Article

Research on Optimization of Urban Commercial District Layout Based on PM2.5 Diffusion Simulation

1
School of Architecture and Planning, Shenyang Jianzhu University, Shenyang 110168, China
2
Shenyang Geotechnical Investigation & Surveying Research Institute Co., Ltd., Shenyang 110000, China
*
Authors to whom correspondence should be addressed.
Atmosphere 2025, 16(11), 1255; https://doi.org/10.3390/atmos16111255
Submission received: 15 September 2025 / Revised: 23 October 2025 / Accepted: 29 October 2025 / Published: 31 October 2025

Abstract

Atmospheric particulate matter (PM) pollution has escalated into a critical threat to urban public health and safety. Among urban functional zones, commercial districts—characterized by high human exposure—are simultaneously hotspots of pollutant accumulation. Consequently, PM mitigation in these areas has become an urgent challenge for sustainable urbanization. This study used Computational Fluid Dynamics (CFD) to simulate the diffusion process and vertical concentration distribution of particulate matter in commercial districts. The results showed that the concentration of PM2.5 decreased with increasing height, with the highest concentration in the respiratory zone (1.5 m) and basic diffusion above 50 m; There are significant differences in the concentration changes of pollutants under different combinations of architectural spaces. By establishing a 20 m block wind corridor, changing the relationship between the building and the street enclosure, and adjusting the form of the building podium and overhead design with building height multiples (6–12 m), strategies can effectively alleviate the accumulation of particulate matter in commercial blocks. These findings provide quantitative evidence for evidence-based retrofitting strategies aimed at reducing PM2.5 exposure in high-density commercial areas.

1. Introduction

More than half of humanity now inhabits cities, which occupy < 3% of Earth’s terrestrial surface [1,2]. This unprecedented spatial concentration has focused research on the livability of dense urban habitats [3]. Simultaneously, rapid urbanization has elevated ambient air pollution—especially PM2.5 (aerodynamic diameter ≤ 2.5 µm)—to a determinant of public health and environmental quality [4,5]. Epidemiological evidence consistently links PM2.5 exposure to excess morbidity and mortality from cardiopulmonary pathologies [6,7], while high ambient concentrations degrade perceived air quality and overall well-being [8,9,10]. In cores of compact cities, continuous street canyons formed by high-rise building arrays and heavy traffic suppress mean wind speeds and amplify turbulence, creating persistent zones of poor ventilation that retard pollutant dispersion and prolong resident exposure [11].
PM2.5 concentrations in cities exhibit pronounced spatial heterogeneity and temporal variability that are governed by the morphology and metabolic regime of urban functional zones [12,13]. Functional zoning—an emergent outcome of land-use allocation, industrial location, and human activity patterns [14,15]—modulates traffic generation, energy-demand distribution, and emission profiles, thereby indirectly controlling pollutant accumulation, dispersion, and deposition pathways within the urban canopy layer [16]. Among these zones, commercial districts concentrate pedestrian and vehicular fluxes to an extreme degree. Their intricate three-dimensional structure, often characterized by sub-optimal surface geometries, fosters persistent local maxima of airborne particulates. Under synoptic conditions that impose perpendicular incident flow, building arrays trigger lee-side vortices, corner accelerations, and venturi contractions; these micro-scale flow distortions enhance residence times and create localized hotspots of elevated PM2.5. Consequently, fine-scale morphological attributes of the urban fabric have become a critical leverage point for neighborhood-scale mitigation of particulate pollution.
A substantial body of literature has elucidated the physico-chemical signatures [17], source apportionment [18,19], and built-environment controls [20] of urban PM2.5. Concentrations are simultaneously modulated by land-use configuration, transport topology, emission-source distributions, blue–green infrastructure, and synoptic meteorology. Freeways and industrial parcels consistently exert negative air-quality externalities [21,22], whereas water bodies and vegetated patches generate positive, albeit scale-dependent, effects [23]. At the city scale, ecological corridors, green-way networks, and aggregated green infrastructure (parks, wetlands, street forests) attenuate particulate loads through enhanced deposition and reduced resuspension [24]. Building morphology exerts an equally decisive influence: façade heterogeneity, packing density, and height variability govern ventilation efficiency, turbulence statistics, and solar access, thereby conditioning the spatiotemporal evolution of PM2.5 at pedestrian level [25,26,27]. High-density, deep-canyon geometries are systematically associated with elevated near-ground concentrations [28], yet the sign and magnitude of individual morphometric indicators—building height, plan area fraction, windward-area index, and their respective standard deviations—remain contingent upon climatic context and ground-cover roughness [29,30].
Critically, the combined disposition of buildings, road grids, and green spaces dictates the formation of ventilation corridors, the emergence of local circulation regimes, and the net balance between deposition and re-entrainment at street scale [26]. At broader scales, PM2.5 patterns are further filtered by regional background concentrations and socio-economic gradients (population density, industrial structure, energy demand) [31,32,33,34,35]. Meta-analyses reveal scale-dependent factor dominance [36,37,38]: regional [39,40] and city-level [41,42,43,44] variability is governed by aggregate urban form, land-use intensity, blue–green spatial continuity, and macro-scale ventilation networks, whereas neighborhood-scale heterogeneity [45,46] is controlled by micro-scale building arrangement, landscape composition, and local transport infrastructure.
Collectively, prior investigations have advanced mechanistic understanding of PM2.5 dynamics across diverse urban contexts. Yet, when the analysis is narrowed to the fine-grained morphologies that characterize commercial districts, extant knowledge offers limited actionable guidance for pollution-mitigation urbanism. This study addresses that gap by integrating high-resolution CFD simulations with parametric urban design to quantify how alternative horizontal interface configurations and three-dimensional building assemblages modulate PM2.5 dispersion at pedestrian level. The derived morphological heuristics are translated into evidence-based layout prescriptions capable of reducing ambient particulate concentrations within commercial blocks. The resultant framework furnishes both a scientific baseline and a practicable toolkit for the retrofitting and environmental upgrading of high-density retail cores.

2. Materials and Methods

2.1. Overview of the Research Area

Shenyang is located in northeastern China, with a warm temperate semi-humid continental climate, strong sunshine, strong winds, and significant seasonal variations in atmospheric circulation [47]. The winter season in Shenyang is relatively long, and the long-term heating demand leads to severe air pollution in the city. The concentration of PM2.5 in the atmosphere is high, and there is a strong demand for ventilation in urban blocks. Commercial districts, as important public spaces and areas with high pedestrian traffic in cities, are also the areas where air pollutants are most likely to accumulate. Through preliminary analysis, it can be found that within a certain area around Taiyuan Street, the Taiyuan Street area is the block with the highest building density and the strongest pollution concentration in the entire area. The impact of the surrounding environment on Taiyuan Street is much smaller than that of Taiyuan Street itself on the surrounding environment. Therefore, the study chose Taiyuan Street Commercial District in Shenyang as the research object. The research section includes Zhonghua Road in Taiyuan Street and Zhongshan Road and Minzhu Road within the research area. Among them, the main section, Zhonghua Road, is about 910 m long, Zhongshan Road is about 510 m long, and Minzhu Road is about 580 m long. Through field research, a three-dimensional model of the urban status quo of Taiyuan Street was built (Figure 1). From the figure, it can be found that Taiyuan Street has typical urban commercial street characteristics: (1) The block has diverse building forms and the spatial structure and combination form are complex; (2) High-rise buildings are dense and irregular; (3) In winter, the wind comes from the north side, but there is no smooth ventilation corridor in the north–south direction of the block.

2.2. Simulation Condition Setting

When simulating pollutant diffusion, simulation conditions need to be set according to the situation of the study area. There is a certain correlation between the concentration of PM2.5 and meteorological elements. Different meteorological elements in different regions of the same area can cause changes in the concentration of PM2.5. Therefore, studying the relationship between PM2.5 concentration and meteorological elements such as wind speed, wind direction, temperature, humidity, and heat islands [48] has guiding significance for the selection of simulation parameters and boundary conditions in the digital simulation process of typical commercial block spaces and overall blocks. By analyzing the monthly changes in PM2.5 concentration in Shenyang City from 2021 to 2025, it can be found that the pollution level of PM2.5 throughout the year, from high to low, is as follows: winter > spring > autumn > summer. Due to the long-term heating demand, the PM2.5 concentration in winter in Shenyang is significantly higher than in other seasons. The overall concentration of pollutants in the air is higher, and the cold winter climate is prone to temperature inversion, causing the temperature in the atmospheric troposphere to rise with height, resulting in a relatively stable atmospheric layer. The airflow movement inside the block is weak, and pollutants cannot be effectively diffused, leading to severe urban air pollution. This study mainly analyzes the influence of block building spatial layout on the diffusion of inhalable particulate matter. Wind direction and speed have a significant impact on pollutant diffusion, assuming that the temperature and humidity in the simulation are in a stable state. Based on comprehensive analysis, winter is determined as the meteorological element, with the dominant wind direction in winter towards the north as the wind direction element. Due to the large variation in wind speed, the average wind speed in winter cities is chosen as 3 m/s, and the average temperature is chosen as −10 °C, as the simulation conditions [49,50]. Through monitoring data, it was found that the concentration of PM2.5 in the study area significantly increases during peak commuting hours due to the dense flow of people and vehicles. The main sources of PM2.5 are vehicle exhaust emissions and dust generated by pedestrian and vehicular traffic. Therefore, when establishing a three-dimensional digital model of typical commercial block spaces and the overall block, the linear streets within the block are set as the main sources of PM2.5 pollution. In the simulation, the release rate of pollution sources also depends on the traffic flow and exhaust emission rate on the street. In the calculation process of numerical simulation, the release speed of the pollution source is also determined based on the street traffic flow and exhaust emission speed. The pollution source is set as a linear pollution source with a height of 1 m. The emission mode and concentration of pollutants are stable, and they are discharged vertically upward from the ground at a speed of 0.5 m/s [51]. The actual measured pollutant concentration is 80 μg/m3.

2.3. Digital Model Establishment

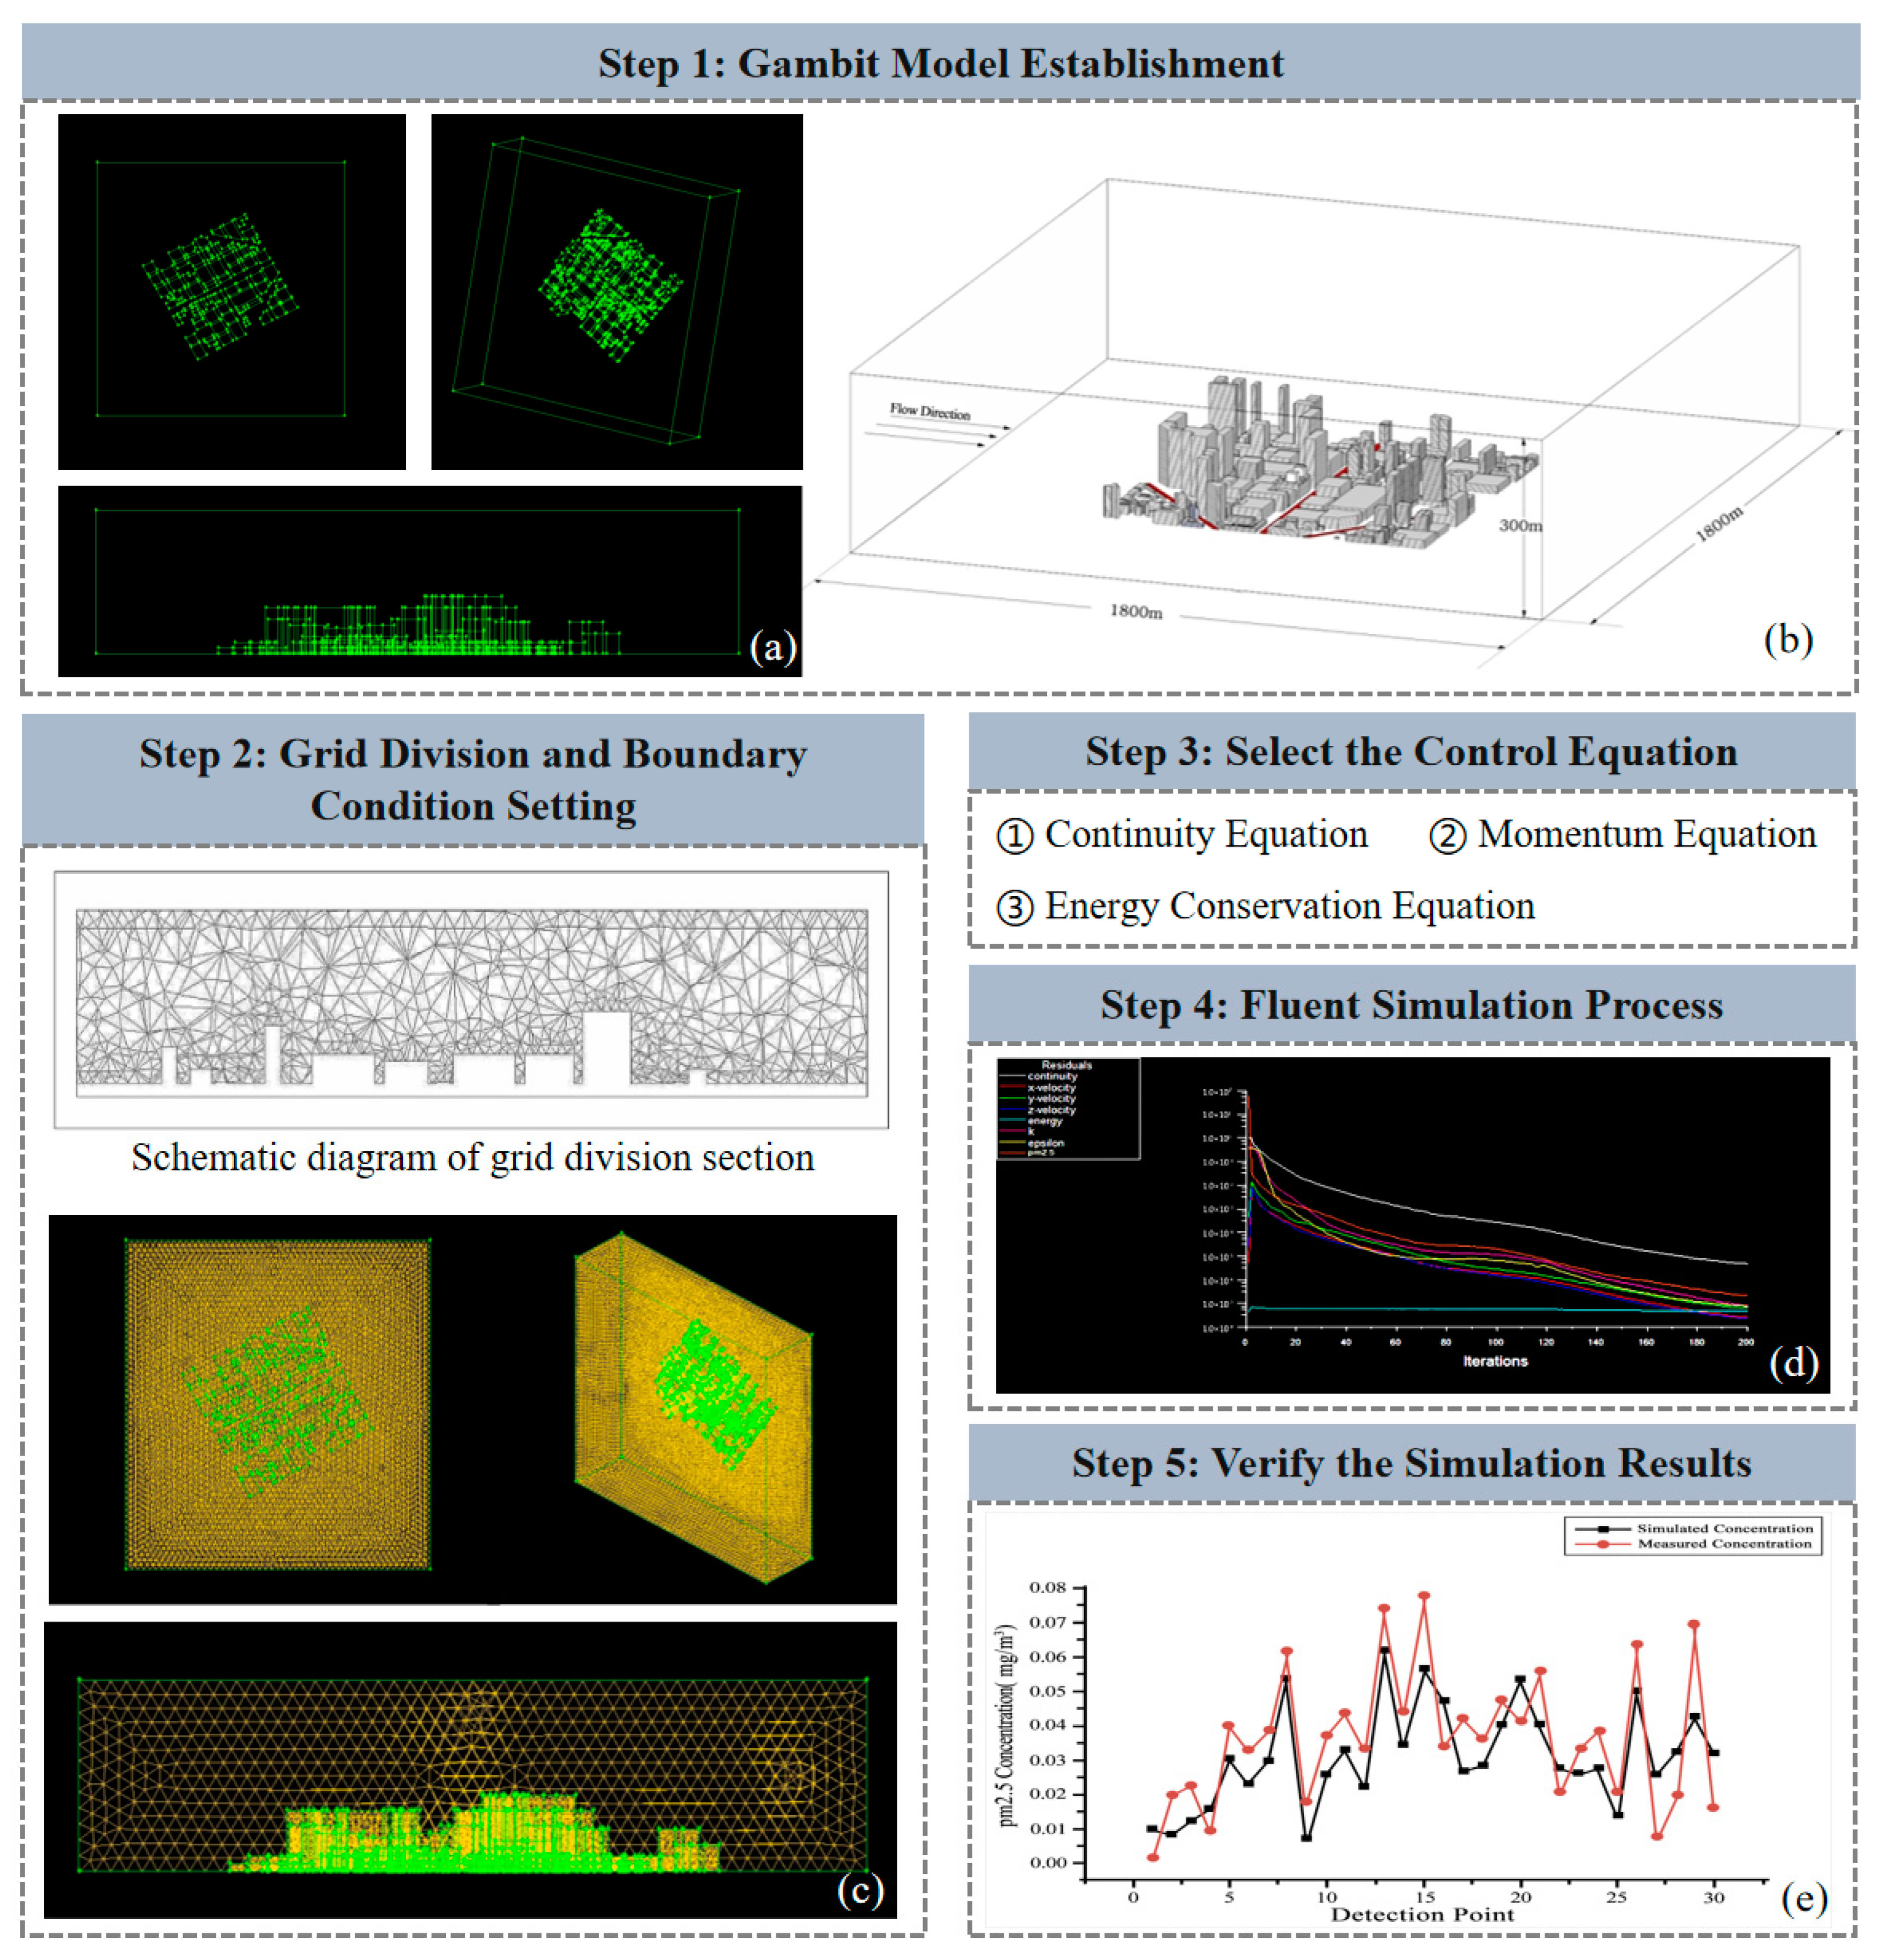
The establishment of a digital model mainly involves five steps (Figure 2). Step 1: Gambit modeling. Through on-site investigation, a three-dimensional model was established using Gambit 2.4.6 (CFD pre-processing software) while maintaining the basic external shape of the building (Figure 2a). According to relevant research, in order to ensure the full development of the inflow, the calculation area of this experiment is a box space of 1800 m * 1800 m * 300 m (Figure 2b). Step 2: Grid division and boundary condition setting. To improve the accuracy of experimental simulation, unstructured grid partitioning was adopted in Gambit, and the main areas near the ground and inside the street valley were densified to form analysis grids ranging from 10 to 20 m [52,53,54] (Figure 2c). According to the climate conditions in Shenyang, the atmospheric inflow wind speed is set at 3 m/s with an average wind speed of 3 m/s and a turbulence intensity of 2%. The upper boundary is a given symmetrical boundary, and the internal interface of the block is treated with no slip condition. The wall function method is used to handle the near wall area to complete the model boundary condition setting. Step 3: Control equation selection. Import the Gambit built block model into Fluent 6.3 simulation software, set relevant fluid dynamics conditions, and perform at least 500 iterative calculations. The control equations used include:
(1)
Continuity equation [54]: For incompressible fluids with constant fluid density, the equation is simplified as:
ρ t + · ρ v = 0
In the formula, ρ is the fluid density; t is time; v is the velocity vector; is divergence operator.
(2)
Momentum equation [55]:
x j ρ u i u j = p x i + τ i j x j + ρ g i + F i
τ i j = μ t u i x j + u j x i 2 3 ρ k δ i j
In the formula, ρ is the fluid density; τ i j is a stress tensor; ρ g i is the volumetric force caused by gravity in the i direction; F i is a source term caused by heat sources, pollution sources, etc.; μ is viscosity; μ i is the velocity in the i direction; δ i j is a constant.
(3)
Energy conservation equation [56]:
x i ρ u i h = x i k + k t + T x t + S h
k t = c p μ t / P r t
In the formula, h is the specific enthalpy; k is the molecular thermal conductivity; k i is the turbulent diffusion thermal conductivity; T is the fluid temperature; S h is the volume heat source term; c p is the mass constant pressure heat capacity; μ t is turbulent viscosity; P r is the turbulent Prandtl number.
Step 4: Fluent simulation process. Import the model into Fluent software for fluid dynamics condition setting and iterative calculation. When the operation factor tends to stabilize and converges, the calculation is completed (Figure 2d). Step 5: Verify the simulation results. In this simulation, the validation data mainly used measured monitoring data as the simulation validation data. The data validation points were mainly distributed in the streets and commercial areas within the Taiyuan Street area of Shenyang City. A total of 8 monitoring points were selected to validate the results of the model simulation (Figure 2e). By analyzing the root mean square error (RMSE), mean absolute error (MAE), and mean relative error (MRE) of simulated and measured values as three indicators to test the accuracy of the model, the accuracy of Fluent’s simulated PM2.5 diffusion distribution results was compared and analyzed (RMSE = 1.556, MAE = 1.250, MRE = 1.3%). The validation results indicate that Fluent is feasible for simulating the diffusion distribution of PM2.5 (Figure 2e).

2.4. Selection of Typical Simulation Spaces

In order to better analyze the diffusion process of PM2.5 in commercial districts, three typical simulation spaces were set up in the study. Category 1: Horizontal diffusion simulation of PM2.5 at different heights. At different heights of horizontal cross-sections, there are significant changes in street space at heights of 1.5 m, 10 m, 30 m, 50 m, and 80 m. Therefore, the above groups of cross-sections are selected as typical horizontal cross-sections: (1) H = 1.5 m—human respiratory height: the continuity of the building interfaces on both sides of the street is strong, with almost no open space; (2) H = 10 m—low-rise commercial building area: the continuity of the building interfaces on both sides of the street is strong, with almost no open space; (3) H = 30 m—multi-story commercial buildings and commercial podium areas: the building interfaces on both sides of the street exhibit intermittent continuity, with some open spaces appearing in dots; (4) H = 50 m—high-rise building area: there are many open spaces in the streets, and they exhibit a linear continuous distribution of open spaces; (5) H = 80 m—high-rise building area: there are almost no continuous building interfaces on both sides of the street, with large open spaces(Figure 3).
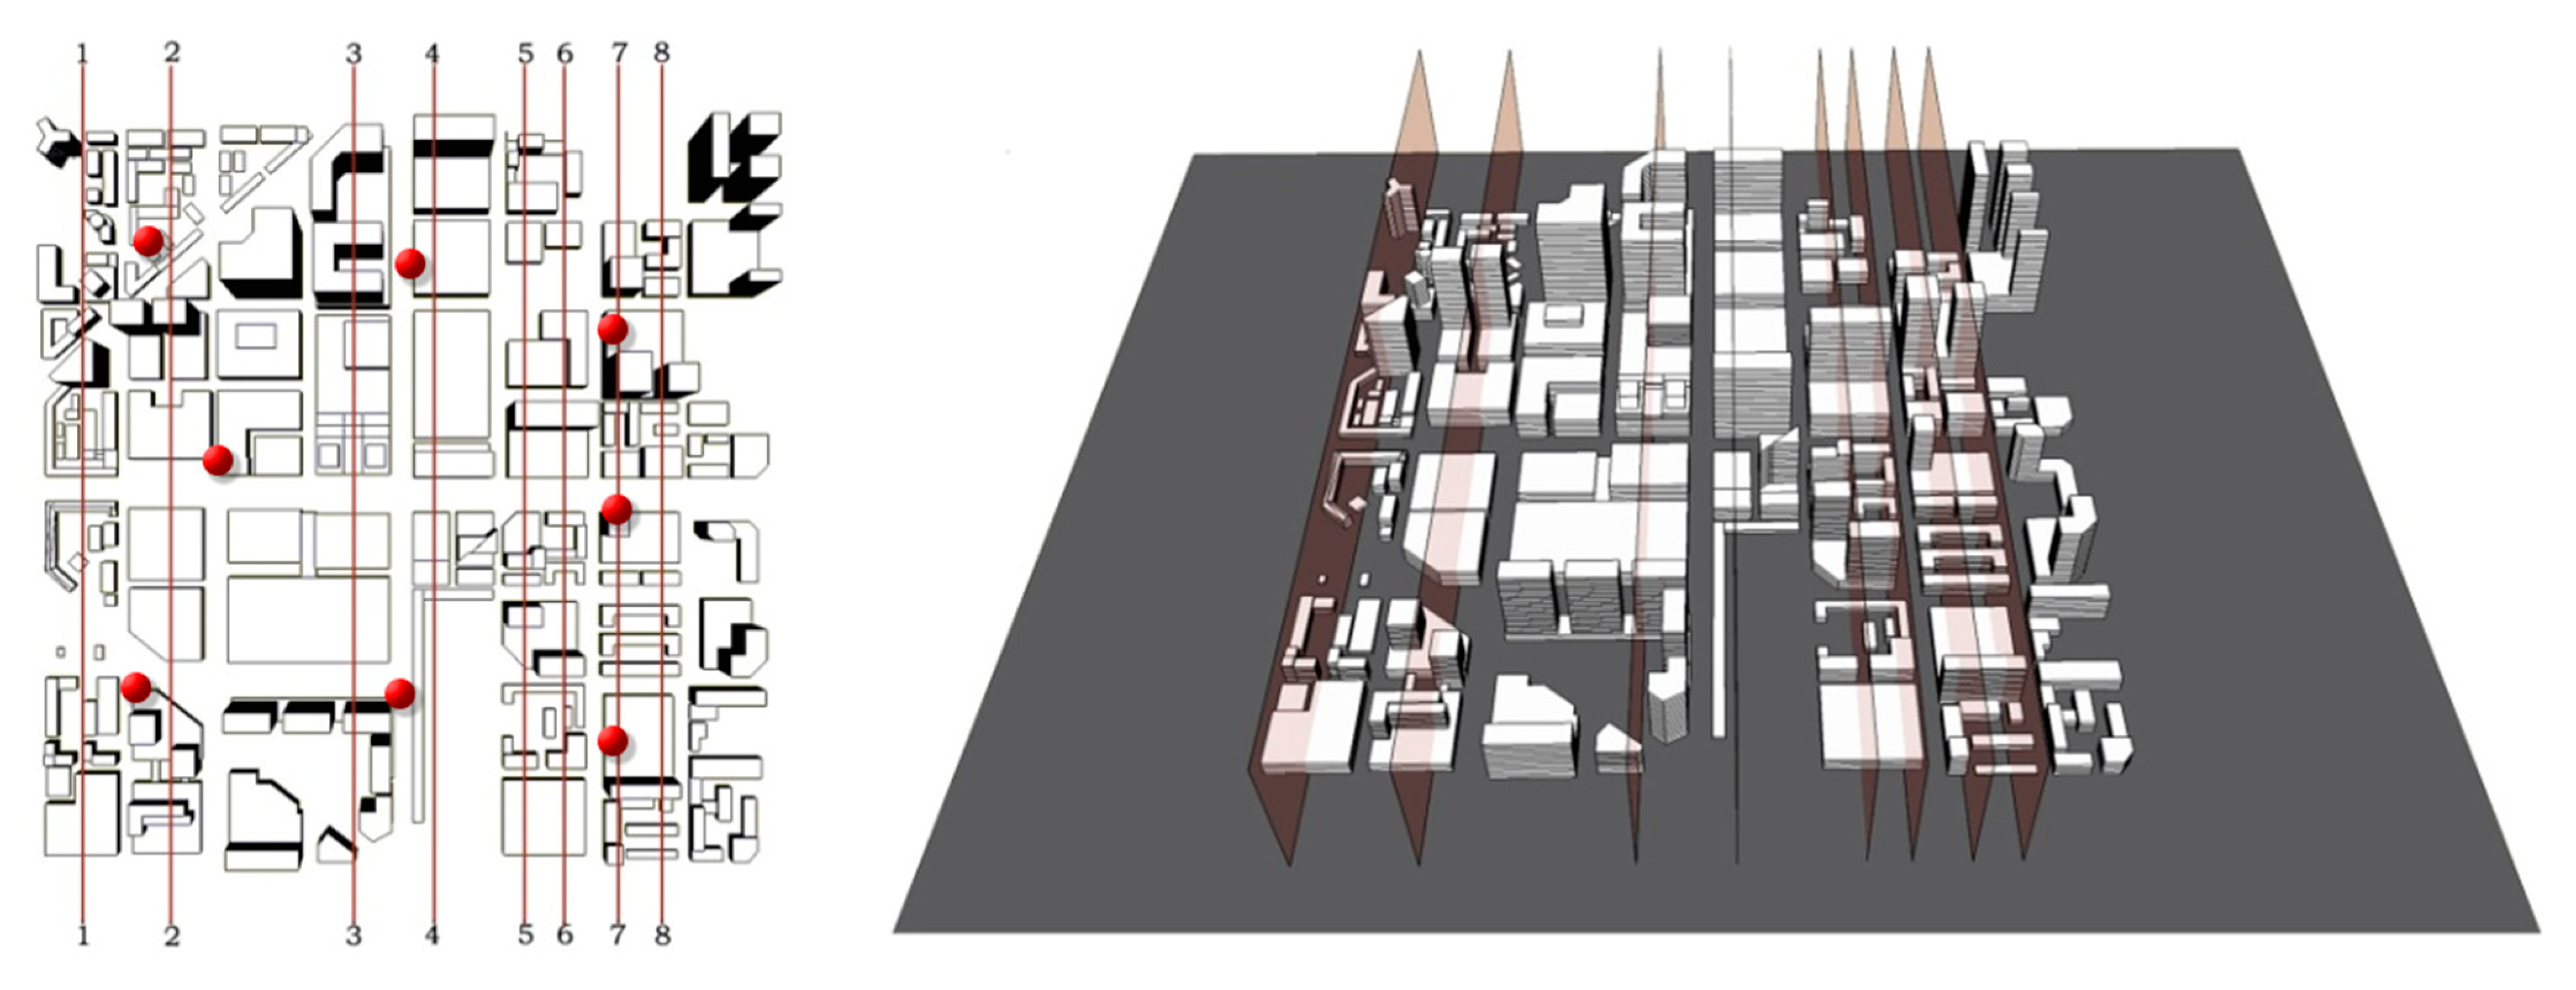
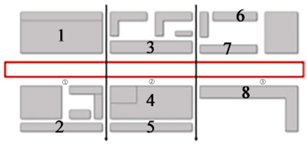
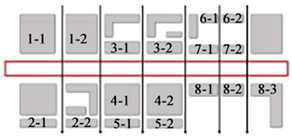
Category 2: Vertical distribution simulation of PM2.5 under different architectural spatial layout forms. Based on the current spatial layout form, building density, building height distribution, and pollutant diffusion distribution characteristics at different horizontal heights of Taiyuan Street, 8 typical spaces were selected to analyze and compare the pollutant concentrations at different heights in each of the 8 typical spaces, and summarize the pollutant distribution characteristics in the vertical space of the block. Based on the spatial distribution characteristics of Taiyuan Street at different heights, heights of H = 1.5 m, 6 m, 10 m, 30 m, 50 m, and 80 m were selected. Category 3: Simulation of PM2.5 diffusion in different street cross-section spaces. Eight typical road sections were selected based on the width of the road and the form and height characteristics of commercial buildings on both sides of the street (Figure 4). Among them, the width of the street is W = 40 m, and the buildings on both sides of the street are upstream and downstream of the wind field, respectively. H1 and H2 are the heights of the buildings on both sides (Table 1).

3. Results

3.1. Distribution Characteristics of PM2.5 Diffusion Simulation in the Overall Space of Commercial Blocks

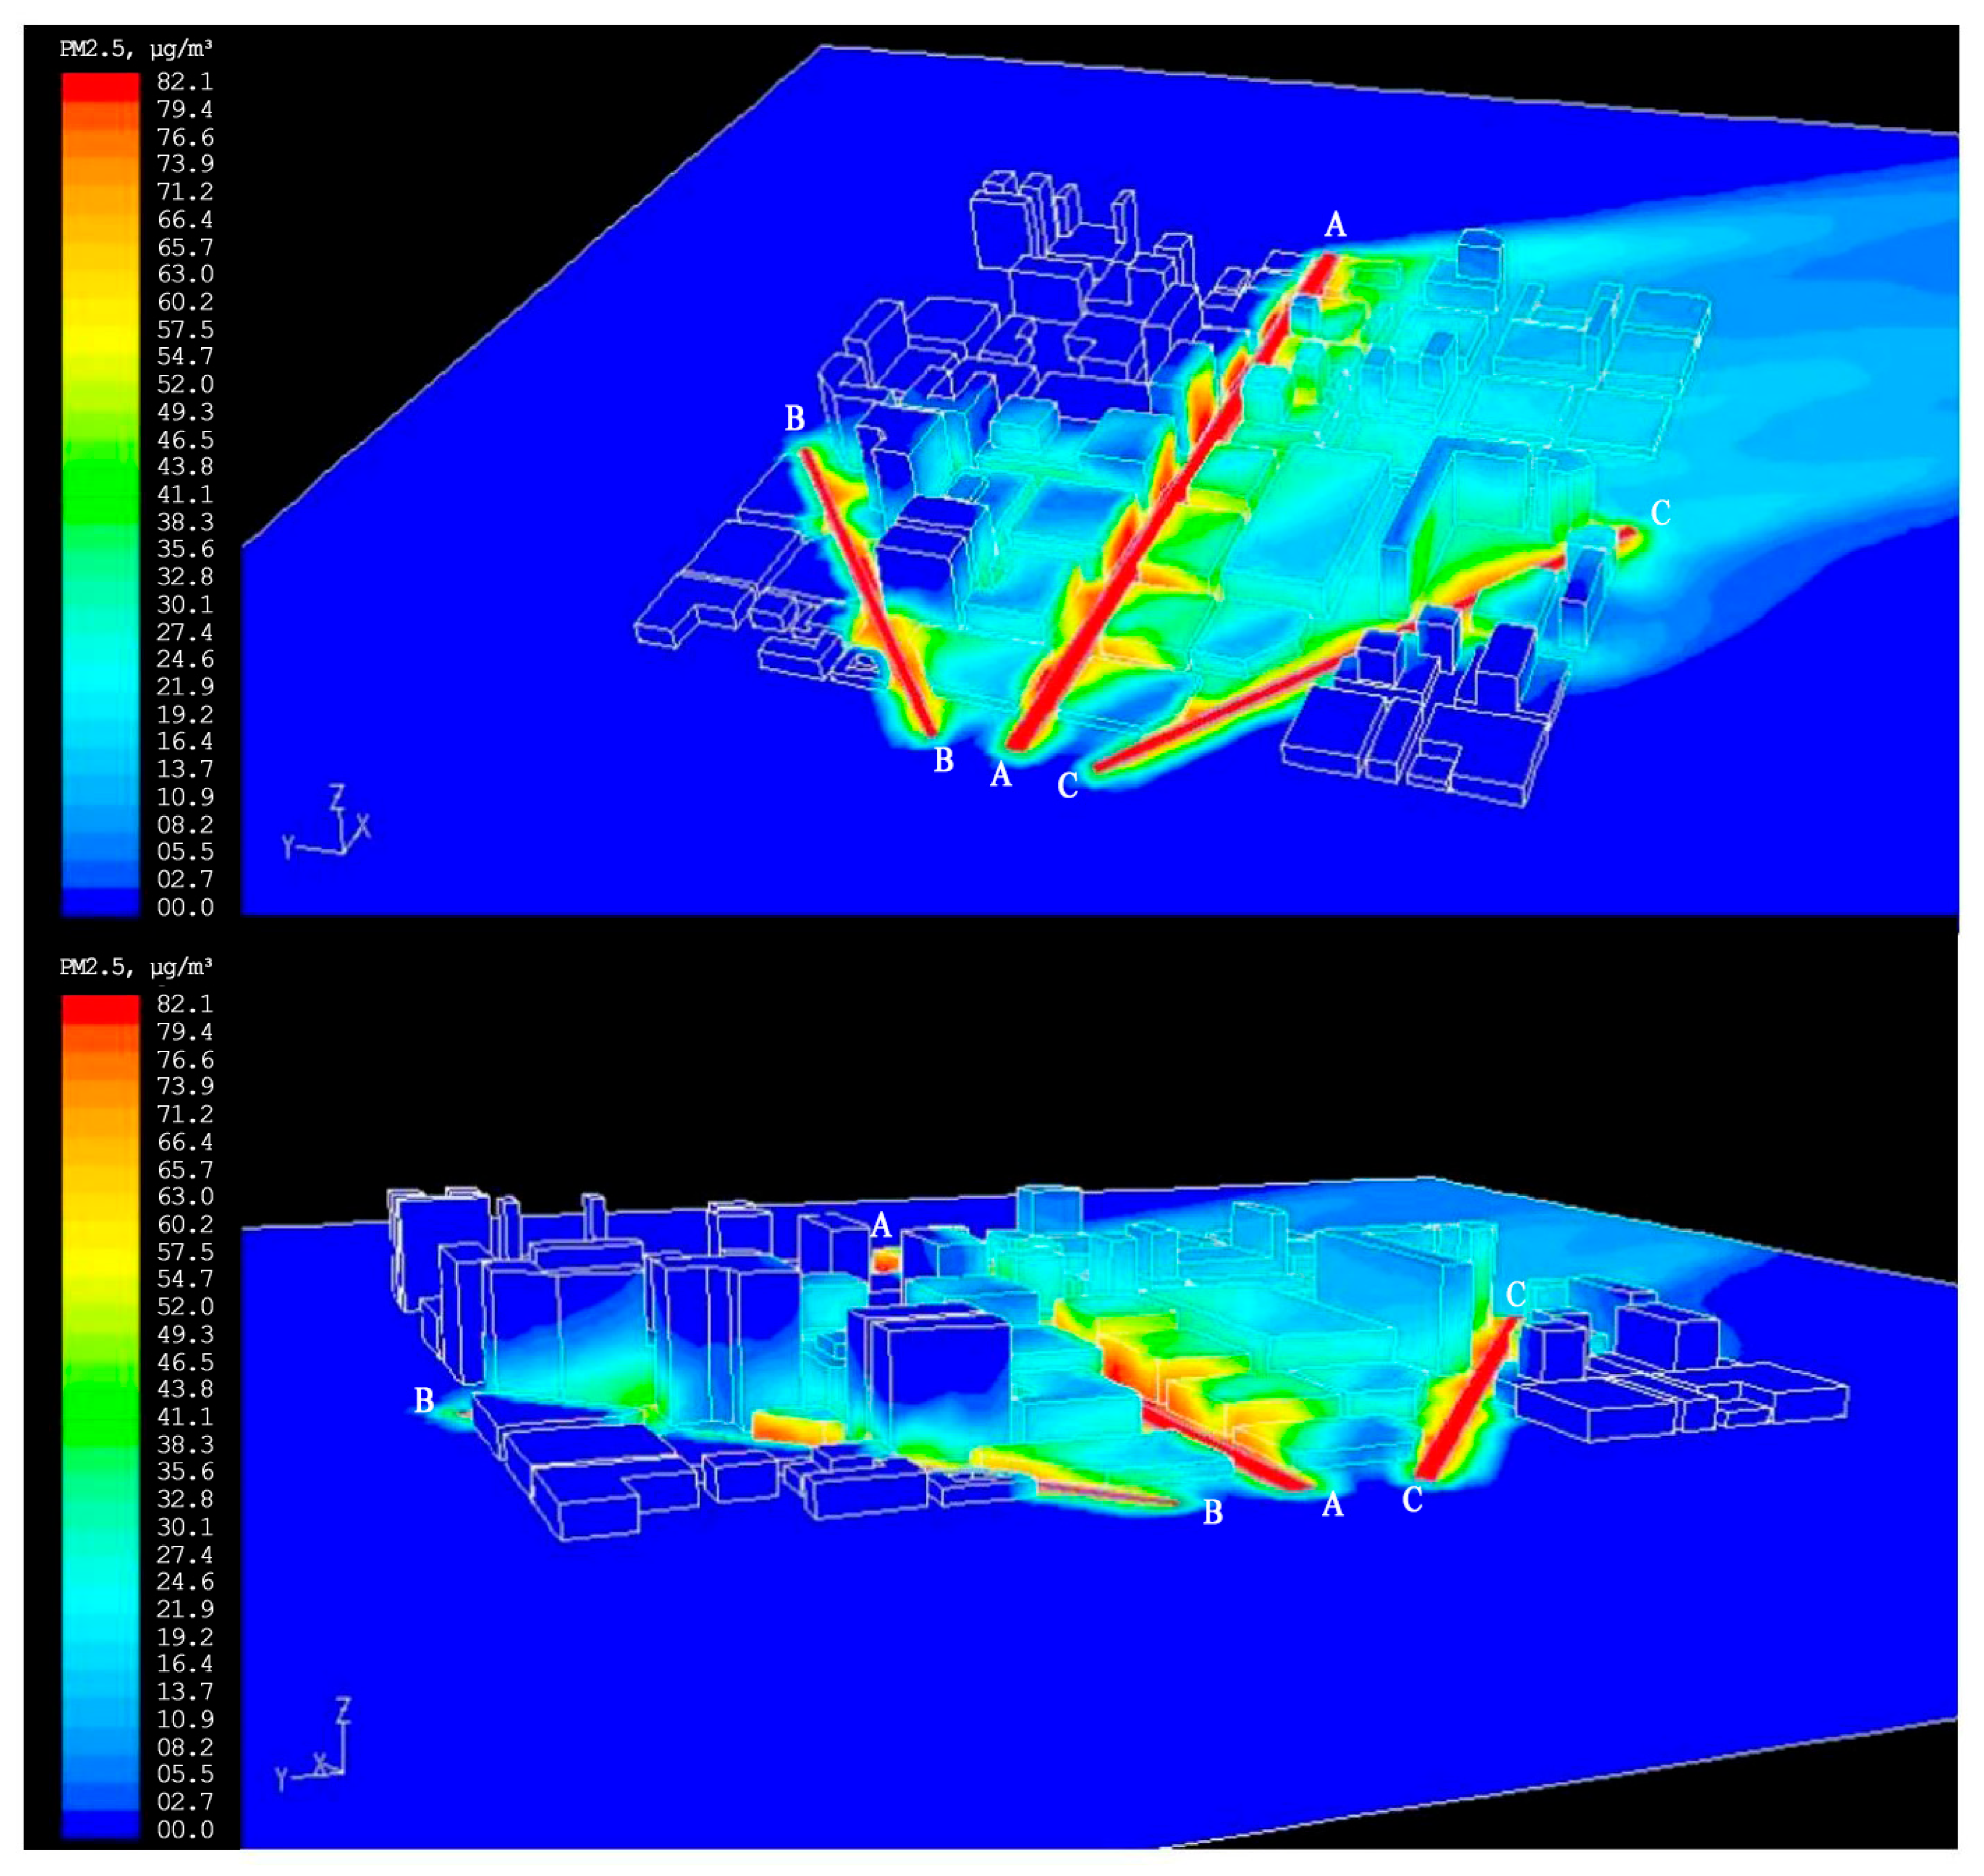
From the analysis of the overall 3D simulation diagram of the block (Figure 5), it can be seen that as the height increases, the wind speed gradually increases, and the building density and height reduce the spatial diffusion resistance of pollutants. The vertical spatial diffusion is centered around the pollution source and spreads towards both sides of the road. As the height increases, the concentration gradually decreases, but the decreasing trend is not obvious. The concentration of PM2.5 in the high-rise building area north of Zhonghua Road is severe, and there is a phenomenon of PM2.5 aggregation, with relatively high concentrations on both the leeward and windward sides, and the highest PM2.5 concentration is 82.1 μg/m3. At the same time, some building groups have formed PM2.5 retention areas due to the influence of eddy currents.

3.2. Distribution Characteristics of PM2.5 Diffusion in Horizontal Cross Sections at Different Heights

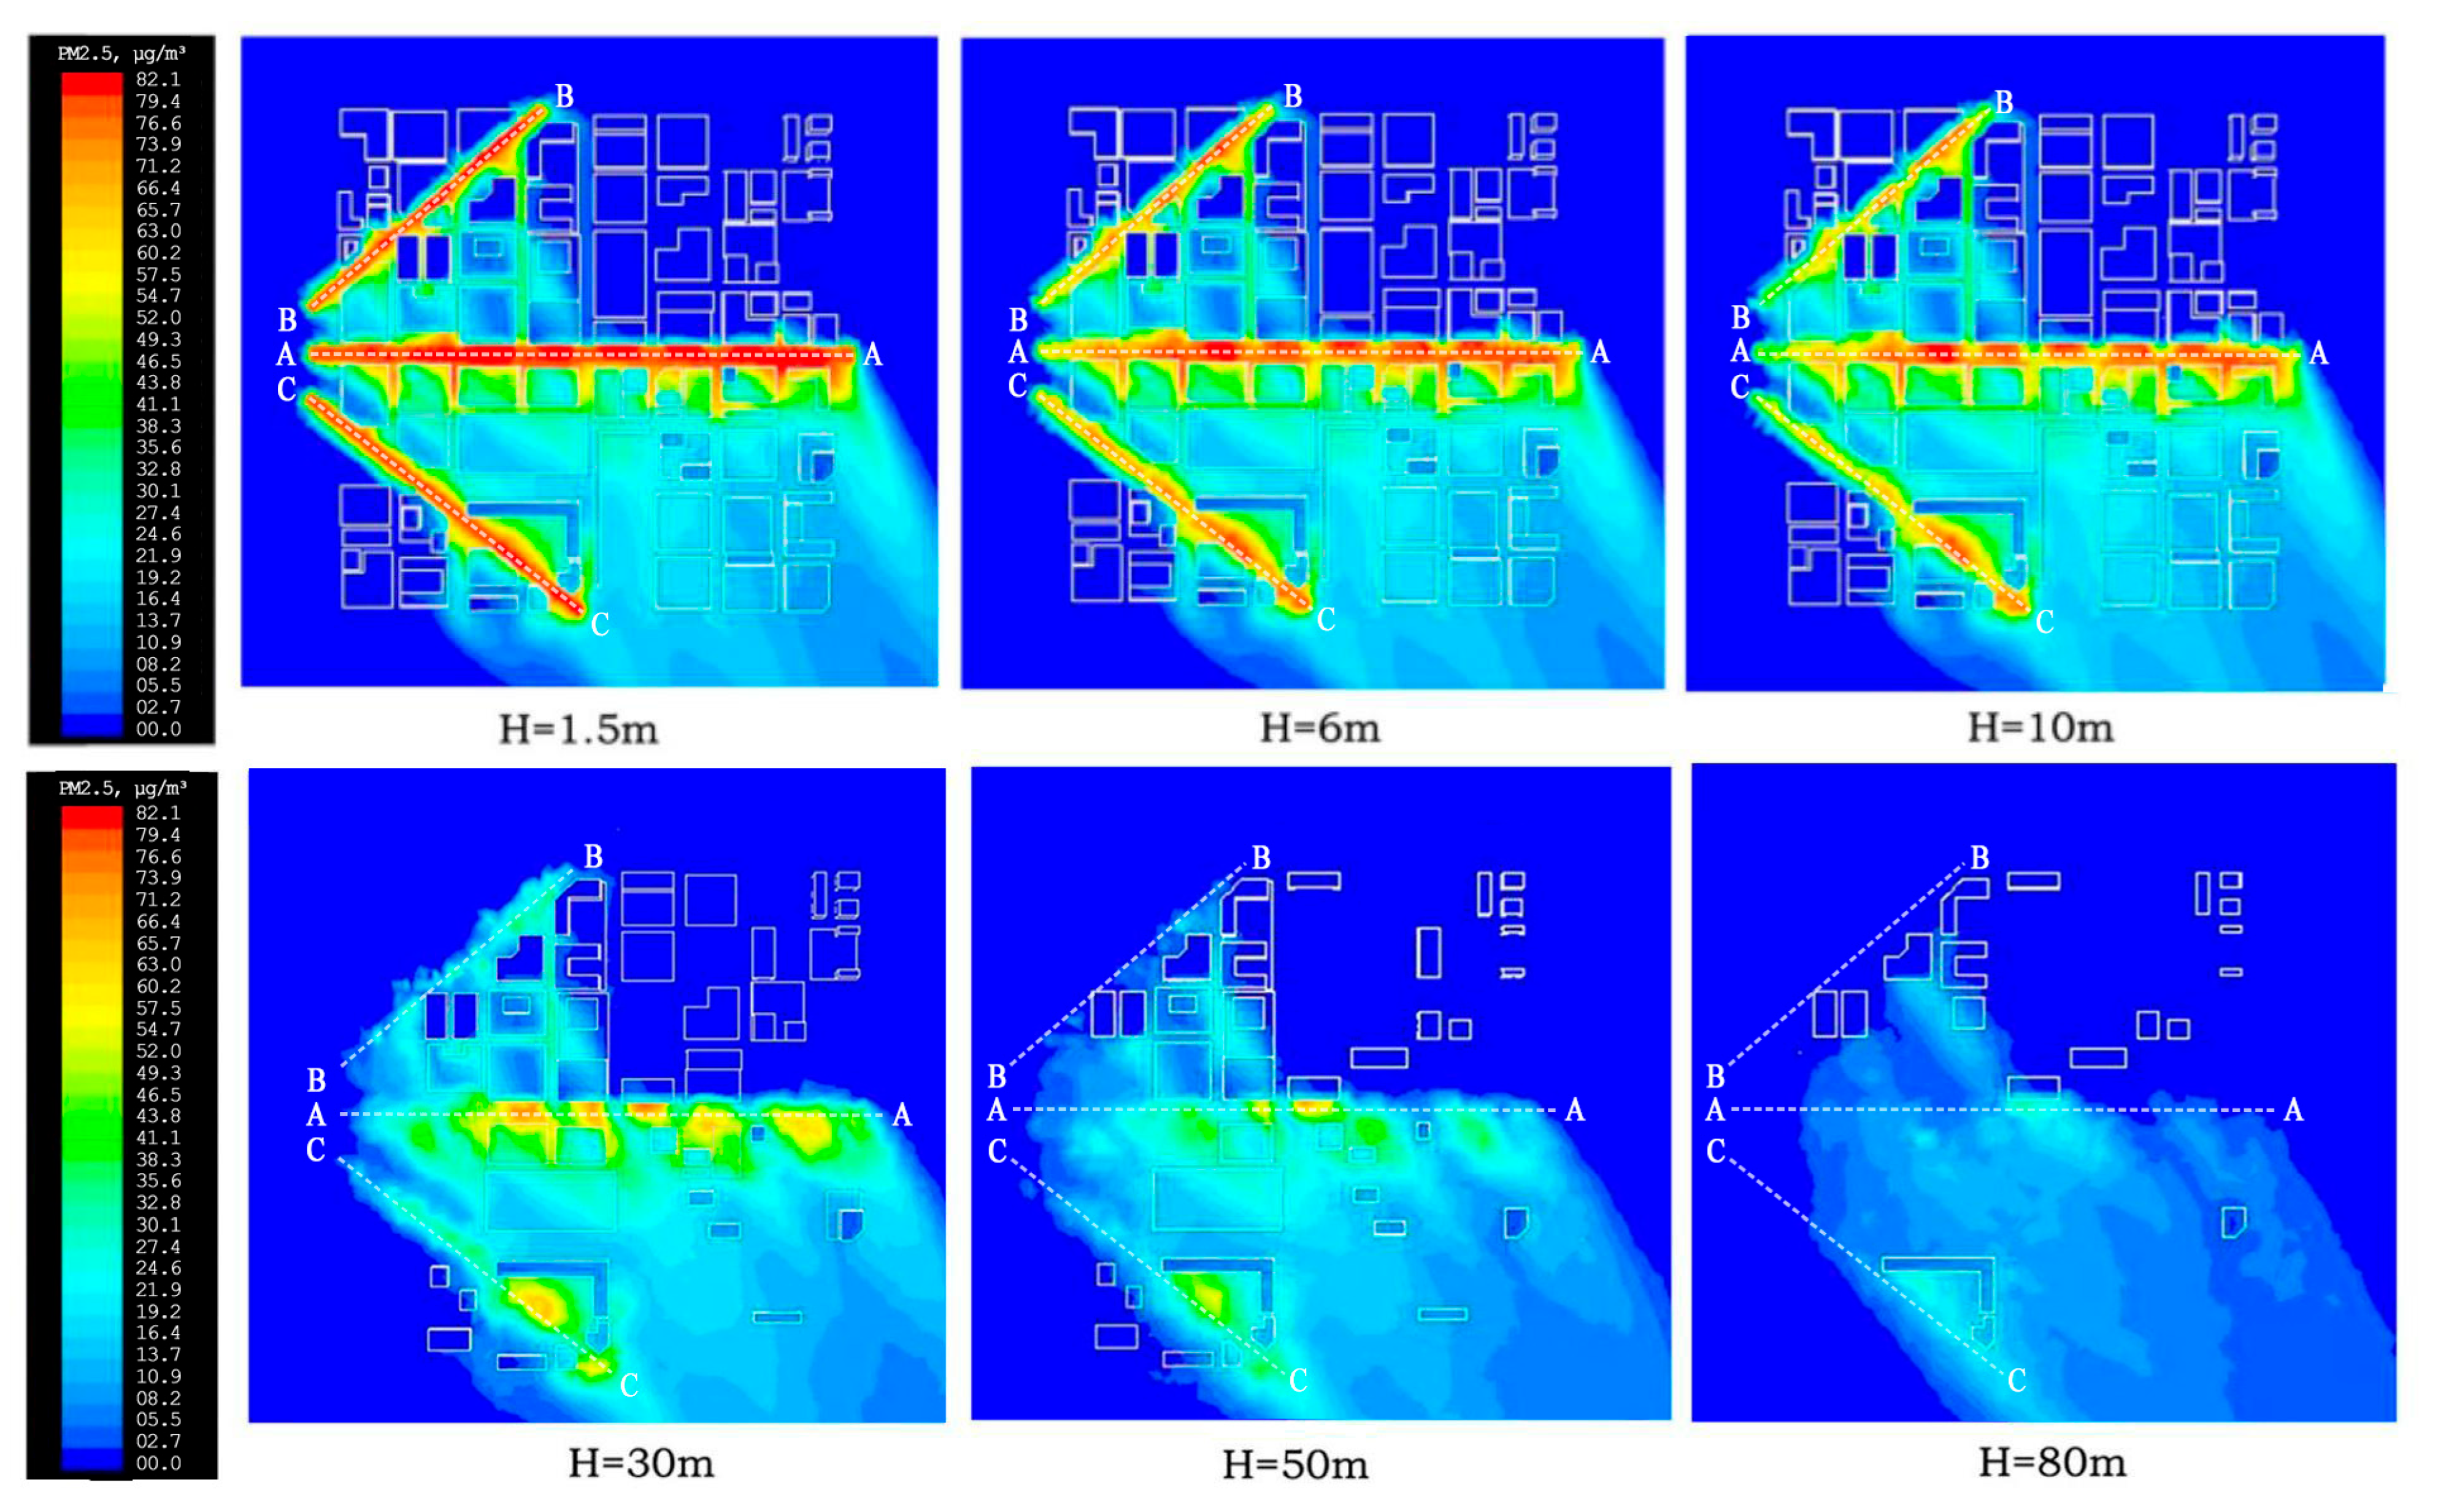
There are significant differences in customs at different horizontal cross-sections (Figure 6), and the distribution of PM2.5 diffusion shows obvious heterogeneity (Figure 7). Based on the simulation results in Figure 6 and Figure 7, the following can be observed: (1) H = 1.5 m: The building interfaces on both sides of the streets in sections A, B, and C are continuous, with almost no open space. The wind speed inside the street changes little and is low, making it difficult for PM2.5 to diffuse, forming a highly continuous and concentrated pollution area. (2) H = 6–10 m: The interfaces on both sides of the streets in sections A, B, and C are mostly low-rise buildings and some building podiums, forming a relatively enclosed street space. Only at very few valley openings and road intersections, there is a brief change in wind speed and direction, with local increases in wind speed causing flow into some blocks, which can evacuate some pollutants, but most pollutants still cannot be transported away. Compared with the height of H = 1.5 m, the concentration of pollutants has slightly decreased, but it still forms a high overall concentration of pollutants within the block and presents a very discontinuous and continuous distribution state. (3) H = 30 m: At this height, intermittent point-like open spaces begin to appear on both sides of the street interface, and incoming flow to the block can enter the interior of the street valley along some building gaps. Wind speed is manifested as the formation of transverse vortices in open spaces, and at continuous building interfaces without openings, incoming flow is obstructed to form vortices from the windward side to the leeward side. The local PM2.5 concentration shows a characteristic of spreading upwards and significantly decreasing at the opening of the street valley. The overall PM2.5 concentration in the block has significantly decreased, and pollutants have shown a linear distribution pattern in some high-concentration areas. (4) H = 50 m: Within this height range, there is a significant increase in open space, with intermittent and continuous distribution of open space. The number of building interfaces on both sides of the street is significantly reduced, especially in the H = 50 m height range, where there is a large range of continuous open space. The incoming flow to the block can fully enter the inside of the block, forming vortices and taking away most of the pollutants. The overall concentration of pollutants in the block decreases, and the linear distribution of high-concentration areas of pollutants disappears, presenting a local point-like distribution. (5) H = 80 m: There is almost no continuous building interface on both sides of the street, resulting in a large area of open space. The buildings are distributed in a point-like pattern, and at this height, they have almost no effect on wind speed. In addition, the distance from the pollution source is far, and the concentration of pollutants inside the block is extremely low, without high-concentration pollution.

3.3. Distribution Characteristics of Vertical Spatial Pollutants in Different Spatial Combinations

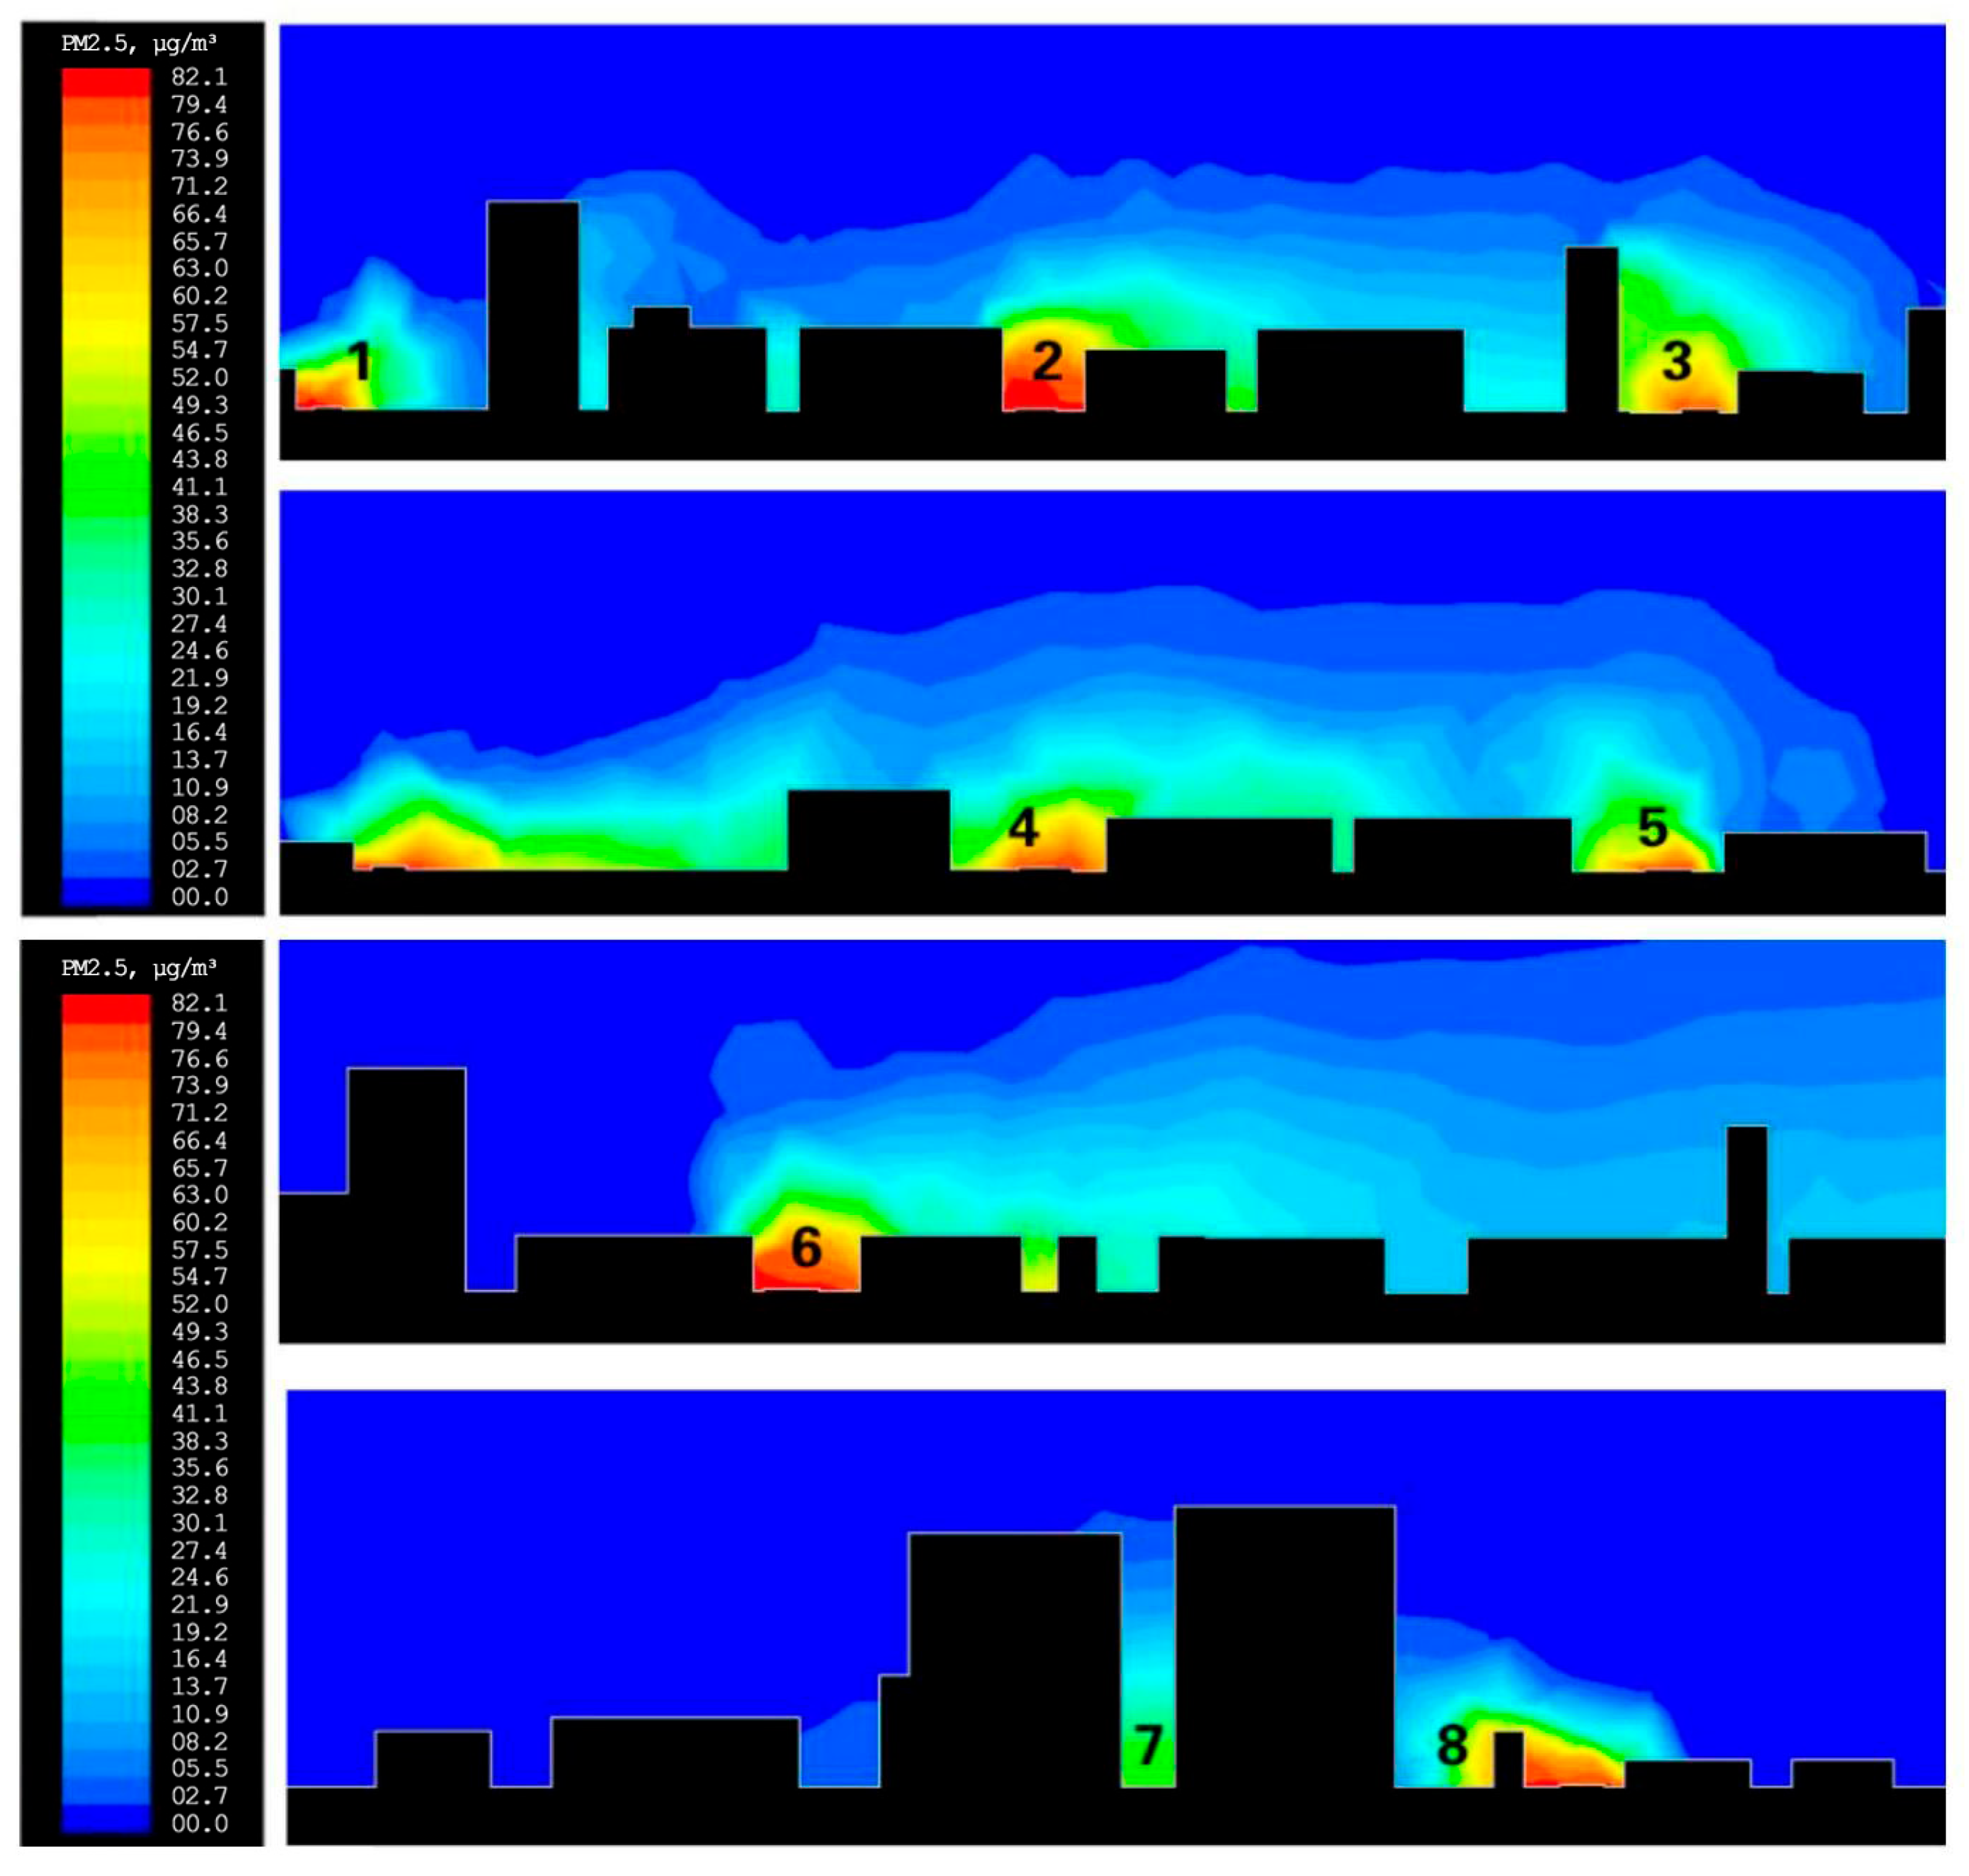
In the selected eight typical block spaces, Table 1 shows the concentration changes at different heights in the vertical direction, and the concentration of pollutants in the block gradually decreases with increasing height. H = 1.5 m is the place with the highest spatial concentration value in a block. However, due to the combination of architectural spaces around the space and the different forms of the buildings themselves in the space, the concentration distribution and variation trend in the vertical direction of different typical spaces are significantly different (Figure 8, Table 2). (1) Spaces 2 and 6, with strong enclosure, have significantly higher concentrations of pollutants in the lower layer compared to other spaces. Within the range of H = 1.5 m to H = 10 m, there is little change in pollution, and both are high-concentration pollution areas. (2) In the relatively open spaces 4, 5, and 8, the pollution concentration is relatively high within the height range of H = 1.5 m–H = 6 m, and shows a clear trend of decreasing concentration at heights greater than 10 m. (3) There is a significant uneven distribution of pollutants inside spaces 1, 3, and 8, with significant differences between the buildings on both sides of the space, and pollutants tend to accumulate on the leeward side of upstream buildings. (4) The narrow-slit space 7 enclosed by high-rise buildings, due to the influence of wind direction and surrounding building environment, as well as being far away from the pollution source, produces a slit effect between the gaps of high-rise buildings, resulting in a lower overall pollution concentration.

3.4. Comparison of PM2.5 Concentration in Different Road Sections

The typical street sections in the research area are divided into the following three situations based on the height of buildings on both sides of the street and the different forms of buildings.
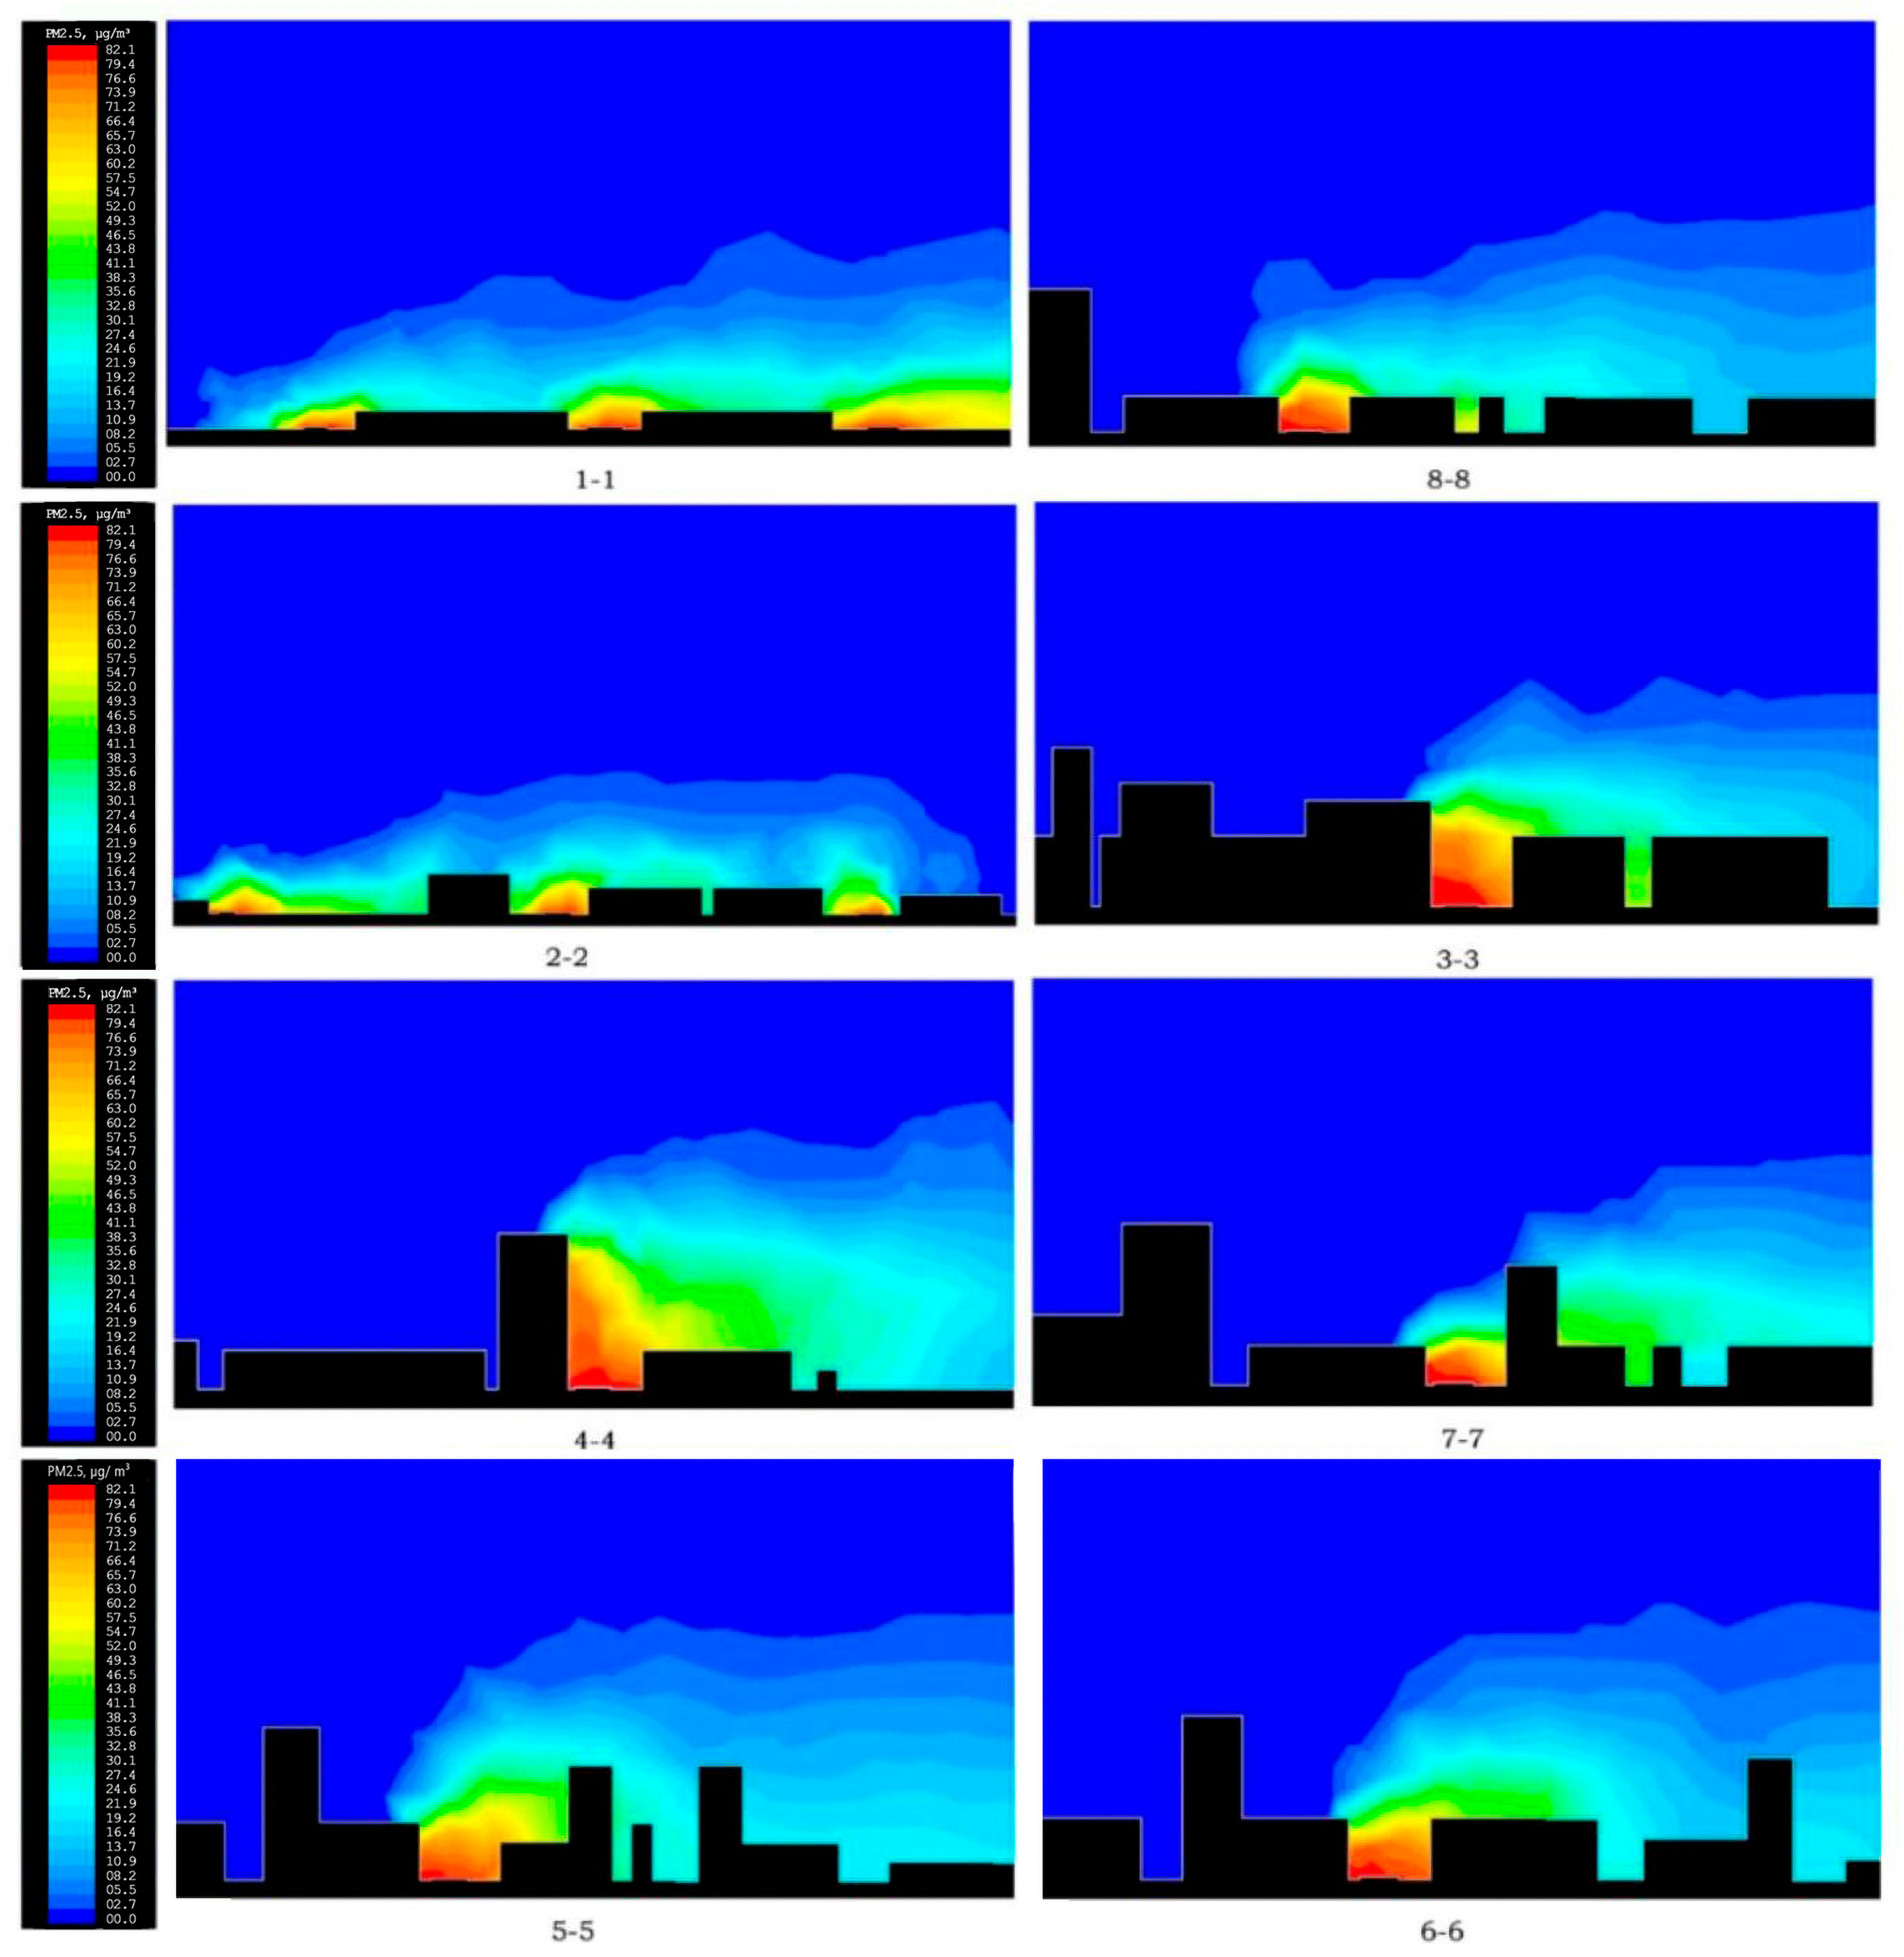
Scenario 1: When the heights of buildings on both sides of the street are similar, i.e., H1/H2 = 1:1. (1) If H/W = 1:4 (Figure 9(1-1)), the block space is open, the pollution inside the block is less, and PM2.5 diffusion is good; (2) If H/W = 1:2 (Figure 9(8-8)), most of the incoming flow in the block passes through the top of the buildings, and a small part enters the interior of the block, unable to form a clear vortex. PM2.5 tends to gather at the bottom of the street valley, forming a higher concentration area; (3) If H/W = 1:1 (Figure 9(3-3)), the incoming flow from the top of the building forms a meandering flow inside the block and a downwash on the windward side of downstream buildings, resulting in a slightly lower concentration of PM2.5 on the windward side of the block than on the leeward side. However, due to the lower airflow entering the block, most of the airflow is concentrated on the upper part of the building, resulting in a significant accumulation of a high concentration PM2.5 at the bottom of the block.
Scenario 2: When there is a significant difference in the height of buildings on both sides of the street, including two situations. (1) If H1 > H2 (Figure 9(4-4)), it means that the height of upstream buildings is significantly higher than that of downstream buildings, and the concentration of PM2.5 accumulates in the block. At the same time, a significant PM2.5 “wall climbing effect” is formed on the leeward side of upstream buildings; (2) If H1 < H2 (Figure 9(7-7)), it means that the upstream buildings are lower than the downstream buildings, and PM2.5 mainly accumulates on the back of the upstream buildings in the lower part of the street valley.
Scenario 3: The combination of high-rise buildings and podiums creates a two-level space in the street valley. Within the high-rise space on the upper level of the podiums, the concentration of PM2.5 is not high and there is obvious diffusion; in the skirt area, there is a significant accumulation of PM2.5 concentration (Figure 9(5-5,6-6)).

4. Strategy and Discussion

The airflow movement and the diffusion of inhalable particulate matter within urban blocks have a significant impact on the internal air quality environment of the blocks [57]. Different spatial layout forms of blocks will form different internal flow fields. Due to the special nature of commercial blocks, the spatial layout structure of commercial blocks is complex. Research results have found that the aspect ratio of buildings on both sides of the street, the height ratio of buildings on both sides of the street, the form of block buildings, and the combination of building forms all have important effects on the diffusion of inhalable particulate matter inside the block. By adjusting the structure, building combination, and architectural form of commercial districts, the concentration of PM2.5 in commercial districts can be effectively reduced, providing a healthier living environment for cities.

4.1. Building Ventilation Corridors

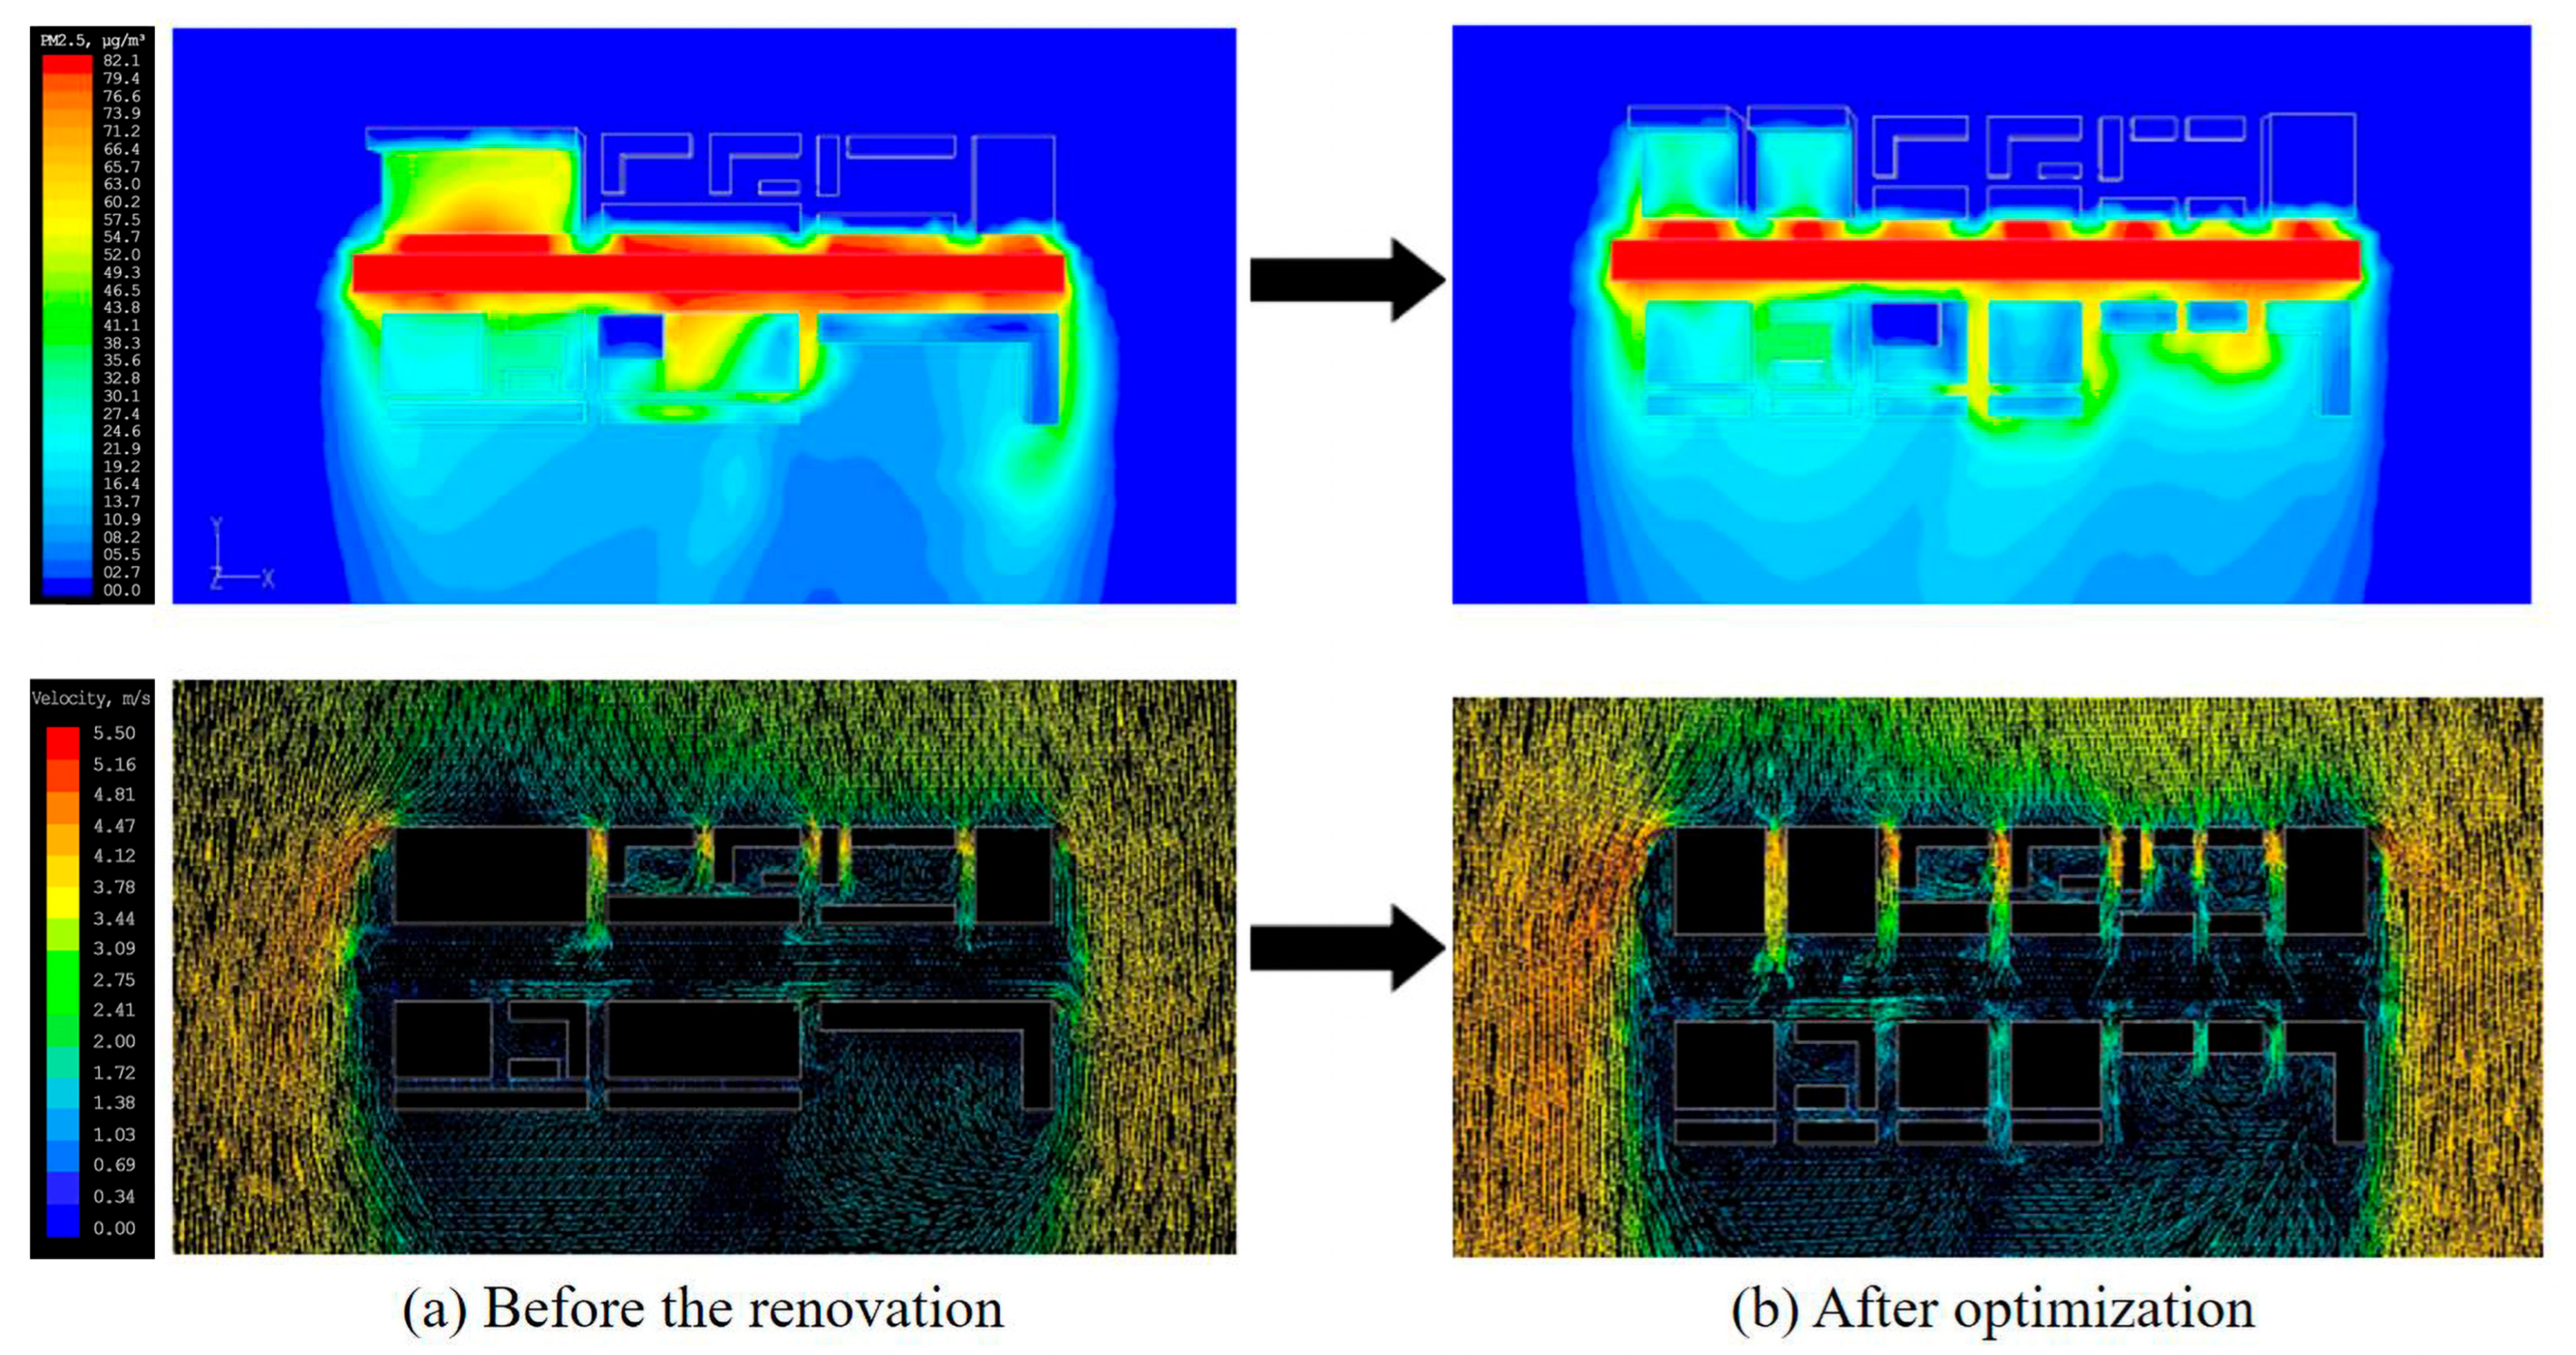
The research area has a high density of buildings and has become a compact and enclosed structure. Taking the area north of section A as an example, due to the obstruction of high-rise buildings, wind and clean air cannot enter its interior, resulting in severe air pollution in the concentrated area of high-rise buildings. Due to the small spacing between buildings, the migration of pollutants with the flow is weak, resulting in the accumulation of pollutants, with relatively high concentrations on both the leeward and windward sides. Due to the differences in the combination of building groups, the dominant wind direction in the city is not fully taken into account. When the wind carries polluted gases into the building group, eddy currents are formed due to the obstruction of the buildings. The eddy currents on the leeward side are prone to form a stagnant area for pollutants, resulting in a chaotic concentration field and a sharp deterioration of the wind environment inside the diffusion channel. The stagnant area increases and affects the air quality in the area. Therefore, constructing a reasonable ventilation corridor can effectively enhance the airflow movement within the block and effectively alleviate PM2.5 pollution. By optimizing the building combination form in the area north of section A, a ventilation corridor space was formed (Table 3). It can be found that using a 20 m ventilation corridor reduces the horizontal pollution range and significantly enhances the diffusion effect after optimization (Figure 10, Table 4). In vertical space, the range of PM2.5 concentration decrease for H = 1.5 m is between 13.23% and 25.32%, while the decrease in PM2.5 concentration for H = 6 m and H = 10 m is similar, ranging from 22.22% to 31.58% and 24.56% to 36.76%, respectively. The same form of architecture, due to different combinations of building forms, will produce different ventilation effects, which can improve the overall environment of urban areas [58,59,60].

4.2. Optimizing Open Space

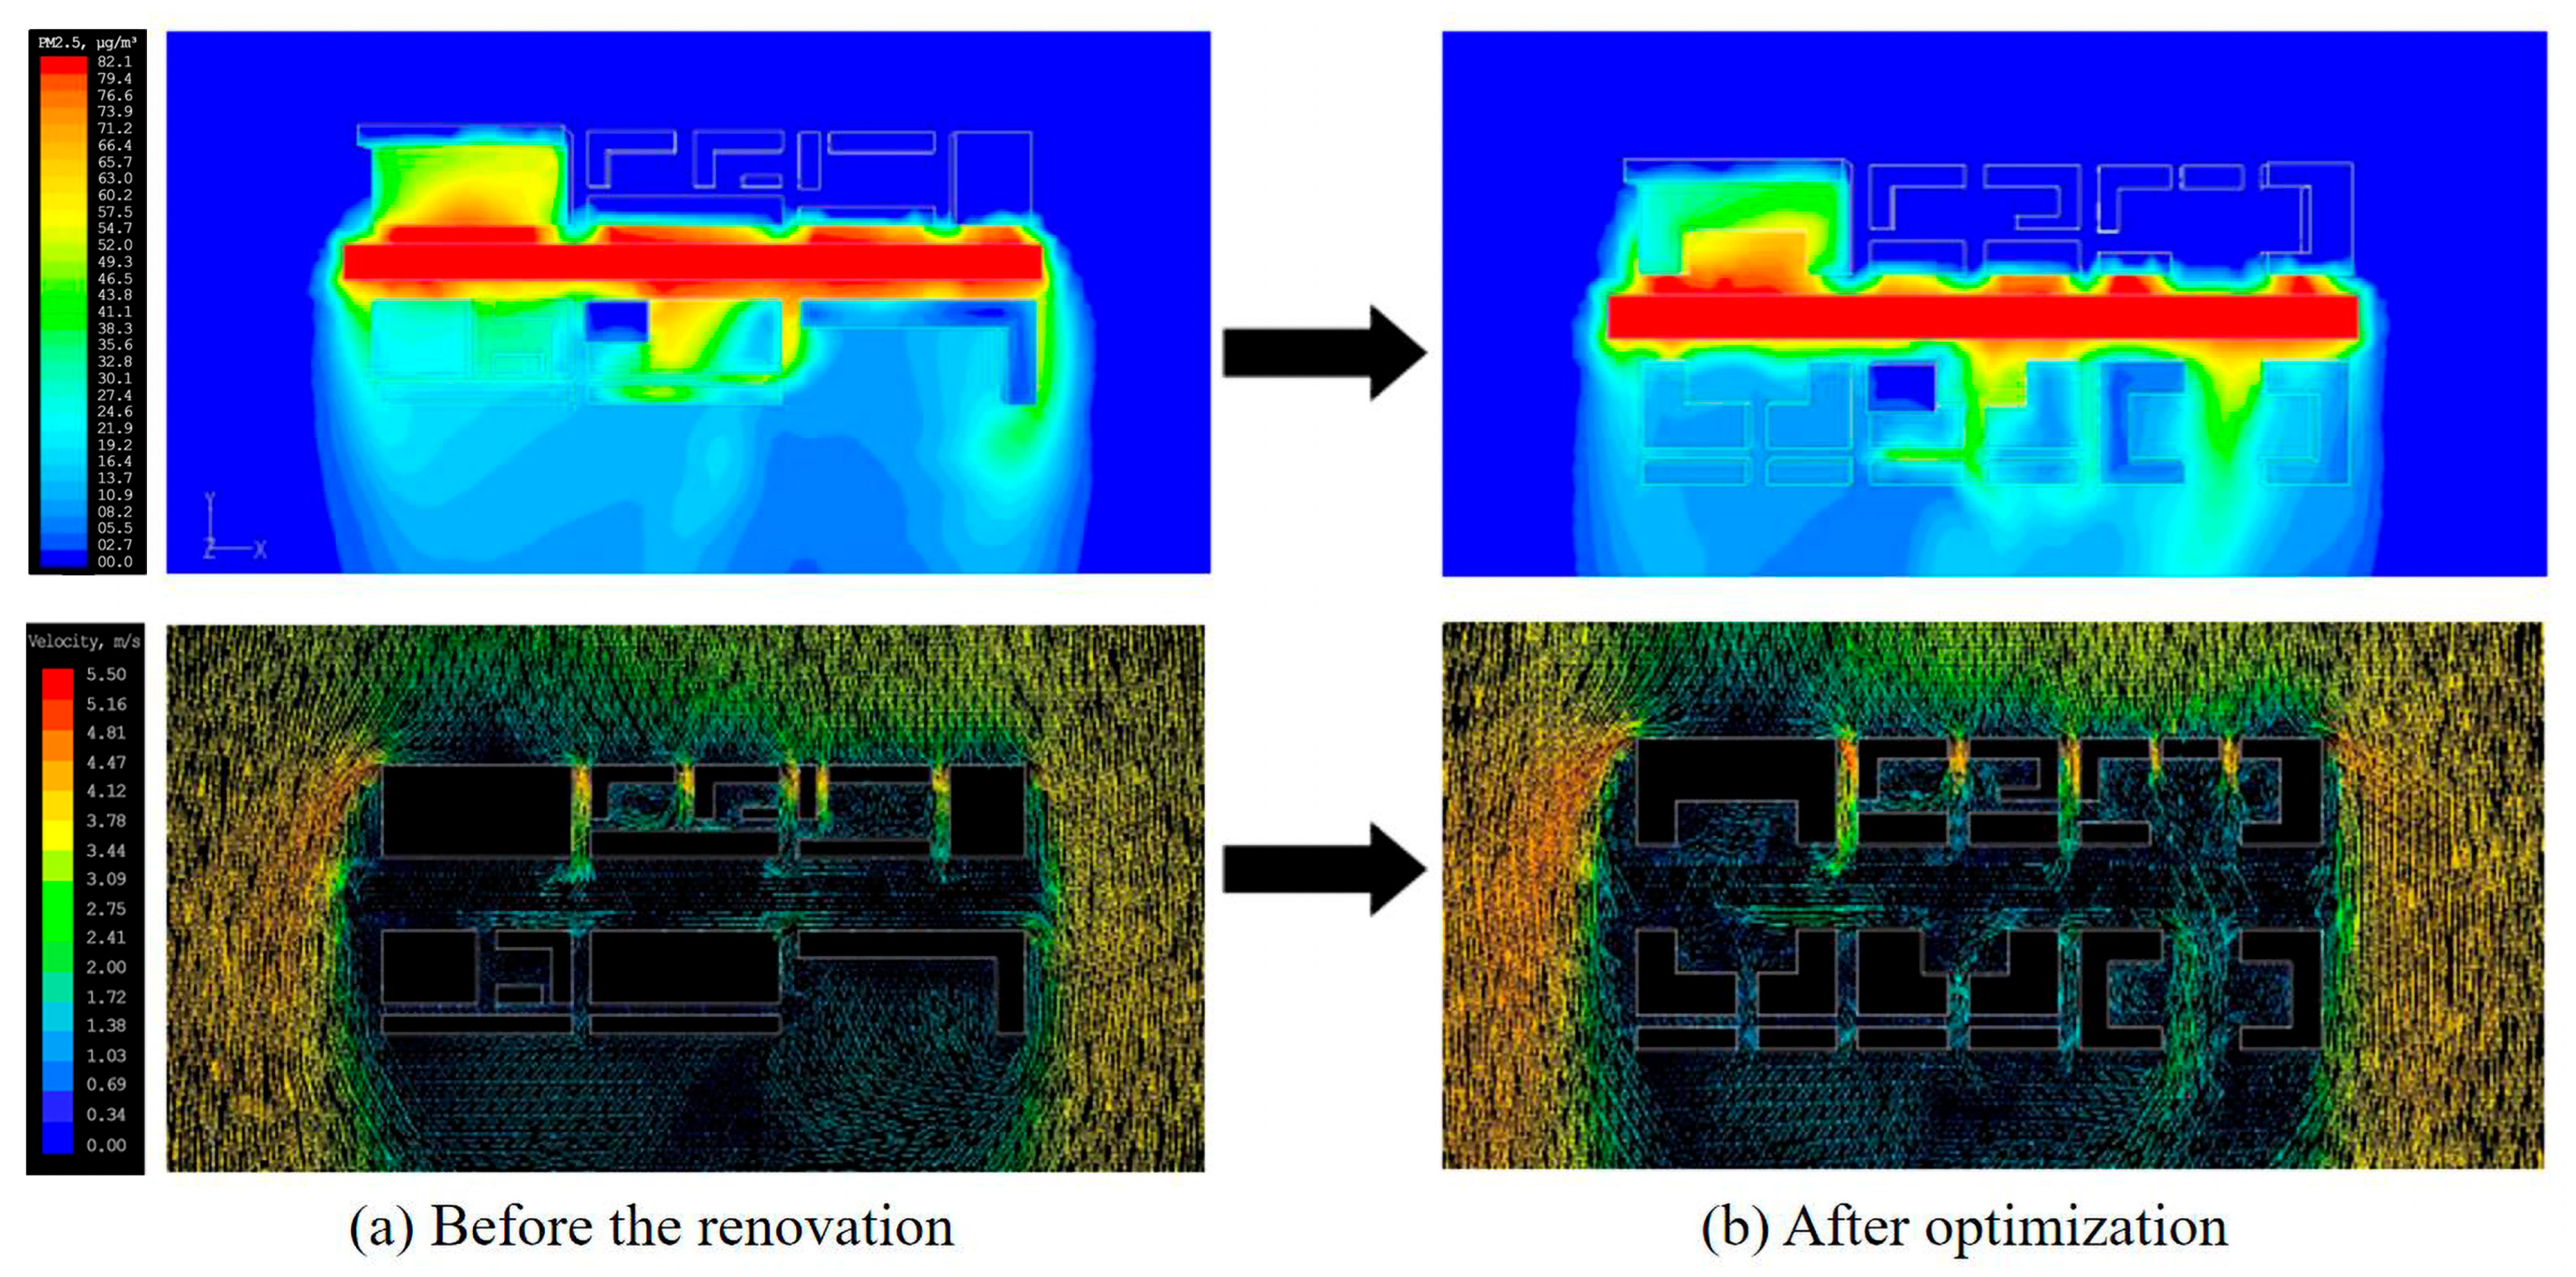
The distribution of open spaces in urban commercial districts is closely related to ventilation. The enclosure between buildings and streets, the enclosure method between buildings, and the formation of fully open spaces and semi-enclosed open spaces will all change the airflow movement inside the block to varying degrees. Setting up open spaces at pollutant-gathering areas will significantly enhance the airflow movement at that location, allowing high-concentration pollutants to be diluted and transported. Research has found that with a certain width of the street, the wider the street space, the more favorable it is for the diffusion of particulate matter. Similarly, in the area north of section A, the width of the street space has been increased by adjusting the building enclosure form (Table 5). After optimizing the design, the pollution range in the horizontal direction was significantly reduced, and the diffusion effect was significantly enhanced. In vertical space, the overall concentration has significantly decreased, with PM2.5 concentrations decreasing by 14.08–52.94%, 22.22–52.38%, and 24.07–52.63% for H = 1.5 m, H = 6 m, and H = 10 m. The maximum decrease in PM2.5 concentration after optimization exceeded 50%, achieving a good optimization effect (Figure 11, Table 6).

4.3. Adjusting Building Skirts

Most of the streets on both sides of the research area are commercial and service buildings with large building volumes (H = 60–80 m) and a combination of podium buildings (H = 25 m) and high-rise buildings (H = 60–80 m). The combination of high-rise buildings and podiums creates a two-level space in the street valley. Within the high-rise space on the upper level of the podiums, the incoming flow of the block forms a meandering flow in the high-rise area. After encountering the high-rise buildings, the incoming air flows downwards to form a downward wash and vortex, making it difficult for particulate matter to accumulate, resulting in low pollution concentration and significant diffusion. However, in the podium area, due to the obstruction of the podium, a relatively enclosed space is formed between the lower podium and the multi-story building, and the upper airflow cannot enter the lower space of the block. In addition, the continuity of the buildings in the lower space of the block is strong, with fewer openings, resulting in the accumulation of a high concentration pollutants (Figure 12a,b). Therefore, in optimization design research, it is necessary to focus on handling the transition space between high-rise buildings and podiums.
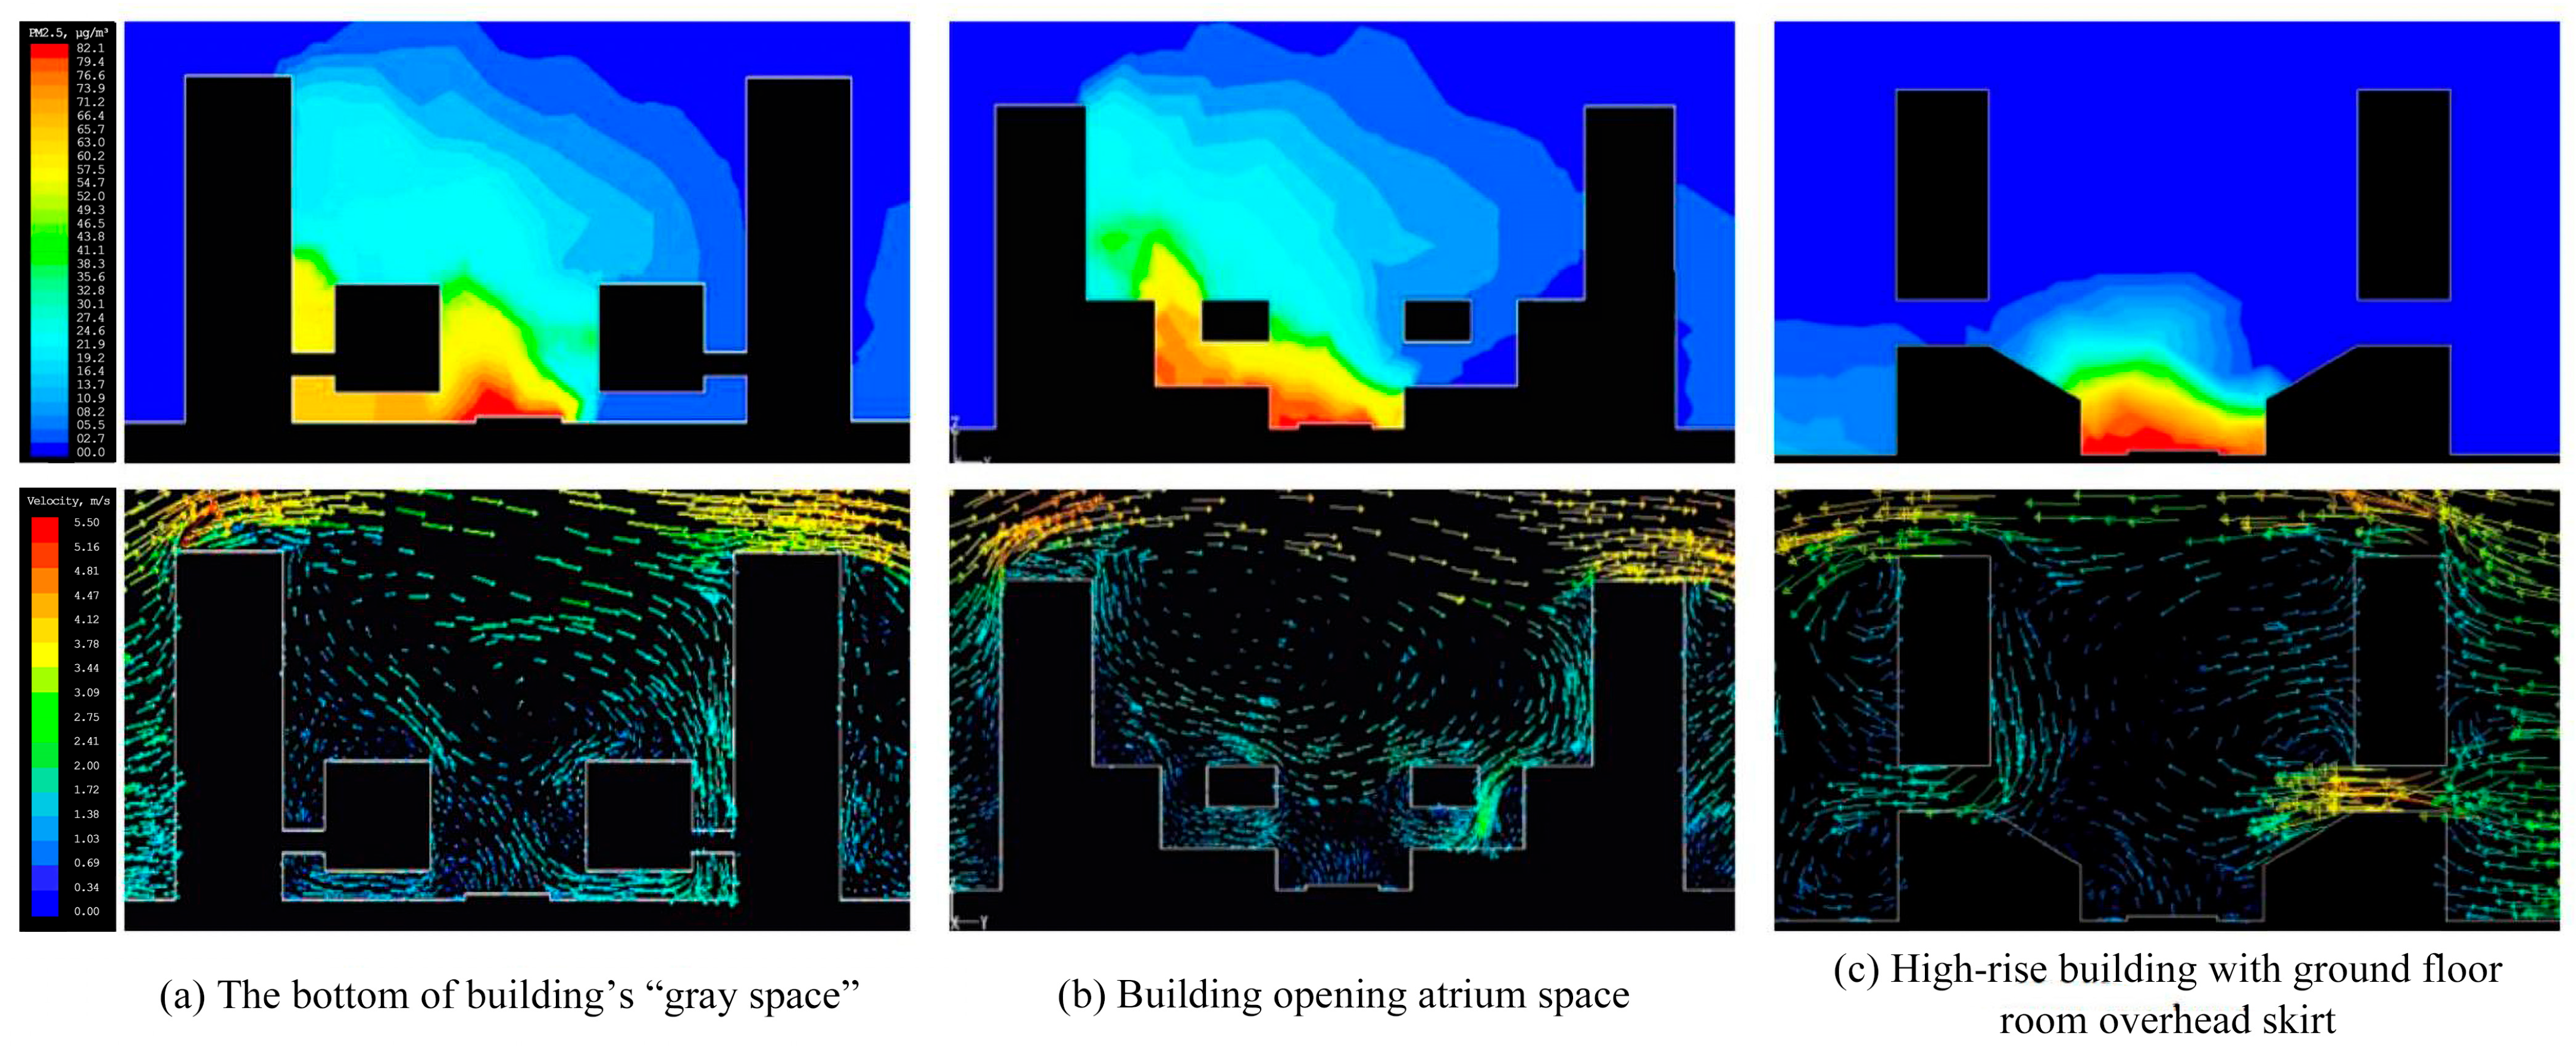
On the premise of ensuring the reasonable use function of the building, in order to allow the incoming flow to smoothly follow the slope into the interior of the block, the form of the right-angle building podium on one side of the street section is changed from a right angle to a slope. The angle between the podium slope and the ground is generally controlled at 30–60°, and the height between the bottom of the slope and the ground is generally a multiple of the building’s floor height, preferably between 6–12 m. The height of the skirt house is adjusted from 25 m to 12 m, forming a 50° angle (Figure 12c). After optimization, the incoming flow in the street area follows the slope of the downstream building skirt house to form a clear downward wash inside the block. PM2.5 can be carried out of the block with the movement of the flow field, completing diffusion and achieving significant optimization effects.
When the form of the right-angled building podium on both sides of the street section changes from a right angle to a setback design, the incoming flow from the upper part of the block can follow the regular changes in the building form and be introduced into the lower space of the block, carrying away and diluting the pollutants accumulated at the bottom of the street, achieving a certain diffusion effect of inhalable particles. The height of each level of setback should be a multiple of the height of the renovated building (6 m or 12 m), so that the internal space of the renovated building can be used reasonably. The podium buildings on both sides of the street were designed with a 12 m setback (Figure 12d), and it was found that the optimized PM2.5 concentration at a height of 1.5 m decreased by 30.43%, indicating a significant optimization effect(Table 7).

4.4. Elevated Design

The bottom floors of the podium buildings on both sides of the street are elevated to form grey spaces, which can facilitate the flow of the block to form a downward wash on the windward side of downstream buildings, establishing a wind field circulation between the podium and the main building. This airflow can carry away pollutants at the bottom of the block, causing them to be transported and diluted. By comparing and analyzing the optimized designs under different elevated heights, the elevated height at the bottom of the podium should be controlled to between 6–12 m. When the elevated height is less than 6 m, the incoming flow entering the block is obstructed through the bottom space and cannot form a significant circulation; when the overhead height is greater than 12 m, the incoming flow cannot form a significant ventilation effect in the building’s “gray space”, making it difficult for pollutants to spread. As shown in Figure 13a, the bottom of the building podium is elevated by 8 m and separated from the main building by 8 m. After optimization, not only is a circulation formed at the bottom of the building, but also a certain circulation is formed on the leeward side of the upstream building. Although some pollutants still accumulate, compared with Figure 12b, a certain diffusion effect is formed, and PM2.5 is reduced by 9.76%, indicating a significant optimization effect. However, for the partial pollution caused by incomplete diffusion of pollutants that accumulates on the leeward side of the street, greening and water body design can be carried out in areas with higher pollution concentrations to achieve further optimization.
The podiums on both sides of the street form an open courtyard space, and the incoming flow creates a clear vortex in the upper space of the podiums, and conforms to the open space of the lower parts of the buildings on both sides to form a circular flow again, allowing pollutants at the bottom of the block to diffuse. Considering the usage nature of commercial buildings and the intensity of airflow entering the block, the height of the open atrium space should be controlled within H ≤ 6 m, providing a comfortable spatial experience while ensuring circulation (Figure 13b). Due to the open space of the upstream building podium being located on the leeward side, pollutants have not been able to diffuse well, resulting in a certain degree of accumulation. This situation can be alleviated to a certain extent by combining the design of vertical greening in buildings.
If an elevated space is formed between the high-rise building and the skirt room, combined with the sloping design of the skirt room, the incoming flow to the block can follow the sloping surface and enter the bottom of the block, forming a very obvious disturbance through the gray space between the high-rise part of the building and the skirt room, and carrying away the accumulated PM2.5 at the bottom. By using the turbulence generated by the building itself, pollution is carried away from the interior of the building, achieving the effect of spreading pollution in the internal space of the block. As shown in Figure 13c, taking into account the building structure and performance, the height selection for the elevated renovation is based on a multiple of the floor height. A 6 m elevated structure is formed between the high-rise building and the skirt room, creating a clear ventilation corridor and generating significant circulation. The optimization effect is significant, and PM2.5 is reduced by 17.73%.

4.5. Limitations of the Research

Although this study revealed the correlation between the vertical distribution of PM2.5 in the commercial district of Taiyuan Street in Shenyang and building combinations through CFD methods, and proposed design strategies such as ventilation corridors and podium optimization based on this, the multiple assumptions in the simulation inevitably limit the extrapolation and universality of the conclusions. In the CFD simulation of the research area, the winter urban average wind speed of 3 m/s and average temperature of −10 °C were used as simulation conditions. However, in actual blocks, low wind speed and high-frequency wind direction deviation phenomena may occur during the heating period, which will increase the residence time of PM2.5 in the street valley [52]. In addition, the emission sources within the block did not take into account the daily fluctuations during winter traffic peaks in commercial areas, local high-level point sources during concentrated catering periods, and the potential formation of secondary aerosols in low-temperature environments, resulting in PM2.5 concentration assessments lower than the actual situation [61,62]. Therefore, this study has certain limitations when applied to other seasons, more complex wind fields, or emission scenarios.

5. Conclusions

This study first analyzed the architectural environment characteristics of the Taiyuan Street commercial district in Shenyang and extracted typical spatial layout forms of commercial blocks. Subsequently, based on the measured PM2.5 data, the diffusion of PM2.5 in commercial districts was simulated using the Fluent model. By analyzing the PM2.5 concentration characteristics of key horizontal sections and different building combinations, it was revealed that the spatial layout of different districts is related to the distribution of urban pollutant concentrations. The smooth spatial layout system of the block plays a crucial role in the natural regulation of the climate environment. It can facilitate air circulation and allow airflow to reach the interior of the block, especially the lower-level space, directly affecting the overall air quality of the block. From the perspective of key horizontal sections, H = 1.5 m is the height of human respiration, with the most severe pollution and highest concentration; H = 10 m is a low-rise building area, where pollutants are slightly reduced compared to H = 1.5 m, with a linear distribution and continuous distribution in most areas; H = 30 m is a multi-story building and podium building area, and the pollution concentration and range of the block are beginning to decrease. The pollutants in the area above H = 50 m have basically diffused, with some showing point-like distribution, and are completely diffused by 80 m. From the perspective of architectural composition, the wider the street space, the more conducive it is to the spread of pollution. At the same time, according to the direction of inflow, upstream buildings should be lower than downstream buildings. Most commercial areas are a combination of high-rise buildings and podiums. Properly changing the form of podiums can alleviate pollution in the lower part of the street area. Based on these findings, we propose four optimization strategies: (1) By segmenting large buildings and constructing ventilation corridors 20 m wide; (2) Change the enclosure relationship between buildings and streets to form an open system; (3) Optimize the structure of the building podium based on the multiple of building heights (6–12 m) for adjustment; (4) Utilize bottom-elevated, atrium-elevated, and high-rise podium-elevated methods to increase block circulation. The research results can be used for the environmental renovation and design of commercial districts, and contribute actionable tools to the promotion of a healthy urban environment, ultimately achieving a sustainable urban development model.

Author Contributions

P.L.: Conceptualization, Methodology, Validation, Formal analysis, Writing—Original Draft. D.Q.: Software, Data Curation. H.T.: Data Curation, Resources. Z.W.: Investigation, Visualization. F.M.: Conceptualization, Writing—Review and Editing, Funding acquisition. All authors have read and agreed to the published version of the manuscript.

Funding

The research was supported by the National Key R&D Program for the 14th Five-Year Plan of China (2023YFC3804102 in 2023YFC3804100).

Institutional Review Board Statement

Not applicable.

Informed Consent Statement

Not applicable.

Data Availability Statement

The data presented in this study are available on request from the corresponding author.

Conflicts of Interest

The authors declare no conflict of interest. Mr. Tai is an employee of Shenyang Geotechnical investigation & surveying Research institute Co., Ltd. The paper reflects the views of the scientists and not the company.

References

  1. Liu, Z.F.; He, C.Y.; Zhou, Y.Y.; Wu, J.G. How much of the world’s land has been urbamized, really? A hierarchical framework for avoiding coniusion. Landsc. Ecol. 2014, 29, 763–771. [Google Scholar] [CrossRef]
  2. United-Nations. World Urbanization Prospects: The 2018 Revision; UN DESA: New York, NY, USA, 2018; Available online: http://esa.un.org/unpd/wup/ (accessed on 1 August 2024).
  3. Talukder, S.; Capon, A.; Nath, D.; Kolb, A.; Jahan, S.; Bouford, J. Urban health in the post-2015 agenda. Lancet 2015, 385, 769. [Google Scholar] [CrossRef] [PubMed]
  4. Song, J.; Li, C.L.; Liu, M.; Hu, Y.M. Spatiotemporal distribution pattens and exposure risks of PM2.5 pollution in China. Remote Sens. 2022, 14, 3173. [Google Scholar] [CrossRef]
  5. Li, C.L.; Liu, M.; Hu, Y.M.; Wang, H.; Xiong, Z.P.; Wu, W.; Liu, C.; Zhang, C.Y.; Du, Y. Invesigating the verical distribution pattems of urban airpollution based on unmanned aerial vehicle gradient monitoring. Sustain. Cities Soc. 2022, 86, 104144. [Google Scholar] [CrossRef]
  6. Hasegawa, K.; Tsukahara, T.; Nomiyama, T. Short-term associations of low-level fine particulate matter (PM2.5) with cardiorespiratory hospitalizations in 139 Japanese cities. Ecotoxicol. Environ. Saf. 2023, 258, 114961. [Google Scholar] [CrossRef]
  7. Vohra, K.; Vodonos, A.; Schwartz, J.; Marais, E.; Sulprizio, M.; Mickley, L. Global mortality from outdoor fine particle pollution generated by fossil fuel combustion: Results from GEOS-Chem. Environ. Res. 2021, 195, 110754. [Google Scholar] [CrossRef]
  8. Aggelos, K.; Kyriaki, M.F.; Konstantinos, M.; Vasiliki, D.A.; Panagiotis, T.N. Threefold Threshold: Synergistic Air Pollution in Greater Athens Area, Greece. Atmosphere 2025, 16, 888. [Google Scholar] [CrossRef]
  9. Shang, X.H.; Wang, S.B.; Zhang, R.Q.; Yuan, M.H.; Xu, Y.F.; Ying, Q. Variations of the source-specific health risks from elements in PM2.5 from 2018 to 2021 in a Chinese megacity. Atomspheric Pollut. Res. 2024, 15, 102092. [Google Scholar] [CrossRef]
  10. Ghosh, B.; Padhy, P.K.; Ali, S.Y.; Shaik, R.; Hossain, M.; Nayek, S.; Bhui, I.; Majee, C.K. Spatiotemporal distribution of PM2.5 and health risk assessment in Kolkata, India: Evaluation of non-carcinogenic health hazards and premature mortality. Urban Clim. 2024, 56, 102005. [Google Scholar] [CrossRef]
  11. Shi, Y.; Ng, E. Fine-Scale Spatial Variability of Pedestrian-Level Particulate Matters in Compact Urban Commercial Districts in Hong Kong. Int. J. Environ. Res. Public Health 2017, 14, 1008. [Google Scholar] [CrossRef]
  12. He, Q.L.; Zhou, Y.F.; Lu, R.H.; Wang, L.Y.; Zou, Q.Y.; Li, M.Y. Exploring the impact mechanism of PM2.5 in urban functional areas based on geodetectors and pollutant measurement. Intell. City 2024, 10, 16–19. [Google Scholar] [CrossRef]
  13. Sun, Y.M.; Fan, J.; Xu, B. Source Apportionment and Seasonal changes in PM2.5 Chemical Components from Different Functional Areas of a Provincial Capital city PM2.5. Environ. Sci. 2022, 43, 2304–2316. [Google Scholar] [CrossRef]
  14. Luo, S.; Liu, Y.; Liu, Y.; Du, M.; Gao, S.; Wang, P.; Liu, X. The Influence of Spatial Grid Division on the Layout Analysis of Urban Functional Areas. Int. J. Geo-Inf. 2021, 10, 189. [Google Scholar] [CrossRef]
  15. Bao, H.; Ming, D.; Guo, Y.; Zhang, K.; Zhou, K.; Du, S. DFCNN-Based Semantic Recognition of Urban Functional Zones by Integrating Remote Sensing Data and POI Data. Remote Sens. 2020, 12, 1088. [Google Scholar] [CrossRef]
  16. Hu, Y.; Han, Y. Identification of urban functional areas based on POI data: A case study of the Guangzhou Economic and Technological Development Zone. Sustainability 2019, 11, 1385. [Google Scholar] [CrossRef]
  17. Seaman, N.L. Future Directions of Meteorology Related to Air-Quality Research. Environ. Int. 2003, 29, 245–252. [Google Scholar] [CrossRef]
  18. Schichtel, B.A. Local and Regional Contributions of Fine Particulate Mass to Urban Areas in the Mid-Atlantic and Southwestern US; Report; Center of Air Pollution Impact and Trend Analysis, Washington University: St. Louis, MO, USA, 1999. [Google Scholar]
  19. Wang, F.; Lin, T.; Feng, J.; Fu, H.; Guo, Z. Source Apportionment of Polycyclic Aromatic Hydrocarbons in PM2.5 Using Positive Matrix Factorization Modeling in Shanghai, China. Environ. Sci. Process. Impacts 2015, 17, 197–205. [Google Scholar] [CrossRef]
  20. Ren, C.; Yuan, C.; Ho, J.C.; Ng, E. A Study of Air Path and lts Application in Urban Planning. Urban Plan. Forum 2014, 3, 52–60. [Google Scholar] [CrossRef]
  21. Yu, C.C.; Deng, Y.Q.; Qin, Z.T.; Yang, C.; Yuan, Q. Traffic volume and road network structure: Revealing transportation-related factors on PM2.5 concentrations. Transp. Res. Part D-Transp. Environ. 2023, 124, 103935. [Google Scholar] [CrossRef]
  22. Jareemit, D.; Liu, J.Y.; Srivanit, M. Modeling the effects of urban form on ventilation patterns and traffic-related PM2.5 pollution in a central business area of Bangkok. Build. Environ. 2023, 224, 110756. [Google Scholar] [CrossRef]
  23. Wang, Z.; Liu, Q.; He, H. Investigation of the Spatiotemporal Variation and Influencing Factors on Fine Particulate Matter and Carbon Monoxide Concentrations Near a Road Intersection. Front. Earth Sci. 2017, 11, 63–75. [Google Scholar] [CrossRef]
  24. Dockery, D.; Pope, C.; Xu, X. An Association Between Air Pollution and Mortality in Six U.S. Cities. N. Engl. J. Med. 1994, 329, 1753–1759. [Google Scholar] [CrossRef] [PubMed]
  25. Dai, M.M.; Wang, W.; HU, C. Characteristics of Particulate Matter Distribution inBusiness and Residence Mixed Blocks and Influence onBuilding Layout—Taking Binhu Block in Hefei city as an Example. Hous. Sci. 2023, 43, 44–50+56. [Google Scholar] [CrossRef]
  26. Li, P.; Chen, Y.; Niu, H.; Zhang, L.; Tang, Y.; Zhu, G.; Zhang, Z.; Ma, Y.; Wu, W. How to evaluate the reduction effect of the park on PM2.5: Exploratory application of the maximum and cumulative perspective. Sustain. Cities Soc. 2024, 116, 105909. [Google Scholar] [CrossRef]
  27. Sargazizadeh, M.S.; Bazdidi-Tehrani, F. Flow field and particle dispersion in a naturally ventilated model building: Application of large eddy simulation based on parallel lattice Boltzmann method. Sustain. Cities Soc. 2024, 106, 105413. [Google Scholar] [CrossRef]
  28. Liu, X.; Wu, W.; Zou, H.; Pan, C.; Liu, M.; Li, H. Unveiling seasonal disparities in urban form: Exploring scale and intensity effects on PM2.5 concentrations. Urban Clim. 2025, 59, 102319. [Google Scholar] [CrossRef]
  29. Faraji, M.; Nadi, S.; Ghaffarpasand, O.; Homayoni, S.; Downeyet, K. An integrated 3D CNN-GRU deep learning method for short-term prediction of PM2.5 concentration in urban environment. Sci. Total Environ. 2022, 834, 155324. [Google Scholar] [CrossRef]
  30. Wang, W.; Cheng, X.; Dai, M. Strategies for sustainable urban development and morphological optimization of street canyons: Measurement and simulation of PM2.5 at different points and heights. Sustain. Cities Soc. 2022, 87, 104191. [Google Scholar] [CrossRef]
  31. Jiang, P.; Yang, J.; Huang, C.; Liu, H. The contribution of socioeconomic factors to PM2.5pollution in urban China. Environ. Pollut. 2018, 233, 977–985. [Google Scholar] [CrossRef]
  32. Xu, G.; Ren, X.; Xiong, K.; Li, L.; Bi, X.; Wu, Q. Analysis of the driving factors of PM2.5 concentration in theair: A case study of the Yangtze River Delta, China. Ecol. Indic. 2020, 110, 105889. [Google Scholar] [CrossRef]
  33. Zhang, Y.; Shuai, C.; Bian, J.; Chen, X.; Shen, L. Socioeconomic factors of PM2.5 concentrations in 152 Chinese cities: Decomposition analysis using LMDI. J. Clean. Prod. 2019, 218, 96–107. [Google Scholar] [CrossRef]
  34. Yang, D.; Wang, X.; Xu, J.; Xu, C.; Lu, D.; Ye, C.; Wang, Z.; Bai, L. Quantifying the influence of natural and socioeconomic factors and their interactive impact on PM2.5 pollution in China. Environ. Pollut. 2018, 241, 475–483. [Google Scholar] [CrossRef]
  35. Cheng, Z.; Li, L.; Liu, J. Identifying the spatial effects and driving factors of urban PM2.5pollution in China. Ecol. Indic. 2017, 82, 61–75. [Google Scholar] [CrossRef]
  36. Feng, J.; Li, M.; Zhang, P. Investigation of the Sources and Seasonal Variations of Secondary Organic Aerosols in PM2.5 in Shanghai with Organic Tracers. Atmos. Environ. 2013, 79, 614–622. [Google Scholar] [CrossRef]
  37. Fan, C.; Tian, L.; Zhou, L.; Hou, D.; Song, Y.; Qiao, X.; Li, J. Examining the Impacts of Urban Form on Air Pollutant Emissions: Evidence from China. J. Environ. Manag. 2018, 212, 405–414. [Google Scholar] [CrossRef] [PubMed]
  38. Zeng, D.H.; Chen, C.J. Spatial-Temporal Characteristics and Influence Factors of PM2.5 Concentrations in Chengdu—Chongqing Urban Agglomeration. Res. Environ. Sci. 2019, 32, 1834–1843. [Google Scholar] [CrossRef]
  39. Huang, X.G.; Zhao, J.B.; Cao, J.J. Evolution of the Distribution of PM2.5 Concentration in the Yangtze River Economic Belt and Its Influence Factors. Environ. Sci. 2020, 41, 1013–1024. [Google Scholar] [CrossRef]
  40. Aleksandropoulou, V.; Torseth, K.; Lazaridis, M. Atmospheric Emission Inventory for Natural and Anthropogenic Sources and Spatial Emission Mapping for the Greater Athens Area. Water Air Soil Pollut. 2011, 219, 507–526. [Google Scholar] [CrossRef]
  41. Xu, H.H.; Chen, H. Research on the Urban Spatial Structure Based on the Accommodation of Air Pollution: A Case Study in Wuhan City. J. Hum. Settl. West China 2020, 35, 73–78. [Google Scholar] [CrossRef]
  42. Zhang, S.P.; Han, L.J.; Zhou, W.Q. Impact of Urban Population on Concentrations of Nitrogen Dioxide (NO2) and Fine Particles (PM2.5) in China. Acta Ecol. Sin. 2016, 36, 5049–5057. [Google Scholar]
  43. Wang, C.M.; Wan, D.J.; Wang, K.X. Spatial-Temporal Distribution and Influencing Factors of PM2.5 Concentration in Changsha City. Sci. Technol. Eng. 2021, 21, 5157–5165. [Google Scholar] [CrossRef]
  44. Tang, Y.K.; Liu, S.H. Study on the Correlation Between Urban Land Use Type and PM2.5 Concentration: A Case Study of Wuhan City. Resour. Environ. Yangtze Basin 2015, 24, 1458–1463. [Google Scholar] [CrossRef]
  45. Li, C.; Wang, Z.; Li, B. Investigating the Relationship Between Air Pollution Variation and Urban Form. Build. Environ. 2018, 147, 559–568. [Google Scholar] [CrossRef]
  46. Marian, M.P.; Enma, T.H.; Eliana, I.; Daniel, L.M.; Fredy, S.M.; Daniel, H. Air Pollution in Two Districts of the City of Cusco: An Interdisciplinary Study Based on Environmental Monitoring and Social Risk Perception. Atmosphere 2025, 16, 770. [Google Scholar] [CrossRef]
  47. Jia, B.S.; Liu, S.B.; Ng, C.Y. Air Quality and Residential Morphology: A Correlation Study. J. Hum. Settl. West China 2020, 35, 1–9. [Google Scholar] [CrossRef]
  48. He, J.; Ding, S.; Liu, D. Exploring the spatiotemporal pattern of PM2.5 distribution and its determinants in Chinese cities based on a multilevel analysis approach. Sci. Total Environ. 2018, 659, 1513–1525. [Google Scholar] [CrossRef]
  49. Wang, Y.; Lu, Z.; Ma, Y.; Li, X.; Ren, W.; Zou, X. Analysis on the characteristics of wind speed and wind energy resources from 1961 to 2020 and the impact of urban underlying surface change on them in Shenyang. Energy Rep. 2022, 8, 335–342. [Google Scholar] [CrossRef]
  50. Li, X.; Ma, Y.; Wang, Y.; Liu, N.; Hong, Y. Temporal and spatial analyses of particulate matter (PM 10 and PM 2.5) and its relationship with meteorological parameters over an urban city in northeast China. Atmos. Res. 2017, 198, 185–193. [Google Scholar] [CrossRef]
  51. Xiao, H.; Peng, W.; Li, H.S.; Yu, F.B.; Li, J.Z.; Li, Z.G. Numerical Simulation of Airflow and Pollutant Dispersion Around High-Rise Buildings with Different Rotation Angles. Processes 2024, 12, 2828. [Google Scholar] [CrossRef]
  52. Li, Q.M.; Zheng, J.P.; Yuan, S.; Zhang, L.X.; Dong, R.M.; Fu, H.H. RAV model: Study on urban refined climate environment assessment and ventilation corridors construction. Build. Environ. 2024, 248, 111080. [Google Scholar] [CrossRef]
  53. He, Y.Y.; Liu, Z.X.; Ng, E. Parametrization of irregularity of urban morphologies for designing better pedestrian wind environment in high-density cities—A wind tunnel study. Build. Environ. 2022, 226, 109692. [Google Scholar] [CrossRef]
  54. Peng, F.; Wong, M.S.; Wan, Y.L.; Nichol, J.E. Modeling of urban wind ventilation using high resolution airborne LiDAR data. Comput. Environ. Urban. Syst. 2017, 64, 81–90. [Google Scholar] [CrossRef]
  55. Kirmaci, V.; Kaya, H. Effects of working fluid, nozzle number, nozzle material and connection type on thermal performance of a Ranque-Hilsch vortex tube: A review. Int. J. Refrig. 2018, 91, 254–266. [Google Scholar] [CrossRef]
  56. Versteeg, H.K.; Malalasekera, W. Turbulence and its modelling. In An Introduction to Computational Fluid Dynamics: The Finite Volume Method, 2nd ed.; Pearson Education: Harlow, UK, 2007; p. 90. [Google Scholar]
  57. Versteeg, H.K.; Malalasekera, W. CFD modelling of combustion. In An Introduction to Computational Fluid Dynamics: The Finite Volume Method, 2nd ed.; Pearson Education: Harlow, UK, 2007; p. 378. [Google Scholar]
  58. Tian, L.; Yang, Z.; Zhao, L. Climate sensitivity and area efficiency threshold of urban park cooling effects: A cross-climate zone comparative analysis. Landsc. Ecol. 2025, 40, 154. [Google Scholar] [CrossRef]
  59. Song, X.C.; Zhang, Y.; Zhao, Y. Factors evaluation of PM2.5 diffusion in street canyons in Dalian based on numerical simulation. Build. Simul. 2025, 8, 619–639. [Google Scholar] [CrossRef]
  60. Cao, J.; Yang, J. Toward refined scale selection: A non-fixed buffer method for defining micro-scale urban morphological elements. Urban Plan. International. 2022, 37, 18–24. [Google Scholar] [CrossRef]
  61. Thammaluck, R.; Win, T. Application of a PM2.5 dispersion model in the Bangkok central business district. Front. Environ. Sci. 2023, 11, 1237366. [Google Scholar] [CrossRef]
  62. Fatma, A.; Debjit, M.; Rabs, R.; Aman, G.; Michael, M. Preliminary study on the spread of air-borne pollutants in Munich city center—A high-resolution CFD approach. Sci. Rep. 2025, 15, 3197. [Google Scholar] [CrossRef]
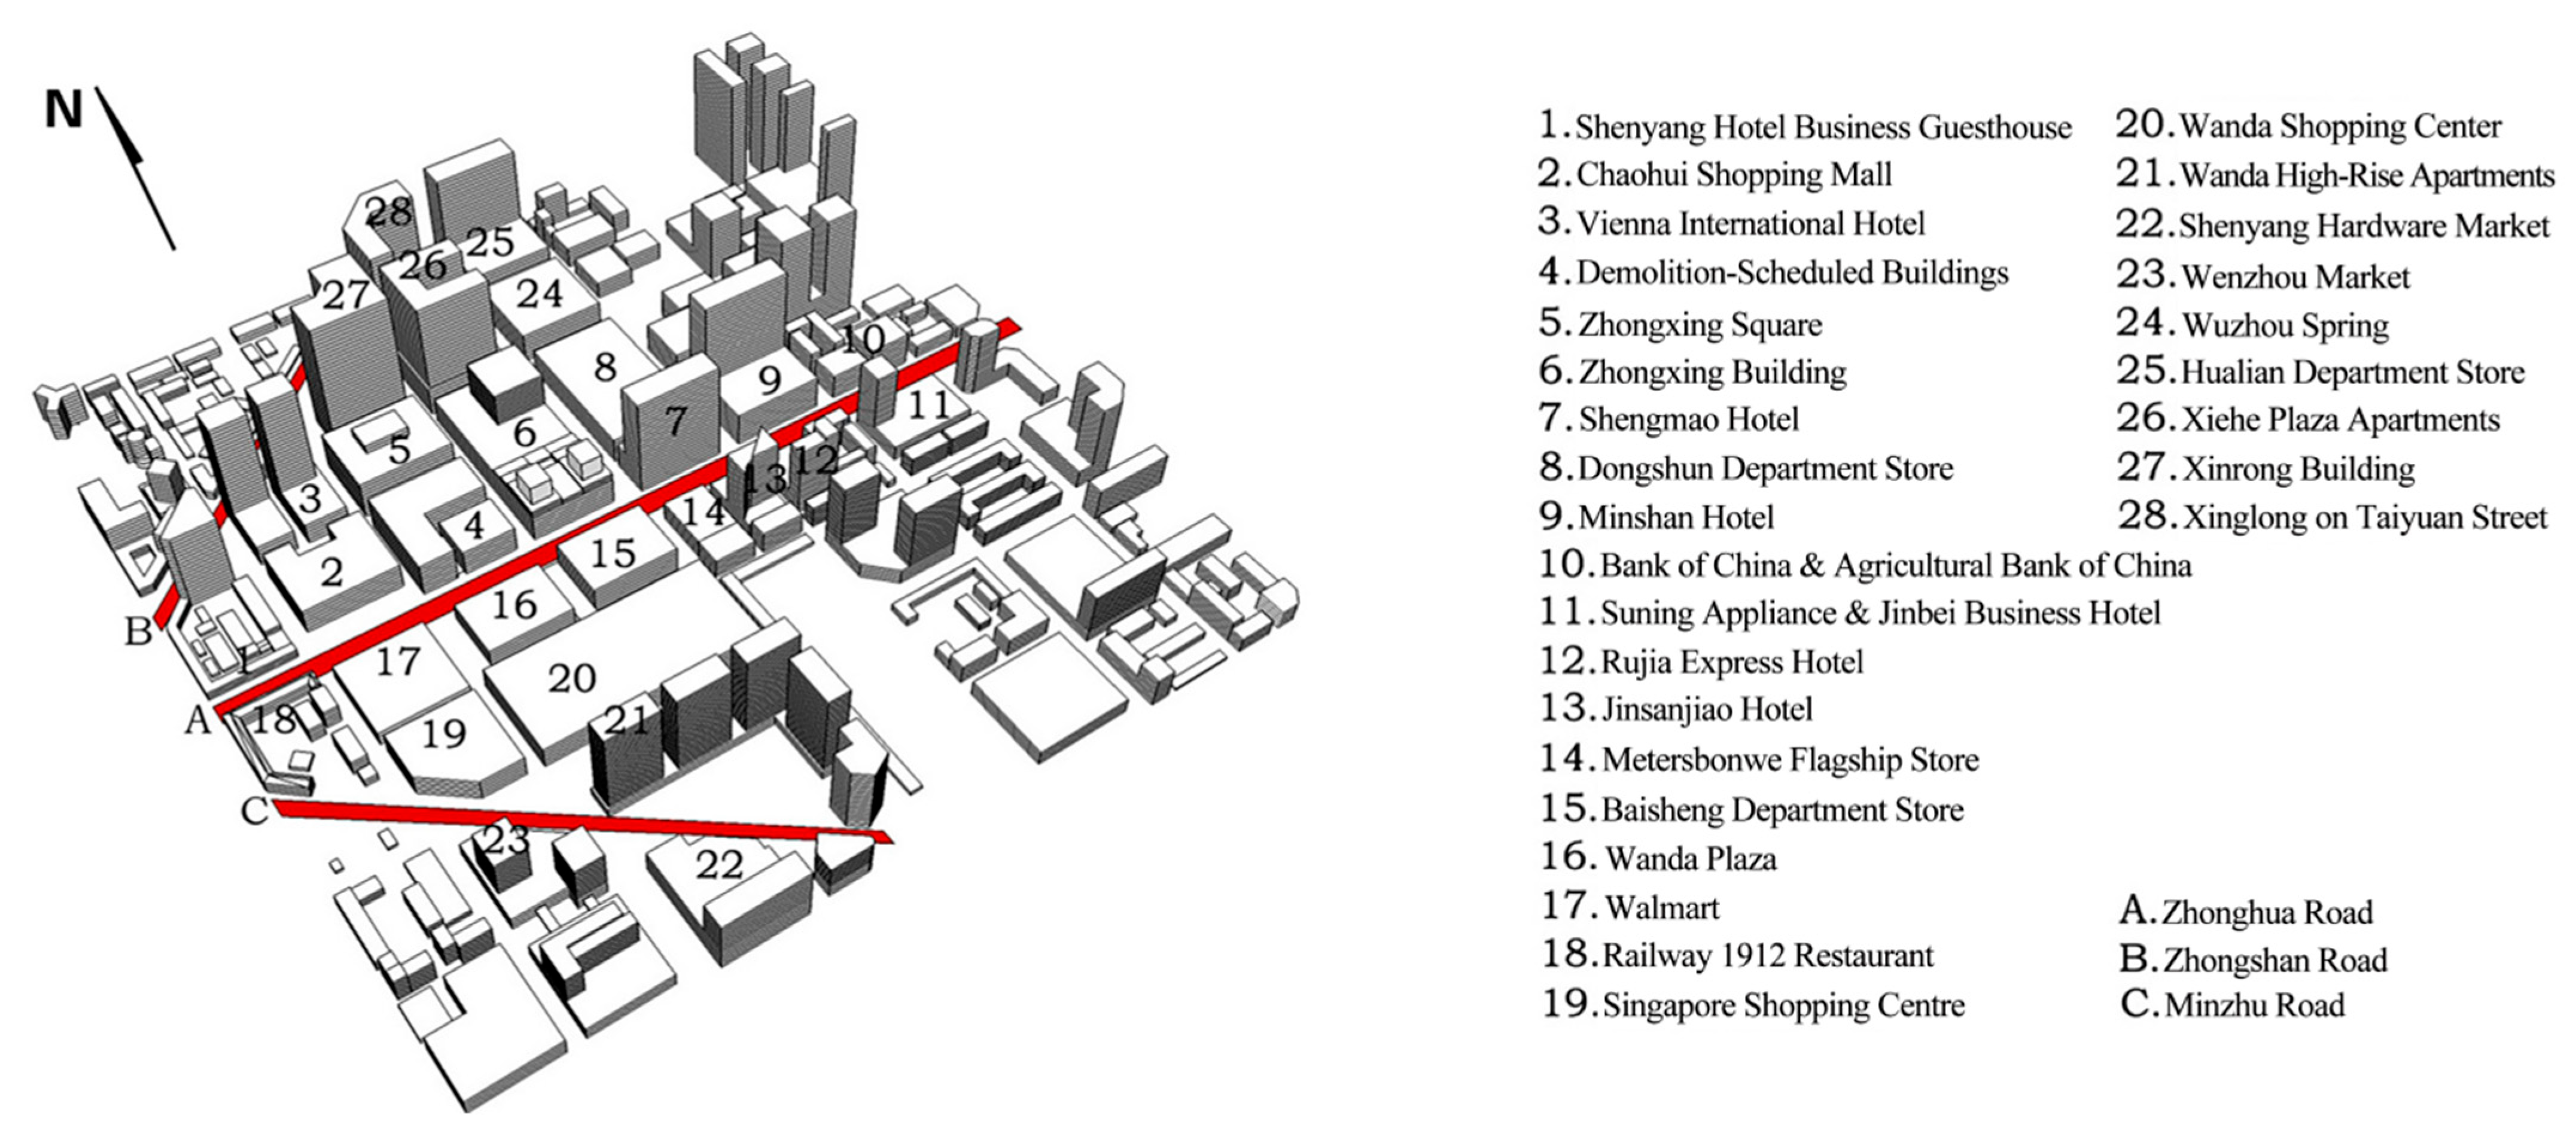
Figure 1. Three-dimensional current status model of the building environment in the research area.
Atmosphere 16 01255 g001
Figure 2. PM2.5 diffusion simulation flowchart. ((a) establish a 3D model; (b) grid division and setting boundary conditions; (c) select control equation; (d) fluent simulation process; (e) simulation result verification).
Atmosphere 16 01255 g002
Figure 3. Different height levels of street space features a schematic cross-section (Red: Street; solid black line: both sides of the architectural cross-section; gray: open space).
Atmosphere 16 01255 g003
Figure 4. Schematic cross-section selected(The symbols like 1-1 represent the position of the road section, and the red dots indicate the position of the measured points.).
Atmosphere 16 01255 g004
Figure 5. Distribution map of PM2.5 diffusion in three-dimensional space from different angles (A. Zhonghua Road; B. Zhongshan Road; C. Minzhu Road).
Atmosphere 16 01255 g005
Figure 6. Wind vectors under the horizontal section of different heights (A. Zhonghua Road; B. Zhongshan Road; C. Minzhu Road).
Atmosphere 16 01255 g006
Figure 7. Distribution map of PM2.5 diffusion at different heights and horizontal cross-sections (A. Zhonghua Road; B. Zhongshan Road; C. Minzhu Road).
Atmosphere 16 01255 g007
Figure 8. Vertical dispersion distribution map of PM2.5 in eight typical block spaces.
Atmosphere 16 01255 g008
Figure 9. Building massing on both sides of the street: particulate matter diffusion schematic.
Atmosphere 16 01255 g009
Figure 10. Block diagram of ventilation corridor before renovation and after optimization.
Atmosphere 16 01255 g010
Figure 11. Block diagram of open space before renovation and after optimization.
Atmosphere 16 01255 g011
Figure 12. Optimization design of building podium.
Atmosphere 16 01255 g012
Figure 13. Optimization design of bottom space in buildings.
Atmosphere 16 01255 g013
Table 1. Typical cross-section specific information.
Cross-Section1-12-23-34-45-56-67-78-8
H110 m15 m50 m80 m30 m (Pavilion)30 m (Pavilion)20 m20 m
H210 m12 m40 m20 m20 m (Pavilion)30 m60 m20 m
H1:H21:15:45:44:13:21:11:31:1
W40 m40 m40 m40 m40 m40 m40 m40 m
H:W1:4≈1:3≈1:1————3:4——1:2
Note: When there is a significant difference between H1 and H2, the street aspect ratio is not calculated, and uses symbols “——” to represent.
Table 2. Typical pollution concentration values of different blocks of space in the vertical direction (μg/m3).
Typical Space/Height1.5 m6 m10 m30 m50 m80 m
179766835190
2827976573210
3635950423012
471685731218
559484331218
682767132210
746413521132
868635721130
Table 3. Parameter changes before and after optimization of architectural space combination.
Before the renovation
Architectural compositionAtmosphere 16 01255 i001
Building number12345678
Dimensions (m)196196196196196108140236
After optimization
Architectural compositionAtmosphere 16 01255 i002
Number adjustment1-11-22-12-23-13-24-14-25-15-26-16-27-17-28-18-28-3
Dimensions (m)8888888888888888888838507050705076
Table 4. Vertical concentration distribution of the same position before and after corridor optimization (μg/m3).
Sampling Point/Height1.5 m6 m10 m30 m50 m80 m
1Before renovation79766843248
After optimization59524332218
2Before renovation827976493210
After optimization635950423010
3Before renovation68635724130
After optimization59494321130
Table 5. Parameter changes before and after optimization of open space.
Before the RenovationAfter Optimization
Architectural compositionAtmosphere 16 01255 i003Atmosphere 16 01255 i004
Building number123456123456
Dimensions (m2)01719228868125283889117421572361180833843722
Table 6. Vertical concentration distribution of the same position before and after optimization of open space (μg/m3).
Sampling Point/Height1.5 m6 m10 m30 m50 m80 m
1Before renovation68635743248
After optimization32302721130
2Before renovation716857433210
After optimization52463524190
3Before renovation71635427135
After optimization61494121130
Table 7. Optimization of vertical concentration distribution of pollutants within the front section of the street (mg/m3).
Street Section/Height1.5 m6 m10 m30 m50 m80 m
Before optimizationSingle sided skirt room0.0820.0790.0790.0650.0240.010
Skirts on both sides0.0820.0790.0730.0570.0130.008
After optimizationSlope optimization0.0710.0650.0540.0300.0130.010
Withdrawal optimization0.0710.0540.0490.0270.0160.002
Disclaimer/Publisher’s Note: The statements, opinions and data contained in all publications are solely those of the individual author(s) and contributor(s) and not of MDPI and/or the editor(s). MDPI and/or the editor(s) disclaim responsibility for any injury to people or property resulting from any ideas, methods, instructions or products referred to in the content.