1. Introduction
The troposphere is the most important layer of the Earth’s atmosphere. The Earth’s atmosphere is 80 percent troposphere, and it is bounded at the top by a layer called the tropopause. This boundary is marked by a temperature inversion in some areas and isothermal conditions in others [
1]. Although it extends approximately 11 km [
2], with variations in height in the polar and equatorial zones, only 20% of the troposphere is made up of the planetary boundary layer (PBL) [
3]. This is the lowest part of the troposphere that is directly influenced by the Earth’s surface, responding in a matter of hours or less to forcing mechanisms. The thickness of the PBL varies over time and space depending on mechanisms including heat transfer, friction force and pollutants, as well as land use and landforms [
2,
4]. The PBL’s thickness varies with the time of day, involving a diurnal variation in thickness. Since water has a high heat storage and absorption capacity and there are no significant temperature changes, the depth of the PBL varies slowly over seas and oceans during the diurnal cycle. Only large-scale air advection and vertical movement can produce changes in PBL depth over the oceans. The depth of the PBL depends on the pressure regime, both over the oceans and over land. In high-pressure regimes, the PBL is thinner due to downdrafts and subsidence, which are specific to this regime. The situation is different in the case of a low-pressure regime. As a result of upward movements, the PBL can reach high altitudes in the troposphere [
2].
Unlike over large bodies of water, the PBL structure over land varies throughout the day. In areas under high pressure, the PBL structure is well-defined during the diurnal cycle [
2,
3,
4,
5,
6,
7,
8,
9,
10]. These are the stable layer, the residual layer and the mixed layer [
2,
8,
9]. During the day, the thickness is influenced by cloud cover and solar radiation [
2]. At night, radiative cooling causes the PBL to decrease in thickness, resulting in the layer near the surface remaining stable and forming a stable boundary layer. As the day progresses, the PBL thickness increases due to increased solar radiation and, consequently, convective processes [
2,
5,
6,
8]. This is known as the convective boundary layer (CBL), and understanding its structure is important for weather forecasting [
7].
Convective processes generate turbulence within the mixed layer, while radiative cooling and surface heat exchange act as additional sources of convection [
2,
5,
7]. In the absence of cold-air advection, turbulent motions weaken after sunset, leading to the formation of a residual layer—the remnant of the daytime convective boundary layer, which persists aloft during the night above the stable surface layer [
2,
5,
8]. As the night progresses, a stable layer develops near the surface, beneath the residual layer, where turbulence becomes very weak and the air remains strongly stratified [
2,
8].
The structure and dynamics of the planetary boundary layer (PBL) control the processes of dispersion, transport and accumulation of atmospheric pollutants, being an essential element in the assessment of air quality. In the southern region of Lake Baikal, it was found that variations in the concentrations of sulphur and nitrogen oxides are closely dependent on meteorological conditions: precipitation reduces the levels of these pollutants in the warm season, while thermal inversions and frequent calms in winter cause sharp increases [
11].
Measurements made with low-cost sensors in the Baikal region have revealed a double seasonality of PM
2.5 and PM
10 concentrations, with maxima in summer and winter. In summer, convection and high humidity favour the formation of secondary organic aerosols, while in winter, the activity of anthropogenic sources, inversions and the reduction of the PBL thickness limit vertical dispersion [
12].
In East China, analysis based on ERA5 data showed that a particular structure of the PBL favours the accumulation of pollutants under conditions of blocked atmospheric circulation. During pollution episodes, wind speed is reduced and temperature and humidity increase over the entire height of the PBL, with a transition height due to dynamic and thermal conditions located around the level of 900 hPa [
13].
Extreme PM
x concentrations occur under anticyclonic conditions, characterised by weak winds and a stable atmosphere, and changes in wind direction cause rapid decreases in concentrations, highlighting the influence of regional industrial sources. In the Huai River basin, it was observed that annual and seasonal variations in aerosols are dominated by processes in the PBL. The decrease in the extinction coefficient occurred predominantly in the 0–2 km layer, and the aerosol types show a seasonal distribution controlled by the wind regime and the thermodynamic conditions in the lower layer [
14].
Therefore, it is found that the PBL parameters—layer height, thermal stability and wind regime—largely determine the level and temporal variability of atmospheric pollution. The integration of boundary layer characteristics in atmospheric chemistry models is an essential condition for improving air quality forecasts [
11,
12].
There are several methods of determining the height of the PBL, each of which provides different information about it. In 1964, Holzworth conducted a foundational study on the determination of the mixed layer height using radiosonde observations [
15]. This was followed by studies that improved and slightly modified his method [
2,
16,
17], which involved adding an excess temperature to the surface temperature to account for measurement uncertainties [
15]. One widely used method for determining PBL height from radiosonde data is the parcel method, also known as the Holzworth method [
9]. This method does not require the wind profile and is based on the intersection point of the dry adiabatic temperature starting from the surface and the profile temperature. This intersection point is interpreted as the equilibrium level of a rising parcel [
9,
10]. However, this method is subject to a high degree of uncertainty because it depends on the surface temperature.
Radiosonde data, which is widely used at most stations, is only available at the reference times of 00:00 and 12:00 UTC [
6,
9]. Therefore, comparisons with model estimations can only be made at these times. The uncertainty associated with this method is related to the nocturnal boundary layer, since no universal correlation has been found between wind, humidity and temperature profiles and turbulence. Several criteria are involved in interpreting the profiles of these parameters. This method can also be expensive [
9]. Estimating the PBL height from radiosonde data can be subjective, as it is identified either by a temperature inversion or by a significant reduction in moisture in the profile [
2].
Another approach to determining the PBL height is the bulk Richardson number method. This method assumes that the limit is reached when the Richardson number reaches a certain threshold value. The most used thresholds are 0.5 and 0.25 [
18]. The bulk Richardson number is highly variable because the PBL is thermally stratified [
18]. The bulk Richardson number method is the most suitable for climatological studies [
19]. Consequently, many studies use this approach [
20,
21,
22].
The variation in PBL height can also be determined by using aircraft and remote sensing techniques. These techniques have both advantages and disadvantages [
23]. For example, aircraft may only be used during the day, but they have the advantage of being able to operate a variety of sensors and cover large areas [
9]. Other techniques used include lidar, sonar and Doppler radar/wind profiling [
9,
23]. Although these methods are expensive, they offer the great advantage of enabling continuous monitoring of height variation over an entire diurnal cycle [
9].
Nemuc et al. studied the dynamics of the lower troposphere between May 2008 and February 2009, using multi-wavelength lidar in the Măgurele area [
24]. According to Nemuc et al., the mixed layer height determined from lidar measurements at Măgurele was approximately 1300–1500 m during the day, falling below this value after 19:00 UTC, when the atmosphere becomes stable. Comparison with radiosonde profiles indicated the existence of a lower layer located at approximately 700 m, confirming that, under stable conditions, the planetary boundary layer height can drop below 1000 m, below the detection limit of the lidar system. The gradient method was compared with the Richardson number method, obtaining concordant values for the PBL height and the aerosol layers [
24].
Ungureanu et al. used the CL-31 ceilometer for the period November 2008–March 2009, finding the predominance of stratiform clouds and a direct correlation between the evolution of low clouds and the PBL structure [
25].
Belegante et al. analysed the period 2009–2011, using lidar, radiometric data and numerical models (WRF, GDAS) [
26]. The correlation between the measured and modelled PBL height was 0.66 for the entire dataset and 0.73 for the diurnal intervals, highlighting a systematic underestimation of the WRF model in stable nocturnal conditions [
26].
Timofte et al. compared lidar, radiometric and radiosonde measurements with the ALARO model, during January–November 2014, for Bucharest and Iași [
27]. In the study conducted by Timofte et al. (2015) [
27], the average difference between the planetary boundary layer (PBL) height estimated by the ALARO model and that determined by other measurement techniques was below 200 m for both analysed locations (Bucharest and Iași). In the cold season, the ALARO model forecast for Bucharest presented a significant gap compared to the warm season, possibly caused by the overlap of the lidar system, which makes it difficult to detect the PBL for heights lower than 900 m. For the Iași station, the differences between the forecasted and measured values were similar in the summer and winter seasons, indicating a more uniform behaviour of the model in this region [
27].
Dandocsi et al. derived the PBL height from lidar measurements (RALI) performed between 9 and 12 July 2012 at Măgurele. The maximum values reached 2265 m, recorded on the warmest day, with a pronounced diurnal variation and an episode of long-range aerosol transport confirmed by HYSPLIT [
28].
Cazacu et al. analysed the time series from 5–8 May 2022 in Galați, using a CHM15k ceilometer and an RPG-HATPRO radiometer. By applying the multifractal motion theory, the PBL height (considered the control parameter) was correlated with the radiometric temperature profiles, obtaining good agreement between the theoretical and experimental values [
29].
Therefore, studies conducted in Romania indicate a clear seasonal variation in the PBL height between 500 m and 2250 m, dependent on atmospheric stability, the type of layer (convective or stable) and local conditions. The maximum values are recorded in summer, in convective regime, and the minimum values in winter, in stable conditions, confirming the importance of integrating multi-instrumental observations for the characterisation of the planetary boundary layer [
24,
25,
26,
27,
28,
29].
During December 2019–November 2021, the study conducted by Pîrloagă et al. used Doppler wind lidar measurements at Măgurele, highlighting a marked diurnal cycle of wind speed and a seasonal variation in the PBL height, from approximately 500 m during winter nights to 1250 m at noon in summer. The predominant classes of PBL were convective, non-turbulent and intermittent (its pattern is complementary to the Convective and Non turbulent classes, being more pronounced in the top of the mixing layer), with the dominance of the convective regime in the warm season [
30].
While previous studies have focused on short periods and local instrumental observations, the present study integrates the long series of aerological data in comparison with the ERA5 reanalysis data, providing for the first time a coherent picture of the multidecadal variation in the planetary boundary layer and the trends associated with the intensification of the duration of sunshine, after 2000 [
31,
32].
3. Results
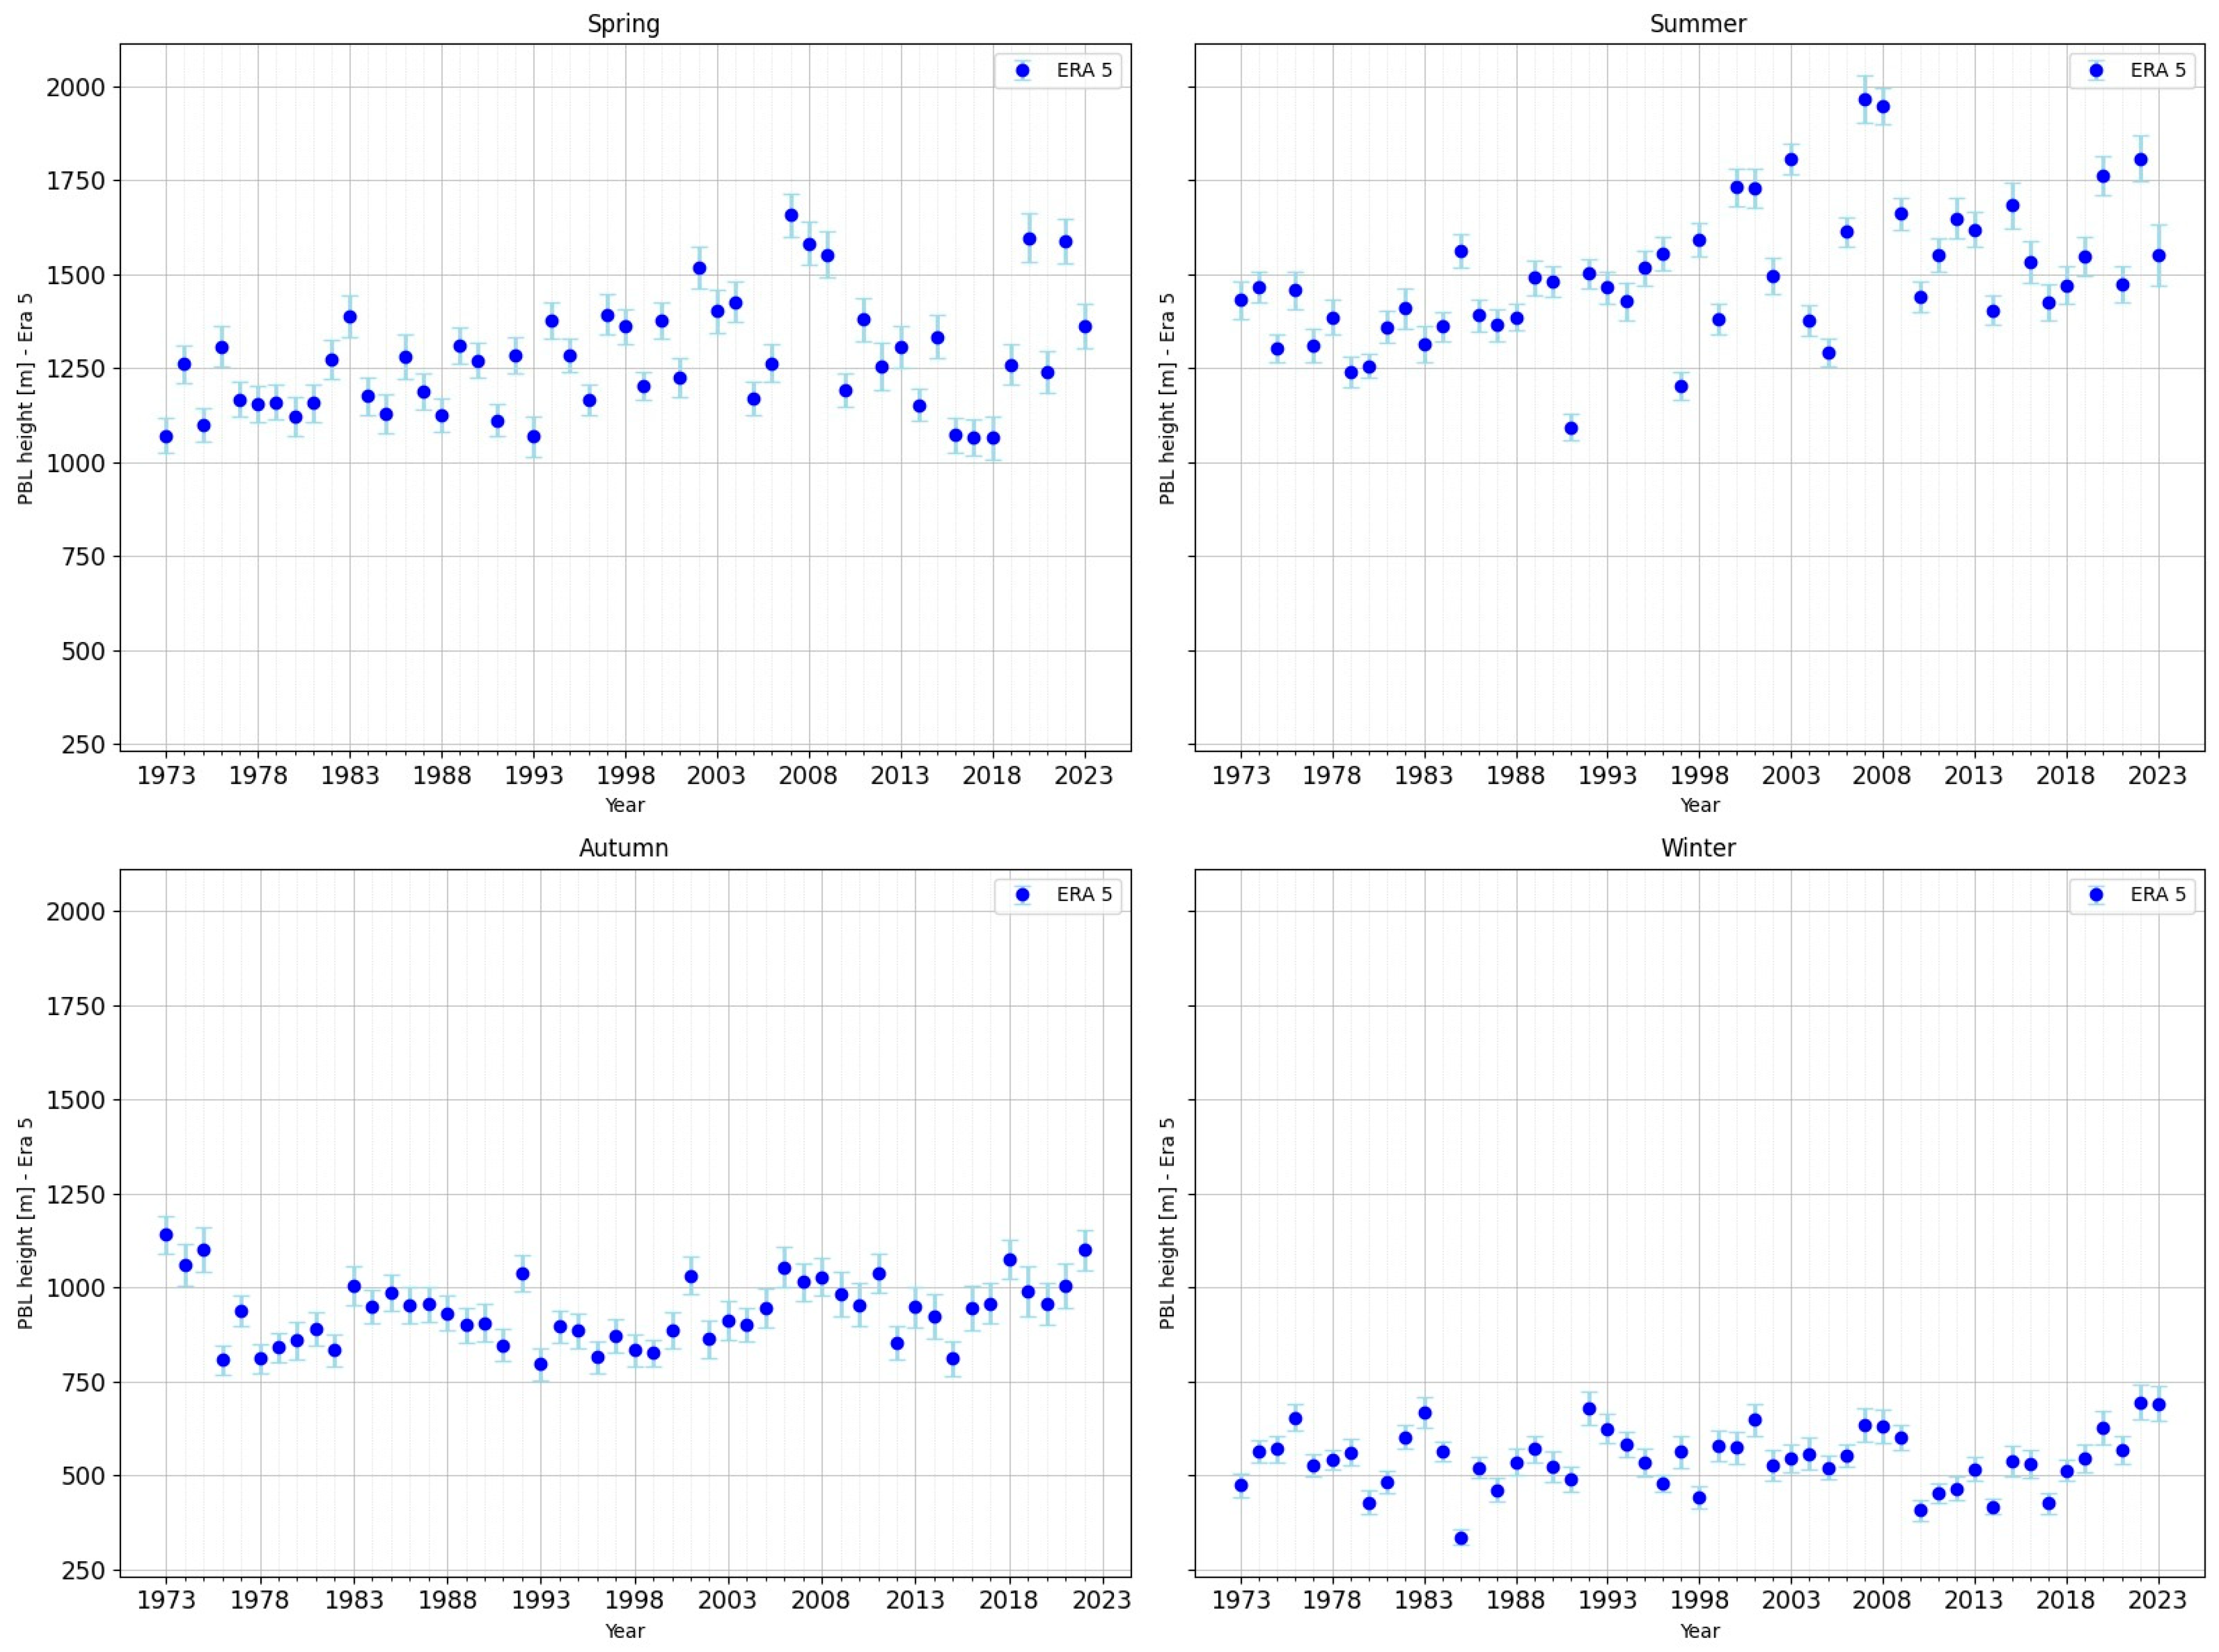
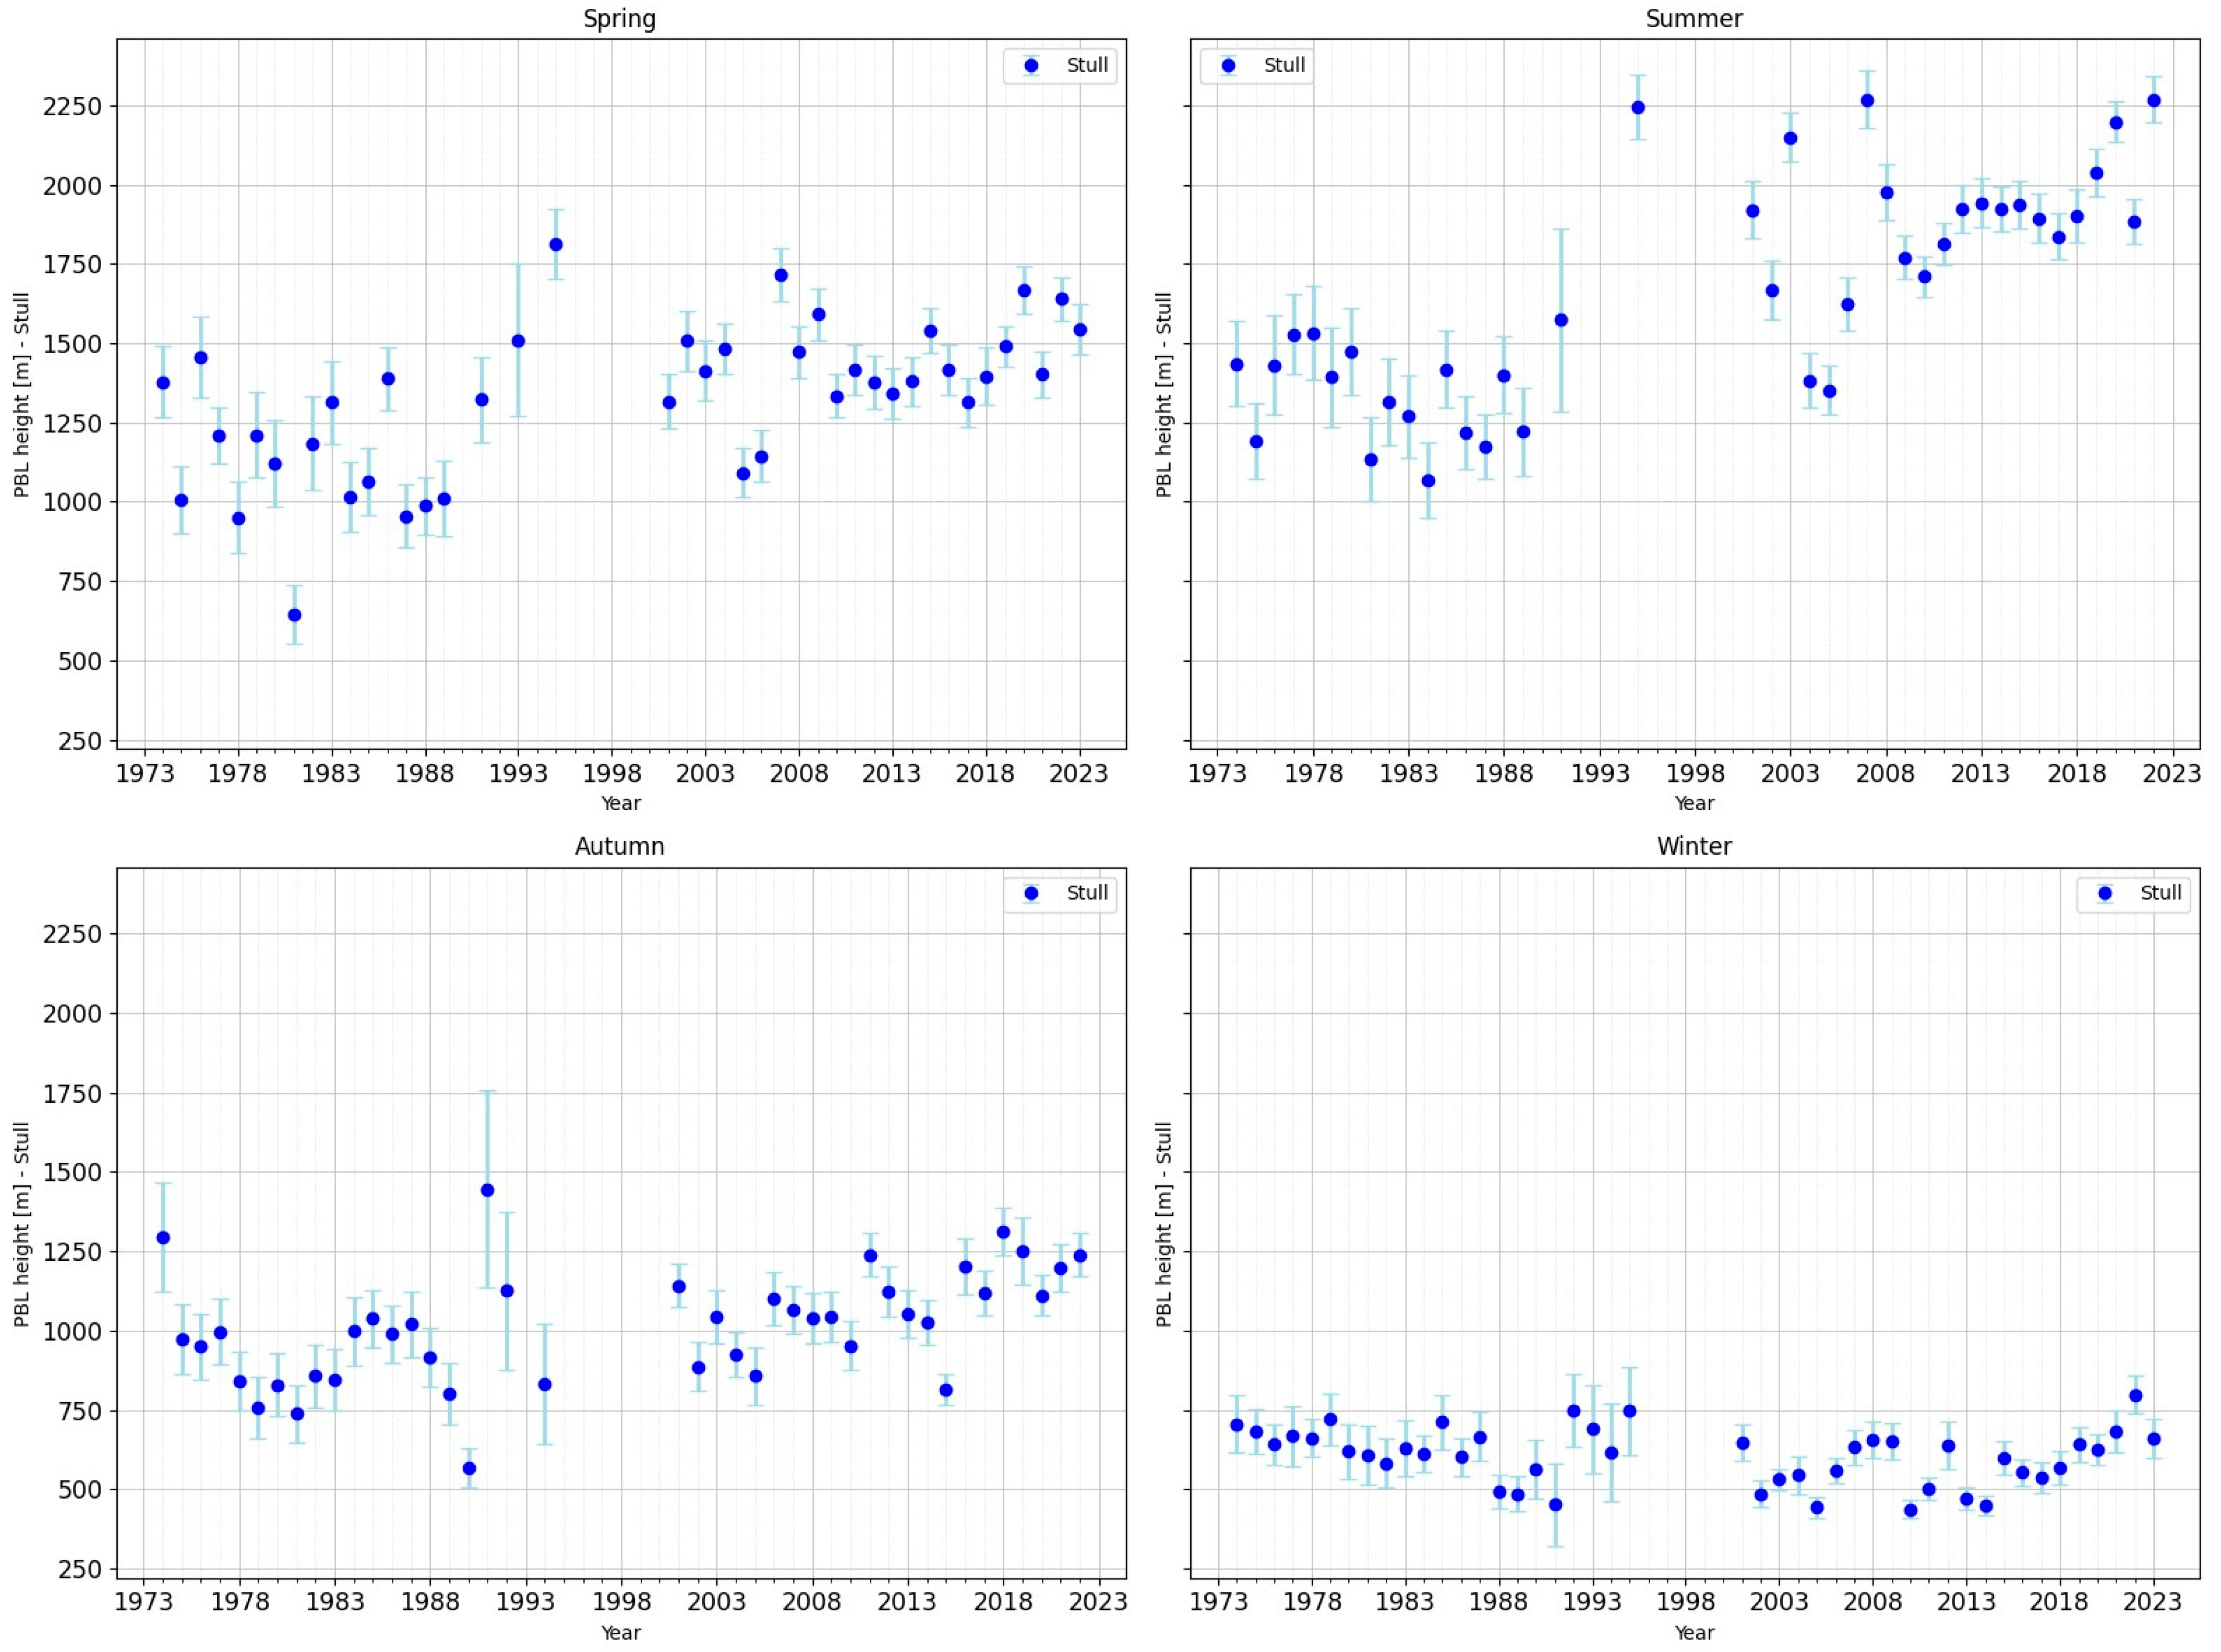
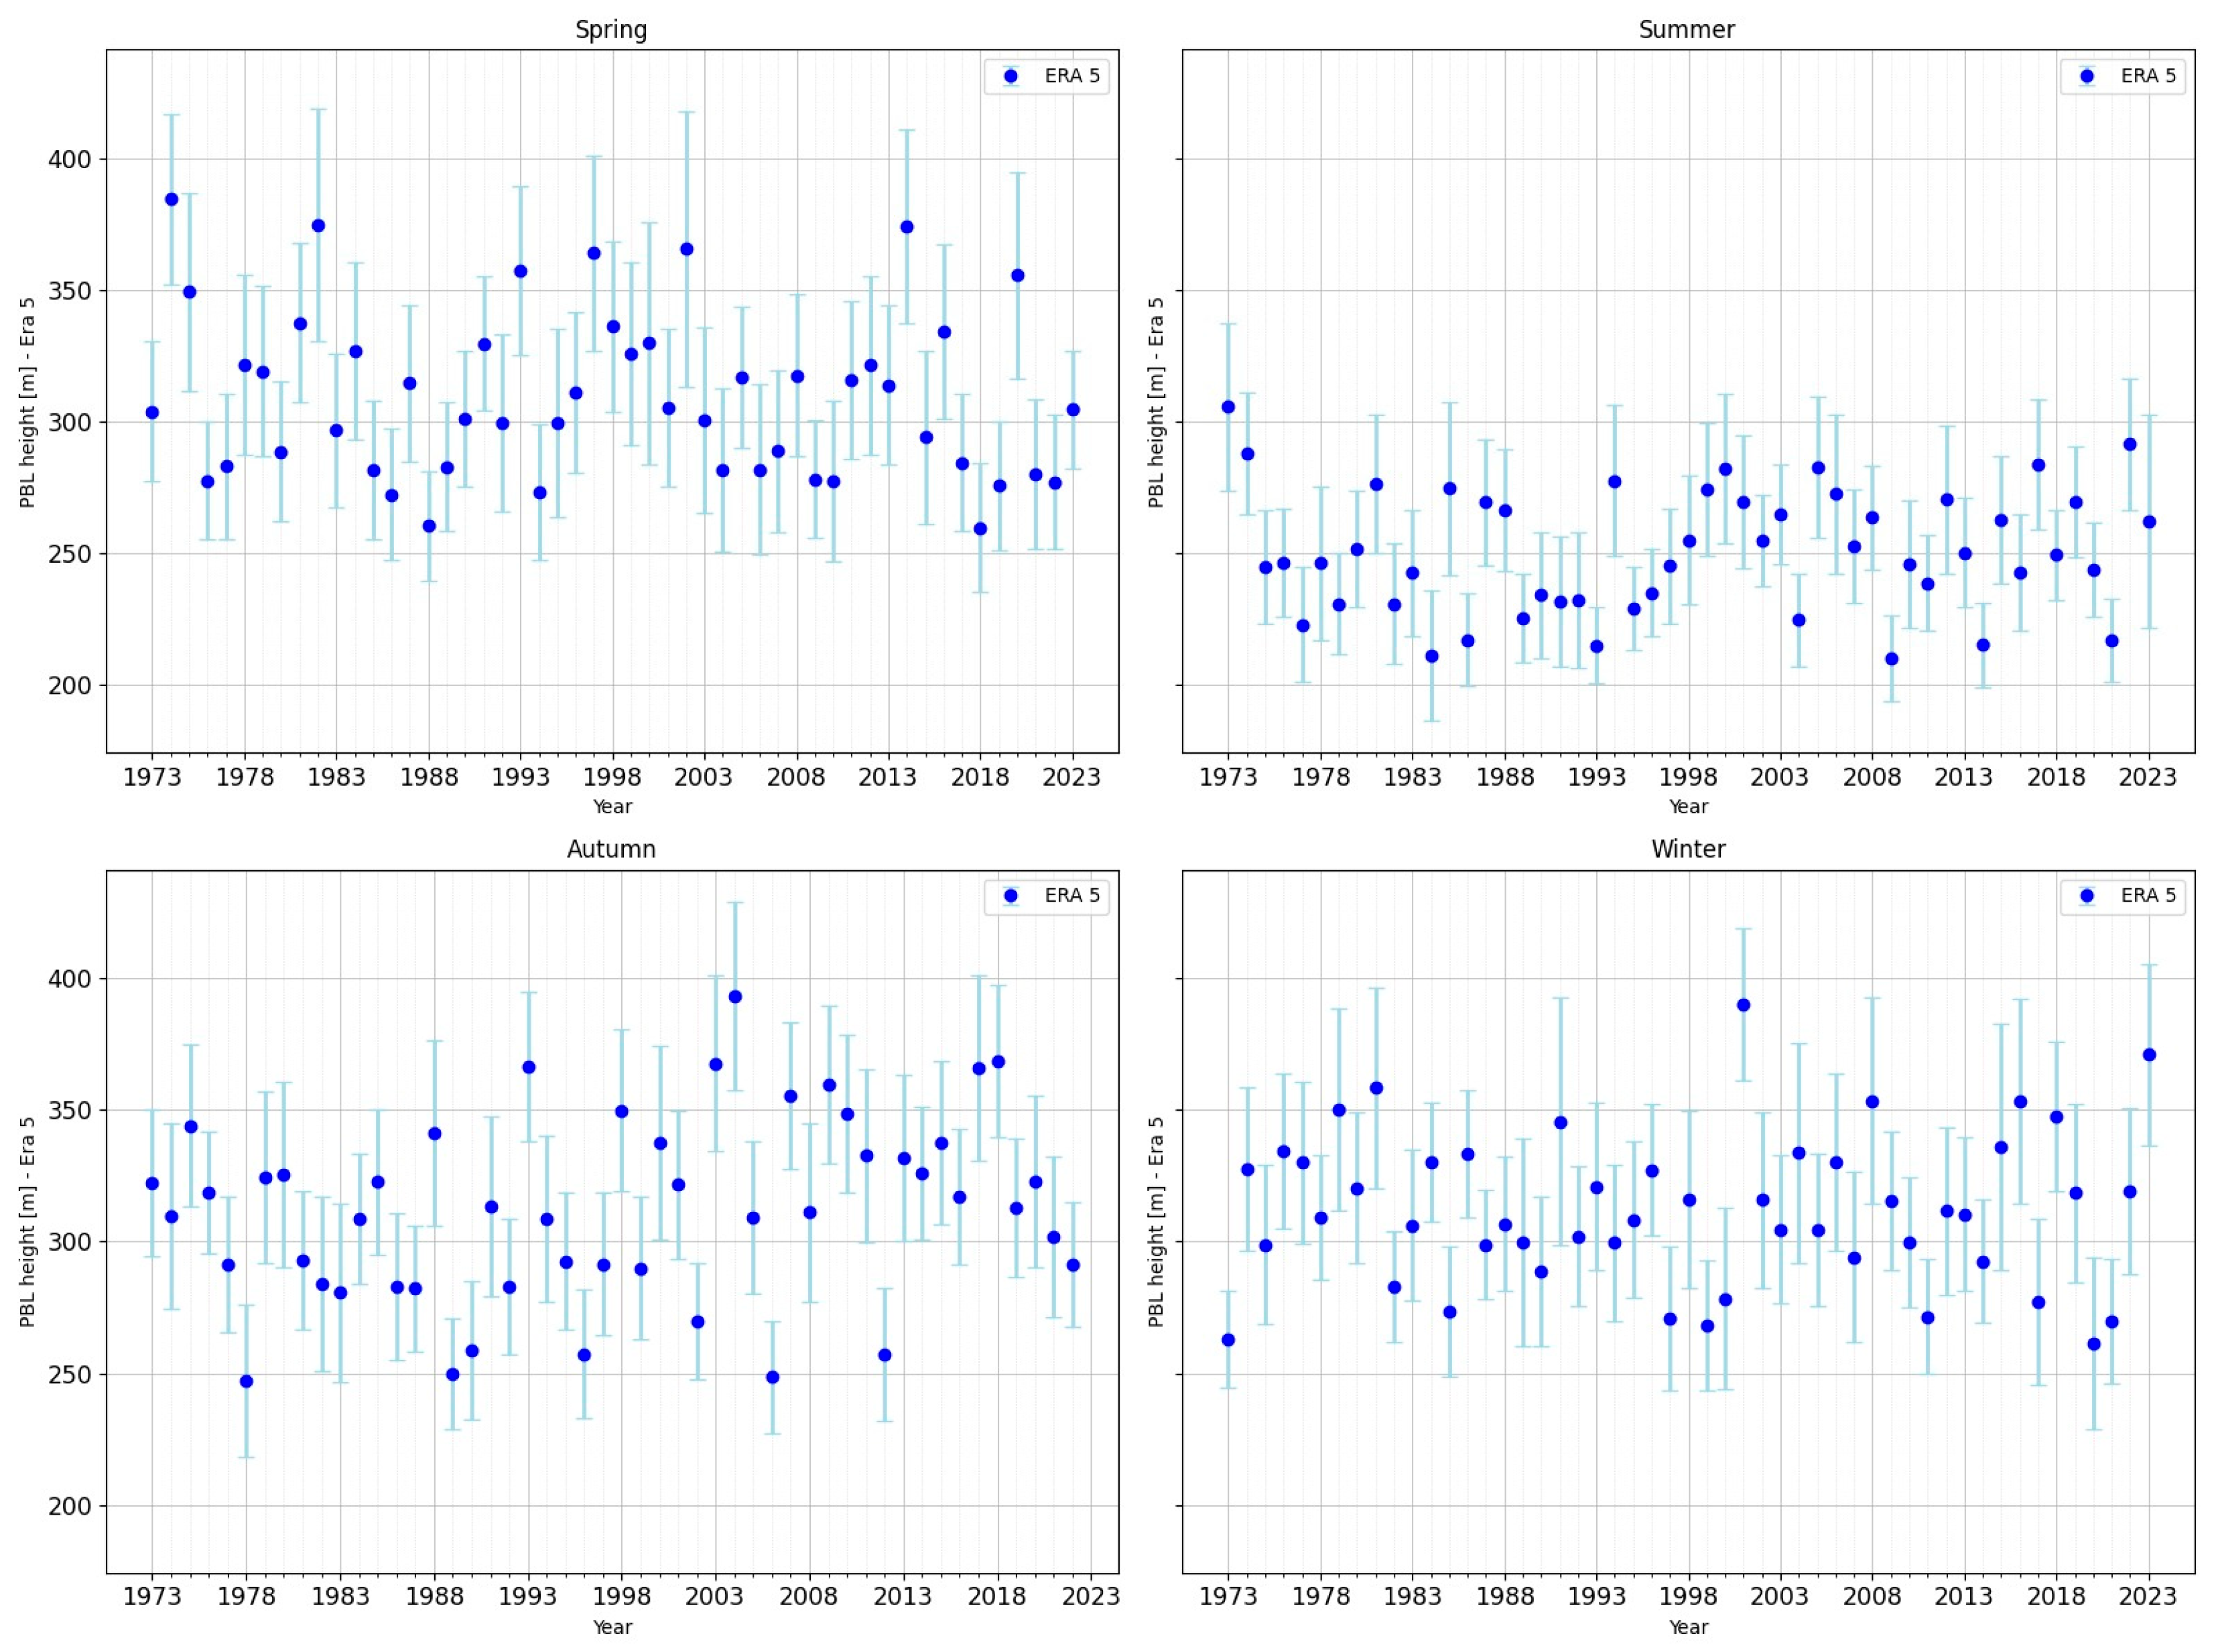
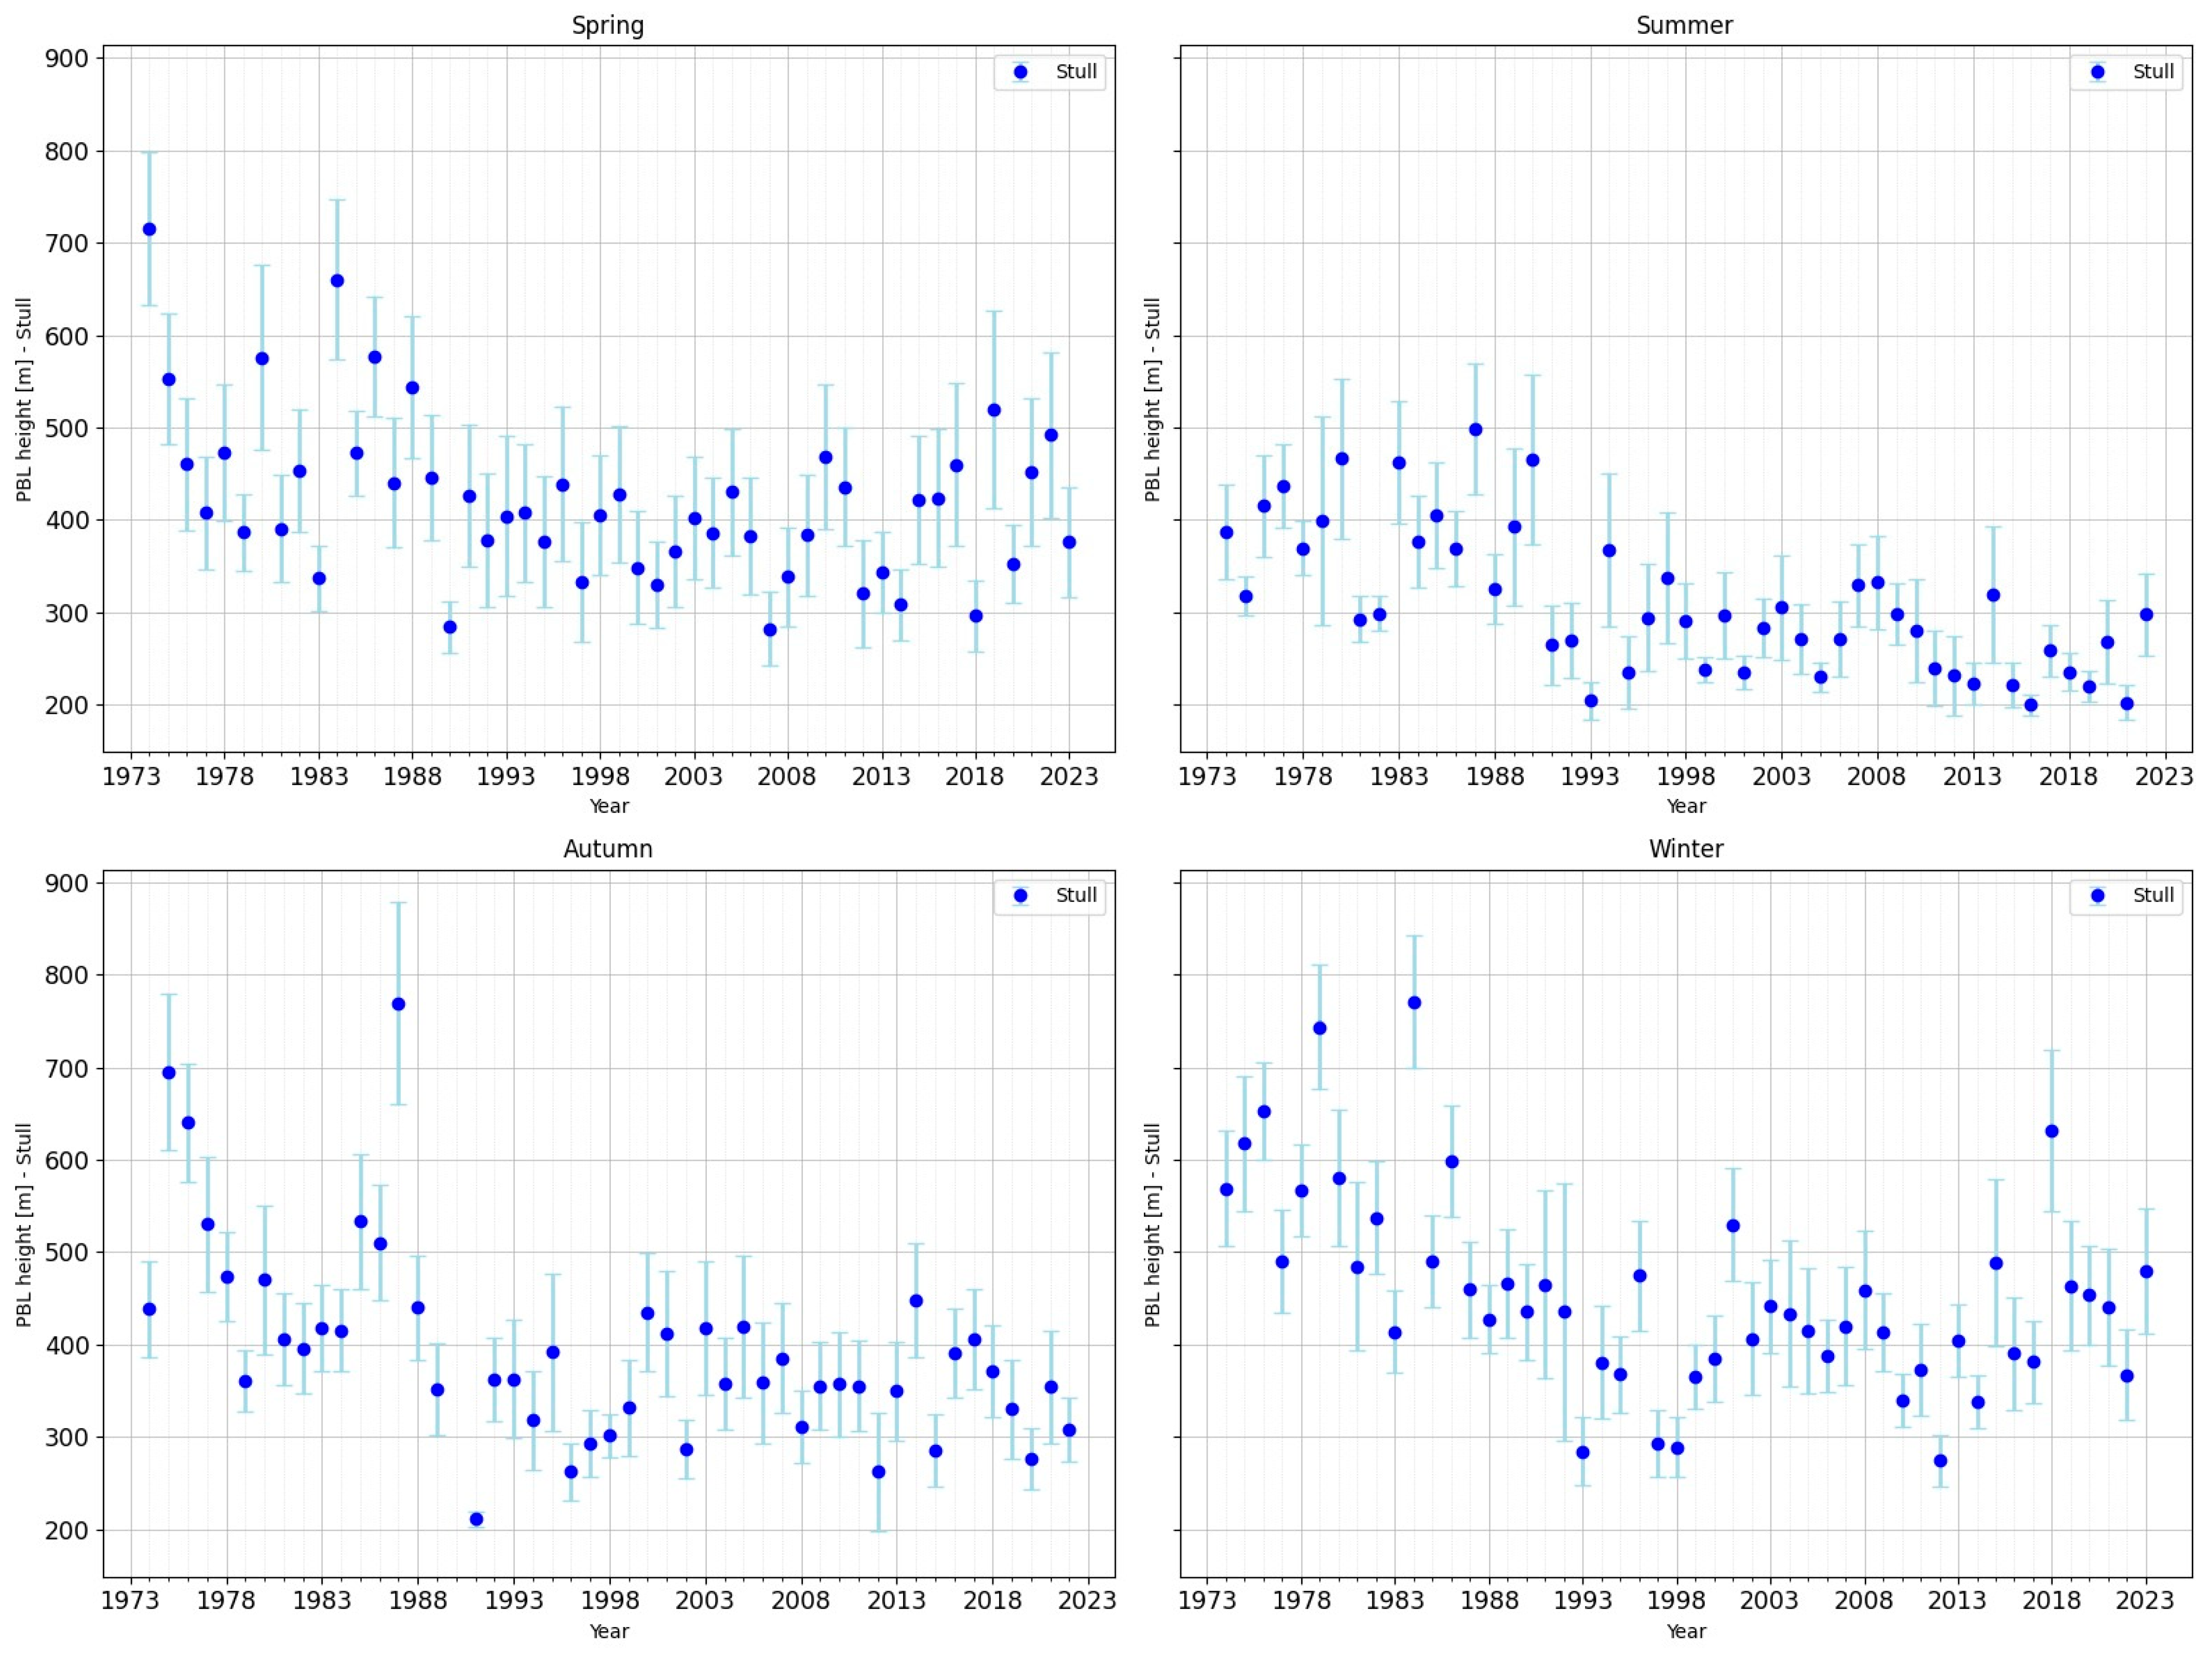
The data presented in the following figures show the mean PBL height values for each seasonal period (DJF, MAM, JJA and SON) over the 50-year period from 1973 to 2023. The error bars represent the standard error of the mean.
For 12 UTC (see
Figure 2 and
Figure 3), the average PBL height in the winter season (DJF) is 545 m according to the ERA5 data and 601 m according to the Stull method. In the winter season, both methods indicate low PBL heights. However, the values obtained by the Stull method are higher than those obtained from ERA5.
In spring (MAM), the average PBL height is 1274 m according to the ERA5 data and 1323 m according to the Stull method.
ERA5 data shows an increasing tendency in PBL height for the MAM season, while the Stull method shows similar average values. Predominantly below-average values are observed until the 1990s, after which higher-than-average values predominate.
In summer (JJA), the average PBL height is 1494 m according to the ERA5 data and 1662 m according to the Stull method.
For the warm season, both the ERA5 data and the Stull method indicate a clear intensification of the PBL height, which is correlated with intense warming and convection. ERA5 indicates an increase after 2000. The Stull method shows below-average values until the 1990s, as with the ERA5 values. After this, higher values are observed, but the data are more dispersed.
In autumn (SON), the average PBL height is 936 m according to the ERA5 data and 1021 m according to the Stull method. SON is characterised by moderate average PBL heights. There is a similar value between the two methods, with no clear tendency.
Winter is characterised by generally low values close to the climatological mean, with higher dispersion in the Stull method. ERA5 shows a slight increase in the frequency of years with below-average PBL, but the signal remains modest. The picture is slightly noisier in Stull: above-average values predominate in the 1970s–1980s, followed by a period of decrease in the 1990s and a redistribution with variations around the mean value.
Spring presents a much clearer signal. In ERA5, most years before 2000 have values close to or below average, with a few exceptions. After 2000, however, years with a PBL above the multi-year mean frequently dominate. This increase is particularly evident between 2000 and 2008, suggesting an intensification of convective processes. In Stull, the distribution is more variable, but the general tendency shows a similar shift towards higher values over the past two decades.
Summer is the season with the most pronounced differentiation. In ERA5, below-average values predominated before 2000, but above-climatological values clearly predominated after this year, with notable maxima around 2007 and 2008. This behaviour reflects an increase in the intensity of thermal convection against a background of climate warming. In Stull, the pattern is similar, but with sharper variations, indicating greater methodological sensitivity to extreme years.
Autumn is more balanced: in the ERA5 dataset, an alternating succession of above- and below-average years is observed before 2000. After 2000, the frequency of above-climatological years increases slightly, but without a robust signal. In the Stull method, the variability is high, but the same moderate long-term increasing tendency can be clearly observed after 2000. The Stull method shows a robust positive tendency after 2000, with the strongest increase observed in summer and spring. This suggests an intensification of convective processes on a climatological scale. The ERA5 series at 12 UTC partially confirms this increasing tendency, although with more moderate values and reduced variability.
In spring (MAM), the average PBL height is 308 m according to the ERA5 data and 423 m according to the Stull method. The ERA5 data show moderate variations around the average value that are somewhat symmetrical to it, while the Stull method highlights episodes in which values below the seasonal average predominate.
In the summer season (JJA), the average PBL height value obtained from the ERA5 data is 250 m, while the average PBL height value obtained using the Stull method is 311 m. The ERA5 values show moderate variations around the average, with successive increases and decreases every 10–15 years, while the Stull method predominantly produces above-average values until the 1990s, followed by values lower than the average. The analysed data show that, although ERA5 has lower values than the Stull method, these values are more stable and the tendencies are insignificant. The Stull method reveals greater variability and higher PBL height values, but without a clear tendency.
During the cold season (DIF), the Stull method applied at 00 UTC yields higher mean values than ERA5, albeit with significant inter-annual variability. The significant negative tendencies observed (i.e., height values below the seasonal mean) reflect the deepening of the nocturnal stable layer (SBL), which is determined by persistent thermal inversions and intensified radiative cooling. During the period from the 1970s to the 1990s, there were years when the residual layer (RL) played a more significant role, as the heights were higher than the seasonal mean. It is worth noting that, since the 1990s, the mean values have mostly been below the seasonal mean. ERA5 remains approximately constant throughout this period, showing that the model diagnosis attenuates real variations. At 00 UTC, the residual layer (RL) plays a reduced role and the estimates capture almost exclusively the SBL.
In the transitional months (MAM), the Stull method shows a significant decrease after the 1990s, followed by an upward tendency between 2015 and 2020. Meanwhile, mean height in ERA5 remained relatively constant, with no notable variations. During this season, daytime RL often persists overnight, but the Stull method primarily identifies the depth of the SBL. The difference in values between the Stull method and ERA5 suggests that the reanalysis data does not fully capture the interaction between the RL and the SBL direct estimates, however, highlight greater variability in stratification processes. During the warm season, the Stull method shows a decrease in the mean value after the 1990s, accompanied by a robust negative tendency. ERA5 shows lower values, with a more stable mean over time. Summer is the season with the strongest contrast between the diurnal mixed layer (ML) and the thin SBL formed at night.
During the transition to winter (SON), the Stull method shows clear decreases after the 1990s, whereas ERA5 indicates a slight increase. Autumn is characterised by the contrast between days that are still convective enough for rain-free convection (RFC) and cold nights that favour a persistent surface boundary layer (SBL). Stull estimates show large amplitude and pronounced variability, whereas the ERA5 model reduces these fluctuations.
The data confirm that, at 00 UTC, the Stull method primarily captures the SBL, which shows a noticeable decreasing tendency after the 1990s, followed by stabilisation. Meanwhile, ERA5 maintains a constant and homogeneous regime. Although the residual layer (RL) is present, especially in spring, summer and autumn, it is not directly represented in the 00 UTC series because the applied algorithm prioritises SBL.
When the average values obtained by the Stull method (12 UTC measurements) are compared with those from the ERA5 data (also 12 UTC measurements) for Bucharest-Băneasa, it is found that, for the lowest values of PBL height from the observational data, the values from ERA5 are consistently higher in all months. Conversely, the highest layer height values from the observations are higher than those calculated with ERA5, capturing both the initiation of PBL formation and its maturity phase. There is an increased deviation from March to September (see
Table 1 and
Table 2).
For 00 UTC (see
Figure 4 and
Figure 5), the average PBL height in the winter season (DJF) is 312 m according to the ERA5 data and 454.11 m according to the Stull method. While the ERA5 data shows some stability with moderate variations, the Stull method captures larger extremes with higher variability.
Table 1 shows the lowest average value of the planetary boundary layer height (called the mixed layer, or ML) for each month of the year (1973–2023), as determined by the Stull method at 12 UTC. From the ERA5 data, the average value for the respective month in the same year was identified (for example, for January in the period 1973–2023, the lowest average value for the planetary boundary layer height was found in 2015, at 262 m; the ERA5 data showed an average PBL height of 342 m for January 2015). This reasoning was applied to the remaining months.
Table 2 shows the highest average value of the planetary boundary layer height (called the mixed layer, or ML) determined by the Stull method at 12 UTC for each month of the year (1973–2023). From the ERA5 data, the average value for the respective month in the same year was identified (for example, for January in the period 1973–2023, the highest average value for the planetary boundary layer height was in 1978, at 893 m; the ERA5 data showed an average PBL height of 592 m in January 1978). This reasoning was applied to the remaining months.
Table 3 shows the lowest average value of the planetary boundary layer height (Stable Boundary Layer, or SBL) determined by the Stull method at 00 UTC for each month of the year (1973–2023). From the ERA5 data, the average value corresponding to each month was identified (for example, for December in the period 1973–2023, the lowest average value of the planetary boundary layer height was found in 1992, at 150 m; the ERA5 data showed an average PBL height of 341 m in December 1992). This reasoning was applied to the other months.
Table 4 shows the highest average value of the planetary boundary layer height (Stable Boundary Layer, or SBL) for each month of the year (1973–2023), as determined by the Stull method at 00 UTC. From the ERA5 data, the average value corresponding to each month was identified (for example, for December, the highest average value of the planetary boundary layer height was found in 1984, at 781 m; the ERA5 data showed an average PBL height of 298 m in December 1984). This reasoning was applied to the other months.
For the minimum values (see
Table 3), the values determined by the Stull method are lower than those in ERA5 in all months. This shows that the reanalysis data tend to overestimate the thickness of the nocturnal stable layer when it is poorly developed. For the maximum values (
Table 4), the Stull method consistently yields higher values than ERA5. This suggests that ERA5 underestimates the maximum development of the nocturnal stable layer and only partially captures the intensification of the nocturnal inversion layer.
Therefore, the same tendency observed at 12 UTC is confirmed. ERA5 smooths the extremes, providing higher values at the minimums and lower values at the maximums. This reflects the limitations of the reanalysis data in capturing the true variability of the planetary boundary layer.
4. Discussion
In the analysed interval for Bucharest, the lowest monthly PBL height values in ERA5, measured at 12 UTC, are found in January and December. This is because the average number of sunny days in these months is three, with the remaining days being partially or fully cloudy, which limits the PBL height. If the height is relatively uniform in December, lower values appear in January. The most notable of these were in 1985 (when 16 consecutive days with negative temperatures were recorded in Bucharest and it was declared the coldest winter in 40 years), 1990, 2002 and 2011, when the PBL height slightly exceeded 300 m.
Some discrepancies between the Bucharest radiosonde observations and ERA5 grid-cell averages are expected, particularly due to urbanisation and heterogeneous terrain. The literature indicates that such differences are consistent with the inherent representativeness limitations of point observations relative to gridded products [
52,
53,
54]. Therefore, the observed deviations are interpreted in light of these spatial constraints, and the representativeness radius of ~50–100 km is applied when comparing radiosonde and ERA5 profiles.
The highest value was 775 m in January 2022. According to the European Union’s Climate Change Service, Copernicus, temperatures higher than climatological averages were recorded throughout Europe, including Romania, that month. According to this report, “globally, January 2022 was 0.28 °C warmer than the average January in the 1991–2020 reference period and the sixth warmest January recorded to that date. At the European level, average temperature anomalies are generally larger and more variable than at the global level, the average temperature in January 2022 was 0.79 °C above the average of the 1991–2020 reference period” [
50].
In Bucharest, the month began with temperatures over 10 degrees Celsius and sunny days.
The height of the PBL varies depending on the surface temperature and humidity. It increases when the surface temperature is high and humidity is low. In these conditions, sensible heat fluxes dominate latent heat fluxes, leading to an increase in buoyancy. As expected, the mixing depth begins to increase in March, a month generally characterised by changeable weather, with cold, wet days alternating with warm, sunny ones. This continues until October, with the most significant increases occurring from May to August in the first 25 years analysed (1973 to 2002). The year 1994 (with an average value of 1258 m recorded in March) was extraordinarily warm and amazed climatologists at the time. Few would have thought that there would be warmer years in the following 30 years. Significant warming began to be felt after 2002, when droughts and heatwaves became increasingly frequent. In the following 25 years, there were significant increases in PBL height in all summer months (June 2007: 2031 m; July 2007: 2258 m; August 2008: 2067 m). Moreover, these increases extend from the beginning of spring and continue until late autumn (March to September inclusive).
The increasing tendency for PBL heights to rise in September can be attributed to heatwaves that persist at the end of summer and affect Southeastern Europe. These heat waves, characterised by sunny days and high temperatures, have become more frequent and intense, as seen in 2007, 2012, 2015, 2017, 2020 and 2022.
In 2007, the maximum PBL values corresponded to three prolonged heatwaves: one in June (19–27 June), with an average value of 2031 m; one in July (15–25 July), with an average value of 2258 m, during which there was an uninterrupted heatwave; and one in August (23–25 August), with an average value of 1610 m. In 2012, the maximum PBL value in July (1906 m) can be interpreted as the result of advection of tropical warm air of North African origin, which was present over south-eastern Europe from the beginning of the month until 16 July. From June to September in 2015, there were five heatwaves, two of which covered most of July (between the 6th and 9th and the 16th and 30th) with values between 1600 and 1700 metres. In 2017, two heatwaves in August (at the beginning and end of the month) led to an increase in the PBL height in both August and September (with values between 1300 and 1600 m).
The summer of 2020 saw record temperatures, even in September, with an average value of 1510 m, when heatwaves reached as far as Russia, with temperatures of 30 °C in Moscow. The PBL depth remained high from April (with an average value of 2063 metres) until early October, reaching its maximum in July, August and September (with values between 1500 and 1900 metres, and an average value of 1962 metres in August).
According to the report published by the European Copernicus Climate Change Service, the summer of 2022 was declared the warmest ever recorded in Europe since the beginning of meteorological measurements. This dethroned the summer of 2021, which had previously been recorded as the hottest summer to that date (with values between 1600 and 1900 m, and an average value of 1974 m in July).
From 2008 to 2023, August was often warmer than July, although July was generally warmer than the following month.
Bucharest is a metropolis located inland, far from the influences of water, in contrast to other European cities used as observation points in the literature on the analysed topic. These other cities are located in the vicinity of large bodies of water (Mediterranean Sea: Brindisi, Trapani, Cagliari, Gibraltar; Bay of Biscay: Bordeaux; Atlantic Ocean: Valencia) [
1]. The temperate climate of Bucharest is dictated by its geographical location in the Carpathian-Balkan basin, respectively, in the Romanian Plain [
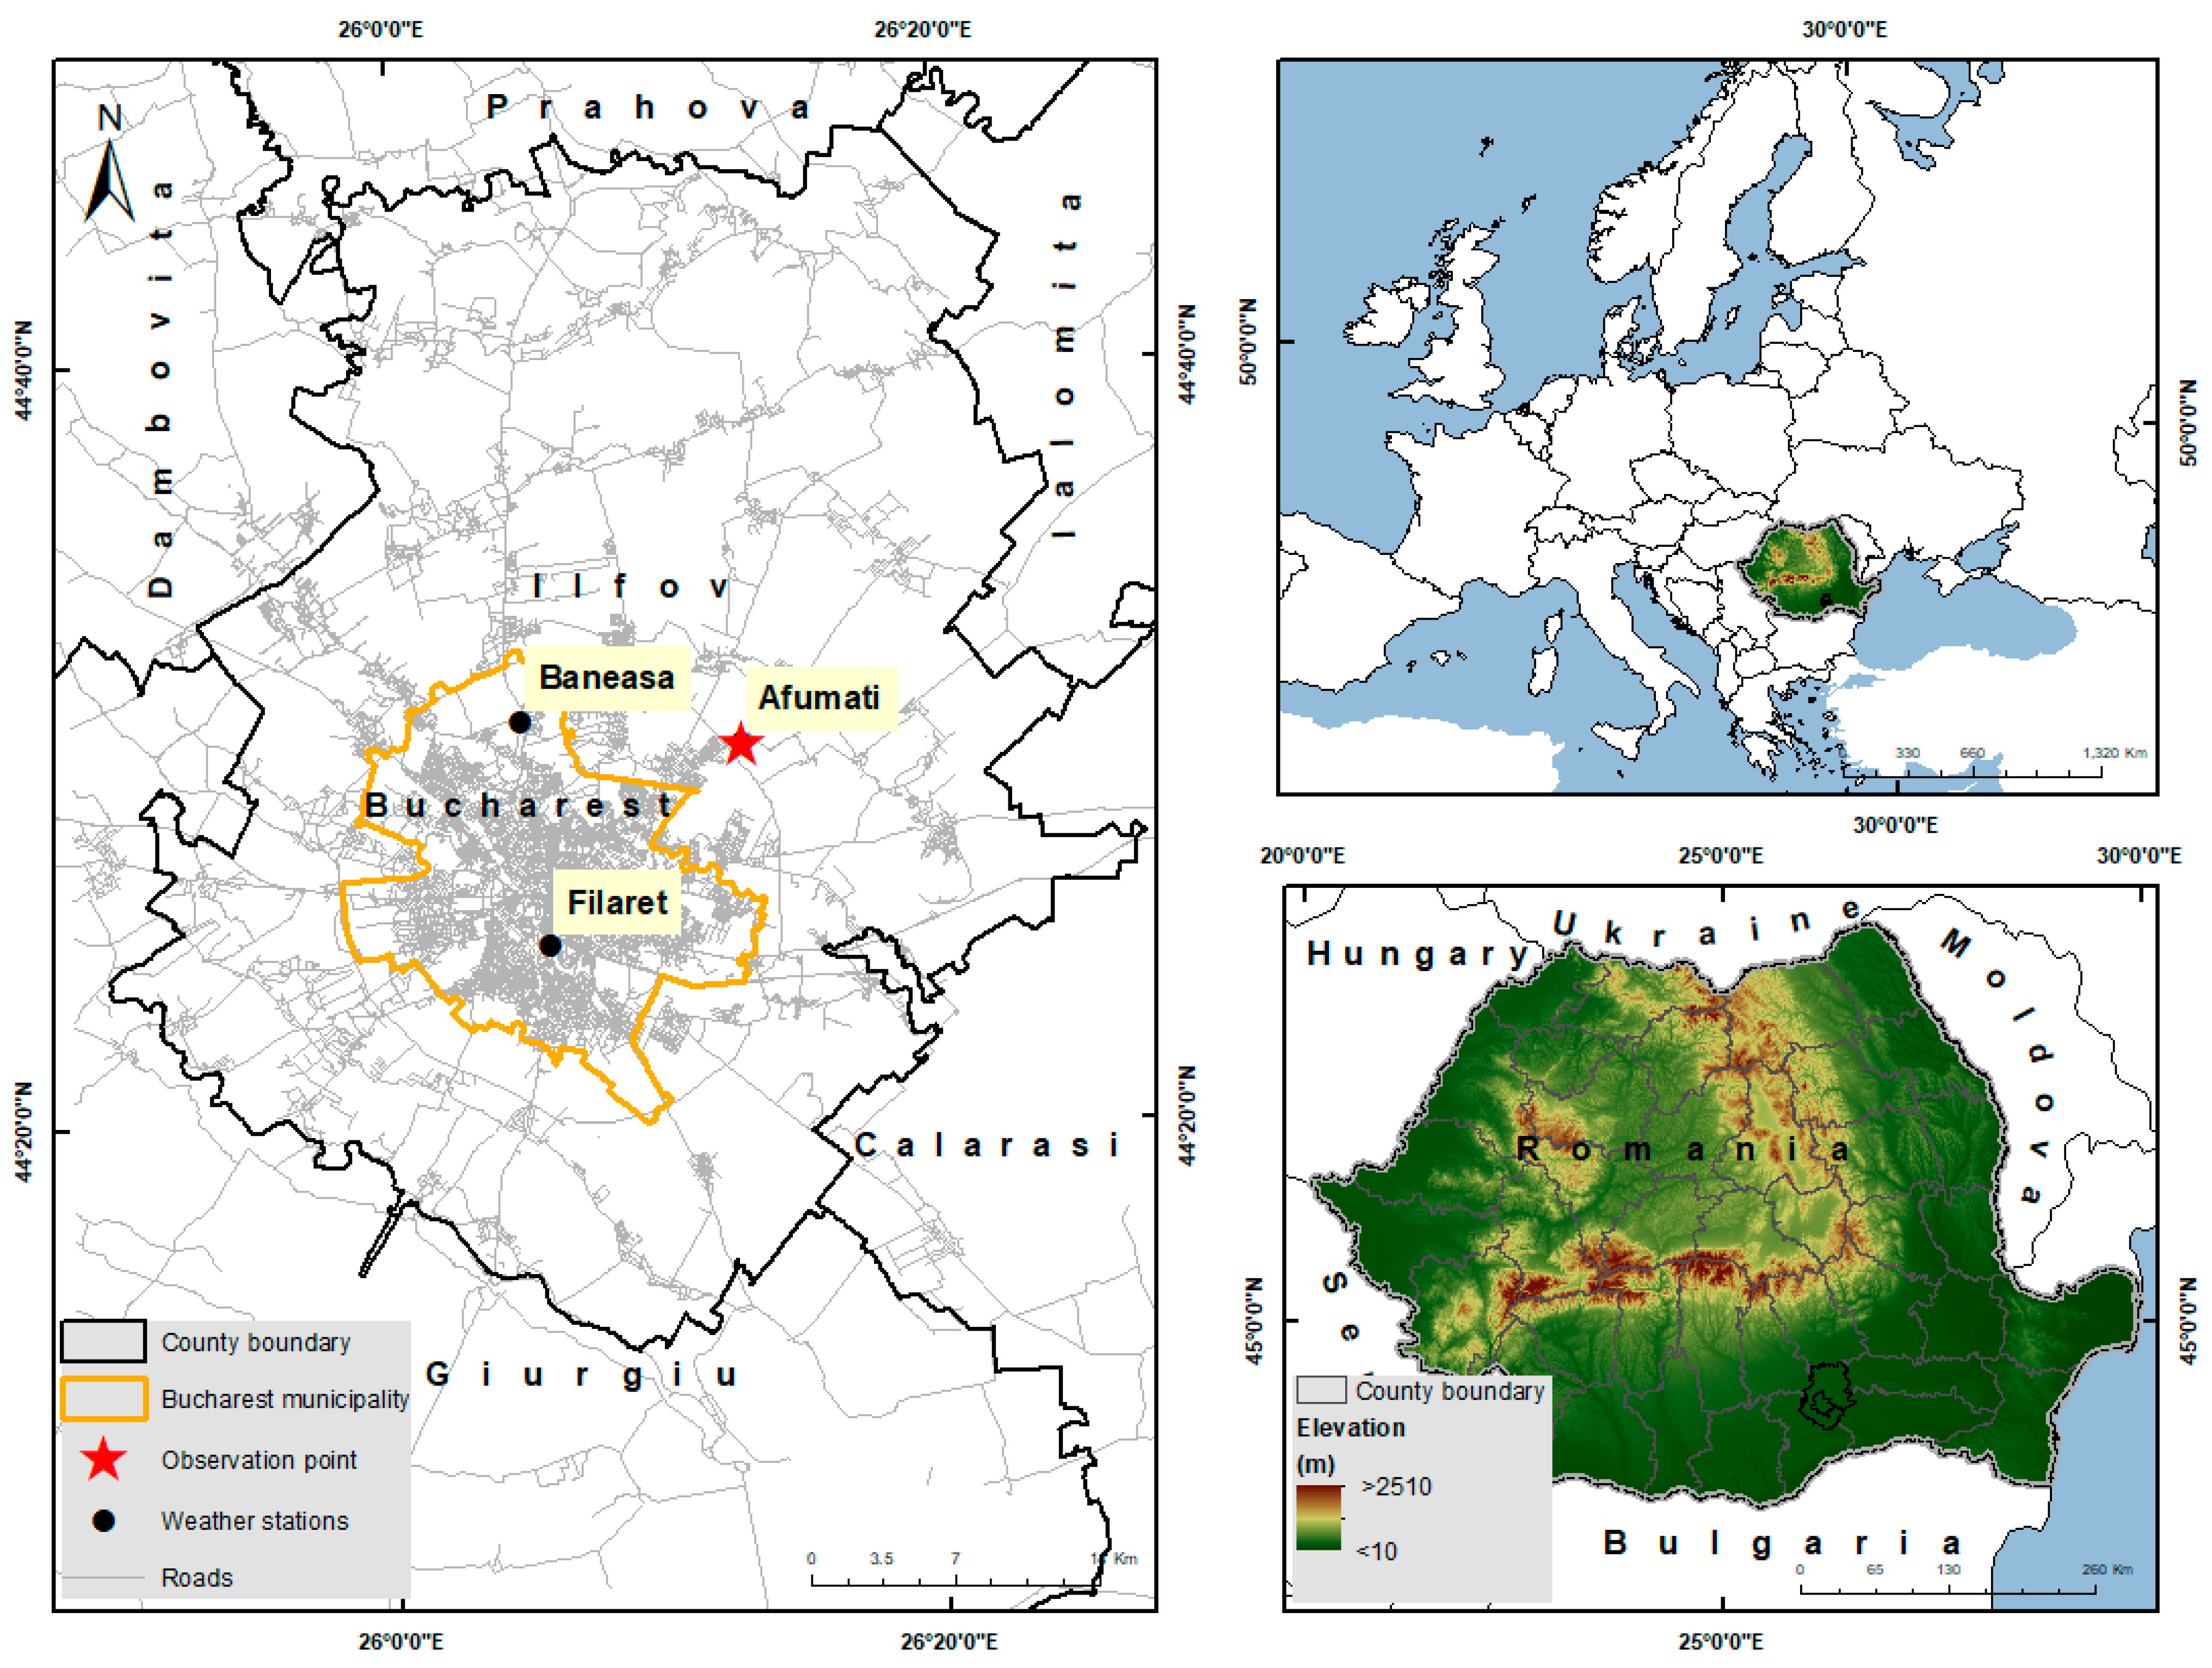
2], and the Afumați Meteorological Station is located at an elevation of 91 m (with an indicative 15420 from Bucharest-Băneasa, as we explained why this convention was made). These cumulative aspects influence the local climate peculiarities.
Tumanov et al. even discuss differences in the main meteorological parameters within the metropolis, taking the meteorological stations at Băneasa and Filaret into account in their analysis [
55]. In their study, they observed a noticeable difference in cloudiness between the two stations. The presence of stratiform clouds at the meteorological station in the northern part of the city is attributed to the influence of the lake and the forest in that area. This phenomenon is said to occur more frequently in the mornings at the Băneasa meteorological station than at the Filaret meteorological station. The author also analysed a case of a frontal passage on 17 April 1994. A compact system that was expected to pass over the city broke up as it passed over, regrouping after crossing the city [
2].
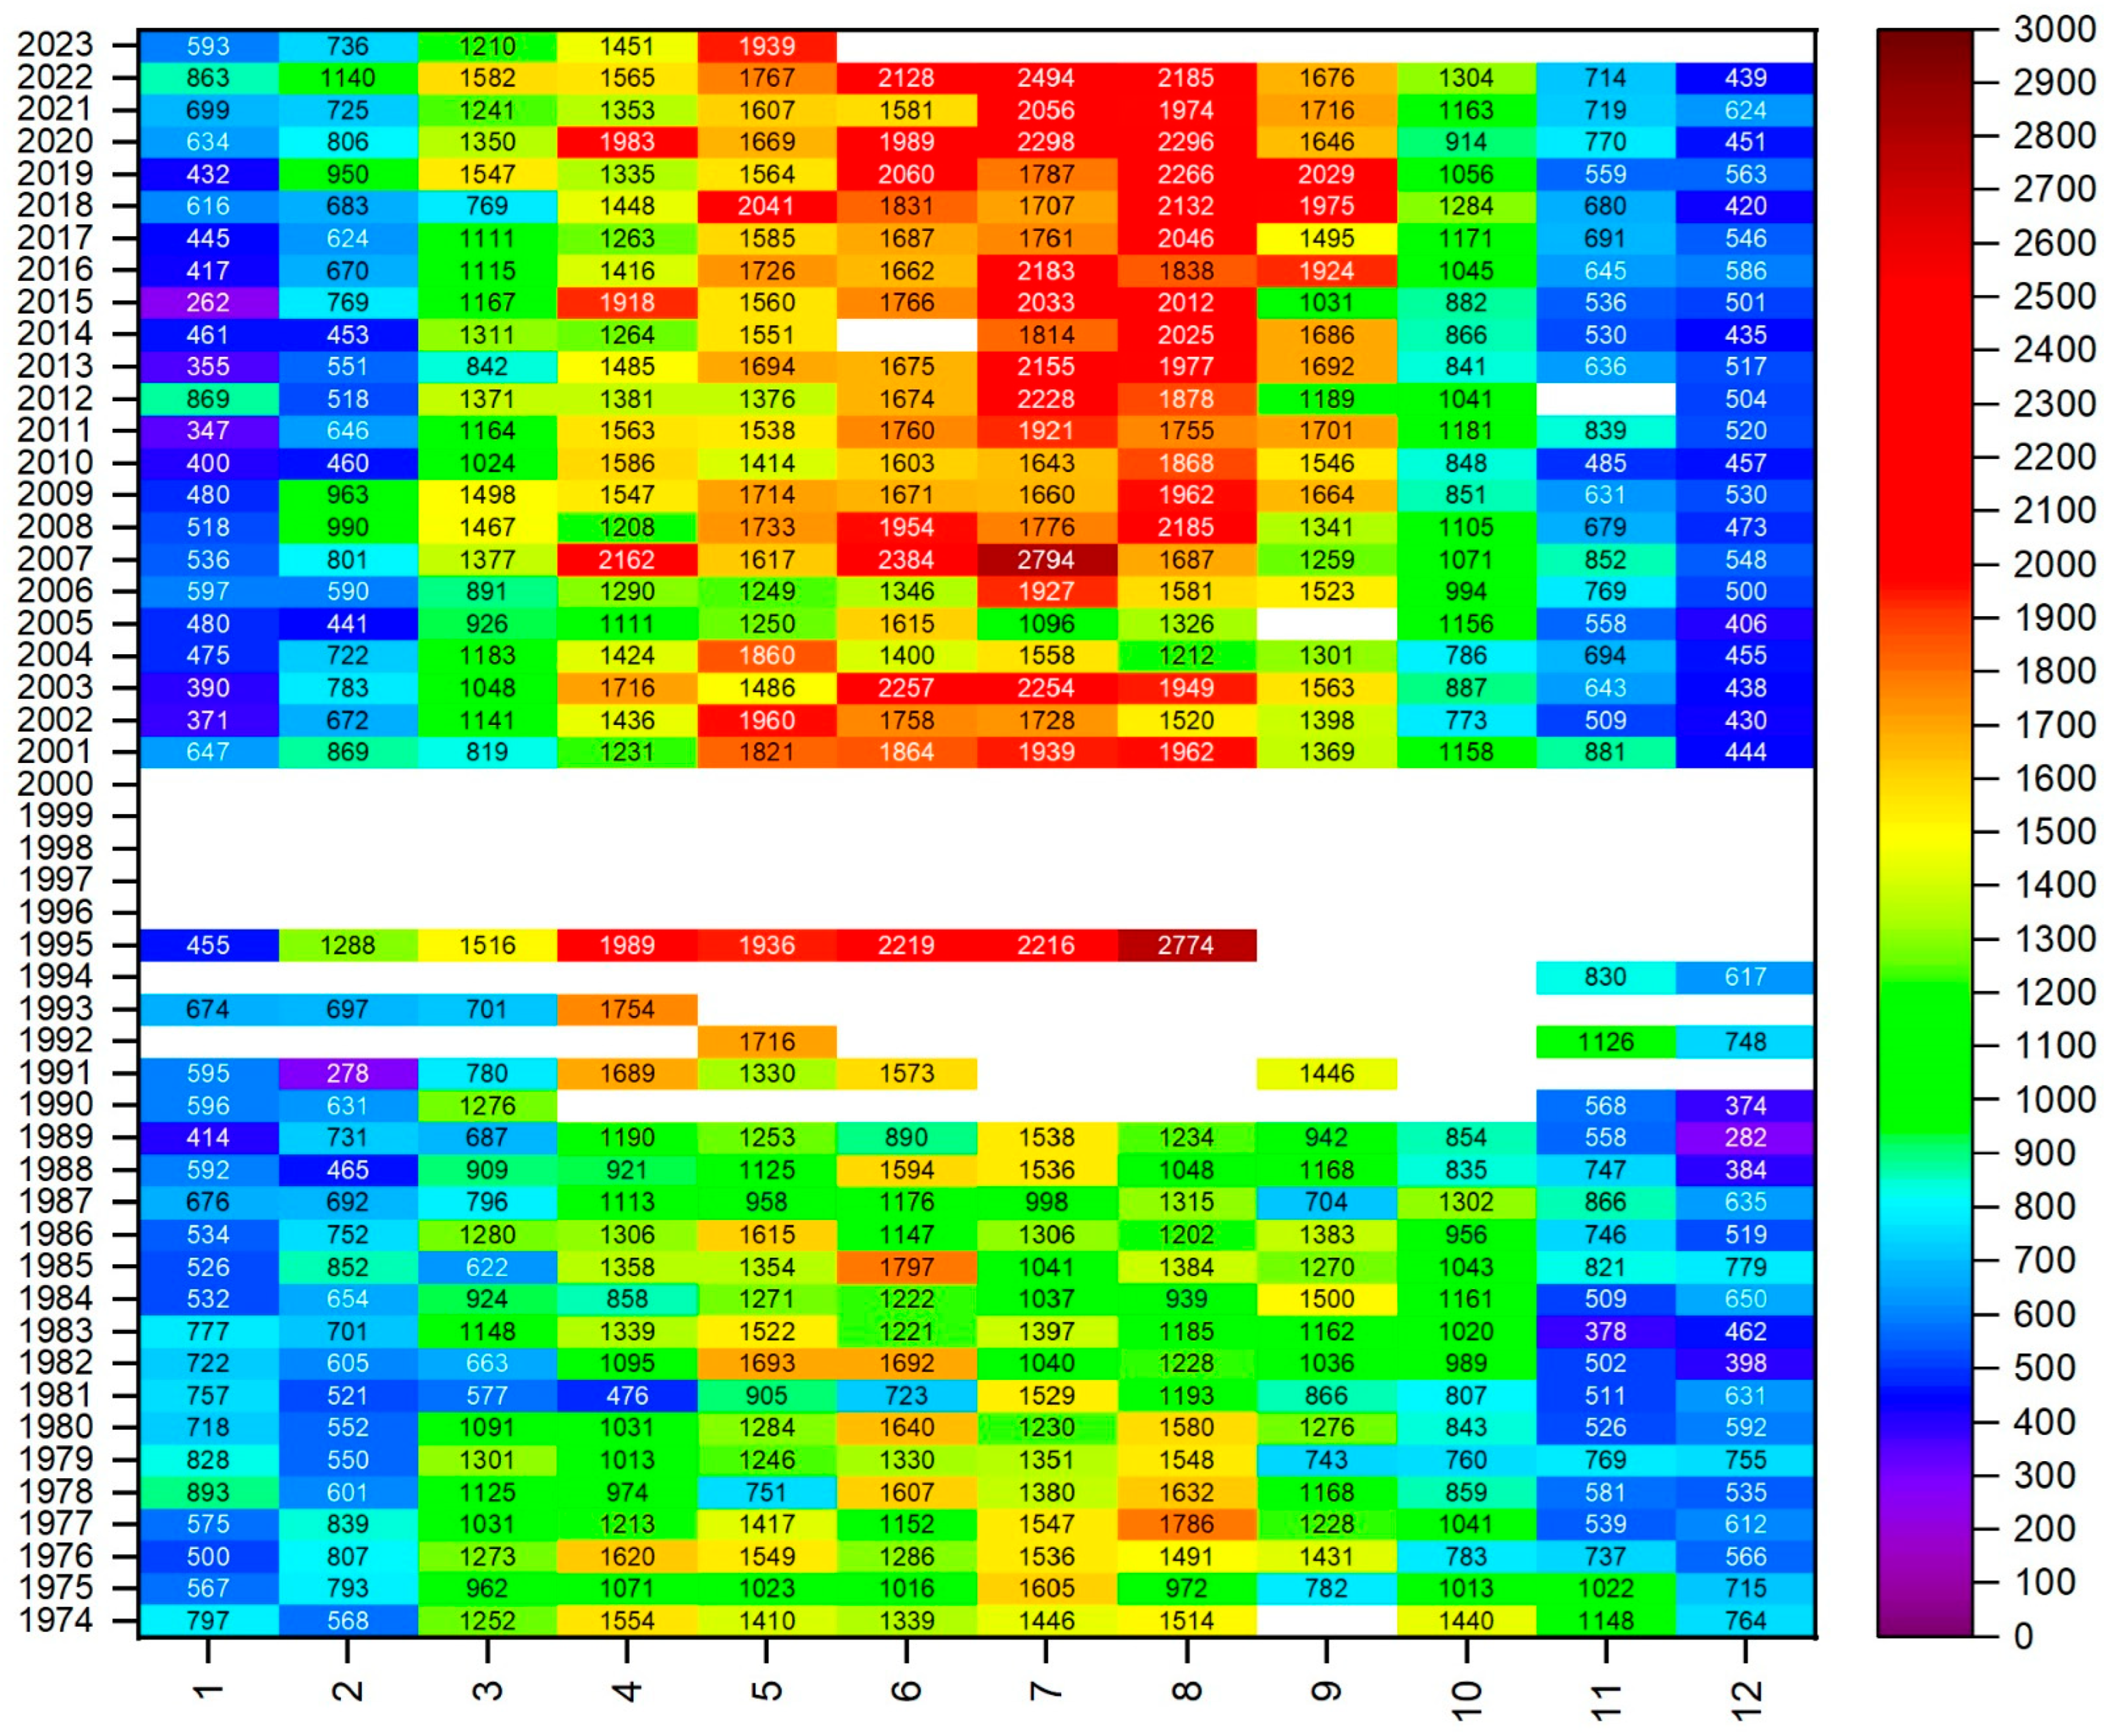
The particularities induced by the local geography, in all its aspects, along with influences at the synoptic scale, are reflected in the climatology of the planetary boundary layer height above Bucharest. The temporal and spatial variability of this parameter can be clearly represented using heatmap graphs, which facilitate a complex yet consolidated analysis of the climatology of the planetary boundary layer height. As can be seen in
Figure 6, which shows the PBL height resulting from ERA5 calculations, the months in the cold semester indeed present the lowest heights, ranging from 219 m to 368 m (average values). January is the month when the PBL reaches its lowest heights. In January, the northern half of the continent experiences tighter barometric gradients due to the deepening of the Icelandic Low. This leads to an intensification of atmospheric circulation in the north. In contrast, the south and the Romanian Plain typically see greater stability of the air masses. This is due to the formation of an anticyclonic belt, brought about by the union of the Siberian and Azores high-pressure systems.
Thus, cyclonic activity in the Mediterranean Basin weakens and circulation becomes less intense [
3]. The transitional seasons (MAM and SON) exhibit similarities with regard to the height of the planetary boundary layer. In March, values range from 609 m to 1671 m, with the lowest value recorded in 2018. April is the month when the height has exceeded 2000 m on two occasions in the analysed data series (2063 m in 2020 and 2017 m in 2007). The lowest height was recorded in 2016 at 990 m, while May is characterised by values exceeding 1500 m. The maximum height was recorded in 1986 at 1865 m, and the minimum value does not drop below 1100 m, with an average value of 1144 m in 1980. As the Northern Hemisphere warms, the anticyclonic belt shifts northwards, the Icelandic Low weakens and the depression over Asia Minor becomes more influential. Consequently, the southern part of the continent experiences more intense circulation than the northern part [
3]. During the warm season, the highest PBL height values are recorded, with July 2007 standing out from the other years in the analysed period with a maximum value of 2258 m.
The lowest height, 1011 m, is observed in June 1991. Starting in June, evident changes to the baric field are observed at continental level. The thermal low over Asia Minor deepens while the Siberian High weakens. The Icelandic Low weakens over the North Atlantic, resulting in weaker winds over northern Europe [
3]. From September onwards, the values gradually decreased, with November showing the most homogeneous PBL height values across the entire analysed period, ranging from 409 m to 832 m.
November is the most stable month of the year due to the extension of the Siberian High ridge, which reaches as far as the western Alps. The ridges of the Azores High and the Siberian High merge to form a high-pressure belt positioned further south over the continent during the cold season than during the warm season. This configuration blocks circulation from the Mediterranean Sea towards Romania [
3].
The heatmaps in
Figure 6 and
Figure 7, which are based on measurements from the observation point at Meteorological Station Afumați (15420 Bucharest Băneasa), also show a clear seasonal variability, with the highest PBL heights occurring during the summer months. This is a result of thermal convection that induces intense turbulence [
4]. The greatest homogeneity is observed during the cold and transitional months. In the warm months, however, although there is a clear upward tendency in PBL height, year-to-year homogeneity is observed to decrease. The highest PBL height was recorded in July 2007, with average values of 2258 m and 2794 m from ERA5 and the Stull method, respectively. The increase in PBL height is related to changes in other meteorological parameters in the Bucharest area, which influence the local climate. In his study, Tumanov S. et al. report a decrease in the number of foggy days and rainy days, a reduction in wind speed and an increase in relative humidity at the Băneasa and Filaret stations in the period 1961–1990 [
55].
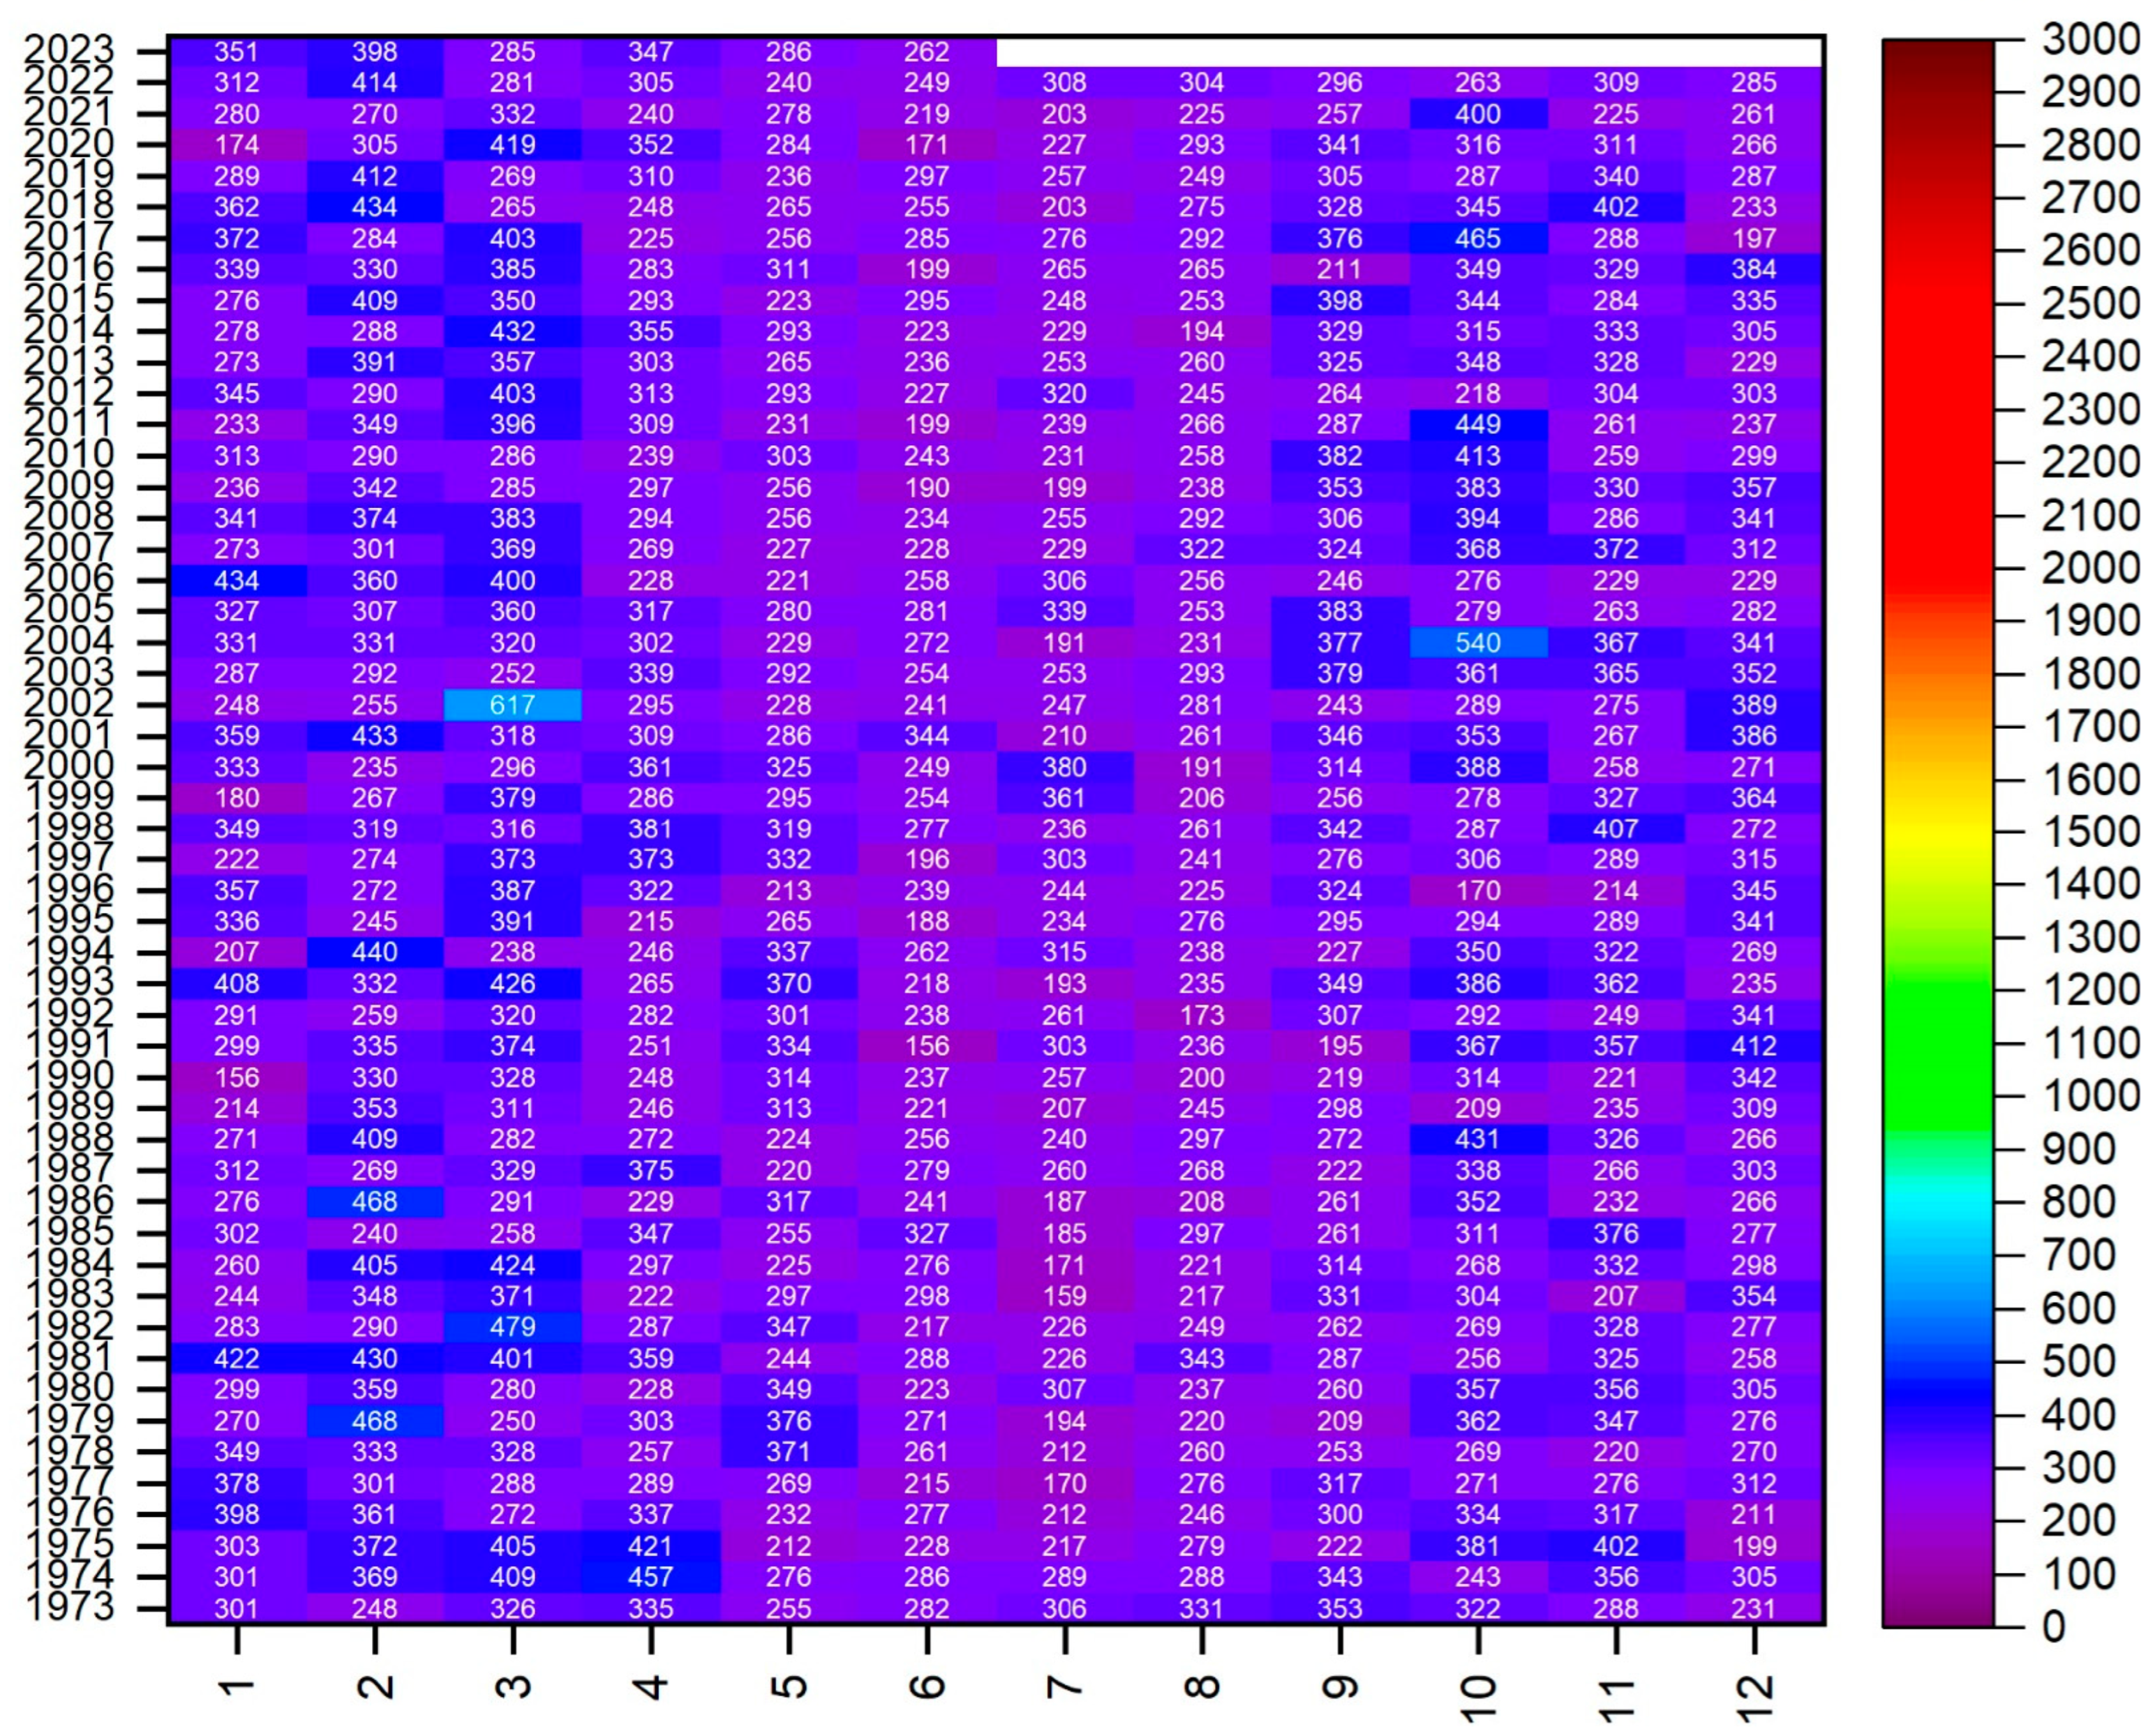
The ERA5 data (
Figure 8) show a relatively uniform evolution of the boundary layer at night, with moderate height values (the multiannual monthly average is approximately 240–330 m, with seasonal variations). These values are typical of a stable nocturnal boundary layer (SBL), which develops through the radiative cooling of the surface. It is characterised by shallow depth and weak turbulence. The limited interannual variations suggest that the ERA5 reanalysis tends to ‘smooth out’ extremes and provide robust climatological averages. At the same time, higher values occasionally appear (above 500–600 m; for example, 540 m in October 2004 and 617 m in March 2002), which are interpreted as residual layers (RLs) formed during the day that did not dissipate completely after sunset. This behaviour indicates that ERA5 effectively captures both the SBL typical of calm and cold nights, and episodes of persistent RL, particularly during the transitional months of spring and autumn.
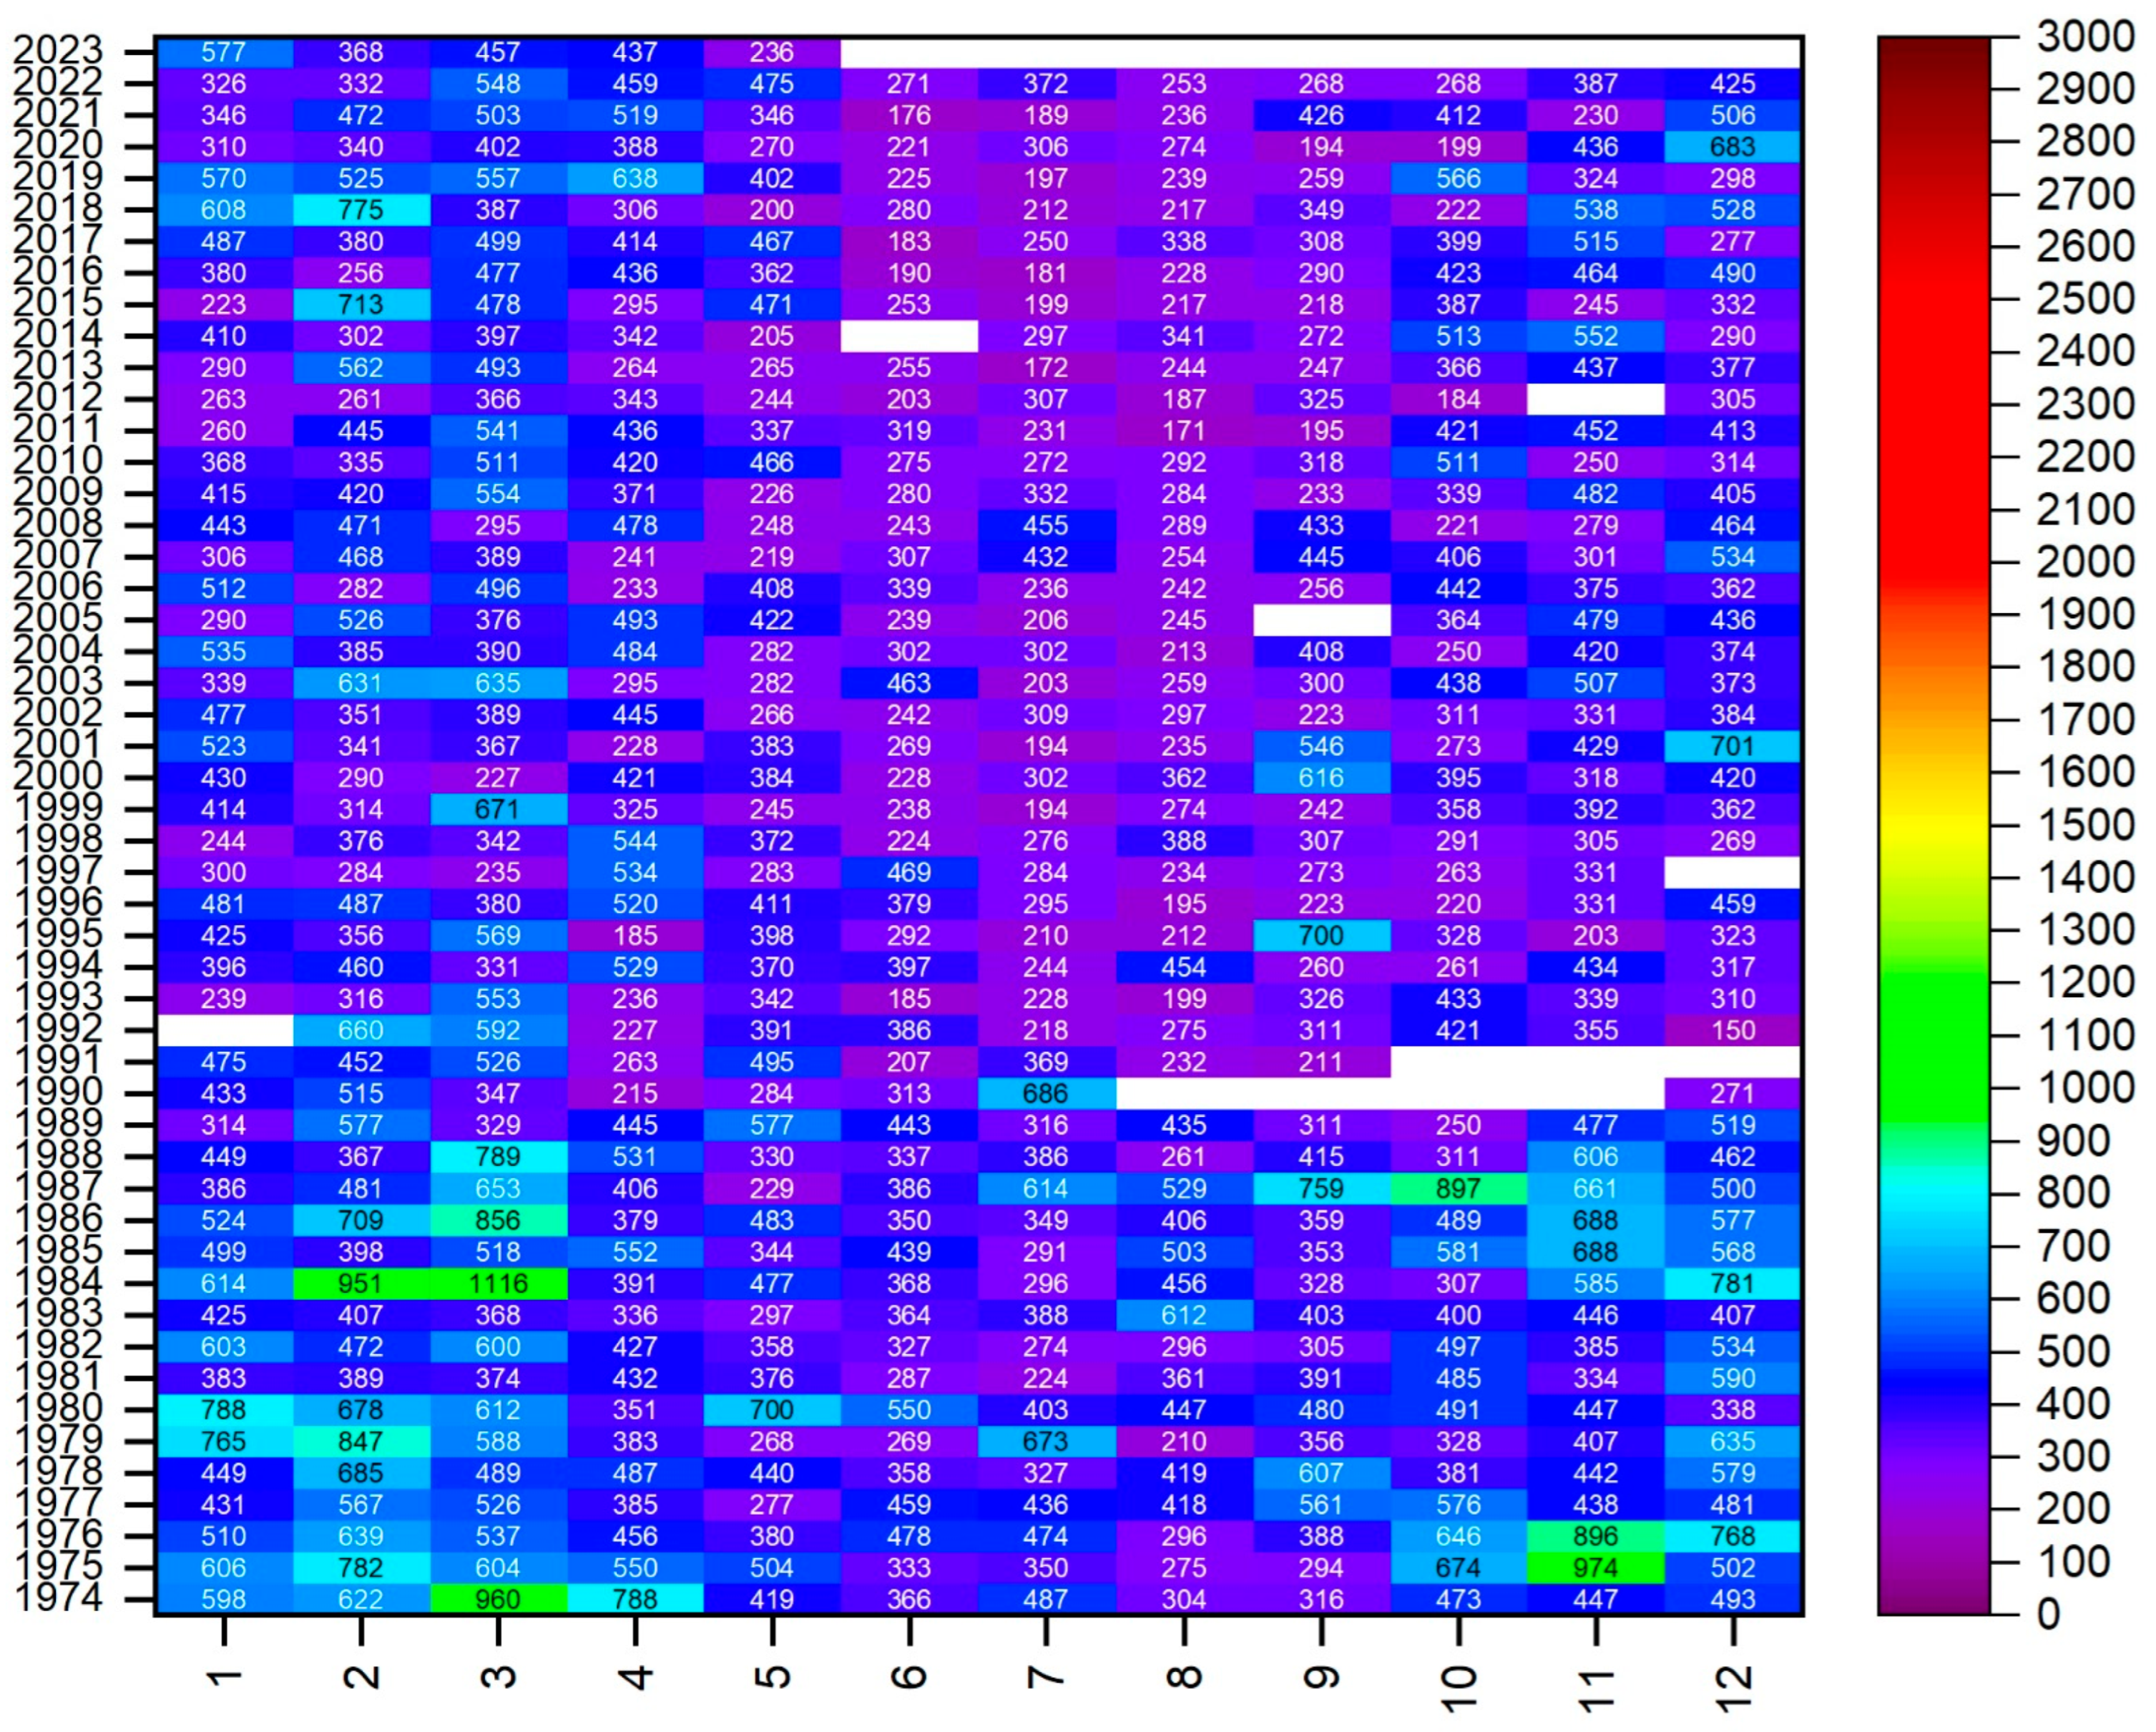
Estimates based on Stull’s method (
Figure 9) show much greater variability in PBL height at night, with values ranging from a few hundred metres (multiannual monthly averages between 300 and 510 m) to over 1000 metres (1116 metres in March 1984). This behaviour indicates that the method is more sensitive to local conditions (atmospheric circulation, stratification and mechanical forcing). The high values (800–1200 m; specifically, 951 m in February 1984; 1116 m in March 1984; 897 m in October 1987; and 974 m in November 1975) suggest that the method retains the signal of a strongly developed residual layer (RL) during the day, which dominates the nocturnal structure. In contrast, low values (200–400 m) correspond to a classic SBL formed under conditions of radiative cooling and stable stratification. Compared to ERA5, the Stull method accentuates these differences, providing a clearer distinction between the shallow SBL and the persistent RL. This is an important aspect for case studies and the evaluation of residual vertical transport events (e.g., pollutants and aerosols).
After 2000, sunshine duration in Europe increased significantly, confirming a consistent positive trend in surface solar radiation. Data from the ESOTC 2024 report show that after 2006, positive anomalies in sunshine duration have persisted almost every year, with only one notable deviation in 2010, higher and lower solar radiation [
31].
The evolution of cloudiness was inversely correlated with that of solar radiation. After 2000, satellite data show a gradual decrease in average cloud cover in Central and Eastern Europe, while moderate increases in cloudiness were observed in the west of the continent. In 2024, these contrasts were accentuated: anomalies of −10% over the Balkans and +10% in the west (France), with minimum values up to −50% in September (eastern Europe), associated with a persistent anticyclonic regime and drought conditions.
In parallel, the intensification of solar radiation and the reduction in cloudiness in south-eastern Europe have favoured a constant increase in extreme temperatures and the number of hot days. Since the 2000s, a clear increase in the frequency of heat waves, days with severe heat stress and tropical nights (minimum temperature below 20 °C) has been observed. The average number of such nights has increased, and the continental area affected by at least one tropical night has risen from 20% in the 1970s to over 35% in the 2020s. In 2024, south-eastern Europe recorded 66 days with severe heat stress, the highest number in the observational series, and 23 tropical nights, exceeding previous records. Copernicus analyses show that, after 2000, it showed an accelerated increase in the frequency and intensity of heat days, a greater persistence of heat values and an increase in the annual variability of summer rainy days, which amplifies the effects of drought [
31,
32].
During the period 2000–2003, the temperature anomaly at the 850 hPa level was analysed and studied for each year, compared to the period 1991–2020. Except for the period 2003–2006 and 2011, where the anomalies are negative, the entire interval had positive anomalies, above the observation point [
31,
32,
56].
The climatological results obtained for the period 1973–2023 are consistent with previously reported observations for Romania, which describe a clear seasonal variation in the PBL height between 500 m and 2250 m, dependent on atmospheric stability, layer type and local conditions. Studies carried out with lidar and ceilometer systems at Măgurele [
24,
25,
28,
30] have revealed maximum values of the convective layer between 1300 and 2265 m during summer and minimum values below 800 m in stable nocturnal regime, similar to our multi-annual averages obtained by the Stull method and ERA5. Belegante et al. and Timofte et al. showed that numerical models tend to underestimate the PBL under certain stability conditions, and the differences between measured and simulated values are frequently below 200 m, which corresponds to our observation of the underestimation of ERA5 compared to the survey determinations, especially for the maximum diurnal values [
26,
27].
Compared to these studies, the present work makes an essential contribution through its climatological character, covering a period of five decades and providing a systematic analysis of the evolution of the PBL in southern Romania.
5. Conclusions
At 12 UTC, both the Stull method and the ERA5 reanalysis data capture the convective mixed layer (CML), with values in the order of kilometres for the warm and transitional seasons. The Stull method reveals greater extremes and variability, whereas the ERA5 provides a more consistent diagnosis with lower maximum limits.
The Stull series shows positive tendencies after 2000, which are particularly significant during the warm seasons (JJA and SON). This suggests an intensification of diurnal convection. By contrast, the ERA5 data only shows moderate increases until the 2000s, after which it stabilises.
The results suggest an increase in ML height after 2000, which is probably associated with an intensification of convection and a change in the regional energy regime. The differences between the Stull method and the ERA5 reanalysis data reflect methodological limitations: the Stull method is more sensitive to local and extreme processes, whereas the ERA5 data are less variable.
At 00 UTC, the values obtained by the Stull method primarily reflect the stable night-time layer (SBL). These values demonstrate significant variability and a tendency to decrease below average in all seasons. In contrast, ERA5 provides a more consistent diagnosis without any robust climatological signals currently.
The pronounced increases observed in the Stull method at 00 UTC during the 1970s–1990s disappear, indicating a possible change in the nocturnal stability regime. After 2000, the at 12 UTC tendencies are positive, especially during the warm seasons, suggesting an intensification of diurnal convection.
In terms of the differences between the methods, the Stull method produces estimates that reach higher maximum values than ERA5 but also exhibit much greater dispersion. In contrast, ERA5 limits extremes and smooths variability. This structural difference between the two methods is a key factor in interpreting the results.
Regarding the connection between the 00 and 12 UTC observations, the following can be stated: inter-annual correlations are weak or negative, particularly in summer. This confirms that the PBL height at 00 UTC cannot be used as a proxy for the residual layer (RL). The diurnal amplitude between the 00 and 12 UTC observations is primarily determined by the ML depth rather than the nocturnal structure.
The results emphasise that the processes governing the diurnal PBL (convection) and the nocturnal PBL (radiative cooling and inversions) are fundamentally different. The climatological analysis must therefore treat these regimes separately. To characterise the RL, other dedicated methods that explicitly distinguish between the SBL and the RL must also be applied.
Summarising the above, our conclusions regarding the evolution of the PBL height are consistent with the measured meteorological parameters. After 2000, Europe experienced an increase in sunshine duration and ground radiation, especially in the east and southeast of the continent, a reduction in cloudiness in the same regions, and an intensification of extreme temperatures, with records of torrid days and tropical nights in Southeast Europe.
