Article

Comparison of Road-Side Emissions Measurements from Heavy-Duty Diesel Vehicles to MOVES5

by
Amber Lae Gurecki Allen
*,
Emma Reeves
and
Darrell B. Sonntag
Department of Civil & Construction Engineering, Ira A. Fulton College of Engineering, Brigham Young University, Provo, UT 84602, USA
*
Author to whom correspondence should be addressed.
Atmosphere 2025, 16(11), 1244; https://doi.org/10.3390/atmos16111244
Submission received: 1 October 2025 / Revised: 26 October 2025 / Accepted: 27 October 2025 / Published: 30 October 2025
(This article belongs to the Section Atmospheric Techniques, Instruments, and Modeling)

Abstract

This study compares MOVES5 emissions estimates for nitrogen oxides (NO, NO2, and NOx), ammonia (NH3), and carbon monoxide (CO) to individual roadside emission measurements from heavy-duty (HD) diesel vehicles. Vehicle measurements were collected in Perry, Utah (winter 2020 and summer 2023) and Peralta, California (spring 2017), using the Fuel Efficiency Automobile Test (FEAT) remote sensing device. MOVES5 underestimated NOx in the Utah winter campaign. MOVES5 underestimated mean NO emissions and overestimated mean NO2 emissions across all campaigns, indicating potential deficiencies in the NO/NOx and NO2/NOx ratios used by the model. NH3 estimates were significantly higher than measurements, while CO estimates closely matched real-world measurements. Analysis by model year found that MOVES5 consistently underestimated emissions of the older model years and overestimated emissions from the newest model years for most pollutants. In the Utah winter campaign, MOVES5 underestimated NOx by 47%, which, when applied to Utah’s emission inventory, suggests that HD diesel vehicles may contribute an additional ~1300 tons/year of unaccounted NOx. Using a broader range of real-world measurements to update the MOVES model could improve its accuracy in estimating HD diesel vehicle emissions.

1. Introduction

Heavy-duty (HD) diesel vehicles are a significant contributor to air pollution. Though HD vehicles only account for 5% of vehicles driven on the road, they contribute 32% of total on-road nitrogen oxide (NO + NO2) or NOx, emissions as of 2022 [1]. According to 2017 National Emissions Inventory (NEI) data, HD diesel trucks are also responsible for 23% of total on-road vehicle greenhouse gas emissions [2]. Ammonia (NH3) emissions from both light-duty (LD) and HD vehicles have been known to contribute between 60 and 95% of total urban NH3 pollution [3]. Additionally, NOx and NH3 emissions are precursors to the formation of fine particulate matter (PM2.5), a criteria air pollutant under the National Ambient Air Quality Standards (NAAQS). Carbon monoxide (CO) and nitrogen dioxide (NO2), a component of NOx, both emitted from HD diesel vehicles, are also monitored under the NAAQS as criteria pollutants. The addition of these pollutants to the atmosphere exacerbates air quality issues and human health concerns. Previous studies have identified that people who live near major roadways experience an increased risk of developing cardiovascular disease, pulmonary disease, asthma, and cancer [4].
The U.S. Environmental Protection Agency (EPA) developed the Motor Vehicle Emission Simulator, or MOVES, modeling software to quantify vehicle emissions for specific roadways or entire counties across the United States. MOVES estimates emission of greenhouse gases, air toxins, and other air pollutants from mobile sources. In addition to being used to create NEI databases and identify major sources and targets for air pollution [5], MOVES is an important tool used by states that struggle to meet the NAAQS. Non-compliant states incorporate MOVES estimates into their State Implementation Plans (SIPs) to quantify vehicle emission contributions and changes over time [6]. Assessing the accuracy of MOVES against real-world emission measurements is essential for reliably quantifying vehicle contribution to emissions inventories.
Several iterations of MOVES have been released. Updates to the model are made to incorporate new vehicle emission and fuel regulations, provide additional data and projections on vehicle emissions, fuel properties, and vehicle activity, and use updated methods to estimate emissions from vehicles [5]. Many studies have examined the accuracy of the MOVES compared to real-world vehicle emission measurements. However, most comparison studies focus on LD vehicle emissions, creating a deficiency in the reliability of MOVES’ accuracy in estimating HD vehicle emissions. Additionally, even fewer studies have assessed the overall performance of the latest version, MOVES5, released in November of 2024 [7]. Most existing studies focus on NOx emissions from HD diesel vehicles. While NOx emissions are important and represent a large contribution from HD diesel vehicles, they are not the only pollutant of concern.
This study compares MOVES-estimated HD diesel emissions to roadside emission measurements from three remote sensing campaigns measuring HD vehicles in Utah and California. In addition to comparing modeled to measured NOx (NO + NO2) emissions, this study will also compare modeled NH3 and CO emissions to roadside measurements. A consistent methodology is applied in each comparison that accounts for the operating conditions, model year, age, regulatory class (weight), and fuel type (diesel) for each vehicle measurement, as well as the temperature, humidity, and fuel properties of each location. Previous comparisons have been made to two of the three campaigns to older versions of MOVES [8]. However, these comparisons did not match the operating conditions and other site-specific information to the MOVES emission rates as conducted in this analysis. Additionally, this study evaluates the model using the latest publicly available version of MOVES: MOVES5. The following sections outline information on the background of MOVES, detail measurement and analysis methods, present results and discuss modeled, measurement comparisons, and provide recommendations for model improvements.

2. Materials and Methods

2.1. Measurements

HD diesel vehicle data collected during the Perry 2020 and Perry 2023 campaigns were measured at the Port of Entry in Perry, Utah, which is located north of Salt Lake City. Upon entering the Port, trucks are either directed to a lane with a speed of 3 mph or 20 mph to be weighed. Occasionally a truck can be directed to pull over for further inspection. All trucks, regardless of the lane they are weighed in or whether they are stopped for inspection, merge back into a single lane as they leave the weigh station. Emissions measurements were captured from trucks as they were leaving the Port to merge back onto I-15 heading south. Several programs allow large fleets to certify their trucks’ status and forgo a stop at the Port of Entry. Observations during the Perry 2023 campaign estimate that approximately 50% of trucks bypass the Port. However, some bypassing trucks are randomly called in or flagged by roadway sensors before the weigh station, ensuring that the sampled vehicles reflect a mix of fleet types. HD diesel vehicle data collected during the Peralta 2017 campaign were collected at the Peralta Weigh Station located east of Anaheim, California, along California SR91 in the spring of 2017. Similar to the Perry campaigns, trucks were measured after being weighed and before they rejoined the highway [9].
HD vehicle measurements were collected using the Fuel Efficiency Automobile Test (FEAT) remote sensing device, which was developed by researchers at the University of Denver [10]. FEAT has been shown to be a reliable and accurate system for measuring in-use emissions from both LD and HD vehicles [9,10,11,12,13]. While a detailed overview of FEAT measurement collection and operation can be found in Bishop and Stedman (1996) [14], the following paragraph summarizes its core operating principles and measurement procedures to provide context for this study. Figure 1 shows the FEAT system setup during the Perry 2023 campaign, with labels to highlight the primary operational components of the system.
FEAT quantifies exhaust composition by measuring the absorption of infrared (IR) and ultraviolet (UV) light by gaseous pollutants. The system operates across a single lane, where the IR- and UV-emitting light source is aligned to a detector directly opposite of it on the other side of the roadway. This detector, calibrated with known concentrations of the measured gaseous pollutants, records light absorption as a vehicle’s exhaust passes through the beam. When a vehicle interrupts the beams of light, the system is triggered to begin measuring. Emission measurements are collected every 0.01 s for 0.5 s, generating 50 data points, and measurements collected for 0.2 s before the vehicle’s passing are used as a reference. Emission rates for each pollutant are determined relative to CO2 using ordinary least squares regression, adjusted with calibration factors from the known reference gases. Because pollutant concentrations are measured relative to CO2, full plume capture is not required. Using an assumed carbon content of 0.86 g carbon per g fuel and the measured molar ratios of CO, NO, NO2, and NH3 to CO2, fuel-based emission rates are computed in grams of pollutant per kilogram of fuel burned (g/kg-fuel).
Vehicle speed and acceleration are obtained from paired infrared detectors positioned six feet apart directly downstream of the beam. At the moment of measurement, an automated camera captures an image of the vehicle’s license plate, linking it to the corresponding emission record. License plate data are manually transcribed during post-processing. For this study, vehicle-specific information for Utah-plated vehicles was obtained in collaboration with the Utah Department of Motor Vehicles, while non-Utah-plated vehicle information was accessed through publicly available sources [15].
Data collected during the Perry 2020 and Peralta 2017 campaigns collected emission from HD diesel trucks using two different configurations of the FEAT: High FEAT and Low FEAT. High FEAT placed both the detector and light source on 4.3 m high scaffolding, and Low FEAT positioned the FEAT and detectors at the ground level, about 0.3 m. These different configurations aimed to capture emissions from HD trucks that had both elevated (stack) and ground-level (turn-down) exhaust pipes. The Perry 2023 measurements were only taken in the Low FEAT configuration due to complexity and cost of the High FEAT setup and, therefore, only captured emissions from trucks with ground-level exhaust pipes. Observations made during the Perry 2023 campaign show that roughly 60% of trucks had ground-level exhaust pipes, while 40% had elevated exhaust pipes.

2.2. MOVES

To compare data measured by FEAT to MOVES, MOVES5 base emission rates were extracted for Class 6, 7 Medium-Heavy-Duty (MHD), and Class 8 Heavy-Heavy-Duty (HHD) vehicles at each model year, age, and operating mode. Base rates were converted from grams of pollutant to grams/kg-fuel using MOVES’ estimates of energy content for HD diesel vehicles. Vehicle weight class and chassis model year for each truck were obtained from the vehicle registration data for each campaign. MOVES5 stores emission rates by engine model year but inherently assumes that the chassis and model year are the same for each truck. The default age distribution used in MOVES5 is based on registration data, which presumably is the chassis model year for heavy-duty vehicles [16]. The MOVES technical guidance does not specify using engine or chassis model year for local age distribution inputs for HD vehicles [17]. To be consistent with the default age distribution data and technical guidance, the MOVES emission rates were matched to measurements using the chassis model year from the measured trucks, even though there is typically a one-year lag between the chassis and engine model year [18].
To account for adjustments that MOVES5 makes to NOx emissions for temperature and humidity, the base NOx emission rates were adjusted using the MOVES5 internal humidity adjustment equation [19] and local conditions measured near the sampling locations in Perry and Peralta for their respective campaign dates. Table 1 shows these conditions and the corresponding NOx adjustment factor for each campaign. Additional emission rate adjustments were made to consider the effects of biodiesel on CO and NOx emissions from pre-2007 HD diesel vehicles. The assumed volume percentage of biodiesel ester in fuel was extracted using MOVES5 for the counties where the measurement campaigns took place (Box Elder County, Utah, and Orange County, California) and was consistent across all three campaigns at 3.5%. The MOVES5 base emission rates for the pre-2007 model year vehicles were adjusted based on the equations and values documented in the latest MOVES Fuel Effects technical report [20]. For method validation, see Appendix A.1.
To properly assign an operating mode to each vehicle, scaled tractive power (STP) was calculated using Equation (1) from the MOVES5 HD Exhaust Emission Rates technical report [21].
S T P t = A v t + B v t 2 + C v t 3 + m · v t ( a + g · sin θ t ) f s c a l e
where
STP = scaled tractive power at time t (scaled kW or skW);
A = rolling resistance coefficient (kW∙s/m);
B = rotational resistance coefficient (kW·s2/m2);
C = aerodynamic drag coefficient (kW·s3/m3);
m = mass of an individual vehicle (metric ton);
vt = instantaneous vehicle velocity at time t (m/s);
at = instantaneous vehicle acceleration (m/s2);
g = the acceleration due to gravity (9.8 m/s2);
sin θ t = the fractional road grade at time t;
fscale = the fixed mass factor (metric ton).
Vehicle weight, road-load coefficients, and fixed mass factor in Equation (1) depend on vehicle source type, model year, and regulatory class. The rolling resistance, rotation resistance, and aerodynamic drag coefficients, as well as vehicle mass and fscale, for each vehicle were extracted from the MOVES5 database [21], using the weight class of the truck (Class 6, 7 MHD, or Class 8 HHD) and assuming that all vehicles were combination long-haul trucks (Source Type ID 62). FEAT measurements included vehicle speed (velocity) and acceleration, and road grade was measured at each sampling location. Table 2 summarizes the number of vehicles in each weight class, average velocity and acceleration, and grade (slope) for each campaign location. Additional information, such as campaign dates and number of vehicles measured in High and Low FEAT configurations are also included.
The calculated STP, velocity, and acceleration for each vehicle measurement were used to assign each vehicle an operating mode [21]. After accounting for the MOVES5 adjustments, the MOVES5 estimated emission rates for each pollutant were matched to the measured FEAT data for each campaign by model year, age, regulatory class, and operating mode.

2.3. Data Analysis

Data from each campaign were analyzed to investigate fleet, model year, and regulatory class trends. For real-world campaign measurements, means were calculated along with 95% confidence intervals (CIs) using the t-distribution. Means for MOVES5 emission estimates were also calculated, but 95% confidence intervals of the mean were not calculated. MOVES is a deterministic model, meaning it consistently predicts the same emission rates for the input conditions. MOVES does not provide uncertainty estimates of the emission predictions. The only variability in the MOVES emissions output is due to differences in MOVES emission rates by operating mode, model year, and regulatory class due to the sample of trucks observed at Perry and Peralta. However, within those categories, the emission rates are consistently the same.
To calculate NO/NOx and NO2/NOx ratios and regulatory class trends, a bootstrap resampling method was applied to obtain sample means and 95% confidence intervals. This method was applied to the ratios because they are roughly constrained between 0 and 1 and cannot be approximated with a normal distribution. Additionally, some regulatory class and model year groupings contained relatively few vehicles, which can lead to unstable estimates and artificially narrow or wide confidence intervals when using traditional parametric methods. Bootstrapping allows these intervals to better reflect the underlying uncertainty by repeatedly resampling the observed data and recalculating the statistics of interest. Resampling calculations were conducted, using the moderndive package in R (version 0.7.0) [22]. Additional details and method justification are provided in Appendix A.2.
Generalized additive models (GAMs) were fit to vehicle data to predict mean emissions by model year using the mcgv package in R (version 1.9.3) [23]. The GAMs estimate continuous functions of emission rates across model years. By assuming continuous functions, the GAM estimates for each model year are influenced by neighboring years according to their distance and the number of observations. The continuous model constraint prevents overfitting the variability of the observations in years with sparse measurements and can estimate emission rates for model years with no observations. The degree of smoothness of the GAM functions are determined by a smoothing parameter, which was selected using the default generalized cross-validation method available in the GAM function [23]. The 95% confidence intervals of the GAM functions are calculated using two times the standard error.

3. Results

3.1. Fleet-Wide Trends

The accuracy of MOVES5-estimated fleet-wide average emissions varied depending on the campaign and pollutant evaluated. Figure 2 illustrates fleet-wide average emissions for each campaign, with error bars representing 95% CIs of the mean. For each of the three campaigns, measured CO emissions compare well with estimates from MOVES5. Peralta 2017 and Perry 2020 MOVES5-estimated mean CO emissions are above what was measured during the campaigns but are within the 95% confidence level of the measured mean. MOVES5 underestimated mean CO emissions from the Perry 2023 campaign but again remained insignificantly different than the real-world measured mean. MOVES5-estimated CO emissions appear representative of real-world CO emissions from HD diesel vehicles and not dependent on location or ambient weather conditions based on our observations.
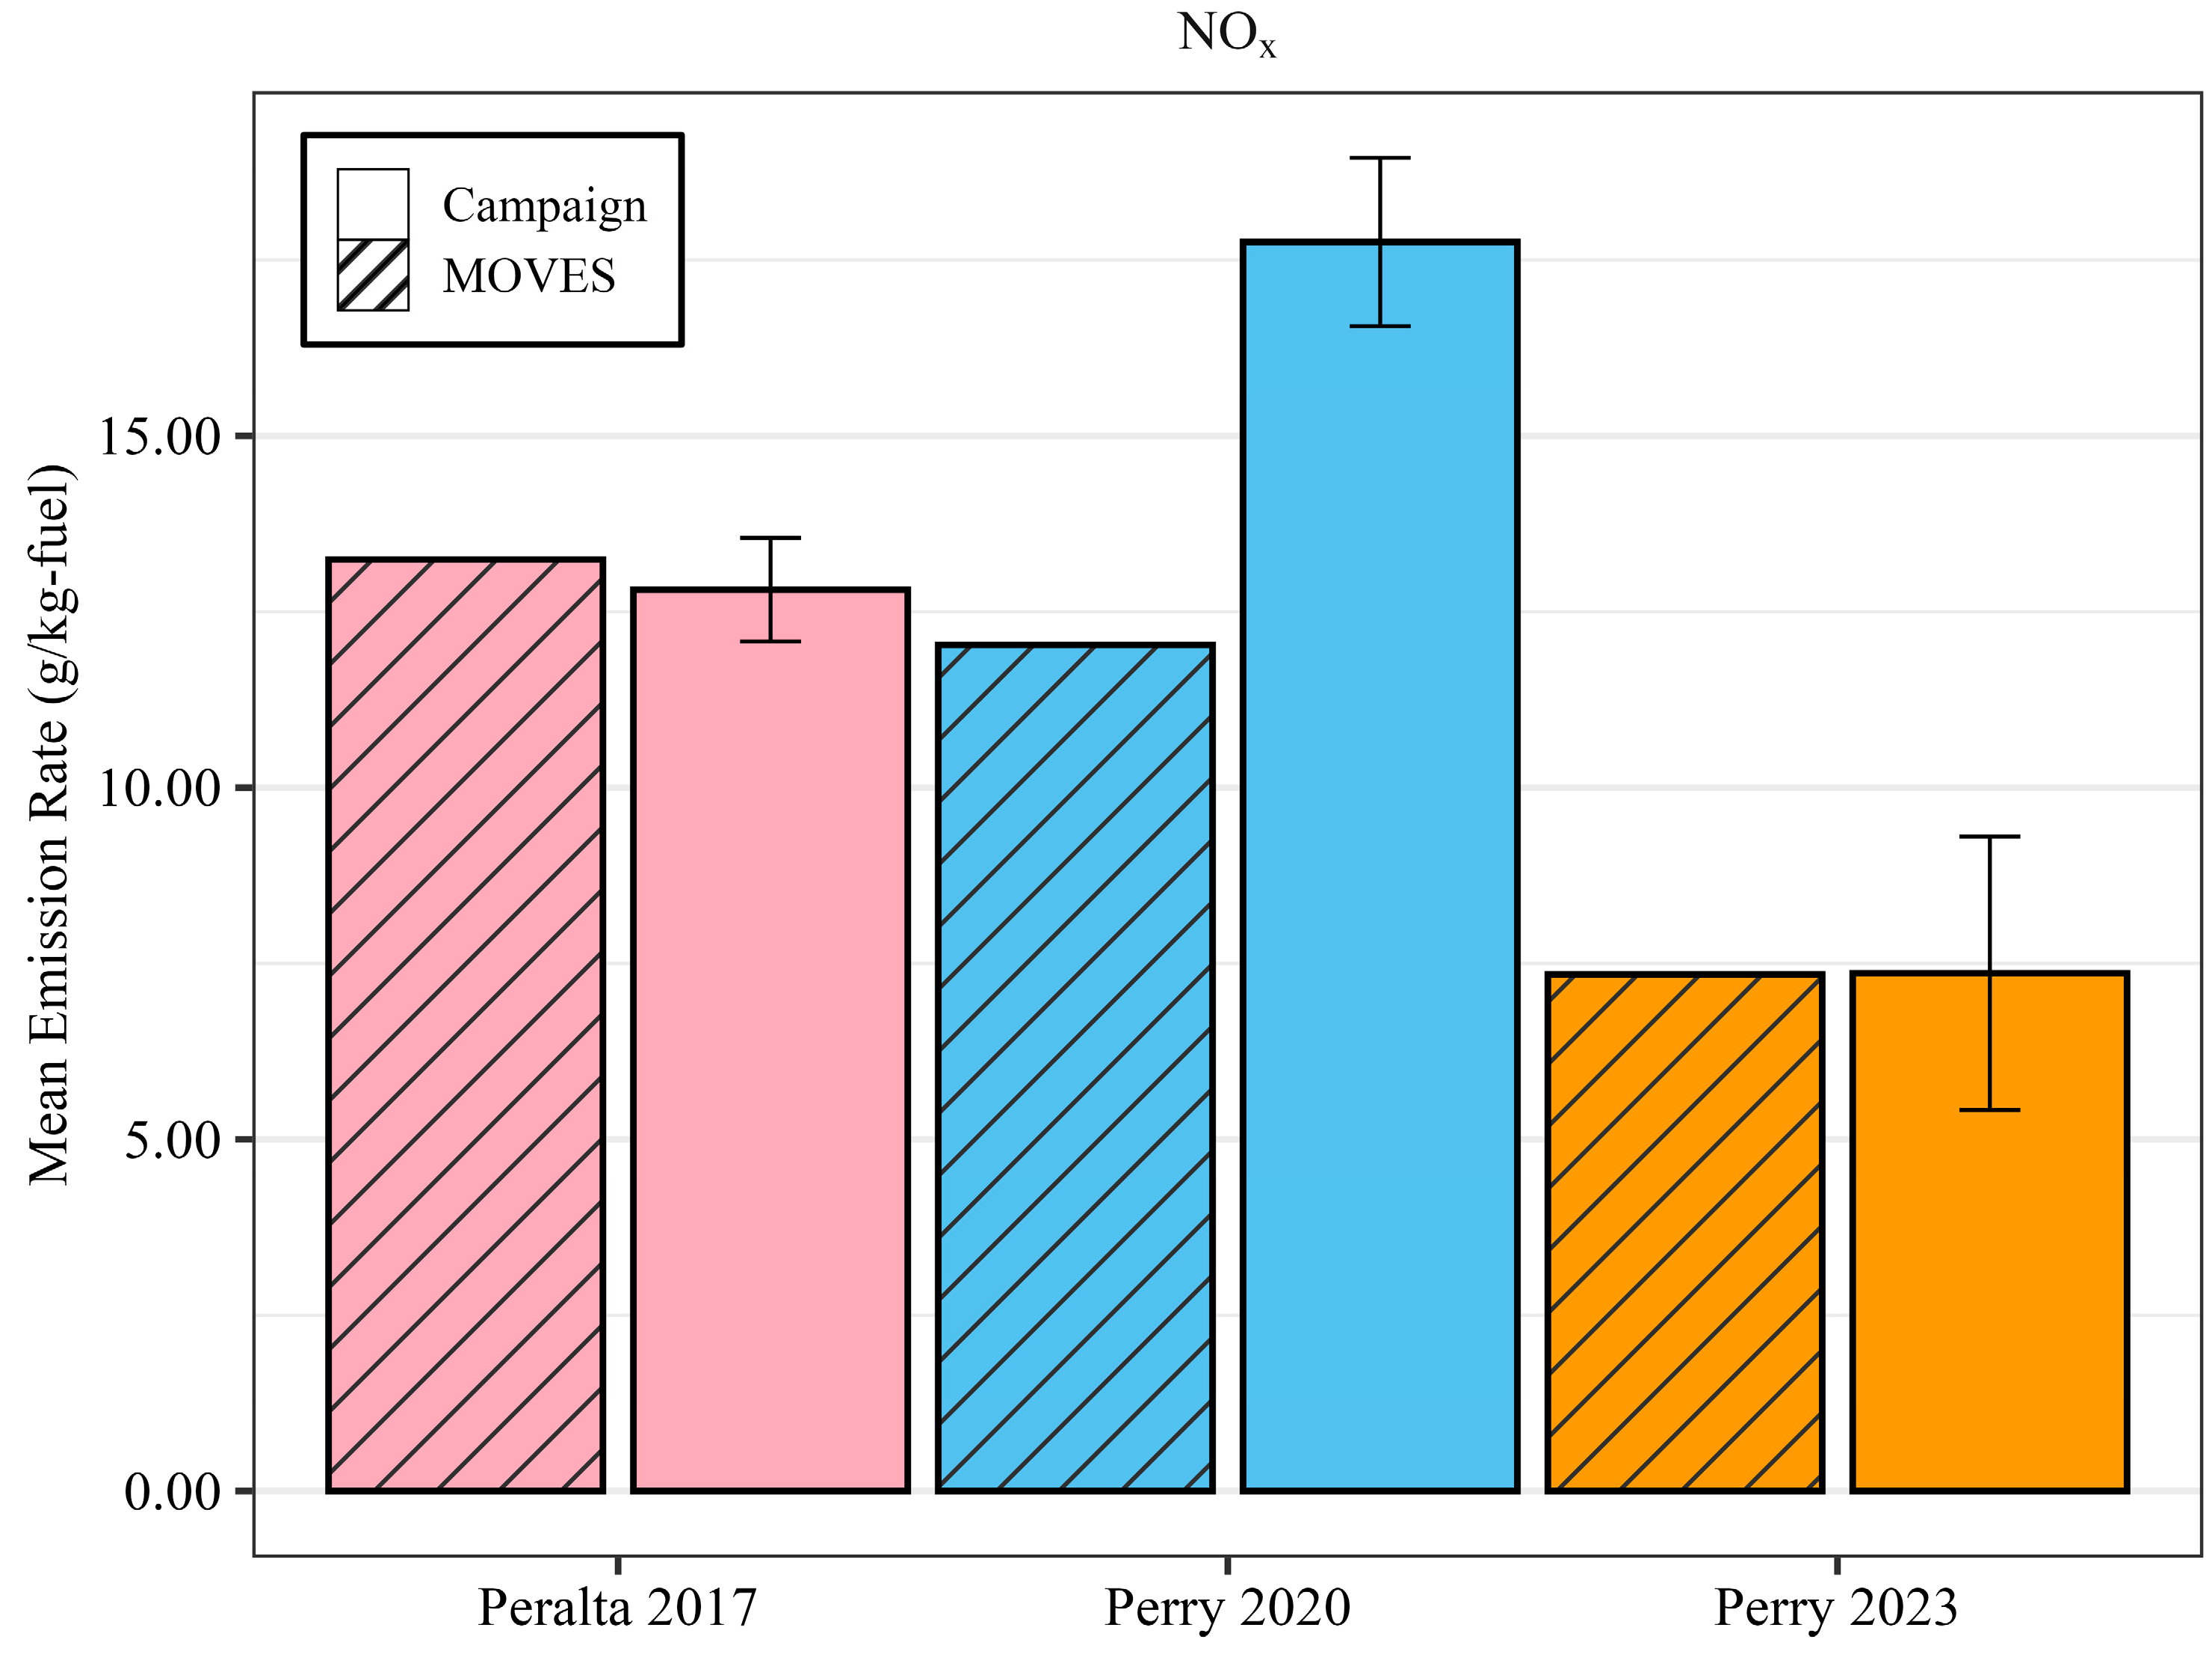
As shown in Figure 3, MOVES5 significantly underpredicts NOx emissions for the Perry 2020 campaign and accurately estimates NOx for the Peralta 2017 and Perry 2023 campaigns. The MOVES5-estimated mean NOx emissions for the Peralta 2017 campaign are 13.24 g/kg-fuel, which fall within the 95% confidence interval of the mean for the measured mean of the campaign, 12.81 g/kg-fuel (CI 12.07–13.55). The disparity between the Perry 2020 campaign and the MOVES5 estimate is significant. MOVES5-estimated fleet average NOx emissions for Perry 2020 are 12.03 g/kg-fuel, while the real-world measured mean NOx is 17.76 g/kg-fuel (CI 16.65–18.95). MOVES5 underpredicted average fleet NOx emissions from the Perry 2020 campaign by approximately 32%. Previous studies suggest the significant increase in wintertime NOx can be attributed to underperformance of selective catalytic reduction (SCR) systems present in newer HD diesel vehicles, because colder ambient temperatures are known to decrease catalyst conversion efficiency [24,25,26]. Currently, MOVES5 does not include a temperature adjustment for HD diesel NOx emissions but includes an adjustment starting with model year 2027 and later vehicles [21]. Gurecki Allen et al. (2025) [27] provide a detailed analysis of temperature sensitivity for the Perry 2020 campaign. For the Perry 2023 campaign, MOVES5-estimated mean NOx emissions were almost identical to the measured fleet average. MOVES5-estimated mean NOx emissions for Perry 2023 were 7.43 g/kg-fuel, while the measured fleet mean was 7.36 g/kg-fuel (CI 5.42–9.31).
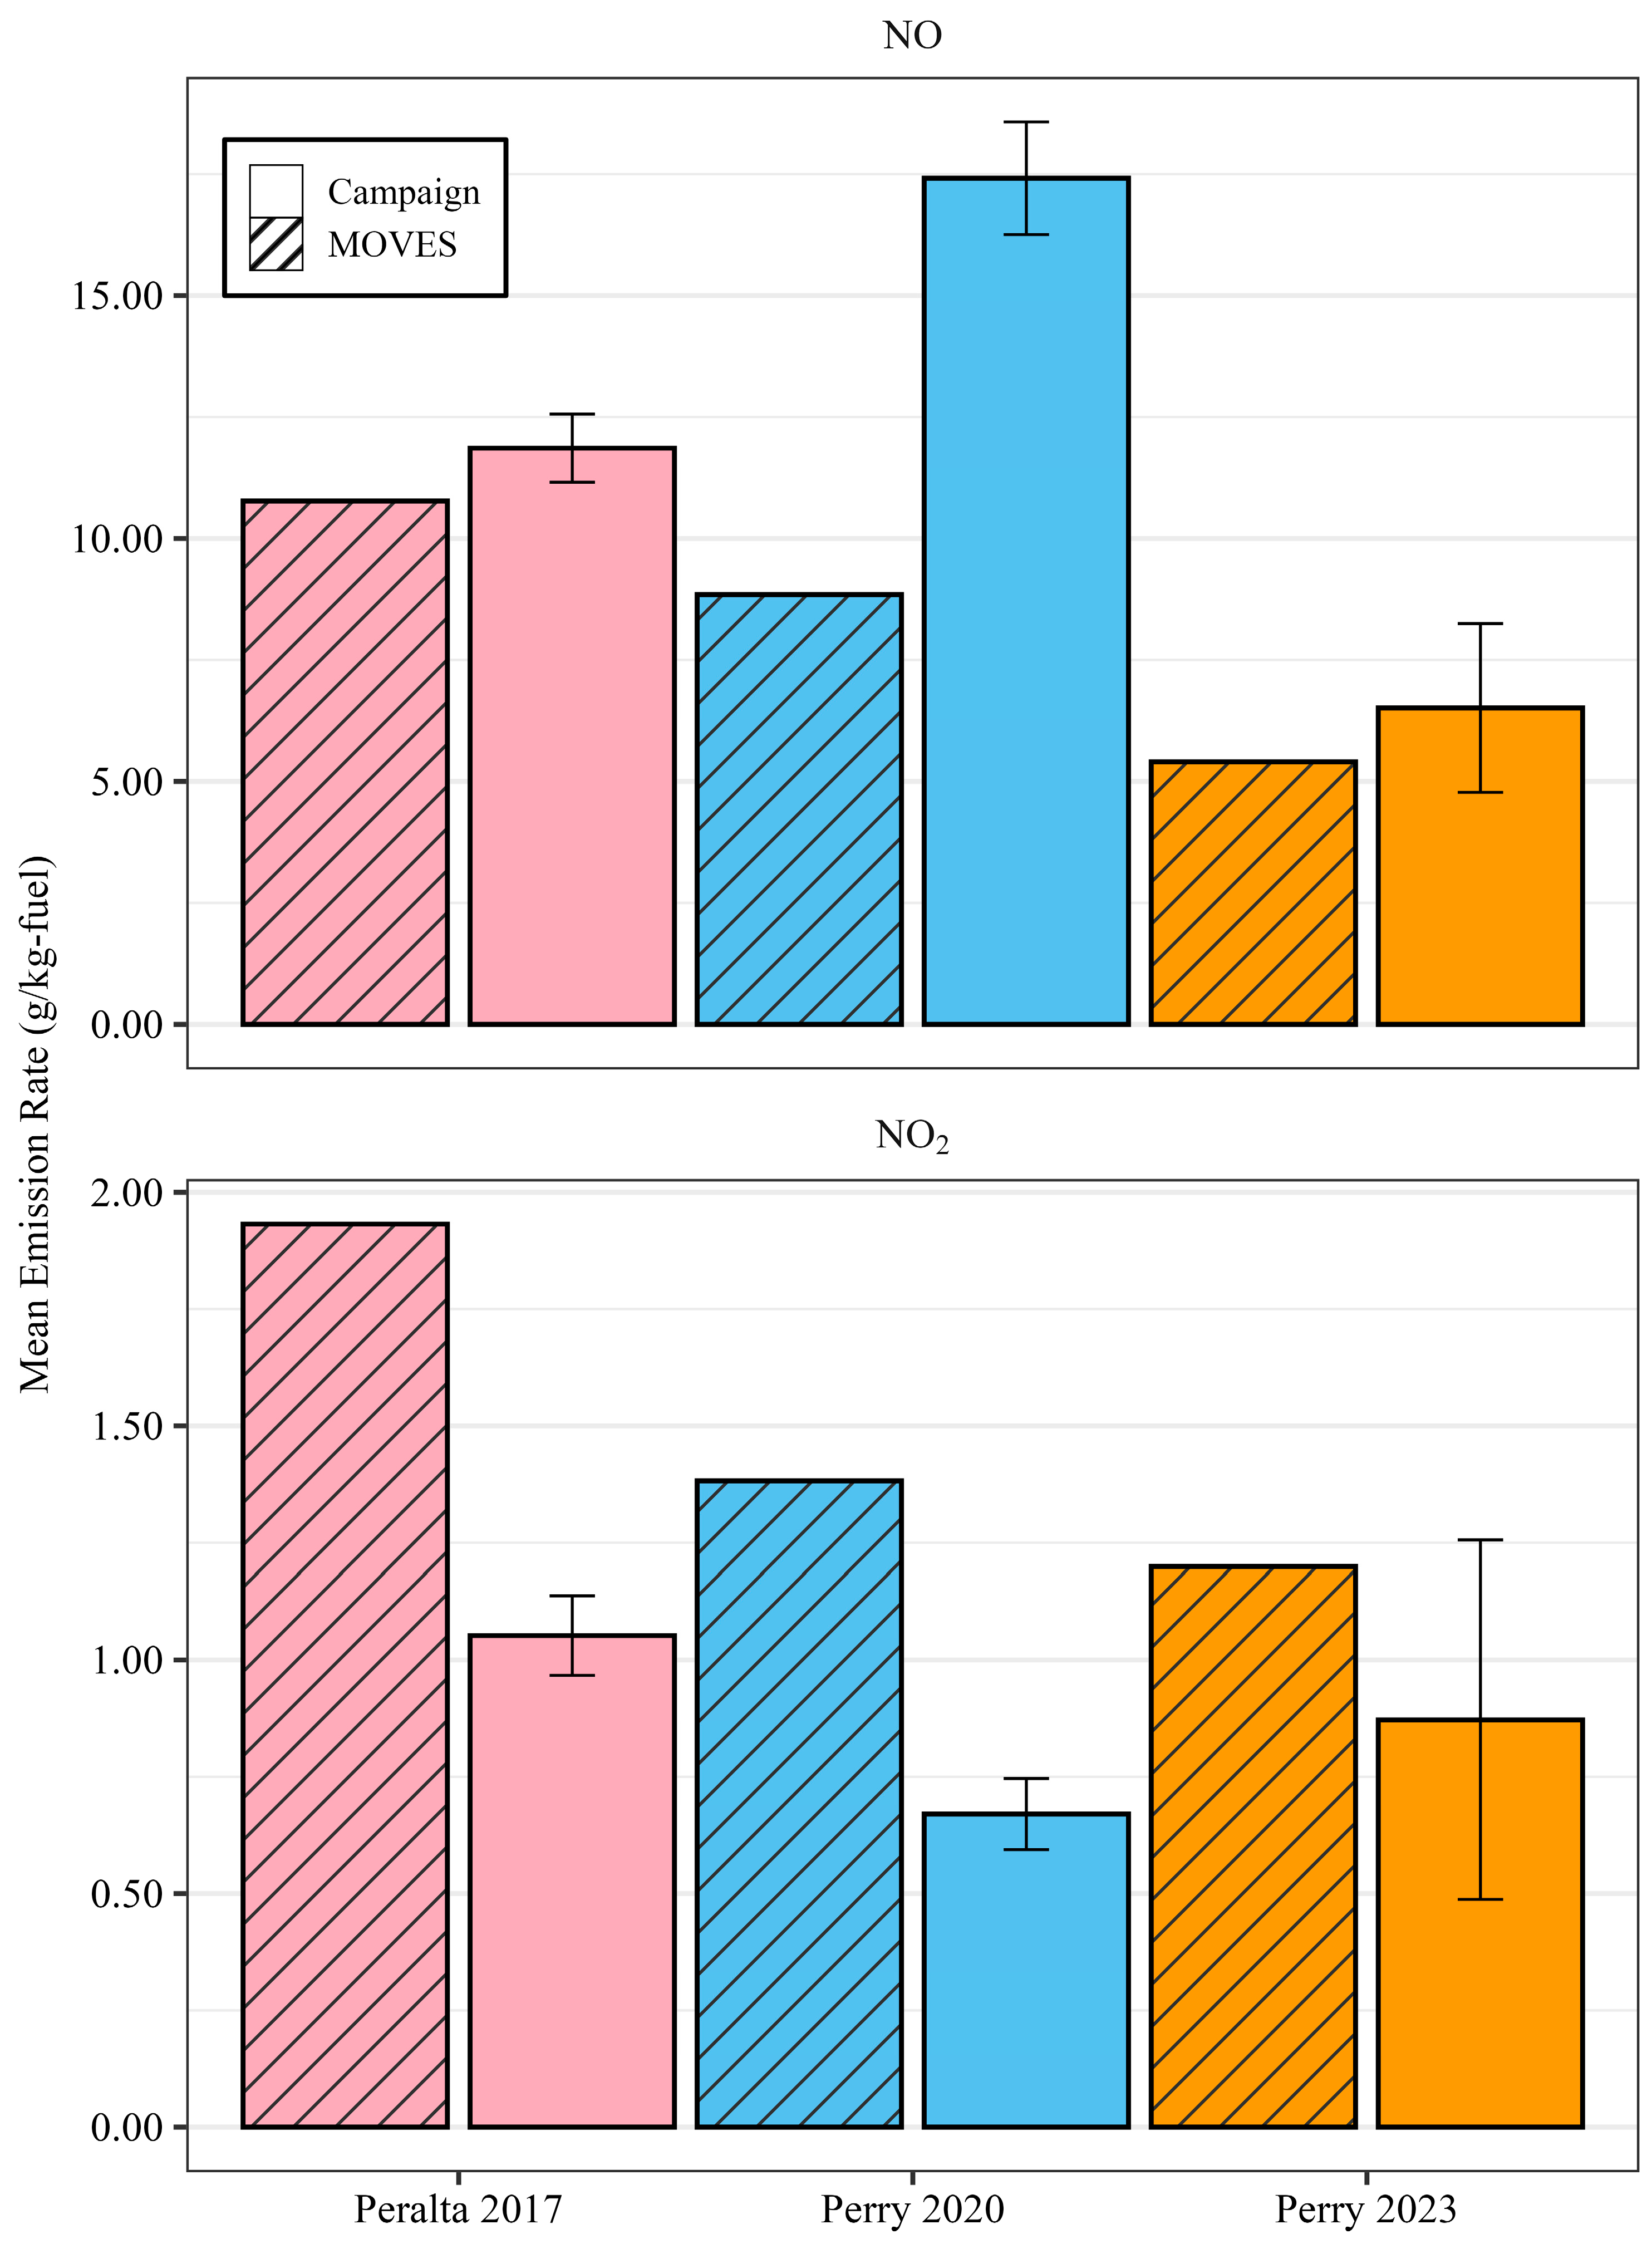
While fleet-wide NOx trends varied across campaigns, both real-world emissions of NO and NO2 and their MOVES5 estimates consistently followed similar trends within each campaign. Figure 4 illustrates fleet-wide average NO and NO2 emission measurements and estimates for each campaign. MOVES5 consistently underestimates mean NO emissions for each campaign. MOVES5 predicts 9% lower emissions than measured for the Peralta 2017 campaign, 49% lower than measured for the Perry 2020 campaign, and 17% lower than measured for the Perry 2023 campaign. Consistent with observations from NOx emissions, the Perry 2020 campaign has the most significant difference between MOVES5-predicted NO and campaign data. Contrary to the NO fleet-wide trends, MOVES5 consistently overpredicts fleet-wide mean NO2 emissions for each campaign. MOVES5 predicts 84% higher mean NO2 emissions than measured for the Peralta 2017 campaign, 106% higher than measured for the Perry 2020 campaign, and 38% higher than measured for the Perry 2023 campaign. Similarly to the trends observed for NOx and NO, the Perry 2020 campaign has the largest difference between MOVES5 estimates and real-world measurements for NO2. We again attribute this observation to NOx conversion catalyst deficiencies observed for HD diesel vehicles during cold ambient temperatures and MOVES5 lack of adjustments for cold-weather NOx for pre-2027 model year vehicles.
To estimate NO and NO2 emission separately, the MOVES model applies the appropriate NO/NOx or NO2/NOx ratios (in model year groups) to the NOx emission rate. MOVES5 updated the NO/NOx and NO2/NOx ratios from Preble et al. (2019) [28], which collected HD diesel measurements from two locations in Southern California. Ratios are separated by four different model year groups, which indicate changes in emission control technology that have been shown to have a significant change to NO/NOx and NO2/NO ratios [28,29]. Table 3 and Table 4 show the current NO/NOx and NO2/NOx ratios used in MOVES5 against the observed ratios for each of the three campaigns, calculated using bootstrap resampling. Generally, the MOVES5 NO/NOx ratios are higher than what was observed in each campaign by a significant margin. The MOVES5 NO2/NOx ratios are typically lower than real-world measurements, though the differences are less distinct than the NO2/NOx ratios. The higher NO/NOx and lower NO2/NOx ratios are most significantly observed in the model year 2010–2024 group, where most data reside for each campaign. NO/NOx ratios may include values over 1 in the 95% CI. As previously noted, FEAT may occasionally calculate negative emission rates relative to CO2 if negligible emissions are present for a pollutant. To avoid skewing overall results, ratios were not restricted to be ≤1. This highlights the variability in collecting roadside measurements.
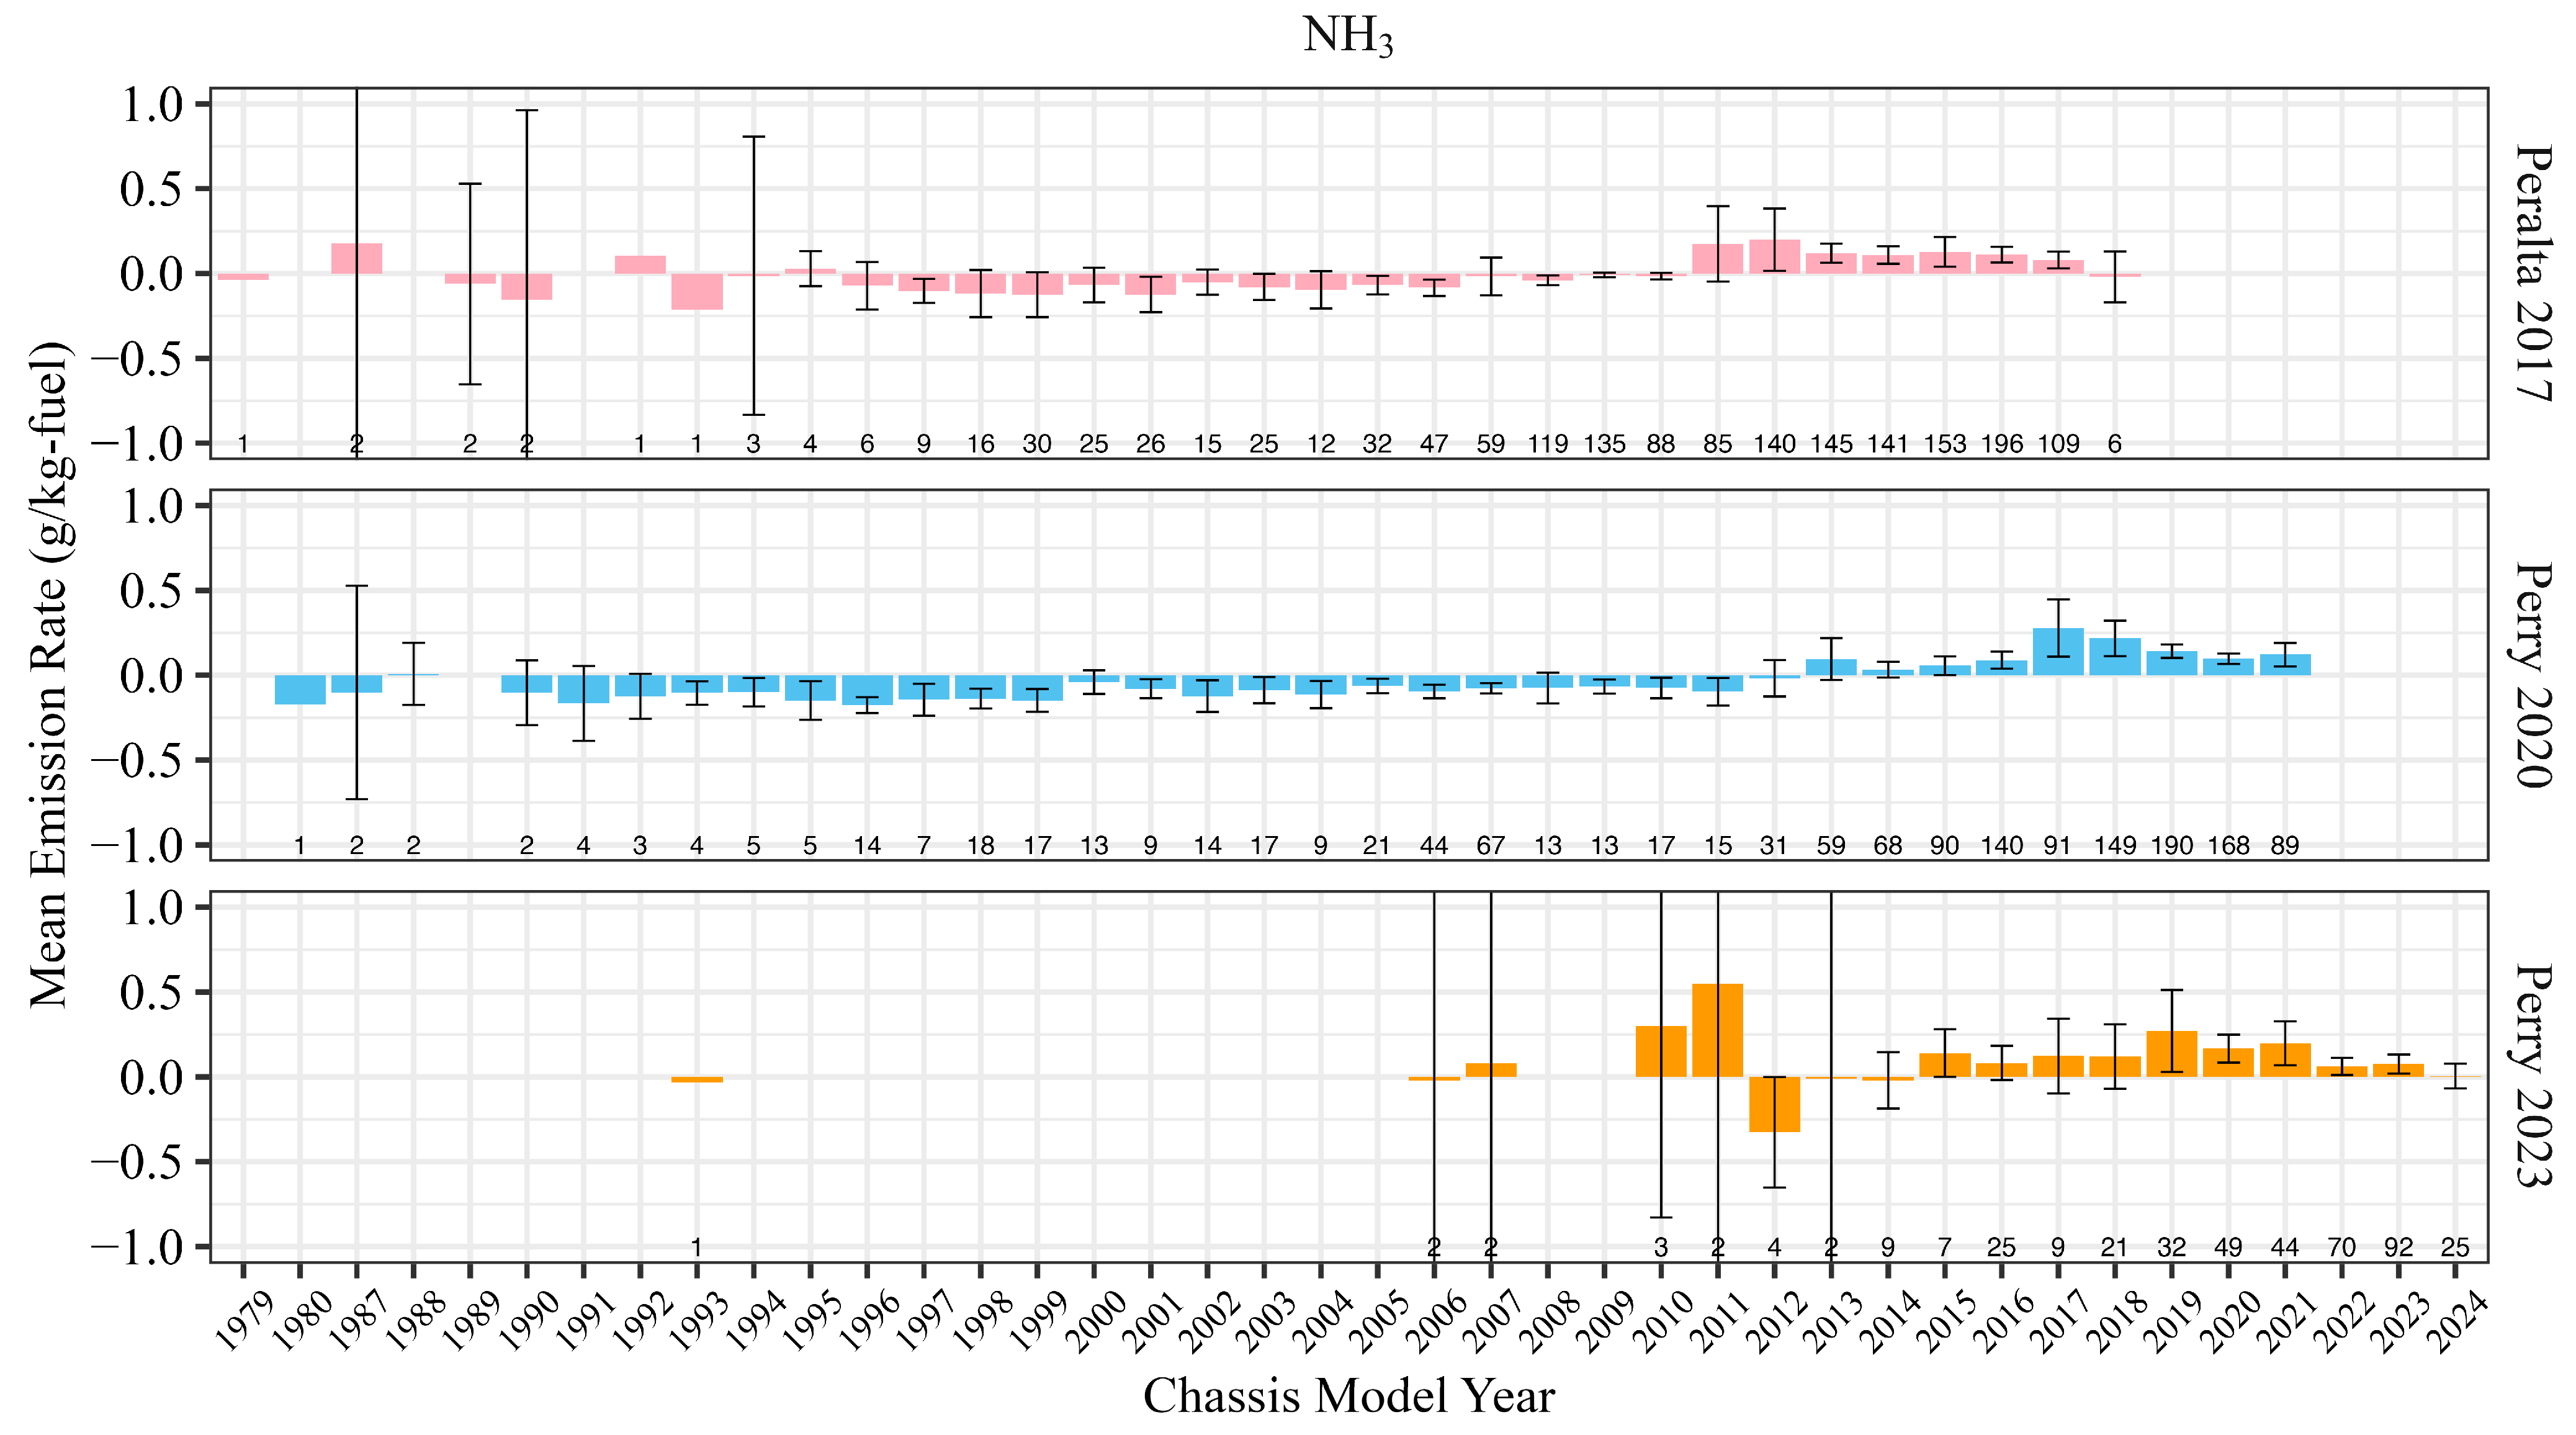
HD diesel vehicles had little to no NH3 emissions before NOx control technology (SCRs) was introduced in engine model year 2010 (chassis model year 2011). SCRs use a urea (NH3) injection that reacts with NOx, reducing engine-out NOx emissions. If the SCR system injects too much urea for what is needed to reduce NOx, it could result in increased tailpipe NH3 emissions. Because this system did not exist in engine model years older than 2010, NH3 emissions are often negligible for earlier than 2011 chassis model years. During measurement campaigns, FEAT may sometimes register negative emission rates for vehicles where pollutant emissions are very small or negligible relative to CO2. To account for these negative emission rates in earlier vehicle model years, average fleet-wide NH3 emissions in Figure 5 were calculated using model year cut offs specific to each campaign. This adjustment decreases bias from early vehicle model years with negative emission rates that could have disproportionately decreased the fleet-wide average of measured NH3 emissions. Cut offs were identified by selecting the year where average NH3 emissions are positive (see Figure A1). For Peralta 2017, average NH3 emission rates become positive starting in model year 2011. For Perry 2020, the shift from positive to negative average NH3 emission rates occurs in model year 2013. For Perry 2023, this shift occurs in model year 2015.
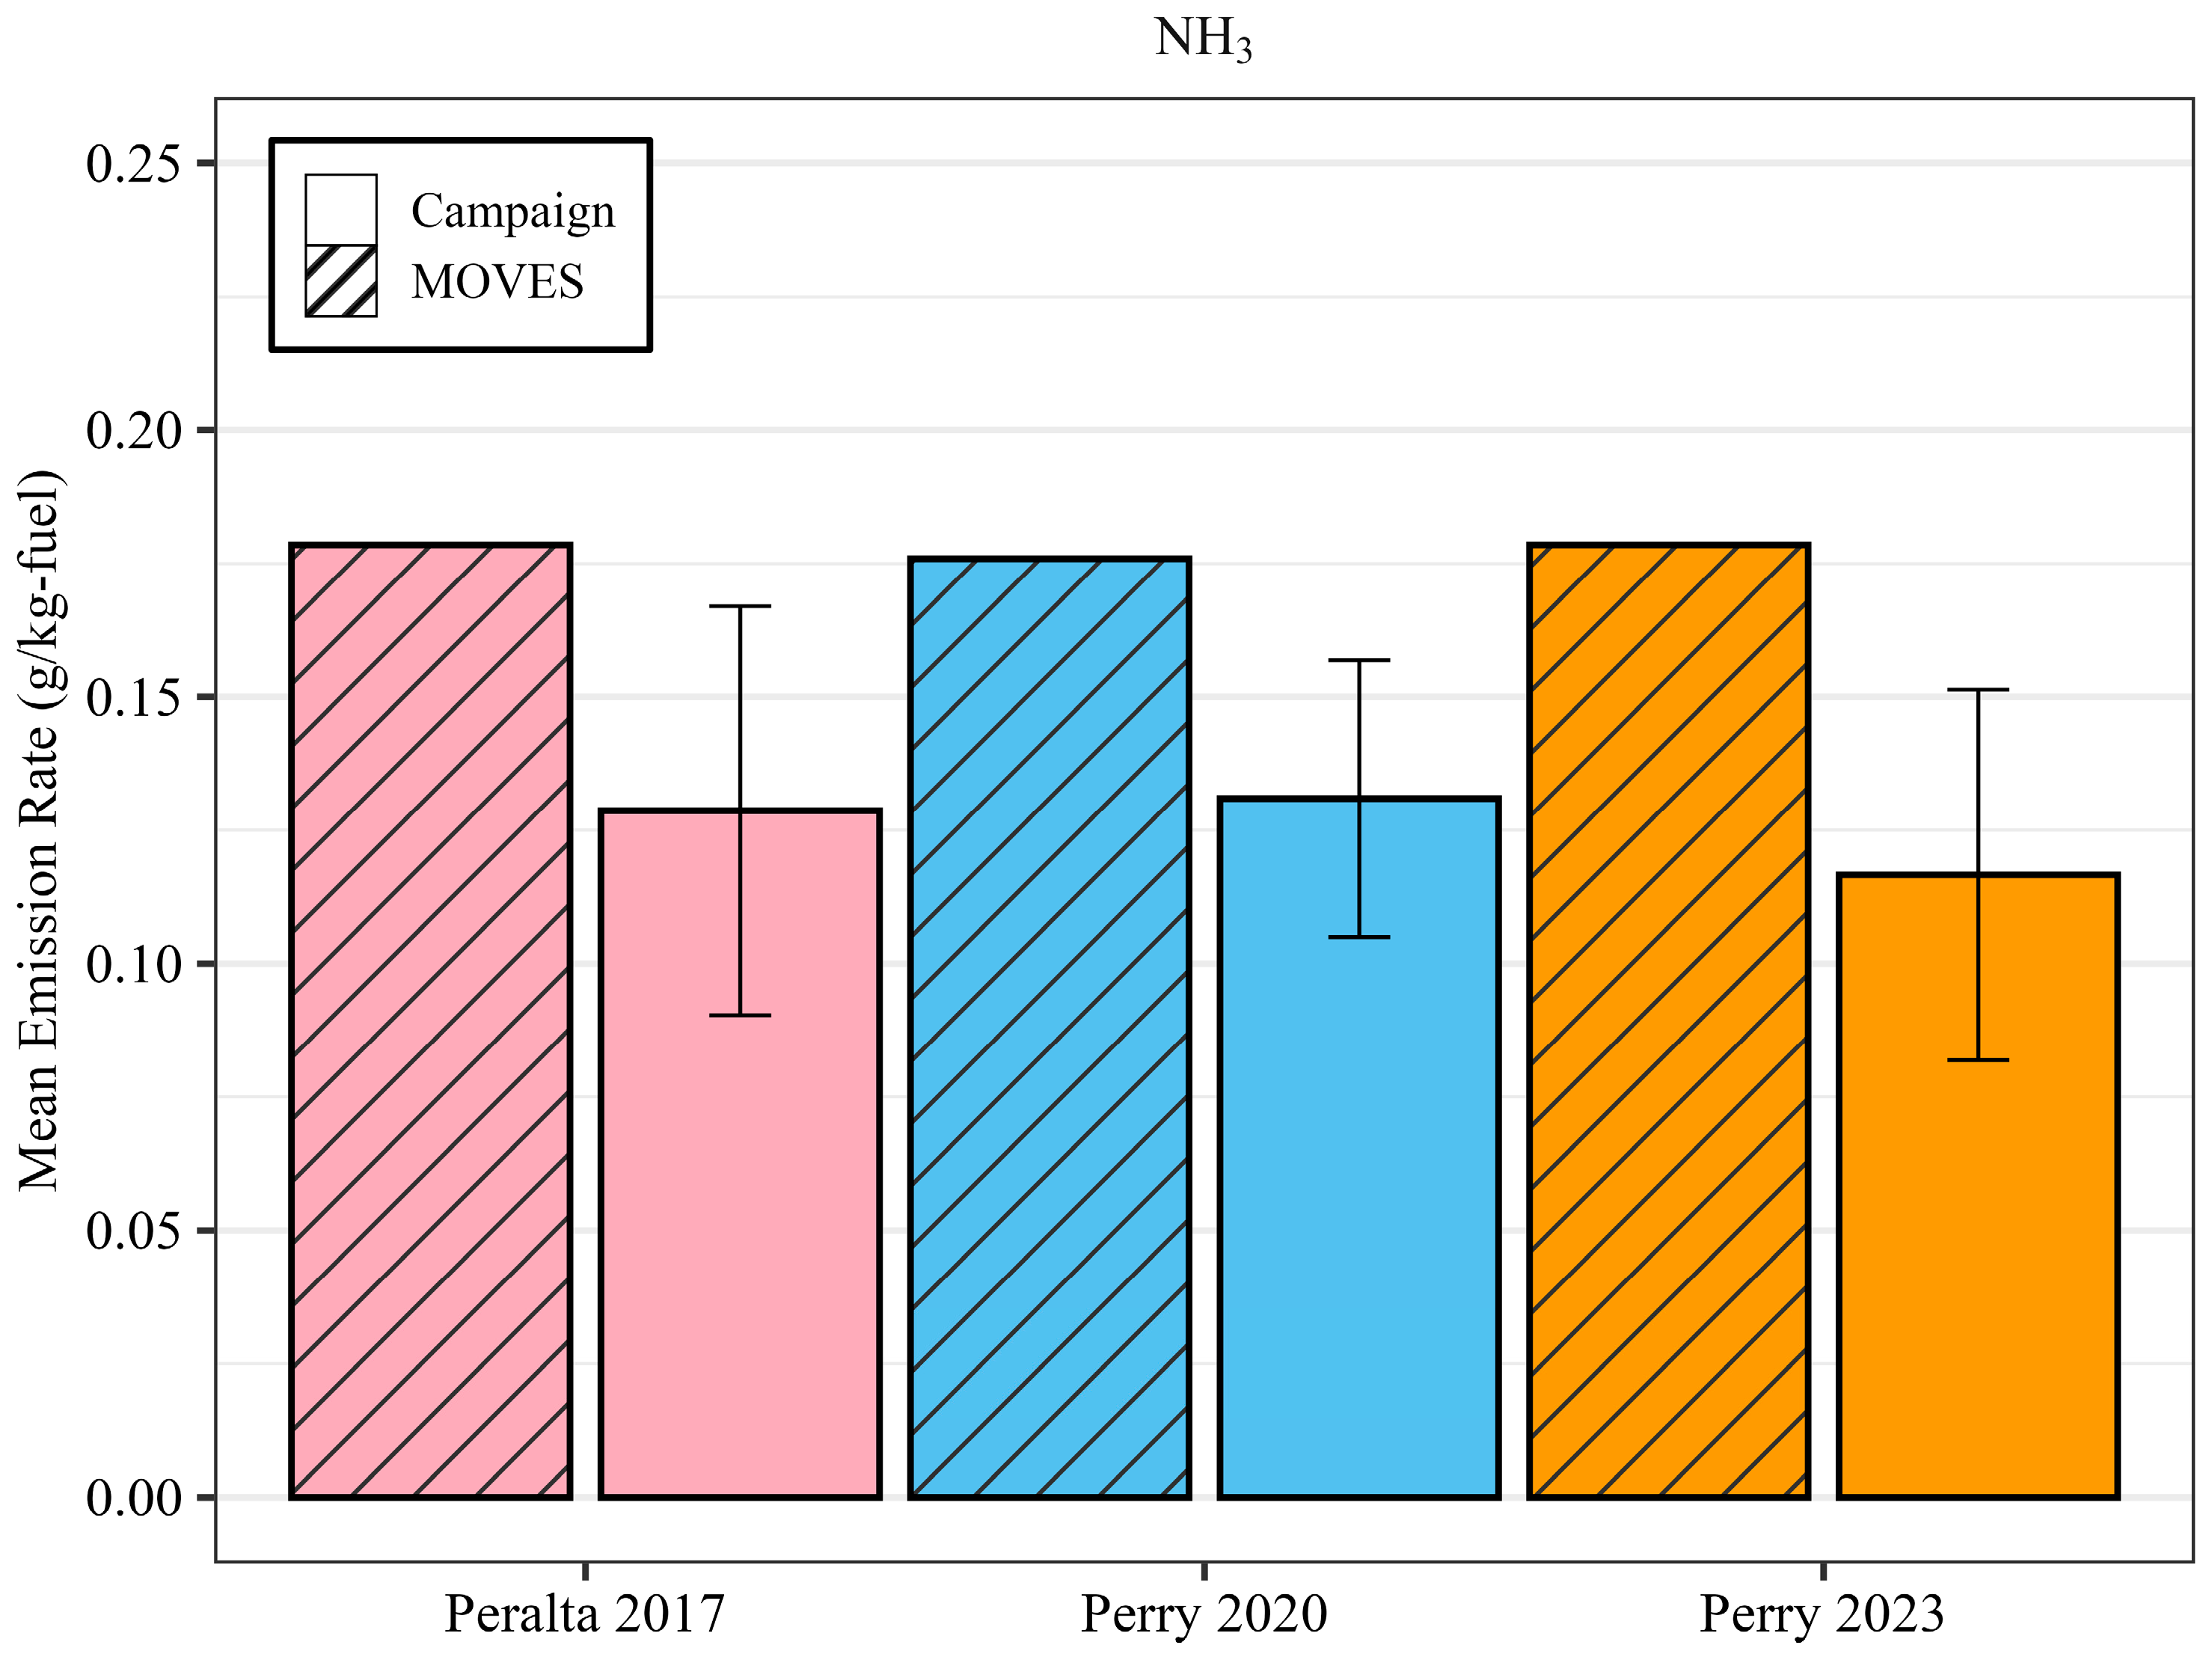
Figure 5 shows that MOVES5 consistently overestimates NH3 emissions for each campaign. MOVES5 overestimates mean NH3 emissions by 34% for both the Peralta 2017 and the Perry 2020 campaigns. For the Perry 2023 campaign, MOVES5 overestimates emissions by 38%. MOVES5 used HD diesel vehicle data from Preble et al. (2019) [28] to update NH3 emission rates, which were collected at the entrance to the Caldecott Tunnel and at the Port of Oakland near San Francisco. At the entrance to the Caldecott Tunnel, the vehicles are ascending a grade of 4% at average speeds of roughly 30 mph to 75 mph [28]. On-road measurement studies using portable emission measurement systems (PEMS) have shown that NH3 emissions from SCR-equipped trucks are emitted in short peaks when the exhaust temperature is high and during high-power transient engine operation when the exhaust temperature is sufficiently hot to inject urea [30,31]. The higher NH3 emission rates predicted by MOVES compared to this study could be due to the higher fuel-based NH3 emission rates measured at the Caldecott Tunnel due to higher load of the trucks at the Caldecott Tunnel.
Though we might expect that the more stringent maintenance requirements for HD vehicles in California would cause MOVES5 to underestimate NH3 emissions, the opposite appears to be true. HD diesel vehicle emissions differ by location, operating condition, and general fleet composition. The NH3 emission rates used to calculate MOVES5 base emission rates were collected at one sampling location, where vehicles were generally operating under the same condition as samples were collected.

3.2. Model Year Trends

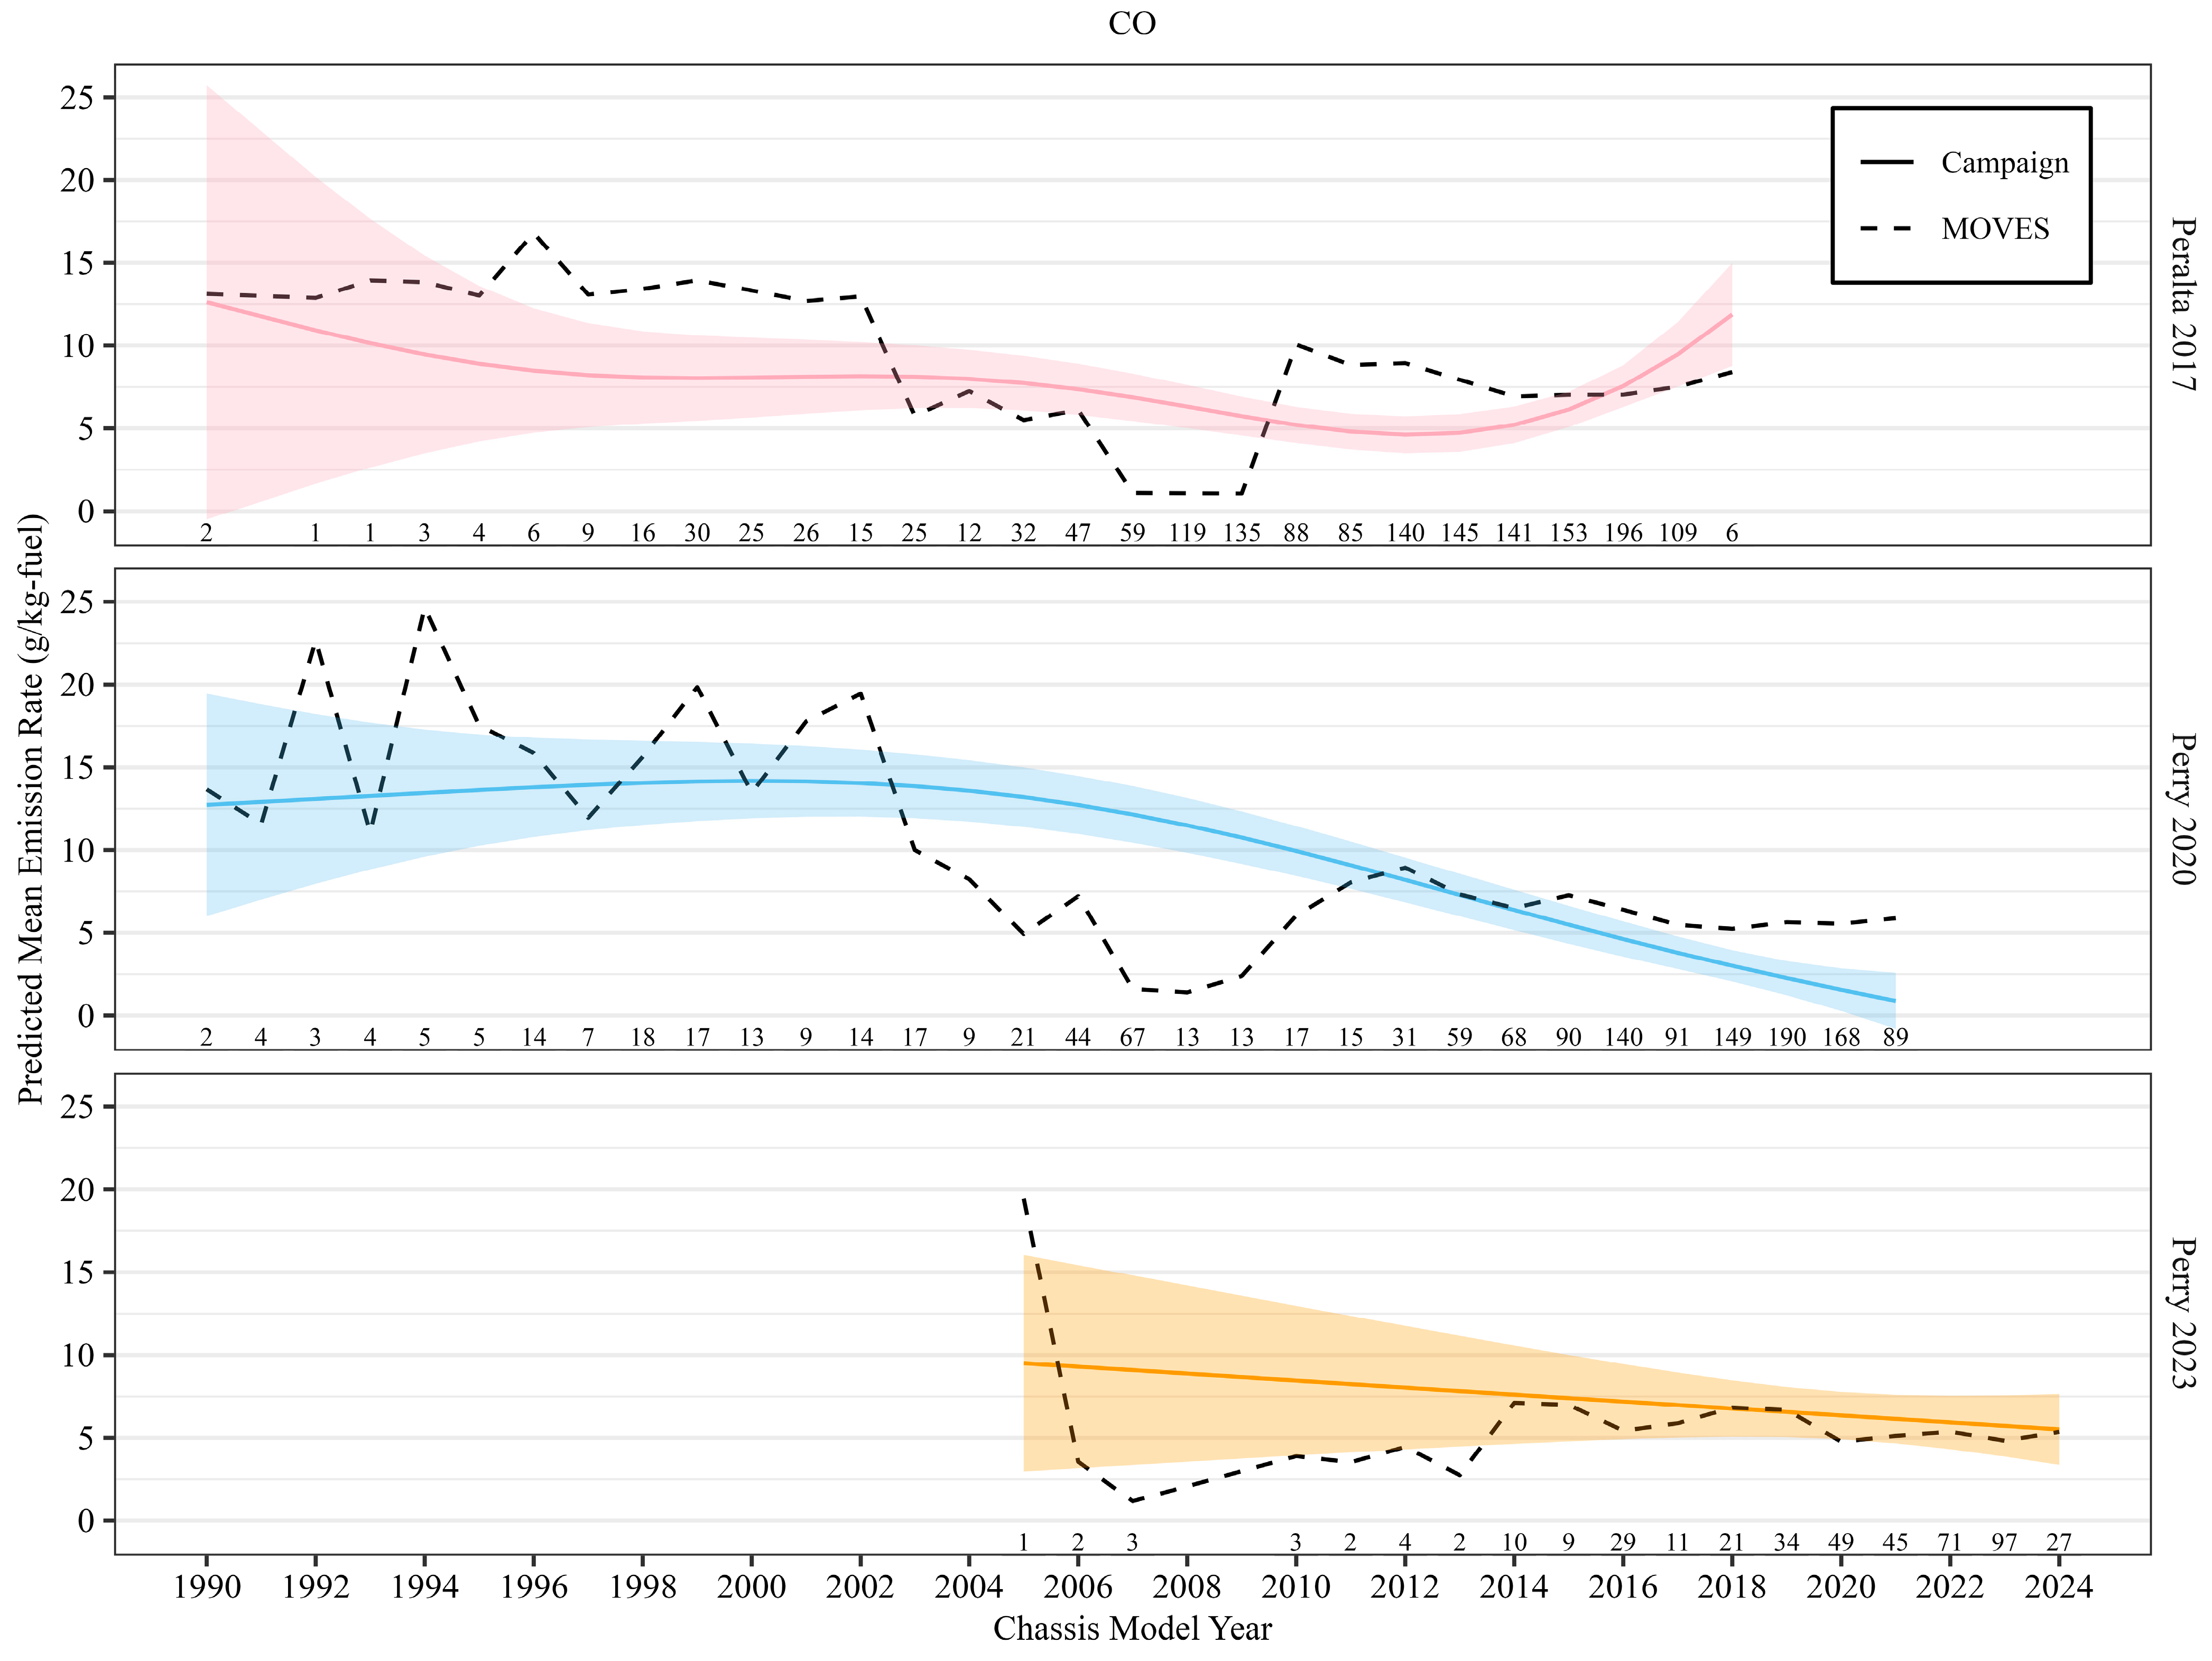
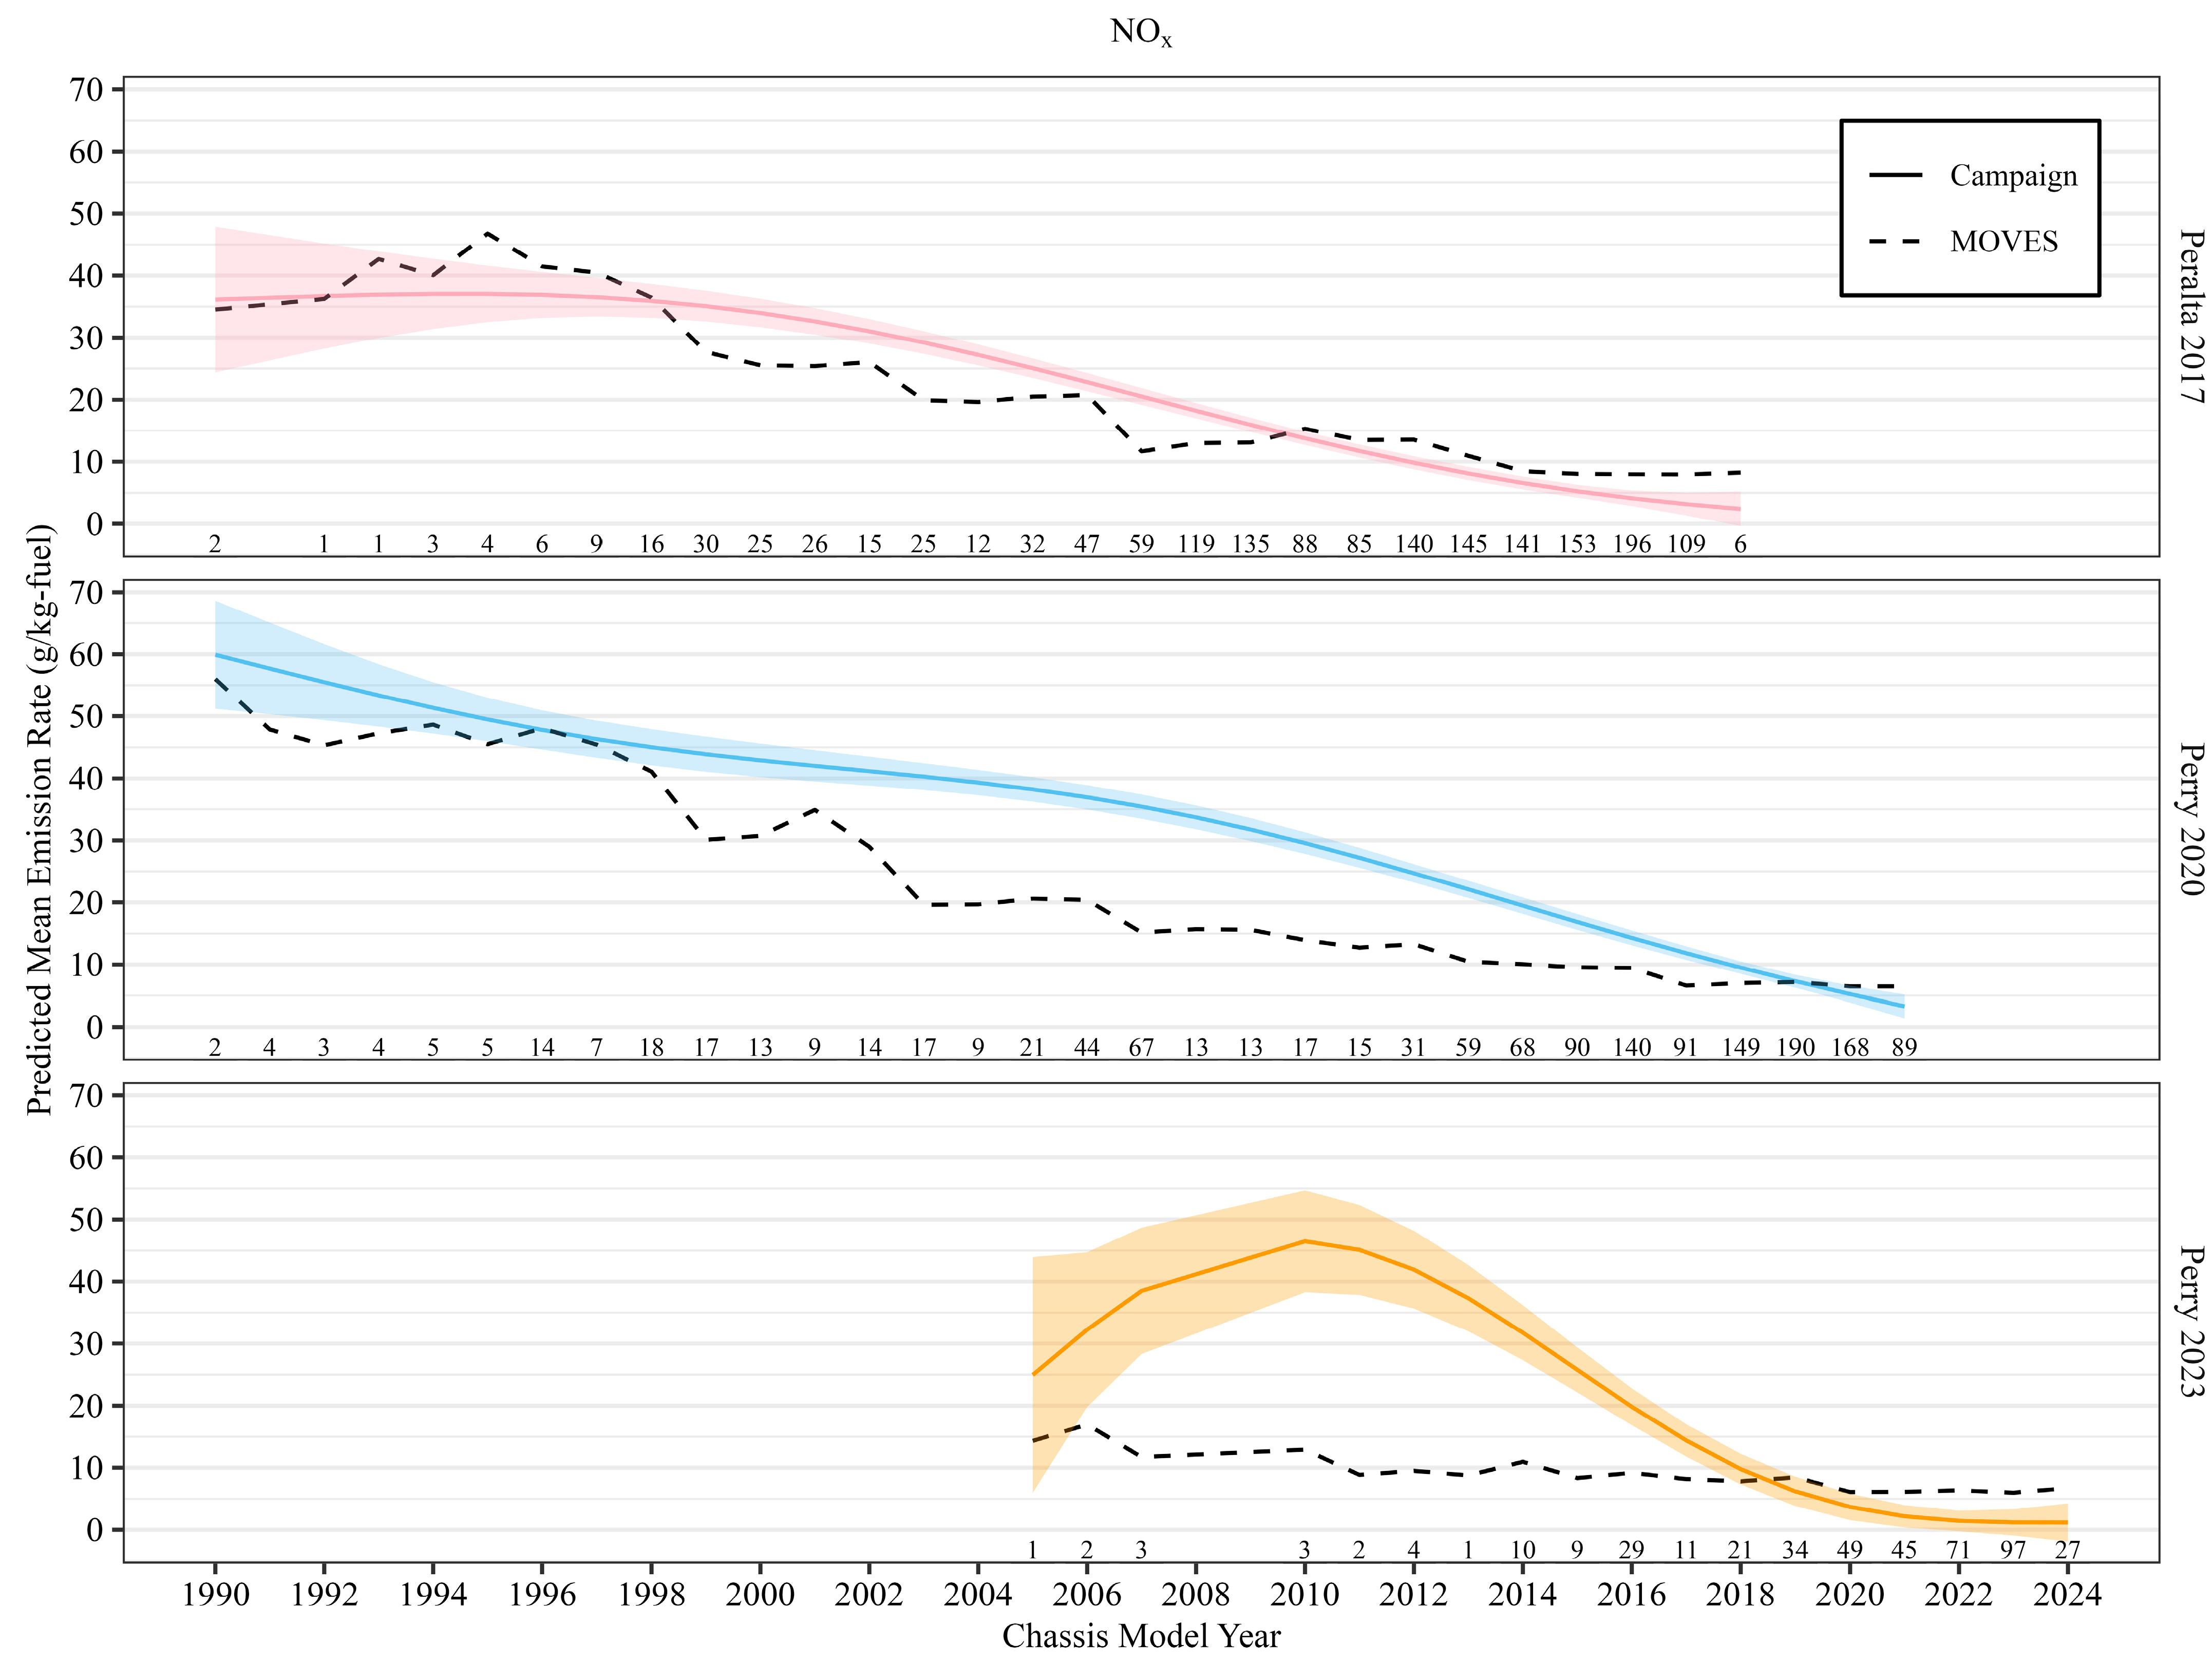
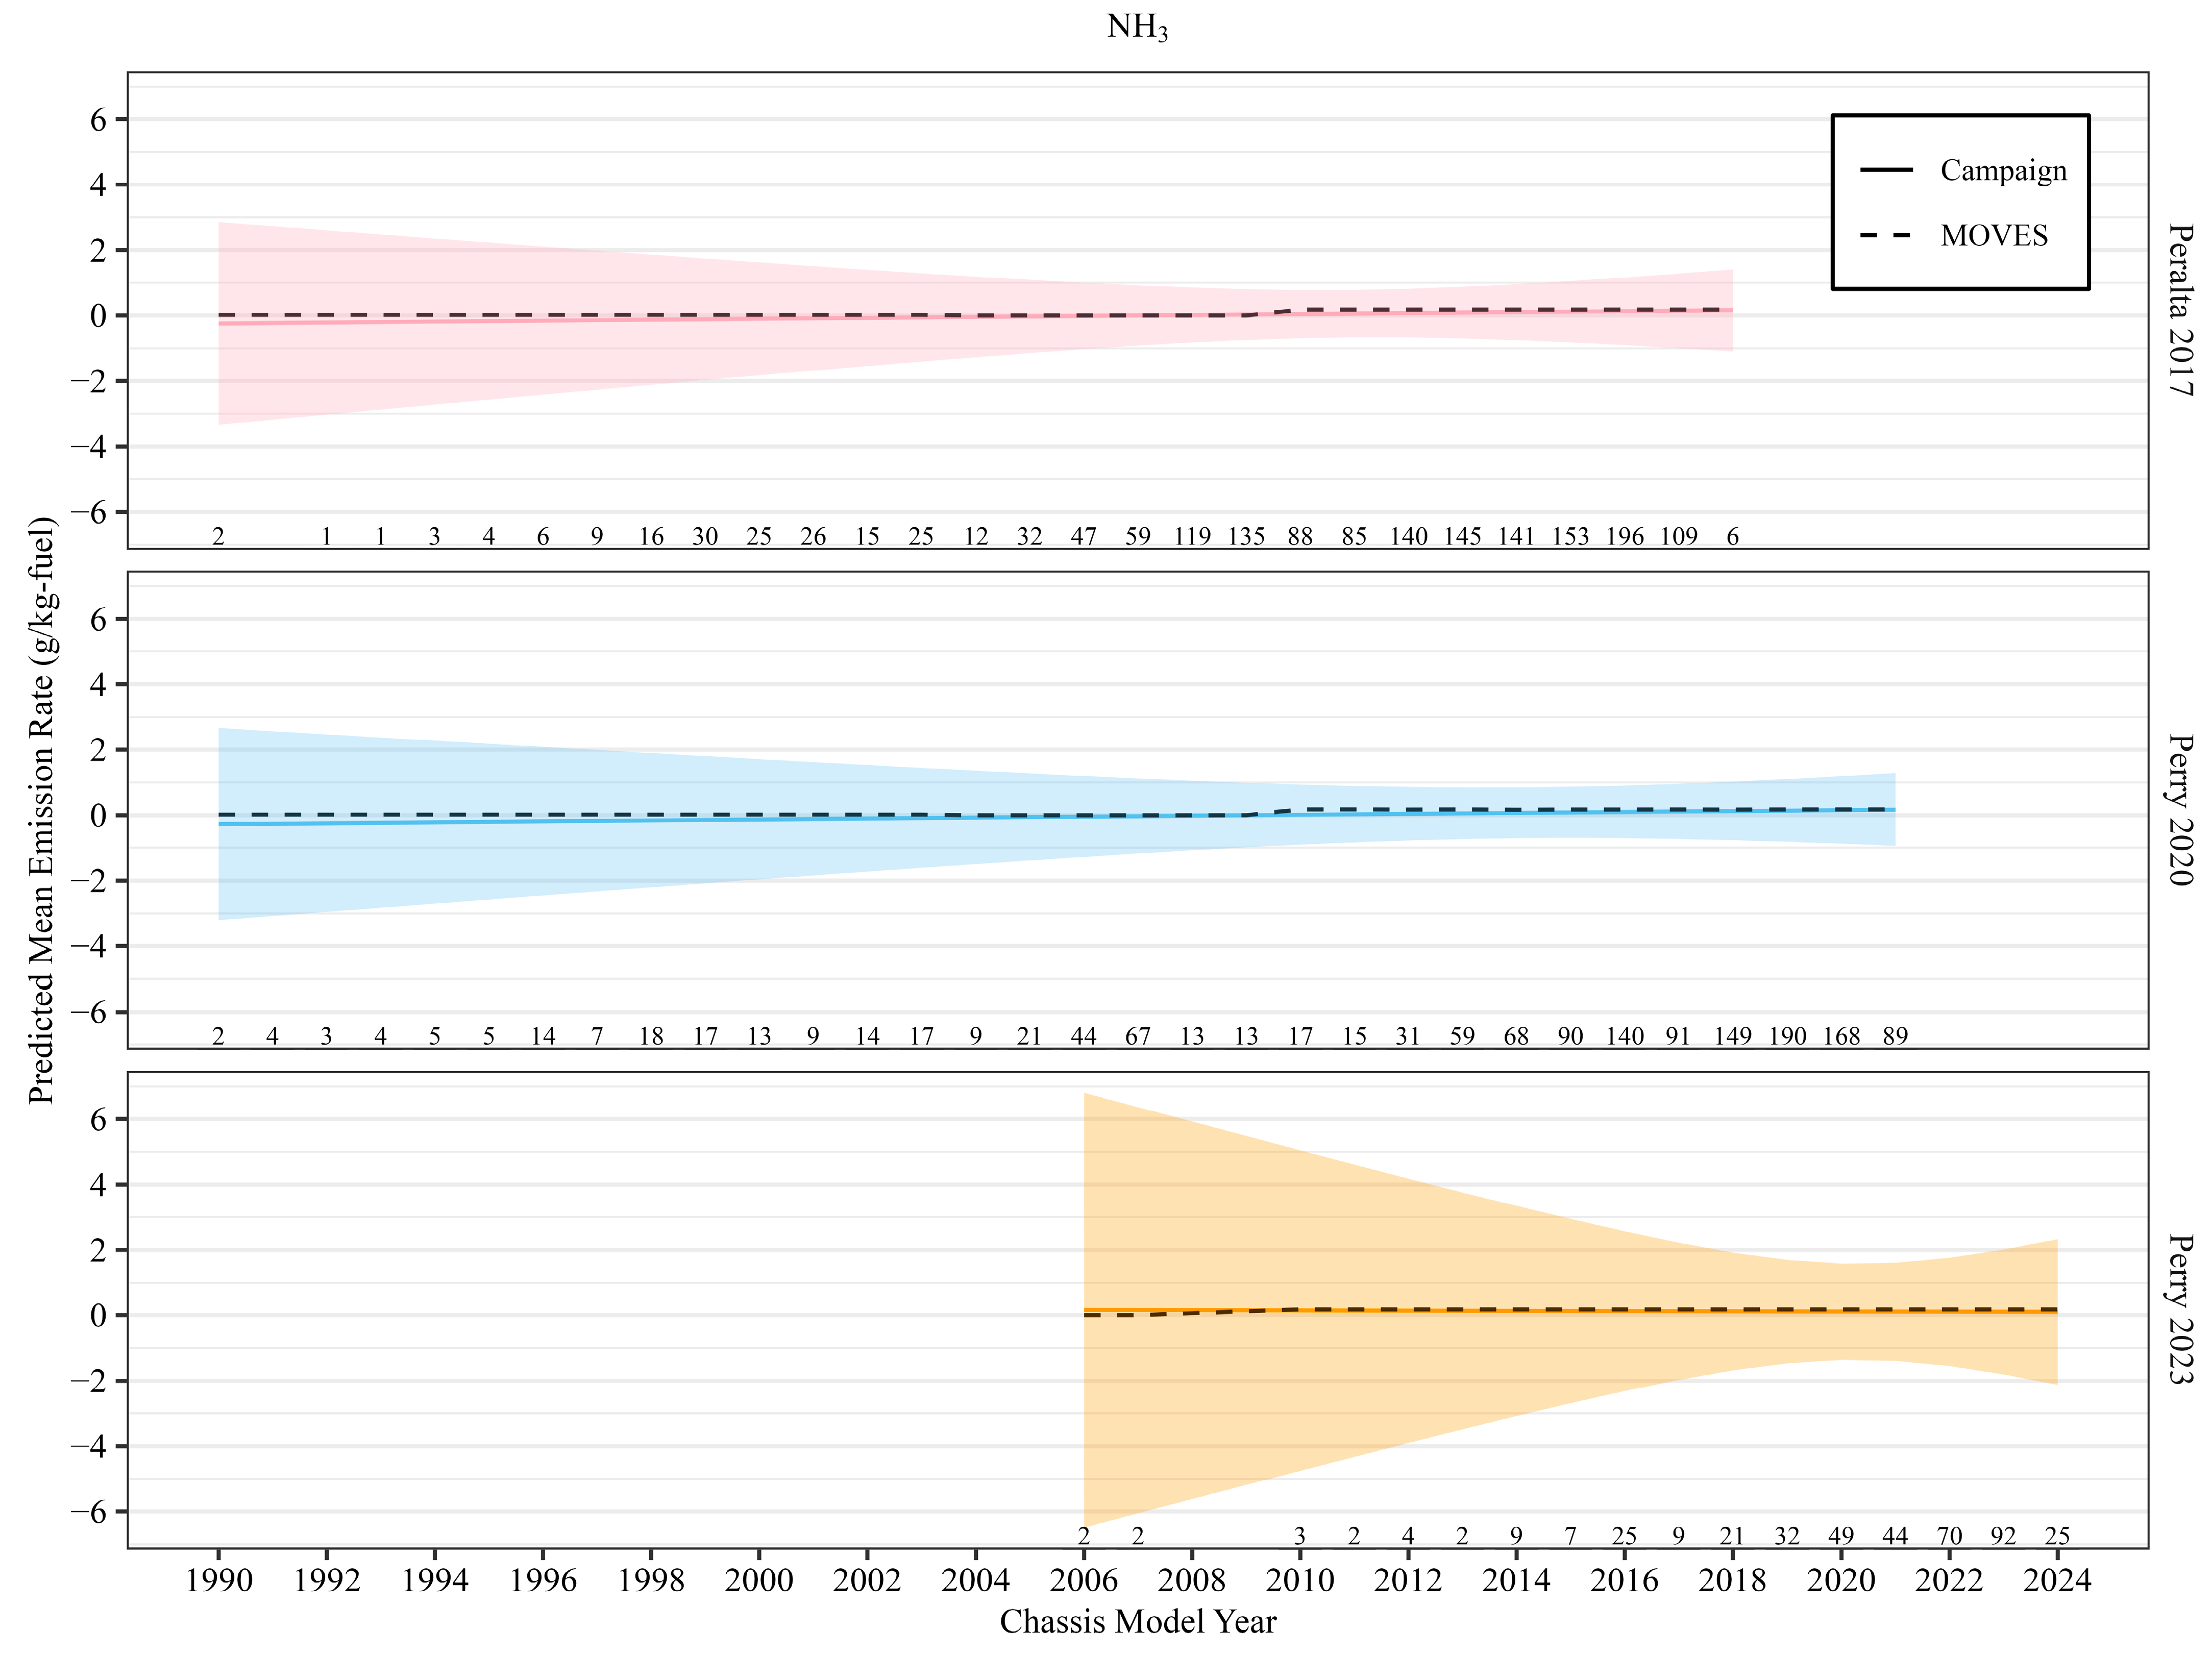
Emission trends by vehicle model year exhibit similar trends to fleet-wide averages for each pollutant. A GAM was fit to each campaign across vehicle model year. The GAM estimates the mean emissions for each model year with a smoothing function (solid line). The shaded ribbon represents 95% CIs of the mean predicted emission rate. For this comparison, data from the Perry 2023 campaign were limited to model years 2005 and newer, where most of the data are present. The Perry 2023 campaign only contained three vehicles with model years before 2005. MOVES5 estimates were averaged by individual vehicle model years and plotted using at dashed black line for each campaign. The number on the x-axis above the model year represents the number of vehicles measured with that model year.
Figure 6 shows MOVES5-estimated mean CO emissions relative to GAM-predicted mean CO emissions across measured model years. For all campaigns, MOVES5’s ability to estimate predicted mean CO emissions varies across vehicle model year. Generally, MOVES5 overestimated mean predicted CO emissions for the oldest and newest model years (Peralta 2017 and Perry 2020). In the middle range of model years, MOVES5 underestimates mean CO emissions compared to GAM predictions. For Perry 2023, MOVES5 consistently underestimated mean predicted CO emissions for model years 2006 to 2013. However, because of small sample sizes for those earlier model year groups, that trend is uncertain. For model years 2014 to 2024, where most of the data are, MOVES5 performed well and estimated mean CO emissions were within the 95% CI of the predicted means.
Figure 7 compares MOVES5-estimated and GAM-predicted NOX emission rates by vehicle model year for each campaign. Across all campaigns, MOVES5 generally underestimates NOX for older vehicles and overestimates for newer ones, suggesting that MOVES5 may not fully capture deterioration effects or real-world performance improvements in the most recent model years. In Perry 2020, MOVES5 underestimated mean predicted NOX emissions for most model years, consistent with the fleet-wide underestimation shown in Figure 3. In contrast, Perry 2023 shows good fleet-level agreement overall but diverges at the model-year level. MOVES5 underestimates emissions for mid-aged vehicles (2006–2017) and overestimates for the newest model years (2020–2024). Similarly, MOVES5 overestimated predicted NOX emissions for the newest eight vehicle model years of the Peralta 2017 campaign. These discrepancies likely reflect differences in real-world operating conditions, emission control degradation, and the limited number of older vehicles sampled, which together influence both MOVES5 projections and roadside measurements.
Across all campaigns, MOVES5 underestimates predicted mean NOx emissions from older HD vehicles and overestimates predicted mean NOx emissions from the newest HD vehicles. These compensating errors resulted in MOVES estimating the fleet average emission rates for Peralta and Perry 2023 accurately. The model year differences were much greater, ranging from 0.11% to nearly 400%. Because there is a varied difference in the emission rates by model year, the age distribution of the fleet has an important influence on the comparison of the fleet average measured and MOVES-estimated emission rates. Additionally, accounting for a one-year lag between the engine and chassis model year would increase the emissions from the MOVES fleet average emission rates and would likely have a measurable impact on the comparison. Although not conducted by MOVES, EMFAC2021 developed by the California Air Resources Board [18] accounts for the lag between the engine and chassis model years.
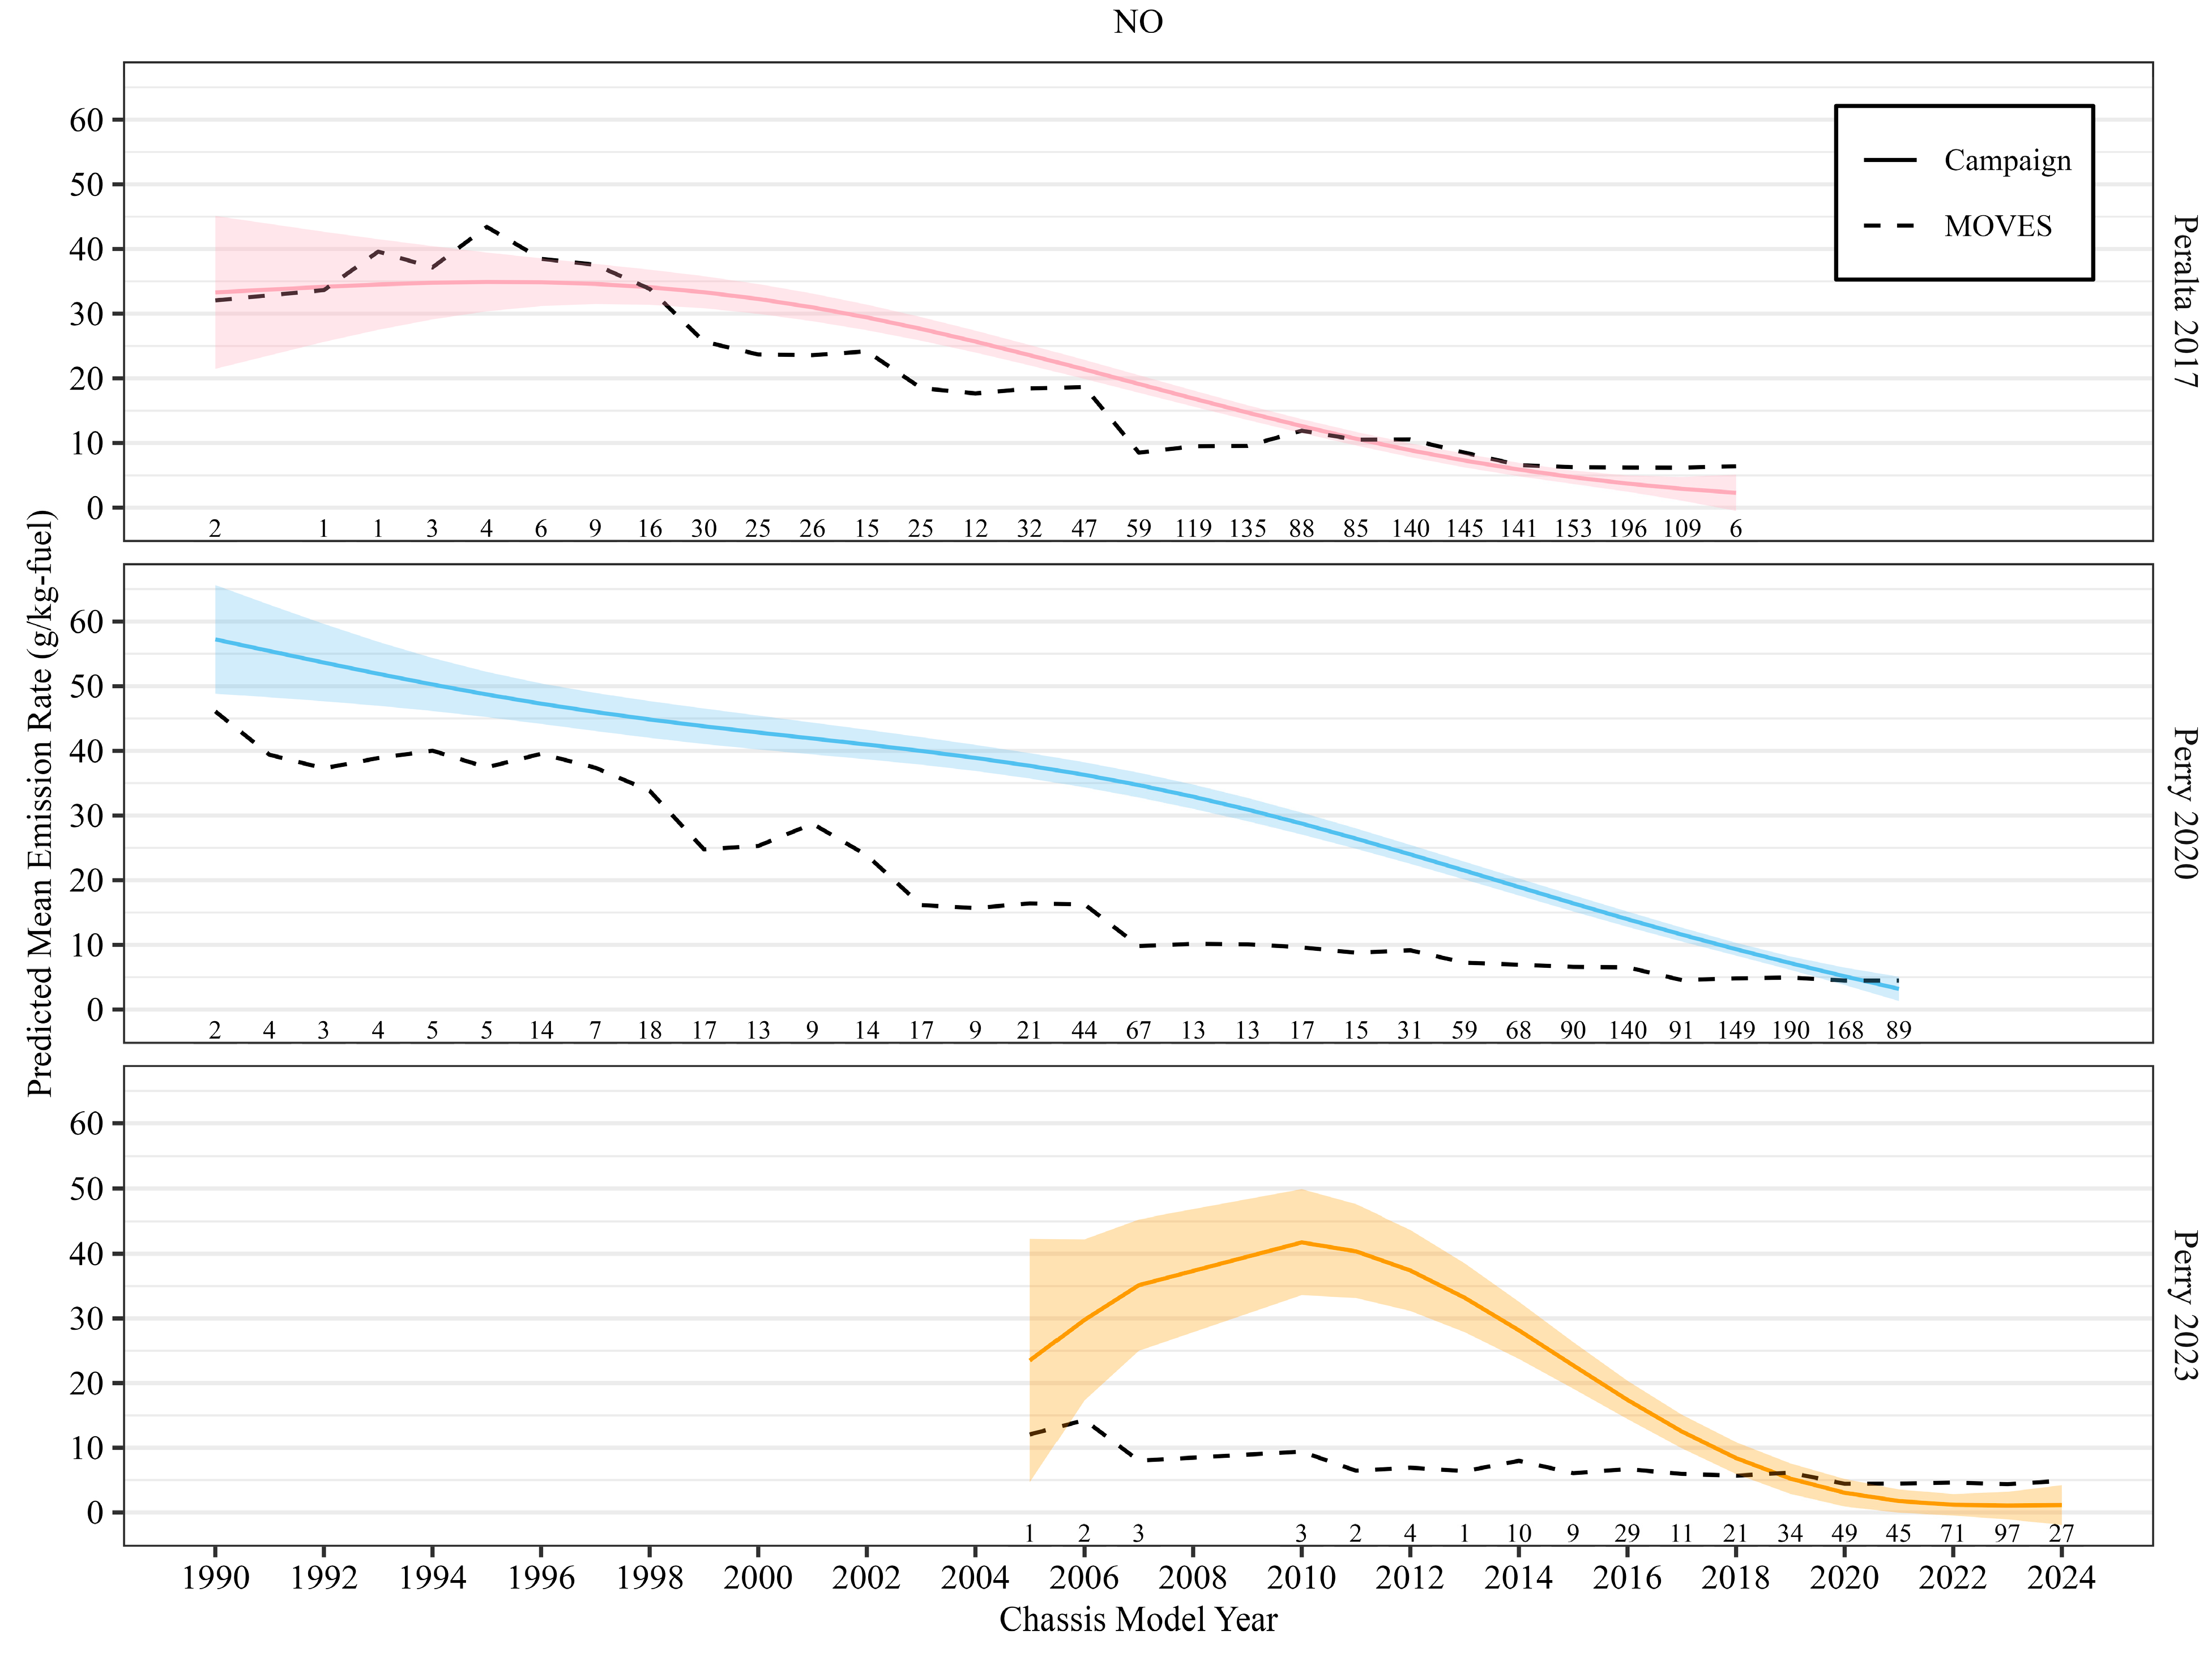
HD NO emission estimates by model year from MOVES5 follow the same pattern as NOx estimates by model year, as NOx emitted from vehicles is primarily NO emissions (see Figure A2). GAM-predicted mean NO2 emission by model year differed slightly from fleet-wide trends (see Figure A3). MOVES5 estimates for NO2 were most accurate across older and newer model years and remained within 95% CIs of the predicted mean. However, MOVES5 consistently overestimated mean NO2 emissions for middle model years for Peralta 2017 (2007–2013) and Perry 2020 (2007–2015). For the Perry 2023 campaign, MOVES5-estimated NO2 was within the 95% CI of the predicted mean but followed a similar trend to NO and NOx, where NO2 emissions for older model years were underestimated and overestimated for newer model years.
Figure 8 shows GAM-predicted mean NH3 emissions relative to MOVES5-estimated mean NH3 emissions by vehicle model year. As previously discussed, HD diesel vehicles manufactured before 2010 did not emit much NH3 but began emitting more with the incorporation of SCR systems to reduce NOx emissions from the tailpipe. Figure 8 illustrates well the variability of roadside measurements for NH3 across model years. The trend for predicted average NH3 emissions across model years is different than fleet average trends (Figure 5). MOVES5-estimated NH3 emissions by model year are well within the uncertainty of all three campaigns.
Overall, the accuracy of MOVES5 to estimate emissions by vehicle model year varies by pollutant and campaign. Small sample sizes for older model years may contribute to this variability. The accuracy of MOVES5 for predicting fleet average emission rates may vary significantly based on the age distribution of the fleet. Older model years contribute far more emissions than expected by MOVES5 for NOx. MOVES5’s tendency to underpredict emissions for the oldest vehicle model years may be disproportionately lowering fleet average emissions. This distinction is critical, as states must quantify contributions of older vehicles to accurately predict statewide emissions, particularly in areas with a significant number of aging HD diesel vehicles on the road.

3.3. Regulatory Class Trends

Three regulatory classes can be used to define HD vehicles: Class 8 represents HHD, while Class 6 and 7 represent MHD. Additionally, some vehicles are classified as Gliders, which are new Class 8 chassis retrofit with old engines. Most of the fleets from each campaign consisted of Class 8, with a few Class 6 and Class 7 vehicles also present. Gliders were only identified in the Perry 2020 campaign. Due to the unique nature of gliders and the small amounts of data collected from them, we have decided to only include an analysis of the Perry 2020 data by regulatory class.
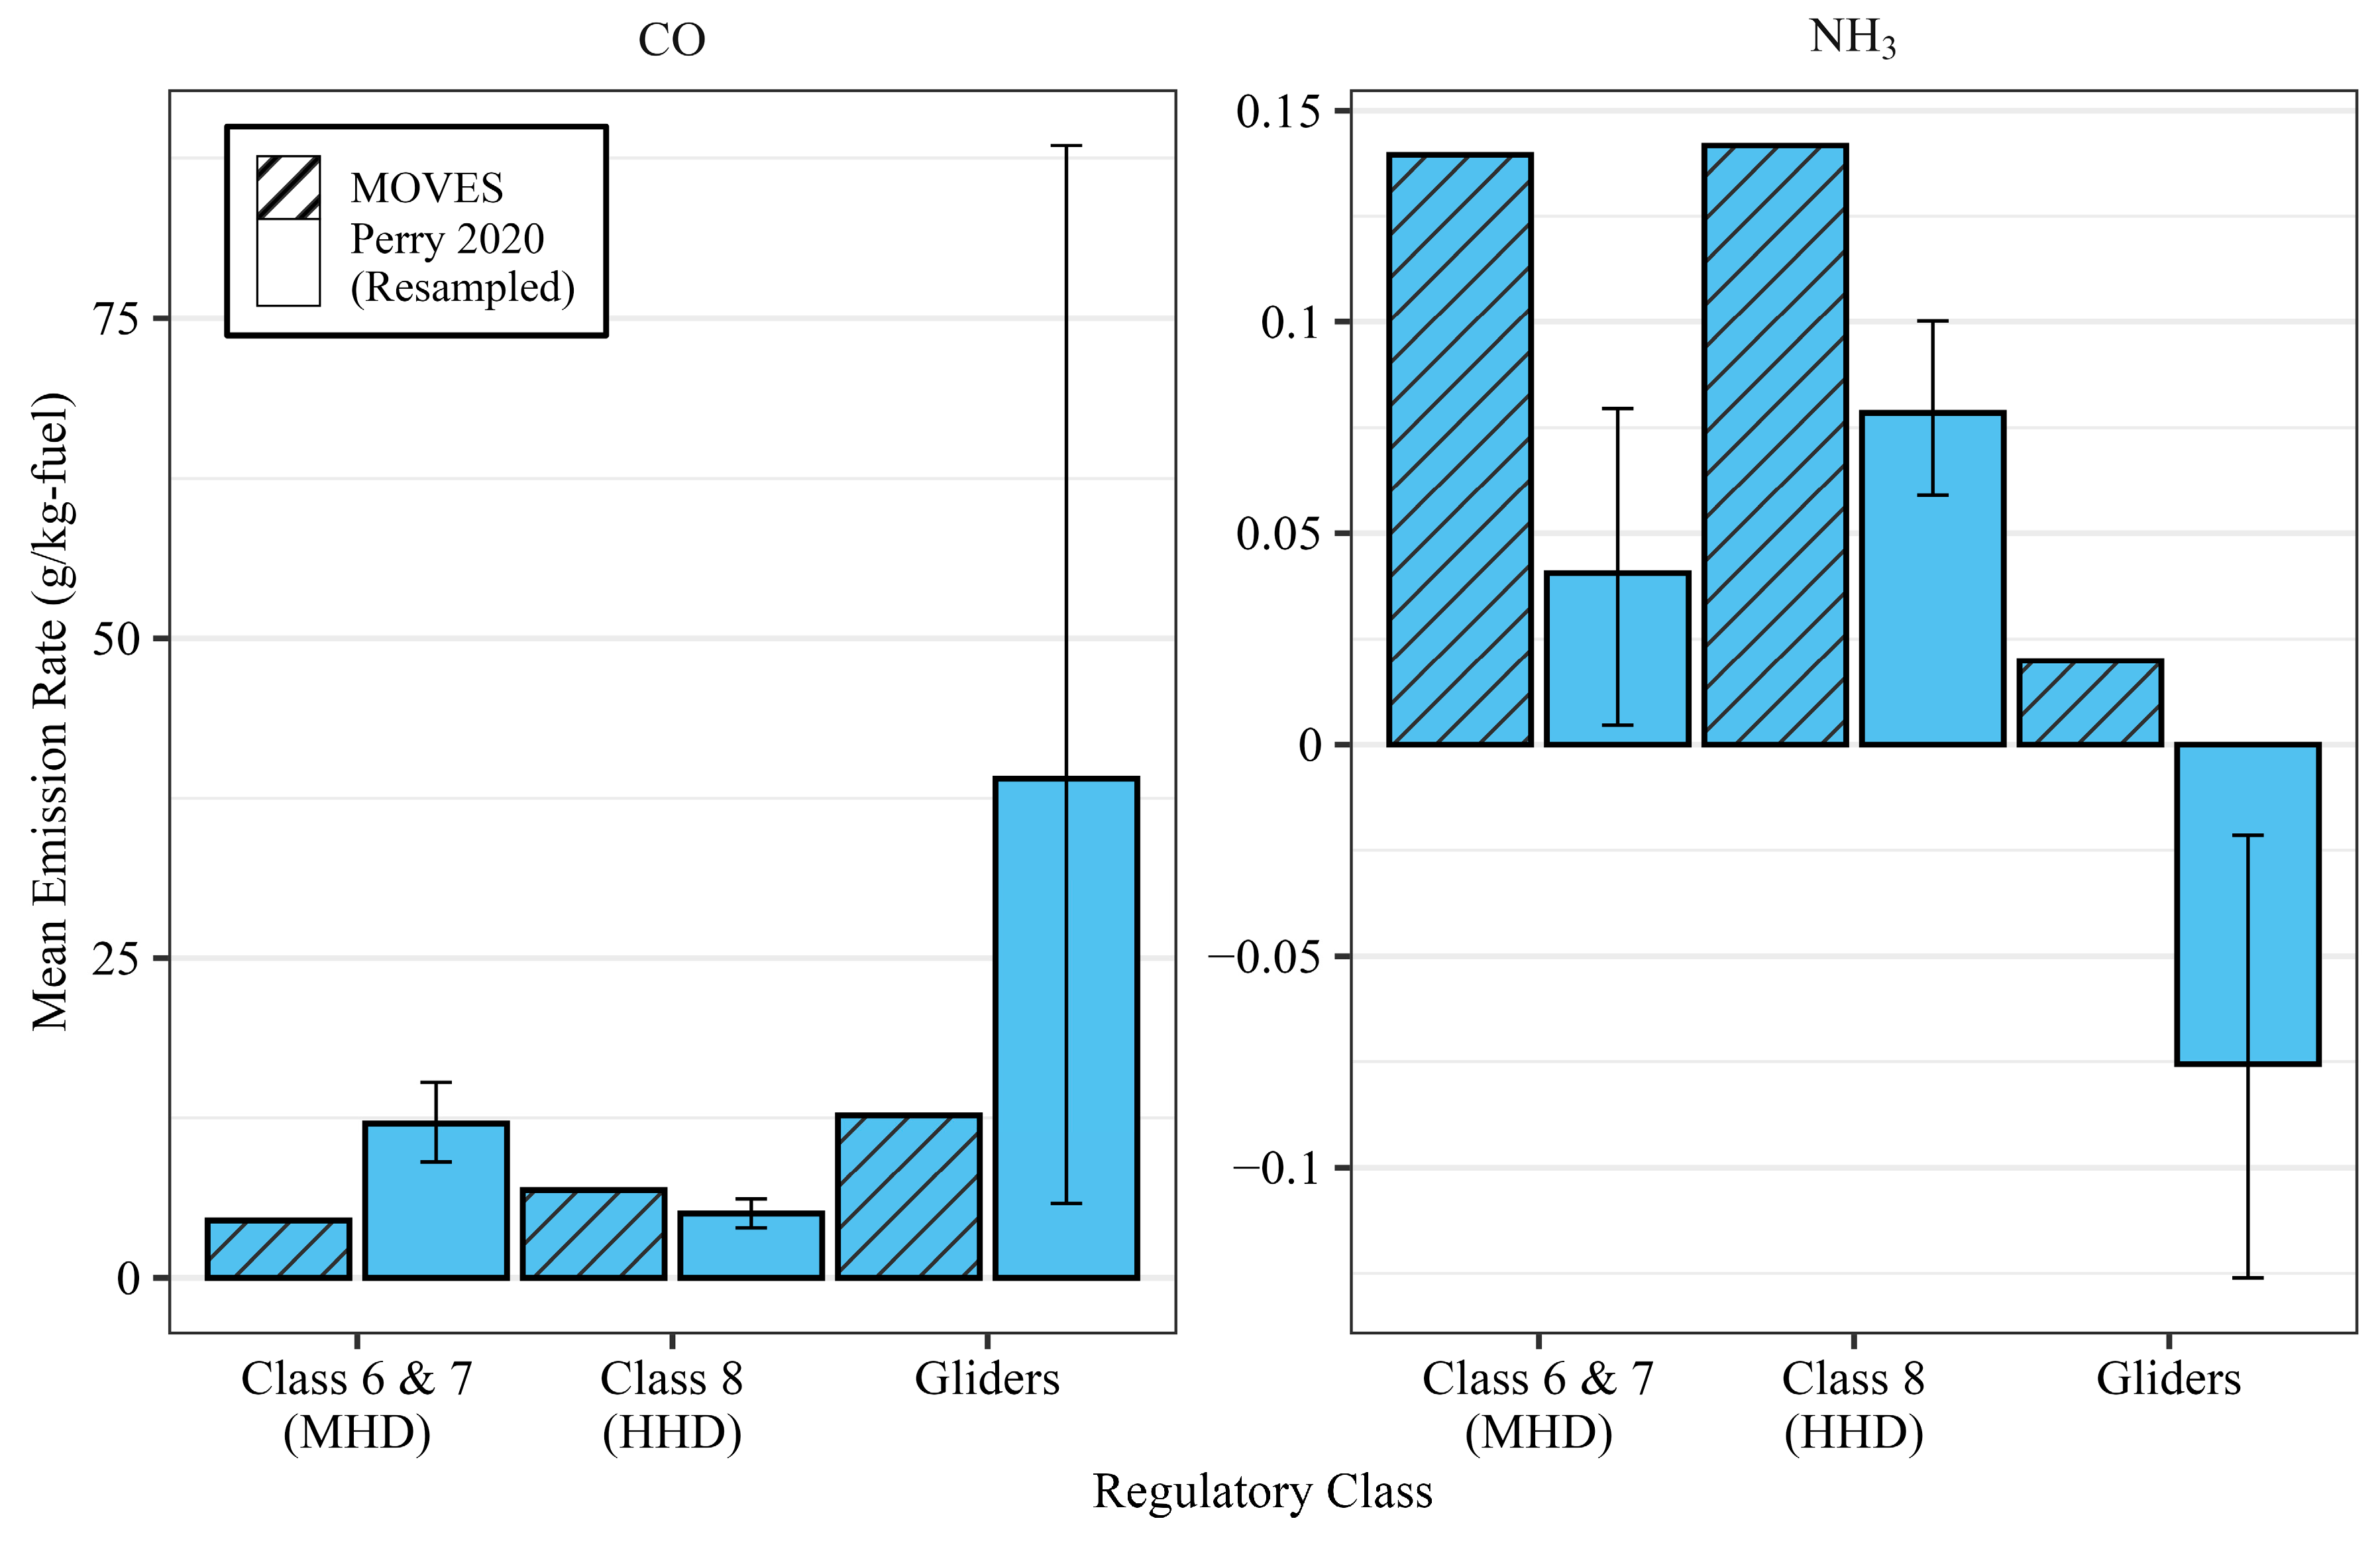
Figure 9 and Figure 10 show that estimates from MOVES5 by regulator class exhibit similar trends to fleet-wide averages. Numbers above each category represent the number of vehicles in each class. For Classes 6, 7, and 8 in the Perry 2020 campaign, MOVES5 significantly underestimates CO, NO, and NOx emissions and significantly overestimates NH3 emissions. MOVES5 for NO2 compared well to measurements for Class 6 and 7 vehicles but significantly overestimated Class 8 NO2 emissions for the fleet. Class 6 and 7 vehicles show more variability in the mean. For Gliders, MOVES5 significantly overestimates NO2 and NH3 emissions, while significantly underestimating NO and NOx emissions. Fleet average CO emissions are widely variable for Gliders. Negative mean NH3 emissions for Gliders in Figure 10 can be explained by the lack of SCR control technology present in Gliders, resulting in negligible NH3 emissions and negative fuel-based rates calculated by FEAT. Trends among NO, NO2, and NOx remain consistent with fleet-wide averages.

4. Discussion

Table 5 highlights several previous studies that have evaluated the accuracy of various versions of the MOVES model compared to real-world measurements. Because each study relied on older versions of MOVES, direct comparison with the present analysis is limited. Several updates to how MOVES’s estimates HD NOx emissions have been incorporated into newer versions of the model. See Table A2 for an overview of major changes to HD vehicle emissions estimates in MOVES with each released version. Most earlier studies focused on comparing measured NOx emissions to MOVES estimates. The results from this study are both similar and different to what others have observed. For example, Yu et al. (2021) [32] found that MOVES2014 overestimated national diesel NOx emissions for earliest model years in the study (1999–2004) and underestimated NOx for the newest model years (2011–2018); this study observed the opposite trend, where MOVES underestimated NOx emissions for the oldest model years and overestimated NOx for the newest model years (see Figure 7). Similar to Yu et al., Sonntag et al. (2017) [33] found that fleet average NOx estimated from MOVES2014a compared well to real-world measurements collected in 1997 and 2006 but underestimated fleet average NOx emissions for measurements collected in 2010.
Similar to what was observed in this study, Wang et al. (2019) [34] found that MOVES2014a underestimated fleet average NOx emissions when there was a high percentage of HD vehicles in the fleet (>30%) and that this difference was greater in the winter than the summer. Bishop et al. (2022) [8], using the same Perry 2020 measurements analyzed here, found that MOVES3 consistently underestimated NOx across all vehicle model years and by a factor of 1.8 for the fleet. Using the same data but a more recent version of MOVES and different comparison methods, this study found a smaller underestimation, by a factor of 1.5. With the release of the MOVES4 model in 2023 [29], the US EPA evaluated model estimates for the 2016 fleet against measurements from the Peralta 2017 campaign [35] (also used in this study) and from the Fort McHenry Tunnel in Maryland [34]. Their analysis showed that MOVES3 estimates for NOx compared well to the fleet averages for Peralta 2017 but significantly underestimated NOx at Fort McHenry, while estimates for CO emissions compared well for both locations. Similarly, this study found that MOVES5 estimates compared well to fleet average NOx from Peralta 2017 and that CO estimates compared well to roadside measurements from Peralta 2017 and both Perry campaigns.
While comparisons of MOVES5 estimates to fleet-wide trends were sometimes consistent across campaigns, significant differences were observed when evaluating model year trends. For example, though fleet average estimates for CO from MOVES5 were within 95% CI of the fleet mean for each campaign, MOVES5 inconsistently estimated mean CO emissions by model year, notably underestimating predicted mean CO emissions for middle-aged model years across all campaigns and significantly overestimating predicted mean CO emissions for the newest seven model years of the Perry 2020 campaign. Similar discrepancies between the accuracy of MOVES5 in estimating fleet and model year average NOx emissions. While MOVES5 accurately estimated fleet average NOx for the Peralta 2017 and Perry 2023 campaigns, the model significantly underestimated predicted mean NOx emissions for the oldest vehicle model years and overestimated predicted mean emissions for the newest vehicle model years. This analysis highlights that over- and underestimation across vehicle model years may be leading MOVES to accurately identify fleet average trends, while it struggles to accurately estimate emissions at the model year level. Lastly, while MOVES estimated significantly higher fleet average NH3 emissions for all three campaigns, estimates for mean NH3 by vehicle model year were well within the confidence intervals for the predicted mean. This finding highlights the variability in NH3 emission measurements, as NH3 emissions are largely dependent on vehicle operation and SCR efficiency. A combination of remote sensing (FEAT) and PEMS data can be used to improve estimates for NH3 emissions across a variety of vehicle operating conditions.
Real-world measurements from the three campaigns indicate that newer vehicles tend to emit less than MOVES5 estimates suggest, while estimates for older vehicles are less consistent. Several factors may contribute to this mismatch. Emission control technologies deteriorate with age and may be tampered with, leading to higher-than-expected NOx and NH3 emissions. In addition, smaller sample sizes for older model years increase uncertainty and may be influenced by a few extreme emitters. For instance, the Perry 2023 campaign included very few pre-2005 vehicles because older heavy-duty diesels often feature stack exhaust configurations that limit measurement opportunities [27]. Ultimately, while MOVES5 performs reasonably well given its inputs and assumptions, it cannot perfectly represent the complexity of real-world vehicle behavior, particularly for older and more variable segments of the fleet.
Since MOVES outputs are used in SIP development, accurate modeling is critical for producing realistic emission inventories. Utah’s releases a state-wide emissions inventory every 3 years, which is used to inform their SIP. This emissions inventory includes contributions from mobile (on-road and non-road), point, area, oil, and gas sources and reports emissions in tons emitted/year. To estimate the mobile sources in the SIP, the state runs MOVES with inputs specific to Utah’s fleet composition. Comparison from this study shows that MOVES underestimated Utah’s wintertime NOx emissions by approximately 47% for the Perry Port of Entry in 2020. Assuming all winter-time heavy-duty NOx emissions are similarly underestimated, then Utah’s current emissions inventory estimates [36] of winter-time HD NOx emissions (December to February) would increase from 2660 tons/year to 3928 tons/year. As stated previously, the current MOVES model does not include a temperature effect for NOx emissions from HD diesel vehicles with model years earlier than 2027. This adjustment is only applied to HD diesel vehicles beginning with 2027 and newer model years. The MOVES’s lack of temperature adjustment for pre-2027 HD diesel vehicles could mean that there is an additional 1267 Tons/Year produced that is unaccounted for in the statewide inventory. Table 6 illustrates how additional NOx would impact different sectors of Utah’s inventory, including total on-road HD diesel, all on-road diesel vehicles, and all on-highway mobile sources. The potentially unaccounted 1267 Tons/Year of winter-time NOx from HD diesel vehicles was added to each category’s existing total emissions.
Collecting additional emissions data from older HD vehicles could improve MOVES predictions for this portion of the fleet. Given the consistent trends in NO and NO2 predictions, forthcoming versions of MOVES should consider updating the NO/NOx and NO2/NOx ratios used in the model by evaluating real-world measurements from a variety of locations. Because California’s strict inspection and maintenance programs may limit the representativeness of local vehicle data [37], integrating emissions measurements from more diverse fleets would enhance the model’s national applicability. At the same time, collecting emissions data at the local level can directly improve the accuracy of statewide emission inventories by providing region-specific inputs that better capture fleet and operating conditions. Additionally, roadside emissions capture the variability of vehicle-to-vehicle emissions but may not capture the variability of emissions at different locations and operating conditions, as discussed for NH3 emissions. NH3 emissions, NO/NOx, and NO2/NOx ratios in MOVES5 are developed from one location. Incorporating additional real-world data into MOVES would improve the reliability of emission inventories, strengthen SIPs, and provide clearer guidance for developing mitigation strategies.

5. Conclusions

The objective of our research was to evaluate the effectiveness and accuracy of the MOVES5 model in estimating on-road HD diesel emissions. Model accuracy was determined on a vehicle-to-vehicle level to make fleet-wide, model years, and regulatory class comparisons by matching MOVES5 emission rates to individual vehicle measurements from three campaigns. MOVES5 demonstrates a varied ability to estimate HD diesel vehicle emissions for each of the measured pollutants. While MOVES5 accurately estimates mean fleet-wide CO emissions (within 7% and 16% percent), inconsistencies are observed in the models’ ability to accurately estimate fleet-wide NO and NO2 (within 9% to 106%). MOVES5 significantly underestimates NOx during the Perry 2020 wintertime campaign, highlighting a need for a more significant NOx temperature adjustment for cold-weather climates to be included in the model. MOVES5 also significantly overestimates fleet-wide NH3 emissions for each campaign (59% to 103%).
When campaign data were aggregated by vehicle regulatory class, they have similar trends to fleet-wide observations for each pollutant. Across vehicle model years, MOVES5 generally underestimated emissions for older and middle-aged model years and overestimated emissions for the newest model years for CO, NO, NO2, and NOx. MOVES5-estimated NH3 compared well to predicted means across all model years. However, variability in measured emissions was larger for older model years across all pollutants, potentially due to smaller sample sizes for older model years and emission control deterioration.
Given the importance of on-highway emission inventory estimates in urban areas, we recommend comparing MOVES estimates to local real-world emissions measurements. The methods outlined compare roadside emission measurements to MOVES emission rates that match the individual vehicle measurement according to model year, vehicle age, regulatory class, vehicle operating mode, and ambient conditions.

Author Contributions

Conceptualization, A.L.G.A. and D.B.S.; methodology, A.L.G.A. and D.B.S.; validation, A.L.G.A., D.B.S. and E.R.; formal analysis, A.L.G.A., D.B.S. and E.R.; investigation, A.L.G.A., D.B.S. and E.R.; resources, A.L.G.A., D.B.S. and E.R.; data curation, A.L.G.A., D.B.S. and E.R.; writing—original draft preparation, A.L.G.A., D.B.S. and E.R.; writing—review and editing, A.L.G.A. and D.B.S.; visualization, A.L.G.A.; supervision, D.B.S.; project administration, A.L.G.A. and D.B.S.; funding acquisition, D.B.S. All authors have read and agreed to the published version of the manuscript.

Funding

This research was performed under funding provided by a Mentored Research Grant from the BYU Ira A. Fulton College of Engineering and the Utah Governor’s Office of Economic Opportunity Strategic Innovation Grant Contract 240632114.

Institutional Review Board Statement

Not applicable.

Informed Consent Statement

Not applicable.

Data Availability Statement

The Peralta 2017 and Perry 2020 campaign data can be accessed at https://digitalcommons.du.edu/feat/ (accessed on 12 May 2024). The Perry 2023 data can be accessed at https://scholarsarchive.byu.edu/y-em (accessed on 20 August 2025).

Acknowledgments

Gary Bishop provided data and support throughout during measurement campaigns and analysis. Dylan Fitt, Dave Andrada, and Andrew Coleman conducted collection and processing of the data as student research assistants. Rodney May and Clayton Harrison and staff in the Civil & Construction Engineering Department built, obtained, and repaired equipment for us to transport and operate the FEAT at BYU. Stephen Goodrich and staff from the Utah Department of Transportation enabled us to conduct the Summer 2023 campaign at the Perry Port of Entry. Suzanne Covert from the Utah Department of Motor Vehicles provided vehicle information from the recorded license plates. Claudio Toro for providing code from MOVES our methods to improve analysis methods. Finally, we recognize the late Don Stedman for conceiving and developing FEAT which has been used to measure real-world emissions for nearly 40 years.

Conflicts of Interest

The authors declare no conflicts of interest. The funders had no role in the design of the study; in the collection, analyses, or interpretation of data; in the writing of the manuscript; or in the decision to publish the results.

Abbreviations

The following abbreviations are used in this manuscript:
HDHeavy-Duty
NONitrogen Monoxide
NO2Nitrogen Dioxide
NOxNitrogen Oxides
NEINational Emissions Inventory
NH3Ammonia
LDLight-duty
PM2.5Particulate Matter
NAAQSNational Ambient Air Quality Standards
COCarbon Monoxide
US EPAUnited States Environmental Protection Agency
MOVESMotor Vehicle Emission Simulator
SIPState Implementation Plan
FEATFuel Efficiency Automobile Test
MHDMedium-Heavy-Duty
HHDHeavy-Heavy-Duty
STPScaled Tractive Power
CI95% Confidence Interval
SCRSelective Catalytic Reduction
GAMGeneralized Additive Model
PEMSPortable Emission Measurement System

Appendix A

Appendix A.1. MOVES5 Method Validation

Method validation was performed to ensure the external temperature and humidity adjustments made to MOVES5 base rates used in this analysis matched MOVES5 internal adjustments. To accomplish this, MOVES5 was run at the default scale for Box Elder County for long-haul combination trucks (Source Type 62), diesel fuel, and vehicle model year 2020, for 1 h of the day (13:00), on an urban restricted access road-type. The selected year for the run was 2020, and the months chosen were December and July, to reflect the months when measurements were collected for the Perry campaigns. Though these specific inputs were used in MOVES5 to reflect similar conditions expected in this study, other inputs can be used (such as County, road type, year, and model year) to accomplish the same validation result.
After running MOVES5, grams/mile of NOx were calculated using the output (grams) and activity (miles) tables. Average temperature, humidity, and barometric pressure assumptions for Box Elder County used by MOVES5 were also extracted for the specified months and time of day. Using the temperature and humidity adjustment equations for diesel vehicles from the latest MOVES Fuel Effects Technical report [20], the NOx adjustment factor (K) was calculated (see Table 1). The output NOx in grams/mile from the original run was divided by the respective K for each month, resulting in equivalent base rates used by MOVES5 before the temperature and humidity adjustments were applied. Note that numbers in the table have been rounded for presentation and simplicity and dividing by K from table values will result in different base rate calculations. Un-rounded K values calculated using MOVES5 temperature and humidity adjustment equation yielded base rates identical to three significant figures.
Table A1. Validation of temperature and humidity adjustments to get MOVES5 base rates.
MonthAverage Temp
(°F)
Average
Humidity
gNOx/mileKBase Rate
gNOx/Mile
July90.122.33321.05318
December34.365.73601.13318

Appendix A.2. Resampling Methodology

A bootstrap resampling method was used to estimate 95% confidence intervals for pollutant ratios and regulatory class means. For each model year or regulatory class group, observations were resampled with replacement 1000 times using the rep_sample_n() function from the moderndive package in R (v0.7.0) [22], maintaining the same sample size as the original group in each replicate.
For each replicate within every model year group, the mean emission rates of NO, NO2, and NOx were calculated, and the ratios NO/NOx and NO2/NOx were then computed from these means. Ratios were not constrained to the valid range (0, 1) to represent variability and uncertainty present in real-world measurements. This process yielded 1000 mean ratio estimates per group, from which the bootstrap mean was calculated. Subsequently the 2.5th and 97.5th percentiles of the bootstrap distribution were used to define the lower and upper bounds of the 95% CI. The same methods were applied for the regulatory class analysis, with regulatory class replacing model year group in the above explanation.
This resampling approach was selected because it provides reliable confidence intervals even when sample sizes within model year and regulatory groups are small or uneven, and it allows for uncertainty estimation in data that deviate from normality without assuming a specific parametric distribution.
Figure A1. Average NH3 emissions by chassis model year. Average emissions trend positive starting in model year 2011 for Peralta 2017, 2014 for Perry 2020, and 2015 for Perry 2023.
Atmosphere 16 01244 g0a1
Figure A2. Trendline of average predicted NO emissions for each vehicle model year by campaign. Solid lines with shaded ribbon represent GAM-predicted mean and 95% CIs. Dashed black lines indicated average MOVES5 estimated mean for each vehicle model year. Numbers indicate the number of vehicle measurements in each model year.
Atmosphere 16 01244 g0a2
Figure A3. Trendline of average predicted NO2 emissions for each vehicle model year by campaign. Solid lines with shaded ribbon represent GAM-predicted mean and 95% CIs. Dashed black lines indicated average MOVES5 estimated mean for each vehicle model year. Numbers indicate the number of vehicle measurements in each model year.
Atmosphere 16 01244 g0a3
Table A2. Recent MOVES model updates by model version. Only updates relevant to HD vehicles and pollutants mentioned in this study are presented.
MOVES VersionMajor Relevant Updates
MOVES5 [5]Age continues to have an effect from 0–40 years old. Previous models stopped differentiating after 30 years.
Updated HD energy consumption rates based on recent data and new CO2 emission standards to improve fleet averages. These changes lead to significant declines in future year CO2.
Updated HD ZEV fractions based on recent data and projections that account for new EPA emission standards.
MOVES4 [38]Updated projected HD emission rates to account for the Heavy-duty low NOx rule (model years 2027+). Sets tighter emission standards for NOx and CO from HD vehicles starting in model year 2027.
Included temperature adjustment for NOx emissions (running and extended idle) for ambient temperatures below 77 °F for HD diesel vehicles. Also updated NOx humidity adjustment estimates.
Update weight, aerodynamics, rolling resistance and other aspects of efficiency for combination trucks of model years 2018+, slightly increasing the modeled emissions of CO2 and other pollutants from these trucks.
Updated HD diesel deterioration estimates.
Updated NH3 emissions for diesel vehicles to match real-world measurements (higher than MOVES3). Updated NO/NOx and NO2/NOx ratios for HD vehicles (estimates more NO and less NO2).
Updated default VMT and vehicle populations from latest historical data.
Updated age distributions based on 2020 registration data. On average, cars are older than in MOVES3.
MOVES3Updated on road exhaust emission rates, including HD GHG Phase 2 and Safer Affordable Fuel Efficiency (SAFE) rules.
Updated on road activity, vehicle populations and fuels.
Added gliders and off-network idle.
MOVES2014aImproved evaporative emissions and air toxics.
Updated on road activity, vehicle populations and fuels.

References

  1. US EPA. Inventory of U.S. Greenhouse Gas Emissions and Sinks: 1990–2022—Main Text. US EPA, 430-R-24–004. 2024. Available online: https://www.epa.gov/ghgemissions/inventory-us-greenhouse-gas-emissions-and-sinks-1990-2022 (accessed on 3 June 2024).
  2. US EPA. 2020 National Emissions Inventory (NEI) Data. Available online: https://www.epa.gov/air-emissions-inventories/2020-national-emissions-inventory-nei-data (accessed on 3 June 2024).
  3. Cao, H.; Henze, D.K.; Cady-Pereira, K.; McDonald, B.C.; Harkins, C.; Sun, K.; Bowman, K.W.; Fu, T.M.; Nawaz, M.O. COVID-19 Lockdowns Afford the First Satellite-Based Confirmation That Vehicles Are an Under-Recognized Source of Urban NH3 Pollution in Los Angeles. Environ. Sci. Technol. Lett. 2022, 9, 3–9. [Google Scholar] [CrossRef]
  4. Brugge, D.; Durant, J.L.; Rioux, C. Near-highway pollutants in motor vehicle exhaust: A review of epidemiologic evidence of cardiac and pulmonary health risks. Environ. Health 2007, 6, 23. [Google Scholar] [CrossRef]
  5. US EPA. Overview of EPA’s MOtor Vehicle Emission Simulator (MOVES5). Technical Report EPA-420-R-25-005. February 2025. Available online: https://nepis.epa.gov/Exe/ZyPDF.cgi?Dockey=P101DQ9V.pdf (accessed on 30 September 2025).
  6. US EPA. MOVES5 Policy Guidance: Use of MOVES for State Implementation Plan Development, Transportation Conformity, General Conformity, and Other Purposes. EPA-420-B-24-038; November 2024. Available online: https://nepis.epa.gov/Exe/ZyPDF.cgi?Dockey=P101CTLB.pdf (accessed on 27 September 2025).
  7. US EPA. EPA Releases MOVES5 Mobile Source Emissions Model. EPA-420-F-24-031; November 2024. Available online: https://www.epa.gov/moves/latest-version-motor-vehicle-emission-simulator-moves (accessed on 19 August 2025).
  8. Bishop, G.A.; Haugen, M.J.; McDonald, B.C.; Boies, A.M. Utah Wintertime Measurements of Heavy-Duty Vehicle Nitrogen Oxide Emission Factors. Environ. Sci. Technol. 2022, 56, 1885–1893. [Google Scholar] [CrossRef]
  9. Haugen, M.J.; Bisho, G.A. Repeat Fuel Specific Emission Measurements on Two California Heavy-Duty Truck Fleets. Environ. Sci. Technol. 2017, 51, 4100–4107. [Google Scholar] [CrossRef]
  10. Bishop, G.; Stedman, D. Remote Measurements of On-Road Emissions from Heavy-Duty Diesel Vehicles in California; Year 5, 2012. Fuel Efficiency Automobile Test Publications. January 2013. Available online: https://digitalcommons.du.edu/feat_publications/67 (accessed on 3 June 2024).
  11. Popp, J.; Bishop, G.A.; Stedman, D.H. Development of a High-Speed Ultraviolet Spectrometer for Remote Sensing of Mobile Source Nitric Oxide Emissions. J. Air Waste Manag. Assoc. 1999, 49, 1463–1468. [Google Scholar] [CrossRef] [PubMed]
  12. Burgard, D.; Dalton, T.; Bishop, G.; Starkey, J.; Stedman, D. Nitrogen Dioxide, Sulfur Dioxide, and Ammonia Detector for Remote Sensing of Vehicle Emissions. Fuel Efficiency Automobile Test Publications. January 2006. Available online: https://digitalcommons.du.edu/feat_publications/157 (accessed on 12 August 2025).
  13. Bishop, G.A.; Morris, J.A.; Stedman, D.H.; Cohen, L.H.; Countess, R.J.; Countess, S.J.; Maly, P.; Scherer, S. The Effects of Altitude on Heavy-Duty Diesel Truck On-Road Emissions. Environ. Sci. Technol. 2001, 35, 1574–1578. [Google Scholar] [CrossRef] [PubMed]
  14. Bishop, G.A.; Stedman, D.H. Measuring the Emissions of Passing Cars. Acc. Chem. Res. 1996, 29, 489–495. [Google Scholar] [CrossRef]
  15. Oregon DOT. Trucking Online. Available online: https://www.oregontruckingonline.com/cf/MCAD/pubMetaEntry/carrierInfoByVeh/ (accessed on 22 April 2024).
  16. US EPA. Population and Activity of Onroad Vehicles in MOVES5. EPA-420-R-24-019; November 2024. Available online: https://nepis.epa.gov/Exe/ZyPDF.cgi?Dockey=P101CUN7.pdf (accessed on 30 September 2025).
  17. US EPA. MOVES5 Technical Guidance: Using MOVES to Prepare Emission Inventories for State Implementation Plans and Transportation Conformity. EPA-420-B-24-043; November 2024. Available online: https://nepis.epa.gov/Exe/ZyPDF.cgi?Dockey=P101CTM3.pdf (accessed on 27 September 2025).
  18. CARB. EMFAC2021 Volume III Technical Document Version 1.0.1. April 2021. Available online: https://ww2.arb.ca.gov/sites/default/files/2021-08/emfac2021_technical_documentation_april2021.pdf (accessed on 22 April 2024).
  19. US EPA. Emission Adjustments for Onroad Vehicles in MOVES5. EPA-420-R-24-013; November 2024. Available online: https://nepis.epa.gov/Exe/ZyPDF.cgi?Dockey=P101CTWV.pdf (accessed on 7 December 2024).
  20. US EPA. Fuel Effects on Exhaust Emissions from Onroad Vehicles in MOVES3. November 2020. Available online: https://nepis.epa.gov/Exe/ZyPDF.cgi?Dockey=P1010M6C.pdf (accessed on 17 July 2024).
  21. US EPA. Exhaust Emission Rates for Heavy-Duty Onroad Vehicles in MOVES5. November 2024. Available online: https://nepis.epa.gov/Exe/ZyPDF.cgi?Dockey=P101CU1O.pdf (accessed on 7 December 2024).
  22. Kim, A.Y.; Ismay, C.; Bray, A.; Moran, D.; Chasnovski, E.; Hopper, W.; Baumer, B.S.; Tapal, M.; Ndlovu, W.; Peppers, C.; et al. moderndive: Tidyverse-Friendly Introductory Linear Regression. (1 September 2024). Available online: https://cran.r-project.org/web/packages/moderndive/index.html (accessed on 1 October 2025).
  23. Wood, S. mgcv: Mixed GAM Computation Vehicle with Automatic Smoothness Estimation. (4 April 2025). Available online: https://cran.r-project.org/web/packages/mgcv/index.html (accessed on 1 October 2025).
  24. Hall, D.L.; Anderson, D.C.; Martin, C.R.; Ren, X.; Salawitch, R.J.; He, H.; Canty, T.P.; Hains, J.C.; Dickerson, R.R. Using near-road observations of CO, NOy, and CO2 to investigate emissions from vehicles: Evidence for an impact of ambient temperature and specific humidity. Atmos. Environ. 2020, 232, 117558. [Google Scholar] [CrossRef]
  25. Bishop, G.; Haugen, M.; McDonald, B. Winter Measurements of Heavy-Duty Vehicles to Characterize the Cold Temperature Effectiveness of Selective Catalytic Reductions Catalyst in Controlling Oxide of Nitrogen Emissions. Fuel Efficiency Automobile Test Publications. January 2021. Available online: https://digitalcommons.du.edu/feat_publications/216 (accessed on 5 February 2024).
  26. Aalborg Energie Technik. How Selective Catalytic Reduction Can Reduce NOx Emissions. Available online: https://knowledge.aet-biomass.com/how-selective-catalytic-reduction-can-reduce-nox-emissions (accessed on 2 April 2024).
  27. Allen, A.L.G.; Sonntag, D.B.; Bisho, G.A. Effects of Ambient Temperature on NOx Emissions from Heavy-Duty Diesel Vehicles Measured in Utah. Environments 2025, 12, 293. [Google Scholar] [CrossRef]
  28. Preble, C.V.; Harley, R.A.; Kirchstetter, T.W. Control Technology-Driven Changes to In-Use Heavy-Duty Diesel Truck Emissions of Nitrogenous Species and Related Environmental Impacts. Environ. Sci. Technol. 2019, 53, 14568–14576. [Google Scholar] [CrossRef] [PubMed]
  29. US EPA. Exhaust Emission Rates for Heavy-Duty Onroad Vehicles in MOVES4. EPA-420-R-23-027; August 2023. Available online: https://nepis.epa.gov/Exe/ZyPDF.cgi?Dockey=P10186TB.pdf (accessed on 30 September 2025).
  30. Suarez-Bertoa, R.; Mendoza-Villafuerte, P.; Bonnel, P.; Lilova, V.; Hill, L.; Perujo, A.; Astorga, C. On-road measurement of NH3 and N2O emissions from a Euro V heavy-duty vehicle. Atmos. Environ. 2016, 139, 167–175. [Google Scholar] [CrossRef]
  31. Zhu, H.; Li, C.; McCaffery, C.; Cao, S.; Johnson, K.C.; Karavalakis, G.; Durbin, T. Emissions from heavy-duty diesel, natural gas, and diesel-hybrid electric vehicles—Part 1. NOx, N2O and NH3 emissions. Fuel 2024, 371, 132175. [Google Scholar] [CrossRef]
  32. Yu, K.A.; McDonald, B.C.; Harley, R.A. Evaluation of Nitrogen Oxide Emission Inventories and Trends for On-Road Gasoline and Diesel Vehicles. Environ. Sci. Technol. 2021, 55, 6655–6664. [Google Scholar] [CrossRef] [PubMed]
  33. Sonntag, D.; Choi, D.; Warila, J.; Beardsley, M. Comparison of Light-duty NOx Emission Rates Estimated from MOVES with Real-World Measurements. 18 August 2017. Available online: https://www.epa.gov/sites/default/files/2017-11/documents/light_duty_nox.pdf (accessed on 11 November 2024).
  34. Wang, X.; Khlystov, A.; Ho, K.-F.; Campbell, D.; Chow, J.C.; Kohl, S.D.; Watson, J.G.; Lee, S.F.; Chen, L.-W.A.; Lu, M.; et al. Real-world Vehicle Emissions Characterization for the Shing Mun Tunnel in Hong Kong and Fort McHenry Tunnel in the United States; Health Effects Institute: Boston, MA, USA, 2019; HEI Report 199. [Online]; Available online: https://www.healtheffects.org/publication/real-world-vehicle-emissions-characterization-shing-mun-tunnel-hong-kong-and-fort (accessed on 31 July 2025).
  35. Haugen, M.J.; Bishop, G.A.; Thiruvengadam, A.; Carder, D.K. Evaluation of Heavy- and Medium-Duty On-Road Vehicle Emissions in California’s South Coast Air Basin. Environ. Sci. Technol. 2018, 52, 13298–13305. [Google Scholar] [CrossRef] [PubMed]
  36. UDAQ. 2020: Statewide Emissions Inventories. Utah Department of Environmental Quality. Available online: https://deq.utah.gov/air-quality/2020statewide-emissions-inventories (accessed on 25 March 2025).
  37. CARB. Clean Truck Check (HD I/M)|California Air Resources Board. Available online: https://ww2.arb.ca.gov/our-work/programs/CTC/about (accessed on 19 May 2025).
  38. Beardsley, M.; Bizer-Cox, D.; Aldridge, M.; Mo, T. Recent Updates to EPA’s Motor Vehicle Emissoin Simulator (MOVES). In Proceedings of the International Emission Inventory Conference, Seattle, WA, USA, 27 September 2023; Available online: https://www.epa.gov/system/files/documents/2023-11/recent-updates-to-moves_508.pdf (accessed on 22 August 2025).
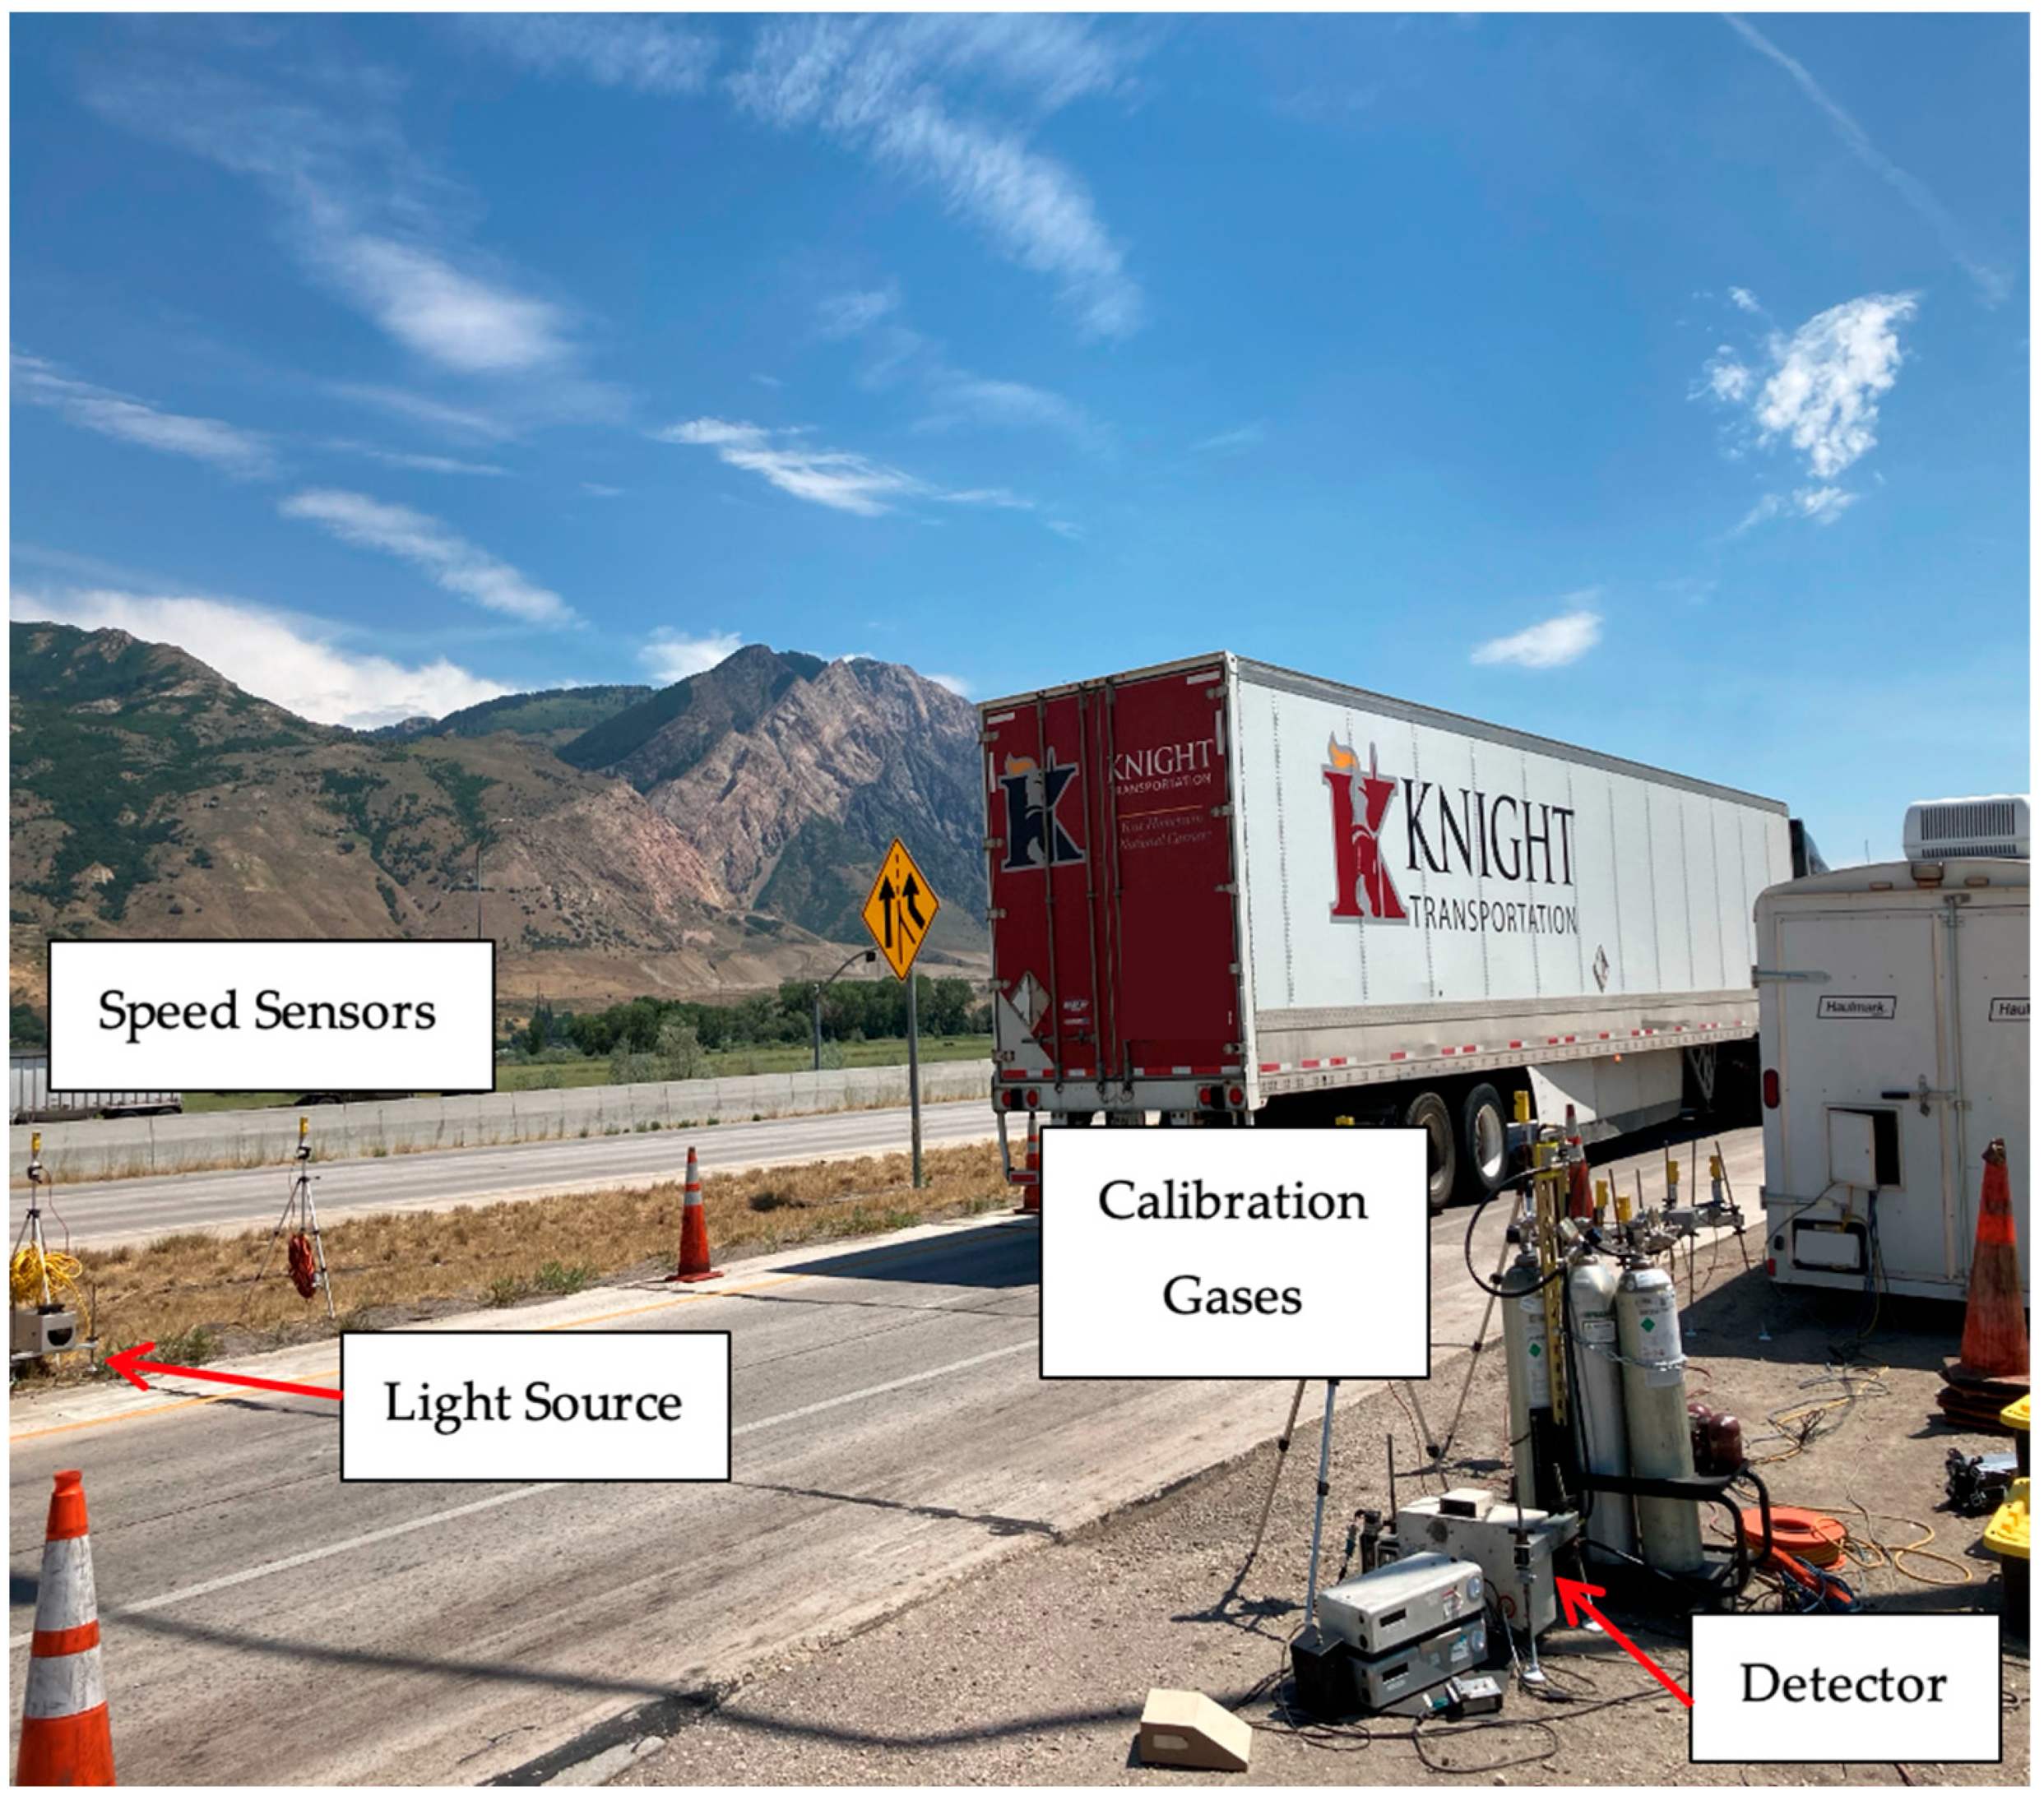
Figure 1. Field setup of the FEAT remote sensing system during the Perry 2023 campaign. The labeled components illustrate the IR/UV light source, detector, and paired speed sensors.
Atmosphere 16 01244 g001
Figure 2. Fleet-wide CO emissions with MOVES5-estimated mean (striped) and measured mean (solid) for each campaign. Error bars are 95% CIs of the measured mean.
Atmosphere 16 01244 g002
Figure 3. Fleet-wide NOx emissions with MOVES5-estimated mean (striped) and measured mean (solid) for each campaign. Error bars are 95% CIs of the measured mean.
Atmosphere 16 01244 g003
Figure 4. Fleet-wide NO (top) and NO2 (bottom) emissions with MOVES5-estimated mean (striped) and measured mean (solid) for each campaign. Error bars are 95% CIs of the measured mean.
Atmosphere 16 01244 g004
Figure 5. Fleet-wide NH3 emissions with MOVES5-estimated mean (striped) and measured mean (solid) for each campaign. Error bars are 95% CIs of the measured mean.
Atmosphere 16 01244 g005
Figure 6. Trendline of average predicted CO emissions for each vehicle model year by campaign. Solid lines with shaded ribbon represent GAM-predicted mean and 95% CIs. Dashed black lines indicate average MOVES5-estimated mean for each vehicle model year.
Atmosphere 16 01244 g006
Figure 7. Trendline of average predicted NOx emissions for each vehicle model year by campaign. Solid lines with shaded ribbon represent GAM-predicted mean and 95% CIs. Dashed black lines indicate average MOVES5-estimated mean for each vehicle model year. Numbers indicate the number of vehicle measurements in each model year.
Atmosphere 16 01244 g007
Figure 8. Trendline of average predicted NH3 emissions for each vehicle model year by campaign. Solid lines with shaded ribbon represent GAM-predicted mean and 95% CIs. Dashed black lines indicate average MOVES5-estimated mean for each vehicle model year. Numbers indicate the number of vehicle measurements in each model year.
Atmosphere 16 01244 g008
Figure 9. Mean resampled (solid) and MOVES5-estimated (striped) mean emissions for NO, NO2, and NOx by vehicle regulatory class, including Gliders. Error bars are 95% CIs of the resampled mean for each regulatory class grouping.
Atmosphere 16 01244 g009
Figure 10. Mean resampled (solid) and MOVES5-estimated (striped) mean emissions for CO and NH3 by vehicle regulatory class, including Gliders. Error bars are 95% CIs of the resampled mean for each regulatory class grouping.
Atmosphere 16 01244 g010
Table 1. MOVES5 NOx adjustment factor for each campaign based on average temperature and relative humidity.
CampaignAverage
Temperature
Average Relative
Humidity
NOx Adjustment Factor
Peralta 201715.9 °C (60.6 °F)76.5%1.03
Perry 2020−4.4 °C (24.0 °F)52.0%1.16
Perry 202328.1 °C (82.5 °F)17.0%1.10
Table 2. Summary table of the Peralta 2017, Perry 2020, and Perry 2023 campaigns, including general information and averages of parameters to calculated STP. Note. n = number of vehicles.
ParameterPeralta 2017Perry 2020Perry 2023
Campaign Dates20 March 2017–23 March 20176 December 2020–11 December 202031 July 2023–1 August 2023
High FEAT Measurements (n)11899160
Low FEAT Measurements (n)446495423
Class 6 and Class 7 (n)3046629
Class 8 (n)13311323394
Location Slope (%)3.1%0%0%
Average Speed (m/s)6.413.012.8
Average Acceleration (m/s2)0.270.090.22
Table 3. Current NO fractions from MOVES5 compared to the measured NO fractions for each campaign. Fractions and CIs were obtained through bootstrap resampling [22] method by model year group.
NO Fraction
Model Year GroupsMOVES5Peralta 2017Perry 2020Perry 2023
1965–20030.9620.946
(0.932, 0.965)
n = 168
0.993
(0.976, 1.018)
n = 137
1
(1, 1)
n = 3
2004–20060.9330.980
(0.944, 1.041)
n = 91
0.972
(0.966, 0.978)
n = 74
0.895
(0.739, 1)
n = 3
2007–20090.7540.907
(0.893, 0.920)
n = 313
0.986
(0.968, 1.011)
n = 93
0.986
(0.959, 1)
n = 3
2010–20240.8040.909
(0.894, 0.922)
n = 1063
0.975
(0.961, 0.992)
n = 1107
0.872
(0.829, 0.915)
n = 414
Table 4. Current NO2 fractions from MOVES5 compared to the measured NO2 fractions for each campaign. Fractions and CIs were obtained through bootstrap resampling [22] method by model year group.
NO2 Fraction
Model Year GroupsMOVES5Peralta 2017Perry 2020Perry 2023
1965–20030.0300.061
(0.054, 0.070)
n = 168
0.026
(0.022, 0.030)
n = 137
0
(0, 0)
n = 3
2004–20060.05950.051
(0.041, 0.063)
n = 91
0.029
(0.023, 0.037)
n = 74
0.105
(0, 0.261)
n = 3
2007–20090.2380.098
(0.087, 0.117)
n = 313
0.031
(0.025, 0.038)
n = 93
0.014
(0,0.041)
n = 3
2010–20240.1890.095
(0.084, 0.108)
n = 1063
0.047
(0.041, 0.053)
n = 1107
0.132
(0.088, 0.176)
n = 414
Table 5. Summaries of previous studies that compared various versions of the MOVES model to real-world measurements. The table is ordered by MOVES version, with comparisons to the oldest versions appearing first.
StudySummaryMOVES
Version
General Findings
Yu et al., 2021 [32]Data were compiled from field campaigns conducted in California, including a variety of inventory and model sources. National emission rates were estimated by reweighting California NOx emission factors using age distributions from the EMFAC and MOVES models.MOVES2014MOVES predicted higher NOx emissions from diesel vehicles in earlier years, with a steeper rate of decrease than in the newer years.
Sonntag et al., 2017 [33]This synopsis compared MOVES estimates to emissions collected during tunnel studies in Oakland, California. The MOVES run was completed using project mode.MOVES2014aMOVES NOx estimates for diesel fuel compared well to measurements collected in 1997 and 2006. For measurements collected in 2010, MOVES underestimated NOx emissions.
Wang et al., 2019 [34]Data were collected in the Fort McHenry Tunnel Baltimore, Maryland, in 2015 during both the summer and winter months.MOVES2014aMOVES underestimated NOx emissions in the Baltimore, MD, tunnel by roughly 30% during the summer and 50% during the winter for high HD traffic volumes.
Bishop et al., 2022 [8]This study measured HD vehicle emissions at the Port of Entry in Perry, Utah, during the winter of 2020.MOVES3MOVES underestimated NOx emissions in Perry, Utah, by a factor of 1.8.
US EPA, 2023 [29]The EPA compared MOVES3 national emissions from the 2016 fleet to remote sensing and tunnel measurements.MOVES3The MOVES national estimate is within error for the Peralta, CA, location. Fort McHenry, MD real-world NOx emissions are significantly higher than the MOVES national estimate. CO estimates from MOVES compared measurements.
Table 6. Application of winter-time NOx increase from HD diesel vehicles to Utah’s Statewide Emissions Inventory (2020).
Inventory CategoryCurrent NOx Estimate (Tons/Year)Updated NOx Estimate
(Tons/Year)
Increase
(%)
Winter HD Diesel2661392847.6
Annual HD Diesel12,14513,41210.4
Annual Diesel19,27620,5436.6
Annual On-Highway Sources30,75332,0204.1
Disclaimer/Publisher’s Note: The statements, opinions and data contained in all publications are solely those of the individual author(s) and contributor(s) and not of MDPI and/or the editor(s). MDPI and/or the editor(s) disclaim responsibility for any injury to people or property resulting from any ideas, methods, instructions or products referred to in the content.