Article

Multi-Scale Mechanisms of Heavy Rainfall Event over North China: Nocturnal Low-Level Jet Intensification and Afternoon Synoptic Forcing

1
Laboratory of Cloud-Precipitation Physics and Severe Storms, Institute of Atmospheric Physics, Chinese Academy of Sciences, Beijing 100029, China
2
National Key Laboratory of Atmospheric Environment and Extreme Meteorology, Institute of Atmospheric Physics, Chinese Academy of Sciences, Beijing 100029, China
*
Author to whom correspondence should be addressed.
Atmosphere 2025, 16(11), 1241; https://doi.org/10.3390/atmos16111241
Submission received: 25 September 2025 / Revised: 18 October 2025 / Accepted: 23 October 2025 / Published: 28 October 2025
(This article belongs to the Section Meteorology)

Abstract

This study investigates the multi-scale processes associated with one type of typical heavy rainfall event in North China, focusing on the interplay among synoptic circulation, mesoscale dynamics, and topographic influences. The synoptic setting, characterized by the East Asian Great Trough, the South Asian High, and a northward-extended Western Pacific Subtropical High, created favorable conditions for moisture transport and convective activity. The event unfolded in two distinct phases: nocturnal and afternoon phases. During the nocturnal phase, an intensified 850 hPa low-level jet transported substantial meridional moisture into North China. Terrain-induced convergence along the Taihang Mountains enhanced lifting, resulting in concentrated precipitation at the foothills. In contrast, during the afternoon phase, the eastward movement of a Mongolian low trough and its associated cyclonic circulation shifted rainfall toward the plains east of the Taihang Mountains. Convective clusters developed locally due to surface heating and were organized along the low-level jet on the eastern flank of the cyclone, further intensifying precipitation. These results underscore three key mechanisms: nocturnal low-level jet-driven moisture convergence, synoptic-scale trough propagation, and terrain-modulated mesoscale convection. Understanding their diurnal variability offers valuable insights for operational forecasting, monitoring, and early warning systems for high-impact rainfall events in North China.

1. Introduction

North China, which hosts major economic, agricultural, and population centers, has increasingly suffered from extreme rainfall events in recent decades. Both the frequency and intensity of these events have risen, causing widespread agricultural losses, urban flooding, transportation disruptions, and triggering secondary hazards such as flash floods, landslides, and other geohazards that threaten lives and property. Previous studies have shown that such heavy rainfall is typically associated with quasi-stationary synoptic circulation, favorable vertical motion, and abundant moisture supply [1,2]. The topography of North China exerts a crucial influence on rainfall distribution. The Taihang Mountains (THM) to the west and the Yanshan Mountains (YSM) to the north rise steeply above the adjacent eastern plains, creating a sharp contrast, with elevations exceeding 1000 m in the mountains but dropping to only a few tens of meters across the plains (Figure 1a). In recent decades, centers of extreme precipitation have frequently been observed along the eastern foothills of the THM and YSM. Representative cases include the Beijing extreme rainfall event on 21 July 2012 [3,4,5,6], the “7.19” North China rainfall during 19–20 July 2016 [7,8], and the extreme rainfall event on 21 July 2023 [9,10,11]. Synoptic analyses of these events reveal that when northward-moving typhoons or extratropical cyclones are blocked by high-pressure systems, prolonged and intense rainfall often develops along the foothills of THM and YSM.
Previous studies have highlighted the dynamic effects of the THM in shaping these events. Continuous southeasterly winds impinging on the mountain slopes initiate convection, while low-level easterly flows transport abundant warm, moist air into the region, modulating rainfall distribution [4,9,12]. The THM enhances low-level convergence and vertical wind shear, supporting convection initiation and improving precipitation efficiency [13]. Low-level jets (LLJs) further transport moisture that can be lifted over mountainous terrain, where uneven heating in the planetary boundary layer facilitates mesoscale system intensification [9,14,15,16,17,18]. Mesoscale topography not only influences airflow dynamics but also alters thermodynamic structures in the boundary layer, which helps organize and sustain mesoscale convective systems [19]. For example, a meso-β scale linear MCS intensified under the combined effects of a southerly boundary jet and topographic vortex circulation, producing local extreme rainfall exceeding 100 mm h−1 in the 21 July 2023 event [11]. Terrain has also been shown to modify cloud microphysical processes, further amplifying precipitation [8,20].
In addition to these topographic influences, the intensity of LLJs, the degree of atmospheric instability, and the transport of moisture strongly modulate the local distribution and intensity of rainfall [21,22,23,24,25]. Nevertheless, relatively few studies have systematically combined the analysis of moisture supply with specific physical processes such as LLJs, mesoscale convective systems (MCSs), and terrain-induced vortices during extreme rainfall events. Unlike the well-known typhoon-induced precipitation of July 2023 [9,10], the late-July 2024 event was driven by a strong low trough over central and eastern China, interacting with the meridional western Pacific subtropical high (WPSH). This quasi-stationary synoptic circulation established a persistent south–north rainfall belt along the second-step terrain of China (Figure 1a). Enhanced by the dynamic effects of the THM, North China experienced continuous heavy rainfall lasting more than two days. To better understand this event, this study applies a moisture budget diagnosis using ground-based observations, satellite data, and reanalysis products. The objective is to investigate the multi-scale interactions that governed moisture supply under complex topographic conditions during different precipitation stages. Section 2 introduces the data and methods, Section 3.1 describes the event and its synoptic circulation, Section 3.2 examines the role of multi-scale weather systems in modulating moisture supply, and Section 4 summarizes the findings and discusses implications for future research on extreme rainfall in North China.

2. Data and Method

Hourly precipitation data from meteorological stations over North China under the China Meteorological Administration (CMA) are utilized to examine the rainfall characteristics during this heavy rainfall event. The temperature of blackbody brightness at the 10.8 μm band of the Advanced Geosynchronous Radiation Imager (AGRI) carried on the Fengyun-4B (FY-4B) satellite is used to clarify the evolution of the MCSs during the heavy rainfall event. FY-4B is the second satellite of the second-generation geostationary meteorological satellite Fengyun-4 series. Compared to the predecessor FY-4A, FY-4B AGRI has enhanced capabilities, with improvements in spectral resolution and sensitivity, which features a spatial resolution ranging from 500 m to 4 km and perform full-disk observations every 15 min. The data used in this study has the temporal resolution of regional observation over China and its vicinity is about 5 min. The fifth-generation European Centre for Medium-Range Weather Forecasts reanalysis dataset (ERA5) with a temporal resolution of 1 h and a spatial resolution of 0.25° × 0.25° [26] is adopted to analyze the synoptic circulation, mesoscale systems and calculate the water vapor budget.
The moisture budget Equation (1) [27] is used to explore the moisture variation and its relationship with multi-scale systems during this persistent heavy rainfall event. Geopotential height, temperature, horizontal wind (u component and v component), vertical velocity and specific humidity from the ERA5 reanalysis dataset are applied to diagnose the moisture budget.
q t = · V q ω q p Q 2 L q
In the moisture budget formulation, V denotes the horizontal wind vector, ∇ the divergence operator, Q 2 the apparent moisture sink/source, and L q the latent heat of condensation. In Equation (1), the first term on the right-hand side represents horizontal moisture flux convergence (MFC), the second term vertical moisture flux convergence (MFC_v), and the third term the effects of condensation and evaporation.
V q = V   q ADV _ q     q V CON _ q = u q x ADV _ q _ zon v q y ADV _ q _ mer q u x CON _ q _ zon q v y CON _ q _ mer
MFC can be decomposed into horizontal advection (ADV_q) and moisture flux convergence resulting from wind convergence (CON_q). Both components are decomposed into zonal and meridional contributions: u   q / x is the zonal advection moisture (ADV_q_zon), v   q / x is the meridional advection moisture (ADV_q_mer). q   u / x is the zonal moisture convergence (CON_q_zon) and q   v / y is the meridional moisture convergence (CON_q_mer).
ω q p = ω q p ADV _ q _ ver q ω p CON _ q _ ver
Vertical moisture flux convergence (MFC_v) is divided into two terms in Equation (3): ω   q / p is the vertical advection moisture (ADV_q_ver) and q   ω / p is the vertical moisture convergence (CON_q_ver). As the storage term ( ω q ) / p is negligible, the dominant terms in Equation (1) are the moisture flux convergence and net precipitation ( Q 2 / L q ) . Because All terms are vertically integrated from the ground to 100 hPa.

3. Results

3.1. The Persistent Heavy Rainfall and Its Synoptic Circulation

The persistent heavy rainfall belt extended across the second-step terrain regions from southwest to northeast between 29 July and 30 July 2024 (Figure 1a). Within this elongated precipitation zone, the most intense accumulated rainfall was observed in North China, particularly in Hebei Province, Beijing, and Tianjin (Figure 1b). Precipitation centers were mainly concentrated in northeastern Beijing and Hebei Province, where the maximum accumulated rainfall exceeded 300 mm in northeastern Hebei. The rainfall initially developed near the boundary between Henan and Hebei provinces at 12 UTC (20 BJT) on 29 July (Figure 2). Subsequently, the rainfall cluster moved northward within Hebei Province, with the precipitation center located over the plains east of the southern Taihang Mountains (THM). Around 21 UTC (05 BJT) on the early morning of 30 July, the rainfall belt aligned in a west–east orientation and began to affect Beijing and Tianjin. The peak hourly rainfall occurred over Beijing between 23 UTC (07 BJT) on 29 July and 00 UTC (08 BJT) on 30 July. Thereafter, the rainfall system propagated northeastward while gradually decreasing in intensity. After 06 UTC (14 BJT), a new rainfall cluster began to form over the area between Beijing and Tianjin. A more extensive rainfall band oriented in a northeast–southwest direction developed between 09 UTC (17 BJT) and 12 UTC (20 BJT) on 30 July. Finally, the rainfall belt shifted eastward while continuing to weaken in intensity.
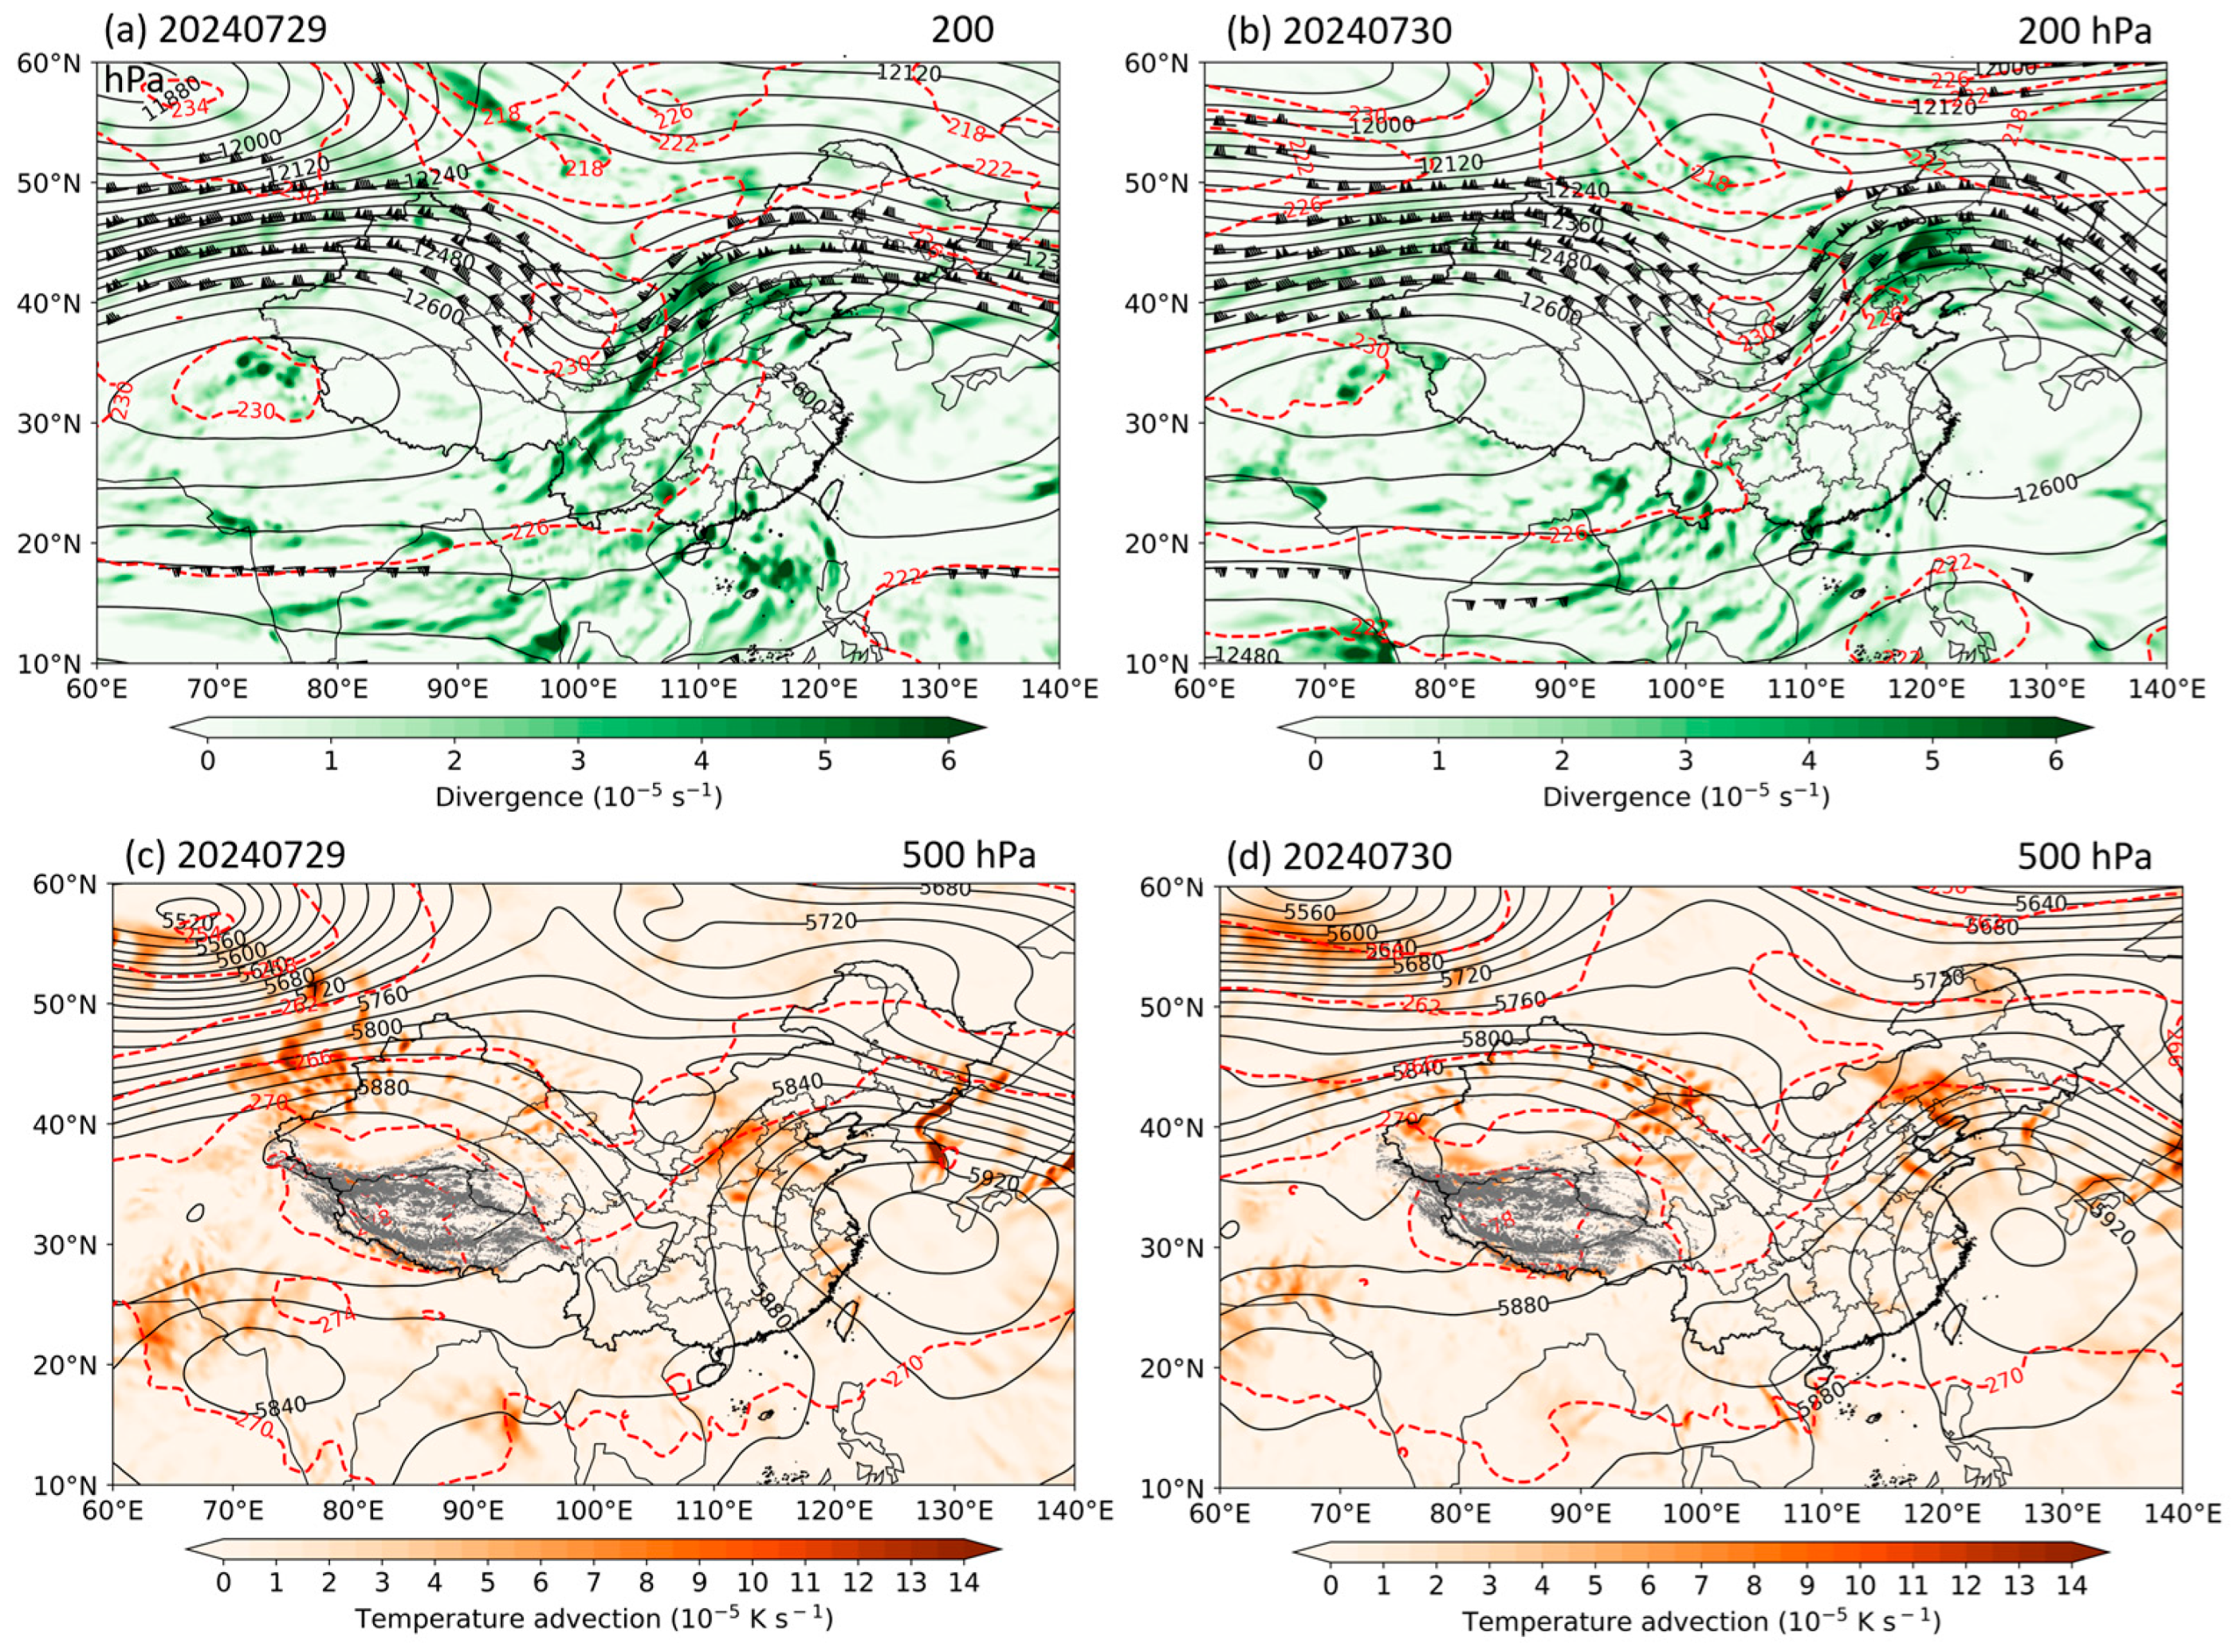
The synoptic circulation pattern in the upper (200 hPa) and middle (500 hPa) levels of the troposphere were relatively stable from 29 July to 30 July 2024 (Figure 3). At 200 hPa (Figure 3a,b), the middle and high latitudes of the entire Eurasian region exhibited a circulation pattern characterized by a strong low trough. This stronger eastern trough was situated over the East Asia (named East Asian Great Trough). The upper-level jet stream remained stable between 40° N and 50° N. Low-latitude regions were influenced by the South Asian High, and the Western Pacific Subtropical High (WPSH) extended northward to the southern Korean Peninsula. Both the Yellow Sea and the eastern coastal areas of China were under the influence of the subtropical high. The East Asian Great Trough, situated between these two high-pressure systems, affected central, northern, and northeastern China. From 29 July to 30 July, as the thermal trough lagged slightly behind the geopotential height trough, the East Asian Great Trough continuously deepened and intensified, with a slight eastward shift in the trough line. The synoptic pattern at 500 hPa was broadly consistent with that at 200 hPa. On 29 July, a low-pressure center persisted south of the western continental high over the Indochinese Peninsula and formed a low-pressure belt in conjunction with the East Asian Great Trough. Additional low-pressure centers developed over Yunnan and Guizhou provinces from 30 July to 31 July. Ahead of the East Asian Great Trough, upper-level divergence (200 hPa) and mid-level warm advection (500 hPa) favored the development of convection in the middle and lower troposphere.
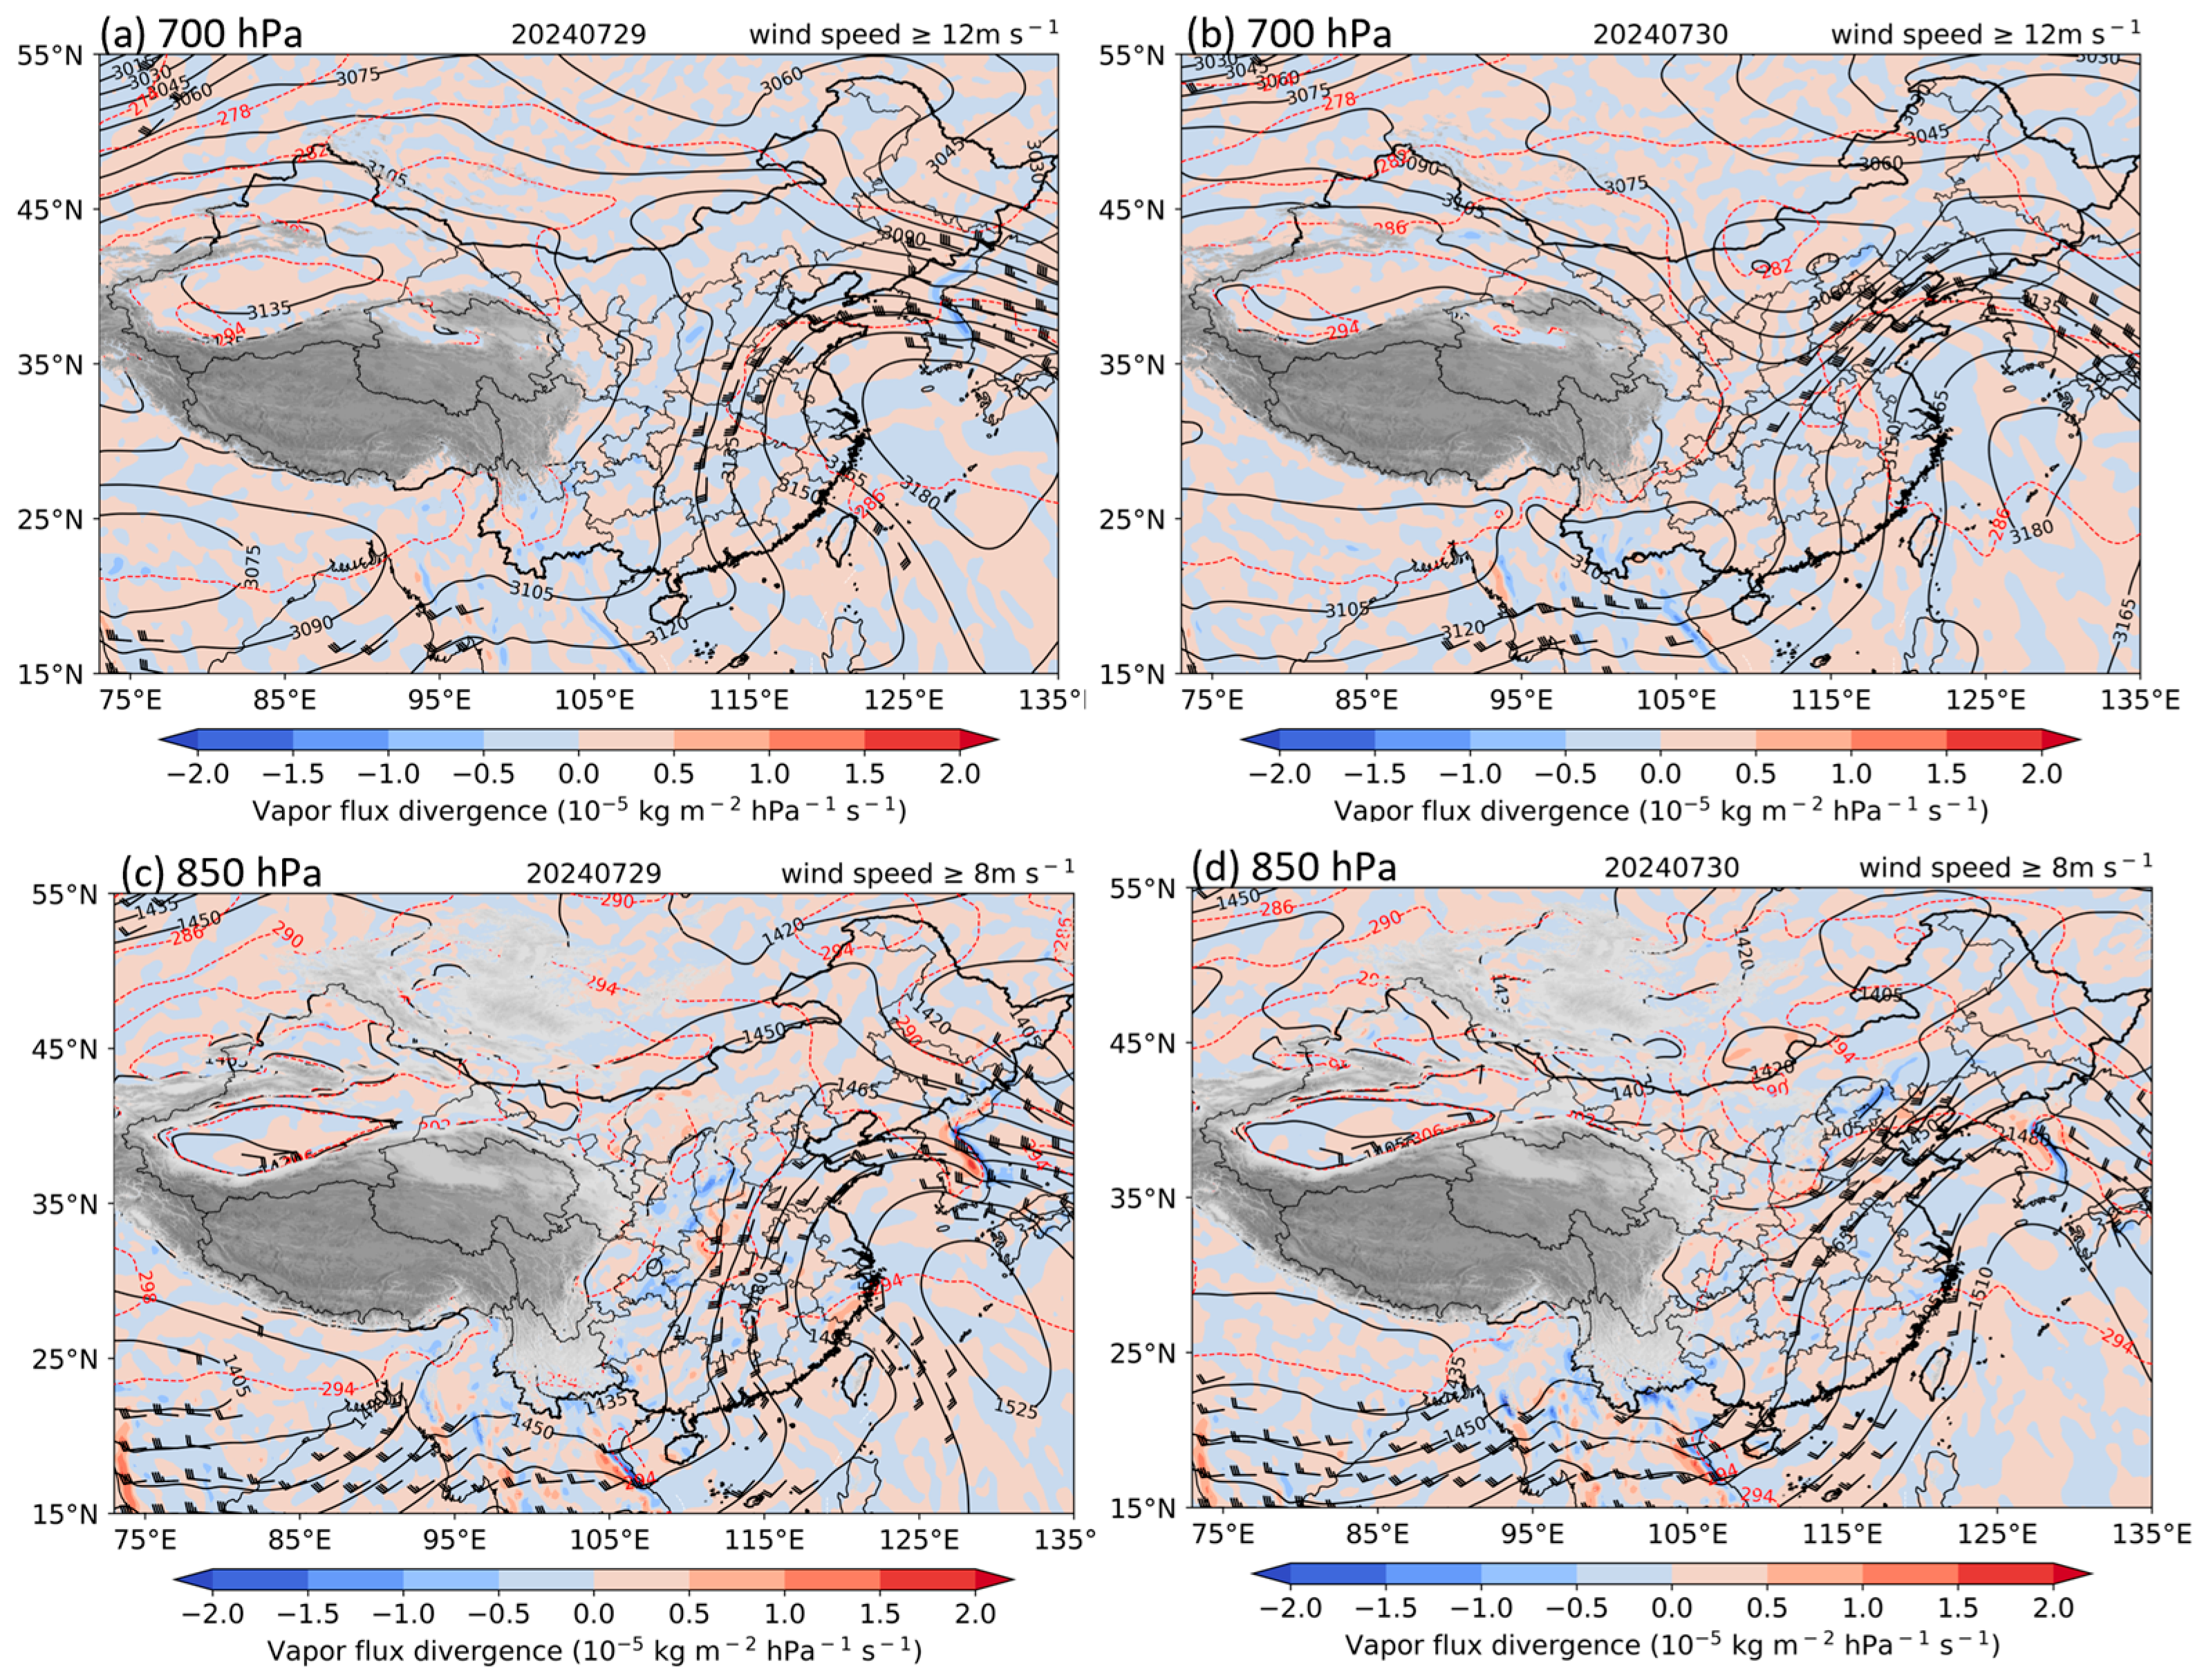
The circulation patterns at 700 hPa and 850 hPa were generally consistent (Figure 4). The WPSH remained dominant over the entire eastern oceanic region. On 29 July, the low-level jet located along the periphery of the WPSH affects central China (Figure 4a,c). Meanwhile, a low-pressure system developed over western Hebei Province due to the intensification of the East Asian Great Trough at 500 hPa on 30 July (Figure 4b,d). The enhanced pressure gradient between the low-pressure system and the WPSH strengthened the low-level jet (LLJ) at both 700 hPa and 850 hPa. Consequently, the LLJ stream extended meridionally across the central and eastern parts of China from 29 July to 30 July. Under the stable synoptic conditions, moisture from the Indian Ocean was transported along the eastern slope of the second-step topography and continuously advected into North China by the LLJ. This process led to significant moisture convergence over the region, supplying abundant water vapor to North China.

3.2. Multi-Scale Mechanisms During This Heavy Rainfall Event

3.2.1. Temporal Variation in Moisture

During this heavy rainfall event, the East Asian Great Trough at 500 hPa shifted eastward from 105° E to 110° E, accompanied by an intensification of its amplitude. In response, the LLJ at 700 and 850 hPa (wind barbs in Figure 4) propagated northward from regions south of 35° N into North China (Figure 4). The rainfall belt was situated within the core influence region of LLJ in the lower troposphere (Figure 4 and Figure 5). Previous studies have demonstrated that LLJs can generate strong shear instability, and their terminus is frequently associated with low-level convergence, which provides the dynamic condition for the water vapor transportation and accumulation [3,17].
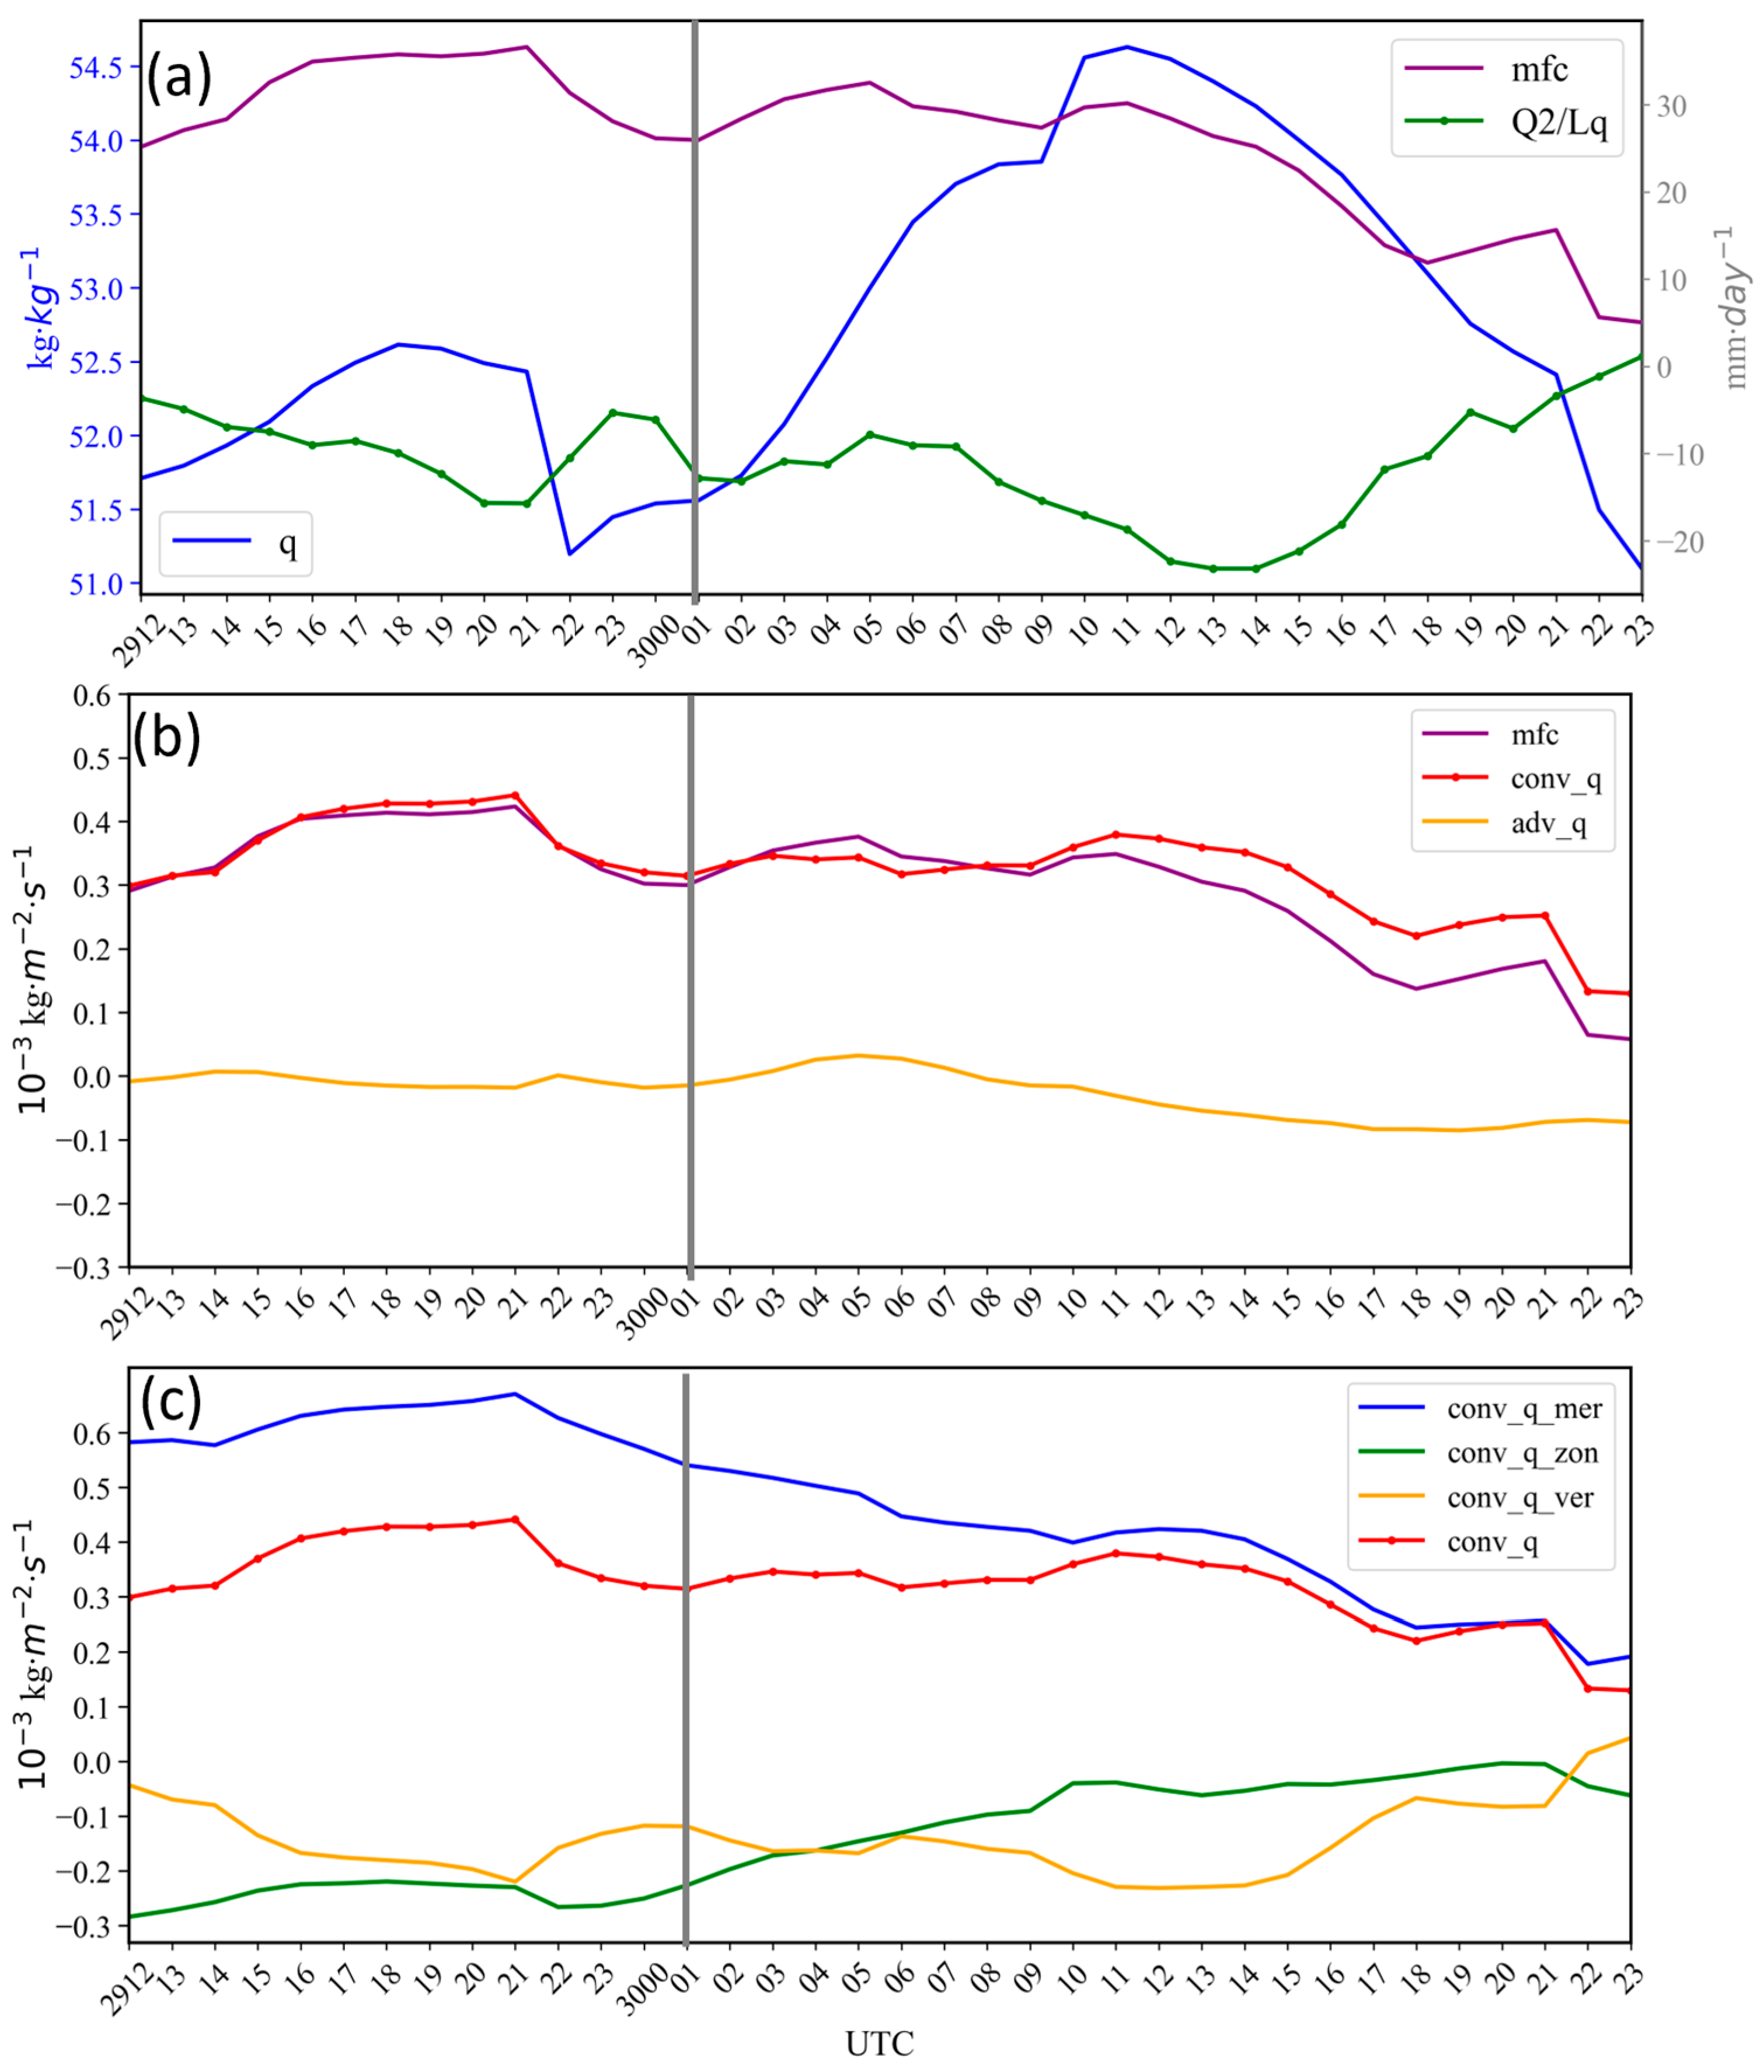
To further investigate the dynamical characteristics of moisture transport associated with heavy rainfall along THM, a moisture budget analysis (Equation (1)) was conducted. Since water vapor was primarily concentrated in the lower troposphere, the budget terms were vertically integrated from the surface to 100 hPa. The temporal evolution of water vapor content (specific humidity, blue line) and the right-hand-side terms of Equation (1), including horizontal component of moisture flux convergence (MFC, purple line) and the moisture loss or gain (Q2/Lq, green line) were presented in Figure 5a. Two distinct peaks in specific humidity are evident: the first occurred between 18 And 21 UTC on 29 July (02–05 BJT on 30 July), and the second between 10 And 12 UTC (18–20 BJT) on 30 July. Both peaks coincided with periods of enhanced hourly precipitation (Figure 2d,e,h,l and Figure 5a). During the first peak, specific humidity increased steadily in the early evening (around 12 UTC/20 BJT on 29 July) and reached its maximum late at night to early morning (18–21 UTC on 29 July/02–05 BJT on 30 July), which was closely tied to the nocturnal boundary-layer processes. In contrast, the second peak developed in the afternoon to the early evening (10–12 UTC/18–20 BJT on 30 July), when specific humidity rose sharply after the sunrise and declined during the nighttime, likely reflecting the influence of synoptic-scale circulation. The differences in the underlying physical mechanism of these two peaks will be further clarified through moisture budget analysis.
Among the budget terms, horizontal moisture flux convergence (MFC), the first term on the right-hand side of Equation (1), was clearly the dominant factor controlling the temporal variation in water vapor during this heavy rainfall event (Figure 5a), which was consistent with the moisture budget analysis of the persistent heavy rainfall in July 2023 [28]. The two MFC maxima were highly consistent with the variations in both atmospheric moisture and hourly precipitation. As expressed in Equation (2), MFC can be decomposed into moisture convergence (conv_q) and moisture advection (adv_q). During this event, adv_q remained small and negative, and thus negligible compared to the dominant contribution of conv_q (Figure 5b). This highlights that the accumulation of water vapor through wind convergence played the leading role in sustaining the moisture supply. Figure 5c illustrates the temporal evolution of the components of moisture flux convergence and total convergence during this heavy rainfall event. The meridional component of moisture flux convergence (blue line in Figure 5c) dominated throughout the period, maintaining positive values and exhibiting two distinct peaks: a primary maximum exceeding 4 × 10⁻³ kg·m−2·s−1 near 21 UTC on 29 June (05 BJT 30 June) and secondary maximum of approximately 3.5 × 10⁻³ kg·m−2·s−1 near 12 UTC (20 BJT) on 30 June. The zonal component (green line in Figure 5c) remained comparatively weak, exhibiting only minor positive values after 10 UTC (18 BJT) on 30 June. The total convergence (red line) closely followed the meridional contribution, reaching its peaks at 21 UTC on 29 June (05 BJT 30 June) around 11–13 UTC (19–22 BJT) on 30 June. These results indicated that meridional moisture transport is the primary contributor to moisture convergence during this period. Based on the temporal evolution of moisture convergence, the heavy rainfall event can be delineated into two distinct phases. The first phase was characterized by a nocturnal rainfall peak, which commenced at 12 UTC (20 BJT) on 29 July and concluded at 01 UTC (09 BJT) on 30 July. The second phase was distinguished by an afternoon precipitation maximum, extending from 02 UTC (10 BJT) to 23 UTC on 30 July (08 BJT on 31 July).

3.2.2. Meridional Moisture Convergence and Nocturnal Rainfall Intensification

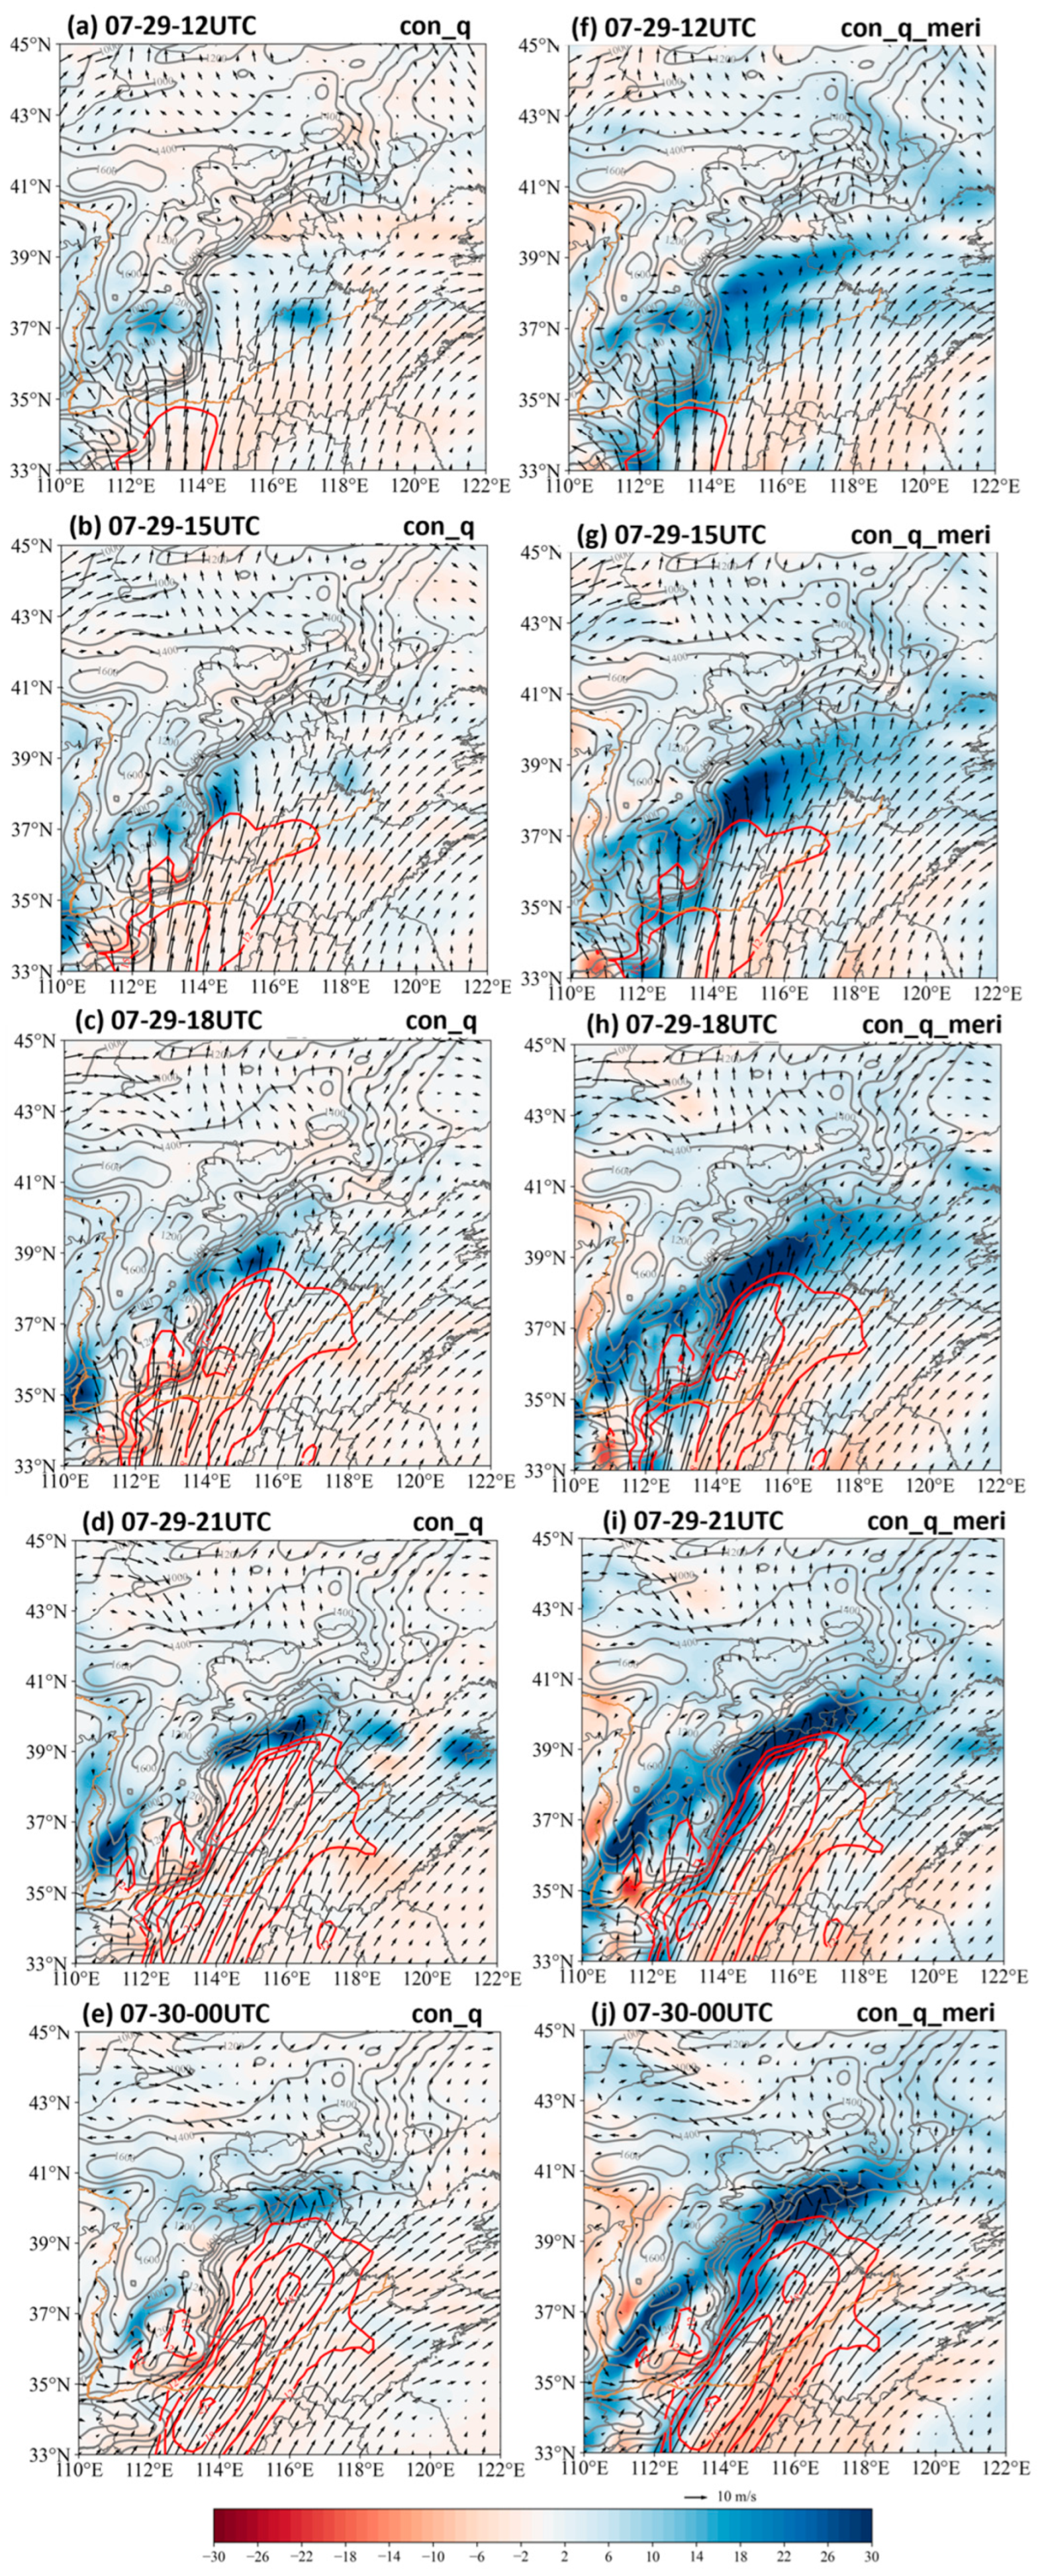
As described in the preceding analysis, meridional moisture convergence played a dominant role in determining the area-averaged moisture supply. This convergence was strongly associated with meridional flows that transported water vapor into North China. To further illustrate these transport dynamical processes, Figure 6 presents the horizontal distributions of total moisture convergence (left column) and meridional moisture convergence (right column) during the first rainfall phase. The pronounced nocturnal rainfall peak coincided with enhanced meridional moisture convergence (Figure 2a–e and Figure 5c), primarily associated with southerly flows transporting abundant water vapor from southern oceanic regions. The spatial pattern of total moisture convergence was generally consistent with the rainfall clusters (Figure 2 and Figure 6), although its magnitude was weaker than that of the meridional component due to opposing contributions from the zonal convergence components (Figure 5c). At the onset of the heavy rainfall event (12 UTC/20 BJT 29 July), the 850-hPa LLJ (wind speed greater than 12 m s−1) was mainly positioned over Henan Province (red line in Figure 6a). Correspondingly, relatively weak convergence emerged over southern Hebei Province, aligned with the eastern slope of the THM. As the LLJ strengthened in the evening, strong convergence advanced northward into central Hebei. By 18 UTC on 29 July (02 BJT on 30 July), the southerly winds on the northern flank of the LLJ underwent cyclonic turning, gradually developing an easterly component along the mountain slopes, which further enhanced convergence over the “trumpet-shaped” topography (orange box highlighted in Figure 6c,h). This dynamical adjustment strengthened low-level convergence and promoted significant moisture accumulation across southern Hebei. The topographic dynamic effect on local extreme rainfall was also significant in the event in July 2023 [15]. During the late-night to early-morning hours, the nocturnal LLJ further intensified, with its high wind speed core (>12 m/s) extending northward to the plains east of the southern THM by 21 UTC 29 July (04 BJT 30 July, Figure 6). The associated convergence zone moved into Beijing around 00 UTC (08 BJT) on 30 July, even as the LLJ began to weaken by early morning. The strongest hourly rainfall occurred along the eastern slope of northern THM during 22 UTC to 23 UTC on 29 July (05 BJT to 06 BJT on 30 July). In Summary, the intensification of the nocturnal LLJ facilitated northward water vapor transport and amplified low-level convergence along the eastern slope of the THM, primarily due terrain-induced blocking of the southwesterly flow. The progressive enhancement of meridional moisture convergence from evening to early morning was the dominant factor contributing to rainfall intensification during the first phase of this heavy rainfall event.

3.2.3. Moisture Convergence for the Afternoon Precipitation Maximum

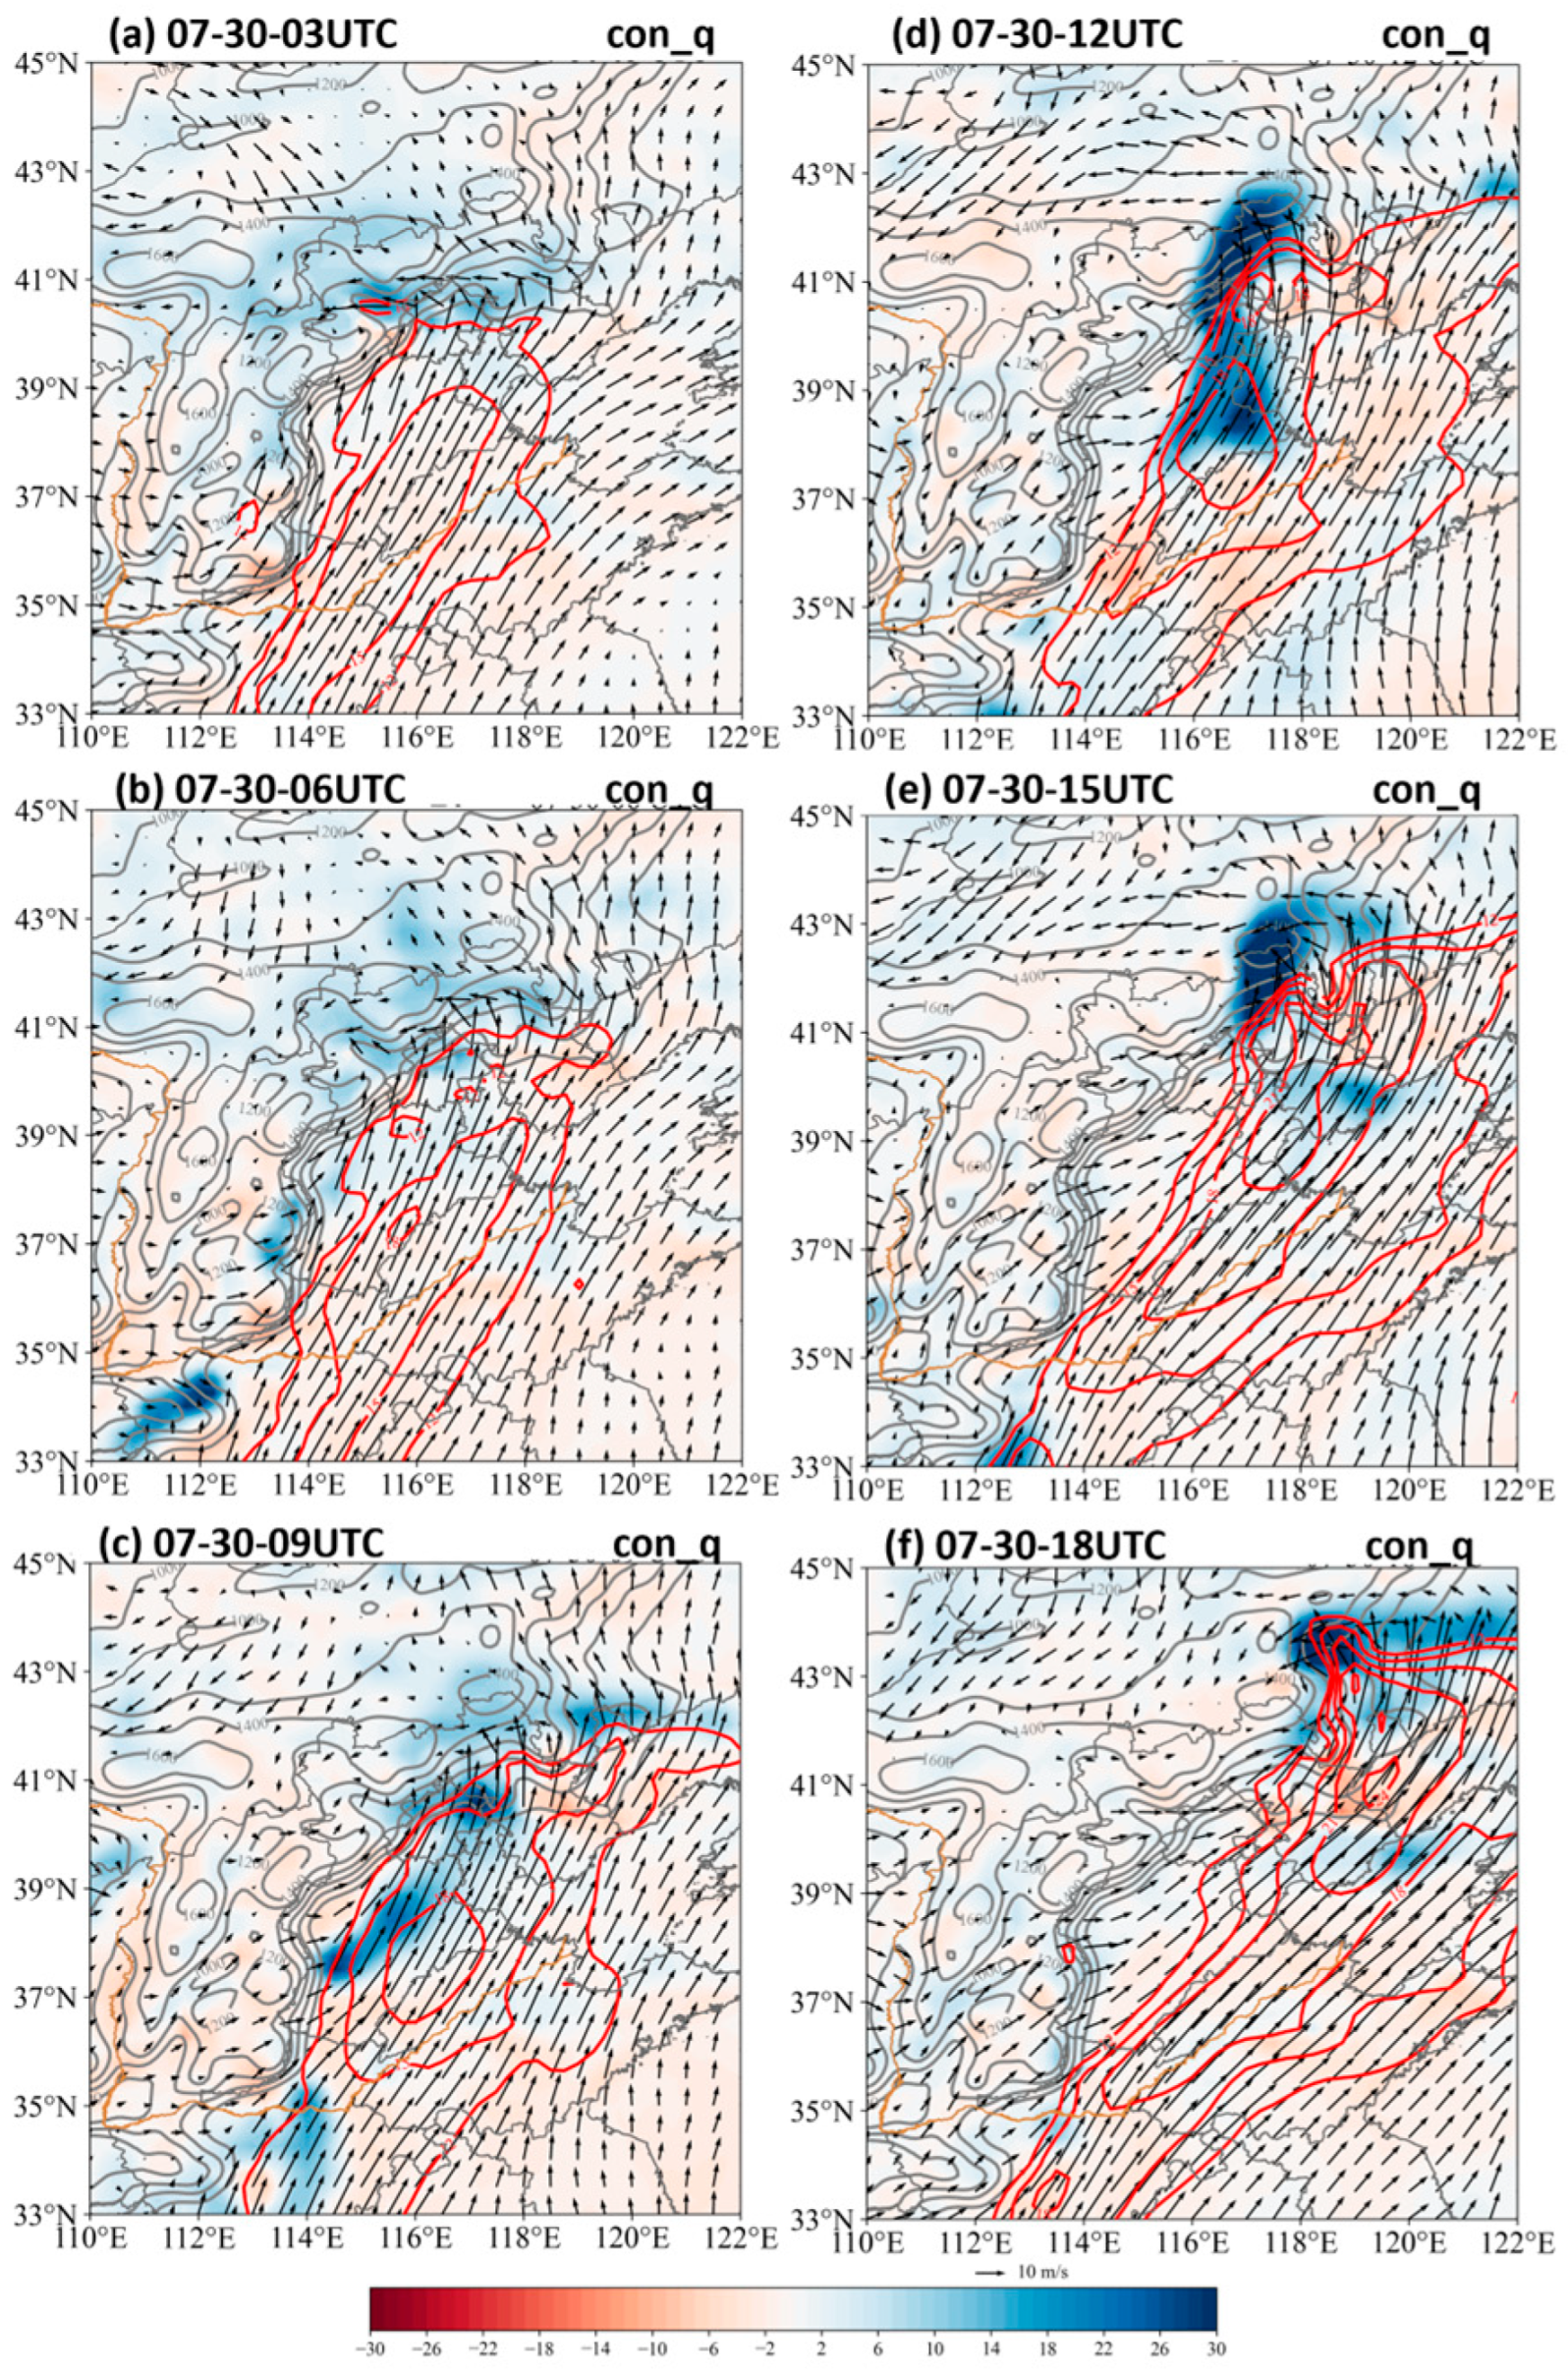
While the nocturnal phase was primarily governed by the intensification of LLJ and its associated meridional moisture transport along the eastern slope of the THM, the evolution of the second phase displayed a different dynamical configuration. In the daytime, large-scale circulation associated with the eastward-propagating Mongolian low trough exerted a stronger influence on moisture transport and convergence. This shift in the dominant mechanism led to the establishment of a new convergence belt and ultimately produced the afternoon precipitation maximum. Generally, the LLJ weakened during the daytime. However, wind speeds at both 850 hPa and 700 hPa resumed intensification after 03 UTC (11 BJT) on 30 July (Figure 6 and Figure 7), signaling the onset of the second phase. Concurrently, the Mongolian low trough at 700 hPa strengthened on 30 July and propagated eastward into North China (Figure 4b,d). As the trough deepened and evolved into a closed cyclone, southwesterly winds along its eastern flank intensified over the eastern edge of the second-step terrain (Figure 4b,d and Figure 7c,d). Consequently, the maximum total moisture convergence became concentrated over the plains east of the southern THM, distinct from the convergence center observed during the first phase (Figure 5a–c). Since the cyclone initially developed at 700 hPa, wind speed intensification at this level preceded that at 850 hPa by approximately 1–2 h (Figure 7a,b and Figure 8a,b). The effect of meridional moisture convergence established a convergence belt extending from southern Hebei Province to Beijing, spatially consistent with the rainfall cluster shown in Figure 4. Convective cells subsequently organized along this convergence belt on the western flank of the strengthening LLJ between 09 UTC (17 BJT) and 12 UTC (20 BJT) on 30 July (Figure 2g,h, Figure 7c,d and Figure 8c,d), resulting in the peak hourly rainfall of the second phase (Figure 2h). After 12 UTC (20 BJT) on 30 July, and meridional moisture convergence declined significantly. Although a mesoscale cyclone began to form at 700 hPa north of Hebei Province, diminished water vapor supply in the northern region led to reduced convergence, and precipitation weakened accordingly(Figure 8d–f). In contrast to the nocturnal intensification of moisture convergence during the first phase, driven primarily by LLJ enhancement along the eastern slope of the THM, the strong meridional convergence in the second phase was closely associated with the eastward propagation of the intensified low trough (cyclone). The strengthened southwesterly winds on the cyclone’s eastern flank facilitated moisture convergence, while afternoon convective clusters, triggered by local thermal forcing, organized and merged along the convergence zone on the western flank of the LLJ. Previous studies also demonstrated that LLJ further transported moisture where there was local heating in the boundary layer [10,18]. Together, these processes contributed to the daytime intensification of hourly precipitation during the second phase of the heavy rainfall event.

4. Conclusions and Discussion

This study investigated multi-scale mechanism that governed moisture supply under a complex topography distribution during one typical type of heavy rainfall event over North China. The heavy rainfall event happened during 29 to 30 July 2024, focusing on the interplay between synoptic-scale circulation, mesoscale moisture convergence, and topographic effects. The synoptic circulation during the event was characterized by the East Asian Great Trough, the South Asian High, and the northward-extended WPSH, creating a favorable large-scale background for moisture transport and convective development. Upper-level divergence at 200 hPa and mid-level warm advection at 500 hPa provided additional dynamical support for sustained convection. These observations highlight the multi-scale characteristics of heavy rainfall events, including synoptic-scale circulation, low-level jets, mesoscale convection, and terrain effects, that control precipitation intensity and distribution.
The event was characterized by two distinct rainfall phases, including nocturnal and afternoon peaks, each governed by different dominant mechanisms. During the nocturnal phase, rainfall intensification was primarily controlled by the low-level jet (LLJ) at 850 hPa, which transported substantial water vapor from southern regions into North China. Meridional moisture convergence progressively increased from evening to early morning, with terrain-induced blocking along the eastern slope of the Taihang Mountains (THM) further enhancing convergence. The combination of enhanced meridional moisture flux and topographic forcing resulted in concentrated nocturnal precipitation, particularly over southern and central Hebei and Beijing. This phase demonstrates the critical role of nocturnal LLJ dynamics and terrain modulation in amplifying heavy rainfall, consistent with prior studies emphasizing LLJ as key moisture transport mechanisms in East Asian summer rainfall events [3]. In contrast, the afternoon phase was primarily influenced by the eastward propagation of the Mongolian low trough and the associated cyclonic circulation. Concurrently, local convective clusters, initiated by surface thermal forcing, organized along the western flank of the LLJ, further intensifying precipitation. The resulting rainfall distribution shifted from the mountainous slopes to the adjacent plains, illustrating how synoptic-scale trough propagation and mesoscale convective processes collectively modulate the spatial pattern and timing of heavy rainfall.
Overall, this study emphasizes three key mechanisms underlying the observed heavy rainfall: meridional moisture transport by low-level jets, which dominated nocturnal rainfall enhancement and determined the initial spatial distribution of precipitation along the THM. Synoptic-scale trough propagation and cyclonic circulation controlled the daytime redistribution of moisture and precipitation toward the plains east of the THM. Mesoscale convective organization and topographic modulation intensified local precipitation through convergence enhancement and terrain-induced uplift.
The main findings provide insight into the temporal evolution and spatial heterogeneity of extreme rainfall in North China. In recent years, North China has experienced several episodes of persistent and even extreme precipitation. The selected case represents one of the typical heavy rainfall types in this region (e.g., Sun et al., 2005 [29]) that was influenced by synoptic, mesoscale, and local-scale processes. Through a detailed multi-scale analysis, this study elucidates key dynamical and thermodynamic processes—such as the evolution of a low trough, low-level jet development, moisture transport, and local convection—that are broadly consistent with previous regional findings. Accordingly, we believe the results provide meaningful process-level insights that contribute to the broader understanding of multi-scale mechanisms in this region. Future studies will incorporate multiple cases to further assess the generality and robustness of these mechanisms. In conclusion, extreme rainfall in North China is governed by a complex interaction of multi-scale processes. Understanding the relative contributions of nocturnal LLJ intensification, synoptic-scale cyclonic forcing, and local terrain effects is essential for both the operational forecasting and risk assessment of heavy rainfall hazards in the region. Furthermore, recognizing the diurnal variability of precipitation mechanisms provides insights for operational monitoring and early warning of high-impact rainfall events in North China.

Author Contributions

Conceptualization, Y.Z.; methodology, H.W. and Y.Z.; software, Y.Z.; formal analysis, H.W.; data curation, Y.Z.; writing—original draft preparation, H.W. and Y.Z.; writing—review and editing, H.W. and Y.Z.; visualization, Y.Z. and H.W. All authors have read and agreed to the published version of the manuscript.

Funding

This work was supported by the National Key R&D Program of China (Grant No. 2022YFB2403000).

Institutional Review Board Statement

Not applicable.

Informed Consent Statement

Not applicable.

Data Availability Statement

Ground-based rain-gauge precipitation can be accessed in the website http://data.cma.cn/ (accessed on 15 January 2025) with approval of China Meteorological Administration. ERA5 reanalysis hourly data on pressure level can be derived from website https://cds.climate.copernicus.eu/datasets/reanalysis-era5-pressure-levels?tab=overview (accessed on 15 February 2025).

Acknowledgments

The data computing and visualization is supported by the National Key Scientific and Technological Infrastructure “Earth System Numerical Simulation Facility” (Earth-Lab).

Conflicts of Interest

The authors declare no conflicts of interest.

References

  1. Doswell, C.A.; Brooks, H.E.; Maddox, R.A. Flash flood forecasting: An ingredients based methodology. Weather Forecast. 1996, 11, 560–581. [Google Scholar] [CrossRef]
  2. Rebora, N.; Molini, E.; Casella, E.; Comellas, A.; Fiori, E.; Pignone, F.; Siccardi, F.; Silvestro, F.; Tanelli, S.; Parodi, A. Extreme rainfall in the Mediterranean: What can we learn from observations? J. Hydrometeorol. 2013, 14, 906–922. [Google Scholar] [CrossRef]
  3. Chen, G.; Sha, W.; Iwasaki, T.; Wen, Z. Diurnal cycle of a heavy rainfall corridor over East Asia. Mon. Weather Rev. 2017, 145, 3365–3389. [Google Scholar] [CrossRef]
  4. Chen, Y.; Sun, J.; Xu, J.; Yang, S.N.; Zong, Z.P.; Chen, T.; Fang, C.; Sheng, J. Analysis and thinking on the extremes of the 21 July 2012 torrential rain in Beijing. PartI: Observation and thinking. Meteorol. Mon. 2012, 38, 1255–1266. (In Chinese) [Google Scholar] [CrossRef]
  5. Sun, J. The effects of vertical distribution of the lower-level flow on precipitation location. Plateau Meteorol. 2005, 24, 62–69. (In Chinese) [Google Scholar] [CrossRef]
  6. Zhang, D.; Lin, Y.; Zhao, P.; Yu, X.D.; Wang, S.Q.; Kang, H.W.; Ding, Y.H. The Beijing extreme rainfall of 21 July 2012: “Right results” but for wrong reasons. Geophys. Res. Lett. 2013, 40, 1426–1431. [Google Scholar] [CrossRef]
  7. Zhong, L.; Mu, R.; Zhang, D.L.; Zhao, P.; Zhang, Z.Q.; Wang, N. An observational analysis of warm-sector rainfall characteristics associated with the 21 July 2012 Beijing extreme rainfall event. J. Geophys. Res. Atmos. 2015, 120, 3274–3291. [Google Scholar] [CrossRef]
  8. Fu, J.; Ma, X.; Chen, T.; Zhang, F.; Zhang, X.D.; Sun, J.; Quan, W.Q.; Yang, S.N.; Shen, X.L. Characteristics and synoptic mechanism of the July 2016 extreme precipitation event in North China. Meteorol. Mon. 2017, 43, 528–539. (In Chinese) [Google Scholar] [CrossRef]
  9. Xia, R.; Zhang, D.; Fu, S.; Yin, J.F.; Wang, H.Y. On the anomalous development of a series of heavy rainfall events from central to North China during 19–21 July 2016. Q. J. R. Meteorol. Soc. 2022, 148, 272–293. [Google Scholar] [CrossRef]
  10. Gao, X.; Sun, J.; Yin, J.; Abulikemu, A. The impact of mountain-plain thermal contrast on precipitation distributions during the “23⋅7” record-breaking heavy rainfall over North China. Atmos. Res. 2024, 310, 107582. [Google Scholar] [CrossRef]
  11. Xia, R.; Ruan, Y.; Sun, J.; Liang, X.D.; Wu, C.; Li, F.; Li, J.; Yin, J.F.; Bao, X.H.; Li, M.X.; et al. Distinct mechanisms governing two types of extreme hourly rainfall Rates in the mountain foothills of North China during the passage of a typhoon remnant vortex from July 30 to August 1, 2023. Adv. Atmos. Sci. 2025, 42, 761–779. [Google Scholar] [CrossRef]
  12. Li, X.; Chen, T.; Zhao, W.; Chen, Y.; Fu, J.L.; Huang, X.; Shi, Y.; Shen, Y. Observational analysis of Mount Taihang’ s orographic effects on the “23·7” extreme precipitation event in North China. Chin. J. Atmos. Sci. 2025, 49, 629–644. (In Chinese) [Google Scholar] [CrossRef]
  13. Wang, C.; Yu, X.; Li, Z.; Li, Z.X.; Li, J.B.; Wang, X. Investigation of extreme flash-rain events on the impact of Taihang Mountain. Meteorol. Mon. 2017, 43, 425–433. (In Chinese) [Google Scholar] [CrossRef]
  14. Kang, Y.; Peng, X.; Wang, S.; Hu, Y.; Shang, K.; Lu, S. Observational analyses of topographic effects on convective systems in an extreme rainfall event in northern China. Atmos. Res. 2019, 229, 127–144. [Google Scholar] [CrossRef]
  15. Martin Ra Neiman, P.; Wick, G. Satellite and CALJET aircraft observations of atmospheric rivers over the eastern North Pacific Ocean during the winter of 1997/98. Mon. Weather Rev. 2004, 132, 1721–1745. [Google Scholar] [CrossRef]
  16. James, C.; Houze, R., Jr. Modification of precipitation by coastal orography in storms crossing northern California. Mon. Weather Rev. 2005, 133, 3110–3131. [Google Scholar] [CrossRef]
  17. Hodges, D.; Pu, Z. Characteristics and variations of low-level jets in the contrasting warm season precipitation extremes of 2006 and 2007 over the Southern Great Plains. Theor. Appl. Climatol. 2019, 136, 753–771. [Google Scholar] [CrossRef]
  18. Luo, Y.; Du, Y. The roles of low-level jets in “21·7” Henan extremely persistent heavy rainfall event. Adv. Atmos. Sci. 2023, 40, 350–373. [Google Scholar] [CrossRef]
  19. Luo, Y.; Zhang, R.; Wan, Q.; Wang, B.; Wong, W.K.; Hu, Z.; Jou, B.J.-D.; Lin, Y.; Johnson, R.H.; Chang, C.P.; et al. The southern China monsoon rainfall experiment (SCMREX). Bull. Am. Meteorol. Soc. 2017, 98, 999–1013. [Google Scholar] [CrossRef]
  20. Hu, X.; Yuan, W.; Yu, R. The extraordinary rainfall over the eastern periphery of the Tibetan Plateau in August 2020. Adv. Atmos. Sci. 2021, 38, 2097–2107. [Google Scholar] [CrossRef]
  21. Lin, Y.L.; Chiao, S.; Wang, T.; Kaplan, M.L.; Weglarz, R.P. Some common ingredients for heavy orographic rainfall. Weather Forecast. 2001, 16, 633–660. [Google Scholar] [CrossRef]
  22. Medina, S.; Houze, R.A. Air motions precipitation growth in Alpine storms. Q. J. R. Meteorol. Soc. 2003, 129, 345–371. [Google Scholar] [CrossRef]
  23. Rotunno, R.; Ferretti, R. Orographic effects on rainfall in MAPcases IOP2b IOP8. Q. J. R. Meteorol. Soc. 2003, 129, 373–390. [Google Scholar] [CrossRef]
  24. Jiang, Q. Moist dynamics and orographic precipitation. Tellus A 2003, 55, 301–316. [Google Scholar] [CrossRef]
  25. Smith, R.B.; Barstad, I. Alinear theory of orographic precipitation. J. Atmos. Sci. 2004, 61, 1377–1391. [Google Scholar] [CrossRef]
  26. Hersbach, H.; Bell, B.; Berrisford, P.; Hirahara, S.; Horányi, A.; Muñoz-Sabater, J.; Nicolas, J.; Peubey, C.; Radu, R.; Schepers, D.; et al. The ERA5 global reanalysis. Q. J. R. Meteorol. Soc. 2020, 146, 1999–2049. [Google Scholar] [CrossRef]
  27. Lubis, S.W.; Hagos, S.; Chang, C.-C.; Balaguru, K.; Leung, L.R. Cross-equatorial surges boost MJO’s southward detour over the Maritime Continent. Geophys. Res. Lett. 2023, 50, e2023GL104770. [Google Scholar] [CrossRef]
  28. Sun, W.Y.; Zhu, C.W.; Jiang, N. A Super Cluster of extreme rainfall event over North China in July 2023: Role of typhoon-monsoon interaction, Environ. Res. Commun. 2025, 7, 051007. [Google Scholar] [CrossRef]
  29. Sun, J.H.; Zhang, X.L.; Wei, J.; Zhao, S.X. A study on severe heavy rainfall in North China during the 1990s. Clim. Environ. Res. 2005, 3, 492–506. (In Chinese) [Google Scholar]
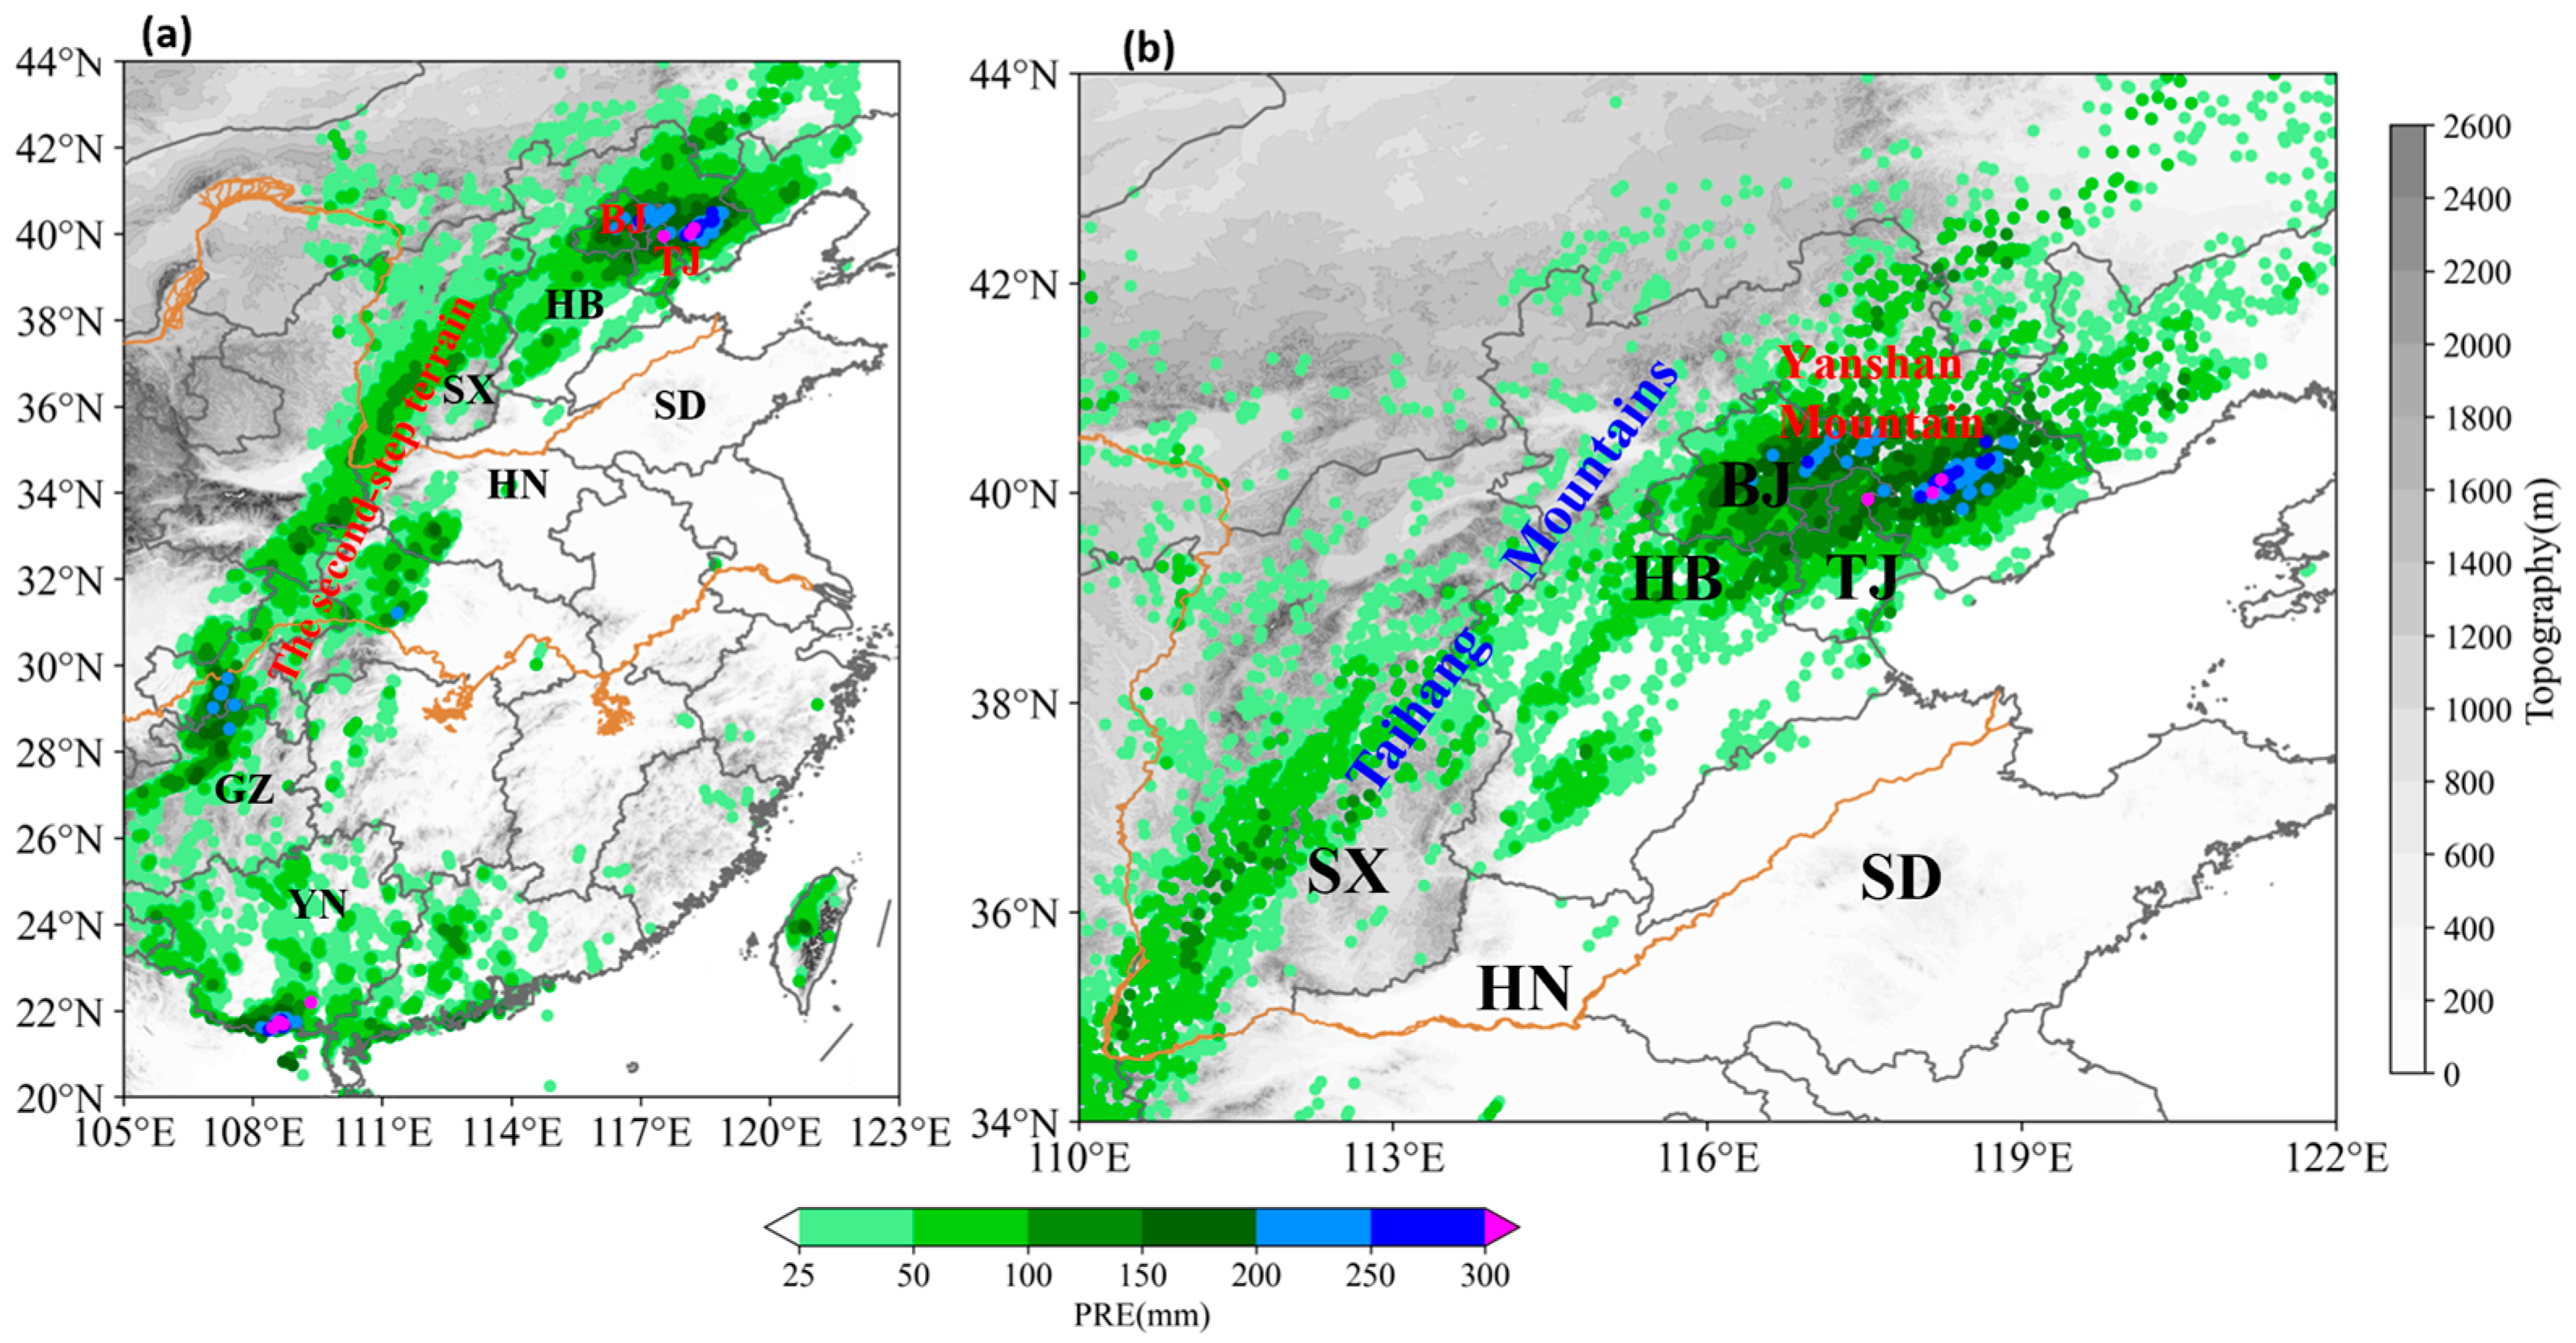
Figure 1. The total accumulated rainfall during the persistent heavy rainfall event from 12UTC (20 BJT) on 29 July to 23UTC on 30 July (07 BJT on 31 July). (a) Rainfall amount over central and eastern China; (b) Precipitation over northern China (unit: mm). Gray shadings indicate topographic elevation (unit: m). The abbreviations BJ, TJ, HB, SX, SD, HN, GZ, and YN denote Beijing, Tianjin, Hebei, Shanxi, Shandong, Henan, Guizhou, and Yunnan, respectively.
Atmosphere 16 01241 g001
Figure 2. The hourly precipitation over North China from 12 UTC (20 BJT) 29 July to 23 UTC 30 July (07 BJT 31 July) (unit: mm). (al) symbolize the times from 12 UTC 29 July to 21 UTC 30 July with 3-h interval.
Atmosphere 16 01241 g002
Figure 3. Geopotential height (black solid lines, unit: gpm), temperature (red dashed lines, unit: K), wind field (wind barbs, wind speed greater than 25 m s−1) and divergence (green shadings, unit: 10−5s−1) at 200 hPa (a,b); geopotential height (black solid lines, unit: gpm), temperature (red dashed lines, unit: K), wind field (wind barbs, wind speed greater than 15 m s−1) and temperature advection (orange shadings, unit: 10−5 Ks−1) at 500 hPa (c,d).
Atmosphere 16 01241 g003
Figure 4. Geopotential height (black solid lines, unit: gpm), temperature (red dashed lines, unit: K), wind field (wind barbs, wind speed ≥12 m s−1 at 700 hPa; wind speed ≥8 ms−1 at 850 hPa) and water vapor flux divergence (shadings, unit: 10−5 kg m−2 hPa−1 s−1), (a,b) are for 700 hPa; (c,d) are for 850 hPa.
Atmosphere 16 01241 g004
Figure 5. Temporal evolution of water vapor (units: kg kg−1) and moisture budget terms (units: mm day−1) integrated from the surface to 100 hPa from 12 UTC (20 BJT) 29 July to 23 UTC 30 July (07 BJT 31 July). (a) specific humidity (blue line, left axis) and moisture budget term, including horizontal moisture flux convergence (MFC, purple line) and moisture sink/source (Q2/Lq, green line); (b) horizontal moisture flux convergence (MFC, purple line), convergence of moisture (conv_q, red line) and advection of moisture (adv_q, orange line); (c) convergence of moisture (red) and its meridional (blue) and zonal (green). The gray line is used to distinguish two phases during the heavy rainfall event.
Atmosphere 16 01241 g005
Figure 6. Horizontal distribution of (ae) total moisture convergence (shading, units: 10−3 kg m−2 s−1) and (fj) meridional moisture convergence (shading, units: 10−3 kg m−2 s−1) from 12 UTC (20 BJT) on 29 July to 00 UTC (08 BJT) on 30 July. Vectors denote the 850-hPa wind field. Red contours indicate wind speeds exceeding 12 m s−1, and gray contours represent topographic height (units: m).
Atmosphere 16 01241 g006
Figure 7. Horizontal distribution of (af) total moisture convergence (shading, units: 10−3 kg m−2 s−1) from 03 UTC to 18 UTC on 30 July. Vectors denote the 850-hPa wind field. Red contours indicate wind speeds exceeding 12 m s−1, and gray contours represent topographic height (units: m).
Atmosphere 16 01241 g007
Figure 8. Same as Figure 7, but the vectors and LLJ are for the wind field at 700 hPa, and the shadings are for the meridional component of moisture convergence from 03 UTC to 18 UTC on 30 July (af).
Atmosphere 16 01241 g008
Disclaimer/Publisher’s Note: The statements, opinions and data contained in all publications are solely those of the individual author(s) and contributor(s) and not of MDPI and/or the editor(s). MDPI and/or the editor(s) disclaim responsibility for any injury to people or property resulting from any ideas, methods, instructions or products referred to in the content.