Abstract
Atmospheric aerosols are known to alter the Earth’s radiative balance and influence climate. However, accurately quantifying the magnitude of aerosol-induced radiative forcing remains challenging. We characterize optical properties of biomass-burning (BB) and non-biomass-burning (NB) aerosols and quantify BB aerosol radiative forcing at two AERONET (AErosol RObotic NETwork) sites in Huancayo (Peru) and La Paz (Bolivia) during 2015–2021. From AERONET data, we derive aerosol optical depth (AOD), Ångström exponent (AE), single-scattering albedo (SSA), and asymmetry parameter (ASY). We then employ the SBDART model to calculate aerosol radiative forcing (ARF) on monthly and multiannual timescales. BB aerosols peak in September (AOD: 0.230 at Huancayo; 0.235 at La Paz), while NB aerosols reach maxima in September at Huancayo (0.109) and November at La Paz (0.104). AE values exceeding unity for BB aerosols indicate fine-mode dominance. Huancayo exhibited the highest BB ARF in November: +16.4 W m−2 at the top of the atmosphere (TOA), –18.6 W m−2 at the surface (BOA), and +35.1 W m−2 within the atmospheric column (ATM). This was driven by elevated AOD and high scattering efficiency. At La Paz, where SSA data was only available for September, BBARF values were also significant (+15.16 at TOA, –17.52 at BOA, and +32.73 W m−2 within the ATM). This result underscores the importance of quantifying the ARF, particularly over South America where data is scarce.
1. Introduction
Each year, millions of tonnes of suspended aerosols perturb Earth’s radiative balance and impact climate and human health. Atmospheric aerosols are solid or liquid particles ranging from 0.001 to 100 µm in diameter [1,2]. They originate from natural processes—such as dust uplift and sea-salt generation—and from anthropogenic activities, notably fossil fuel combustion and biomass burning [3,4]. Black carbon emissions from wood-fuel use and wildfires account for 59–85% of global black carbon releases [5,6]. By scattering and absorbing solar and terrestrial radiation, these particles alter the net atmospheric radiative balance and reduce the solar irradiance reaching the surface [7].
Beyond degrading visibility and impairing respiratory health, aerosols modify cloud microphysics and precipitation patterns [8,9]. These effects extend to ecosystem dynamics and air quality, linking pollution episodes to broader environmental and societal consequences. However, the high spatial and temporal variability of aerosol concentrations and properties complicates precise quantification of these impacts [10,11].
Radiative forcing quantifies how aerosols perturb the balance between incoming and outgoing radiation at the tropopause [8,12]. This forcing is assessed at the top of the atmosphere (TOA), the bottom of the atmosphere (BOA), and within the atmospheric column (ATM) [13]. Key optical parameters—AOD, AE, SSA, and ASY—govern the magnitude of aerosol radiative forcing (ARF), depending on aerosol type, distribution, and optical behavior [14].
In tropical South America, logging, deforestation, and intensified droughts drive frequent Amazonian fires, making biomass burning a dominant aerosol source [15,16]. Fine particles (<10 µm) emitted in the basin can travel thousands of kilometers, transported by trade winds along the eastern Andean slope [16,17]. This study focuses on two high-altitude AERONET sites: Huancayo (12.040° S, 75.321° W; 3313 m a.s.l.) in Peru and La Paz (16.539° S, 68.066° W; 3439 m a.s.l.) in Bolivia.
Previous regional research using MODIS data documented seasonal AOD cycles in Peru and Bolivia, with peak values during the austral summer and minima in winter [18,19,20]. Comparisons of MODIS-derived AOD with simultaneous AERONET observations at La Paz revealed weak correlations, underscoring potential retrieval biases of the satellite algorithm over high-altitude mountainous terrain [19]. Sun-photometer measurements at Huancayo linked monthly AOD variability primarily to biomass aerosols [21], and observations during the 2019 burning season confirmed the dominance of continental and biomass particles [22]. However, none of these studies quantified ARF or examined the seasonal evolution of SSA and the ASY at these sites.
To fill this gap, we aim to characterize the optical properties of biomass-burning Aerosols in two high Andean cities, Huancayo and La Paz, and their effect on radiative forcing. We process Level 2 AERONET data (2015–2021), focusing on AOD, AE, SSA, and ASY, and employ the SBDART radiative transfer model to estimate forcing at TOA, BOA, and ATM [23].
2. Material and Methods
2.1. Study Sites
This study evaluates the optical properties of aerosols in two high Andean cities in South America: Huancayo (12°04.0′ S, 75°19.3′ W; 3313 m a.s.l.), the principal urban center of Peru’s Mantaro Valley with over 400,000 inhabitants, and La Paz (16°32.3′ S, 68°03.9′ W; 3439 m a.s.l.), the administrative capital and economic hub of Bolivia, home to approximately 1.8 million residents. The high-Andean cities of Huancayo and La Paz are shown in Figure 1.
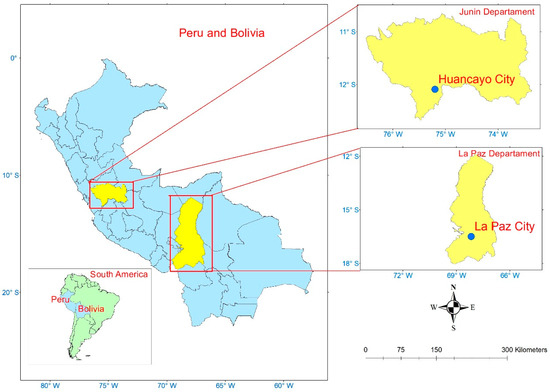
Figure 1.
Study sites.
Both sites are influenced by emissions from forest fires in the Amazon and adjacent high Andean regions. AERONET stations deployed in Huancayo and La Paz delivered continuous, cloud-screened measurements of AOD and the Ångström exponent.
2.2. Data and Methodology
2.2.1. Data
In this research, we integrate Level 2 aerosol optical measurements from AERONET, the NCAR Fire INventory (FINN), NCEP/NCAR Reanalysis I meteorological fields, and accumulated precipitation data, as detailed in the following sections.
AERONET
AERONET is a global network of solar photometers installed at various terrestrial sites. It is designed to deliver continuous, long-term measurements of AOD with a high temporal resolution (15 min) and low uncertainties (0.01–0.02) [24]. In addition, AERONET supplies data regarding particle concentrations and types—such as sulfates, sea salt, and soot—as well as water vapor (precipitable water), making it an essential resource for monitoring variations in the optical properties of atmospheric aerosols [10].
Each AERONET station is equipped with a CIMEL sun photometer that measures the spectral irradiance of both the Sun and the sky [25]. The network provides aerosol data at eight wavelengths: 340, 380, 440, 500, 675, 870, 1020, and 1640 nm [26]. A strict data quality control protocol classifies the measurements into different processing levels: Level 1.0 comprises raw, uncorrected data; Level 1.5 consists of processed measurements with the removal of cloud and rain contamination; and Level 2.0 involves further cloud screening and post-calibration [27]. Data at Level 2.0, derived from rigorous in situ quality control and calibration procedures, provide highly accurate estimates of aerosol optical properties [28].
Given this high precision, the current study exclusively employed AERONET Level 2.0 data, without the need for numerical model simulations or satellite-derived products. These AERONET products are freely accessible at http://aeronet.gsfc.nasa.gov/ (accessed on 11 October 2025).
NCEP/NCAR Global Reanalysis Data
It is a gridded reanalysis dataset created through the cooperation of the National Centers for Environmental Prediction (NCEP) and the National Center for Atmospheric Research (NCAR) of the United States. These data have a temporal resolution of 6 h and a spatial resolution of 1.90° × 1.875° (latitude by longitude) [29]. The NCEP/NCAR data are available at https://psl.noaa.gov/data/gridded/data.ncep.reanalysis.html (accessed on 11 October 2025) and are used as input meteorological data for the HYSPLIT model in the present study.
Fire INventory from NCAR (FINN)
Derived from the MODIS fire products, the FINN inventory (https://www2.acom.ucar.edu/modeling/finn-fire-inventory-ncar, accessed on 11 October 2025) estimates trace gas and aerosol emissions from open biomass burning, which includes forest and agricultural fires but does not include biofuel or trash burning [30,31]. Emissions are estimated using a bottom-up approach based on the amount of biomass burned and corresponding emission factors. The FINN utilizes satellite observations of active fire detections and land cover derived from the MODIS sensor aboard the Aqua and Terra satellites, enabling the generation of daily estimates at a spatial resolution of up to 1 km2 [32]. Given the high spatial and temporal resolution of the data provided by the FINN, this study employed the dataset to quantify the number of forest fire events (NFF) and the concentration of particulate matter with aerodynamic diameter less than 10 μm (PM10).
Accumulated Precipitation
Accumulated precipitation data for 2015–2021 were obtained from the Huancayo Automatic Meteorological Station of the Geophysical Institute of Peru (IGP), a research-grade, fully automated facility at the IGP Huancayo Observatory that records precipitation at one-minute intervals using high-precision sensors (tipping-bucket rain gauge, thermohygrometer, barometer, anemometer) and a Campbell Scientific data logger.
For La Paz, precipitation records were obtained from the Achocalla station operated by the Bolivian National Meteorological and Hydrological Service (Servicio Nacional de Meteorología e Hidrología, SENAMHI), which, under the Ministry of Environment and Water, maintains an extensive network of automated and conventional stations nationwide to provide real-time weather observations and support forecasting and hydrological assessments.
Atmospheric aerosols can be removed by dry or wet deposition [33]. This research will not analyze the factors causing dry deposition but will focus solely on the factors that cause wet deposition. Wet deposition occurs due to precipitation [34] and since precipitation is recorded throughout the year in the cities of Huancayo and La Paz, it directly affects the persistence of aerosols in the atmosphere. Table 1 presents the monthly variation in accumulated precipitation. In Huancayo, the highest accumulated precipitation is recorded in January (813.27 mm), while in La Paz, the highest accumulated precipitation also occurs in January (862.40 mm). The lowest accumulated precipitation values are recorded in July (33.38 mm) in Huancayo and in June (53.70 mm) in La Paz. In Huancayo, accumulated precipitation decreases significantly from January to July, but increases from July to December.

Table 1.
Monthly variation in accumulated precipitation at Huancayo (HYO) and La Paz (LPAZ).
In La Paz, precipitation decreases from January to June, and from June onwards, it begins to increase until December. In January, May, and July, precipitation in La Paz is greater than in Huancayo, while in the other months, the opposite is true.
Table 2 presents the multiannual variation in precipitation. Precipitation in La Paz was higher than in Huancayo in 2018 and 2020; in the other years, the opposite occurred. The highest precipitation in La Paz was recorded in 2018, while in Huancayo, it was recorded in 2015.
Table 2.
Multiannual variation in accumulated precipitation at Huancayo (HYO) and La Paz (LPAZ).
2.2.2. Methodology
HYSPLIT
The Hybrid Single-Particle Lagrangian Integrated Trajectory (HYSPLIT) model is a particle-dispersion framework that couples Lagrangian and Eulerian techniques to simulate the transport and dispersion of tracers from local to global scales [35]. In its Lagrangian module, HYSPLIT tracks individual air parcels in a moving reference frame to compute advection and turbulent diffusion. Simultaneously, its Eulerian grid applies a fixed three-dimensional mesh to calculate concentration fields and pollutant mixing [35].
This integrated approach enables rigorous back-trajectory analyses, identifying the origin of air masses and potential aerosol source regions. In the present study, we computed 120 h backward trajectories arriving at the AERONET sites in Huancayo and La Paz, using a receptor altitude of 200 m above ground level to capture near-surface transport pathways. In the present study, we used NCEP/NCAR reanalysis data as the meteorological input for the HYSPLIT model.
Aerosol Radiative Forcing
Aerosol radiative forcing (ARF) is defined as the influence of aerosols on radiative fluxes at both the top of the atmosphere (TOA), defined as 100 km above the surface of the Earth, and the bottom of the atmosphere (BOA), defined as 1 km above the surface of the Earth, as well as on radiation absorption in the atmosphere [13,36]. In operational terms, ARF at the TOA is defined in accordance with Srivastava [8]:
where and are the global irradiances at the aerosol and non-aerosol TOA, respectively. The arrows indicate the upward direction () and downward direction () of the radiation fluxes. The ARF is expressed in W. Similarly, the ARF is determined at the BOA [1]:
where and are the global irradiances at the BOA with and without aerosol, respectively. The ARF in the atmosphere, which represents the amount of solar energy trapped in the atmosphere, is obtained by subtracting the ARF at the TOA from the ARF at the BOA, as shown in the following expression:
The Santa Barbara Discrete Atmospheric Radiative Transfer (SBDART) model [23] is used to calculate the ARF. SBDART is a model that calculates radiative transfer in a plane-parallel medium under clear and disturbed sky conditions. This tool includes all the important processes that affect the ultraviolet, visible, and infrared radiation fields model [23]. Aerosol optical properties—including AOD, AE, ASY, and SSA—were used as input parameters in the SBDART radiative transfer model.
3. Results
3.1. Analysis of Air Mass Retrotrajectories
Atmospheric aerosols, once generated either naturally or anthropogenically, are transported by air masses and spread over short or long distances, depending on the type of aerosol and meteorological conditions. Therefore, it is essential to know the origin of the air masses, as they may coincide with areas where atmospheric aerosols are generated. After performing detailed back-trajectory analyses for each year from 2015 to 2021 and carefully evaluating trajectory patterns and data quality for each year, we selected 2016 for Huancayo and 2018 for La Paz because these years were statistically representative and exhibited the clearest and most consistent air-mass source patterns. Figure 2a shows the flow patterns of the air masses that arrived at the AERONET station in Huancayo, represented as a fusion of individual trajectories close to each other and grouped (cluster) according to their average trajectory. 61% of the air masses originated within Peruvian territory, with 29.2% coming from the north of the Peruvian Amazon and 31.8% from the northeast of Peru. 18.4% originated in Brazil, and 20.7% had a marine origin, within the waters of the Pacific Ocean; these air masses carry maritime-type aerosols. It should be noted that the air masses of marine origin, when moving towards the city of Huancayo, cross the desert coast of Peru, also transporting dust-type aerosols [21].
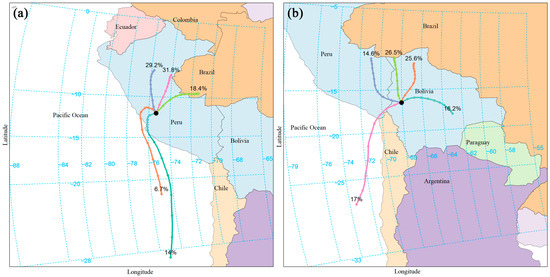
Figure 2.
Air masses reached the AERONET station in (a) Huancayo and (b) La Paz.
Figure 2b displays clustered trajectories of air masses arriving at the La Paz AERONET station. Of these, 41.8% originated within Bolivia, 41.1% traversed the Peru–Brazil border region, and 17% had marine origins. Combined observations from Figure 2a,b identify the Amazon as the principal source of air masses reaching both Huancayo and La Paz.
3.2. Number of Forest Fires and Particulate Matter
Knowing the patterns of the air masses that reach the cities of Huancayo and La Paz allows us to identify the possible sources of atmospheric aerosols. Since this research focuses on the study of BB aerosols, it is essential to consider the geographic areas surrounding each of these cities, as forest fires in these regions are known to generate BB aerosols. The geographic area surrounding the cities of Huancayo and La Paz will be referred to as the “area of influence”. To define the study’s area of influence, we analyzed individual air-mass trajectories reaching the AERONET stations in Huancayo and La Paz and delineated the influence area to encompass all regions where those individual trajectories originated. We additionally considered aerosol residence time, which can range from a few hours to several weeks [37]. This delineated area was used to count forest-fire occurrences within it and to compute the mean PM10 across the influence area. Figure 2 presents the mean of the individual trajectories, and the selected area of influence circumscribes the full set of source regions identified by those trajectories.
Therefore, a larger area than that represented by the origins of the air mass patterns was considered. The areas of influence for the cities of Huancayo and La Paz are shown in Figure 3. Areas of influence of the cities of Huancayo and La Paz: The purple rectangle represents the area of influence of Huancayo, while the blue area represents the area of influence of La Paz.
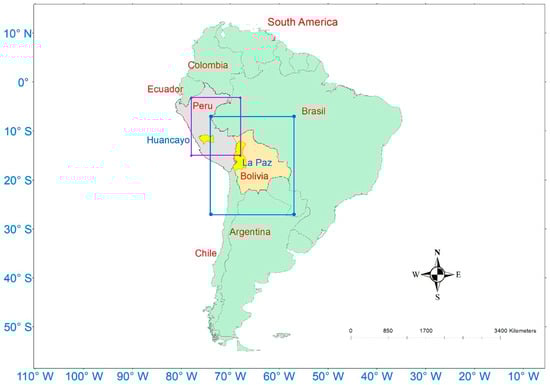
Figure 3.
Areas of influence of the cities of Huancayo and La Paz: the purple rectangle represents the area of influence of Huancayo, while the blue area represents the area of influence of La Paz.
The area of influence for Huancayo is bounded by the following geographic coordinates: W = −78°; E = −68°; N = −3.2°; S = −15°. The area of influence for La Paz is bounded by the following geographic coordinates: W = −74°; E = −57°; N = −7°; S = −27° (Figure 3).
Once the areas of influence were established, the number of forest fires (NFF) and the mean concentration of particulate matter with an diameter less than 10 μm (PM10) generated within those areas were determined.
Table 3 presents the monthly variation in NFF and PM10 at the areas of influence of Huancayo and La Paz. In the area of influence of the city of Huancayo, the NFF decreases from February to May, with May recording the lowest NFF. From June to September, the NFF increases, then decreases in October and November, before increasing again in December. The highest PM10 values are recorded in October (3.320 × kg/month), August (3.644 × kg/month), and September (3.760 × kg/month), with September being the highest. In January, PM10 records its lowest value, with 1.519 × kg/month.
Table 3.
Monthly variation in NFF and PM10 at the areas of influence of Huancayo (HYO) and La Paz (LPAZ).
In the area of influence of the city of La Paz, the lowest NFF is recorded in February, while the highest NFF value is recorded in September. Regarding PM10, the lowest value was recorded in April (1.979 × kg/month) and the highest value in September (2.863 × kg/month), which coincides with the values recorded for Huancayo.
In the areas of influence of the cities of Huancayo and La Paz, the highest amount of NFF is recorded in August, September, and October, which also generate higher amounts of PM10.
Table 4 presents the multiannual variation in NFF and PM10 at the areas of influence of Huancayo and La Paz. In the area of influence of the city of Huancayo, the highest NFF was recorded in 2016, followed by 2020. In 2016, drought [38] prolonged the biomass burning period, while in 2020, warm ocean temperatures in the tropical Atlantic pushed rainfall away from South America, creating favorable conditions for increased biomass burning [39]. The lowest NFF value was recorded in 2015. Regarding PM10, the highest value occurred in 2019 (3.190 × kg/year). Although the NFF was higher in 2016, this result is attributed to the fact that precipitation in 2019 was higher than in 2016 (see Table 2), which contributed to higher humidity in the biomass, leading to greater emissions of BB aerosols [40]. The lowest PM10 value was recorded in 2015 (2.597 × kg/year).
Table 4.
Multiannual variation in NFF and PM10 at the areas of influence of Huancayo (HYO) and La Paz (LPAZ).
In the area of influence of the city of La Paz, the highest NFF was recorded in 2020, followed by 2019. The lowest NFF value was recorded in 2015. Regarding PM10, the highest value was recorded in 2019 (2.883 × kg/year), although the NFF was higher in 2020. The lowest PM10 value was recorded in 2015 (1.020 × kg/year).
3.3. Aerosol Types in Huancayo and La Paz
The aerosol classification method employed in the present study is based on an analysis of a scatter diagram that correlates AOD at 400 nm with the AE over the 440–870 nm range [10,41,42]. Although alternative classification approaches exist, this method is among the most commonly used. Establishing thresholds among the various aerosol types requires consideration of several factors, including the specific characteristics of the measurement site and its surroundings, as well as a preliminary analysis of air mass behavior to define potential source regions. By employing this method, several aerosol types may be identified through the determination of physically interpretable clusters, which serve as threshold values for both AOD at 400 nm and AE in the 440–870 nm range [10].
In this investigation, aerosols have been grouped into two categories: BB and NB. Biomass aerosols (BB) originate from biomass burning, whereas NB aerosols are composed of continental, marine, dust, urban, and mixed particles [21]. Specifically, BB are defined by the following condition: 1.01 < AE < 2.60 and AOD ≥ 0.14 [21] aerosol observations that fall outside the range established for BB.
Table 5 presents the monthly variation in aerosol types. In Huancayo, the proportion of BB ranges from 1.263% to 53.646%, with the highest percentages recorded in August, September, and October. These results are attributed to the fact that the minimum number of forest fires (NFF) is observed in May, whereas higher NFF values are recorded in August, September, and October, as shown in Table 3. Similarly, in La Paz, the highest percentages of BB occur in August, September, and October—with a peak in September—while the lowest value is observed in February. In both cities, the elevated proportions of BB are associated with an increased number of recorded forest fires.
Table 5.
Monthly variation in aerosol types at Huancayo (HYO) and La Paz (LPAZ).
In Huancayo, the percentage of NB exceeds 69% throughout the year, except in August and September when it drops below 50%. In La Paz, the percentage of NB remains above 60% except in September, when it reaches 45.135%.
In both cities, in November, BB exceed those of October, despite the fact that more forest fires were recorded in October. This behavior is due to the fact that November is the planting season in the Andean areas near the AERONET stations of Huancayo and La Paz, which causes the burning of agricultural waste, increasing the concentration of BB. Another contributing factor is the increase in precipitation, as the rise in humidity in the biomass due to precipitation favors a greater emission of BB [40].
Table 6 shows the multiannual variation of aerosols. In Huancayo, in 2020, BB reached their highest percentage value, despite the fact that a greater number of forest fires were recorded in 2016, as shown in Table 4. However, in 2016, precipitation was greater than in 2020, which favored a greater process of elimination by wet deposition. The lowest percentage of BB was recorded in 2021, despite the fact that the number of forest fires was lower in 2015 than in 2021; this behavior is due to the reasons previously explained. In La Paz, as in Huancayo, the highest percentage of BB was recorded in 2020, and the lowest in 2016.
Table 6.
Multiannual variation in aerosol types at Huancayo (HYO) and La Paz (LPAZ).
The percentage of BB depends on the NFF in the area of influence; however, due to precipitation, a wet deposition process occurs, which causes aerosols to be eliminated before reaching the AERONET stations located in the cities of Huancayo and La Paz.
3.4. Aerosol Optical Depth in Huancayo and La Paz
AOD is a crucial dimensionless parameter in the study of climate change [43] that quantifies the extinction of radiation at a specific wavelength due to the presence of aerosols. It is calculated by integrating the aerosol extinction coefficient along the atmospheric column [44].
Figure 4a presents the monthly variation in AOD for BB in the cities of Huancayo and La Paz. In Huancayo, the highest values are observed in July (0.227), August (0.226), and September (0.230), which is attributed to the increased concentration of BB during these months. It is noteworthy that the AOD in July exceeds that in October, despite Table 5 indicating a lower BB fraction in July; this behavior is linked to the reduced precipitation recorded in July compared with October, as shown in Table 3. Furthermore, the February AOD (0.204) is higher than the values registered in January (0.202) and March (0.197), due to the harvest season in the Mantaro valley, which promotes the burning of agricultural residues. The minimum AOD value in Huancayo is recorded in June (0.164).
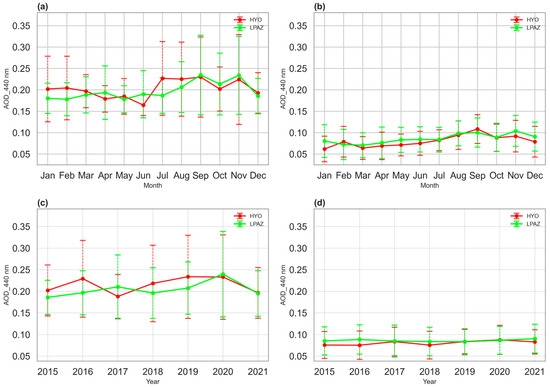
Figure 4.
Variations in AOD: (a) monthly BB, (b) monthly NB, (c) multiannual BB, (d) multiannual NB.
In La Paz, the maximum values of AOD BB are observed in September (0.235) and November (0.234), coinciding with the highest presence of BB, as evidenced by Table 5. The lowest values are recorded in February and May, with both months exhibiting an AOD of 0.178. Additionally, during September and November, both cities show the highest standard deviation (SD) in AOD values—this variability is attributed to the considerable heterogeneity in aerosol measurements, reflecting the significant fluctuations in the intensity of biomass burning during these months.
Figure 4b displays the monthly variation in NB AOD in the cities of Huancayo and La Paz. In both cities, the AOD for NB reaches its maximum values in August, September, and November. This behavior is attributed to the presence of mixed-type aerosols (one of the components within the NB group), which form at the interface between BB and dust aerosols [21,45]. Consequently, as the proportion of BB increases during these months, the contribution of mixed-type aerosols also rises [46]. Furthermore, the SD of the NB measurements exhibits lower variability compared to that of the BB, indicating that most of the data are concentrated near the mean value.
The AOD recorded in Huancayo in September (0.230 for BB and 0.109 for NB) differs from the values reported by Victoria and Estevan [22], who documented an overall aerosol AOD of 0.159. This discrepancy arises because those authors analyzed only the biomass burning season of 2019 without differentiating between BB and NB. In La Paz, the AOD recorded in September (0.235 for BB and 0.100 for NB) is higher than that reported by Pérez-Ramírez [17] for the biomass burning period, during which the AOD was 0.12. This difference is attributed to the increased incidence of biomass burning in recent years.
Figure 4c illustrates the interannual variation in AOD for BB at both sites. In Huancayo, the highest BB AOD values are observed in 2016 (0.229), 2019 (0.234), and 2020 (0.233), reflecting an increased presence of BB, in agreement with the data presented in Table 2. The lowest value was recorded in 2017, despite the BB concentration being higher than in 2018. This behavior is explained by the greater generation of PM10 in 2018 (see Table 4), which resulted in enhanced solar radiation extinction. Moreover, the Coastal El Niño phenomenon that occurred in 2017 during summer and autumn promoted the wet deposition of atmospheric aerosols [47]. In La Paz, the highest AOD was observed in 2020, while the lowest occurred in 2015, for reasons analogous to those seen in Huancayo. Notably, during 2016, 2018, and 2019, Huancayo exhibited a considerably higher SD compared to La Paz, indicating a greater heterogeneity in atmospheric aerosol concentrations in Huancayo.
Figure 4d shows that interannual NB AOD remains consistently below 0.10 at both sites. Across both monthly and interannual scales, BB AOD exceeds NB AOD, confirming that aerosol optical depth in these regions is primarily governed by biomass-burning particles [21].
3.5. Angström Exponent in Huancayo and La Paz
The spectral dependence of AOD is associated with the particle size distribution, making it an indicator of particle size [48]. The AE is a reliable indicator of the dominant size of particles dispersed in the atmosphere. Values above 1 are typically associated with fine-mode aerosols, whereas values below 1 indicate a greater presence of coarse-mode particles. Consequently, a higher AE signifies the predominance of fine-mode particles, while a lower AE suggests a higher proportion of coarse-mode particles [49].
Figure 5a shows the monthly variation in the AE for BB. In Huancayo, the AE remains above 1.55 throughout all months, indicating a predominance of smaller aerosols. This observation is attributed to the fact that fine aerosols produced in the Amazon can reach the Andes, while larger aerosols tend to undergo dry deposition during transport from the Amazon toward the Andes. The elevated AE recorded in May is linked to local biomass burning events, particularly the combustion of agricultural residues from barley. In La Paz, the AE exceeds 1.37; however, except for April, the AE in La Paz is consistently lower than that observed in Huancayo.
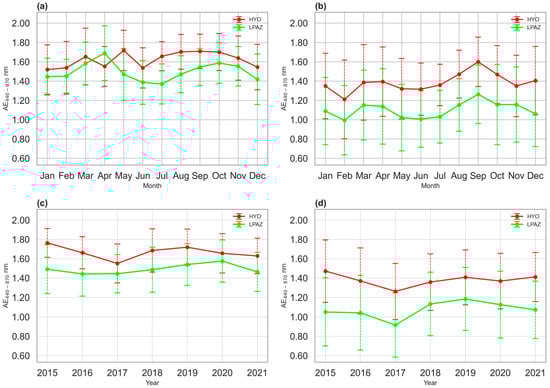
Figure 5.
Variations in AE: (a) monthly BB, (b) monthly NB, (c) multiannual BB, (d) multiannual NB.
Figure 5b presents the monthly variation in the AE for NB. In Huancayo, the AE remains above 1.20 during all months, although it is always lower than the corresponding AE for BB. Notably, in September, the AE NB exceeds 1.50, a result attributed to the presence of mixed-type aerosols. With the increase in BB in September, the proportion of mixed-type aerosols also rises [46]. In La Paz, as in Huancayo, the AE NB reaches its maximum value in September for the reasons mentioned above. In both cities, the AE NB follows a similar pattern of increase and decrease—with the exception of December, when the trend reverses (an increase in AE NB in Huancayo and a decrease in La Paz). The behavior of the AE NB in Huancayo is linked to the predominance of continental aerosols—a subgroup of NB—as demonstrated by Estevan [21].
In both Huancayo and La Paz, fine-mode aerosols prevail. For biomass-burning particles, in both cities, fine-mode aerosols predominate, since—as mentioned previously—the AE for BB exceeds 1.250. Likewise, in the case of NB, fine particles also prevail because their AE is generally above 1, with the exception of February in La Paz, where the AE measures 0.995. Moreover, in both cities the SD of BB is lower than that of NB, indicating a greater heterogeneity in the latter.
Pérez-Ramírez [16] demonstrate that the average AE during the biomass burning season and the non-biomass burning season in Rio Branco (Brazil) is 1.67 and 0.84, respectively. In La Paz, during the same periods, the AE values are 0.95 and 0.84. These values are lower than those obtained in the present study, a difference attributed to the increased incidence of biomass burning in the Amazon and the Andes.
Figure 5c illustrates the interannual variation in the AE for BB. In Huancayo, AE values exceed 1.55, reaching a maximum in 2015. In La Paz, the AE remains above 1.440, with its highest value recorded in 2020. In contrast, Figure 5d presents the interannual variation in the AE for NB. In Huancayo, the AE exceeds 1.250, with its highest value also in 2015, whereas in La Paz it reaches values above 0.915, attaining a maximum in 2019. In both cities, the AE NB is at its lowest in 2017, suggesting that the particle size of NB was larger during that year compared to others.
It is important to note that the SD of BB is lower than that of NB, implying a reduced variability in their atmospheric behavior.
The AE BB is greater than the AE NB in both cities. It is important to note that in Huancayo, both the AE BB and AE NB exceed those recorded in La Paz for all years and months, except in April, when the AE BB reaches significantly higher values. This behavior is attributed to the fact that the Eastern Cordillera of the Andes, located north of Huancayo, is at a lower altitude than the Cordillera Real, which is situated east of La Paz. This topographic difference facilitates the transport of a greater amount of fine-mode aerosols to Huancayo compared to La Paz. During the months of July, August, and September, winds predominantly originate from the north and northeast towards the Mantaro Valley [21], thereby transporting the aerosols generated in the Amazon. It should be noted that during this period there is an increased incidence of biomass burning, as evidenced in Table 3.
3.6. Asymmetry Parameter in Huancayo and La Paz
The ASY quantifies the angular distribution of solar radiation scattering upon interaction with aerosol particles. ASY values range from −1 (indicating completely backscattered light) to +1 (indicating completely forward-scattered light), with a value of zero representing symmetric scattering. The ASY depends on both the size and composition of aerosols and is a crucial parameter influencing radiative forcing [50,51].
Figure 6a presents the monthly variation in the ASY for BB in the cities of Huancayo and La Paz. In Huancayo, during January, February, April, May, and December, the ASY exceeds 0.7, indicating a predominance of forward scattering. In January, February, April, and December, this behavior is attributed to the fact that the AE is lower compared to other periods (see Figure 5a). However, in May, the ASY reaches its maximum value, despite that month also recording the highest AE. This is because a minority fraction of coarse-mode particles exerts a significant impact on the ASY by greatly increasing its value through highly directional scattering, without substantially affecting the overall AE value [52]. According to Estevan [21], ASY values typically range between 0.65 and 0.7; it is noteworthy that the results obtained in the present study are similar to those reported by these authors. No data for ASY BB in March are available for Huancayo. In La Paz, ASY BB reaches its highest values in February (0.709) and December (0.736), for reasons analogous to those observed in Huancayo. Between June and December, ASY BB in La Paz is higher than in Huancayo, owing to the higher AE observed in Huancayo as compared to La Paz, as shown in Figure 5a.
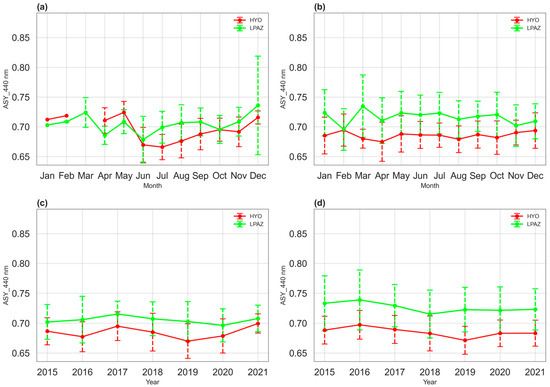
Figure 6.
Variations in ASY: (a) monthly BB, (b) monthly NB, (c) multiannual BB, (d) multiannual NB.
Figure 6b displays the monthly variation in the ASY for NB in Huancayo and La Paz. In Huancayo, the ASY NB averages around 0.67, reaching its maximum value in February (0.695). In La Paz, the ASY NB averages about 0.70, attaining its maximum in March (0.735). It is evident that the ASY NB in La Paz is greater in every month than in Huancayo, indicating that NB in La Paz scatter radiation more efficiently in the forward direction.
Figure 6c presents the interannual variation in ASY for BB in the cities of Huancayo and La Paz. In both cities, the highest ASY BB values are recorded in 2017 and 2021. It is noteworthy that, in every year, ASY BB in Huancayo is lower than that observed in La Paz, which is attributed to the greater presence of smaller particles (i.e., higher AE values) in Huancayo compared to La Paz.
Figure 6d illustrates the interannual ASY for NB. In both cities, NB ASY peaks in 2016, and La Paz again demonstrates higher values than Huancayo. Pérez-Ramírez [16] reported an ASY of 0.68 for La Paz—below the values observed here—underscoring the strong temporal variability in aerosol properties (Table 6).
3.7. Single Scattering Albedo in Huancayo and La Paz
The SSA is defined as the ratio between the scattering and extinction coefficients, constituting a key parameter in the interaction between aerosols and radiation. Additionally, the SSA significantly determines both the magnitude and the sign of aerosol radiative forcing [53]. SSA values can range from 0 (pure absorber) to 1 (pure scatterer) [54]. The calculation of SSA is only possible when the AOD exceeds 0.4, under clear-sky conditions and when the scattering angle is greater than 50° [55]; therefore, for those months and years in which the AOD does not exceed 0.4, no SSA data are available in AERONET.
Only the biomass AOD (AOD BB) surpasses this threshold, so the analysis of SSA was conducted exclusively for this aerosol type, while the analysis of non-biomass-burning aerosols (NB) was discarded due to the lack of available data. In this investigation, neither numerical models nor satellite data have been used to substitute for the missing AERONET data. As mentioned in Section 3.1, SSA is an extremely sensitive parameter in the calculation of aerosol radiative forcing; a change of merely 0.1 in its value can shift the aerosol radiative effect from negative to positive [53]. This high sensitivity underscores the importance of determining the SSA with great precision, a level of accuracy that cannot be achieved through numerical simulations or satellite data.
Figure 7a shows the monthly variation in SSA. In Huancayo, a continuous increase is observed from July (0.939) until September (0.956), reaching its maximum in November (0.970). Although, in general, an increase in BB should decrease SSA—since these aerosols are good absorbers [56,57,58]—changes in the internal structure of the aerosols cause the SSA to increase, thereby mitigating the expected enhancement in absorption that would typically accompany an increase in BB. In Huancayo, the rise in SSA between July and September coincides with the increase in BB, indicating that in these aerosols the scattering process predominates over absorption.
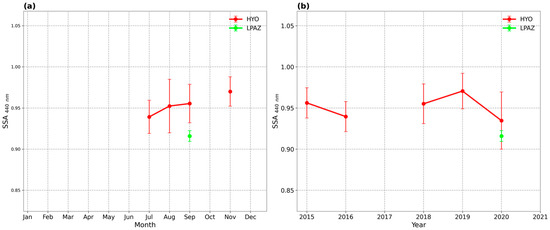
Figure 7.
Variations in SSA: (a) monthly BB and (b) multiannual BB.
It should be noted that, for the reasons mentioned above, no SSA data are available from January to June nor in October. In La Paz, only a single value is recorded in September, with an SSA of 0.916.
Figure 7b illustrates the interannual variation in SSA. In Huancayo, the maximum SSA value (0.971) was recorded in 2019, while the minimum (0.935) occurred in 2020. In La Paz, only one value is available, 0.916.
The high SSA values recorded in both cities, in both the monthly and interannual analyses, indicate that the aerosols are predominantly scattering. It is important to note that the ASY for BB in Huancayo is higher than that in La Paz. During the periods for which SSA data are available (September and 2020), the SSA in La Paz is lower than that in Huancayo; this result indicates that, in La Paz, there is greater absorption of radiation compared to Huancayo. Pérez-Ramírez [16] obtained an SSA value of 0.87 in La Paz, a value lower than that recorded in the present investigation. This difference is attributed to the study period, as the presence of aerosols varies from year to year, as shown in Table 6.
3.8. Aresol Radiative Forcing in Huancayo and La Paz
The impact of aerosols on climate is quantified in terms of ARF. The energy balance of the Earth–Atmosphere system is altered when aerosols, which possess different physical and optical properties, scatter or absorb electromagnetic radiation. The interaction between radiation and aerosols modifies the radiative balance at the surface, at the top of the atmosphere (TOA), and within the atmosphere, thereby influencing the rate of atmospheric warming [59]. Positive ARF values indicate a warming effect, whereas negative values denote a cooling effect [8]. It should be noted that radiative forcing was calculated only for the periods during which SSA data were available, for the reasons explained in Section 2.2.1 and Section 3.7.
Figure 8a displays the monthly variation in ARF for BB in Huancayo. At the top of the atmosphere, the ARF is positive in every month, indicating warming due to the backscattering of solar radiation by BB. These carbonaceous aerosols are efficient both as absorbers and scatterers. The highest ARF at the TOA is recorded in November (16.435 W·m−2), primarily due to the elevated AOD values observed in that month (even though the AOD in November is only slightly lower than that in September by 0.006, as shown in Figure 4a. Another determining factor is the SSA, which reaches its maximum in November. A shift in the SSA value by as little as 0.1 can alter the aerosol radiative effect from negative to positive, depending on the albedo of the underlying surface [53]. The lowest ARF values at the TOA are observed in July (14.024 W·m−2) and August (14.047 W·m−2), as during these months the AOD values are lower than those recorded in September and, furthermore, the SSA values (see Figure 7a) are also lower compared to those in September and November.
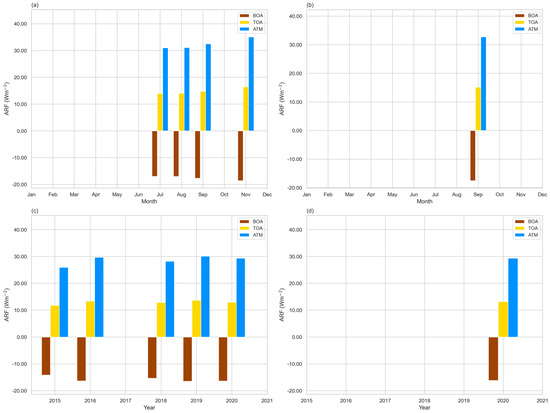
Figure 8.
Variations in BB ARF: (a) monthly in Huancayo, (b) monthly in La Paz, (c) multiannual in Huancayo, (d) multiannual in La Paz. Bright yellow, light brown, and light blue denote ARF at the top of the atmosphere (TOA), bottom of the atmosphere (BOA), and within the atmospheric column (ATM), respectively.
At the bottom of the atmosphere (BOA), the ARF reaches its most negative value in November (–18.623 W·m−2), owing to the high AOD recorded in that month. This leads to an increased extinction of solar radiation, thereby reducing the amount of radiation that reaches the Earth’s surface and generating a cooling effect. Within the atmosphere (ATM), the highest ARF is also recorded in November (35.058 W·m−2). The solar radiation passing through the atmosphere is absorbed by BB, resulting in a warming effect within the atmospheric column.
Figure 8b shows the monthly variation in the ARF for BB in La Paz. Only results for September are available, as that is the only month for which SSA data exist (see Figure 7a). In that month, the ARF values at the top of the atmosphere (TOA), at the bottom of the atmosphere (BOA), and within the atmosphere (ATM) are, respectively, 15.162 W·m−2, –17.5167 W·m−2, and 32.728 W·m−2.
Figure 8a,b permit a direct comparison of September ARF between La Paz and Huancayo. In La Paz, the ARF at the TOA (15.162 W·m−2) and within the ATM (32.729 W·m−2) is slightly higher than that observed in Huancayo (14.789 W·m−2 at the TOA and 32.482 W·m−2 within the ATM). Conversely, at the BOA the ARF in Huancayo is –17.693 W·m−2, which is slightly lower than that registered in La Paz (–17.567 W·m−2). This result is attributed to the fact that, in September, the ASY in La Paz is higher than in Huancayo (see Figure 6a); this permits a greater amount of radiation to reach the Earth’s surface, thereby reducing the cooling effect. Overall, these findings indicate that in La Paz the warming effect at the TOA and within the ATM is slightly greater than in Huancayo, whereas at the BOA the cooling effect is more pronounced in Huancayo than in La Paz.
Figure 8c displays the interannual variation of ARF for BB in Huancayo. In 2019, the highest ARF values are recorded at the TOA (13.621 W·m−2), at the BOA (–16.486 W·m−2), and within the ATM (30.107 W·m−2), which is attributable to the high AOD values observed, as shown in Figure 4c. In contrast, the lowest ARF values are recorded in 2015, corresponding to low AOD values.
Figure 8d displays the interannual variation in ARF for BB in La Paz; results are available only for the year 2020, for which the ARF values at the TOA, BOA, and ATM are, respectively, 13.144 W·m−2, –16.200 W·m−2, and 29.344 W·m−2.
Figure 8c,d permit a direct comparison in 2020 ARF between La Paz and Huancayo. It is observed that, in La Paz, the ARF at the TOA (13.144 W·m−2) and in the ATM (29.344 W·m−2) is slightly higher than that in Huancayo (12.945 W·m−2 at the TOA and 29.343 W·m−2 in the ATM). Conversely, at the BOA the ARF in Huancayo is –16.398 W·m−2, which is slightly lower (i.e., more negative) than the value recorded in La Paz (–16.200 W·m−2). Together, these findings indicate that although La Paz exhibits a slightly greater warming effect at the TOA and within the ATM, Huancayo shows a cooling effect of greater magnitude at the BOA. These differences can be attributed to the same factors observed in the monthly analysis.
4. Discussion
In this study, we characterize the optical properties of BB and NB aerosols in two high-altitude Andean cities—Huancayo and La Paz—and quantify the radiative forcing attributable solely to BB aerosols. This work is the first of its kind in South America at elevations above 3000 m a.s.l., compared with previous investigations in Dungri and Srinagar (both below 2000 m a.s.l.) and in Skardu (2680 m a.s.l.) in the Himalaya [60,61,62].
Huancayo consistently exhibits higher AE BB values than La Paz (except in April), indicating a larger fraction of fine-mode particles transported to Huancayo, particularly during July–September when northerly and northeasterly winds advect Amazonian emissions coincident with peak biomass-burning activity [21].
Topography explains much of this pattern: the Eastern Cordillera north of Huancayo is lower in elevation than the Cordillera Real east of La Paz, which facilitates ingress and mixing of fine aerosols into Huancayo, whereas La Paz receives relatively less direct Amazonian input.
The lower ASY BB in Huancayo relative to La Paz is consistent with a higher fine-mode fraction (higher AE) in Huancayo.
High SSA in both cities indicates that scattering dominates the direct radiative effect; nevertheless, the relative SSA differences between the cities imply variations in optical properties that may modify the local radiative balance.
One major limitation was the scarce availability of single scattering albedo (SSA) data in La Paz (Section 3.7). We avoided using model outputs or satellite-derived estimates to fill SSA gaps because SSA’s high sensitivity—where a 0.1 change can substantially alter atmospheric radiative forcing (ARF) or even reverse its sign [53]—would compromise our results. Furthermore, satellite retrievals demand validation against ground-based networks (e.g., AERONET); Rojas [19] reported insufficient correlations in La Paz between MODIS and AERONET (Terra–AERONET: r = 0.190; Aqua–AERONET: r = 0.139), precluding their unvalidated use.
Our results demonstrate that AOD and SSA are the primary optical parameters controlling ARF in both cities, whereas the ASY plays a clearly secondary role. Temporal variations in AOD and SSA explain the intercity differences in ARF. In absolute magnitude, La Paz exhibits slightly higher ARF at the top of atmosphere (TOA) and within the atmosphere (ATM), while Huancayo shows greater ARF at the bottom of atmosphere (BOA).
We further show that BB aerosol–induced ARF is positive at the TOA, negative at the BOA, and positive again in the ATM. This forcing pattern aligns with Tiwary [60] in Dungri (1800 m a.s.l.) using SBDART, although the magnitudes differ markedly. Similarly, Ahmad [61] reported positive TOA and ATM ARF and negative BOA ARF in Srinagar (1600 m a.s.l.), whereas Zeb [62] observed negative TOA and BOA ARF and positive ATM ARF in Skardu (2680 m a.s.l.), also via SBDART.
These discrepancies underscore the substantial variability of aerosol radiative forcing in high-mountain regions and highlight the urgent need for additional in situ studies to refine our understanding of their impacts on regional energy balance and climate change.
5. Conclusions
The optical properties of both BB and NB were characterized, and the effect of BB on aerosol radiative forcing (ARF) was determined for the high Andean cities of Huancayo and La Paz over the period 2015–2021.
The majority of BB were generated in September in both cities due to an increase in biomass burning, which caused the AOD BB to reach its highest values during that month. It is noteworthy that the AOD for NB also peaked in September. Moreover, the AOD BB is considerably higher than the AOD NB, indicating that the variability of the AOD in both cities is predominantly governed by BB aerosols.
In both cities, fine mode aerosols predominate, as reflected by elevated AE values. The AE for BB is higher than that for NB in both cities. It is important to note that, in Huancayo, the AE—whether for BB or NB—is greater than in La Paz for all years and months, except in April when the AE for BB in La Paz surpasses that in Huancayo. This behavior is attributed to the fact that the Eastern Cordillera of the Andes, located to the north of Huancayo, is at a lower altitude than the Cordillera Real, situated to the east of La Paz. The lower altitude of the Eastern Cordillera facilitates the transport of a larger number of fine-mode aerosols to Huancayo, thereby resulting in higher AE values compared with La Paz.
Regarding the interannual variability of the ASY, both the ASY for BB and the ASY for NB are higher in La Paz than in Huancayo, indicating that aerosols in La Paz are larger and, consequently, possess a greater capacity to generate direct (i.e., forward) scattering. With respect to the SSA, both cities exhibit values on the order of 0.95, with Huancayo showing slightly higher SSA than La Paz during September. The fact that the SSA is approximately 0.9 indicates that scattering predominates over absorption in both cities.
The variation in ARF was calculated exclusively for BB. ARF is determined primarily by the AOD and, to a lesser extent, by the SSA and ASY. Consequently, BB are the main contributors to the impact of aerosols on climate change, given that they exhibit both scattering and absorbing properties. It is noteworthy that in both cities the ARF at the top of the atmosphere (TOA) and within the atmosphere (ATM) is positive—indicating a warming effect—whereas at the bottom of the atmosphere (BOA) the ARF is negative, producing a cooling effect. In Huancayo, a substantial increase in the ARF of BB was observed between 2015 and 2019, although there was a slight decrease in 2020.
To mitigate the impact of aerosols on climate change, it is imperative to implement policies that dramatically reduce biomass burning in both the Amazon and the Andes. Without comprehensive environmental education in all Andean and Amazonian communities, biomass burning will regrettably persist, thereby exacerbating climate change. It is essential to emphasize that the expansion of agriculture and livestock production, along with illicit activities such as logging, cocaine production, and illegal mining, constitute the primary sources of biomass (BB) aerosol emissions. We reiterate that, despite data limitations, this study offers valuable insights for the data-sparse high-mountain region.
Author Contributions
Conceptualization, C.V.-B.; methodology, C.V.-B. and R.E.A.; software, C.V.-B. and R.E.A.; validation, R.E.A.; formal analysis, C.V.-B. and R.E.A.; investigation, C.V.-B.; resources, C.V.-B.; data curation, C.V.-B.; writing—original draft preparation, C.V.-B.; writing—review and editing, R.E.A.; visualization, R.E.A.; supervision, R.E.A.; project administration, C.V.-B.; funding acquisition, C.V.-B. All authors have read and agreed to the published version of the manuscript.
Funding
This work was subsidized by CONCYTEC through the PROCIENCIA program within the framework of the “Undergraduate and Postgraduate Thesis in Science, Technology and Technological Innovation” contest, under contract No. PE501084880-PROCIENCIA-2023.
Institutional Review Board Statement
Not applicable.
Informed Consent Statement
Not applicable.
Data Availability Statement
Data underlying the results presented in this paper are not publicly available at this time but may be obtained from the authors upon request.
Acknowledgments
I am grateful to Aquel for his technical and administrative support.
Conflicts of Interest
The authors declare no conflicts of interest.
Abbreviations
The following abbreviations are used in this manuscript:
| AERONET | AErosol RObotic NETwork |
| AE | Ångström exponent |
| ARF | aerosol radiative forcing |
| ASY | asymmetry parameter |
| AOD | aerosol optical depth |
| BB | biomass-burning aerosol (BB) |
| NB | non-biomass-burning aerosol (NB) |
| NFF | number of forest fire events |
| PM10 | concentration of particulate matter with aerodynamic diameter less than 10 μm |
| SSA | single-scattering albedo |
References
- Yu, S.; Liu, D.; Xu, J.; Wang, Z.; Wu, D.; Shan, Y.; Shao, J.; Mao, M.; Qian, L.; Wang, B.; et al. Optical properties and seasonal distribution of aerosol layers observed by lidar over Jinhua, southeast China. Atmos. Environ. 2021, 257, 118456. [Google Scholar] [CrossRef]
- Deshler, T. Encyclopedia of Atmospheric Sciences; OBSERVATIONS FOR CHEMISTRY (IN SITU). Academic Press: Cambridge, MA, USA, 2003. [Google Scholar]
- Choi, Y.; Sung, Y.; Rozenhaimer, S.; Redemann, J.; LeBlanc, S.; Flynn, C.; Johnson, R.J.; Lee, Y.; Lee, T.; Park, T.; et al. Temporal and spatial variations of aerosol optical properties over the Korean peninsula during KORUS-AQ. Atmos. Environ. 2021, 254, 118301. [Google Scholar] [CrossRef]
- Xia, X.; Che, H.; Shi, H.; Chen, H.; Zhang, X.; Wang, P.; Goloub, P.; Holben, B. Advances in sunphotometer-measured aerosol optical properties and related topics in China: Impetus and perspectives. Atmos. Res. 2021, 249, 105286. [Google Scholar] [CrossRef]
- Chen, J.; Li, Z.; Lv, M.; Wang, Y.; Wang, W.; Zhang, Y.; Wang, H.; Yan, X.; Sun, Y.; Cribb, M. Aerosol hygroscopic growth, contributing factors, and impact on haze events in a severely polluted region in northern China. Atmos. Chem. Phys. 2019, 19, 1327–1342. [Google Scholar] [CrossRef]
- Andreae, M. Emission of trace gases and aerosols from biomass burning—An updated assessment. Atmos. Chem. Phys. 2019, 19, 8523–8546. [Google Scholar] [CrossRef]
- Zhang, X.; Li, L.; Chen, C.; Chen, X.; Dubovik, O.; Derimian, Y.; Gui, K.; Zheng, Y.; Zhao, H.; Zhang, L.; et al. Validation of the aerosol optical property products derived by the GRASP/Component approach from multi-angular polarimetric observations. Atmos. Res. 2021, 263, 105802. [Google Scholar] [CrossRef]
- Srivastava, A.; Mehrotra, B.; Singh, A.; Singh, V.; Bisht, D.; Tiware, S.; Srivastava, M. Implications of different aerosol species to direct radiative forcing and atmospheric heating rate. Atmos. Environ. 2020, 241, 117820. [Google Scholar] [CrossRef]
- Vicente-Luis, A.; Tremblay, S.; Dionne, J.; Chang, R.; Fogal, P.; Leaitch, W.; Sharma, S.; Kolonjari, F.; Hayes, P.L. In situ optical and microphysical properties of tropospheric aerosols in the Canadian High Arctic from 2016 to 2019. Atmos. Environ. 2021, 250, 118254. [Google Scholar] [CrossRef]
- Filonchyk, M.; Peterson, M.; Yan, H.; Yang, S.; Chaikovsky, A. Columnar optical characteristics and radiative properties of aerosols of the AERONET site in Minsk, Belarus. Atmos. Environ. 2021, 249, 118237. [Google Scholar] [CrossRef]
- Cai, H.; Yang, Y.; Luo, W.; Chen, Q. City-level variations in aerosol optical properties and aerosol type identification derived from long-term MODIS/Aqua observations in the Sichuan Basin, China. Urban Clim. 2021, 38, 100886. [Google Scholar] [CrossRef]
- IPCC. Climate Change 2013: The Physical Science Basis. In Contribution of Working Group I to the Fifth Assessment Report of the Intergovernmental Panel on Climate Change; Cambridge University Press: New York, NY, USA, 2013. [Google Scholar]
- Chung, C. Aerosol Direct Radiative Forcing: A review. In Atmospheric Aerosol-Regional Characteristics—Chemistry and Physics; IntechOpen: London, UK, 2012; pp. 379–394. [Google Scholar] [CrossRef]
- Tutsak, E.; Koçak, M. Optical and microphysical properties of the columnar Aerosol burden over the Eastern Mediterranean: Discrimination of Aerosol types. Atmos. Environ. 2020, 229, 117463. [Google Scholar] [CrossRef]
- Barni, P.E.; Rego, A.C.M.; Silva, F.D.C.F.; Lopes, R.A.S.; Xaud, H.A.M.; Xaud, M.R.; Barbosa, R.I.; Fearnside, P.M. Logging Amazon forest increased the severity and spread of fires during the 2015–2016 El Niño. For. Ecol. Manag. 2021, 500, 119652. [Google Scholar] [CrossRef]
- Pérez-Ramírez, D.; Andrade-Flores, M.; Eck, T.; Stein, A.; O’Neill, N.; Lyamani, H.; Gassó, S.; Whiteman, D.N.; Veselovskii, I.; Velarde, F.; et al. Multi year aerosol characterization in the tropical Andes and in adjacent Amazonia using AERONET measurements. Atmos. Environ. 2017, 166, 412–432. [Google Scholar] [CrossRef]
- Rupakheti, D.; Rupakheti, M.; Yin, X.; Hofer, J.; Rai, M.; Hu, Y.; Abdullaev, S.F.; Kang, S. Modifications in aerosol physical, optical and radiative properties during heavy aerosol events over Dushanbe, Central Asia. Geos. Fron. 2021, 12, 101251. [Google Scholar] [CrossRef]
- Vargas, P. Variabilidad Espacial y Temporal del Espesor Óptico de los Aerosoles Sobre Perú Usando Imágenes de Satélite; Monografía para optar título de licenciada en Física, Universidad Nacional Mayor de San Marcos: Lima District, Perú, 2003. [Google Scholar]
- Rojas, N.; Rojas, J. Estudio de la dinámica del espesor óptico de los aerosoles en Perú y América del Sur a partir de las imágenes MODIS de los satélites TERRA y AQUA en el periodo 2000–2013. Rev. Investig. Física 2015, 18, 11577. [Google Scholar] [CrossRef]
- Cholan, J.; Rojas, J.; Willems, B. Estimación del espesor óptico de los aerosoles a partir de las imágenes del sensor MODIS sobre el Perú (2004–2005). Rev. Investig. Física 2017, 19, 1–14. [Google Scholar] [CrossRef]
- Estevan, R.; Martínez-Castro, D.; Suarez-Salas, L.; Moya, A.; Silva, Y. First two and a half years of aerosol measurements with an AERONET sunphotometer at the Huancayo Observatory, Peru. Atmos. Environ. X 2019, 3, 100037. [Google Scholar] [CrossRef]
- Victoria, C.; Estevan, R. Comportamiento de los aerosoles atmosféricos en el Observatorio de Huancayodurante los eventos de quema de biomasa del año 2019. Rev. Investig. Física 2021, 24, 40–54. [Google Scholar] [CrossRef]
- Ricchiazzi, P.; Gautier, S.; Sowle, D. SBDART: A research and teaching software tool for plane-parallel radiative transfer in the Earth’s atmosphere. Bull. Am. Meteorol. Soc. 1998, 79, 2101–2114. [Google Scholar] [CrossRef]
- Li, Y.; Wang, J.; Chen, C.; Li, J. Estimating PM2.5 in the Beijing-tianjin-Hebei Region Using MODIS AOD Products from 2014 to 2015. Int. Arch. Photogramm. Remote Sens. Spatial Inf. Sci. 2016, XLI-B2, 721–727. [Google Scholar] [CrossRef][Green Version]
- Logothetis, S.; Salamalikis, V.; Kazantzidis, A. The impact of different aerosol properties and types on direct aerosol radiative forcing and efficiency using AERONET version 3. Atmos. Res. 2021, 250, 105343. [Google Scholar] [CrossRef]
- Choo, G.; Lee, J.; Kim, S.; Lee, D. Optical and chemical properties of long-range transported aerosols using satellite and ground-based observations over seoul, South Korea. Atmos. Environ. 2021, 246, 118024. [Google Scholar] [CrossRef]
- da Silva Palácios, R.; Romera, K.S.; Curado, L.F.A.; Banga, N.M.; Rothmund, L.D.; da Silva Sallo, F.; Morais, D.; Santos, A.C.A.; Moraes, T.J.; Morais, F.G.; et al. Long Term Analysis of Optical and Radiative Properties of Aerosols in the Amazon Basin. Aerosol Air Qual. Res. 2020, 20, 139–154. [Google Scholar] [CrossRef]
- Zhang, Z.; Li, J.; Che, H.; Dong, Y.; Dubovik, O.; Eck, T.; Gupta, P.; Holben, B.; Kim, J.; Lind, E.; et al. Long-term trends in aerosol properties derived from AERONET measurements. Atmos. Chem. Phys. 2025, 25, 4617–4637. [Google Scholar] [CrossRef]
- Rehman, Z.; Asim, M.; Azhar, M.; Moeenuddin, G.; Farooq, M. Correcting solar radiation from reanalysis and analysis datasets with systematic and seasonal variations. Case Stud. Therm. Eng. 2021, 25, 100933. [Google Scholar] [CrossRef]
- Wiedinmyer, C.; Kimura, Y.; McDonald-Buller, E.; Emmons, L.; Buchholz, R.; Tang, W.; Seto, K.; Joseph, M.B.; Barsanti, K.C.; Carlton, A.G.; et al. The Fire Inventory from NCAR version 2.5: An updated global fire emissions model for climate and chemistry applications. Geosci. Model Dev. 2023, 16, 3873–3891. [Google Scholar] [CrossRef]
- Vongruang, P.; Wongwises, P.; Pimonsree, S. Assessment of fire emission inventories for simulating particulate matter in Upper Southeast Asia using WRF-CMAQ. Atmos. Poll. Res. 2017, 8, 921–929. [Google Scholar] [CrossRef]
- Kopplitz, S.; Nolte, G.; Pouliot, G.; Vukovich, J.; Beidler, J. Influence of uncertainties in burned area estimates on modeled wildland fire PM2.5 and ozone pollution in the contiguous U.S. Atmos. Environ. 2018, 191, 328–339. [Google Scholar] [CrossRef]
- Albdour, S.; Sharaf, O.; Addad, Y. A critical review on the charging and transport dynamics of atmospheric radioactive aerosols: Fundamentals and advances. Sci. Total Environ. 2024, 955, 177130. [Google Scholar] [CrossRef]
- Audoux, T.; Laurent, B.; Chevaillier, S.; Desboeufs, K. Trace element solubility in wet deposition: Investigating the evolution at the intra-event scale. Sci. Total Environ. 2025, 162, 178308. [Google Scholar] [CrossRef]
- NOAA. Air Resources Laboratory Investigating Processes in the Earth’s Boundary Layer. Available online: https://www.arl.noaa.gov/hysplit/ (accessed on 22 September 2025).
- Shu, Z.; Liu, Y.; Zhao, T.; Zhou, Y.; Asmeron, B.; Shen, L.; Hu, J.; Ma, X.; Sun, X. Long-term variations in aerosol optical properties, types, and radiative forcing in the Sichuan Basin, Southwest China. Scien. Total Environ. 2022, 807, 151490. [Google Scholar] [CrossRef]
- NASA. Aerosols and Their Importance. Available online: https://earth.gsfc.nasa.gov/climate/data/deep-blue/aerosols#:~:text=For%20fine%20aerosols%20injected%20near,can%20remain%20there%20for%20years (accessed on 22 September 2025).
- Senamhi. Caracterización Espacio Temporal de la Sequía en los Departamentos Altoandinos del Perú (1981–2018). Available online: https://www.senamhi.gob.pe/load/file/01401SENA-78.pdf (accessed on 22 September 2025).
- NASA. Fires Raged in the Amazon Again in 2020. Available online: https://earthobservatory.nasa.gov/images/147946/fires-raged-in-the-amazon-again-in-2020 (accessed on 22 September 2025).
- Mouton, M.; Malek, K.; James, M.; Pokhrel, R.; Fiddler, M.; Asa-Awuku, A.; Bililign, S. The hygroscopic properties of biomass burning aerosol from Eucalyptus and cow dung under different combustion conditions. Aerosol Sci. Technol. 2023, 57, 665–677. [Google Scholar] [CrossRef]
- Holben, B.; Tanré, D.; Smirnov, A.; Eck, T.; Slutsker, I.; Abuhassan, N.; Newcomb, W.W.; Schafer, J.S.; Chatenet, B.; Lavenu, F.; et al. An emerging ground-based aerosol climatology: Aerosol optical depth from AERONET. J. Geophys. Res. Atmos. 2001, 106, 12067–12097. [Google Scholar] [CrossRef]
- Verma, S.; Prakash, D.; Ricaud, P.; Payra, S.; Attié, J.; Soni, M. A New Classification of Aerosol Sources and Types as Measured over Jaipur, India. Aerosol Air Qual. Res. 2015, 15, 985–993. [Google Scholar] [CrossRef]
- Chen, L.; Liu, C.; Wang, J.; Chen, G.; Zhao, Y.; Jin, Y.; Jin, H. How is the spatiotemporal representativeness of ground- and satellite-based aerosol optical depth (AOD) measurements over Asia? Atmos. Res. 2025, 315, 107857. [Google Scholar] [CrossRef]
- Guo, B.; Wang, Z.; Zhu, X.; Chen, Q.; Wu, H.; Zhang, D. Reconstructing MODIS aerosol optical depth and exploring dynamic and influential factors of AOD via random forest at the global scale. Atmos. Environ. 2023, 315, 120159. [Google Scholar] [CrossRef]
- Gidarakou, M.; Papayannis, A.; Kokkalis, P.; Evangeliou, N.; Vratolis, S.; Remoundaki, E.; Zwaaftink, C.G.; Eckhardt, S.; Veselovskii, I.; Mylonaki, M.; et al. Optical and Microphysical Properties of the Aerosols during a Rare Event of Biomass-Burning Mixed with Polluted Dust. Atmosphere 2024, 15, 190. [Google Scholar] [CrossRef]
- Tao, J.; Luo, B.; Xu, W.; Zhao, G.; Xu, H.; Xue, B.; Zhai, M.; Xu, W.; Zhao, H.; Ren, S.; et al. Markedly different impacts of primary emissions and secondary aerosol formation on aerosol mixing states revealed by simultaneous measurements of CCNC, H(/V)TDMA, and SP2. Atmos. Chem. Phys. 2024, 24, 9131–9154. [Google Scholar] [CrossRef]
- Pécastaing, N.; Cortez, J.; Salavarriga, J. The effects of El Niño events on mangrove-dependent populations’ income in Peru. Ocean Coast. Manag. 2024, 257, 107322. [Google Scholar] [CrossRef]
- Kumar, A.; Pratap, V.; Kumar, S.; Singh, A. Atmospheric aerosols properties over Indo-Gangetic Plain: A trend analysis using ground—Truth AERONET data for the year 2009–2017. Adv. Space Res. 2022, 69, 2659–2670. [Google Scholar] [CrossRef]
- Quirantes, A.; Guerrero-Rascado, J.; Pérez-Ramírez, D.; Foyo-Moreno, I.; Ortiz-Amezcua, P.; Benavent-Oltra, J.; Lyamani, H.; Titos, G.; Bravo-Aranda, J.; Cazorla, A.; et al. Extinction-related Angström exponent characterization of submicrometric volume fraction in atmospheric aerosol particles. Atmos. Res. 2019, 228, 270–280. [Google Scholar] [CrossRef]
- Madhavan, B.; Krishnaveni, A.; Venkat Ratnam, M.; Ravi Kiran, V. Climatological aspects of size-resolved column aerosol optical properties over a rural site in the southern peninsular India. Atmos. Res. 2021, 249, 105345. [Google Scholar] [CrossRef]
- Ramachandran, S.; Rupakheti, M. Inter-annual and seasonal variations in columnar aerosol characteristics and radiative effects over the Pokhara Valley in the Himalayan foothills e Composition, radiative forcing, and atmospheric heating. Environ. Pollut. 2020, 264, 114799. [Google Scholar] [CrossRef]
- Mahowald, N.; Li, L.; Vira, J.; Prank, M.; Hamilton, D.; Matsui, H.; Miller, R.L.; Lu, P.L.; Akyuz, E.; Meidan, D.; et al. AERO-MAP: A data compilation and modeling approach to understand spatial variability in fine- and coarse-mode aerosol composition. Atmos. Chem. Phys. 2025, 25, 4665–4702. [Google Scholar] [CrossRef]
- Dong, Y.; Li, J.; Yan, X.; Li, C.; Jian, Z.; Xiong, C.; Chang, L.; Zhang, L.; Ying, T.; Zhang, Z. Retrieval of aerosol single scattering albedo using joint satellite and surface visibility measurements. Remote Sens. Environ. 2023, 294, 113654. [Google Scholar] [CrossRef]
- Rajesh, T.; Ramachandran, S. Black carbon aerosol mass concentration, absorption and single scattering albedo from single and dual spot aethalometers: Radiative implications. J. Aerosol Sci. 2018, 119, 77–90. [Google Scholar] [CrossRef]
- Holben, B.; Eck, T.; Slutsker, I.; Smirnov, A.; Schafer, J.; Dubovik, A. Aeronet’s Version 2.0 quality assurance criteria. In Proceedings of the Proceedings Volume 6408, Remote Sensing of the Atmosphere and Clouds, Goa, India, 13–17 November 2006; p. 6408. [Google Scholar] [CrossRef]
- Pokhrel, R.; Wagner, N.; Langridge, J.; Lack, D.; Jayarathne, T.; Stone, E.; Stockwell, C.E.; Yokelson, R.J.; Murphy, S.M. Parameterization of single-scattering albedo (SSA) and absorption Ångström exponent (AAE) with EC/OC for aerosol emissions from biomass burning. Atmos. Chem. Phys. 2016, 15, 9549–9561. [Google Scholar] [CrossRef]
- Das, S.; Colarco, R.; Bian, H.; Gassó, S. Improved simulations of biomass burning aerosol optical properties and lifetimes in the NASA GEOS Model during the ORACLES-I campaign. Atmos. Chem. Phys. 2024, 24, 4421–4449. [Google Scholar] [CrossRef]
- Devi, A.; Satheesh, S. Global maps of aerosol single scattering albedo using combined CERES-MODIS retrieval. Atmos. Chem. Phys. 2022, 22, 5365–5376. [Google Scholar] [CrossRef]
- Sangura, M.; Althaf, P.; Makokha, J.; Boiyo, R.; Kumar, K. Estimation and model performance of aerosol radiative forcing from Radiative Transfer models using the AERONET data over Kenya, East Africa. Adv. Space Res. 2024, 75, 481–496. [Google Scholar] [CrossRef]
- Tiwary, P.; Kukreti, S.; Shridhar, V.; Abhinav, A.; Rana, S.; Arunachalam, K.; Singh, V. Assessment of Black Carbon, optical properties and aerosol radiative forcing at Pranmati basin Himalayan critical zone observatory. Sci. Total Environ. 2024, 933, 173050. [Google Scholar] [CrossRef] [PubMed]
- Ahmad, M.; Ahmad, S.; Beig, G. Aerosol black carbon at an urban site-Srinagar, Northwestern Himalaya, India: Seasonality, sources, meteorology and radiative forcing. Atmos. Environ. 2017, 165, 336–348. [Google Scholar] [CrossRef]
- Zeb, B.; Alam, K.; Nasir, J.; Mansha, M.; Ahmad, I.; Bibi, S.; Malik, S.; Ali, M. Black Carbon aerosol characteristics and radiative forcing over the high altitude glacier region of Himalaya-Karakorum-Hindukush. Atmos. Environ. 2024, 238, 117711. [Google Scholar] [CrossRef]
Disclaimer/Publisher’s Note: The statements, opinions and data contained in all publications are solely those of the individual author(s) and contributor(s) and not of MDPI and/or the editor(s). MDPI and/or the editor(s) disclaim responsibility for any injury to people or property resulting from any ideas, methods, instructions or products referred to in the content. |
© 2025 by the authors. Licensee MDPI, Basel, Switzerland. This article is an open access article distributed under the terms and conditions of the Creative Commons Attribution (CC BY) license (https://creativecommons.org/licenses/by/4.0/).