Article

Collaborative Station Learning for Rainfall Forecasting

by
Bagati Sudarsan Patro
1,2,* and
Prashant P. Bartakke
1,*
1
Department of Electronics & Telecommunication Engineering, COEP Technological University Pune (COEP Tech), Wellesley Road, Shivajinagar, Pune 411005, MH, India
2
Surface Instrument Division, Climate Research & Services, India Meteorological Department, Shivajinagar, Pune 411005, MH, India
*
Authors to whom correspondence should be addressed.
Atmosphere 2025, 16(10), 1197; https://doi.org/10.3390/atmos16101197
Submission received: 22 August 2025 / Revised: 29 September 2025 / Accepted: 15 October 2025 / Published: 16 October 2025

Abstract

Cloudbursts and other extreme rainfall events are becoming more frequent and intense, making precise forecasts and disaster preparedness more challenging. Despite advances in meteorological monitoring, current models often lack the precision needed for hyperlocal extreme rainfall forecasts. This study addresses the research gap in spatial configuration-aware modeling by proposing a novel framework that combines geometry-based weather station selection with advanced deep learning architectures. The primary goal is to utilize real-time data from well-placed Automatic Weather Stations to enhance the precision and reliability of extreme rainfall predictions. Twelve unique datasets were generated using four different geometric topologies—linear, triangular, quadrilateral, and circular—centered around the target station Chinchwad in Pune, India, a site that has recorded diverse rainfall intensities, including a cloudburst event. Using common performance criteria, six deep learning models were trained and assessed across these topologies. The proposed Bi-GRU model under linear topology achieved the highest predictive accuracy (R2 = 0.9548, RMSE = 2.2120), outperforming other configurations. These findings underscore the significance of geometric topology in rainfall prediction and provide practical guidance for refining AWS network design in data-sparse regions. In contrast, the Transformer model showed poor generalization with high MAPE values. These results highlight the critical role of spatial station configuration and model architecture in improving prediction accuracy. The proposed framework enables real-time, location-specific early warning systems capable of issuing alerts 2 h before extreme rainfall events. Timely and reliable predictions support disaster risk reduction, infrastructure resilience, and community preparedness, which are essential for safeguarding lives and property in vulnerable regions.

1. Introduction

Extreme rainfall events have become more frequent and severe in recent decades, posing risks to infrastructure, ecosystems, agriculture, and human lives worldwide. Particularly in regions with complex topography and high population density, these short-duration events can trigger flash floods, landslides, and other cascading hazards [1,2]. For disaster risk reduction and climate resilience planning, it is consequently essential to accurately and promptly predict such downpour events. However, severe rainfall continues to be one of the most difficult meteorological occurrences to accurately anticipate because of its confined and sudden nature. Due to resolution, parameterization, and computing cost constraints, traditional methods frequently fail to represent spatiotemporal variability towards extreme occurrences at smaller resolutions, despite their strength at large scales [3]. The phenomenon of cloudbursts (CB) and mini-cloudbursts (MCB) is one of the most harmful effects of such heavy rainfall. The India Meteorological Department (IMD) defines a cloudburst as an abrupt and severe weather phenomenon that is characterized by exceptionally high rainfall rates, frequently reaching 100 mm within an hour over a small geographical area (usually less than 30 km2). Similarly, recent climatological research has introduced the term ‘mini-cloudburst’ to describe similar but moderately less extreme events, characterized by 50 mm or more of rainfall over two consecutive hours. These occurrences are closely linked to cumulonimbus clouds, which develop in the presence of high levels of moisture, severe atmospheric instability, and substantial orographic lifting, particularly in mountainous areas [4,5,6,7]. In India, both the 2021 Nainital cloudburst in Uttarakhand and the 2013 Kedarnath tragedy are notable instances where the combination of high terrain, delicate soils, and insufficient drainage infrastructure exacerbated the damage [8,9].
Historically, two fundamental approaches have been employed: dynamical models, based on physical equations simulating atmospheric behavior, and empirical models, which derive relationships from historical data using regression and fuzzy logic [10,11]. Among empirical methods, ML algorithms like SVM, RF, and Bayesian Networks have been widely used for classification and regression tasks [12,13]. Traditional models often fail to capture complex spatiotemporal dependencies and the complexity of extreme weather events. To overcome these limitations, neural network-based models have emerged as promising alternatives [14]. Artificial Neural Networks (ANNs), including Backpropagation Neural Networks (BPNN) and Multilayer Perceptrons, have been used for monthly and regional rainfall forecasts. However, their inability to handle sequential dependencies limits their performance in time-series prediction [15,16]. In contrast, RNNs and variants such as LSTM and GRU excel at learning from time series weather data, which is more useful for predicting rainfall patterns over time [17]. Recent developments have also introduced the adoption of spatial data processing and Transformer models for capturing long-range dependencies in both time and space [18]. Recent studies have applied diverse machine-learning-based rainfall prediction using datasets with varying temporal resolution and geographic scope. For example, models such as Decision Tree, KNN, SVM, ANN, LSTM, and ensemble techniques have been employed on historical weather data, incorporating temperature, humidity, rainfall, and large-scale climatic indices. These studies span various regions, including Malaysia, Pakistan, China, Iran, and Spain, and report performance metrics such as R2 from 0.532 to 0.8593, depending on models and dataset characteristics [19,20,21,22,23]. According to the literature surveyed in Atmosphere, previous rainfall prediction studies have reported accuracies of 88% [24], 85.71% [25], and 87.15% [26] across various regions. Despite significant progress in deep learning-based rainfall prediction, most existing studies treat meteorological stations as isolated feature vectors and focus primarily on refining temporal sequence modeling using RNNs, LSTMs, GRUs, and Transformers. While these approaches have improved short-term forecasting, they generally overlook the geometric spatial configuration of Automatic Weather Stations (AWSs), which strongly influences convective triggers, orographic lifting, and wind–moisture channeling factors critical to rainfall capture and prediction accuracy. The systematic role of geometry-based spatial arrangement thus remains underexplored, creating a critical research gap. Addressing this research gap, the present study reconceptualizes rainfall prediction as a spatial–temporal learning problem by explicitly integrating station topology into the modeling framework, with the aim of advancing extreme rainfall and cloudburst forecasting. The integration of spatial reasoning, such as geometry-based station selection, is expected to enhance model performance by optimizing input structure, especially relevant in data-rich environments with dense Automatic Weather Station (AWS) networks like India. This study proposes a novel geometry-based collaborative station learning framework for extreme rainfall prediction, systematically assessing how different spatial configurations influence forecasting accuracy through integration with deep learning models.
The main contributions of this study are as follows:
  • A systematic analysis of four geometric station topologies: linear, triangular, quadrilateral, and circular, to evaluate their impact on prediction accuracy.
  • Integration of these topologies with six state-of-the-art deep learning models (LSTM, Bi-LSTM, Stacked-LSTM, GRU, Bi-GRU, and Transformer) for comprehensive benchmarking.
  • Demonstration that the linear topology with Bi-GRU configuration achieves the highest predictive performance (R2 = 0.9548, RMSE = 2.2120), surpassing both prior studies and all other tested topologies.
Establishment of geometric topology as a critical yet previously overlooked determinant of rainfall forecasting skill, with direct implications for AWS network design, early warning systems, and disaster preparedness.

2. Study Area

For this study, Pune City in the Indian state of Maharashtra was selected as the rainfall study region. Pune is situated in western India on the Deccan Plateau, experiences hot summers, heavy monsoon rains, and mild winters. During the southwest monsoon season, Pune typically receives moderate to heavy rainfall; however, the distribution of rainfall across time and space can vary greatly. In the past decade, the frequency of extreme rain, including cloudbursts and mini-cloudbursts, has increased [13,23].
Pune city has a dense network that effectively records these events across all rainfall intensities, making the data suitable for ML-based studies on extreme rainfall. The city is a major hub for education, research, and information technology, and is considered one of the fastest-growing urban centers in India. Automatic Rain Gauge (ARG) Chinchwad station, chosen as the target for prediction, has documented rainfall across all intensity classes, including a significant cloudburst event, making it ideal for evaluating model performance. The locations of IMD-installed and maintained automatic weather stations in and around Pune are depicted in Figure 1, along with the city’s geographic position.

3. Data and Methods

3.1. Data Sources and Processing

In and around Pune, IMD has strategically installed 20 ARG and 13 AWSs; metadata are presented in Table 1. ARG stations measure temperature, humidity, and rainfall, while AWSs record temperature, humidity, wind speed, direction, pressure, and rainfall. Data from these sites from 2020 to 2024 were considered for this investigation. Four distinct topologies, linear, triangular, quadrilateral, and circular, were used to construct 12 datasets with a target station for rainfall prediction, with ARG Chinchwad as the target station, with a wide range of rainfall classes, including extreme rainfall events, recorded. A total of 175,392 records were collected at 15 min intervals. Outliers and missing values are present at certain stations; the percentage of missing data ranges from 6% to 36%. Short-term gaps were treated using mean substitution and forward/backfill methods, while long-term gaps were filled using data from the nearest neighboring stations. Data validation followed WMO QA/QC protocols (range, step, internal consistency, and persistence checks), and 80% of the preprocessed dataset was used for training, and 20% was used for testing [23,26,27,28,29,30].
The Automatic Weather Station (AWS) and Automatic Rain gauge (ARG) networks employed in this study were installed and are currently maintained by the India Meteorological Department (IMD) through its Surface Instruments Division (SID), Climate Research and Services, Pune. Both networks adhere to World Meteorological Organization (WMO) guidelines for calibration, exposure, and maintenance, and follow IMD’s standard operating procedure for weather forecasting and warning services to ensure high data quality. A standard AWS is equipped with Pt100 RTD air temperature sensors and capacitive relative humidity sensors at approximately 2 m, a tipping bucket rain gauge (TBRG) at 0.5 m above ground level, ultrasonic wind sensors at 10 m, and a barometric pressure sensor at around 2 m. ARG stations primarily consist of TBRGs and ATRH sensors. Data are recorded at 15 min intervals under routine operations. Routine calibration, quarterly field inspections, and real-time quality control checks (range, step, persistence, and spatial consistency checks) are applied to ensure data reliability. All station data (CSV format), archived at the National Data Center (NDC), IMD Pune, were used in this study. The computing facilities at COEP Technological University, Pune, were employed for Python (v3) and TensorFlow (v2) based deep learning model development on Intel Xeon CPU-based workstations [23,26,27,28,29,30].

3.2. The Proposed Conceptual Framework

As shown in Figure 2, the methodology used in this study adheres to a defined conceptual framework for machine learning based on the prediction of excessive rainfall. The first step in the approach is gathering quality long-term surface weather data from every AWS and ARG in the study area. Following that, the data goes through pre-processing and feature engineering, which includes feature selection, handling missing values and outliers, cleaning, scaling, and normalization. Subsequently, a geometric data selection strategy is applied, where data is integrated based on the geometrical configuration of station locations using patterns such as linear, triangular, quadrilateral, and circular arrangements. Based on station positions, 12 datasets were formed using the four geometry types described above, keeping ARG Chinchwad as the target station for rainfall prediction. After refining, the 12 datasets are fed into machine learning models. Finally, standard criteria are used to assess the models’ performance and determine the optimal geometrical configurations and model setup for accurate forecasting of excessive rainfall.

3.3. Experiments

Out of 33 stations, in and around Pune district, twelve datasets, comprising linear, triangular, quadrilateral, and circular topologies, were produced using various geometries based on station location alignments and arrangements. The target station, ARG Chinchwad, is at the center of these topologies, with the other stations acting as input stations. The entire spectrum of rainfall, from mild to heavy, is recorded in the ARG Chinchwad station, which also depicts the cloudburst event on 23 June 2024. Because cloudburst and mini-cloudburst events are usually brief and localized over small geographical ranges, all AWS/ARG stations taken into consideration are located within a 50 km radius only for this investigation.
Figure 3a presents linear geometrical topology consisting of heterogeneous AWS/ARG stations within a 5 km band, utilizing available stations positioned with an NNE-SSW orientation, and other stations’ location at approximately 22 km and 15 km from the central ARG Chinchwad station. ARG Chinchwad (590 m a.s.l.), where 590 m represents the station elevation above sea level. Similarly, the north direction and station elevations are indicated for all AWS/ARG topologies. Whereas Figure 3b presents the linear geometrical topology, which utilizes available stations positioned with an NNW-SSE orientation consisting of homogeneous AWSs, approximately opposite the previous one, and the ARG Chinchwad target station at one corner. These other stations are located at approximate distances of 15 km and 18 km from the target station.
Figure 3c presents a triangular geometrical topology, utilizing available stations positioned in a triangular orientation, with ARG Chinchwad as the target center station. Figure 3d presents another triangular geometrical topology, which utilizes available stations positioned with an orientation opposite that of the corner stations shown in Figure 3c.
Figure 3e presents quadrilateral geometry, utilizing available stations positioned in a quadrilateral orientation, with ARG Chinchwad as the target center station. Figure 3f presents another quadrilateral geometrical topology, which utilizes available stations positioned with an orientation opposite that of the corner stations shown in Figure 3e. Figure 3g–l present circular geometrical topologies with the combination of homogeneous and heterogeneous AWS/ARG networks, utilizing available stations positioned at various radii and orientations, with ARG Chinchwad as the target center station. Figure 3g covers stations within a radius of 15 km, showing only about 40% area coverage, with no stations in the remaining area. Figure 3h presents another circular topology with a heterogeneous network, offering full station coverage in all directions within a radius of 20 km. Figure 3i displays full area coverage with a heterogeneous network, extending to a radius of 35 km. Figure 3j shows a circular topology with a radius of 15 km, where only 25% of the area is covered by the network, and the rest has no stations. Figure 3k presents a circular topology that has a radius of 30 km, featuring a heterogeneous network combination covering 50% of the area. Figure 3l consists of stations within a 35 km radius, forming a heterogeneous combination network. More details on the screening and selection of stations are described in Section 3.5.
As shown in Figure 3, AWS/ARG station geometrical arrangements for 12 Datasets, showing Linear, Triangular, Quadrilateral, and Circular Geometry. A total of 12 datasets were methodically created by merging AWS and ARG stations based on different geometric topologies, to aid in the machine learning based prediction of extreme rainfall. Table 2 provides specifics on each dataset’s topology and the AWS/ARG stations that were chosen for this study.
In configurations where Chinchwad was located outside the linear geometry and others, the surrounding stations were excluded if they were not aligned with the geometry, failed to meet the acceptable limits of linear topology, or risked introducing redundancy and noise. Stations beyond 50 km were also avoided, as such arrangements extend beyond the effective spatial scale of cloudbursts and thus fail to adequately capture their localized signatures. The IMD prediction manuals’ classification of rainfall categories based on 24 h’ rainfall amount, including hourly defined CB and MCB events, is shown in Table 3. The table also provides a summary of the incidents that were recorded at the ARG Chinchwad station [3,4].

3.4. Cloudburst Event Recorded at ARG Chinchwad Station

The cloudburst event shown in Figure 4 was well captured at IMD-installed ARG Chinchwad station at Pune, Maharashtra, from 10:15 UTC to 11:15 UTC on 23 June 2024. The hourly rainfall increased dramatically in this one hour, driving the cumulative rainfall over 100 mm to the day’s total of 121 mm. The wet, cooling environment characteristic of such intense precipitation is highlighted by simultaneous temperature reductions and saturation-level increases in relative humidity. Modern machine-learning–based approaches can more easily identify this signature, which is notoriously hard for older deterministic models to capture. These sudden, tightly coupled movements across all four variables confirm a short-duration, high-impact cloudburst. These occurrences frequently destabilize cities, resulting in flooding, gridlock, and aircraft delays. Predicting these intense rainfall events in advance is crucial for preventing fatalities and minimizing property damage.

3.5. Geometric Station Screening and Topology Design

The design of station topologies is central to ensuring that rainfall prediction frameworks capture the localized nature of cloudbursts. To achieve this, a systematic screening and geometry-based selection process was adopted, integrating quality assurance checks, temporal completeness filters, and geometric alignment criteria. This framework ensures that only reliable and spatially representative stations contribute to rainfall prediction. The following section outlines the pipeline used to construct reproducible linear, triangular, quadrilateral, and circular topologies from AWS and ARG networks.

3.5.1. Selection of Geometrical Configurations

In this study, four geometries: linear, triangular, quadrilateral, and circular were adopted, as they were feasible with the actual AWS/ARG distribution, compatible with existing networks, and deployable even in hilly terrain. These geometries provide a practical balance between minimal and robust configurations that are easily planned and implemented. More complex topologies, such as hexagonal, star, grid, or hybrid, were not considered, since they require evenly spaced or uniformly distributed stations. Nevertheless, the proposed framework remains extendable to such geometries in future applications where station density permits.

3.5.2. Station Screening Criteria for Cloudburst-Scale Analysis

Cloudburst and mini-cloudburst events occur over very short durations (≤1–2 h) and small spatial footprints (20–30 km2), making spatiotemporal resolution a critical factor in station selection. To capture these localized extremes, only AWS and ARG stations with 15 min temporal resolution and located within 50 km of the target site were retained. This ensured that the constructed geometrical configurations were both spatially representative of the typical cloudburst footprint and temporally capable of recording rapid rainfall intensities.

3.5.3. Screening of AWS/ARG Based on Sensor Type

AWS and ARG were both included in this study, and stations were screened based on sensor type. Rainfall measurement with a tipping-bucket rain gauge was set as the common and essential requirement for inclusion, as it is available in both AWS and ARG stations. Preference was given to stations equipped with validated tipping-bucket sensors and simultaneous relative humidity (RH) and atmospheric temperature (AT) sensors. In addition, only stations that recorded at least three overlapping meteorological parameters were considered. This criterion ensures comparability between AWS and ARG stations, with rainfall as the common sensor, while additional temperature and humidity measurements further enhance the robustness of the dataset. Cloudburst and mini-cloudburst events demand high temporal resolution. Therefore, only AWS and ARG stations with 15 min rainfall data were included, ensuring accurate event timing and validation. The IMD-installed stations were arranged into linear, triangular, quadrilateral and circular topologies, based on their availability and spatial suitability for this study.

3.5.4. Data-Quality (QA/QC) Filters

To ensure reliability and precision of geometrical input data, rigorous Quality Assurance and Quality Control procedures were applied before model training. Data from each ARG and AWSs underwent automated validation based on WMO and IMD guidelines. Basic QC was implemented at the data logger level at remote sites, while advanced QA/QC was performed at the IMD server level to flag and validate data. The QA/QC workflow included range checks, temporal consistency checks, step-change detection, persistence tests, and spatial consistency assessments. Range checks verified that each variable (rainfall, temperature, relative humidity, wind speed, and surface pressure) remained within climatologically realistic bounds (e.g., temperature −40 °C to 60 °C; RH 0–100%; SLP 600–1100 hPa). Consistency checks ensured inter-parameter coherence—such as verifying dew point ≤ air temperature and rainfall events coinciding with temperature decreases and humidity increases, while step and spike tests detected abrupt, non-physical variations using dynamic thresholds (|Vi − Vi − 1| + |Vi − Vi + 1| ≤ 4σ). Where Vi − 1, Vi, and Vi + 1 represent the previous, current, and next observations, and σ denotes the standard deviation of the variable over a rolling window [30]. Persistence checks flagged unrealistically static readings across 60 min windows, and spatial checks compared neighboring stations to detect outliers and transmission errors.
Quality assurance procedures included pre- and post-monsoon preventive maintenance, calibration with traveling standards, and periodic field validation to minimize sensor drift. Only stations with at least 70% temporal completeness and ≥90% overlapping with the target station record were retained. Redundant or low-quality stations were excluded to avoid multicollinearity and ensure robustness of the predictive framework.

3.5.5. Topology Design for Cloudburst-Scale Prediction

To enhance prediction accuracy, four geometrical configurations were designed from 33 AWS/ARG stations in the study domain. This approach introduces novelty by linking network geometry with machine learning performance, offering insights into optimal designs for complex terrains. The station selection criteria applied for these configurations are described as follows.
(i)
Linear topology: Two configurations were developed (Figure 3a,b) with reversed orientations, but both aligned with the target station (ARG Chinchwad). In Figure 3a, the target lies at the center, with partner stations aligned NNE–SSW within a ±2.5 km band. In Figure 3b, the target is placed at the edge, resulting in distinct partner combinations. Stations beyond a 5 km lateral offset were excluded, as they introduced zigzag rather than linear alignments. Partner stations were required to lie within 3–50 km of the target. Minimum station count: ≥2 partners (3 including target). Linear layouts are well suited for tracking rainfall along orographic channels, valleys, ridges, transport corridors, and river basins where precipitation propagates linearly.
(ii)
Triangular topology: Stations were arranged at azimuth separations of ~120° ± 15°. Two designs (Figure 3c,d) with reversed orientations tested variable lengths of 20 km and 35 km. This ensured balanced sampling of inflow variability and convective initiation. Minimum station count: ≥3 partners (4 including target). Triangular configurations are particularly suited for capturing directional inflows from three azimuthal sectors, such as hillslopes and ridge environments.
(iii)
Quadrilateral topology: Four stations were positioned at ~90° ± 15° azimuth separations (Figure 3e,f), with reversed orientations tested. This design is effective for resolving rainfall fields across mesoscale domains. Minimum station count: ≥4 partners (5 including target). Quadrilateral arrangements are therefore suited for systems with moderate spatial extent, requiring balanced four-way sampling.
(iv)
Circular topology: Circular layouts ensure full 360° sampling of radial precipitation gradients. Six designs were tested (Figure 3g–l), with radii distributed between 15–35 km from the target. Minimum station count: ≥4 partners (5 including target). Circular topologies help capture convergent and centripetal rainfall patterns. Base stations were selected within 15, 20, 30, and 35 km radii around the target ARG Chinchwad. Additionally, extended layouts (Figure 3g–l) were tested with broader coverage (~20%, 30%, 45%, 75%, and up to 100% of the network area). Circular topology is the only configuration that provides flexibility to accommodate the maximum number of stations within the defined radius from the central target station. With this intention, six cases with variations in the number of stations, including the central target station (3, 4, 7, 7, 9, and 9), were considered to examine whether incorporating more spatial information could enhance the model’s ability to learn rainfall trends and patterns. This approach enabled us to investigate how various spatial arrangements affect the model’s performance and its ability to capture underlying rainfall patterns accurately.
Certain stations were excluded from topology construction if they exceeded the effective CB/MCB spatial boundary, exhibited frequent data gaps, contained poor-quality or noisy records, did not align with defined topology boundaries, or introduced redundancy and multicollinearity.

3.6. Algorithm Selection

To assess the interaction between model and spatial station topology, we benchmark six representative sequence-modeling architectures: LSTM, Stacked-LSTM, Bi-LSTM, GRU, Bi-GRU, and Transformer. These models were selected to represent standard temporal sequence learners (LSTM, GRU), directional-context enhancement (bidirectional variants), depth-based temporal hierarchies (stacked LSTM), and attention-based long-range dependency modeling (Transformer). Brief justifications are provided in-line below, while full mathematical definitions, layer diagrams, and derivations are presented in Appendix A to conserve space and maintain focus on the geometry-based methodology.
  • LSTM—standard memory-cell architecture to capture long short-term dependencies; widely used for meteorological time series [25].
  • Stacked-LSTM—deeper LSTM layers to capture hierarchical temporal scales [25].
  • Bi-LSTM—processes the sequence forward and backward to exploit context from both directions [25].
  • GRU—a simplified recurrent cell with fewer parameters, offering computational efficiency [18].
  • Bi-GRU—bidirectional GRU, combining speed with contextual richness (empirically best performer in our experiments) [18].
  • Transformer—self-attention architecture for long-range interactions and non-sequential dependency modeling [19].
All models were trained using the hyperparameters and architectures summarized in Table 4.

3.6.1. Model Evaluation and Evaluation Metrics

The study uses performance evaluation metrics to determine how accurate the models’ predictions are. Metrics such as R 2 , MSE, RMSE, MAE, and MAPE are used to quantify and analyze the forecasting model’s performance [5,6,31,32,33].
RMSE = 1 n i = 1 n ( y i y i ^ ) 2
MAE = 1 n i = 1 n | y i y i ^ |
MSE = 1 n i = 1 n ( y i y i ^ ) 2
MAPE = 100 n i = 1 n ( y i y i ^ ) y i
R 2 = 1 i = 1 n ( y i y i ^ ) 2 i = 1 n ( y i y ¯ ) 2
where y ^ —predicted value of y, y ¯ —mean value of y, and n —number of data points.
To quantitatively assess the prediction performance of the model, this study employs RMSE, MAE, MSE, MAPE, and R2 as the primary evaluation metrics. Each of these metrics provides unique insights into model accuracy and reliability. Equation (2), MAE intuitively reflects the average magnitude of errors in predictions by calculating the arithmetic means of the absolute differences between predicted and actual values [13]. It is less influenced by outliers and maintains the same unit as the original data, making it easily interpretable. In Equation (3), MSE emphasizes larger errors by squaring the deviations. This amplifies the impact of large prediction errors and effectively captures the dispersion of the prediction results. Together, MAE and MSE form a complementary evaluation system, MAE focusing on robust estimation of overall deviation, and MSE on sensitivity to extreme errors, offering a multidimensional quantitative basis for model optimization. Equation (1) for RMSE, derived from MSE, is analogous to the standard deviation but applied to residuals, measuring the average magnitude of prediction errors relative to actual values. It is more sensitive to outliers than MAE and is expressed in the same unit as the predicted variable, helping in direct comparison. Whereas Equation (4), MAPE expresses the prediction error as a percentage, which makes it useful for understanding relative performance [33]. However, MAPE can be disproportionately high when actual values are very small, making it sensitive in such cases. Equation (5), R2 indicates how well the predicted values explain the variability of the actual values. A higher R2 value implies better model fit. Although a higher R2 and lower RMSE, MAE, and MSE generally indicate better model performance, experiments in this study showed that MAPE may still be high due to its sensitivity to low actual values of the target variable. Therefore, in selecting the best-performing model, this study prioritizes those with the highest R2 and lowest RMSE, MAE, and MSE, acknowledging that MAPE must be interpreted cautiously, especially when actual values approach zero.

3.6.2. Model Configuration and Training Setup

After extensive iteration and experimentation, the following combinations of models demonstrated superior performance. The following common hyperparameters were used to train all models: MSE as the loss function, Adam-Optimizer, 64 batch size, Learning Rate of 0.001, and 100 Epochs. Model architecture and hyperparameters utilized for rainfall prediction are compiled in Table 4. In the LSTM model, “tanh/relu” denotes tanh for the internal cell state and ReLU for the output layer. Other models primarily use ReLU for hidden layers and a linear activation at the output.
Detailed model definitions are provided in Appendix A. Detailed descriptions of the deep learning models and architectures, along with model equations, training logs, and loss curves, are presented in Figure A8, while curves comparing actual and predicted rainfall are presented in Figure A9.

4. Results and Discussion

This section presents the experimental outcomes of the proposed framework. The discussion is organized into three parts: (i) the performance of deep learning (DL) models across various geometrical topologies, (ii) a comparative assessment with results reported in the literature, and (iii) an analysis of the dependence of prediction accuracy on lead time, highlighting the model’s capability for Early Warning.

4.1. Performance Evaluation of the DL Models

The results highlight two key findings: (i) geometric topology plays a decisive role in rainfall prediction accuracy, and (ii) the Bi-GRU model with linear topology offers the most robust and operationally valuable solution. As summarized in Table 5 and illustrated in Figure 5, this configuration consistently outperformed all other model–topology combinations, achieving the highest R2 (0.9548) and lowest RMSE (2.2120). Notably, it not only surpasses benchmarks reported in the literature but also provides reliable early warnings of cloudburst and mini-cloudburst events up to two hours in advance, highlighting its practical utility for disaster preparedness. For clarity and focus, Table 5 summarizes only the best-performing model under each topology, while Figure 5 provides a concise performance comparison (R2 and RMSE) across all deep learning architectures and geometrical configurations. Complete result tables and detailed model statistics are available in Appendix B and Appendix C. Table A2 presents a detailed performance summary of six deep learning models across twelve topologies and datasets.
While the linear topology consistently delivered superior predictive accuracy, performance varied across other geometrical configurations. Circular arrangements showed inconsistent results despite involving a greater number of stations. This suggests that simply increasing network density does not guarantee improved model accuracy. Instead, excessive spatial redundancy and heterogeneous data inputs may introduce noise, diminishing the predictive skill of deep learning models. By contrast, triangular and quadrilateral configurations yielded moderate performance (average R2 ≈ 0.94), reflecting a balance between spatial diversity and information redundancy. These findings reinforce that strategic alignment of observation points rather than uniform or arbitrary densifications crucial for optimizing predictive performance in data-driven rainfall forecasting frameworks.
Overall, the analysis demonstrates that Bi-GRU consistently achieved the best performance, confirming that station topology is as important as model architecture for extreme rainfall prediction.

4.2. Comparison with Literature Results

The performance of the proposed models was benchmarked against results reported in earlier studies to contextualize their effectiveness. As illustrated in Figure 6, the Bi-GRU with linear topology consistently outperforms previous published approaches, thereby confirming its superiority in predictive accuracy.

4.3. Dependence on Lead Time

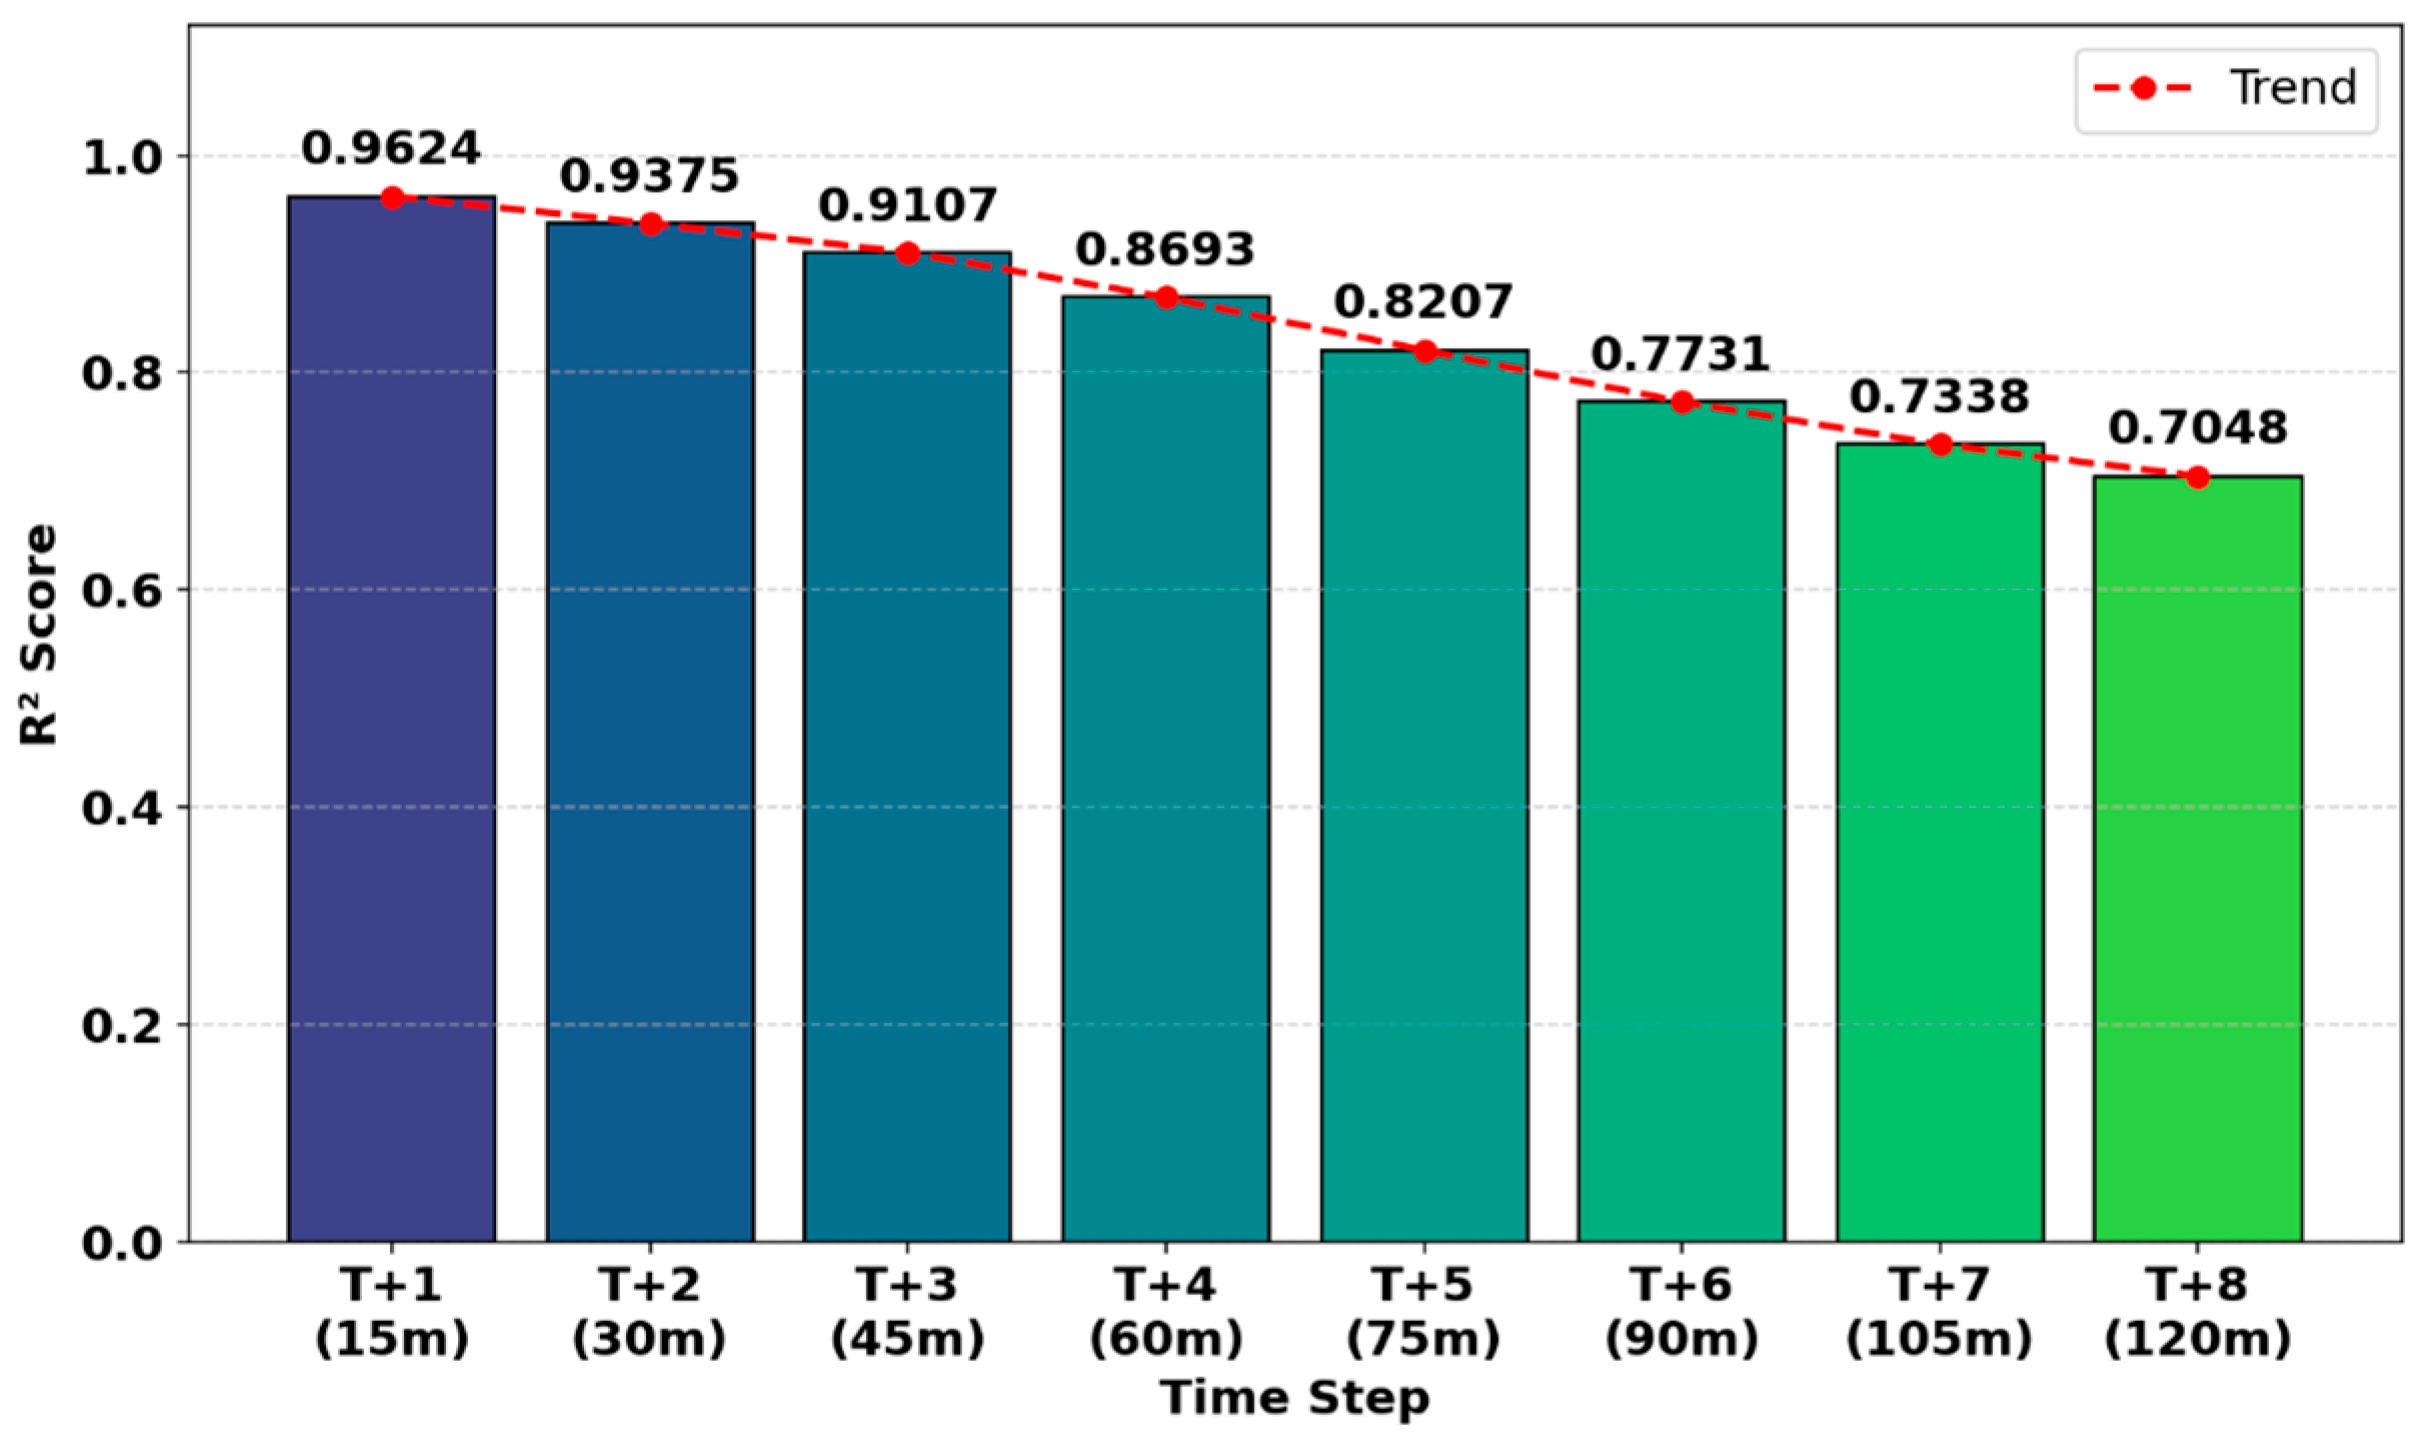
This section emphasizes the powerful capability of the proposed model for Early Warning. As the operational relevance of rainfall prediction critically depends on the forecast horizon, the influence of varying lead times on model accuracy was assessed. Figure 7, Figure 8 and Figure 9 present the validation results, indicating that the Bi-GRU model with linear topology achieved the best performance, providing reliable early prediction of extreme cloudburst rainfall events with a lead time of up to two hours. As lead times increase from 15 min (T + 1) to 120 min (T + 8) with T = 0 at 11:15 UTC, the rainfall prediction validation accuracy (R2 Score) is depicted in Figure 7. The accuracy steadily declines as the forecast horizon lengthens, reaching 0.7048 at 120 min, but peaks at shorter lead times, with an R2 of 0.9624 at 15 min. When compared to lengthier lead times, the model performs better for short-term predictions, as evidenced by the downward trend.
Actual cumulative rainfall over various lead times (T + 1 to T + 8) is contrasted with model forecast validation in Figure 8, at shorter lead times, predictions closely match observed rainfall, with strong agreement between T + 1 and T + 2 (R2 > 0.93). But variations get bigger as the predicted horizon lengthens, with rainfall totals being overestimated or underestimated, especially beyond T + 5. This suggests that predictions with longer lead times are less reliable.
A comparison of actual and expected rainfall values at 15 min intervals for various lead durations (T + 1 to T + 8) is shown in Figure 9. The model has great validation accuracy at shorter lead times, where predicted rainfall closely resembles observed values, as illustrated in Figure 7 and Figure 8. However, disparities become more noticeable as lead times increase, and there is a propensity to overestimate the severity of rainfall. The steady decrease in forecast accuracy over longer time horizons is shown in all three Figure 7, Figure 8 and Figure 9.
Quantitatively, the linear Bi-GRU model consistently outperformed the other (Table A2, Figure 5, Figure 6, Figure 7, Figure 8 and Figure 9), indicating that high accuracy was obtained even with a limited number of strategically positioned stations, whereas circular topologies, despite having more nodes, performed worse, likely due to redundancy and noise. The model reliably forecasted extreme rainfall events up to two hours in advance, providing critical lead time for early warning. This improved performance of the Bi-GRU model with linear topology, supported by geographically and meteorologically, the linearly aligned stations around Chinchwad, Pune, Maharashtra. The region is on the western Deccan Plateau at ~590 m elevation, featuring a relatively flat urban landscape on Deccan trap basalt with minor undulations. The Pavana River basin creates linear topographic features that influence near-surface wind patterns. The Arabian Sea’s moisture-laden winds, which are channeled by the local terrain and affect rainfall distribution and wind flow alignment, boost cloud formation and excessive rainfall during the active southwest monsoon (June–September) by orographically lifting over the Sahyadri Mountains [4,13].
Furthermore, these findings provide actionable guidance for observation network construction in resource-limited regions. Instead of pursuing uniform spatial coverage, results suggest prioritizing linear densification along dominant moisture transport or topographic corridors, which enhances predictive performance while optimizing cost. High-quality, well-calibrated stations spaced at 15–25 km intervals along key advection pathways are more valuable than dense, redundant networks. Ensuring regular maintenance and sensor calibration before and after monsoon seasons is also crucial, as forecast accuracy depends strongly on AWS data quality.
Nevertheless, this study acknowledges certain limitations. The analysis is geographically focused on a single region (Pune) and based on a moderate temporal dataset (2020–2024) with a limited number of extreme-event samples, which may constrain model generalization across diverse climatic regimes and terrains. Model performance may also vary with changes in network density, data quality, or prevailing synoptic conditions. Future research should therefore validate the proposed framework across different topographic and climatic settings, incorporate additional hydro-meteorological predictors such as soil moisture and convective indices, explore graph-based architectures with explicit spatial encoding, and conduct cost–benefit assessments to optimize operational deployment and resource allocation.
Additionally, this study is constrained by the dependence of forecasting accuracy on the quality of AWS data. Forecasting extreme weather events remains challenging due to their inherent rarity. A major limitation is the scarcity of training data, as extreme rainfall events such as cloudbursts and mini-cloudbursts are infrequent. Consequently, most predictive models tend to either underestimate or overestimate these events. Despite these challenges, the present study demonstrates the applicability of advanced deep learning algorithms, which show potential to improve the reliability of extreme rainfall predictions.

5. Conclusions and Future Work

One of the most important problems in the environmental sector is rainfall estimation, and this method attempted to predict rainfall using a geometry-based approach. The key findings of this study are as follows:
  • This study evaluated the performance of six machine learning models for extreme rainfall prediction using different Automatic Weather Station network topologies. The proposed linear geometry-based approach using the Bi-GRU model emerged as the most consistently accurate model, achieving a greater value of training R2 of 0.9548, validation R2 of 0.9426, and a small RMSE of 2.2120. Comparison shows significant improvements over earlier studies. These enhanced prediction skills can help disaster managers in making timely and informed decisions by providing more accurate forecasting of extreme rainfall events with two hours of lead time.
  • The Bi-GRU model with a linear topology achieved the highest predictive performance, surpassing triangular, quadrilateral, and circular station layouts. This result indicates that strategically aligned but fewer stations can outperform larger yet suboptimal placed networks, even at the (15–25 km) spacing required to capture cloudburst signatures. The linear configuration, particularly along the Pavana River basin, effectively represented orographic lifting and wind-channeling effects of the western Deccan Plateau, thereby enhancing precipitation forecasting accuracy.
  • Though state-of-the-art in time series modeling, the Transformer model showed inconsistent performance in localized rainfall prediction, with high R2 but elevated MAPE, likely due to redundancy or noise from dense station networks with much additional information. Further investigations are needed to unlock the full capability that requires tailored adaptation to meteorological datasets and data quality and redundancy handling.
Future research is required to evaluate model performance and geometric responses using datasets from river basins, coastal stations, and hilly terrains, enabling more generalized modeling and comparative analysis. There is also scope for extending this work by integrating high-resolution quality Automatic Weather Station (AWS) data with weather radar and satellite imagery, in conjunction with topographical studies, to enhance the accuracy of short-term extreme rainfall forecasts and early warning.

Author Contributions

B.S.P.: Investigation, Development, formal analysis, visualization, writing—original draft. P.P.B.: Conceptualization, methodology, formal analysis, revision, and overall supervision. All authors have read and agreed to the published version of the manuscript.

Funding

This research received no external funding.

Institutional Review Board Statement

Not applicable for this study, as it does not involve humans or animals.

Informed Consent Statement

Not applicable for this study, as it does not involve humans.

Data Availability Statement

The source is the National Data Centre (NDC), I.M.D., India, it is accessible upon request at https://dsp.imdpune.gov.in. (accessed on 20 September 2025).

Acknowledgments

The Centre of Excellence (CoE) in Signal-Image Processing Lab at COEP Technological University, Pune (COEP Tech), and IMD provided all the resources required for this research project.

Conflicts of Interest

There are no conflicts of interest disclosed by the authors. The authors’ opinions are expressed in the study, not those of the organizations.

Abbreviations

ASLAbove Sea Level
CBCloudburst
COECenter of Excellence
COEPCollege of Engineering Pune
DLDeep Learning
GPRSGeneral Pocket Radio Service
GRUGated Recurrent Unit
IMDIndia Meteorological Department
IOTInternet of Things
LSTMLong Short-Term Memory
MAEMean Absolute Error
MAPEMean Absolute Percentage Error
MCBMini-Cloudburst
MLMachine Learning
MSEMean Squared Error
NDCNational Data Centre
NWPNumerical Weather Prediction
QAQuality Analysis
QCQuality Check
RNNRecurrent Neural Network
RMSERoot Mean Squared Error
TDMATime Division Multiple Access
WMOWorld Meteorological Organization

Appendix A. Deep Learning Model Architecture

Time series prediction of heavy precipitation requires models that can capture temporal dependencies and sequence variability in meteorological data. Recurrent models like RNN, LSTM, Bi-LSTM, and GRU can accommodate sequence variability in meteorological data and reflect temporal dependencies; they are appropriate for predicting heavy precipitation. While LSTM and GRU deal with the problem of vanishing gradients, Bi-LSTM enhances learning by processing input in both directions. With their attention mechanism, Transformer models are excellent at spotting intricate, distant relationships and interactions in multivariate time series [16].

Appendix A.1. Recurrent Neural Networks (RNNs)
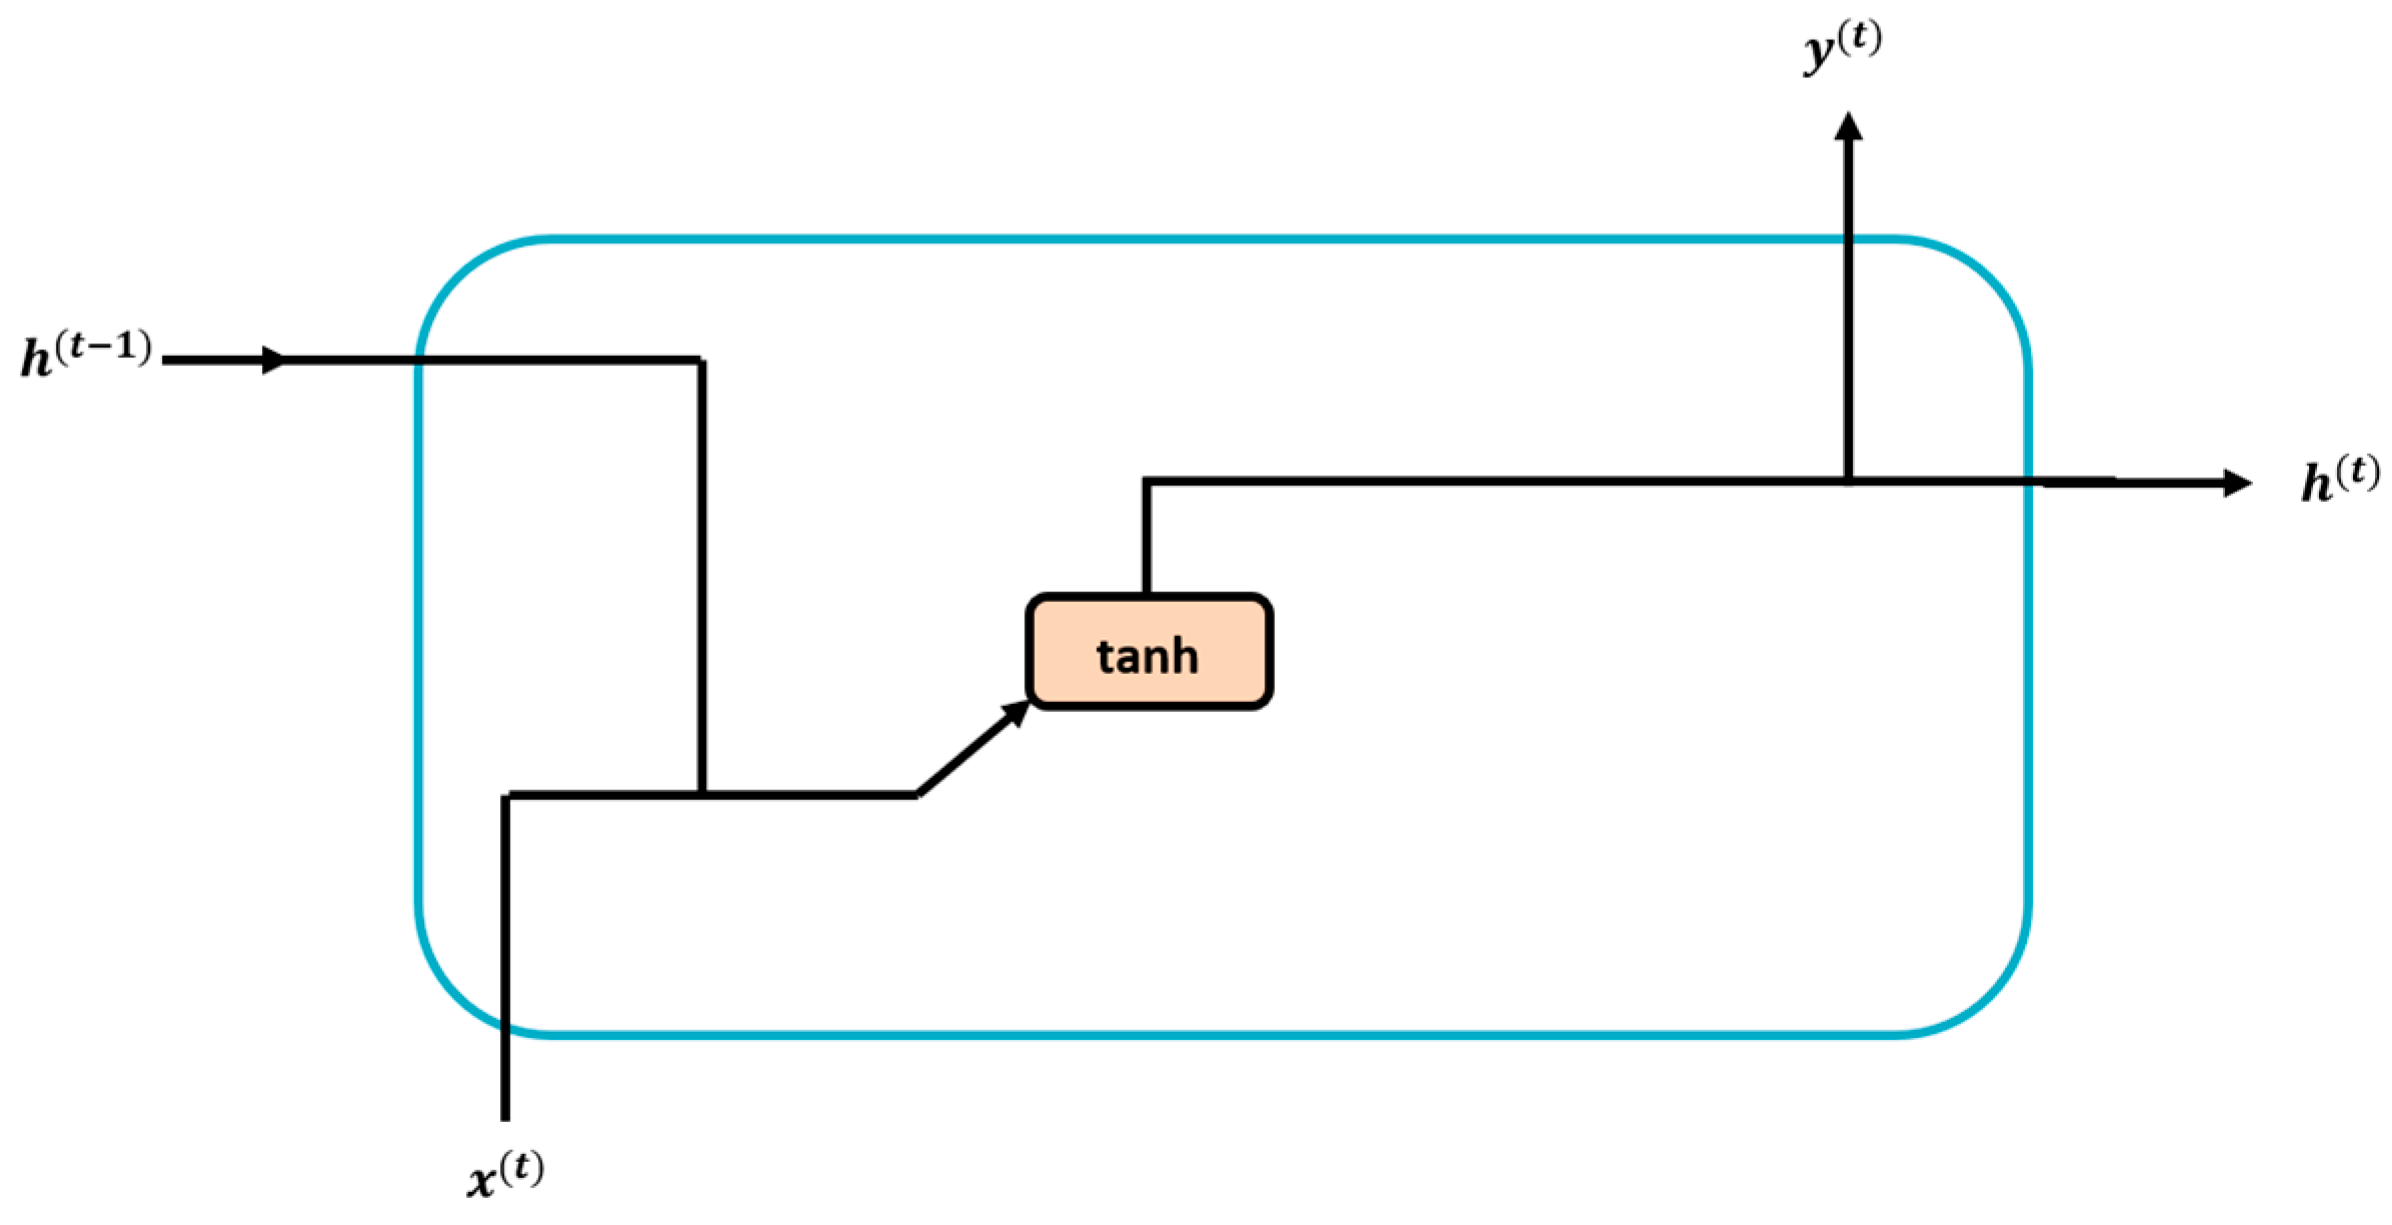
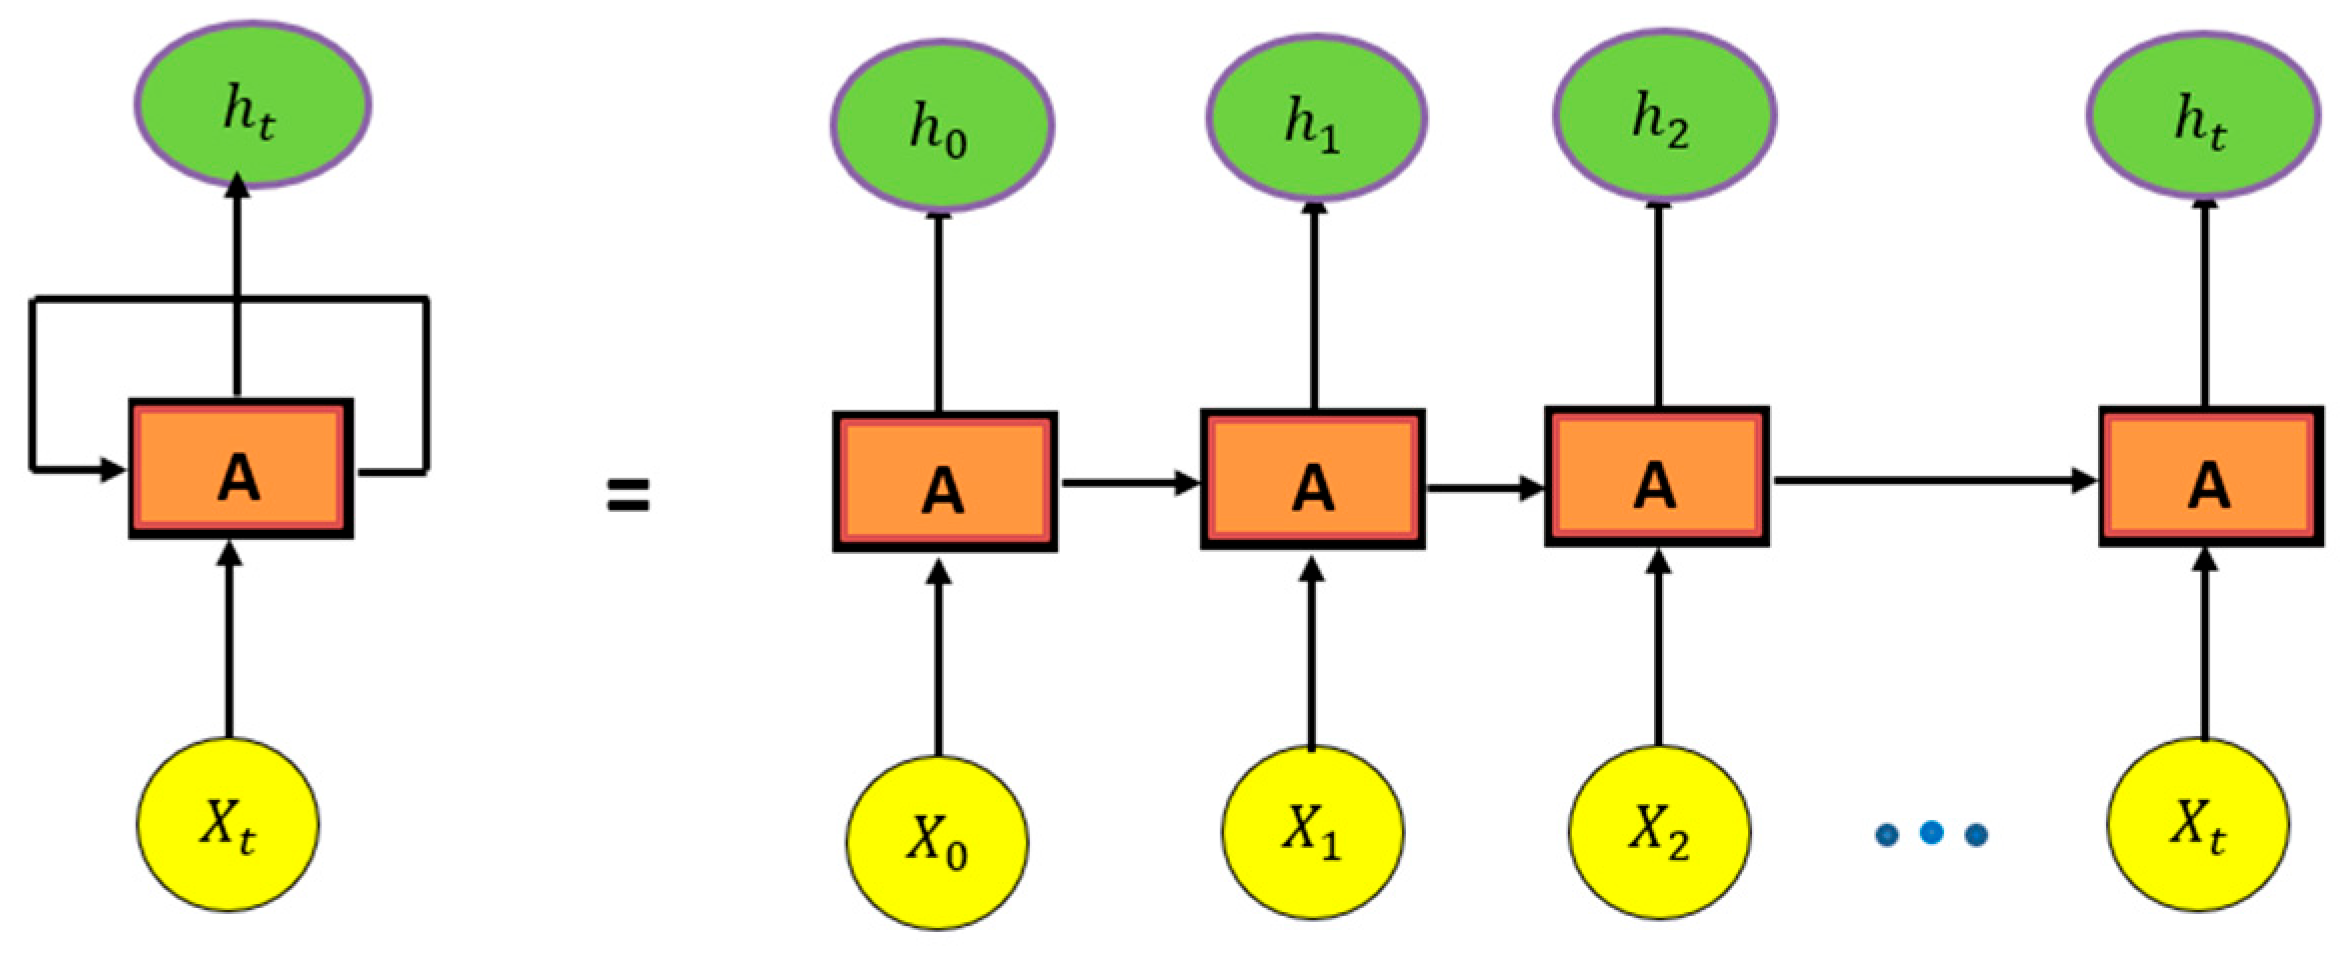
RNNs are widely employed in predicting excessive rainfall and are crucial for modeling sequential meteorological data, including time-series weather patterns. They can capture short-term variations and temporal dependencies owing to their memory of previous inputs (Figure A1). The equations are general RNN equations: Equation (A1) describe the hidden state updates, while Equation (A2) describe the output computation [20].
h t = f ( W h x x t + W h h h t 1 + b h )
y ^ t = g ( W y h h t + b y )
x t and y ^ t : represent the Input and output vectors at time step t.
W x h , W h h   a n d   W h h : weight matrix connecting to input to the hidden state or the previous hidden state to the current hidden state.
b h and b y : Bias vector for hidden state or output computation.
Figure A1. Recurrent-Neural-Network.
Atmosphere 16 01197 g0a1
The structure of an RNN is illustrated in Figure A2, which demonstrates how repeated hidden states process sequential inputs. Traditional RNNs provide a straightforward yet efficient method for learning temporal characteristics, notwithstanding the possibility that they would experience vanishing gradient issues throughout lengthy sequences. Because of this, RNNs serve as a foundational model for more complex architectures like LSTM and GRU [25].
Figure A2. Recurrent-Neural-Network-loop.
Atmosphere 16 01197 g0a2

Appendix A.2. Long-Short-Term-Memory (LSTM)
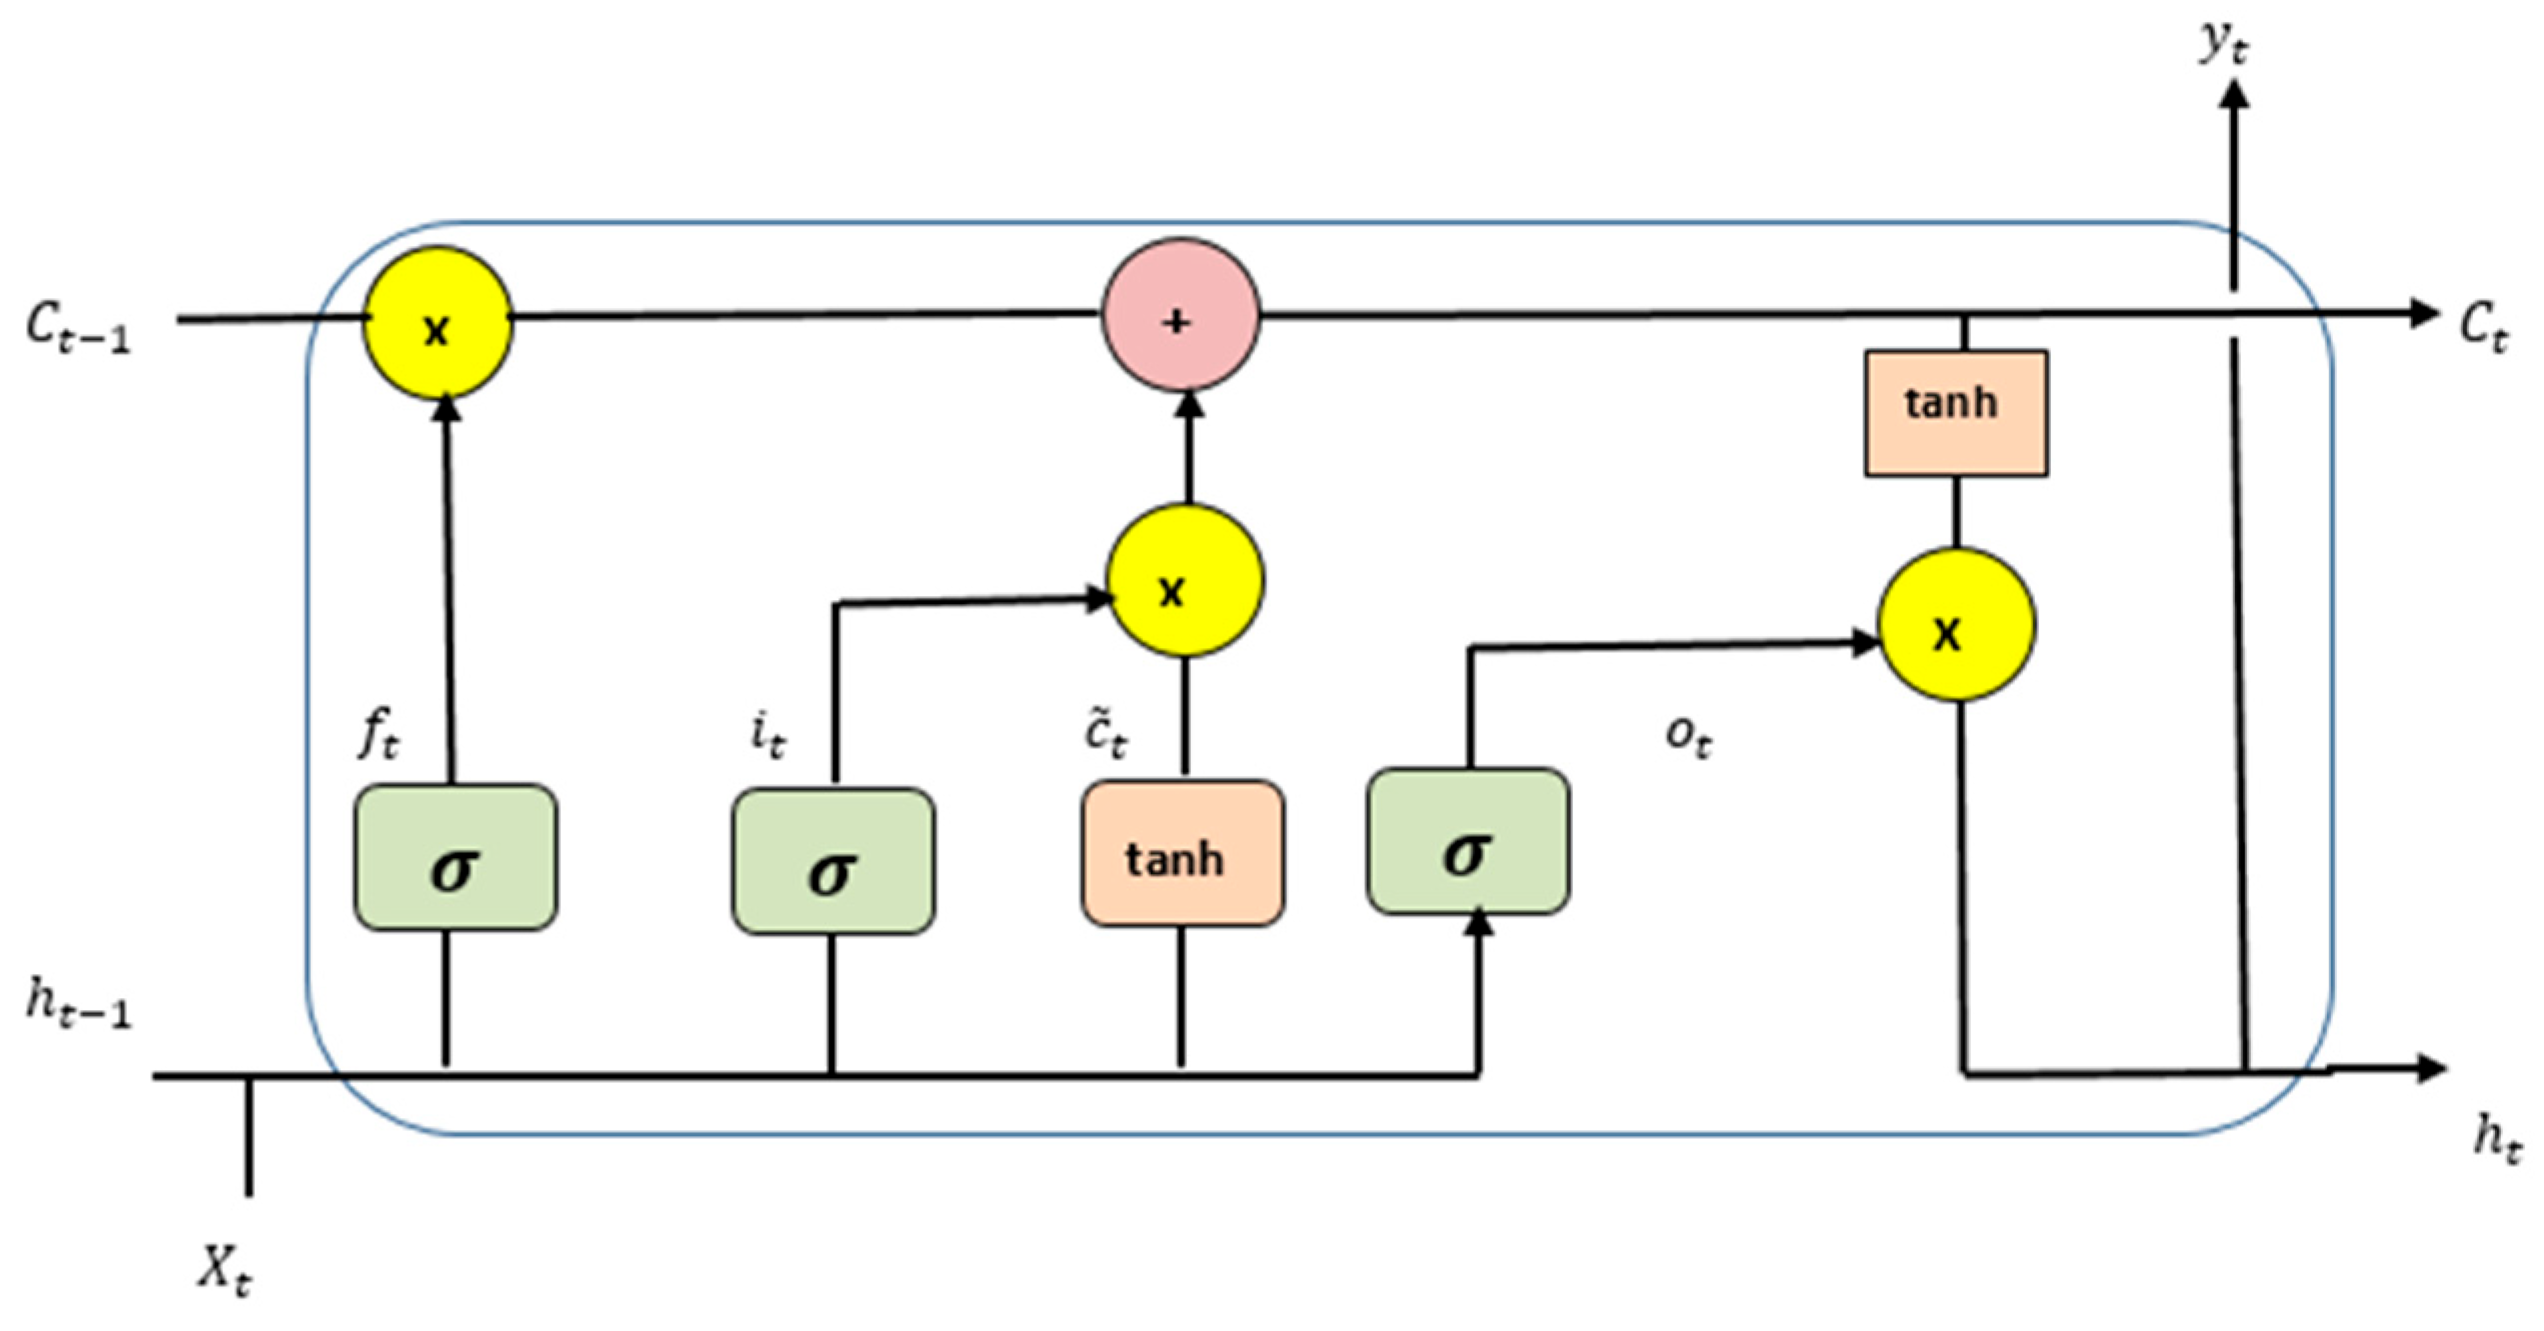
Unlike traditional models (Figure A3), LSTMs can remember significant events over extended periods of time, which makes them ideal for detecting delayed or seasonal influences in rainfall data. In highly changeable phenomena like rainfall, their gating mechanisms are essential for controlling noise and concentrating on pertinent signals. The STACKED-LSTM deep learning model captures hierarchical temporal patterns in sequential data by stacking multiple LSTM layers on top of each other. Because LSTM networks can efficiently detect long-term dependencies and temporal patterns in sequential meteorological data, they are ideal for predicting heavy rainfall. This makes it possible to predict infrequent and extreme precipitation events with greater accuracy [24].
Figure A3. Long-Short-Term-Memory.
Atmosphere 16 01197 g0a3
The equations for the gates in LSTM are:
i t = σ ( w i h t 1 , x t + b i )
f t = σ ( w f h t 1 , x t + b f )
o t = σ ( w o h t 1 , x t + b o )
c ~ t = tanh ( w c h t 1 , x t + b c )
c t = f t × c t 1 + i t × c ~ t
h t = o t × t a n h ( c t )
i t : represents the input gate.
f t : represents forget gate.
o t : represents output gate.
σ : represents the sigmoid function.
w x : weight for the respective gate (x) neurons.
h t 1 : output of the previous LSTM block (at timestamp t − 1).
x t : input at current timestamp.
b x : biases for the respective gates (x).
The equations for the cell state, candidate cell state, and the final output:
c t : cell state (memory) at timestamp (t).
c ~ t : represents candidate for cell state at timestamp (t).
The input, forget, and output gates in an LSTM cell regulate the information flow. How much of the updated cell state is sent on as the hidden state is controlled by the output gate Equation (A5), the forget gate Equation (A4) determines how much of the previous cell state is discarded, and the input gate Equation (A3) determines how much new information is added to the cell state. Potential new information is calculated by the candidate cell state Equation (A6), the output gate determines the hidden state Equation (A8), and the updated cell state Equation (A7) mixes the candidate state modulated by the gates with the prior cell state. With sigmoid and tanh activations, these techniques allow LSTM to alleviate the vanishing gradient problem in sequential data modeling, retain long-term dependencies, and filter out unnecessary information [25,33].

Appendix A.3. Bidirectional-Long-Short-Term-Memory (Bi-LSTM)
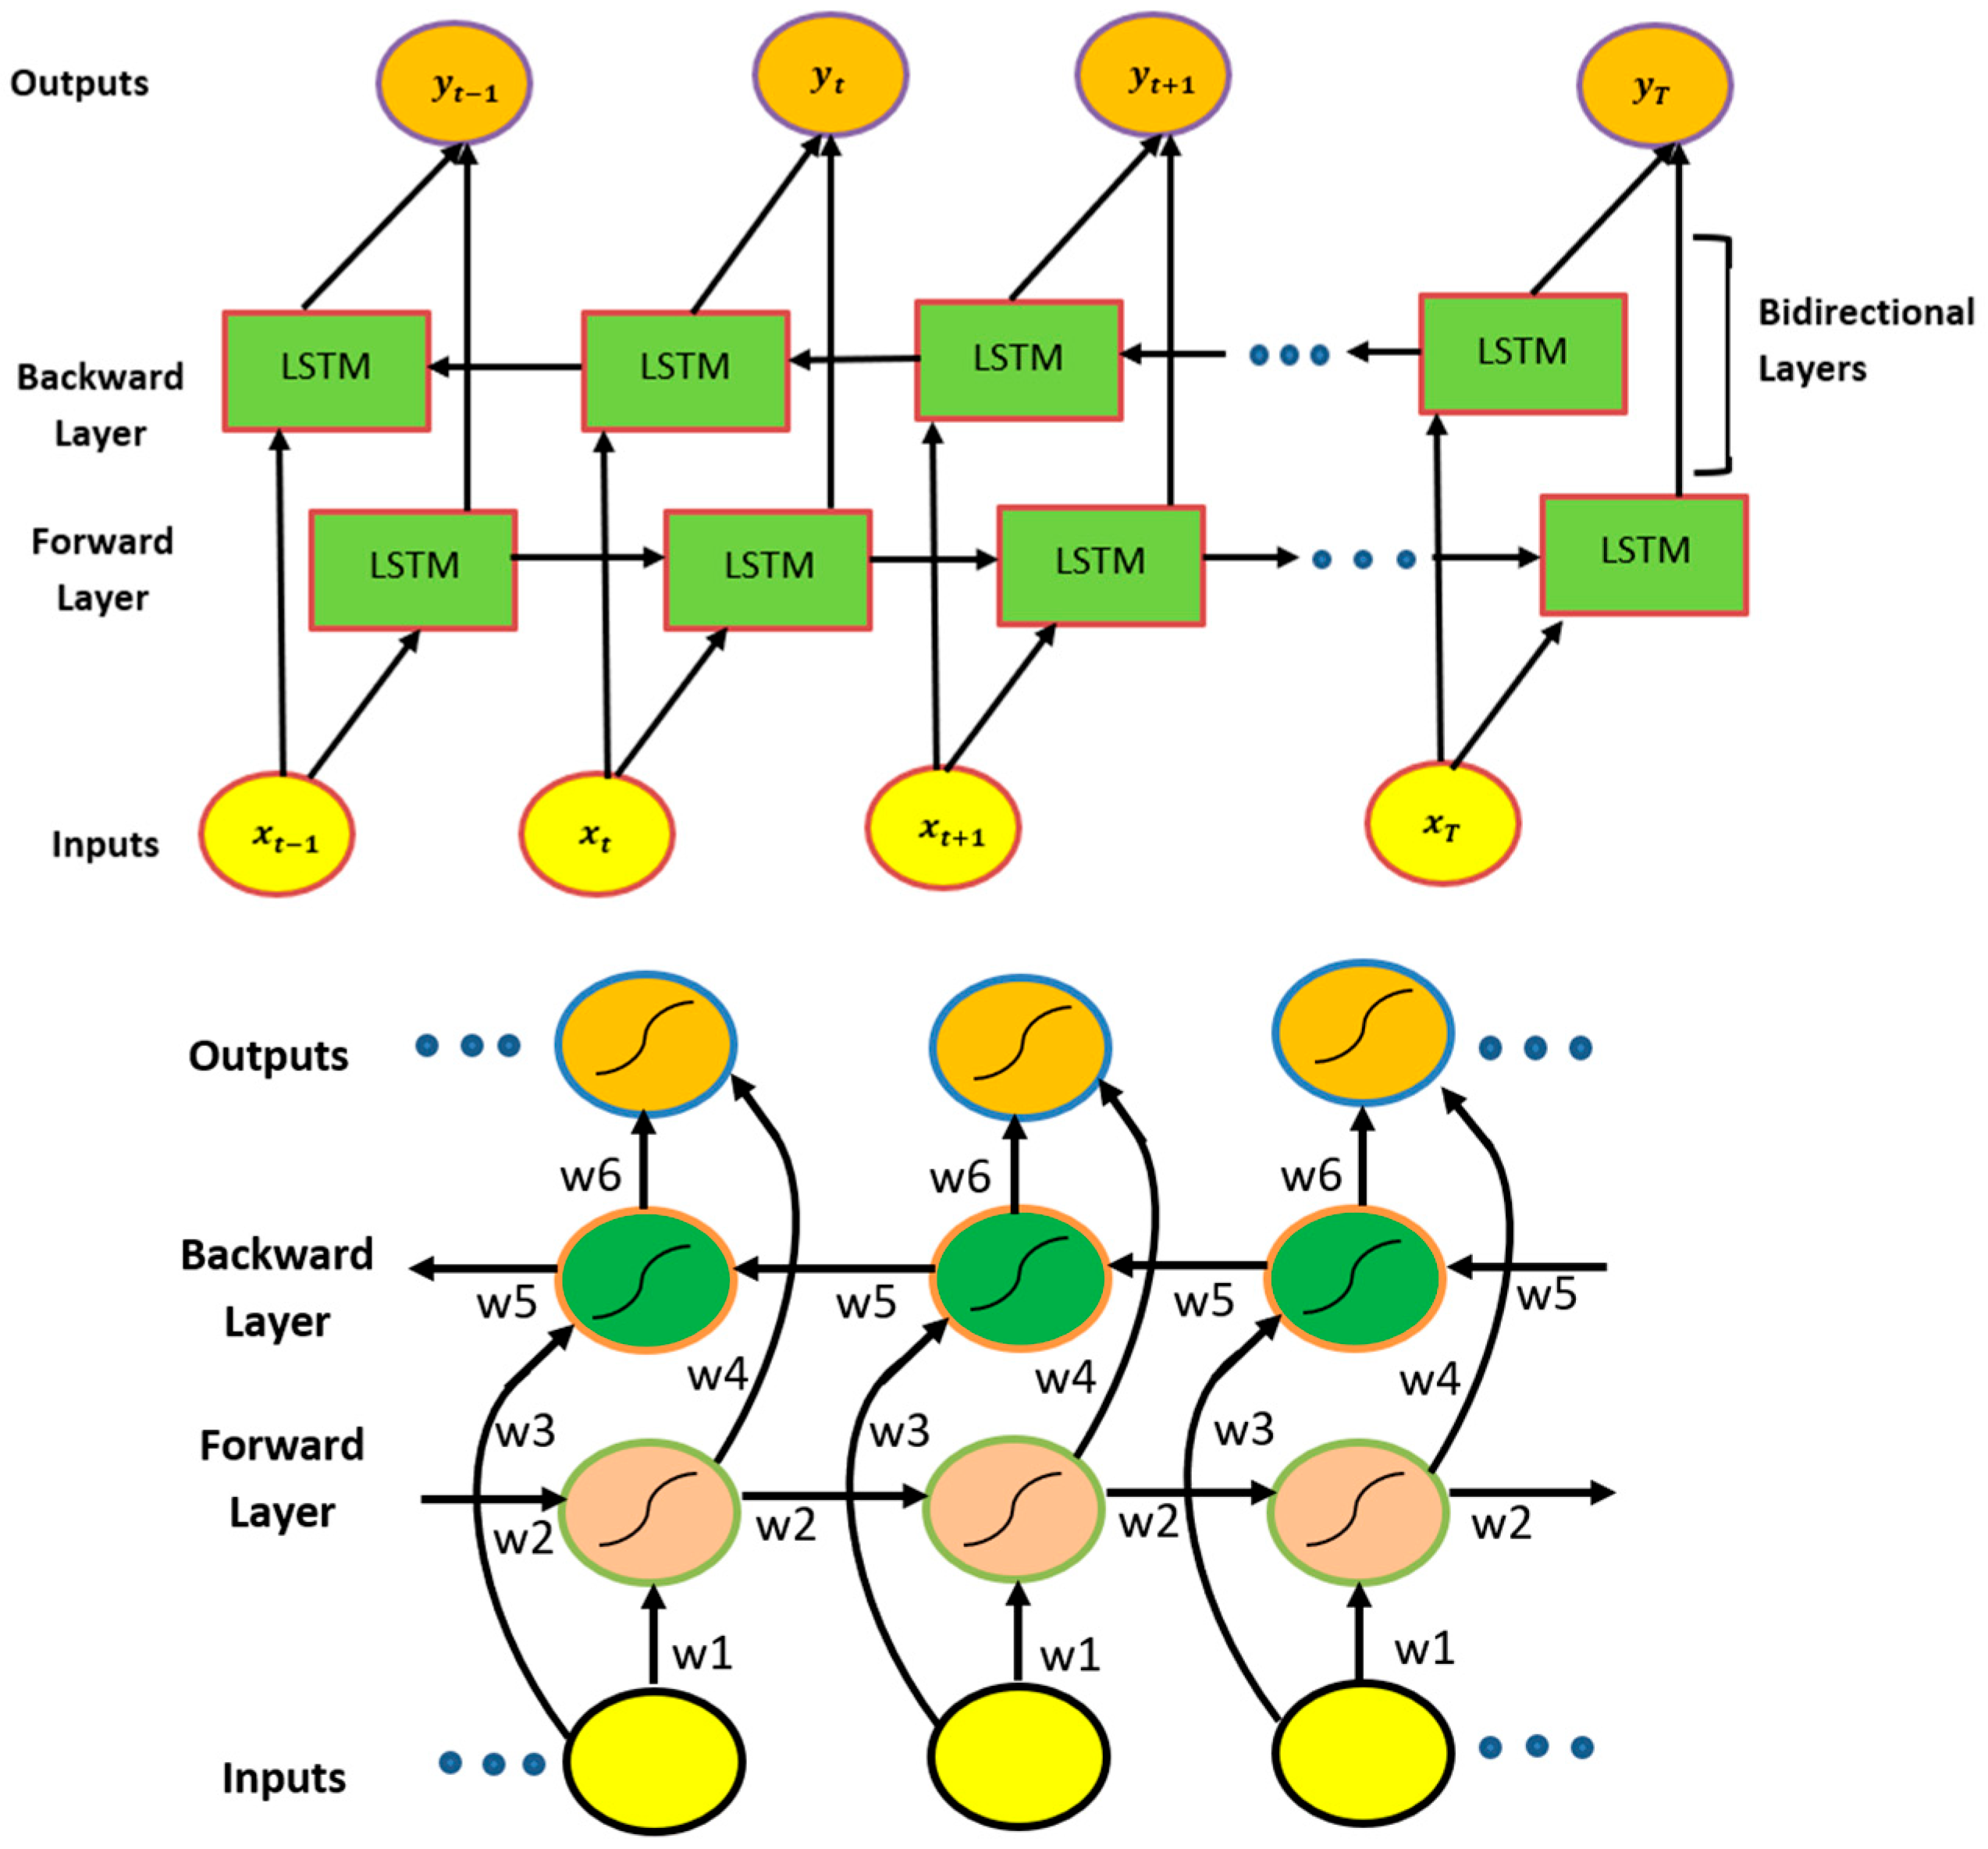
Bi-LSTM is widely used for forecasting excessive rainfall due to its ability to process incoming data both forward and backward and incorporate past and future dependencies, Figure A4, in the time series. This dual context improves the model’s comprehension of intricate weather processes. When it comes to predicting extreme events, Bi-LSTM is more effective than conventional LSTM since it can better recognize abrupt spikes or unusual patterns in rainfall [20].
h t = σ ( W h x x t + W h h h t 1 + b h )
z ( t ) = σ ( W z x x t + W z z z t + 1 + b z )
y ^ ( t ) = s o f t m a x ( W y x h t + W y x z t + b y )
z ( t ) : Intermediate representation
The current input and the prior forward hidden state are used to compute the forward hidden state Equation (A9) and the current input, and the subsequent backward hidden state are used to compute the backward hidden state Equation (A10). Through a softmax activation, the final output Equation (A11) integrates data from both forward and backward states, allowing the network to use context from the complete sequence to produce predictions that are more accurate [31].
Figure A4. Bidirectional-Long-Short-Term-Memory (BI-LSTM).
Atmosphere 16 01197 g0a4

Appendix A.4. Gated-Recurrent-Unit (GRU)

Because GRU and Bi-GRU effectively model temporal connections in weather data, they help predict excessive rainfall Figure A5. Large rainfall datasets benefit greatly from GRU’s speed and reduced propensity for overfitting, which are achieved by simplifying the LSTM structure while maintaining the capacity to capture long-term connections [20].
Figure A5. Gated-Recurrent-Unit (GRU).
Atmosphere 16 01197 g0a5
zt = σ(Wz × [ht − 1:xt])
rt = σ(Wr × [ht − 1:xt])
ĥt = tanh(W × [rt × ht − 1:xt])
ht = (1 − zt) × ht − 1 + zt × ĥt
zt: Update gate
rt: Reset gate
ĥt: Candidate hidden state
σ: Sigmoid activation function
tanh: Hyperbolic tangent activation function
A simpler version of LSTM that uses fewer gates and combines the cell and hidden states is called a Gated Recurrent Unit (GRU). The reset gate Equation (A13) decides how to mix incoming input with old memory, whereas the update gate Equation (A12) regulates how much of the previous hidden state is kept. The final hidden state Equation (A15) is a weighted mixture of the candidate state and the prior hidden state, while the candidate hidden state Equation (A14) integrates the reset-modulated past information and present input. Compared to LSTMs, GRUs reduce computational complexity while effectively capturing sequential dependencies [32].

Appendix A.5. Bidirectional Gated Recurrent Unit (Bi-GRU)
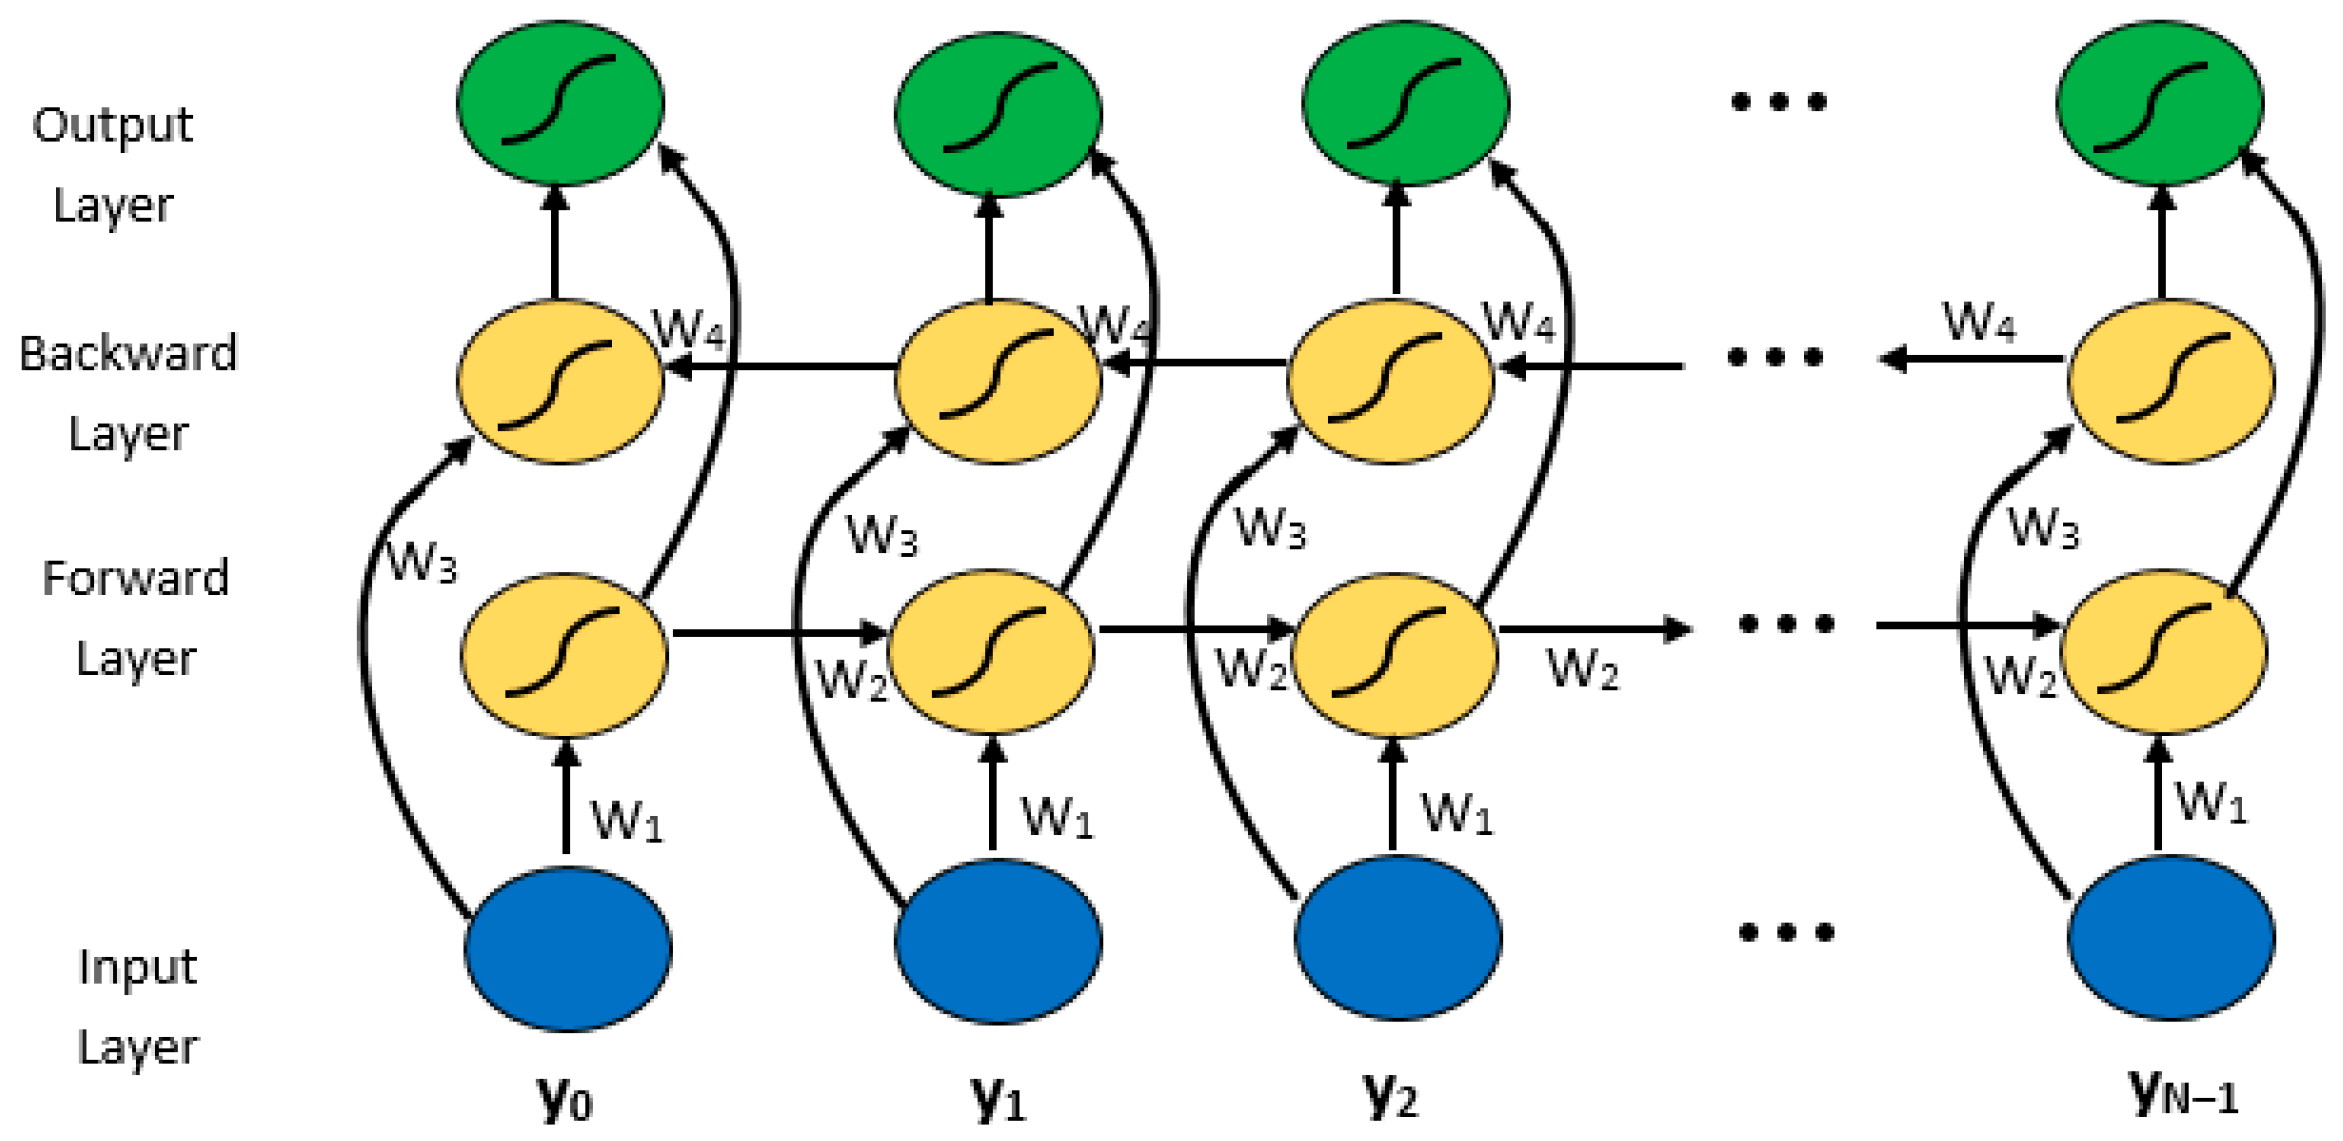
Bi-GRU improves the model’s comprehension of context before and after each time step by processing data both forward and backward. This is essential for identifying intricate patterns that result in extreme rainfall occurrences Figure A6.
h t = f ( W 1 y t + W 2 h t 1 + b ) t
h t = f ( W 3 y t + W 4 h t 1 + b ) t
o t = h t , h t t
x ^ = σ W o N + b t
h t : forward hidden state at time t
f : activation function
o t : output at time t is the concatenation of forward and backward hidden states.
The current input and the prior forward hidden state are used to compute the forward hidden state Equation (A16), and the current input and the prior backward hidden state in reverse are used to compute the backward hidden state Equation (A17). Information from both directions is merged in the combined output Equation (A18), and an activation function is used to the combined output to produce the final anticipated output Equation (A19). This enables Bi-GRU to be computationally efficient while utilizing historical and future data to improve sequential predictions [20,31].
Figure A6. Bidirectional Gated-Recurrent-Unit (Bi-GRU).
Atmosphere 16 01197 g0a6

Appendix A.6. Transformer Model

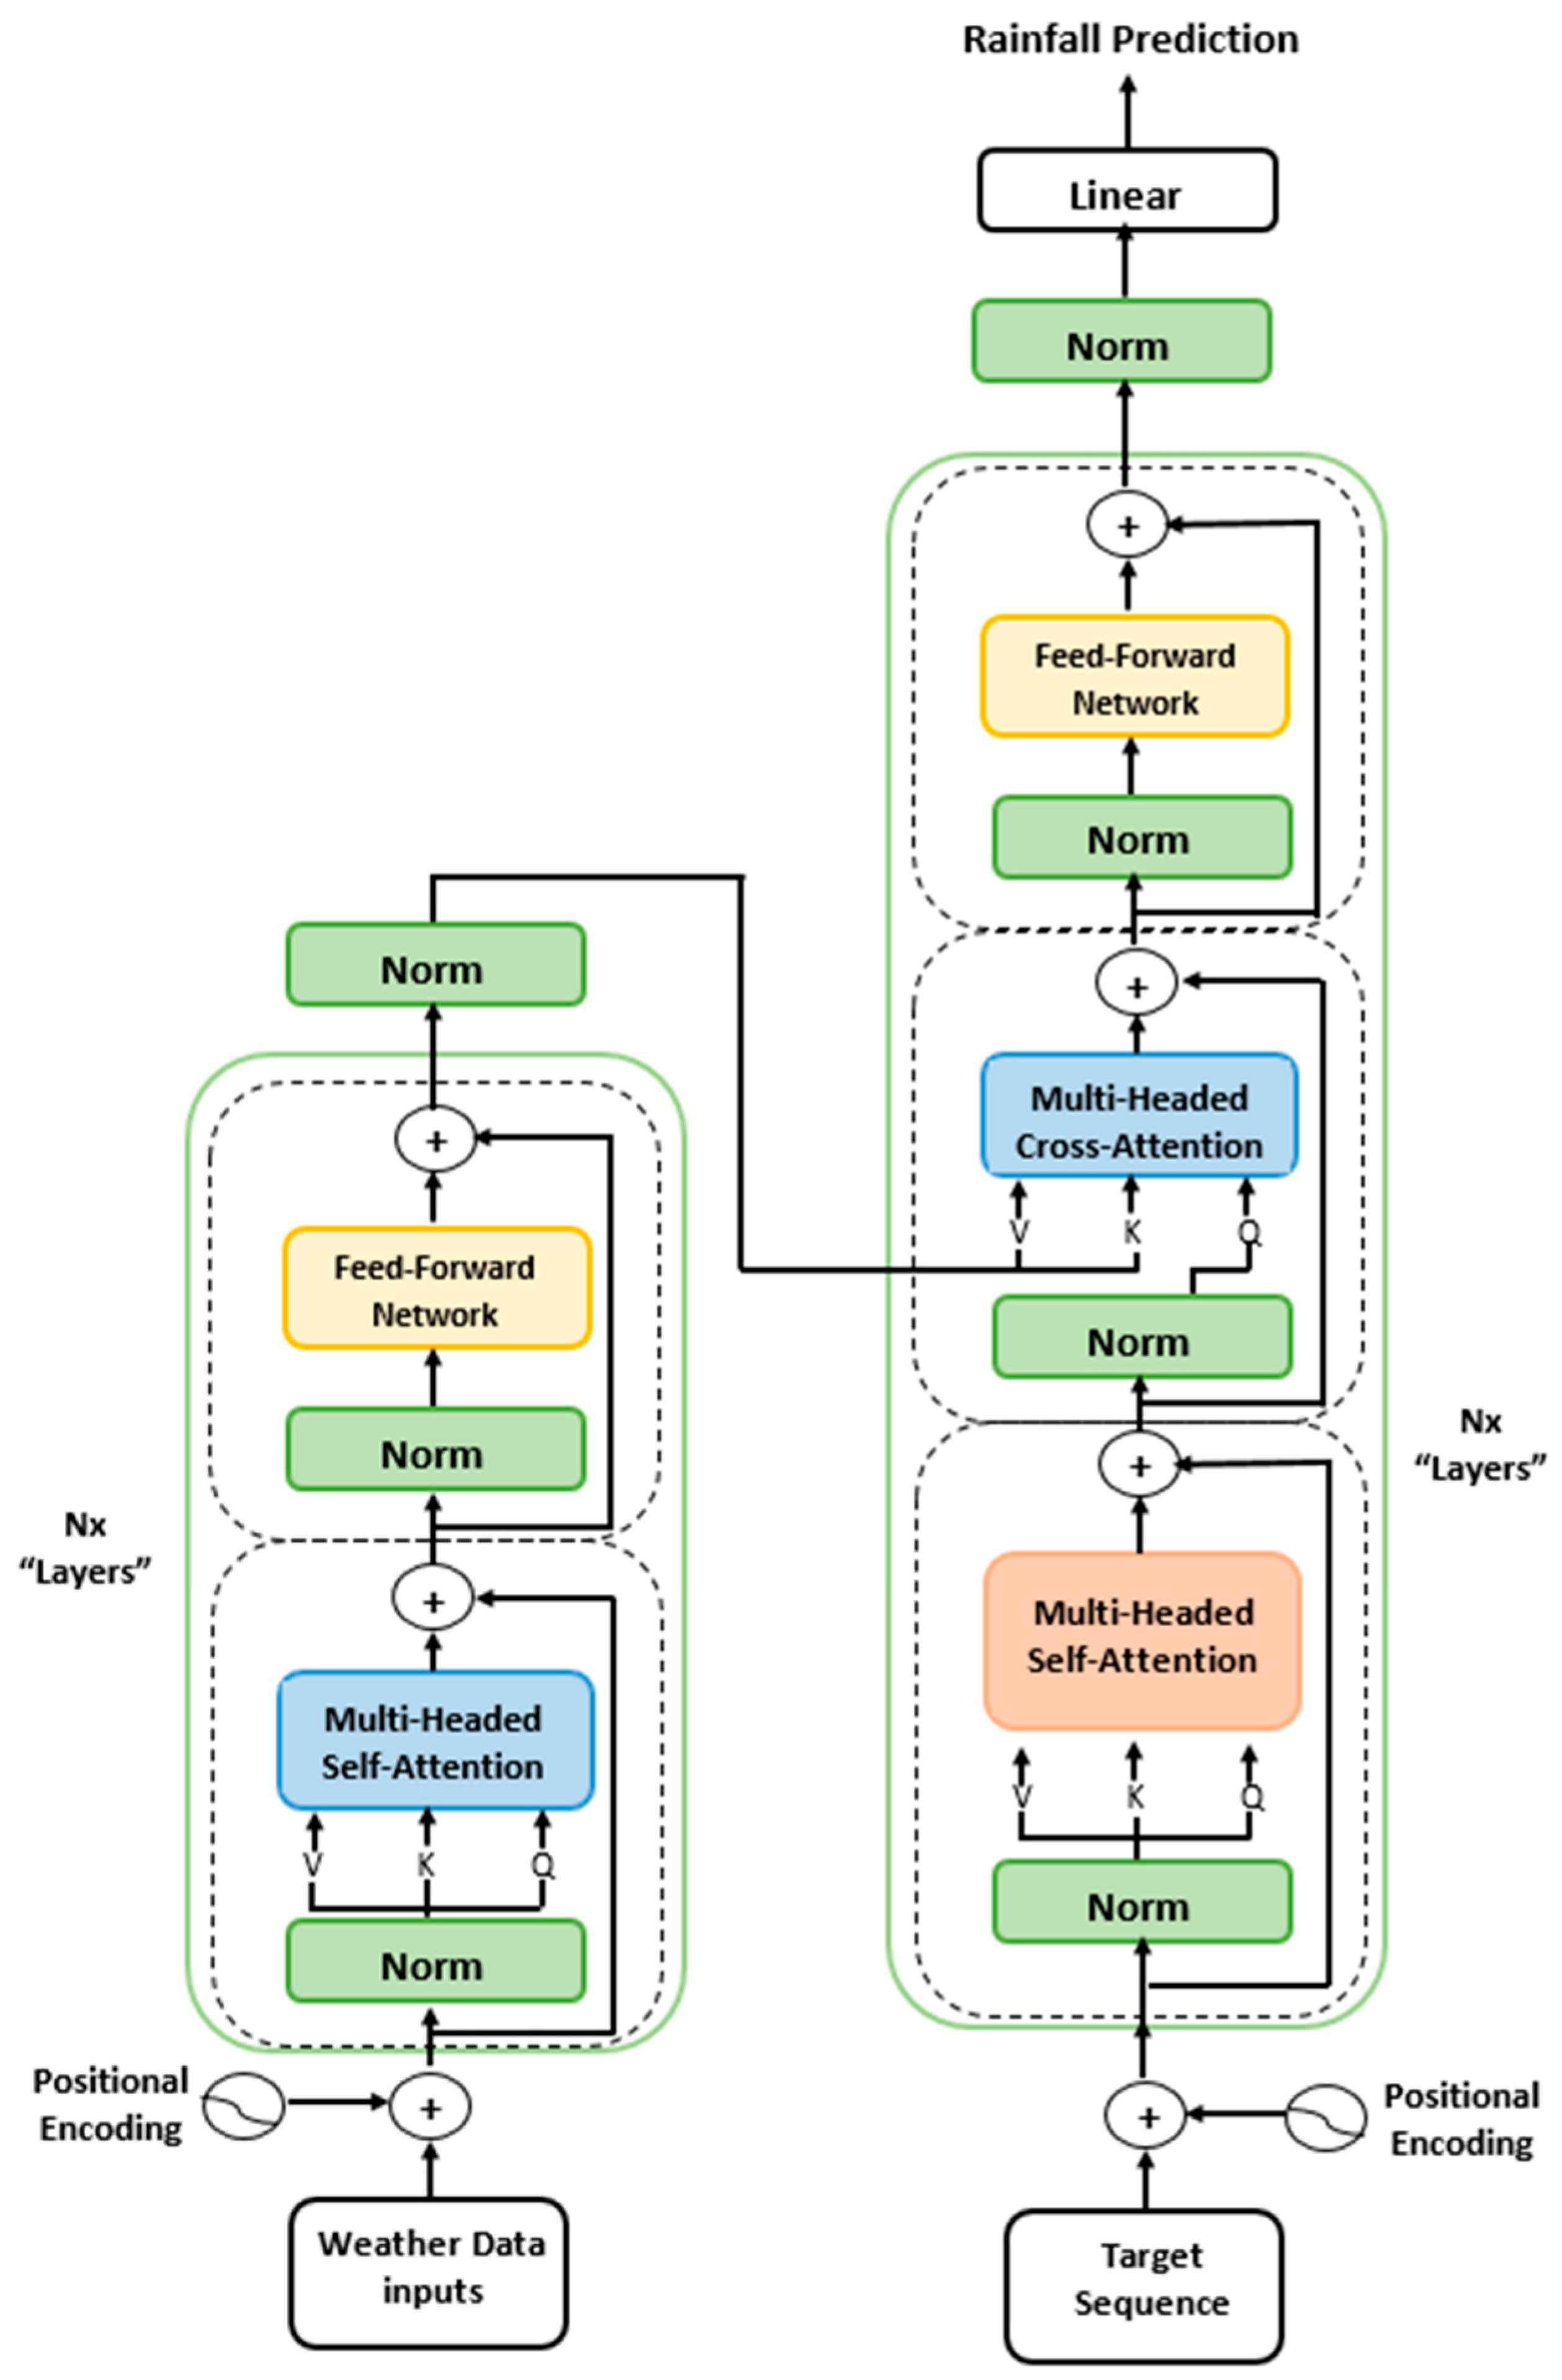
Because of its attention-based architecture, which captures long-range dependencies without relying on sequential processing like RNNs, the Transformer model is effective for predicting excessive rainfall. Self-attention enables the model to assign varying importance to different time steps, allowing it to detect significant trends and anomalies. Unlike traditional models (Figure A7, Transformer), it processes entire sequences in parallel, making it faster and more scalable, especially for handling irregular or multivariate meteorological data. By incorporating variables such as temperature, humidity, and pressure, Transformer models improve prediction accuracy for extreme rainfall.
The Transformer architecture, which was first presented in the paper “Attention Is All You Need,” is made up of feedforward networks and stacked encoder and decoder layers, multi-head self-attention, and layer normalization. substitutes self-attention for recurrence, and positional encoding is applied to preserve temporal order [12].
Attention ( Q , K , V ) = softmax   Q K T d k V
MultiHead ( Q , K , V ) = Concat ( head 1 ,   ,   headh ) W O
Headi = A t t e n t i o n Q W i Q ,   K W i K ,   V W i V
FFN(x) = ReLU (xW1 + b1) W2 + b2
LayerNorm(x + Sublayer(x))
PE ( pos , 2 i ) = sin p o s 10000 2 i d m o d e l
PE ( pos , 2 i + 1 ) = cos p o s 10000 2 i d m o d e l
Q: Query matrix
K: Key matrix
V: Value matrix
d k : dimension of keys
W O : learned weight matrix to combine concatenated heads.
W i Q , W i K   and   W i V : Each head has its own projection matrices
PE: positional encoding
p o s : position index of a token in the input sequence
i: the dimension index of the embedding vector
d m o d e l : total dimension of the model
Figure A7. Block diagram for the full Transformer Architecture.
Atmosphere 16 01197 g0a7
The Attention mechanism computes weighted representations of input using queries, keys, and values, allowing the model to focus on relevant parts of the sequence Equation (A20). Multi-head attention Equations (A21) and (A22) capture information from multiple representation subspaces in parallel, enhancing contextual understanding. The feed-forward network Equation (A23) applies nonlinear transformations to enrich feature representations. Layer normalization Equation (A24) stabilizes and accelerates training by normalizing inputs within each layer. Positional encoding Equations (A25) and (A26) inject sequence order information into the model, enabling it to differentiate positions in the input sequence. These components collectively form the basis of the Transformer architecture for sequential and time series modeling [18].

Appendix A.7. Model Training and Validation
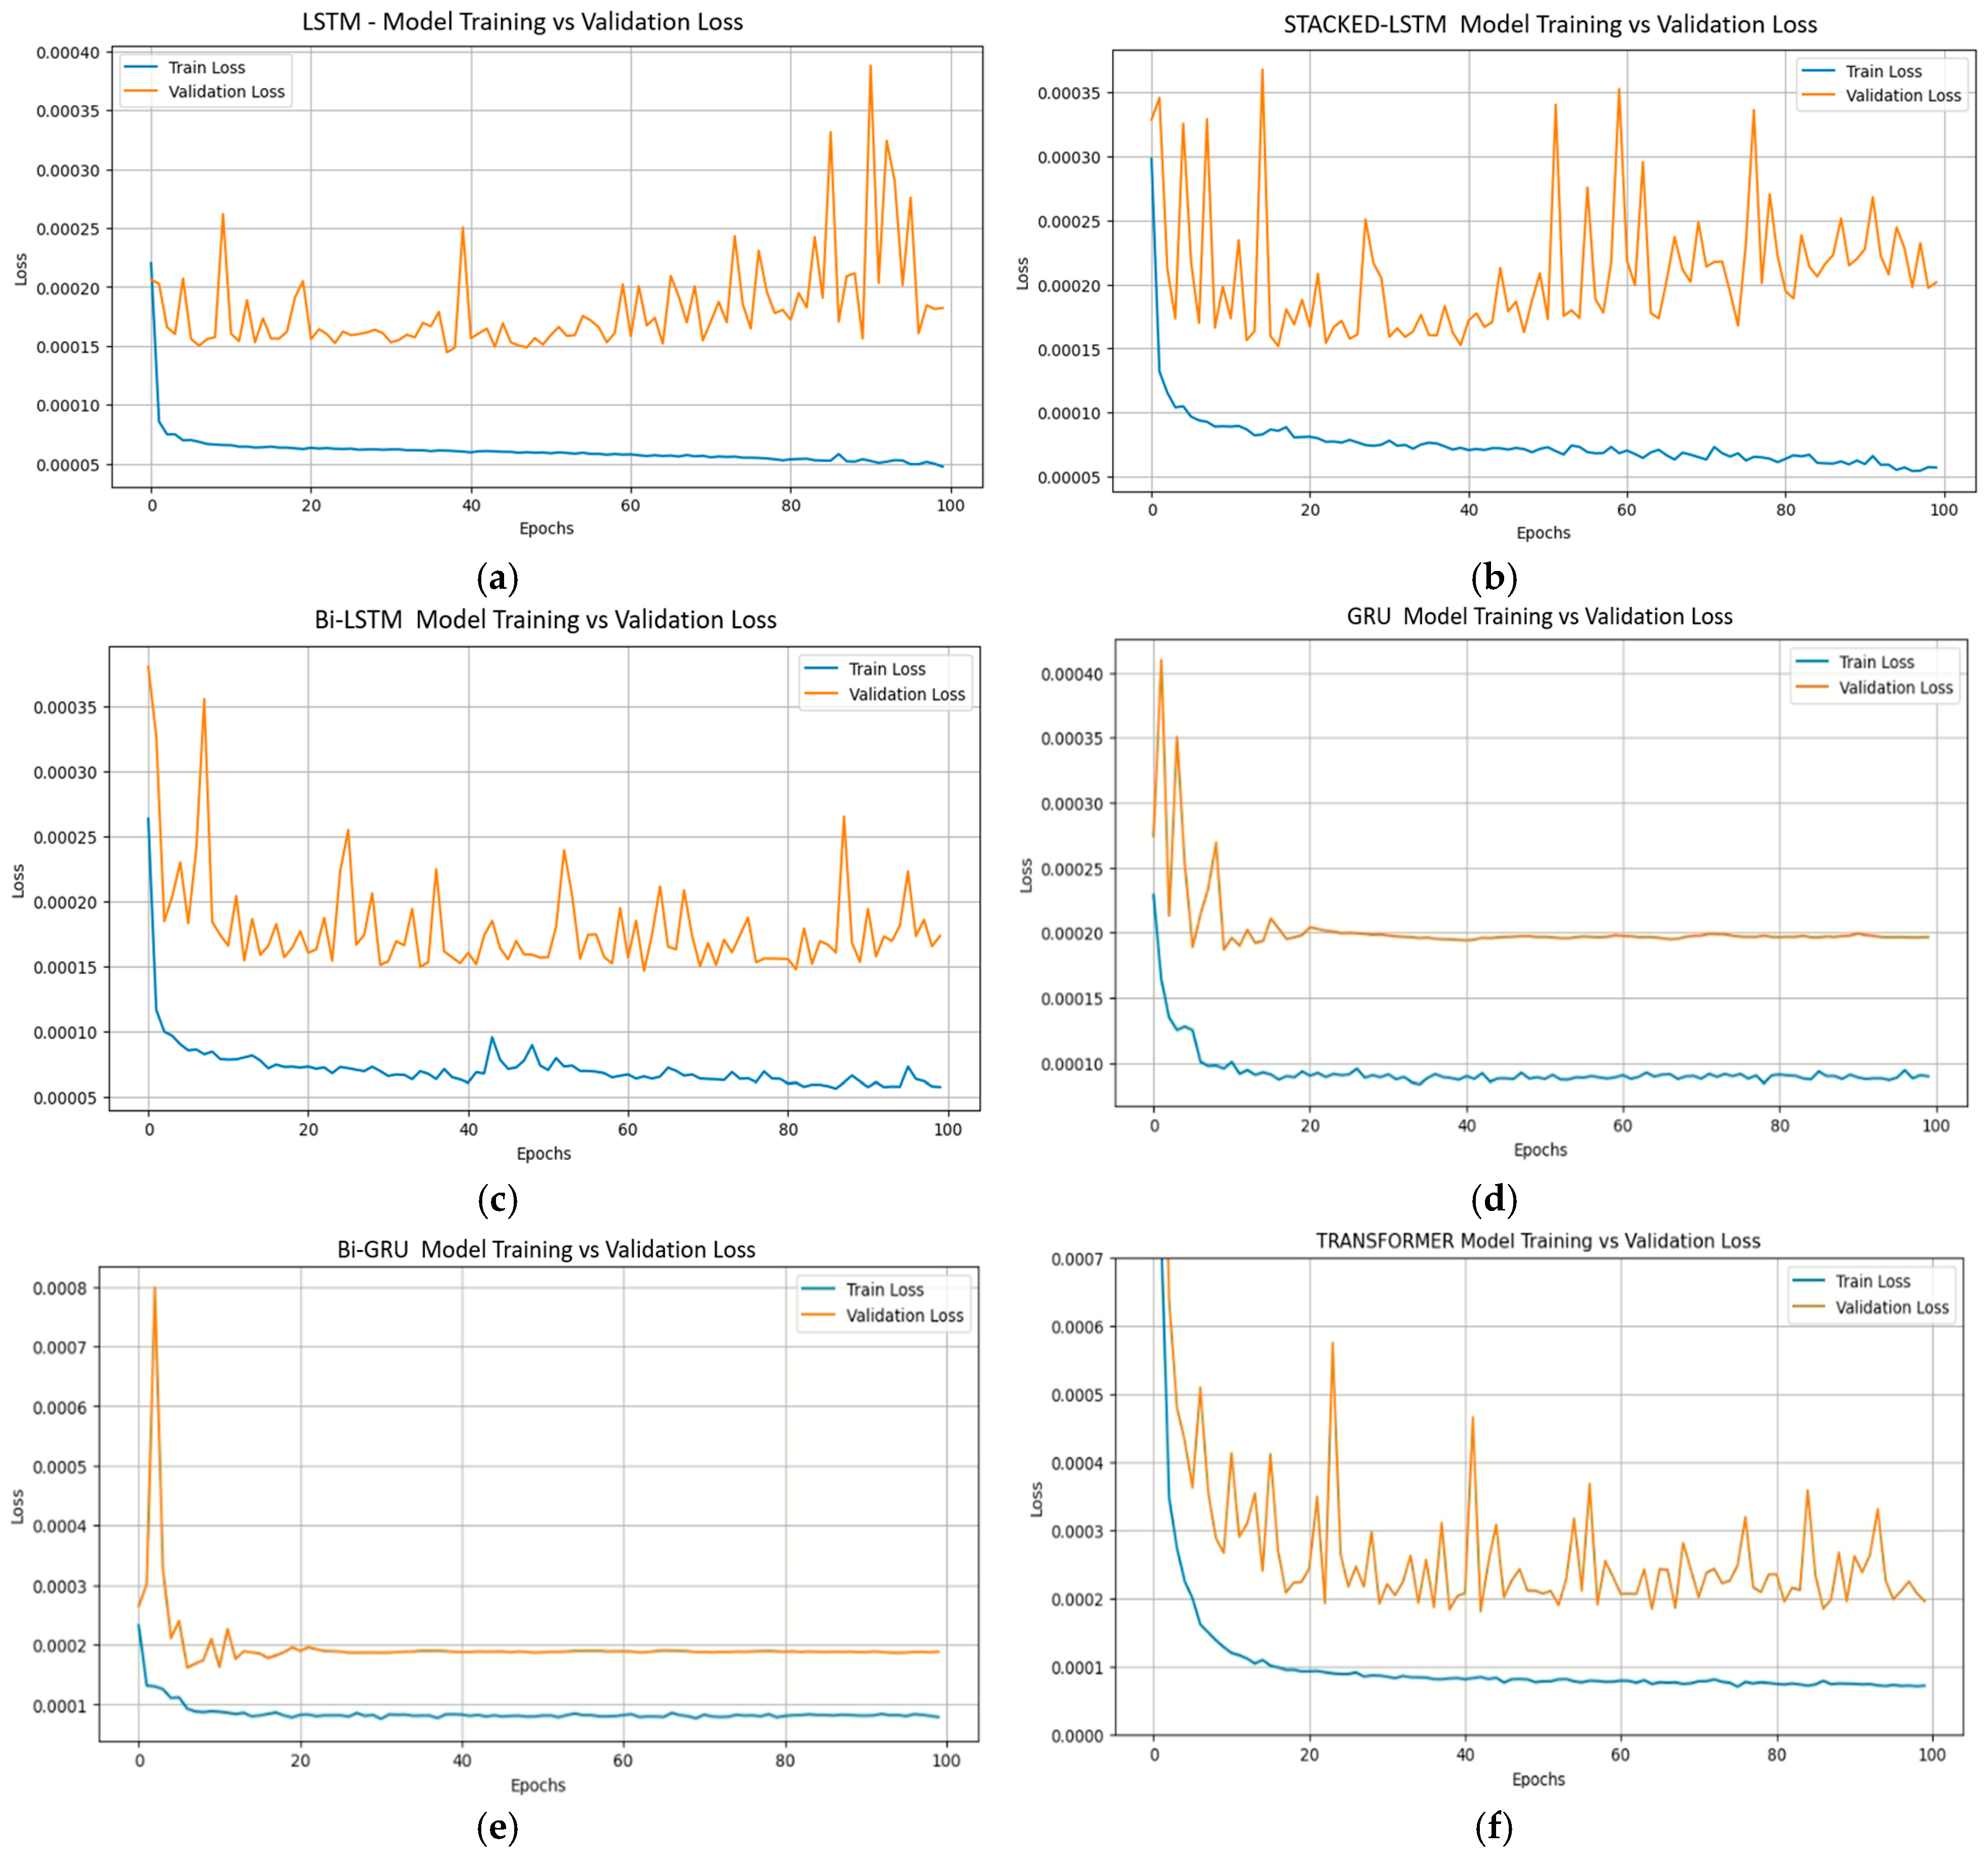
As shown in Figure A8, the training and validation curves of six deep learning models are presented. The LSTM and stacked-LSTM models exhibit stable training loss but relatively high and fluctuating validation loss, indicating limited generalization. Bi-LSTM improves temporal feature learning yet shows a noticeable train–validation gap. GRU converges faster than LSTM variants but with moderate stability. In contrast, the Bi-GRU achieves the lowest and most stable training and validation losses, confirming its superior predictive capability. The Transformer demonstrates reasonable convergence, though higher variance in validation loss reduces robustness compared with Bi-GRU.
Figure A8. Training and validation loss curves of deep learning models: (a) LSTM, (b) STACKED-LSTM, (c) Bi-LSTM, (d) GRU, (e) Bi-GRU, (f) TRANSFORMER.
Atmosphere 16 01197 g0a8
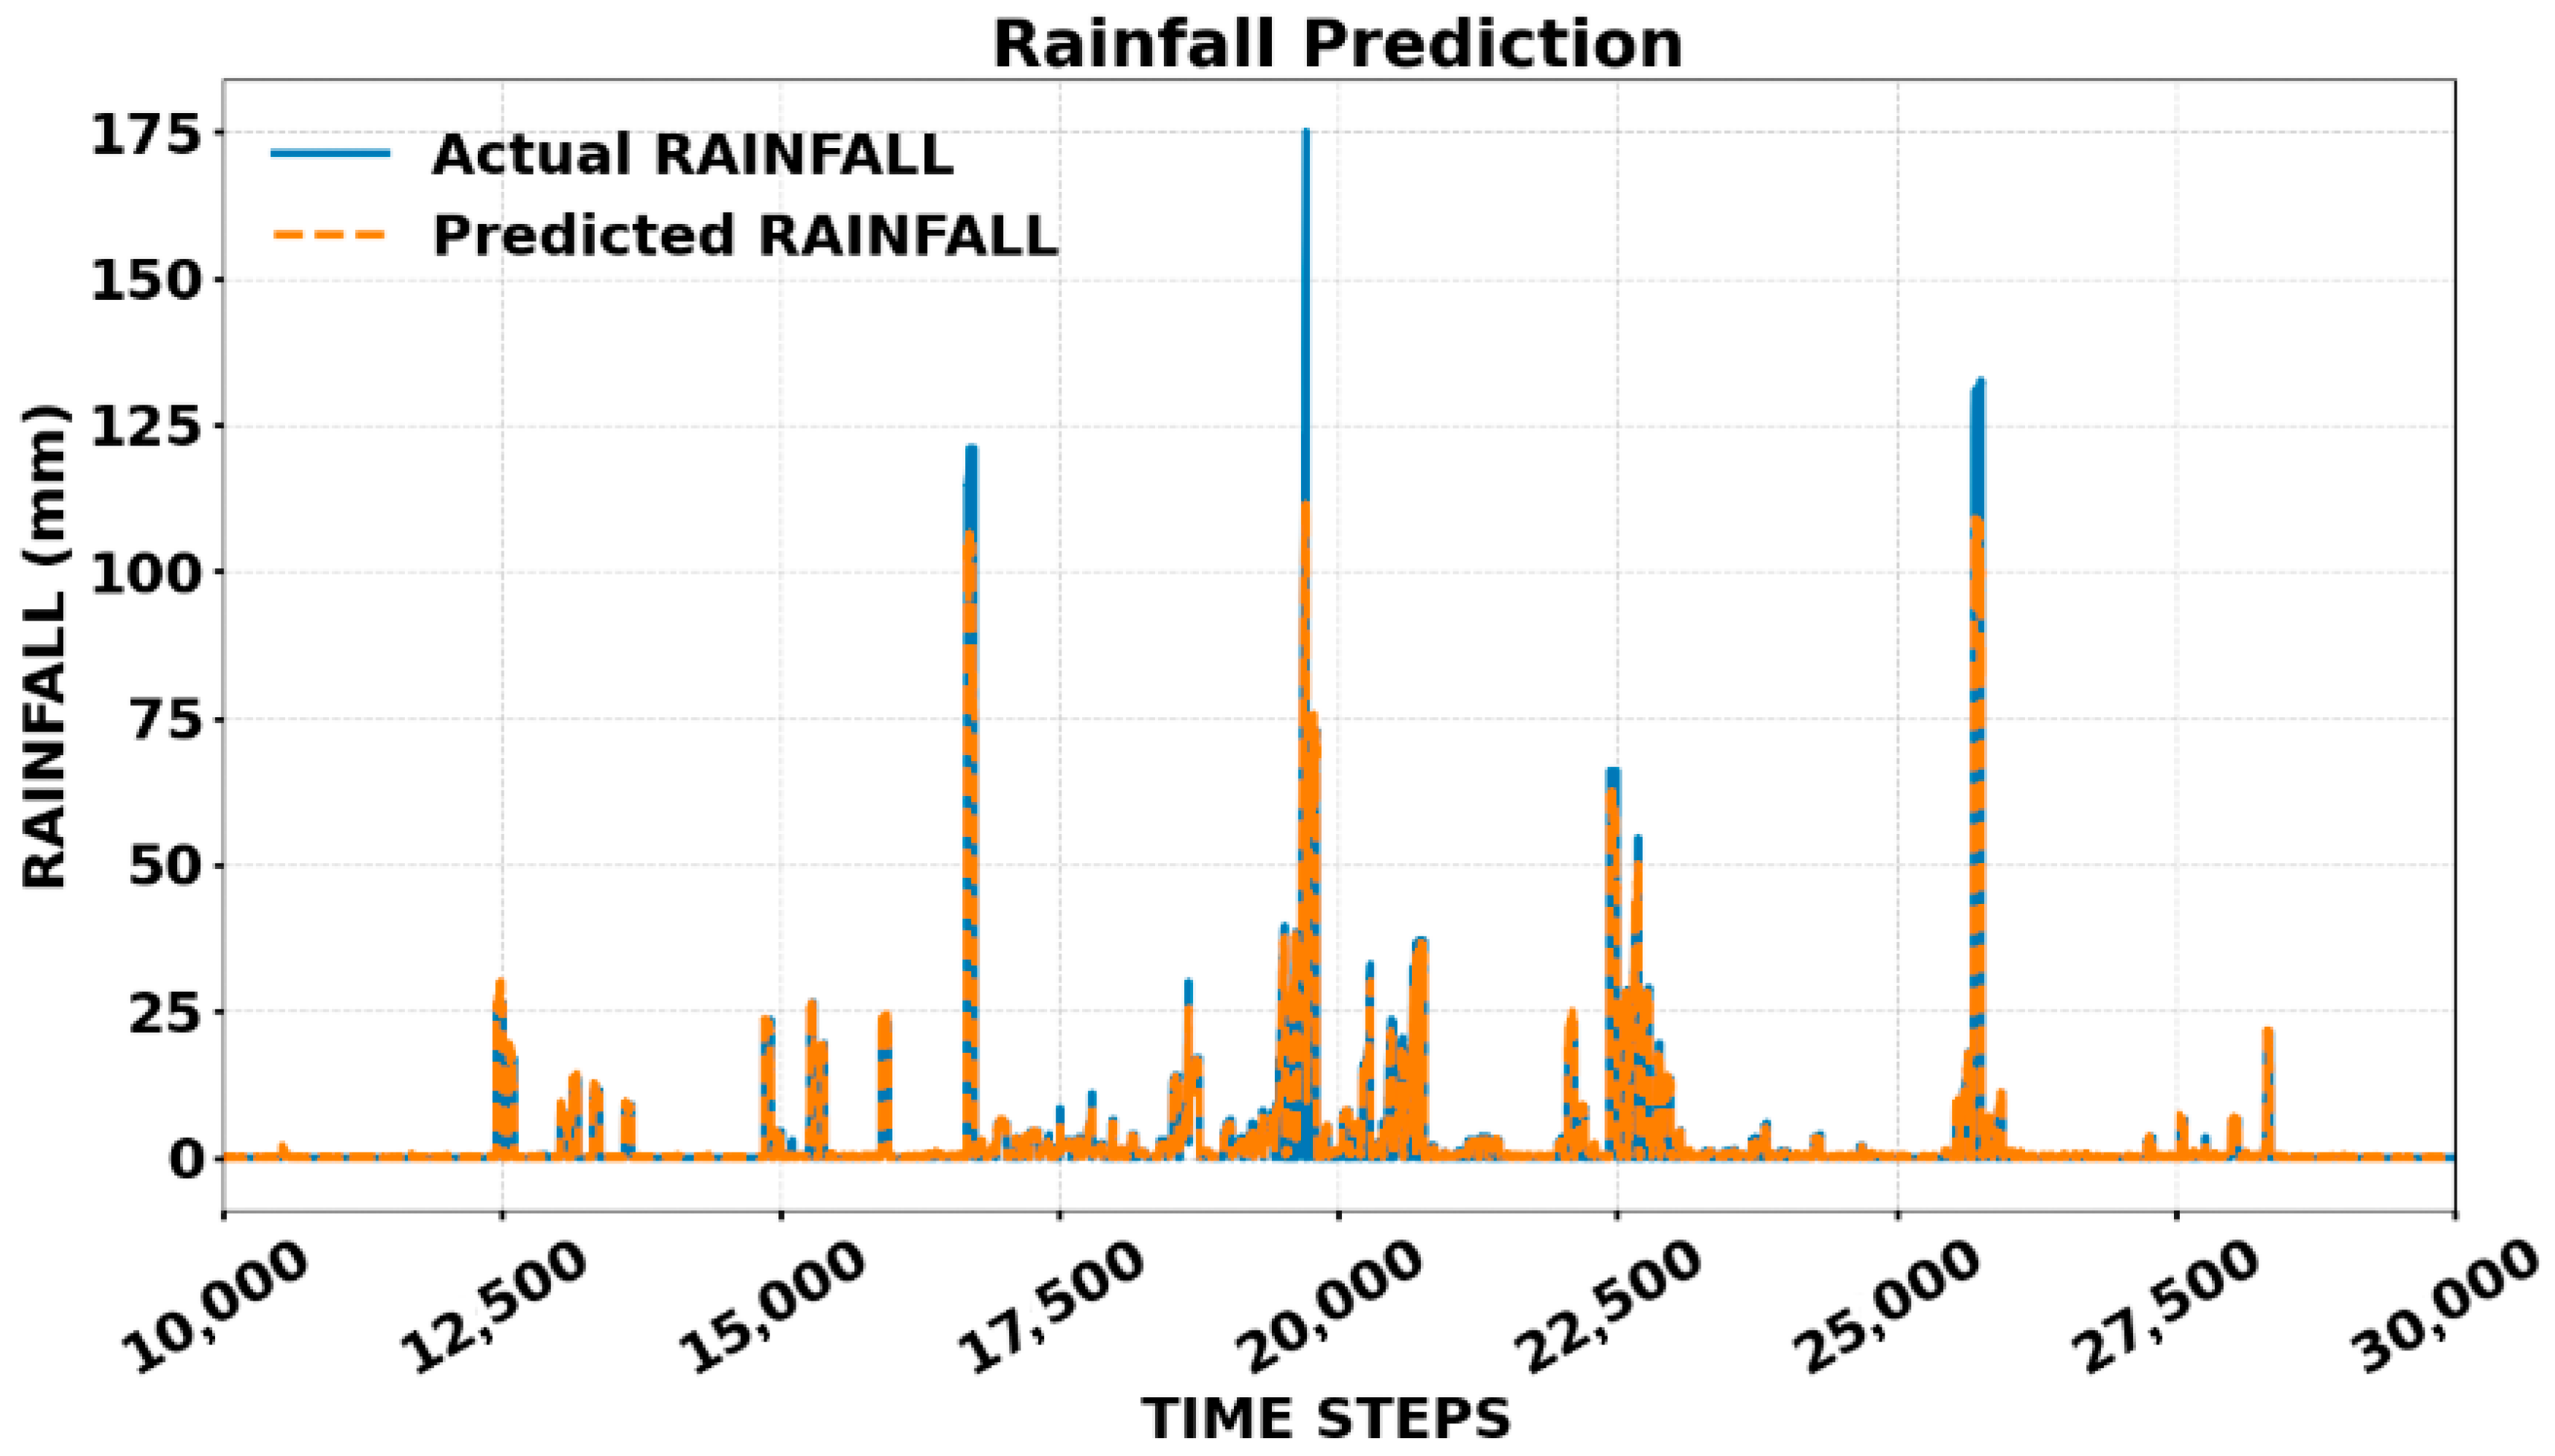
Figure A9 shows a comparison between the research period’s actual and expected rainfall values. Although there are minor variations during high-intensity occurrences, the model well depicts the temporal variability and strong rainfall peaks. The close alignment of predicted and observed rainfall indicates the reliability of the proposed approach for forecasting.
Overall Model Insights Across Topologies, as described in Table A1, Bi-GRU consistently achieves the highest R2 and lowest RMSE (especially in LINEAR and TRIANGULAR); GRU and Bi-LSTM also perform well. LSTM is moderately effective, while STACKED-LSTM and Transformer show inconsistent results. Across all topologies and datasets, Bi-GRU emerged as the most consistently accurate model, achieving the highest R2 (up to 0.9548) and lowest RMSE (as low as 2.2120), particularly in linear (Datasets 1–2) and overall comparison with entire 12 datasets and triangular (Dataset 4) configurations. Bi-LSTM also performed robustly, especially in circular topologies, demonstrating reliable temporal modeling capabilities. In contrast, Transformer models showed fluctuating results, occasionally producing high R2 but often suffering from unacceptably high MAPE (up to 88.55%), indicating instability and poor generalization in this application. Geometrical configurations also played a significant role: circular and linear topologies consistently yielded better predictive performance, while triangular and quadrilateral setups showed moderate variability. These results reinforce the importance of both model architecture and station topology in improving extreme rainfall forecasts.
Figure A9. Actual vs. Predicted Rainfall.
Atmosphere 16 01197 g0a9
Table A1. Overall Model Insights Across Topologies.
MODELPERFORMANCE
LSTMPerforms decently but not best-in-class
STACKED-LSTMInconsistent, often high MAPE
Bi-LSTMHigh R2, competitive with Bi-GRU, especially in CIRCULAR Topology
GRUPerforms well, often just behind Bi-GRU
Bi-GRUBest R2 and lowest RMSE in many cases (especially LINEAR, TRIANGULAR)
TRANSFORMERMost inconsistent: sometimes high R2 but very high MAPE
STACKED-LSTMInconsistent, often high MAPE

Appendix B. Performance Comparison for Deep Learning Models Across Different Geometrical Configurations for Rainfall Prediction: MAE vs. Dataset, MAPE% vs. Dataset, MSE vs. Dataset
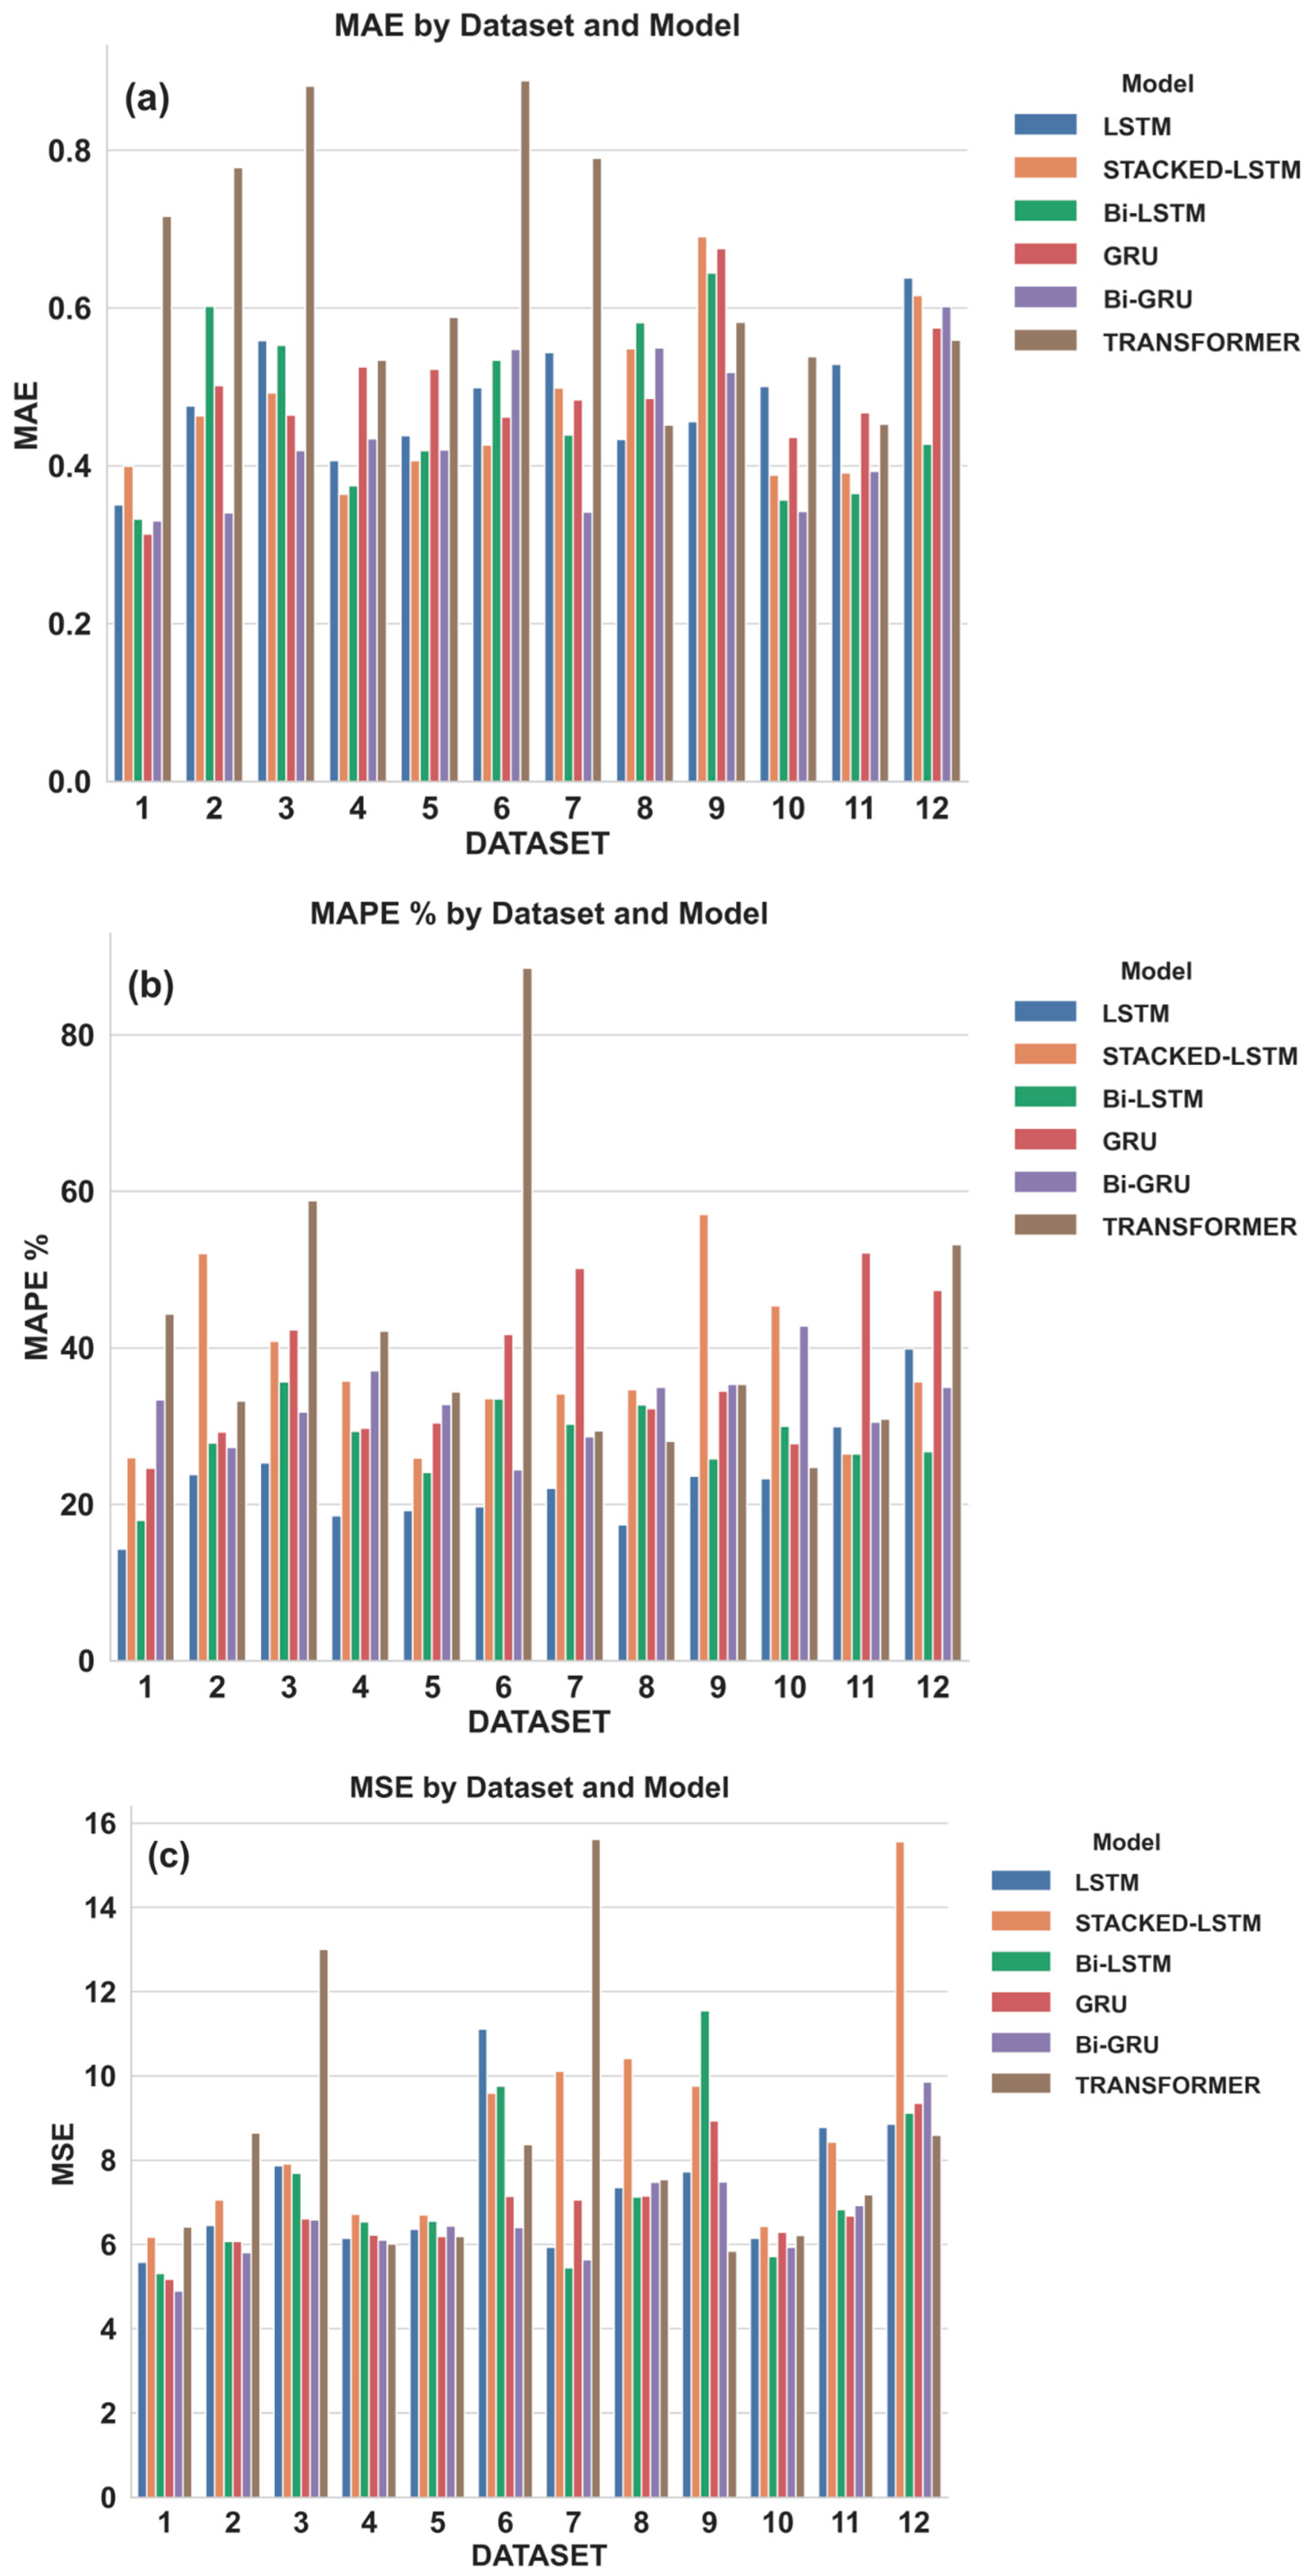
To evaluate the predictive capabilities of the proposed framework, this study investigated six ML algorithms: STACKED-LSTM, LSTM, Bi-LSTM, Bi-GRU, GRU, and TRANSFORMER connected to linear, triangular, quadrilateral, and circular geometrical topologies using a total of twelve datasets. Among the metrics used to evaluate model performance are RMSE, MAE, MSE, MAPE, and R2. A thorough summary of all results is given in Table A2, which is organized by dataset, topology, model, and related metrics. The variance in RMSE, R2 presented in Section 4.1 and MAE, MAPE (%), and MSE among various deep learning models is shown in Figure A10.
Figure A10. Performance Comparison for Deep Learning Models Across Different Geometrical Configurations for Rainfall Prediction: (a) MAE vs. dataset, (b) MAPE% vs. dataset, (c) MSE vs. dataset.
Atmosphere 16 01197 g0a10

Appendix C. Performance Evaluation Deep Learning Models and Topologies

Table A2, Figure 5 and Figure A10 summarize the comparison of model performance over 12 datasets in four different topological configurations: linear, triangular, quadrilateral, and circular. In the linear topology (Datasets 1–2) and in the entire datasets, Bi-GRU consistently outperforms others with the lowest RMSE and highest R2, while Transformer performs poorly with high MAPE (33–44%) and lower R2. In the triangular topology (Datasets 3–4), Bi-GRU remains strong; although Transformer shows a slightly better R2 in Dataset 4, it fails in Dataset 3 with very high MAPE (~59%). In the quadrilateral topology (Datasets 5–6), Bi-GRU leads in Dataset 6, while Transformer’s good R2 is offset by extremely high MAPE (88.55%) in one case, showing instability. In the circular topology (Datasets 7–12), Bi-LSTM and Bi-GRU are most stable, with consistently high R2 and low errors. Transformers and STACKED-LSTM show wide fluctuations, often with very high MAPE, making them less reliable.
Table A2. Performance Summary of Deep Learning Models across Topologies and Datasets.
S. No.GeometryModelRMSEMAEMSEMAPE%R2
1LinearLSTM2.36240.35035.580814.270.9485
STACKED-LSTM2.48520.39956.176125.980.9430
Bi-LSTM2.30450.33245.310817.940.9510
GRU2.27620.31355.181224.600.9522
Bi-GRU2.21200.33004.893233.380.9548
TRANSFORMER 2.53220.71646.412144.280.9408
2LinearLSTM2.54010.47586.452023.820.9404
STACKED-LSTM2.65640.46327.056552.020.9349
Bi-LSTM2.46490.60266.075927.880.9439
GRU2.46350.50166.068829.240.9440
Bi-GRU2.41030.34035.809627.260.9464
TRANSFORMER 2.94070.77828.647833.200.9202
3TriangularLSTM2.80590.55867.872925.300.9273
STACKED-LSTM2.81310.49267.913340.850.9269
Bi-LSTM2.77270.55287.688135.670.9290
GRU2.57080.46446.608842.260.9390
Bi-GRU2.56660.41956.587631.830.9392
TRANSFORMER 3.60620.881613.00558.800.8799
4TriangularLSTM2.48050.40676.152718.540.9441
STACKED-LSTM2.59220.36436.719535.780.9390
Bi-LSTM2.55790.37486.542629.380.9406
GRU2.49570.52526.228529.730.9434
Bi-GRU2.47190.43446.110237.110.9445
TRANSFORMER 2.45220.53436.013142.100.9454
5QuadrilateralLSTM2.52160.43826.358719.190.9413
STACKED-LSTM2.58950.40656.705325.910.9381
Bi-LSTM2.56140.41936.560624.070.9394
GRU2.48890.52276.194530.430.9428
Bi-GRU2.53670.42016.434632.780.9406
TRANSFORMER 2.48840.58846.191934.370.9428
6QuadrilateralLSTM3.33390.499111.11519.690.8974
STACKED-LSTM3.09630.42679.586833.520.9115
Bi-LSTM3.12380.53419.758333.460.9099
GRU2.67310.46207.145341.670.9340
Bi-GRU2.53050.54796.403424.440.9409
TRANSFORMER 2.89310.88838.370288.550.9227
7Circular LSTM2.43600.54385.933922.080.9452
STACKED-LSTM3.17970.498910.11034.160.9067
Bi-LSTM2.33370.43905.446330.280.9497
GRU2.65790.48357.064250.140.9348
Bi-GRU2.37380.34125.634928.620.9480
TRANSFORMER 3.95180.789915.61729.390.8558
8Circular LSTM2.71070.43337.348217.370.9322
STACKED-LSTM3.22810.548410.42034.690.9038
Bi-LSTM2.67060.58167.132132.740.9342
GRU2.67420.48577.151332.240.9340
Bi-GRU2.73430.54977.476434.980.9310
TRANSFORMER 2.74470.45187.533528.060.9305
9Circular LSTM2.77940.45627.725323.630.9287
STACKED-LSTM3.12370.69069.757357.030.9099
Bi-LSTM3.39880.644511.55125.840.8934
GRU2.98880.67558.933134.470.9175
Bi-GRU2.73560.51857.483635.330.9309
TRANSFORMER 2.41660.58215.840135.340.9461
10Circular LSTM2.47980.50066.149223.280.9432
STACKED-LSTM2.53610.38836.431845.340.9406
Bi-LSTM2.39050.35665.714329.990.9472
GRU2.50840.43626.292327.750.9419
Bi-GRU2.43590.34235.933442.730.9452
TRANSFORMER 2.49320.53856.216124.700.9426
11Circular LSTM2.96400.52878.785429.940.9189
STACKED-LSTM2.90420.39118.434326.450.9221
Bi-LSTM2.61390.36516.832526.440.9369
GRU2.58420.46716.678352.130.9383
Bi-GRU2.63160.39346.925230.540.9361
TRANSFORMER 2.67900.45257.177230.920.9337
12Circular LSTM2.97640.63828.859239.910.9182
STACKED-LSTM3.94510.615915.56335.680.8563
Bi-LSTM3.01960.42759.118226.740.9158
GRU3.05860.57479.354947.310.9136
Bi-GRU3.13900.60209.853434.960.9090
TRANSFORMER 2.93120.55958.591953.180.9207

References

  1. Chaluvadi, R.; Varikoden, H.; Mujumdar, M.; Ingle, S.T.; Kuttippurath, J. Changes in large-scale circulation over the Indo-Pacific region and its association with the 2018 Kerala extreme rainfall event. Atmos. Res. 2021, 263, 105809. [Google Scholar] [CrossRef]
  2. Dimri, A.P.; Chevuturi, A.; Niyogi, D.; Thayyen, R.J.; Ray, K.; Tripathi, S.N.; Pandey, A.K.; Mohanty, U.C. Cloudbursts in Indian Himalayas: A Review. Earth-Sci. Rev. 2017, 168, 1–23. [Google Scholar] [CrossRef]
  3. Deshpande, N.R.; Kothawale, D.R.; Kumar, V.; Kulkarni, J.R. Statistical characteristics of cloudburst and mini-cloudburst events during the monsoon season in India. Int. J. Climatol. 2018, 38, 4172–4188. [Google Scholar] [CrossRef]
  4. India Meteorological Department (IMD). Standard Operating Procedure—Weather Forecasting and Warning Services; Ministry of Earth Sciences: New Delhi, India, 2021. Available online: https://mausam.imd.gov.in/imd_latest/contents/pdf/forecasting_sop.pdf (accessed on 20 September 2025).
  5. Endalie, D.; Haile, G.; Taye, W. Deep learning model for daily rainfall prediction: Case study of Jimma, Ethiopia. Water Supply 2022, 22, 3448–3461. [Google Scholar] [CrossRef]
  6. Aguasca-Colomo, R.; Castellanos-Nieves, D.; Méndez, M. Comparative analysis of rainfall prediction models using machine learning in islands with complex orography: Tenerife Island. Appl. Sci. 2019, 9, 4931. [Google Scholar] [CrossRef]
  7. Baljon, M.; Sharma, S.K. Rainfall prediction rate in Saudi Arabia using improved machine learning techniques. Water 2023, 15, 826. [Google Scholar] [CrossRef]
  8. Singh, B.; Thapliyal, R. Cloudburst events observed over Uttarakhand during monsoon season 2017 and their analysis. Mausam 2022, 73, 91–104. [Google Scholar] [CrossRef]
  9. Chaudhuri, C.; Tripathi, S.; Srivastava, R.; Misra, A. Observation-and numerical-analysis-based dynamics of the Uttarkashi cloudburst. Ann. Geophys. 2015, 33, 671–686. [Google Scholar] [CrossRef]
  10. Mishra, P.; Al Khatib, A.M.G.; Yadav, S.; Ray, S.; Lama, A.; Kumari, B.; Yadav, R. Modeling and forecasting rainfall patterns in India: A time series analysis with XGBoost algorithm. Environ. Earth Sci. 2024, 83, 163. [Google Scholar] [CrossRef]
  11. Bouach, A. Artificial neural networks for monthly precipitation prediction in north-west Algeria: A case study in the Oranie-Chott-Chergui basin. J. Water Clim. Change 2024, 15, 582–592. [Google Scholar] [CrossRef]
  12. Zhang, H.; Liu, Y.; Zhang, C.; Li, N. Machine Learning Methods for Weather Forecasting: A Survey. Atmosphere 2025, 16, 82. [Google Scholar] [CrossRef]
  13. Dawoodi, H.H.; Patil, M.P. Rainfall prediction for north Maharashtra, India using advanced machine learning models. Indian J. Sci. Technol. 2023, 16, 956–966. [Google Scholar] [CrossRef]
  14. Rahman, A.U.; Abbas, S.; Gollapalli, M.; Ahmed, R.; Aftab, S.; Ahmad, M.; Khan, M.A.; Mosavi, A. Rainfall prediction system using machine learning fusion for smart cities. Sensors 2022, 22, 3504. [Google Scholar] [CrossRef] [PubMed]
  15. Ojo, O.S.; Ogunjo, S.T. Machine learning models for prediction of rainfall over Nigeria. Sci. Afr. 2022, 16, e01246. [Google Scholar] [CrossRef]
  16. Barrera-Animas, A.Y.; Oyedele, L.O.; Bilal, M.; Akinosho, T.D.; Delgado, J.M.D.; Akanbi, L.A. Rainfall prediction: A comparative analysis of modern machine learning algorithms for time-series forecasting. Mach. Learn. Appl. 2022, 7, 100204. [Google Scholar] [CrossRef]
  17. Frame, J.M.; Kratzert, F.; Klotz, D.; Gauch, M.; Shalev, G.; Gilon, O.; Qualls, L.M.; Gupta, H.V.; Nearing, G.S. Deep learning rainfall–runoff predictions of extreme events. Hydrol. Earth Syst. Sci. 2022, 26, 3377–3392. [Google Scholar] [CrossRef]
  18. Vaswani, A.; Shazeer, N.; Parmar, N.; Uszkoreit, J.; Jones, L.; Gomez, A.N.; Polosukhin, I. Attention is all you need. arXiv 2017, arXiv:1706.03762. [Google Scholar] [CrossRef]
  19. Waqas, M.; Humphries, U.W.; Wangwongchai, A.; Dechpichai, P.; Ahmad, S. Potential of artificial intelligence-based techniques for rainfall forecasting in Thailand: A comprehensive review. Water 2023, 15, 2979. [Google Scholar] [CrossRef]
  20. Shiri, F.M.; Perumal, T.; Mustapha, N.; Mohamed, R. A Comprehensive Overview and Comparative Analysis on Deep Learning Models. J. Artif. Intell. 2024, 6, 301–360. [Google Scholar] [CrossRef]
  21. Sarasa-Cabezuelo, A. Prediction of rainfall in Australia using machine learning. Information 2022, 13, 163. [Google Scholar] [CrossRef]
  22. Shah, N.H.; Priamvada, A.; Shukla, B.P. Validation of satellite-based cloudburst alerts: An assessment of location precision over Uttarakhand, India. J. Earth Syst. Sci. 2023, 132, 161. [Google Scholar] [CrossRef]
  23. Ranalkar, M.R.; Anjan, A.; Mishra, R.P.; Mali, R.R.; Krishnaiah, S. Development of operational near real-time network monitoring and quality control system for implementation at AWS data receiving earth station. Mausam 2015, 66, 93–106. [Google Scholar] [CrossRef]
  24. Poornima, S.; Pushpalatha, M. Prediction of rainfall using intensified LSTM based recurrent neural network with weighted linear units. Atmosphere 2019, 10, 668. [Google Scholar] [CrossRef]
  25. Priatna, M.A.; Esmeralda, C.D. Precipitation prediction using recurrent neural networks and long short-term memory. Telkomnika Telecommun. Comput. Electron. Control 2020, 18, 2525–2532. [Google Scholar] [CrossRef]
  26. Tuysuzoglu, G.; Birant, K.U.; Birant, D. Rainfall prediction using an ensemble machine learning model based on K-stars. Sustainability 2023, 15, 5889. [Google Scholar] [CrossRef]
  27. World Meteorological Organization (WMO). Guide to the WMO Integrated Processing and Prediction System, (WMO-No. 305); WMO: Geneva, Switzerland, 2023; Available online: https://library.wmo.int/records/item/28978-guide-to-the-wmo-integrated-processing-and-prediction-system?offset=9 (accessed on 20 September 2025).
  28. Kumar, G.; Chand, S.; Mali, R.R.; Kundu, S.K.; Baxla, A.K. In-situ observational network for extreme weather events in India. Mausam 2016, 67, 67–76. [Google Scholar] [CrossRef]
  29. World Meteorological Organization (WMO). Guide to Instruments and Methods of Observation, (WMO-No. 8); WMO: Geneva, Switzerland, 2021; Available online: https://library.wmo.int/records/item/41650-guide-to-instruments-and-methods-of-observation?language_id=&offset=1 (accessed on 20 September 2025).
  30. Patro, B.S.; Bartakke, P.P. Quality Control (QC) and Quality Assurance (QA) Procedures for Meteorological Data from Automatic Weather Stations. In Proceedings of the 2025 4th International Conference on Range Technology (ICORT), Chandipur, India, 6–8 March 2025; pp. 1–6. [Google Scholar] [CrossRef]
  31. Dotse, S.Q. Deep learning–based long short-term memory recurrent neural networks for monthly rainfall forecasting in Ghana, West Africa. Theor. Appl. Climatol. 2024, 155, 4. [Google Scholar] [CrossRef]
  32. Kumar, V.; Kedam, N.; Kisi, O.; Alsulamy, S.; Khedher, K.M.; Salem, M.A. A comparative study of machine learning models for daily and weekly rainfall forecasting. Water Resour. Manag. 2025, 39, 271–290. [Google Scholar] [CrossRef]
  33. Sham, F.A.F.; El-Shafie, A.; Jaafar, W.Z.B.W.; Adarsh, S.; Sherif, M.; Ahmed, A.N. Improving rainfall forecasting using deep learning data fusing model approach for observed and climate change data. Sci. Rep. 2025, 15, 27872. [Google Scholar] [CrossRef]
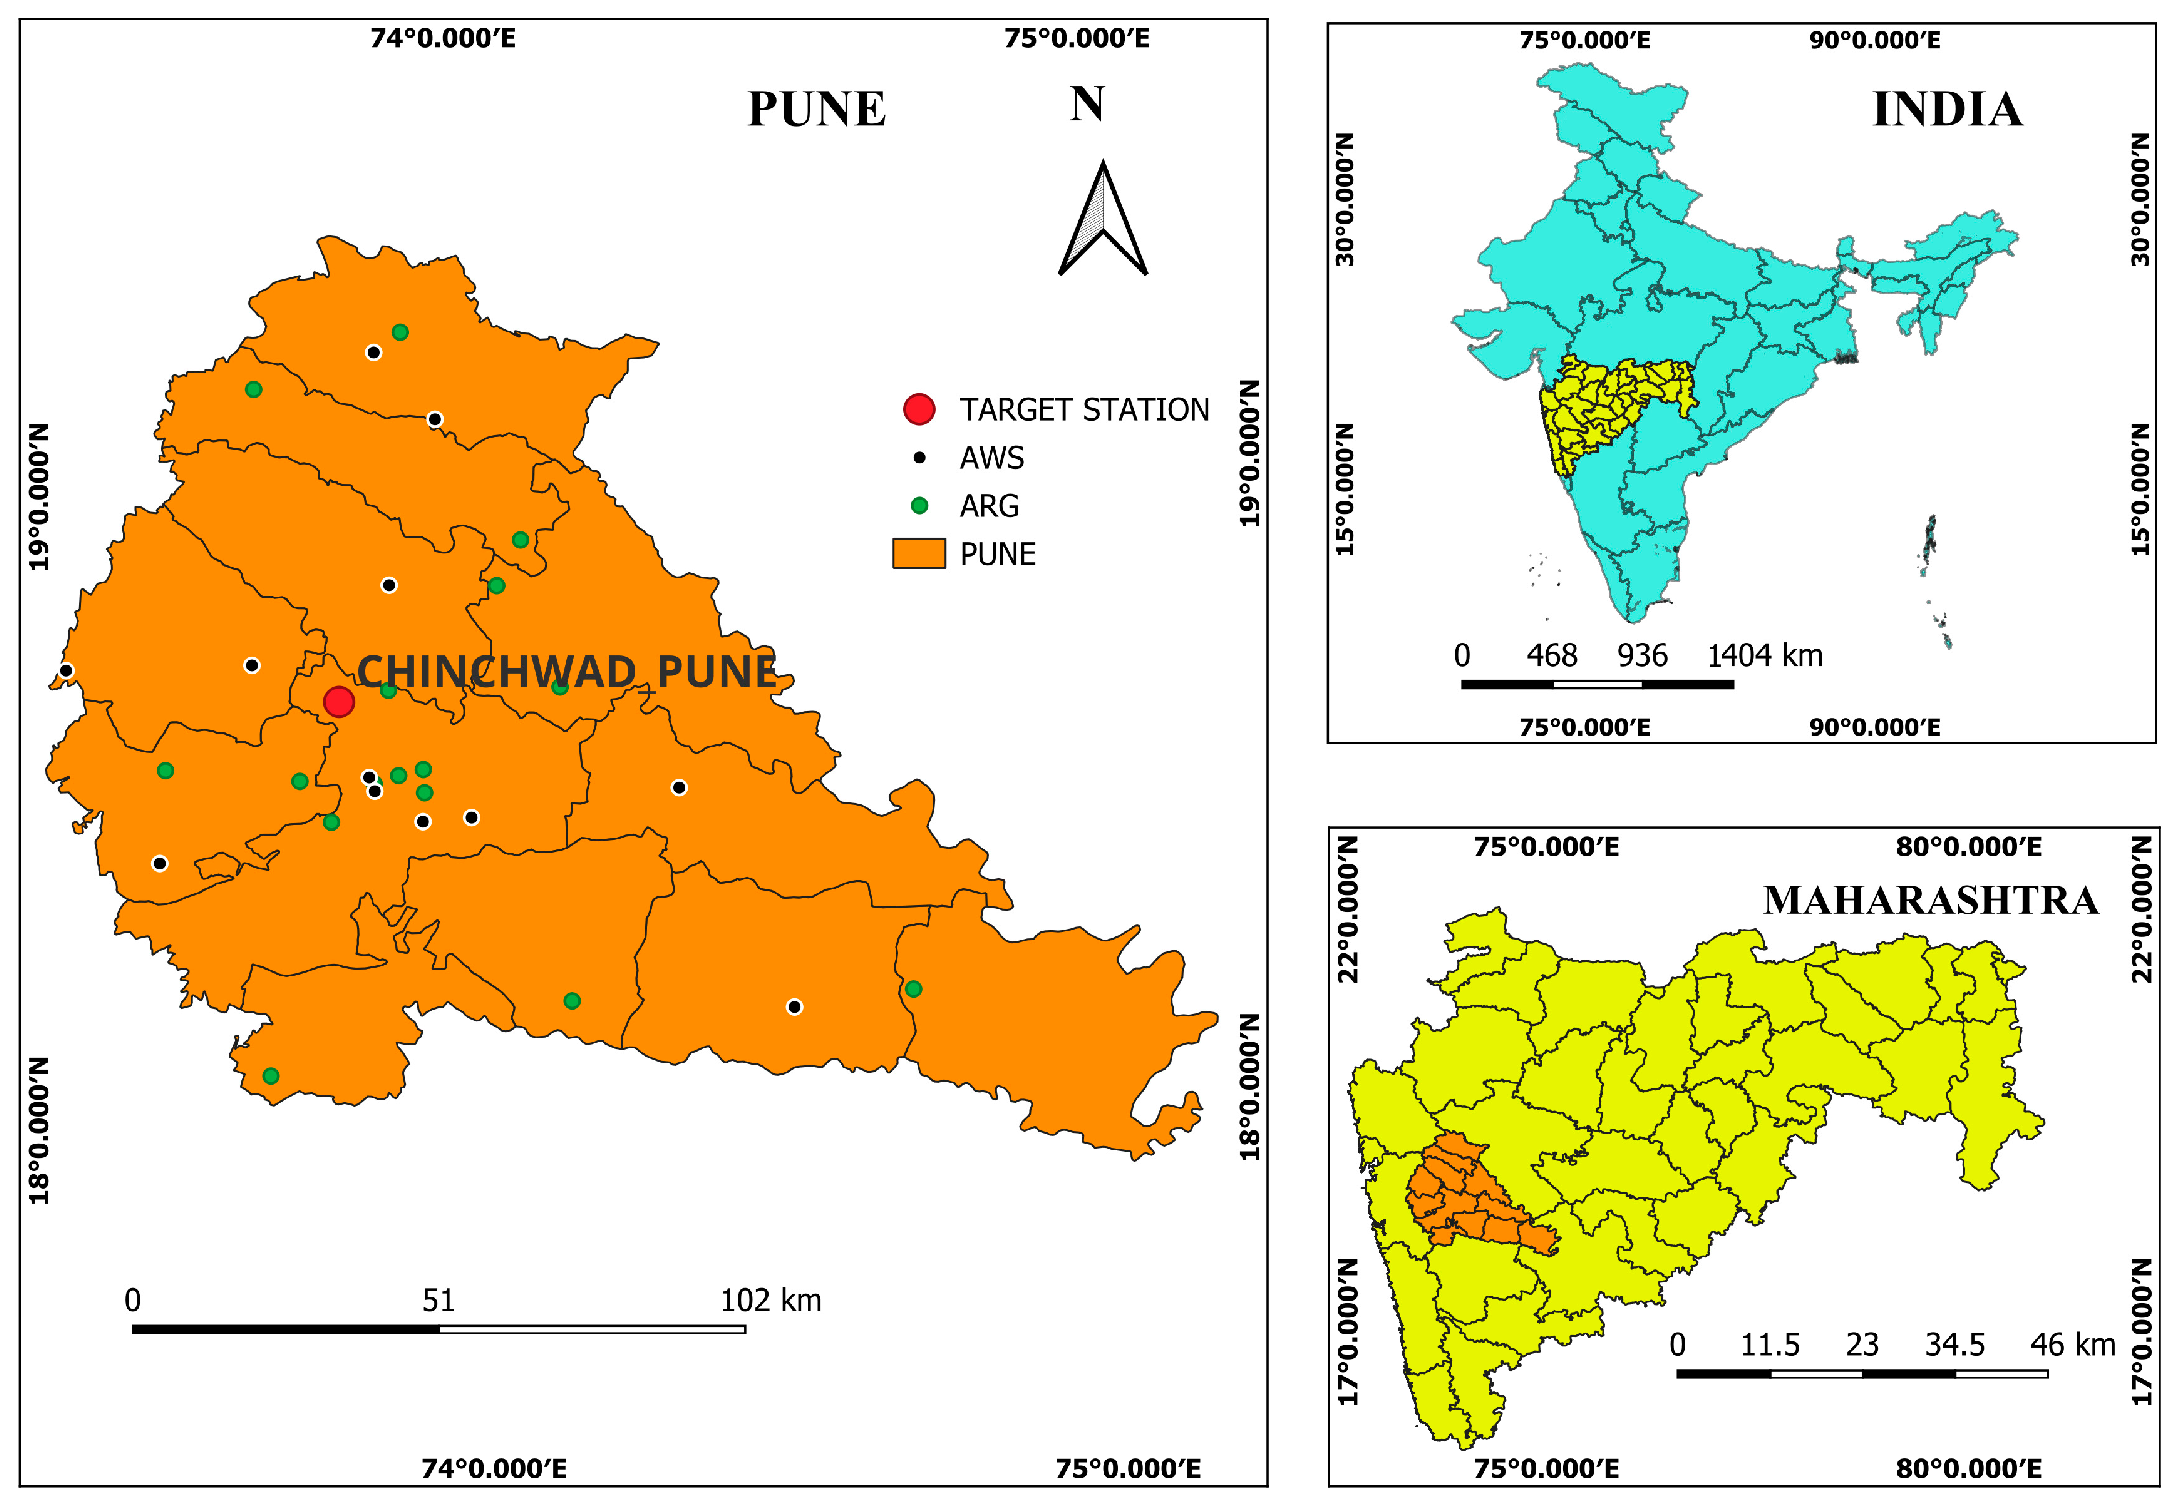
Figure 1. Study area Map of Pune, Maharashtra, India. Disclaimer: This map is for academic purposes. Boundaries shown are indicative and may not be legally authoritative.
Atmosphere 16 01197 g001
Figure 2. The proposed conceptual framework.
Atmosphere 16 01197 g002
Figure 3. AWS/ARG station geometrical arrangements for 12 datasets: (a,b) linear, (c,d) triangular, (e,f) quadrilateral, and (gl) circular Geometry.
Atmosphere 16 01197 g003aAtmosphere 16 01197 g003b
Figure 4. Cloudburst Event Recorded at ARG Chinchwad Station.
Atmosphere 16 01197 g004
Figure 5. Performance Comparison for Deep Learning Models Across Different Geometrical Configurations for Rainfall Prediction: (a) R2 vs. Dataset (b) RMSE vs. dataset.
Atmosphere 16 01197 g005
Figure 6. Model Performance Comparison. Results adapted from Intensified-LSTM [24], RNN [25], and Ensemble [26] models.
Atmosphere 16 01197 g006
Figure 7. Rainfall prediction accuracy (R2 Score) across different lead times.
Atmosphere 16 01197 g007
Figure 8. Actual vs. Predicted Cumulative Rainfall for different Timesteps.
Atmosphere 16 01197 g008
Figure 9. Actual vs. Predicted Rainfall for different Timesteps.
Atmosphere 16 01197 g009
Table 1. Station Metadata for IMD AWS and ARG sites in Pune districts, Maharashtra, India.
Station NameLatitudeLongitudeElevation Type
NIMGIRI19.209273.8725619.0AWS
SHIVAJINAGAR118.538673.8420559.0AWS
LAVASA18.414473.5069687.3AWS
DAPODI18.603273.8541563.2AWS
HADAPSAR18.465973.9244618.7AWS
DAUND18.505674.3304554.0AWS
LONAVALA18.724073.3697620.8AWS
HAVELI18.469774.0013563.0AWS
NARAYANGOAN19.100373.9655694.5AWS
BARAMATI18.153074.5003569.7AWS
PASHAN118.516773.8500577.0AWS
RAJGURUNAGAR18.841073.8840598.1AWS
TALEGAON18.722073.6632635.8AWS
BALLALWADI19.239673.9155719.8ARG
KOREGOANPARK18.540073.8886546.2ARG
CHINCHWAD18.659573.7987588.3ARG
GIRIVAN18.560773.5211750.0ARG
BHOR18.072873.6706773.0ARG
JUNNAR19.207073.8679619.0ARG
KHADAKWADI18.905274.0938585.0ARG
LAVALE18.536373.7325577.0ARG
MAGARPATTA18.511573.9285618.7ARG
AMBEGAON19.157473.6811778.7ARG
PASHAN218.538373.8045586.4ARG
SHIVANE18.470073.7800586.4ARG
INDAPUR18.174874.6890386.2ARG
SHIRUR18.834474.0536667.3ARG
DUDULGAON18.675173.8772574.7ARG
SHIVAJINAGAR218.528673.8493559.0ARG
DHAMDHERE18.671074.1480562.4ARG
KHED18.939073.7744742.7ARG
WADGAONSHERI18.548273.9278618.7ARG
WPURANDAR18.174874.1498585.0ARG
Table 2. Datasets Formed Based on Geometric Topologies of AWS and ARG Station Combinations for Extreme Rainfall Prediction.
DATASETSGEOMETRYAWS/ARGSTATION
1LINEARARGCHINCHWAD
ARGLAVALE
AWSRAJGURUNAGAR
2LINEARARGCHINCHWAD
AWSSHIVAJINAGAR1
AWSPASHAN1
3TRIANGULARARGCHINCHWAD
AWSTALEGAN
ARGLAVALE
ARGDHAMDHERE
4TRIANGULARARGCHINCHWAD
AWSSHIVAJINAGAR1
AWSTALEGAON
AWSRAJGURUNAGAR
5QUADRILATERALARGCHINCHWAD
ARGLAVALE
ARGWADGAONSHERI
AWSTALEGAON
AWSRAJGURUNAGAR
6QUADRILATERALARGCHINCHWAD
AWSTALEGAON
ARGGIRIVAN
AWSPASHAN1
AWSDHAMDHERE
7CIRCULARARGCHINCHWAD
ARGTALEGAON
ARGLAVALE
AWSSHIVAJINAGAR1
8CIRCULARARGCHINCHWAD
AWSTALEGAON
ARGLAVALE
AWSSHIVAJINAGAR1
ARGMAGARPATTA
ARGSHIVANE
AWSRAJGURUNAGAR
9CIRCULARARGCHINCHWAD
AWSTALEGAON
ARGLAVALE
AWSSHIVAJINAGAR1
ARGMAGARPATTA
ARGSHIVANE
AWSRAJGURUNAGAR
ARGGIRIVAN
ARGDHAMDHERE
10CIRCULARARGCHINCHWAD
AWSTALEGAON
ARGLAVALE
11CIRCULARARGCHINCHWAD
AWSTALEGAON
ARGLAVALE
ARGGIRIVAN
ARGSHIVANE
AWSPASHAN1
ARGMAGARPATTA
12CIRCULARARGCHINCHWAD
AWSTALEGAON
ARGLAVALE
ARGGIRIVAN
ARGSHIVANE
ARGMAGARPATTA
AWSRAJGURUNAGAR
AWSPASHAN1
AWSDHAMDHERE
Table 3. Categorization of 24 h rainfall accumulation, including hourly defined Cloudburst and Mini-Cloudburst events [3,4].
Sr. No.TerminologyRainfall Ranges in mmNumber of Events
1Very Light RainfallTrace—2.4256
2Light Rainfall2.5–15.5166
3Moderate Rainfall15.6–64.4147
4Heavy Rainfall64.5–115.511
5Very Heavy Rainfall115.6–204.46
6Extremely Heavy Rainfall≥204.51
7Cloudburst (CB)≥100 mm in one hour1
8Mini-Cloudburst (MCB)≥50 mm in two consecutive hours.7
Table 4. Deep Learning Models, Architectures, and Hyperparameters for Rainfall Prediction.
ModelLayers and UnitsActivation Function
LSTMLSTM (64, 32)(tanh/relu)
STACKED-LSTMLSTM (128, 64, 32)relu
Bi-LSTMBi-LSTM (64, 32)relu
GRUGRU (64, 64, 32)relu
Bi-GRUBi-GRU (64, 64, 32)relu
TRANSFORMERMultiHeadAttention (4 heads), FFN (128)relu (FFN), linear (output)
Table 5. Best-performing model for each topology.
TopologyBest ModelR2RMSE
LinearBi-GRU0.95482.2120
TriangularBi-GRU0.94452.4719
Quadrilateral Bi-GRU 0.9409 2.5305
CircularBi-LSTM0.94972.3337
Disclaimer/Publisher’s Note: The statements, opinions and data contained in all publications are solely those of the individual author(s) and contributor(s) and not of MDPI and/or the editor(s). MDPI and/or the editor(s) disclaim responsibility for any injury to people or property resulting from any ideas, methods, instructions or products referred to in the content.