Abstract
Oil depots are continuous sources of volatile organic compounds (VOCs), which contribute to ground-level ozone (O3) and secondary organic aerosol formation, posing threats to air quality and public health. This study investigated typical crude and refined oil depots in the Xigu District of Lanzhou by measuring VOC source profiles and establishing an emission inventory. The maximum incremental reactivity (MIR) method was applied to assess the chemical reactivity of VOCs; both the emission inventory and VOC profiles were incorporated into the WRF-CMAQ model for numerical simulations. Results showed that the average ambient VOC concentrations were 49.8 μg/m3 for the crude oil depot and 66.1 μg/m3 for the refined oil depot. The crude oil depot was dominated by alkanes (37.1%), aromatics (25.1%), and OVOCs (22.5%), while the refined oil depot was dominated by alkanes (57.3%) and OVOCs (16.7%), with isopentane identified as the most abundant species in both depots. The ozone formation potentials (OFPs) of the crude oil and refined oil depots were 153.1 μg/m3 and 178.3 μg/m3, respectively. Aromatics (47.0%) and OVOCs (29.0%) were the primary contributors at the crude oil depot, with isopentane, o-xylene, etc., as the dominant reactive species. In the refined oil depot, the main contributors were alkanes (27.8%), alkenes and alkynes (26.6%), OVOCs (24.5%), and aromatics (20.5%), among which isopentane, trans-2-butene, etc., were most prominent. In 2023, VOC emissions from the crude oil and refined oil depots were estimated at 1605.3 t and 1287.8 t, respectively, mainly from working loss (96.6%) in the crude oil depot and deck fitting loss (60.7%) and working loss (31.3%) in the refined oil depot. Numerical simulations indicated that oil depot emissions could increase regional MDA8 O3 concentrations by up to 40.0 μg/m3. At the nearby Lanlian Hotel site, emissions contributed 15.1% of the MDA8 O3, equivalent to a 6.1 μg/m3 increase, while the citywide average was 1.7 μg/m3. This study enriches the VOC source profile database for oil depots, reveals their significant role in regional O3 formation, and provides a scientific basis for precise O3 control and differentiated emission reduction strategies in Northwest China.
1. Introduction
Tropospheric ozone (O3) is a greenhouse gas with strong oxidizing properties that regulates atmospheric oxidation capacity and contributes to climate warming. Elevated O3 concentrations pose risks to human health and crop productivity [1,2,3]. Ground-level O3 pollution remains a pressing environmental challenge worldwide, particularly in industrialized regions. In East Asia, O3 concentrations have shown a clear upward trend in recent decades [4]. In China, for instance, the summer trend in maximum daily 8 h average (MDA8) O3 increased by 1.9 ppb per year from 2013 to 2019 [5], contributing to increasingly severe pollution episodes in major urban agglomerations such as the Yangtze River Delta, the Pearl River Delta, and the Fenwei Plain [6,7], while industrial cities in Northwest China, including Lanzhou and Yinchuan, are also experiencing increasingly severe O3 episodes [8,9]. In contrast, North America and Europe have seen a general decline in surface O3 from 2000 to 2018, particularly in summer, along with a seasonal shift of O3 peaks from summer to spring, driven by NOx; controls and background O3 changes [10]. However, more recent data indicate the United States summer O3 concentrations have plateaued during 2013–2023, with little improvement over the past decade [11].
Volatile organic compounds (VOCs) are key precursors of O3 formation. In the presence of nitrogen oxides (NOx), VOCs undergo a series of photochemical reactions, producing peroxy radicals and driving O3 accumulation [12]. Rising temperatures significantly enhance the photochemical reactivity of VOCs, thereby accelerating O3 production [13]. Moreover, O3 formation exhibits a complex nonlinear relationship with its precursors, where the O3 production regime may be VOC-limited, NOx-limited, or within a transitional zone, depending on the ratio of NOx to VOC concentrations [14]. Source-specific VOC emissions vary greatly in composition, reactivity, and ozone formation potential (OFP), thereby influencing both the efficiency of O3 production and the characteristics of regional pollution [15,16]. Among various emission sources, petroleum storage and transportation, particularly oil depots, are recognized as significant yet often overlooked contributors due to their large storage capacity, frequent loading/unloading operations, and substantial breathing losses [17]. Oil depots emit large amounts of alkanes, aromatics, and oxygenated VOCs, including highly reactive species that play critical roles in O3 formation [18,19,20]. These emissions not only deteriorate local air quality but may also elevate O3 levels through the regional transport of photochemically produced ozone over distances of tens to hundreds of kilometers, complicating pollution control efforts [21].
International studies on oil depot VOC emissions have mainly focused on emission factor measurement, compositional characterization, and evaluation of control technologies. Research in the United States, Europe, and Japan has highlighted tank sealing, loading/unloading practices, and temperature fluctuations as key factors influencing emission intensity [22,23,24]. Modeling studies have further demonstrated that incorporating localized source emission profiles can significantly improve the accuracy of O3 simulations, especially during high-concentration episodes [25]. However, in Northwest China (particularly in valley-type industrial cities with complex terrain and unique meteorological conditions), studies on oil depot VOC emission characteristics and their contributions to O3 formation remain scarce. Current control strategies often rely on generic source profile databases, lacking localized field observations.
As a typical industrial city in Northwest China, Lanzhou is located in a narrow valley along the upper reaches of the Yellow River. Due to the constrained valley terrain and stable stratification, pollutants tend to accumulate, and dispersion is limited, leading to complex O3 formation mechanism. Monitoring data from the local environmental authority indicate that O3 has become one of the dominant summer pollutants in recent years, with 25 days recorded in 2024 when it ranked as the primary pollutant (https://sthjj.lanzhou.gov.cn/, accessed on 2 July 2025).
Previous studies have shown that VOCs in Lanzhou originate from multiple sources, including industrial activities, solvent use, vehicle exhaust, and fuel combustion [26,27]; among them, highly reactive species such as propylene, toluene, ethylbenzene, and n-pentane contribute significantly to O3 formation in industrial zones [28]. Simulations using the WRF-CHEM model further revealed that the urban core of Lanzhou is VOC-limited, while the western petrochemical zone is NOx-limited. Coordinated VOC and NOx emissions reductions were found to effectively suppress peak daytime O3 levels. Sensitivity analyses also indicated that the city’s unique valley topography reduces surface ozone concentrations during the day but increases nighttime levels, thereby reshaping the spatiotemporal patterns of photochemical reactions and pollutant transport [29,30]. Additional modeling results confirmed that emissions of NOx, VOCs, and particulate matter led to an increase of approximately 0.98 ppb in O3 concentrations between 2013 and 2021, driven by chemical interactions and vertical mixing processes [31].
As atmospheric oxidation capacity intensifies, the co-occurrence of O3 and PM2.5 pollution becomes more pronounced, with oxygenated VOCs (OVOCs) and secondary aerosol precursors playing critical roles in regional air quality degradation [32]. Nevertheless, substantial discrepancies remain between modeled and observed concentrations of VOCs and O3 in Lanzhou, indicating the need for refined emission inventories and updated chemical mechanisms [33]. For a large industrial city such as Lanzhou, a detailed characterization of oil depot VOC source profiles, their chemical reactivity, and their contributions to O3 is crucial for improving the accuracy of regional O3 simulations and for optimizing pollution control strategies.
Against this backdrop, this study focuses on typical crude oil and refined oil depots in Lanzhou’s Xigu District. High-resolution VOC source profiles were obtained through field observations, combined with an emission inventory and the maximum incremental reactivity (MIR) method to quantify chemical reactivity [34]. These observed source profiles were converted into CB06 mechanism species and incorporated into the WRF-CMAQ model to simulate O3 formation and quantitatively assess the impacts of oil depot emissions on O3 concentrations [35]. In this study, we aim to establish a localized VOC source profile database for oil depots in Northwest China, identify key reactive species and quantify their contributions to O3 formation from oil depot emissions, and provide a scientific basis for developing differentiated and refined O3 pollution control strategies for Lanzhou and other similar regions.
2. Materials and Methods
2.1. Sampling and Analysis
2.1.1. Site Description
Lanzhou is located in the semi-arid climate zone of China [36]. The oil depot complex in the Xigu District, comprising a crude oil depot and a refined oil depot, functions as a major petroleum hub, with storage capacities of 2.30 × 10⁶ m3 and 0.36 × 10⁶ m3 and annual throughputs of 31.21 × 10⁷ m3 and 11.46 × 10⁷ m3 in 2023, respectively (Figure 1). Situated within the urban built-up area, the depot is surrounded primarily by residential neighborhoods and building-material markets. Operational processes include crude oil storage, cyclic heating, tank switching, and external transfer. According to the Technical Specification for Application and Issuance of Pollutant Permit Bulk Oil Terminal and Filling Station (HJ 1118-2020) [37], VOC emissions from oil depots primarily originate from working losses and standing losses, with emission intensity closely related to throughput, floating-roof design, and tank fittings.
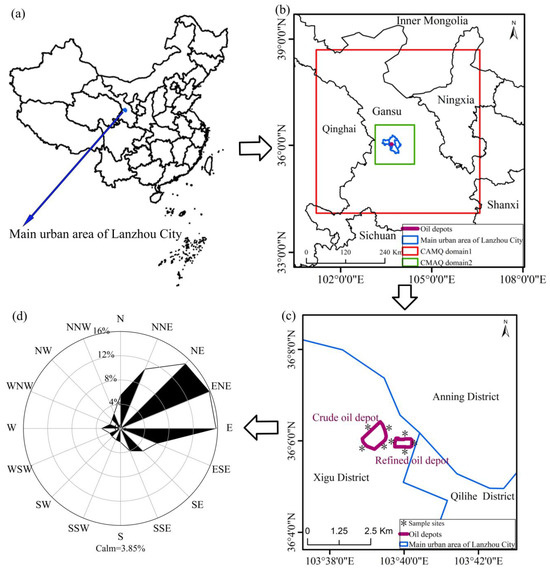
Figure 1.
Geographical scope of sampling sites and CMAQ simulation domains. (a) Lanzhou City’s location in China. (b) CMAQ domains over Northwest China with marked oil depots and Lanzhou urban area. (c) Sampling sites of crude and refined oil depots in Xigu District. (d) Wind frequency in Lanzhou from 2004 to 2023.
The crude oil depot employs external floating-roof tanks with double-deck full-contact floating roofs and secondary mechanical seals, while the refined oil depot adopts internal floating-roof tanks with double-deck or pontoon-type roofs and bladder seals. Substantial fugitive VOC emissions occur during routine operations, and tank design differences significantly affect VOC profiles. The crude oil depot uses double-deck full-contact floating roofs, which eliminate vapor space due to welded decks, resulting in zero deck seam losses. In contrast, pontoon-type roofs in the refined oil depot retain vapor space, leading to notable deck seam losses. Additionally, secondary mechanical seals used in the crude oil depot have lower rim seal loss factors than bladder seals in the refined oil depot, which provide only single-stage sealing. These structural differences lead to varying emission patterns, further details can be found in Section 2.3.
2.1.2. Sampling Procedures and Timeline
The Emission Standard of Air Pollutant for Bulk Petroleum Terminals (GB 20950-2020) specifies explicit requirements for boundary emission monitoring [38]. Previous studies have shown that fugitive VOC emissions are commonly monitored at facility boundaries or outside workshops to evaluate emission characteristics, OFP, and health risks, highlighting the critical role of boundary monitoring in industrial emission control [39,40,41]. Following both HJ 732-2014 (Emission from Stationary Sources-Sampling of Volatile Organic Compounds-Bag Method) and GB 20950-2020 [42], and considering the specific conditions of the study area, four sampling sites were established along the boundaries of both the crude oil and refined oil depots at a height of approximately 1 m. The sampling bags used in this study were made of polytetrafluoroethylene (PTFE, 1.5 L) with low adsorption and permeability. The sampling system consisted of a transparent vacuum box (5 L), pump, flow meter, connecting tubes, sampling tube, and valves. Before sampling, the bags were cleaned three times with the vacuum sampler and evacuated. During collection, inflow was controlled at a constant rate via the flow meter.
To avoid daytime photochemical degradation of reactive VOCs [43], all sampling was performed at night. This approach minimizes the degradation of reactive species and enhances the accuracy of VOC profiles. As daytime measurements largely reflect residual VOCs after photochemical reactions, nighttime sampling reduces survivor bias and more accurately captures key precursors driving ozone formation. Sampling at the crude oil depot was conducted from 22:05 to 22:45 on 8 August 2024, and at the refined oil depot from 23:50 on 8 August to 00:30 on 9 August. Each site was sampled for 40 min, meeting the ≥30 min requirement in HJ 1010-2018 (the Specifications and Test Procedures for Ambient Air Quality Continuous Monitoring System with Gas Chromatography for Volatile Organic Compounds) [44]. Sampling took place under stable meteorological conditions, with confirmed regular operations. This timing avoided upcoming maintenance involving solvents, ensuring representativeness. All samples were stored in a light-protected box and transported to the laboratory. All procedures followed HJ 732-2014. During the sampling period, meteorological conditions were relatively stable, with an average temperature of 21 °C, relative humidity of 70%, prevailing easterly winds, and a mean wind speed of 2 m/s. The small diurnal temperature variation and limited atmospheric dispersion or transport suggest that the sampling results are highly representative.
2.1.3. Analytical Methods
Samples from the crude oil and refined oil depots were analyzed on 9 August 2024 between 05:00 and 13:00 at hourly intervals using a thermal desorption preconcentrator (TT24-7-xr, Markes, Llantrisant, UK) coupled with a gas chromatograph-mass spectrometer/flame ionization detector (GC-MS/FID, 8890-5977B, Agilent, Santa Clara, CA, USA). The system detected a total of 116 VOC species, including 29 alkanes, 11 alkenes, 1 alkyne, 21 oxygenated VOCs, 18 aromatics, and 35 halocarbons. Detailed species information is provided in Table S1. The FID analyzed C2-C3 hydrocarbons, while the MS was used for other compounds. Operating conditions of the TT and GC-MS are summarized in Tables S2 and S3, respectively. All observed mixing ratios (ppb) were converted to mass concentrations (μg/m3) using Equation (1).
where M is molecular weights of VOCs; Vm is the molar volume of the gas, 22.4 L/mol was selected for this study.
Statistical analysis of the sampling results was performed using descriptive statistics (mean and standard deviation), along with inferential methods including independent-sample t-tests and one-way analysis of variance (ANOVA), to assess both inter-group differences and spatial variability.
2.1.4. Quality Assurance and Control
Instrument calibration and quality assurance strictly followed HJ 1010-2018, with over 90% of compounds having detection limits ≤ 0.1 nmol/mol. Standard gases were supplied by certified providers. The internal standard was a mixed gas (10 × 10−6, v/v) containing bromochloromethane, 1,4-difluorobenzene, chlorobenzene-D5, and 4-bromofluorobenzene, while external standards gases were prepared by diluting PAMS, TO-15, and OVOCs gases to 20 × 10−6 (v/v) using an SD6000 diluter. Recalibration was performed when measured concentrations deviated by ± 30% from expected values. Under stable operation, standard gases (0.5–10 nmol/mol) were analyzed sequentially. Calibration employed the internal standard method, with analyte/internal standard concentration ratios as the x-axis and response ratios as the y-axis, regression lines were forced through the origin, with R2 ≥ 0.98 as required by HJ 1010-2018.
2.2. Evaluation of VOC Chemical Reactivity
VOCs are chemically diverse and often undergo multi-step atmospheric reactions, sometimes forming chain reactions that generate additional radicals and drive further processes. Their role in atmospheric chemistry is closely linked to both ambient concentrations and chemical reactivity [45]. The OFP is an indicator of the potential of a unit mass of VOCs to generate O3 through photochemical reactions, while the MIR reflects both mechanistic and kinetic reactivity. In this study, MIR coefficients proposed by Carter were applied to assess the O3 formation potential of oil depot VOCs based on their measured concentrations and compositional profiles. The calculation is presented in Equation (2).
where OFP represents the maximum ozone formation potential (μg/m3), VOCi is the observed concentration of species i (μg/m3), and MIRi denotes the maximum incremental reactivity coefficient of species i (μg/μg), with values taken from Carter’s MIR database [46].
2.3. Construction of VOC Emission Inventory for Oil Depots
Based on a detailed investigation, it was determined all tanks at both the crude and refined oil depots are external floating-roof types. This study estimates VOC emissions using the methods specified in HJ 118 and Chapter 7.1 of the U.S. EPA’s AP-42 “Liquid Storage Tanks”, as described in Supplementary Material (Text S1). The AP-42 methodology has also been widely utilized in domestic research for estimating VOC emissions from oil depots [47]. Notably, the Guidelines for the Investigation of VOC Pollution Sources in the Petrochemical Industry, issued by the Ministry of Ecology and Environment of China, also references the AP-42 methodology for calculating VOC emissions from storage tanks. In accordance with this approach, routine emissions from floating-roof tanks were considered as the sum of standing and working losses. Standing losses include rim seal, deck fitting, and deck seam losses, while working loss, also known as withdrawal loss, results from vapor displacement caused by liquid level changes against the tank wall during filling or withdrawal. Using this method, 2023 emission inventories were compiled for both depots, incorporating activity data such as daily throughput, floating-roof type, and fitting configuration.
2.4. O3 Numerical Simulation
2.4.1. Model Parameterization
This study employed the Weather Research and Forecasting model (WRF v4.2) and the Community Multiscale Air Quality model (CMAQ v5.3) to simulate meteorological fields and ambient air quality in Lanzhou [48,49], as illustrated in Figure 1b. The initial and boundary conditions for WRF were obtained from the Final Operational Global Analysis (FNL) reanalysis dataset (1° × 1°, 6 h interval) from the National Centers for Environmental Prediction (NCEP). Oil depots VOC speciation followed the CB06 mechanism using the Speciation Tool based on the U.S. EPA SPECIATE database, which provides a comprehensive repository of source-specific chemical composition profiles for gas-phase and particulate emissions [50].
Anthropogenic emissions combined the 2020 Multi-resolution Emission Inventory for China (MEIC) with the oil depot-specific VOC inventory developed in this study. Emissions were processed via the Sparse Matrix Operator Kernel Emissions (SMOKE v4.7) for temporal allocation and chemical speciation. Spatial allocation was performed in ArcGIS using road networks, land use, GDP, and population data. Temporal profiles followed the Technical Guidelines for Urban Emission Inventories by the Chinese Society of Environmental Sciences. Biogenic emissions were estimated using MEGAN v3.1 [51].
The simulation period, 26 July–31 August, coincided with the VOC sampling campaign and represented typical summer ozone conditions. One-month warm-season simulations are widely used in regional photochemical modeling to capture representative meteorological and chemical patterns [52,53]. The Integrated Source Apportionment Method (ISAM) module in CMAQ was applied to quantify the contributions of VOC emissions from oil depots to ambient O3 levels [54]. Detailed model configurations are provided in Table 1.

Table 1.
Model configurations.
2.4.2. Scenario Design
To assess the impact of oil depot emissions, two ozone simulation scenarios were established. The baseline scenario included anthropogenic emissions from MEIC with default VOC speciation. The comparison scenario additionally incorporated VOC emissions from crude and refined oil depots using source profiles derived in this study, while other sources followed MEIC defaults. Biogenic VOCs were simulated using MEGAN v3.1. Key differences are summarized in Table 2.
Table 2.
Description of O3 simulation scenarios and VOC configuration.
2.4.3. Model Evaluation Methods
Model performance was evaluated by comparing simulated and observed data using statistical metrics: correlation coefficient (R), normalized mean bias (NMB), root mean square error (RMSE), and index of agreement (IOA) [55]. Meteorological data were obtained from the China Meteorological Administration (https://www.cma.gov.cn/, accessed on 5 May 2025), and air quality data from the China Air Quality Online Database (https://quotsoft.net/air, accessed on 3 June 2025). Formulas for the evaluation metrics are provided in Equations (3)–(6).
where Si and Oi denote the simulated and observed values, respectively; and represent their averages; and m is the number of paired samples.
3. Results and Discussion
3.1. Emission Characteristics of VOCs in Oil Depots
3.1.1. Concentration Level of VOCs
Figure 2 illustrates the VOC concentration distributions at the boundary monitoring sites of the crude and refined oil depots. At the crude oil depot, VOC concentrations ranged from 41.7 to 56.9 μg/m3, with the highest level on the southern boundary and the lowest on the northern boundary, yielding a mean of 49.8 μg/m3 and relatively low variability (standard deviation = 8.5 μg/m3). In contrast, VOC concentrations at the refined oil depot were higher overall, ranging from 56.0 to 82.5 μg/m3, with the highest value on the western boundary and the lowest on the eastern boundary. The mean concentration was 66.1 μg/m3 with greater variability (SD = 11.5 μg/m3). A two-sample t-test (n = 4 per depot) confirmed that VOC levels at the refined oil depot were significantly higher than those at the crude oil depot (p < 0.01). One-way ANOVA showed significant directional differences at the refined oil depot (p = 0.04) but not at the crude oil depot (p = 0.11), suggesting that VOC dispersion at the refined facility is more sensitive to wind direction and fuel volatility. These results align with the observed higher concentrations on the western and southern boundaries, consistent with prevailing easterly winds and the storage of more volatile fuels.
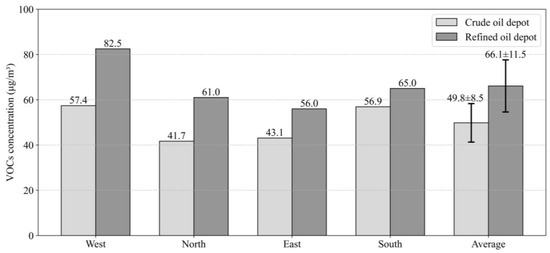
Figure 2.
VOCs concentrations at monitoring points for oil and refined depots.
Both depots exhibited higher VOC concentrations along their western and southern boundaries, supporting the role of wind-driven transport. Overall, the refined oil depot showed higher average concentrations than the crude oil depot, reflecting the storage of more volatile fuels such as gasoline and diesel. The observed concentration levels were comparable to concentrations observed at the downwind site of a chemical industrial park in Kunming (48.0 ± 46.6 μg/m3) and at the boundary of a chemical complex containing oil storage tanks (59.0 ± 40.0 μg/m3) [56,57], but were substantially lower than those measured at the boundary of a northern China refinery (378.0 ± 363.0 μg/m3) [58]. These differences mainly reflect variations in industrial source types and scales. The referenced refinery processes 8 million tons of crude oil annually and includes multiple production units, resulting in higher and more complex VOC emissions. In contrast, the oil depots investigated in this study are dedicated solely to storage, with simpler operations and fewer emission sources.
3.1.2. Compositional Characteristics of VOC Species
The compositional characteristics of VOCs are presented in Figure 3. In the crude oil depot, alkanes dominated (37.1%), followed by aromatics (25.1%), OVOCs (22.5%), halocarbons (12.2%), and alkenes/alkynes (3.1%). In contrast, the refined oil depot was primarily composed of alkanes (57.3%), with lower proportions of OVOCs (16.7%), aromatics (10.4%), halocarbons (8.6%), and alkenes/alkynes (6.9%).
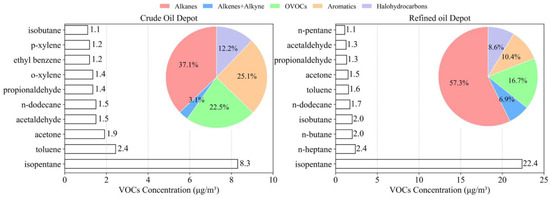
Figure 3.
VOC composition and top 10 species at crude and refined oil depots.
Compared with previous studies, the alkane fraction in the crude oil depot was markedly lower than that reported for crude oil storage tanks in Hebei (49.9–84.6%), the urban area of Dongying (70.9%), a petroleum extraction and processing city, and the Zhoushan crude oil storage area (75.6%) [59,60,61]. This discrepancy may be related to differences in crude oil sources and monitoring locations: the crude oil in this study originated mainly from Northwest China, with relatively higher proportions of aromatics and OVOCs, whereas the Dongying measurements were taken within the urban area and thus subject to mixed-source influences. For the refined oil depot, the alkane proportion falls between those reported for diesel (51.9%) and gasoline (92.5%) from Zhoushan gas stations [61]. These results are also consistent with the national VOC profile range (36.5–69.3%), particularly for sources in Northwest China, as reported by Wang et al. (2022) [62].
This suggests that while the overall alkane content in both depots aligns with the broader characteristics of petroleum-related sources, notable depot-specific differences remain. Notably, Wu et al. (2019) found that alkanes comprised over 60% of total VOCs in many industrial and urban sites in Lanzhou, highlighting their widespread dominance in petrochemical-related emissions in Northwest China [28]. The relatively lower alkane and higher OVOC and aromatic fractions observed in the crude oil depot of this study may reflect differences in crude oil origins (primarily sourced from Northwest China), storage conditions, and emission environments, as opposed to the urban-affected sites like Dongying. Additionally, discrepancies across studies may also result from variations in sampling methodologies (e.g., fence-line sampling in this study vs. nozzle sampling in Zhoushan), fuel additive usage, and the degree of gasoline–diesel mixing.
A total of 116 VOC species were identified in this study (detailed in Table S1). The top ten species contributed 21.8 μg/m3 (43.8%) in the crude oil depot and 37.2 μg/m3 (56.2%) in the refined oil depot, indicating higher emission intensity associated with refining processes. In the crude oil depot, isopentane (16.6%) was the dominant compound, followed by toluene and several oxygenated species, with further contributions from aromatics and long-chain alkanes. In contrast, the refined oil depot showed a substantially higher proportion of isopentane (33.8%), with strong enrichment of short- and medium-chain alkanes, while the relative contributions of aromatics and OVOCs were lower.
Comparisons revealed that isopentane was the most abundant species in both depots, with its fraction in this study (16.6% in the crude oil depot and 33.8% in the refined oil depot) significantly higher than values reported for the Zhoushan crude oil storage facility (3.10%), and the refined oil depot values falling between those reported for diesel (14.36%) and gasoline (68.67%) at Zhoushan gas stations. Similar dominance of isopentane and C2–C5 alkanes has been reported in both Lanzhou and Zhoushan [28,61]. In Lanzhou, Wu et al. (2019) found isopentane consistently among the top VOC species across industrial and urban sites [28]. Moreover, Liang et al. (2023) estimated that 60% of isopentane emissions in oil-related facilities originated from gasoline storage and transport, underscoring the importance of liquid fuel supply chains in shaping source profiles [63]. These compositional distinctions may reflect not only fuel type differences but also regional variation in crude oil sources, storage conditions, and emission controls. Additionally, discrepancies could stem from differences in sampling methods, fuel additive usage, and the degree of gasoline–diesel mixing, as noted in prior VOC source profile reviews [64].
3.1.3. VOC Emission Inventory and Model-Ready Speciation Profiles
Based on the VOC emission inventory constructed in Section 2.3 (following HJ 1118-2020 and the U.S. EPA’s AP-42 guidelines for liquid storage tanks), the estimated annual emissions were 1605.3 t/a for the crude oil depot and 1287.8 t/a for the refined oil depot (Figure 4), reflecting typical large-scale VOC release intensities in storage facilities. The crude oil depot, equipped with external floating-roof tanks with secondary mechanical seals, released VOCs predominantly from working losses (96.6%), with rim-seal losses effectively eliminated by the use of double-deck full-contact floating roofs. In contrast, the refined oil depot, using internal floating-roof tanks with bladder seals (mostly single-deck pontoon type), exhibited emissions dominated by rim-seal losses (60.7%) and working losses (31.3%).
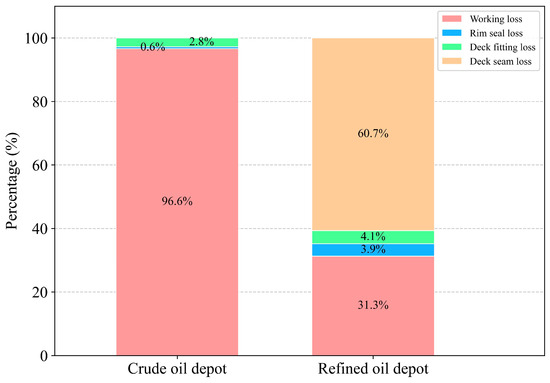
Figure 4.
Type and proportion of VOCs emission at crude and refined oil depots.
Compared with reported results for internal floating-roof tanks at a Beijing oil depot, the refined oil depot in this study showed a higher rim-seal loss proportion (60.7% vs. 53.8%), a similar working loss proportion (31.3% vs. 29.6%), and a markedly lower fitting loss proportion (8.0% vs. 13.4%) [65]. These differences are likely attributable to tank design features (e.g., single-deck pontoon type), highlighting the significant influence of tank structure on VOC emission characteristics. Notably, the full-contact floating-roof design adopted at the crude oil depot proved highly effective in eliminating rim-seal losses. These findings provide valuable implications for developing differentiated VOC control strategies tailored to various types of floating-roof tanks.
Uncertainties in the emission inventory primarily originate from activity data acquisition and emission factor selection [66]. In this study, emission factors and parameters were primarily derived from U.S. EPA’s AP-42, which may inevitably introduce biases in VOC emission estimates. To further reduce VOC emissions, we recommend that refined oil depots consider upgrading single-deck pontoon-type internal floating roofs to full-contact designs to minimize vapor space and associated losses. Additionally, both crude and refined oil depots should reinforce seal integrity to curb rim losses. Operationally, synchronizing oil receiving and dispatching processes is also advisable to shorten the residence time of residual liquid films, thereby mitigating working losses.
Based on the observed VOC concentrations from the crude oil and refined oil de-pots, source profiles were processed with the Speciation Tool to construct profiles compatible with the CB06 chemical mechanism in the CMAQ model. These were systematically compared with VOC speciation profiles of industrial sources in the MEIC inventory (Table 3). The MEIC industrial source profile was dominated by benzene (BENZ, 33.6%) and acetone (ACET, 32.7%), reflecting the characteristics of process-related aromatic and oxygenated VOC emissions. In contrast, the crude oil and refined oil depot profiles were characterized by PAR (39.6%/60.7%), XYLMN (13.5%/4.8%), and UNR (11.6%/8.3%), indicative of petroleum volatilization. The proportions of higher aldehydes (ALDX), alkenes (IOLE/OLE), and intermediate-volatility organic compounds (IVOCs, 3.8–3.9%) were significantly higher in oil depot profiles than in the MEIC industrial source profile, suggesting that fuel oxidation processes may play an important role and that oil depots may represent a potentially important source of IVOCs.
Table 3.
Species allocation of VOCs under CB06 for MEIC industry and oil depot sources.
In addition, propane (PRPA) was much lower in oil depots than in industrial sources, whereas ethane (ETHA) was higher. The comparison revealed substantial compositional differences. This contrast may be related to differences in energy structures and industrial processes: as the world’s largest consumer of liquefied petroleum gas (LPG), China’s industrial sources (e.g., refining, petrochemicals, and LPG processing) likely involve substantial propane use and byproduct emissions, whereas oil depots, dominated by lighter crude oil fractions, tend to emit higher levels of ethane. These discrepancies have important implications for O3 precursor attribution and atmospheric chemical mechanism representation in the CMAQ model. These efforts jointly strengthen the accuracy of VOC source representation in chemical transport models and provide a solid foundation for simulating ozone formation from oil depot emissions with greater fidelity.
3.2. O3 Formation Potential of VOCs
To identify the key reactive VOC species contributing to O3 formation, the OFP of crude oil and refined oil depots was calculated (Figure 5). The results showed distinct differences, with total OFP values of 153.1 μg/m3 for the crude oil depot and 178.3 μg/m3 for the refined oil depot (with detailed OFP values provided in Table S1). For the crude oil depot, the contributions ranked as aromatics (47.0%) > OVOCs (29.0%) > alkanes (14.1%) > alkenes/alkynes (9.3%) > halocarbons (0.6%), indicating substantial variability among groups. In contrast, the refined oil depot showed a more even distribution, with alkanes (27.8%), alkenes/alkynes (26.6%), OVOCs (24.5%), and aromatics (20.5%) contributing comparably, while halocarbons remained negligible (0.6%).
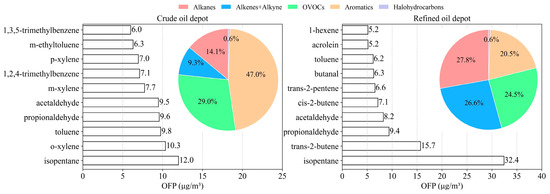
Figure 5.
OFP composition and top 10 OFP species at crude and refined oil depots.
Notably, a comparison between group concentration shares (Figure 3) and OFP contributions revealed no direct correspondence, suggesting that VOC abundance is not linearly proportional to its ozone formation contribution. This discrepancy arises from differences in MIR coefficients among VOC species, underscoring the complex nonlinear relationship between O3 formation and its precursors. Building upon this, our results further indicate that aromatics, alkenes, and OVOCs were the dominant contributors to ozone formation potential (OFP) in both oil depots, a pattern broadly consistent with prior studies. For example, Sun et al. (2023) reported that alkenes/alkynes and aromatics dominated OFP in the petroleum refining industry in Guangdong, despite alkanes being the most abundant by mass [67]. Similarly, in Chongqing high-tech industrial zone, Luo et al. (2023) identified alkenes as the most reactive O3 precursors, followed by aromatics and alkanes, further illustrating the mismatch between species abundance and reactivity [68].
The top ten VOC species contributing to the ozone formation potential (OFP) in crude and refined oil depots (Figure 5) showed distinct profiles. In the crude oil depot, OFP was mainly driven by aromatics-o-xylene (6.7%), toluene (6.3%), m-xylene (5.0%)-and oxygenated VOCs, including propionaldehyde (6.2%) and acetaldehyde (6.2%), along with isopentane (7.8%) from the alkane group. These ten species together accounted for 55.4% of the total OFP, reflecting the chemical complexity and distributed emission characteristics of crude oil VOCs. By contrast, the refined oil depot displayed a markedly different pattern. Its top ten contributors were dominated by highly reactive alkenes, such as trans-2-butene (8.8%) and cis-2-butene (4.0%), and alkanes, particularly isopentane (18.2%), alongside OVOCs like propionaldehyde (5.3%) and acetaldehyde (4.6%). Together, these species accounted for 59.5% of the total OFP, with isopentane and trans-2-butene alone contributing 26.9%, suggesting that O3 formation in the refined depot was strongly driven by a few highly reactive species, with light hydrocarbon volatilization playing a dominant role.
From a reactivity perspective, although aromatics and aldehydes in the crude oil depot exhibited strong photochemical activity, their OFP contributions were relatively evenly distributed, whereas the abundance of highly reactive alkenes in the refined oil depot suggests a more pronounced potential impact on O3 formation. This pattern aligns with broader industry-level findings, in the context of China’s refining industry, Hini et al. (2023) further quantified that alkenes accounted for 59.5% of OFP, compared to 22.3% from alkanes and 13.7% from aromatics, with ethylene, cis-2-butene, and m/p-xylene collectively contributing over 78% of the total OFP despite their relatively low abundances [69]. At the national scale, Liang et al. (2023) found that a small number of highly reactive compounds, including m/p-xylene, toluene, ethyl benzene, and isopentane, contributed disproportionately to O3 formation, with the top 20 OFP-driving species representing 85% of total OFP but only 59% of emissions [63]. Collectively, these results underscore that O3 formation is often dominated by a limited number of highly reactive VOCs, highlighting the necessity of species-targeted control strategies in emission reduction policies.
3.3. Numerical Simulation of O3 Contributions from Oil Depots
3.3.1. Model Performance
Considering that near-surface O3 formation is closely related to meteorological factors such as temperature and relative humidity [70,71], hourly temperature and relative humidity observations from ground-based meteorological stations in Lanzhou were used to validate the WRF simulations. For air quality, observed near-surface O3 and NO2 concentrations were compared with CMAQ outputs at six national control sites in Lanzhou. In addition, special attention was given to model performance at the Lanlian Hotel site near the oil depots. The detailed validation results were summarized in Table 4.
Table 4.
The results of model simulation evaluation statistics.
The evaluation results in Table 4 show that the WRF model reproduced temperature and relative humidity well, with correlation coefficients (R) above 0.83 and |NMB| values within ±15%. The RMSEs were 2.16 °C and 11.29%, In addition, the IOA values for temperature (0.94) and relative humidity (0.86) further confirm the high quality of the WRF simulations.
Under the baseline scenario, the CMAQ model simulated NO2 with R values of 0.66 and 0.49 at the Lanzhou city average and Lanlian Hotel site, respectively, along with IOA values of 0.79 and 0.69, indicating good temporal agreement with observations. The corresponding NMB and RMSE values also fell within acceptable ranges. For O3, the model achieved R values of 0.85 and 0.75, |NMB| values within 52%, and IOA values above 0.6 at both sites, indicating reasonable agreement between simulations and observations.
However, the negative bias in NMB and relatively high RMSE values (50.69 and 53.98 μg/m3) suggest an underestimation of O3 concentrations. This underprediction aligns with previous CMAQ simulations in Lanzhou, which found that the model driven by MEIC inventories tends to underestimate TVOC and O3 due to discrepancies between estimated VOC speciation and actual emissions in the region [33]. Additionally, among 50 referenced O3 modeling studies, the highest reported RMSE was 41.0 ppb [72], which is actually higher than the maximum RMSE observed in this study (53.98 μg/m3), considering the unit conversion between ppb and μg/m3. Overall, the CMAQ model reasonably reproduced the temporal variation in O3 concentration in Lanzhou, demonstrating its reliability for regional air quality assessment.
3.3.2. Impacts on O3 Concentrations
The spatial distribution of near-surface MDA8 O3 over Lanzhou’s urban core during the simulation period (Figure 6a,b) indicated that, under both the baseline and comparison scenarios, Elevated O3 bands extended east–west along the valley, with typical MDA8 levels around 130 μg/m3, consistent with the alignment of emission sources and valley topography. Localized low-O3 pockets were also evident, likely reflecting limits of emission-inventory resolution and O3 losses via chemistry, transport, and advection [73], which warrant further investigation. Compared with the baseline, the comparison scenario showed enhanced model performance near the oil depots east of Xigu District, where the area of elevated MDA8 O3 expanded (Figure 6b). Quantitatively, the comparison scenario increased MDA8 O3 by 6.1 μg/m3 at the Lanlian Hotel site and 1.7 μg/m3 citywide, with ozone formation impacts extending approximately 8 km from the depot area, demonstrating that oil depot emissions and localized VOC profiles are key to the regional inventory. These results highlight the value of refined, site-specific profiles for better O3 simulation.
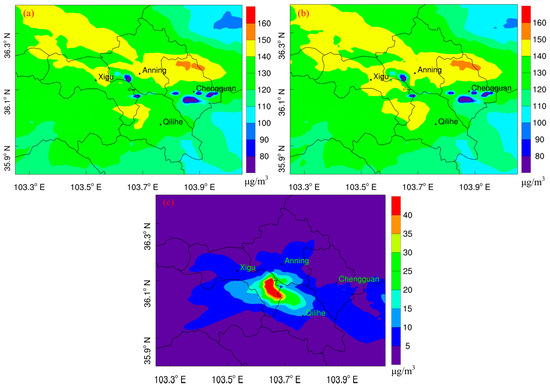
Figure 6.
Spatial distribution of MDA8 O3 concentrations from different emission sources. (a) MEIC-based simulation, (b) MEIC+oil depots simulation, and (c) oil depots-only simulation.
Our findings align with recent studies highlighting the importance of accurate VOC characterization in ozone modeling. For example, Fan et al. (2025) reported that elevated ozone concentrations in Jinan were aligned with valley-plain wind corridors and major industrial sources, resembling Lanzhou’s east–west ozone belt [20]. In Texas, a CMAQ-based study found that adjusting VOC emission estimates led to a 5 ppb increase in peak ozone during high-O3 episodes. Similarly, in California, a 30% increase in VOC emissions caused a 1.9 ppb rise in midday O3 levels-both highlighting the sensitivity of urban ozone levels to VOC input assumptions [25,74]. Furthermore, Xiong et al. (2024) demonstrated that refining VOC speciation and updating chemical mechanisms in the WRF-CMAQ framework reduced RMSE by 3.15 µg/m3 across several urban clusters in eastern China [75]. Collectively, these comparisons underscore that our simulated increases in ozone due to oil depot emissions (up to 6.1 µg/m3) fall within the range of impacts reported elsewhere. This reinforces the importance of incorporating refined, site-specific VOC profiles to enhance ozone simulation accuracy and support targeted emission mitigation strategies.
Focusing on the contributions of crude and refined oil depots (Figure 6c), VOC emissions exerted the greatest influence near the sources, notably in the eastern Xigu District, western Qilihe District, and southern Anning District. The maximum regional MDA8 O3 increment reached 40 μg/m3, following a clear east–west dispersion pattern. This value surpasses the summer-season contributions from residential and power sources in Chengdu (30 μg/m3) but remains below those from industrial and traffic sources (up to 80 μg/m3) [76]. CMAQ-ISAM source apportionment further showed that oil depots contributed 15.1% to MDA8 O3 at the nearest monitoring site (Lanlian Hotel), underscoring their substantial localized impact. Similar findings have been reported in other urban areas using CMAQ-ISAM, Wang et al. (2024) found that industrial and point sources contributed over 10% of O3 in Xi’an, particularly under stagnant meteorological conditions [77]. In the Yangtze River Delta, local VOC emissions accounted for 60–77% of O3 peaks, significantly exceeding NOx contributions, highlighting the dominant role of VOCs in urban ozone formation [78]. These results contribute to the growing body of evidence quantifying the significant and localized contributions of storage facilities to urban ozone pollution, and further emphasize the urgent need for targeted VOC emission control strategies.
4. Conclusions
In summary, by integrating source profile observations, emission inventories, OFP analysis, and WRF-CMAQ simulations, this study systematically investigated VOC emissions from crude oil and refined oil depots in Xigu District, Lanzhou, and their impact on O3 formation. VOC concentrations were higher in the refined oil depot (56.0–82.5 μg/m3) than in the crude oil depot (41.7–56.9 μg/m3). Compositionally, the refined oil depot was dominated by short-chain alkanes, whereas the crude oil depot featured a more balanced mix of alkanes, aromatics, and OVOCs, with isopentane being the most abundant compound in both. Annual VOC emissions in 2023 were estimated at 1605.3 t for the crude oil depot and 1287.8 t for the refined oil depot. OFP analysis indicated that ozone formation at the crude oil depot (153.1 μg/m3) was mainly driven by aromatics and OVOCs, while the refined oil depot (178.3 μg/m3) was jointly influenced by alkanes, alkenes, OVOCs, and aromatics.
WRF-CMAQ simulations revealed that incorporating depot emissions increased the regional mean MDA8 O3 by 1.7 μg/m3, with a peak of 6.1 μg/m3. The maximum localized contributions reached 40.0 μg/m3, and depot emissions accounted for 15.1% of O3 at the nearest monitoring site (Lanlian Hotel). From a pollution control perspective, priority at crude oil depots should be placed on reducing working and breathing losses and targeting high-reactivity species such as aromatics and OVOCs. For refined oil depots, emphasis should be on rim-seal and working losses, with targeted control of key species such as isopentane, propanal, and toluene.
Although this study is based on a summer sampling campaign, which ensures stable meteorological conditions and captures typical operating emissions, the reliance on a single-season dataset may limit the temporal representativeness of the VOC profiles and OFP estimates. Additionally, the emission inventory relies on U.S. EPA’s AP-42 emission factors, which may not fully reflect the operational conditions, control technologies, and regulatory contexts of Chinese oil depots. These factors, including MEIC inventory limitations, may introduce uncertainties into emission estimates and model simulations. Future work should incorporate multi-seasonal observations to capture temporal variability in VOC emissions and reactivity, thereby enhancing the scientific basis for seasonal O3 control strategies.
Overall, this study presents the first localized VOC source profiles for oil depots in Northwest China, identifies key reactive species, and quantifies their ozone impacts through a combined observation–modeling framework. The findings offer scientific support for refining VOC species emission inventories related to oil storage and transport, and provide evidence for implementing differentiated and targeted O3 pollution control strategies in arid and semi-arid urban areas such as Lanzhou and beyond.
Supplementary Materials
The following supporting information can be downloaded at https://www.mdpi.com/article/10.3390/atmos16101192/s1. Table S1: VOC source profiles and OFP values for crude oil and refined oil depots; Table S2: Sample analysis conditions for TT; Table S3: Sample analysis conditions for GC/MS; Text S1: Detailed methodology for estimating VOC emissions from oil depots.
Author Contributions
Conceptualization, W.A., J.T. and L.Z.; investigation and data curation, W.A., J.T., L.M., Y.L., H.Y. and M.C.; methodology and writing—original draft preparation, W.A., L.M. and Y.L.; writing—review and editing, J.T. and L.Z.; resources and funding acquisition, J.T. All authors have read and agreed to the published version of the manuscript.
Funding
This research was funded by National Natural Science Foundation of China (No. 42375136); and Technology Development Project of Gansu Province (No. 0076938).
Institutional Review Board Statement
Not applicable.
Informed Consent Statement
Not applicable.
Data Availability Statement
The original contributions presented in this study are included in the article and the Supplementary Material. Further inquiries can be directed to the corresponding authors.
Acknowledgments
During the preparation of this manuscript, the authors used GPT and DeepSeek for the purpose of language polishing. The numerical simulations were supported by the Supercomputing Center of Lanzhou University. The authors are also grateful to the College of Atmospheric Sciences, Lanzhou University, and sincerely thank Lingyun Ma, Yongle Liu, Yiming Luo, Fengjiang Li, Haotian Liu, Yongpeng Wei, Yuqin Wan, Shusu Wang, and Congjie Ao for their valuable assistance during field sampling.
Conflicts of Interest
The authors declare no conflicts of interest.
References
- Wang, Y.; Yang, Y.; Yuan, Q.; Li, T.; Zhou, Y.; Zong, L.; Wang, M.; Xie, Z.; Ho, H.C.; Gao, M.; et al. Substantially underestimated global health risks of current ozone pollution. Nat. Commun. 2025, 16, 102. [Google Scholar] [CrossRef]
- Wang, Y.; Lin, C.; Lau, A.K.H.; Fung, J.C.H.; Chong, K.C.; Ren, C. Assessing the impact of compound heatwave-ozone event with varied definitions on mortality risk in Hong Kong. Environ. Int. 2025, 201, 109595. [Google Scholar] [CrossRef]
- Feng, Z.; Xu, Y.; Kobayashi, K.; Dai, L.; Zhang, T.; Agathokleous, E.; Calatayud, V.; Paoletti, E.; Mukherjee, A.; Agrawal, M.; et al. Ozone pollution threatens the production of major staple crops in East Asia. Nat. Food 2022, 3, 47–56. [Google Scholar] [CrossRef]
- Lyu, X.; Li, K.; Guo, H.; Morawska, L.; Zhou, B.; Zeren, Y.; Jiang, F.; Chen, C.; Goldstein, A.H.; Xu, X.; et al. A synergistic ozone-climate control to address emerging ozone pollution challenges. One Earth 2023, 6, 964–977. [Google Scholar] [CrossRef]
- Li, K.; Jacob, D.J.; Shen, L.; Lu, X.; De Smedt, I.; Liao, H. Increases in surface ozone pollution in China from 2013 to 2019: Anthropogenic and meteorological influences. Atmos. Chem. Phys. 2020, 20, 11423–11433. [Google Scholar] [CrossRef]
- Wang, T.; Xue, L.; Feng, Z.; Dai, J.; Zhang, Y.; Tan, Y. Ground-level ozone pollution in China: A synthesis of recent findings on influencing factors and impacts. Environ. Res. Lett. 2022, 17, 063003. [Google Scholar] [CrossRef]
- Zhang, X.; Wu, W.; Liu, H.-B. Spatial heterogeneous associations and spillover effects of ozone pollution in China. Environ. Res. 2025, 283, 122201. [Google Scholar] [CrossRef] [PubMed]
- Shi, G.; Du, H.; Du, L.; Ni, X.; Hu, Y.; Pang, D.; Yao, L. Distribution characteristics of volatile organic compounds and its multidimensional impact on ozone formation in arid regions based on machine learning algorithms. Environ. Pollut. 2025, 373, 126159. [Google Scholar] [CrossRef]
- Guo, W.; Yang, Y.; Chen, Q.; Zhu, Y.; Zhang, Y.; Zhang, Y.; Liu, Y.; Li, G.; Sun, W.; She, J. Chemical reactivity of volatile organic compounds and their effects on ozone formation in a petrochemical industrial area of Lanzhou, Western China. Sci. Total Environ. 2022, 839, 155901. [Google Scholar] [CrossRef] [PubMed]
- Ansari, T.; Nalam, A.; Lupaşcu, A.; Hinz, C.; Grasse, S.; Butler, T. Explaining trends and changing seasonal cycles of surface ozone in North America and Europe over the 2000–2018 period: A global modelling study with NOx and VOC tagging. EGUsphere 2024, 2024, 1–51. [Google Scholar] [CrossRef]
- Chang, K.L.; McDonald, B.C.; Harkins, C.; Cooper, O.R. Surface ozone trend variability across the United States and the impact of heat waves (1990–2023). Atmos. Chem. Phys. 2025, 25, 5101–5132. [Google Scholar] [CrossRef]
- Wang, Z.; Tian, X.; Li, J.; Wang, F.; Liang, W.; Zhao, H.; Huang, B.; Wang, Z.; Feng, Y.; Shi, G. Quantitative evidence from VOCs source apportionment reveals O3 control strategies in northern and southern China. Environ. Int. 2023, 172, 107786. [Google Scholar] [CrossRef] [PubMed]
- Seo, J.H.; Jeon, H.W.; Sung, U.J.; Sohn, J.-R. Impact of the COVID-19 Outbreak on Air Quality in Korea. Atmosphere 2020, 11, 1137. [Google Scholar] [CrossRef]
- Guo, J.; Xu, Q.; Yu, S.; Zhao, B.; Zhang, M. Investigation of atmospheric VOCs sources and ozone formation sensitivity during epidemic closure and control: A case study of Zhengzhou. Atmos. Pollut. Res. 2024, 15, 102035. [Google Scholar] [CrossRef]
- Zhang, X.; Ma, Q.; Chu, W.; Ning, M.; Liu, X.; Xiao, F.; Cai, N.; Wu, Z.; Yan, G. Identify the key emission sources for mitigating ozone pollution: A case study of urban area in the Yangtze River Delta region, China. Sci. Total Environ. 2023, 892, 164703. [Google Scholar] [CrossRef]
- Lv, Z.; Liu, X.; Bai, H.; Nie, L.; Li, G. Process-specific volatile organic compounds emission characteristics, environmental impact and health risk assessments of the petrochemical industry in the Beijing-Tianjin-Hebei region. Environ. Sci. Pollut. Res. 2024, 31, 3938–3950. [Google Scholar] [CrossRef] [PubMed]
- Zhang, Z.; Wang, H.; Chen, D.; Li, Q.; Thai, P.; Gong, D.; Li, Y.; Zhang, C.; Gu, Y.; Zhou, L.; et al. Emission characteristics of volatile organic compounds and their secondary organic aerosol formation potentials from a petroleum refinery in Pearl River Delta, China. Sci. Total Environ. 2017, 584, 1162–1174. [Google Scholar] [CrossRef]
- Jindamanee, K.; Keawboonchu, J.; Pinthong, N.; Meeyai, A.; Inchai, P.; Thepanondh, S. Environmental impacts and emission profiles of volatile organic compounds from petroleum refineries. Sci. Rep. 2025, 15, 15509. [Google Scholar] [CrossRef] [PubMed]
- Yang, Y.; Meng, X.; Chen, Q.; Xue, Q.; Wang, L.; Sun, J.; Guo, W.; Tao, H.; Yang, L.; Chen, F. Characteristics of volatile organic compounds under different operating conditions in a petrochemical industrial zone and their effects on ozone formation. Environ. Pollut. 2024, 363, 125254. [Google Scholar] [CrossRef]
- Fan, L.; Gu, S.; Yan, H.; Zhang, J.; Zhang, M.; Wei, X.; Zhang, G. A comprehensive analysis of O3 variation and source contributions of VOCs-oriented to O3 pollution episodes over Jinan city, China. Atmos. Pollut. Res. 2025, 16, 102552. [Google Scholar] [CrossRef]
- Cui, C.; Zhu, Y.; Yan, X.; Zhang, X.; Zhao, M.; Mu, J.; Zhong, X.; Tang, J.; Nie, Y.; An, C.; et al. Rapid formation of acetaldehyde and its influence on ozone formation in a petrochemical industrialized region. J. Environ. Sci. 2025, 157, 134–147. [Google Scholar] [CrossRef]
- Rajabi, H.; Hadi Mosleh, M.; Mandal, P.; Lea-Langton, A.; Sedighi, M. Emissions of volatile organic compounds from crude oil processing—Global emission inventory and environmental release. Sci. Total Environ. 2020, 727, 138654. [Google Scholar] [CrossRef] [PubMed]
- Paulauskiene, T.; Zabukas, V.; Vaitiekūnas, P. Investigation of volatile Organic Compound (VOC) emission in oil terminal storage tank parks. J. Environ. Eng. Landsc. Manag. 2009, 17, 81–88. [Google Scholar] [CrossRef]
- Tiwari, V.; Hanai, Y.; Masunaga, S. Ambient levels of volatile organic compounds in the vicinity of petrochemical industrial area of Yokohama, Japan. Air Qual. Atmos. Health 2010, 3, 65–75. [Google Scholar] [CrossRef]
- Pan, S.; Choi, Y.; Roy, A.; Li, X.; Jeon, W.; Souri, A.H. Modeling the uncertainty of several VOC and its impact on simulated VOC and ozone in Houston, Texas. Atmos. Environ. 2015, 120, 404–416. [Google Scholar] [CrossRef]
- Zhou, X.; Li, Z.; Wang, F.; Zhao, Z.; Kang, S.; Yang, J.; Chang, Y.; Xia, D.; Li, K.; Zhang, X.; et al. Characterization and source analysis of VOCs and PM2.5 species in Lanzhou, northwestern China in 2017–2021: Implications for pollution control strategies. Environ. Pollut. 2025, 384, 126964. [Google Scholar] [CrossRef]
- Li, D.; Tao, X.; Song, X.; Liu, S.; Yuan, K.; Deng, F.; Guo, Y. Ambient volatile organic compounds concentration variation characteristics and source apportionment in Lanzhou, China during the COVID-19 lockdown. Atmos. Pollut. Res. 2024, 15, 102064. [Google Scholar] [CrossRef]
- Wu, Y.; Hu, J.; Wang, H.; Li, H.; Zhang, H.; Chai, F.; Wang, S. The Characteristics of Ambient Non-Methane Hydrocarbons (NMHCs) in Lanzhou, China. Atmosphere 2019, 10, 745. [Google Scholar] [CrossRef]
- Guo, W.; Yang, Y.; Zhang, J.; Han, K.; Yang, Y.; Chen, Q.; Li, S.; Zhu, Y. Effects of valley topography on ozone pollution in the Lanzhou valley: A numerical case study. Environ. Pollut. 2024, 363, 125225. [Google Scholar] [CrossRef]
- Li, J.; Wang, Z.; Chen, L.; Lian, L.; Li, Y.; Zhao, L.; Zhou, S.; Mao, X.; Huang, T.; Gao, H.; et al. WRF-Chem simulations of ozone pollution and control strategy in petrochemical industrialized and heavily polluted Lanzhou City, Northwestern China. Sci. Total Environ. 2020, 737, 139835. [Google Scholar] [CrossRef]
- Song, X.; Tian, P.; Yu, Z.; Liu, X.; Wang, T.; Zhang, M.; Li, J.; Cao, X.; Liang, J.; Ren, Y.; et al. Probing the mechanism of prolonged ozone pollution in arid and semi-arid urban areas. Urban Clim. 2025, 61, 102399. [Google Scholar] [CrossRef]
- Wang, L.; Zhao, Y.; Liu, X.; Shi, J. Enhancement of atmospheric oxidation capacity induced co-pollution of the O3 and PM2.5 in Lanzhou, northwest China. Environ. Pollut. 2024, 341, 122951. [Google Scholar] [CrossRef]
- She, Y.; Li, J.; Lyu, X.; Guo, H.; Qin, M.; Xie, X.; Gong, K.; Ye, F.; Mao, J.; Huang, L.; et al. Current status of model predictions of volatile organic compounds and impacts on surface ozone predictions during summer in China. Atmos. Chem. Phys. 2024, 24, 219–233. [Google Scholar] [CrossRef]
- Wu, R.; Xie, S. Spatial Distribution of Ozone Formation in China Derived from Emissions of Speciated Volatile Organic Compounds. Environ. Sci. Technol. 2017, 51, 2574–2583. [Google Scholar] [CrossRef] [PubMed]
- Liu, Y.; Wang, T. Worsening urban ozone pollution in China from 2013 to 2017—Part 2: The effects of emission changes and implications for multi-pollutant control. Atmos. Chem. Phys. 2020, 20, 6323–6337. [Google Scholar] [CrossRef]
- Wang, L.; Zhao, Y.; Shi, J.; Ma, J.; Liu, X.; Han, D.; Gao, H.; Huang, T. Predicting ozone formation in petrochemical industrialized Lanzhou city by interpretable ensemble machine learning. Environ. Pollut. 2023, 318, 120798. [Google Scholar] [CrossRef]
- HJ 1118-2020; Technical Specification for Application and Issuance of Pollutant Permit Bulk Oil Terminal and Filling Station. Ministry of Ecology and Environment of the People’s Republic of China: Beijing, China, 2020. Available online: https://www.mee.gov.cn/ywgz/fgbz/bz/bzwb/pwxk/202003/t20200310_768188.shtml (accessed on 9 July 2025).
- GB 20950-2020; Emission Standard of Air Pollutant for Bulk Petroleum Terminals. Ministry of Ecology and Environment of the People’s Republic of China: Beijing, China, 2021. Available online: https://www.mee.gov.cn/ywgz/fgbz/bz/bzwb/dqhjbh/dqgdwrywrwpfbz/202012/t20201231_815623.shtml (accessed on 11 July 2025).
- Lee, H.E.; Kim, J.H.; Seo, D.; Yoon, S.J. Prioritization of Volatile Organic Compound Reduction in the Tire Manufacturing Industry through Speciation of Volatile Organic Compounds Emitted at the Fenceline. Atmosphere 2024, 15, 223. [Google Scholar] [CrossRef]
- Liang, Z.; Yu, Y.; Sun, B.; Yao, Q.; Lin, X.; Wang, Y.; Zhang, J.; Li, Y.; Wang, X.; Tang, Z.; et al. The underappreciated role of fugitive VOCs in ozone formation and health risk assessment emitted from seven typical industries in China. J. Environ. Sci. 2024, 136, 647–657. [Google Scholar] [CrossRef]
- You, G.; Jin, Z.; Lu, S.; Ren, J.; Zhang, Y.; Hu, K.; Xie, S. Emission factors and source profiles of volatile organic compounds from the automobile manufacturing industry. Sci. Total Environ. 2024, 927, 172183. [Google Scholar] [CrossRef]
- HJ 732-2014; Emission from Stationary Sources-Sampling of Volatile Organic Compounds-Bag Method. Ministry of Ecology and Environment of the People’s Republic of China: Beijing, China, 2015. Available online: https://www.mee.gov.cn/ywgz/fgbz/bz/bzwb/jcffbz/201501/t20150115_294220.shtml (accessed on 11 July 2025).
- Wang, Z.; Shi, Z.; Wang, F.; Liang, W.; Shi, G.; Wang, W.; Chen, D.; Liang, D.; Feng, Y.; Russell, A.G. Implications for ozone control by understanding the survivor bias in observed ozone-volatile organic compounds system. NPJ Clim. Atmos. Sci. 2022, 5, 39. [Google Scholar] [CrossRef]
- HJ 1010-2018; Specifications and Test Procedures for Ambient Air Quality Continuous Monitoring System with Gas Chromatography for Volatile Organic Compounds. Ministry of Ecology and Environment of the People’s Republic of China: Beijing, China, 2019. Available online: https://www.mee.gov.cn/ywgz/fgbz/bz/bzwb/jcffbz/201901/t20190105_688615.shtml (accessed on 11 July 2025).
- He, C.Q.; Zou, Y.; Lv, S.J.; Flores, R.M.; Yan, X.L.; Deng, T.; Deng, X.J. The importance of photochemical loss to source analysis and ozone formation potential: Implications from in-situ observations of volatile organic compounds (VOCs) in Guangzhou, China. Atmos. Environ. 2024, 320, 120320. [Google Scholar] [CrossRef]
- Carter, W. Updated maximum incremental reactivity scale and hydrocarbon bin reactivities for regulatory applications. Calif. Air Resour. Board Contract 2010, 1, 07–339. [Google Scholar]
- Man, H.; Shao, X.; Cai, W.; Wang, K.; Cai, Z.; Xue, M.; Liu, H. Utilizing a optimized method for evaluating vapor recovery equipment control efficiency and estimating evaporative VOC emissions from urban oil depots via an extensive survey. J. Hazard. Mater. 2024, 479, 135710. [Google Scholar] [CrossRef] [PubMed]
- Hou, T.; Yu, S.; Jiang, Y.; Chen, X.; Zhang, Y.; Li, M.; Li, Z.; Song, Z.; Li, P.; Chen, J.; et al. Impacts of Chemical Initial Conditions in the WRF-CMAQ Model on the Ozone Forecasts in Eastern China. Aerosol Air Qual. Res. 2022, 22, 210402. [Google Scholar] [CrossRef]
- Xu, Y.; Shen, A.; Jin, Y.; Liu, Y.; Lu, X.; Fan, S.; Hong, Y.; Fan, Q. A quantitative assessment and process analysis of the contribution from meteorological conditions in an O3 pollution episode in Guangzhou, China. Atmos. Environ. 2023, 303, 119757. [Google Scholar] [CrossRef]
- Lu, X.; Gao, D.; Liu, Y.; Wang, S.; Lu, Q.; Yin, S.; Zhang, R.; Wang, S. A recent high-resolution PM2.5 and VOCs speciated emission inventory from anthropogenic sources: A case study of central China. J. Clean. Prod. 2023, 386, 135795. [Google Scholar] [CrossRef]
- Li, L.; Cao, J.; Hao, Y. Spatial and species-specific responses of biogenic volatile organic compound (BVOC) emissions to elevated ozone from 2014–2020 in China. Sci. Total Environ. 2023, 868, 161636. [Google Scholar] [CrossRef] [PubMed]
- Yang, X.; Wu, K.; Wang, H.; Liu, Y.; Gu, S.; Lu, Y.; Zhang, X.; Hu, Y.; Ou, Y.; Wang, S.; et al. Summertime ozone pollution in Sichuan Basin, China: Meteorological conditions, sources and process analysis. Atmos. Environ. 2020, 226, 117392. [Google Scholar] [CrossRef]
- Li, W.; Han, X.; Li, J.; Lun, X.; Zhang, M. Assessment of surface ozone production in Qinghai, China with satellite-constrained VOCs and NOx emissions. Sci. Total Environ. 2023, 905, 166602. [Google Scholar] [CrossRef]
- Qi, H.; Duan, W.; Cheng, S.; Cai, B. O3 transport characteristics in eastern China in 2017 and 2021 based on complex networks and WRF-CMAQ-ISAM. Chemosphere 2023, 337, 139258. [Google Scholar] [CrossRef]
- Liu, C.; Wu, C.; Kang, X.; Zhang, H.; Fang, Q.; Su, Y.; Li, Z.; Ye, Y.; Chang, M.; Guo, J. Evaluation of the prediction performance of air quality numerical forecast models in Shenzhen. Atmos. Environ. 2023, 314, 120058. [Google Scholar] [CrossRef]
- Shi, J.; Wang, Y.; Han, X.; Yang, J.; Wu, X.; Yao, Q.; Zhao, C.; Zhong, Y.; Ning, P.; Tian, S. Differentiation analysis of VOCs in Kunming during rainy and dry seasons based on monitoring high temporal resolution. Atmos. Pollut. Res. 2024, 15, 101996. [Google Scholar] [CrossRef]
- Zhu, B.; Zhong, X.; Cai, W.; Shi, C.; Shao, X.; Chen, Z.; Yang, J.; Chen, Y.; Ni, E.; Guo, S.; et al. Characterization of VOC source profiles, chemical reactivity, and cancer risk associated with petrochemical industry processes in Southeast China. Atmos. Environ. X 2024, 21, 100236. [Google Scholar] [CrossRef]
- Feng, Y.; Ding, D.; Xiao, A.; Li, B.; Jia, R.; Guo, Y. Characteristics, influence factors, and health risk assessment of volatile organic compounds through one year of high-resolution measurement at a refinery. Chemosphere 2022, 296, 134004. [Google Scholar] [CrossRef] [PubMed]
- Lv, D.; Lu, S.; He, S.; Song, K.; Shao, M.; Xie, S.; Gong, Y. Research on accounting and detection of volatile organic compounds from a typical petroleum refinery in Hebei, North China. Chemosphere 2021, 281, 130653. [Google Scholar] [CrossRef]
- Tang, J.; Shen, H.; Li, H.; Ji, Y.; Zhong, X.; Zhao, M.; Liu, Y.; Guo, M.; Shang, F.; Xue, L. Significant contributions of the petroleum industry to volatile organic compounds and ozone pollution: Insights from year-long observations in the Yellow River Delta. Atmos. Ocean. Sci. Lett. 2024, 17, 100523. [Google Scholar] [CrossRef]
- Wang, Q.; Li, S.; Dong, M.; Li, W.; Gao, X.; Ye, R.; Zhang, D. VOCs emission characteristics and priority control analysis based on VOCs emission inventories and ozone formation potentials in Zhoushan. Atmos. Environ. 2018, 182, 234–241. [Google Scholar] [CrossRef]
- Wang, G.; Zhao, N.; Zhang, H.; Li, G.; Xin, G. Spatiotemporal Distributions of Ambient Volatile Organic Compounds in China: Characteristics and Sources. Aerosol Air Qual. Res. 2022, 22, 210379. [Google Scholar] [CrossRef]
- Liang, X.; Sun, X.; Xu, J.; Ye, D. Improved emissions inventory and VOCs speciation for industrial OFP estimation in China. Sci. Total Environ. 2020, 745, 140838. [Google Scholar] [CrossRef]
- Wang, S.; Zhang, J.; Zhang, Y.; Wang, L.; Sun, Z.; Wang, H. Review on Source Profiles of Volatile Organic Compounds (VOCs) in Typical Industries in China. Atmosphere 2023, 14, 878. [Google Scholar] [CrossRef]
- Yang, H.; Ren, B.; Huang, Y.; Zhang, Z.; Hu, W.; Liu, M.; Zhao, H.; Jiang, G.; Hao, Z. Volatile organic compounds (VOCs) emissions from internal floating-roof tank in oil depots in Beijing: Influencing factors and emission reduction strategies analysis. Sci. Total Environ. 2024, 916, 170222. [Google Scholar] [CrossRef]
- Liu, X.; Zhang, H.; Lv, Z.; Bai, H.; Li, G. Characterization identification and speciated emission inventory construction of anthropogenic volatile organic compounds (VOCs) in Beijing, China. Atmos. Pollut. Res. 2025, 16, 102452. [Google Scholar] [CrossRef]
- Sun, X.; Liang, X.; Chen, L.; Liao, C.; Zhang, Y.; Ye, D. Historical emission and reduction of VOCs from the petroleum refining industry and their potential for secondary pollution formation in Guangdong, China. Sci. Total Environ. 2023, 904, 166416. [Google Scholar] [CrossRef] [PubMed]
- Luo, S.; Hao, Q.; Xu, Z.; Zhang, G.; Liang, Z.; Gou, Y.; Wang, X.; Chen, F.; He, Y.; Jiang, C. Composition Characteristics of VOCs in the Atmosphere of the Beibei Urban District of Chongqing: Insights from Long-Term Monitoring. Atmosphere 2023, 14, 1452. [Google Scholar] [CrossRef]
- Hini, G.; Gao, K.; Zheng, Y.; Simayi, M.; Xie, S. Emission Characteristics, OFPs, and Mitigation Perspectives of VOCs from Refining Industry in China’s Petrochemical Bases. Aerosol Air Qual. Res. 2023, 23, 220347. [Google Scholar] [CrossRef]
- Wu, W.; Fu, T.-M.; Arnold, S.R.; Spracklen, D.V.; Zhang, A.; Tao, W.; Wang, X.; Hou, Y.; Mo, J.; Chen, J.; et al. Temperature-Dependent Evaporative Anthropogenic VOC Emissions Significantly Exacerbate Regional Ozone Pollution. Environ. Sci. Technol. 2024, 58, 5430–5441. [Google Scholar] [CrossRef]
- Tao, C.; Zhang, Y.; Zhang, X.; Guan, X.; Peng, Y.; Wang, G.; Zhang, Q.; Ren, Y.; Zhao, X.; Zhao, R.; et al. Discrepant Global Surface Ozone Responses to Emission- and Heatwave-Induced Regime Shifts. Environ. Sci. Technol. 2024, 58, 22288–22297. [Google Scholar] [CrossRef]
- Sharma, S.; Sharma, P.; Khare, M. Photo-chemical transport modelling of tropospheric ozone: A review. Atmos. Environ. 2017, 159, 34–54. [Google Scholar] [CrossRef]
- Ye, F.; Rupakheti, D.; Huang, L.; Nishanth, T.; Kumar MK, S.; Li, L.; Valsaraj, K.T.; Hu, J. Integrated process analysis retrieval of changes in ground-level ozone and fine particulate matter during the COVID-19 outbreak in the coastal city of Kannur, India. Environ. Pollut. 2022, 307, 119468. [Google Scholar] [CrossRef]
- Zhu, Z.; Do, K.; Ivey, C.E.; Collins, D.R. Assessing CMAQ model discrepancies in a heavily polluted air basin using UAV vertical profiles and sensitivity analyses. Environ. Sci. Atmos. 2024, 4, 1051–1063. [Google Scholar] [CrossRef]
- Xiong, K.; Xie, X.; Huang, L.; Hu, J. Improved O3 predictions in China by combining chemical transport model and multi-source data with machining learning techniques. Atmos. Environ. 2024, 318, 120269. [Google Scholar] [CrossRef]
- Xian, Y.; Zhang, Y.; Liu, Z.; Wang, H.; Wang, J.; Tang, C. Source apportionment and formation of warm season ozone pollution in Chengdu based on CMAQ-ISAM. Urban Clim. 2024, 56, 102017. [Google Scholar] [CrossRef]
- Wang, J.; Cai, Y.; Zou, S.; Zhou, X.; Fang, C. Source Attribution Analysis of an Ozone Concentration Increase Event in the Main Urban Area of Xi’an Using the WRF-CMAQ Model. Atmosphere 2024, 15, 1208. [Google Scholar] [CrossRef]
- Wang, Y.; Jiang, S.; Huang, L.; Lu, G.; Kasemsan, M.; Yaluk, E.A.; Liu, H.; Liao, J.; Bian, J.; Zhang, K.; et al. Differences between VOCs and NOx transport contributions, their impacts on O3, and implications for O3 pollution mitigation based on CMAQ simulation over the Yangtze River Delta, China. Sci. Total Environ. 2023, 872, 162118. [Google Scholar] [CrossRef] [PubMed]
Disclaimer/Publisher’s Note: The statements, opinions and data contained in all publications are solely those of the individual author(s) and contributor(s) and not of MDPI and/or the editor(s). MDPI and/or the editor(s) disclaim responsibility for any injury to people or property resulting from any ideas, methods, instructions or products referred to in the content. |
© 2025 by the authors. Licensee MDPI, Basel, Switzerland. This article is an open access article distributed under the terms and conditions of the Creative Commons Attribution (CC BY) license (https://creativecommons.org/licenses/by/4.0/).