Article

Vegetation Transpiration Drives Root-Zone Soil Moisture Depletion in Subtropical Humid Regions: Evidence from GLDAS Catchment Simulations in Fujian Province

1
School of Geographical Sciences, Fujian Normal University, Fuzhou 350117, China
2
National Demonstration Center for Experimental Geography Education, Fujian Normal University, Fuzhou 350007, China
3
Fujian Provincial Engineering Research Centre for Monitoring and Assessing Terrestrial Disasters, School of Geographical Sciences, Fujian Normal University, Fuzhou 350117, China
4
Key Laboratory of Humid Subtropical Eco-Geographical Processes of Ministry of Education, School of Geographical Sciences, Fujian Normal University, Fuzhou 350117, China
*
Author to whom correspondence should be addressed.
Atmosphere 2025, 16(10), 1180; https://doi.org/10.3390/atmos16101180
Submission received: 5 September 2025 / Revised: 3 October 2025 / Accepted: 10 October 2025 / Published: 13 October 2025
(This article belongs to the Section Biometeorology and Bioclimatology)

Abstract

Understanding the relationship between vegetation transpiration and root-zone soil moisture is essential for assessing eco-hydrological processes under global change. However, past studies often looked at only one side, and traditional field observations have the limitations of high cost and poor spatial–temporal continuity. Using daily GLDAS Catchment data from 2004 to 2023, this study investigates the spatiotemporal patterns and interactions between vegetation transpiration and root-zone soil moisture in Fujian Province. The results show that transpiration decreased before 2016 and increased thereafter temporally, with an overall spatial decline. In contrast, the root-zone soil moisture increased before 2016 and then decreased temporally, showing overall spatial growth with significant heterogeneity. A strong negative correlation was found between vegetation transpiration and root-zone soil moisture, particularly in summer and autumn. Among them, vegetation transpiration strongly influenced soil moisture, with increases (or decreases) in transpiration corresponding to decreases (or increases) in soil moisture. Moreover, transpiration changes preceded those in soil moisture, and a significant resonance relationship with a 1- to 2-year cycle was identified. These findings offer insights into the vegetation–soil moisture dynamics in humid subtropical regions, supporting eco-hydrological management under climate change.

1. Introduction

Vegetation transpiration serves as a critical bridge for material and energy exchange between the pedosphere and the atmosphere [1,2,3,4], with its dynamic variations closely tied to the root-zone soil moisture. As a key variable within the soil system, soil moisture plays a pivotal role in regulating regional land–atmosphere water cycling processes [5,6,7,8,9]. Therefore, investigating the relationship between the dynamics of root-zone soil moisture and vegetation transpiration is essential for understanding changes in regional eco-hydrological processes [10].
Significant progress has been made in recent years regarding vegetation transpiration and root-zone soil moisture. Studies such as those by Granier et al. [11] and Bai et al. [12] have identified climatic and biotic factors as key drivers of transpiration, while Zhang et al. [13] and Ren et al. [14] highlighted the role of vegetation transpiration in ecosystem functioning and evapotranspiration partitioning. Jin et al. [15] further emphasized the dominant influence of soil moisture over atmospheric drivers in regulating transpiration. On the other hand, research on root-zone soil moisture has revealed its spatiotemporal variability and ecological implications, particularly in arid regions [16,17,18,19]. However, most of these studies have focused on arid or semi-arid ecosystems, with limited attention to subtropical humid regions where the interactions between soil moisture and vegetation transpiration are modulated by complex biotic and abiotic factors [20,21,22].
In recent years, remote sensing technology has been increasingly used in large-scale hydrological and ecological studies because it provides spatially continuous, temporally consistent, and long-term observational data that are hard to obtain through traditional ground measurements alone. These advantages make remote sensing especially valuable for studying regional eco-hydrological processes. To ensure data reliability, this study uses root-zone soil moisture and vegetation transpiration data from the GLDAS CLSM. Several reasons support the choice of GLDAS over other datasets. First, compared to atmospheric reanalysis products like ERA5, which mainly rely on atmospheric data, GLDAS uses a dedicated land surface model that better represents soil moisture processes and land–atmosphere interactions [23,24,25]. Second, unlike climate model outputs such as CMIP, which focus on future projections and have high uncertainties at regional scales, GLDAS is designed for historical simulation and incorporates multiple observational constraints, leading to higher accuracy in diagnosing soil moisture–vegetation interactions [26]. Previous evaluations in China have shown that GLDAS matches well with ground observations and performs reliably in humid subtropical regions [27,28], further supporting its use in this study.
Recent advances in time–frequency analysis, particularly wavelet coherence techniques, have enabled more nuanced investigations into the multi-scale relationships between eco-hydrological variables [29,30]. Grinsted et al. [31] demonstrated the utility of cross-wavelet transform and wavelet coherence in identifying localized intermittent periodicities and phase relationships in geophysical time series—a methodology that holds great promise for unraveling complex soil moisture–vegetation interactions. Applying such methods, Liu et al. [32] revealed how plant functional types alter the coherence between precipitation and soil moisture across different soil depths, providing important insights into vegetation-mediated hydrological processes. Similarly, Rocha et al. [33] used wavelet coherence to uncover species-specific stomatal regulation effects on soil moisture–sap flux coupling, while Stoy et al. [34] employed this technique to evaluate model–data agreement in carbon flux simulations across multiple temporal scales.
Despite these methodological advances, critical research gaps remain in understanding root-zone soil moisture–vegetation transpiration interactions in subtropical humid regions. The application of wavelet coherence techniques to elucidate these interactions remains scarce in subtropical humid forest ecosystems [35], particularly in regions like Southeast China, where high forest coverage and complex climate conditions create unique eco-hydrological dynamics that may fundamentally differ from arid ecosystems [36]. Existing studies have largely overlooked how vegetation mediates soil moisture depletion through transpiration in humid regions, where moisture recycling processes operate differently than in water-limited ecosystems. Most land surface models produce fundamentally different soil moisture representations due to structural differences in parameterizations of evaporation, runoff, and soil hydraulic properties [37,38], making direct comparisons across studies problematic without proper statistical normalization.
Fujian Province is a key component of China’s southern forest region, with a forest coverage rate of 65.12%, the highest among all provinces in the country [21]. Therefore, investigating the relationship between root-zone soil moisture and vegetation transpiration in this region holds both typical and representative significance. Accordingly, this study focuses on Fujian Province as the research area and utilizes root-zone soil moisture and vegetation transpiration data provided by the Global Land Data Assimilation System. It aims to analyze the spatiotemporal dynamics and interactive characteristics of these two variables and reveal the response mechanisms linking root-zone soil moisture and vegetation transpiration in subtropical humid regions. Our findings are expected to provide a scientific basis for the formulation of vegetation restoration strategies and adaptive climate management in southeastern China while also contributing to the broader application of time–frequency analysis in eco-hydrological studies.

2. Materials and Methods

2.1. Study Area

Fujian Province is located along the southeastern coast of China, spanning from 23°31′ to 28°18′ N latitude and 115°50′ to 120°43′ E longitude (Figure 1). The region is characterized by a topography that is elevated in the northwest and lower in the southeast, presenting a typical mountain–sea transitional pattern. Mountainous and hilly areas account for approximately 90% of the province’s total land area, with major mountain ranges including the Wuyi Mountains, Jiufeng Mountains, Daimao Mountains, and Daiyun Mountains. The climate is classified as humid subtropical (Cfa) according to the Köppen climate classification, featuring hot, humid summers and mild, drier winters, with an annual average temperature ranging from 17 °C to 21 °C and an average annual precipitation between 1400 and 2000 mm. Coastal areas are relatively flat with lower precipitation, whereas the central and western mountainous regions receive higher precipitation due to orographic uplift, leading to a precipitation pattern that roughly parallels the coastline.
The province is predominantly covered by subtropical evergreen broadleaf forests. The natural vegetation consists of primary species such as Castanopsis carlesii, Schima superba, Cyclobalanopsis glauca, and Machilus thunbergii, which form the core canopy layer in the mid-subtropical zones [39]. Due to afforestation efforts since the late 20th century, coniferous plantations are also widely distributed, primarily composed of Pinus massoniana and Cunninghamia lanceolata. The dominant soil types include red soils and yellow soils, which are highly weathered, acidic, and typical of humid subtropical regions [40]. Red soils are predominantly distributed in hilly and low-elevation areas, characterized by moderate to high clay content and relatively low organic matter, which affects their water-holding capacity and infiltration rates. Yellow soils are more common in higher elevation zones with better drainage.
Landscape heterogeneity is notable; the northwestern mountainous regions are characterized by dense forests and higher precipitation due to orographic effects, while the southeastern coastal areas feature flatter terrain with more urban and agricultural land use. This spatial variability in the topography, vegetation, and soil types underpins the regional differences in the transpiration and soil moisture dynamics observed in this study.

2.2. Data Sources

2.2.1. GLDAS Data

The Global Land Data Assimilation System (GLDAS) was jointly developed by the Goddard Space Flight Center (GSFC) and the National Centers for Environmental Prediction (NCEP) (https://daac.gsfc.nasa.gov/ (accessed on 29 August 2024)). It aims to integrate advanced land surface modeling with data assimilation techniques to produce optimal estimates of land surface water and energy fluxes by assimilating satellite and in situ observations. This study employs the GLDAS Catchment Land Surface Model (CLSM) [41], which simulates terrestrial hydrological processes including soil moisture, precipitation, and evapotranspiration.
As a comprehensive land surface model, CLSM adopts a multi-layer soil–vegetation–atmosphere coupling framework, with the core physical processes parameterized as follows:
First, for soil hydrothermal transfer, CLSM uses a three-layer soil structure (surface, subsurface, and deep layer) and the diffusion equation to describe water vapor transport, with the governing equation expressed as
θ t = · ( K ( θ ) ( h + z ) ) S
where θ is soil volumetric water content, K ( θ ) is unsaturated hydraulic conductivity, h is matrix potential, z is vertical coordinate, and S is the root water uptake term.
For snow processes, CLSM uses the energy balance method to simulate snow accumulation and ablation while simultaneously considering dynamic changes in snow density, liquid water content, and surface temperature. The variation equation of snow water equivalent (SWE) is
S W E t = P s E s M + A
where P S is snowfall, E S is snow sublimation, M is snowmelt, and A is snow drift transport.
For vegetation–atmosphere interaction, CLSM calculates canopy conductance using the Big Leaf Model and simulates transpiration via the Penman–Monteith equation [18]. For the subtropical humid region of Fujian, GLDAS CLSM optimizes local underlying surface parameters: it modifies precipitation distribution using a topographic lift factor that enhances precipitation by 20–30% in northwestern mountainous areas and adjusts water-holding parameters for red soils and yellow soils with a field capacity of 0.45–0.55 cm3/cm3 to match local hydrological characteristics; meanwhile, it integrates MODIS vegetation indices and SMAP soil moisture observations, optimizing initial fields through 4-dimensional variational assimilation (4D-Var) to further improve simulation accuracy in complex terrain. We extracted daily data of root-zone soil moisture and vegetation transpiration from the CLSM for Fujian Province, covering the period from 1 January 2004 to 31 December 2023, at a spatial resolution of 0.25° × 0.25°. A critical aspect of this data is that both core variables originate from the same integrated model. This common source ensures they are generated within a unified physical framework, meaning that even if their absolute values may carry inherent model biases, the relative dynamics and coupling relationships between them—which constitute the central focus of this investigation—are considered robust and physically meaningful. The data were processed to generate seasonal (winter: December–February; spring: March–May; summer: June–August; autumn: September–November) and interannual time series of root-zone soil moisture and vegetation transpiration.

2.2.2. Temperature and Precipitation Data

Precipitation and air temperature data for the same period in Fujian Province (1 January 2004–31 December 2023) were obtained from the National Tibetan Plateau Data Center (https://data.tpdc.ac.cn/ (accessed on 11 March 2025)). To ensure consistency with the scale of the calculated root-zone soil moisture and vegetation transpiration data, we used the 1 km resolution monthly precipitation dataset for China (1901–2023) [42] and the 1 km resolution monthly mean temperature dataset for China (1901–2023) [43]. Based on these datasets, the annual cumulative precipitation and annual mean temperature for Fujian Province were derived, which were then used to preliminarily explore the influence of precipitation and temperature on the interactions between root-zone soil moisture and vegetation transpiration.

2.3. Research Methods

2.3.1. Mann–Kendall Trend Test

The Mann–Kendall (M-K) test is a non-parametric statistical method used to detect trends in time series data [44,45]. Given the stochastic nature of the hydrometeorological data, which often do not conform to normal distributions, the M-K test is particularly suitable due to its distribution-free assumptions and wide applicability. It has been widely employed in the trend analyses of hydrometeorological variables [46,47,48]. In this study, we applied the M-K test to examine the temporal trends of root-zone soil moisture and vegetation transpiration in Fujian Province from 2004 to 2023, aiming to identify their spatiotemporal variation patterns.

2.3.2. Cross-Wavelet Transform

Cross-wavelet transform (XWT) is a method that combines wavelet analysis and cross-spectrum analysis to examine the correlation and phase relationships between two time series across different time scales [31,49]. A higher cross-wavelet power indicates a stronger correlation between the two series at a given scale. In this study, XWT was used to explore the seasonal and interannual interactions between root-zone soil moisture and vegetation transpiration. This study adopts the Morlet wavelet (a complex wavelet) for XWT, as it balances time–frequency localization and retains abundant oscillatory information, making it suitable for hydrological time series analysis.
Let W n X ( s ) and W n Y ( s ) be the CWT results of time series X (root-zone soil moisture) and Y (vegetation transpiration), respectively. The cross-wavelet spectrum is defined as
W n X Y ( s ) = W n X ( s ) W n Y * ( s )
where W n Y * ( s ) is the complex conjugate of W n Y ( s ) , and | W n X Y ( s ) | is the cross-wavelet power, with higher values indicating stronger co-variability at the corresponding scale and time.
Significance testing of cross-wavelet power is conducted against a red noise background. Assuming the expected spectra of X and Y are red noise spectra P k X and P k Y , the test criterion is
| W n X ( s ) W n Y * ( s ) | σ X σ Y = Z v ( P ) v P k X P k Y
where σ X and σ Y are the standard deviations of X and Y , v = 2 (degrees of freedom for Morlet wavelet), and Z v ( P ) is the confidence level-related value. If the left-hand side of (6) exceeds the right-hand side, the correlation is significant at the 95% confidence level.

2.3.3. Singular Value Decomposition (SVD)

Singular value decomposition (SVD) is a matrix decomposition technique commonly applied to analyze the relationship between two meteorological fields [50,51]. It identifies statistically independent coupled modes that best capture the co-variability between two datasets, thus revealing spatial patterns of temporal correlation. These coupled spatial structures provide an optimal explanation of the cross-covariance between the two fields. SVD has been widely used in climate diagnostics to analyze the coupling between meteorological variables [52,53]. In this study, SVD was employed to investigate the relationship between root-zone soil moisture (left field) and vegetation transpiration (right field) in Fujian Province.

3. Results

3.1. Characteristics of Vegetation Transpiration Changes

Vegetation transpiration in Fujian Province exhibited an overall declining trend from 2004 to 2023, with a decreasing rate of −5.58 mm/yr. However, there was a noticeable periodic variation, with 2004–2016 being a declining phase at a decreasing rate of −13.43 mm/yr. In contrast, from 2016 to 2023, the trend shifted from a decrease to an increase, with an increasing trend of 10.93 mm/yr during this period (Figure 2a). The seasonal variation in vegetation transpiration was similar to the interannual changes, showing a decreasing trend from 2004 to 2016 and an increasing trend from 2016 to 2023. Overall, the reduction amplitude of vegetation transpiration in summer was the most pronounced, at a rate of −1.56 mm/yr (Figure 2c), while the reduction amplitude in winter was the weakest, at a rate of −0.64 mm/yr (Figure 2e). The reduction amplitude in spring and autumn fell between those of summer and winter (Figure 2b,d). Interestingly, the rate of change in summer and autumn during the periods of 2004–2016 and 2016–2023 was significantly greater than those in the other two seasons, with the rate of decline from 2004 to 2016 being −3.75 mm/yr and −5.38 mm/yr, and the rate of increase from 2016 to 2023 being 3.57 mm/yr and 5.48 mm/yr, respectively. Collectively, vegetation transpiration across all four seasons in Fujian Province demonstrated a pattern of initial decrease followed by a subsequent increase.
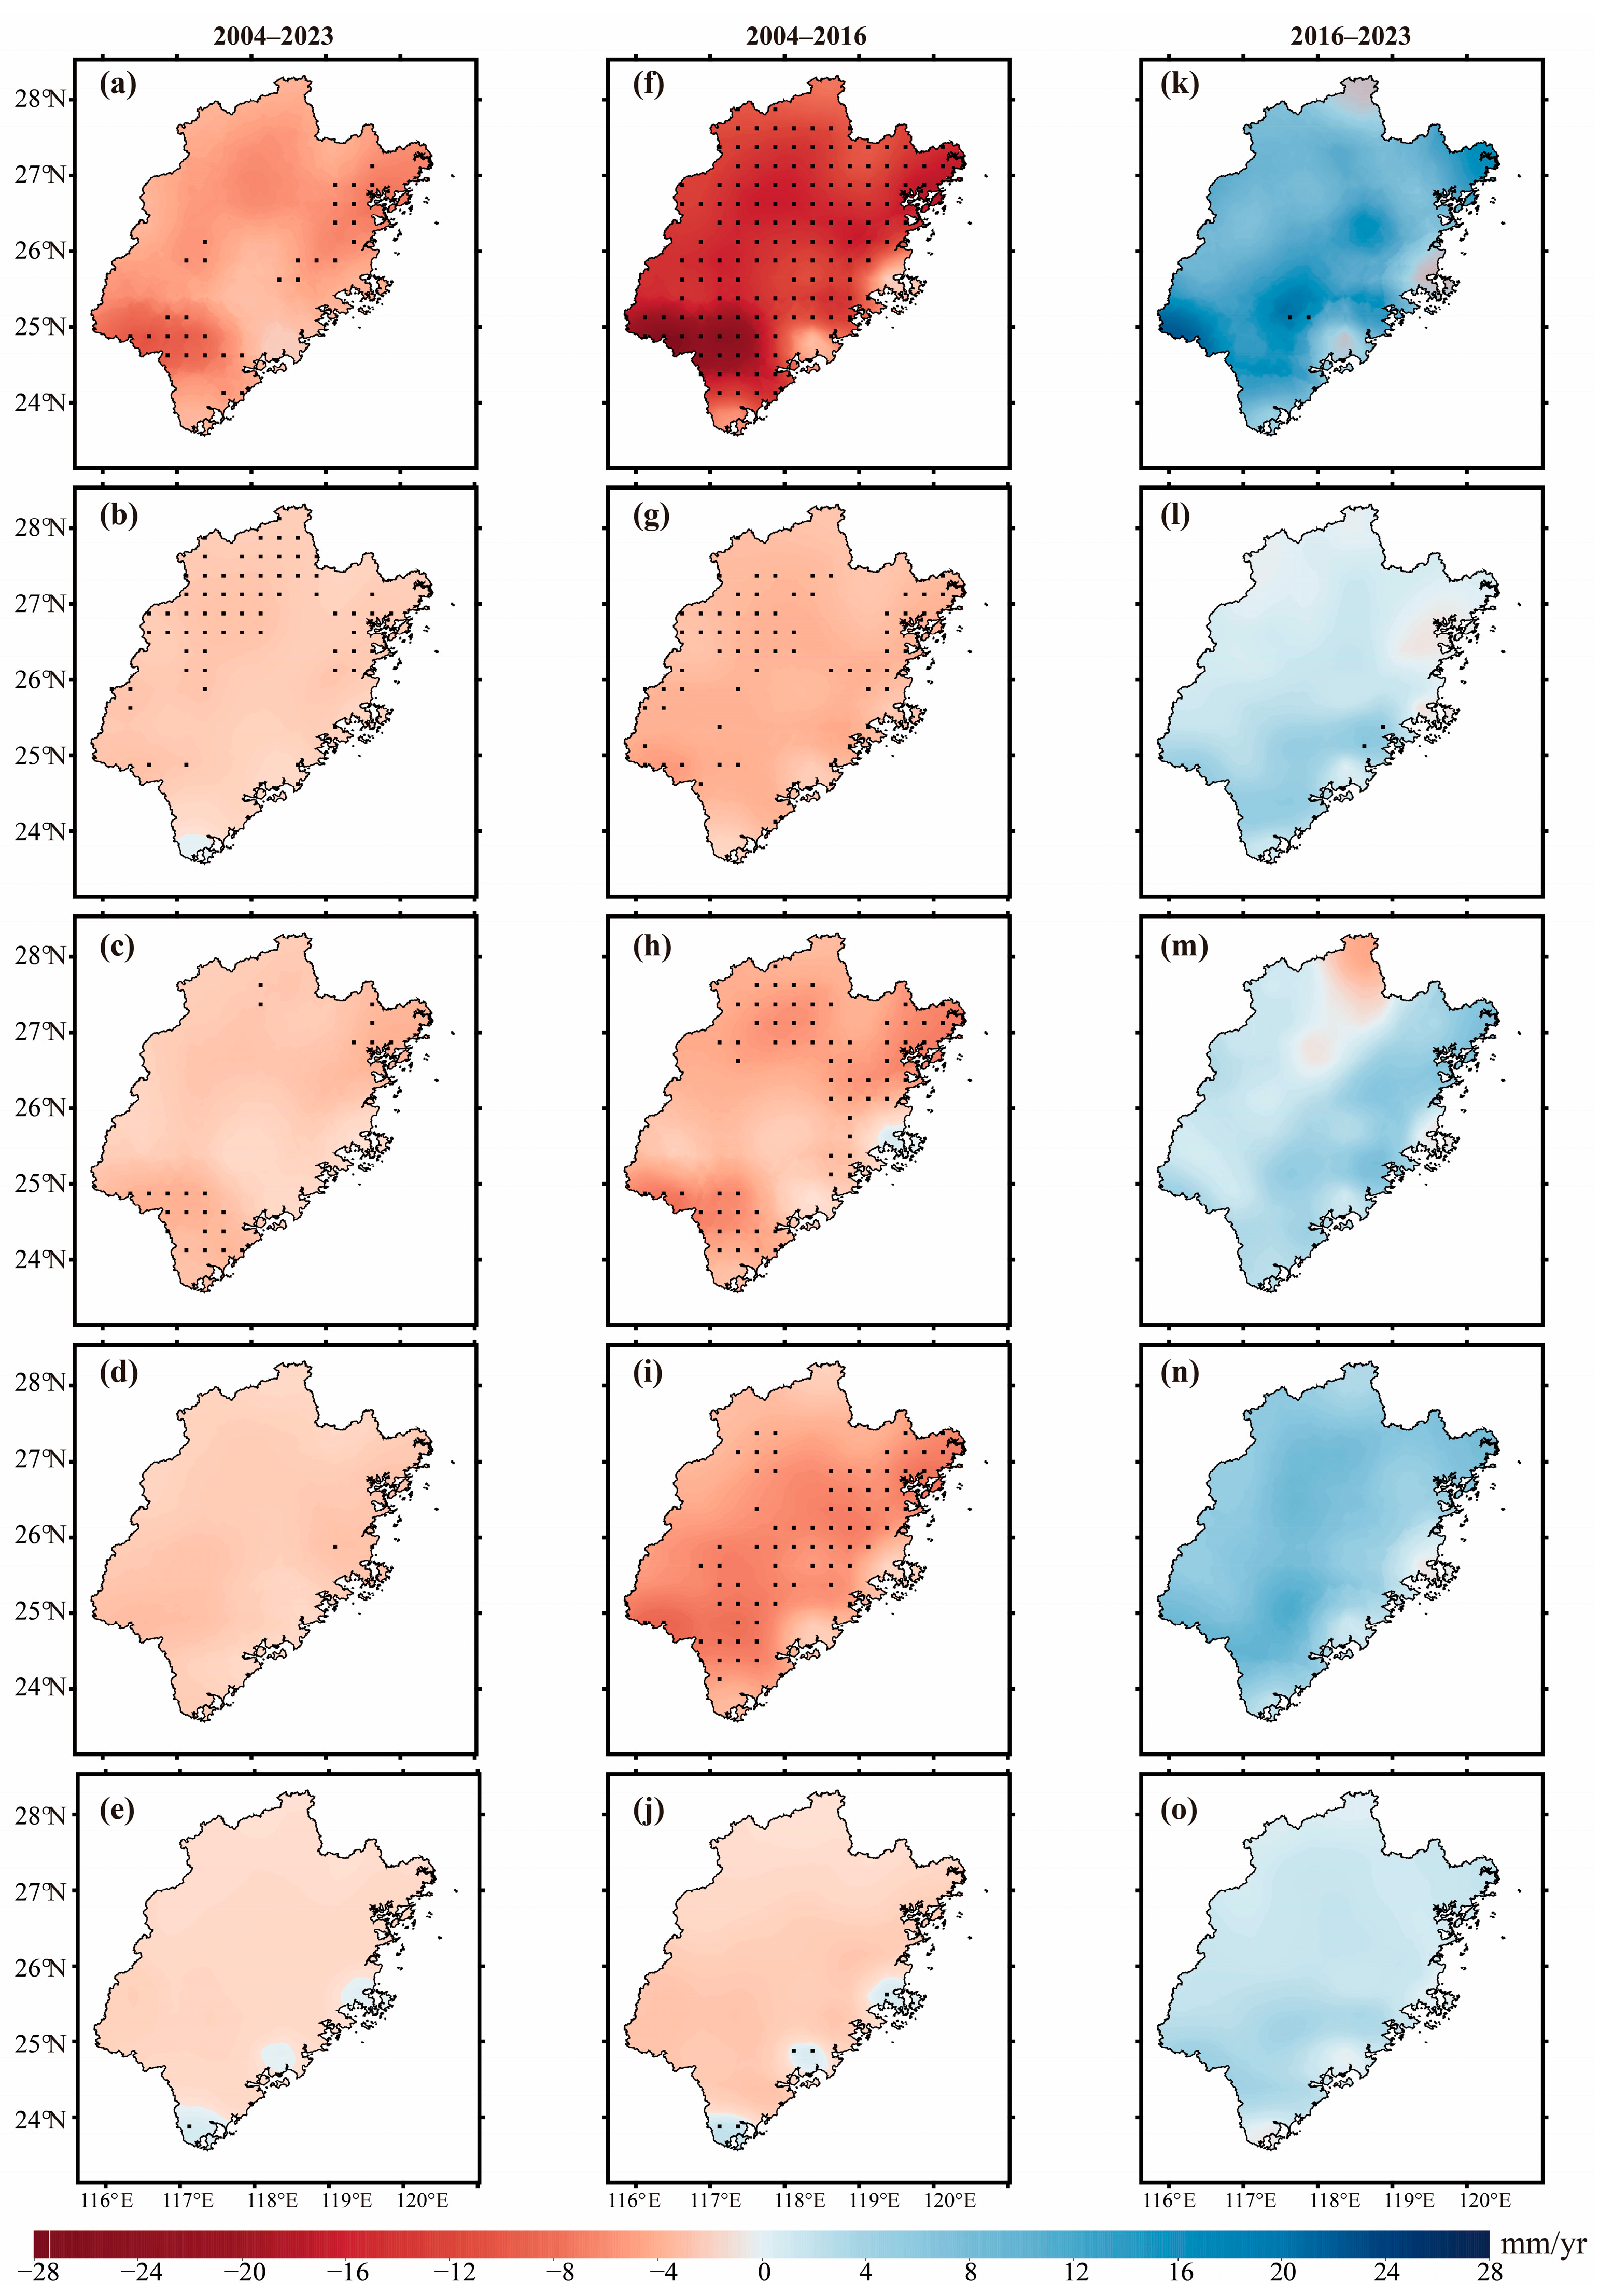
Regarding spatial variation characteristics, both interannual and seasonal vegetation transpiration across Fujian Province exhibited a declining trend during the period 2004–2023 (Figure 3a–e). Specifically, on the interannual scale, vegetation transpiration decreased significantly in the southern and northeastern coastal regions, while changes in other areas were non-significant. At the seasonal scale, areas experiencing a significant decrease in spring vegetation transpiration were concentrated in the west and northeast (Figure 3b). In summer, the southern and northern regions showed significant decreases (Figure 3c). Decreasing trends during autumn and winter were generally non-significant across the province (Figure 3d,e).
During the period from 2004 to 2016, a significant decreasing trend in vegetation transpiration was observed across the entire study area at the interannual scale, with rates predominantly ranging between −28 mm/yr and −12 mm/yr (Figure 3f). Seasonally, the decreasing trend in spring was relatively modest (Figure 3g), with significant decreases localized in the western and northeastern regions. In summer, the southern and northern parts exhibited significant decreasing trends (−8 mm/yr to −4 mm/yr) (Figure 3h). The rate of decrease in vegetation transpiration during autumn was higher compared to the other three seasons (Figure 3i), and the spatial extent of areas showing a significant decrease expanded relative to summer. The decreasing trend in winter was not significant over the entire region (Figure 3j).
During the period from 2016 to 2023, interannual vegetation transpiration predominantly showed an increasing trend, with rates between 12 mm/yr and 20 mm/yr (Figure 3k). At the seasonal scale, spring displayed a relatively small increasing trend (0 to 4 mm/yr), which was not statistically significant (Figure 3l). Significant increases in summer were primarily located in the eastern coastal region, although localized decreases persisted in parts of the north (Figure 3m). Autumn exhibited a more pronounced increasing trend (Figure 3n), while the increasing trend in winter was relatively modest (Figure 3o).

3.2. Characteristics of Root-Zone Soil Moisture Changes

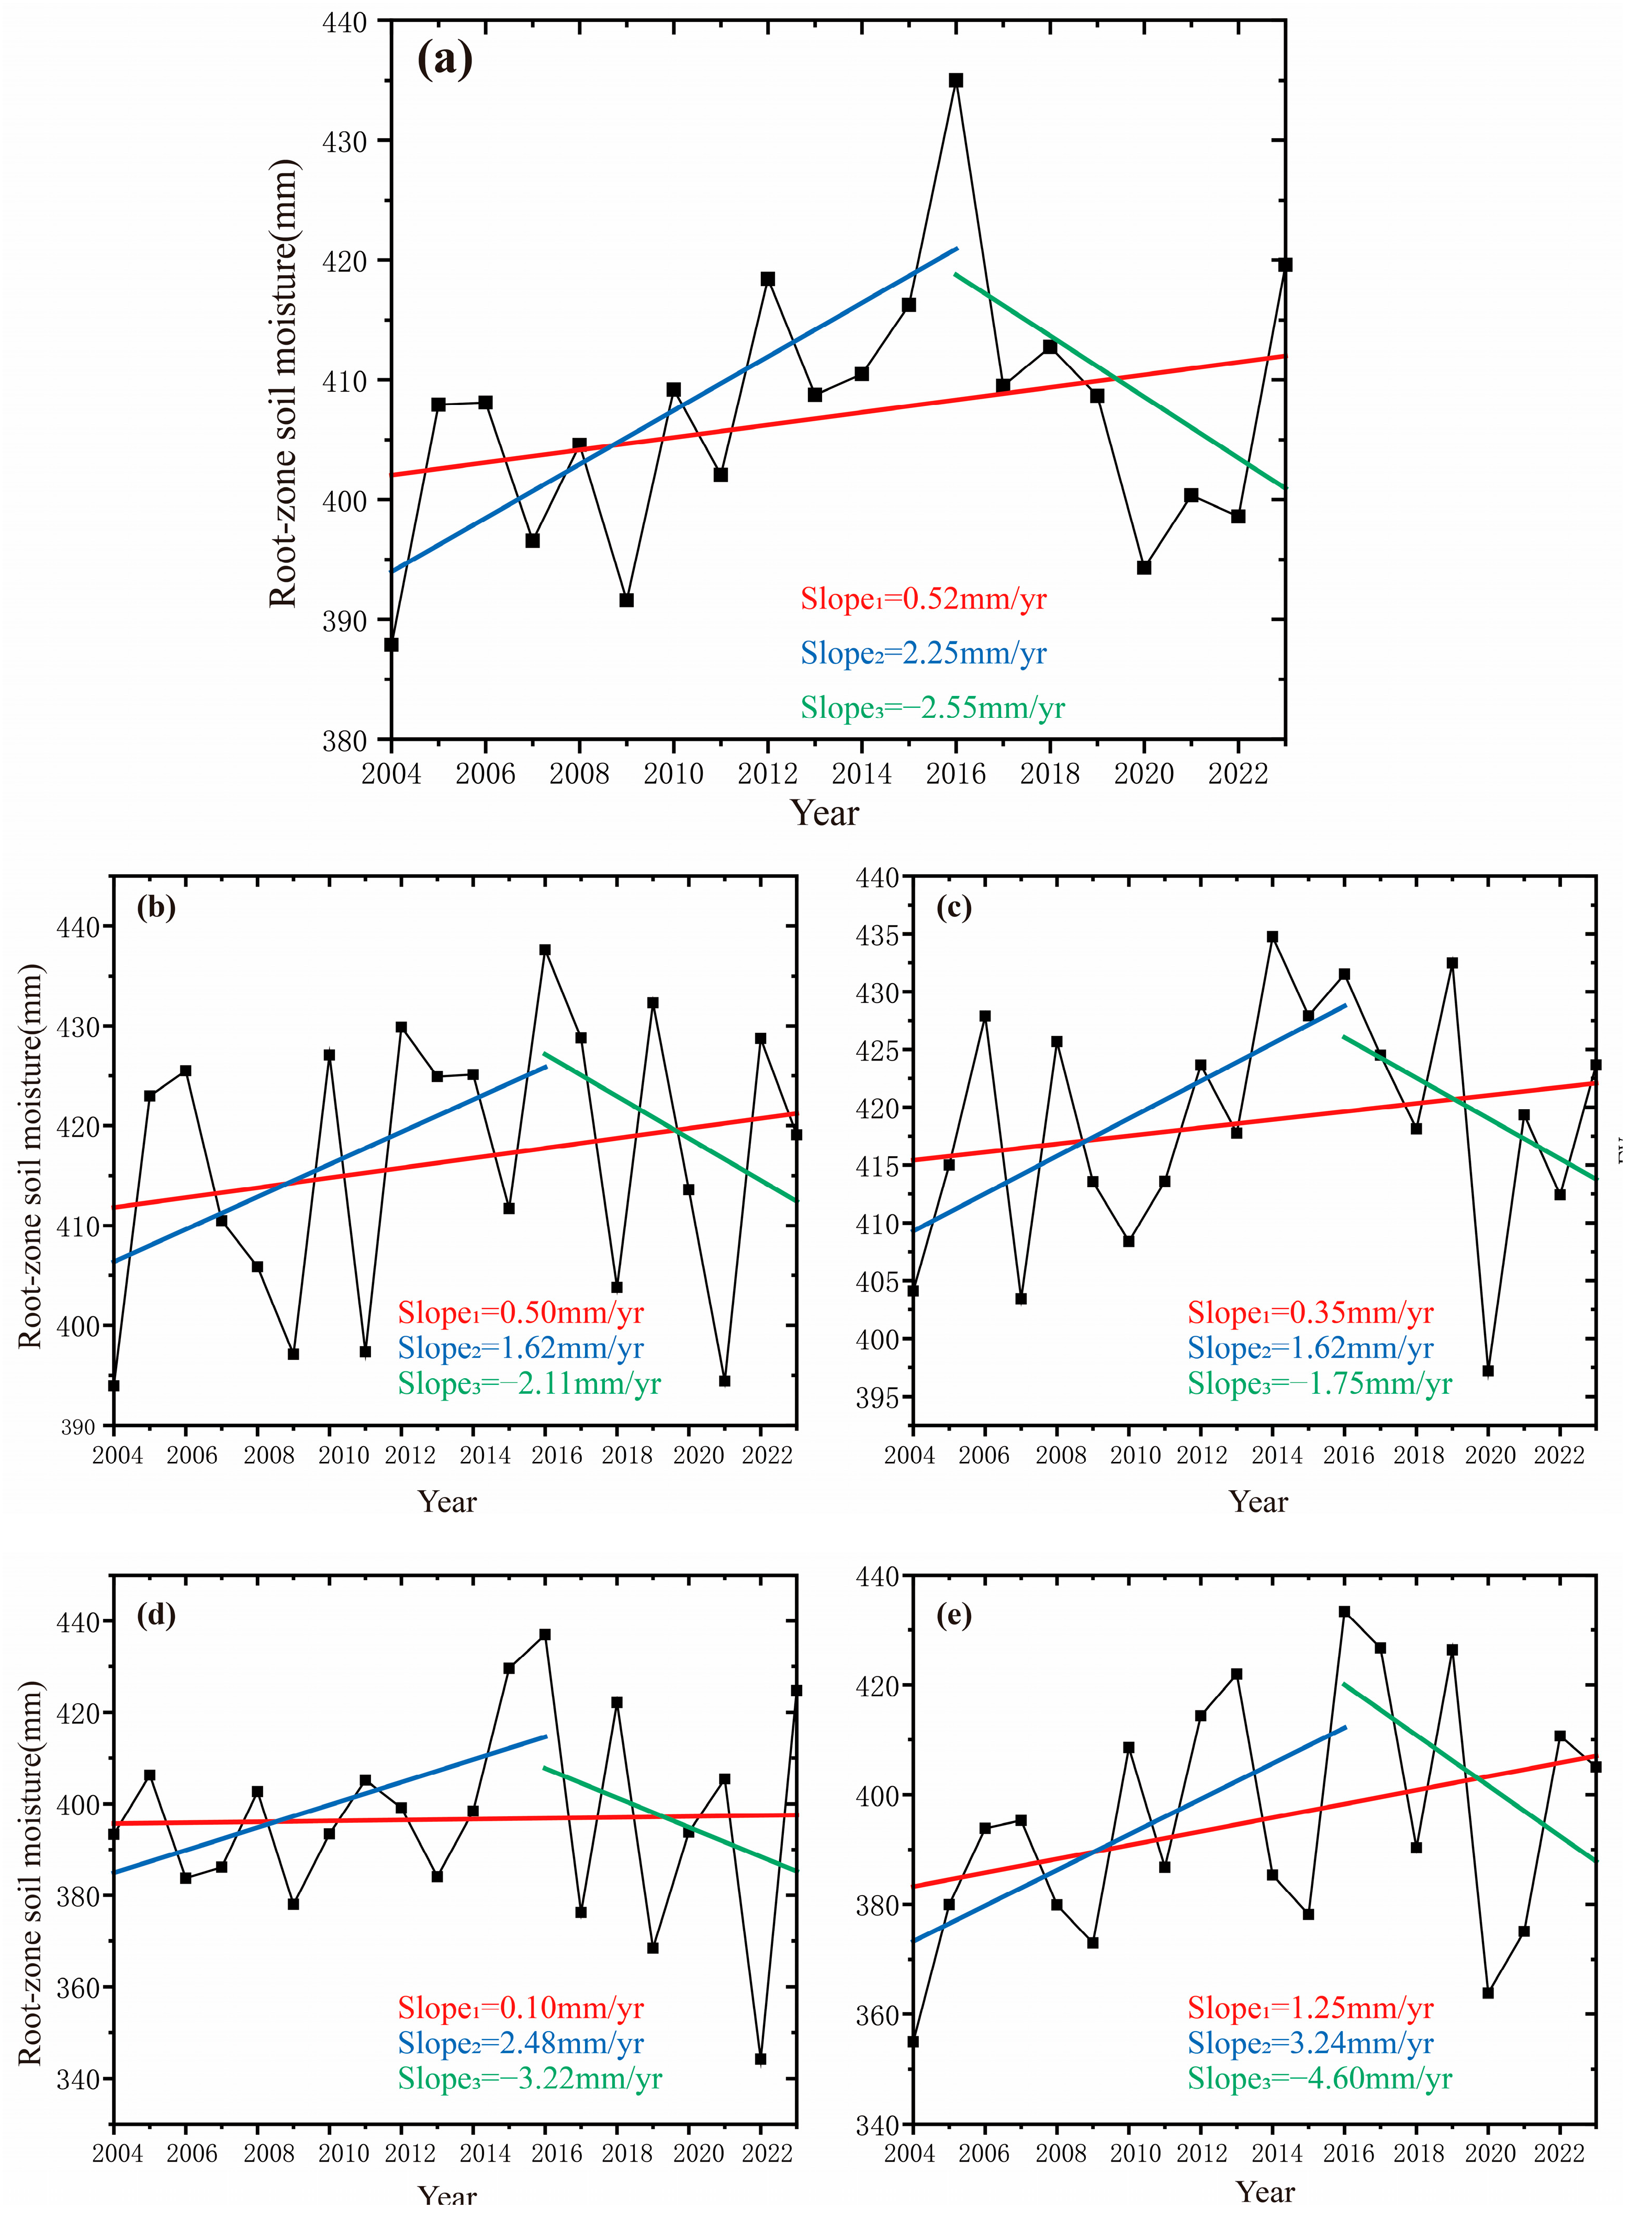
During the period from 2004 to 2023, root-zone soil moisture in the study area exhibited an overall increasing trend, with a rate of 0.52 mm/yr (Figure 4a). Similar to the trend in vegetation transpiration, the variation in soil moisture can be segmented into two distinct periods. From 2004 to 2016, there was an increasing trend at a rate of 2.25 mm/yr, whereas a decreasing trend was observed from 2016 to 2023, at a rate of −2.55 mm/yr. The seasonal variation in root-zone soil moisture is consistent with its interannual dynamics. Among the four seasons, autumn exhibited the smallest magnitude of variation, with an increase rate of only 0.1 mm/yr (Figure 4d). Spring showed a more pronounced increase (Figure 4c), and the increase in summer was comparable to that in autumn (Figure 4d). The most significant increase occurred in winter, reaching 1.25 mm/yr (Figure 4e). Notably, the rates of change in autumn and winter during both sub-periods (2004–2016 and 2016–2023) were significantly greater than those in spring and summer. Specifically, the increase rates in autumn and winter during 2004–2016 were 2.48 mm/yr and 3.24 mm/yr, respectively, while during 2016–2023, the corresponding decrease rates were −3.22 mm/yr and −4.60 mm/yr. A comparison between Figure 2 and Figure 4 reveals a clear negative correlation between vegetation transpiration and root-zone soil moisture.
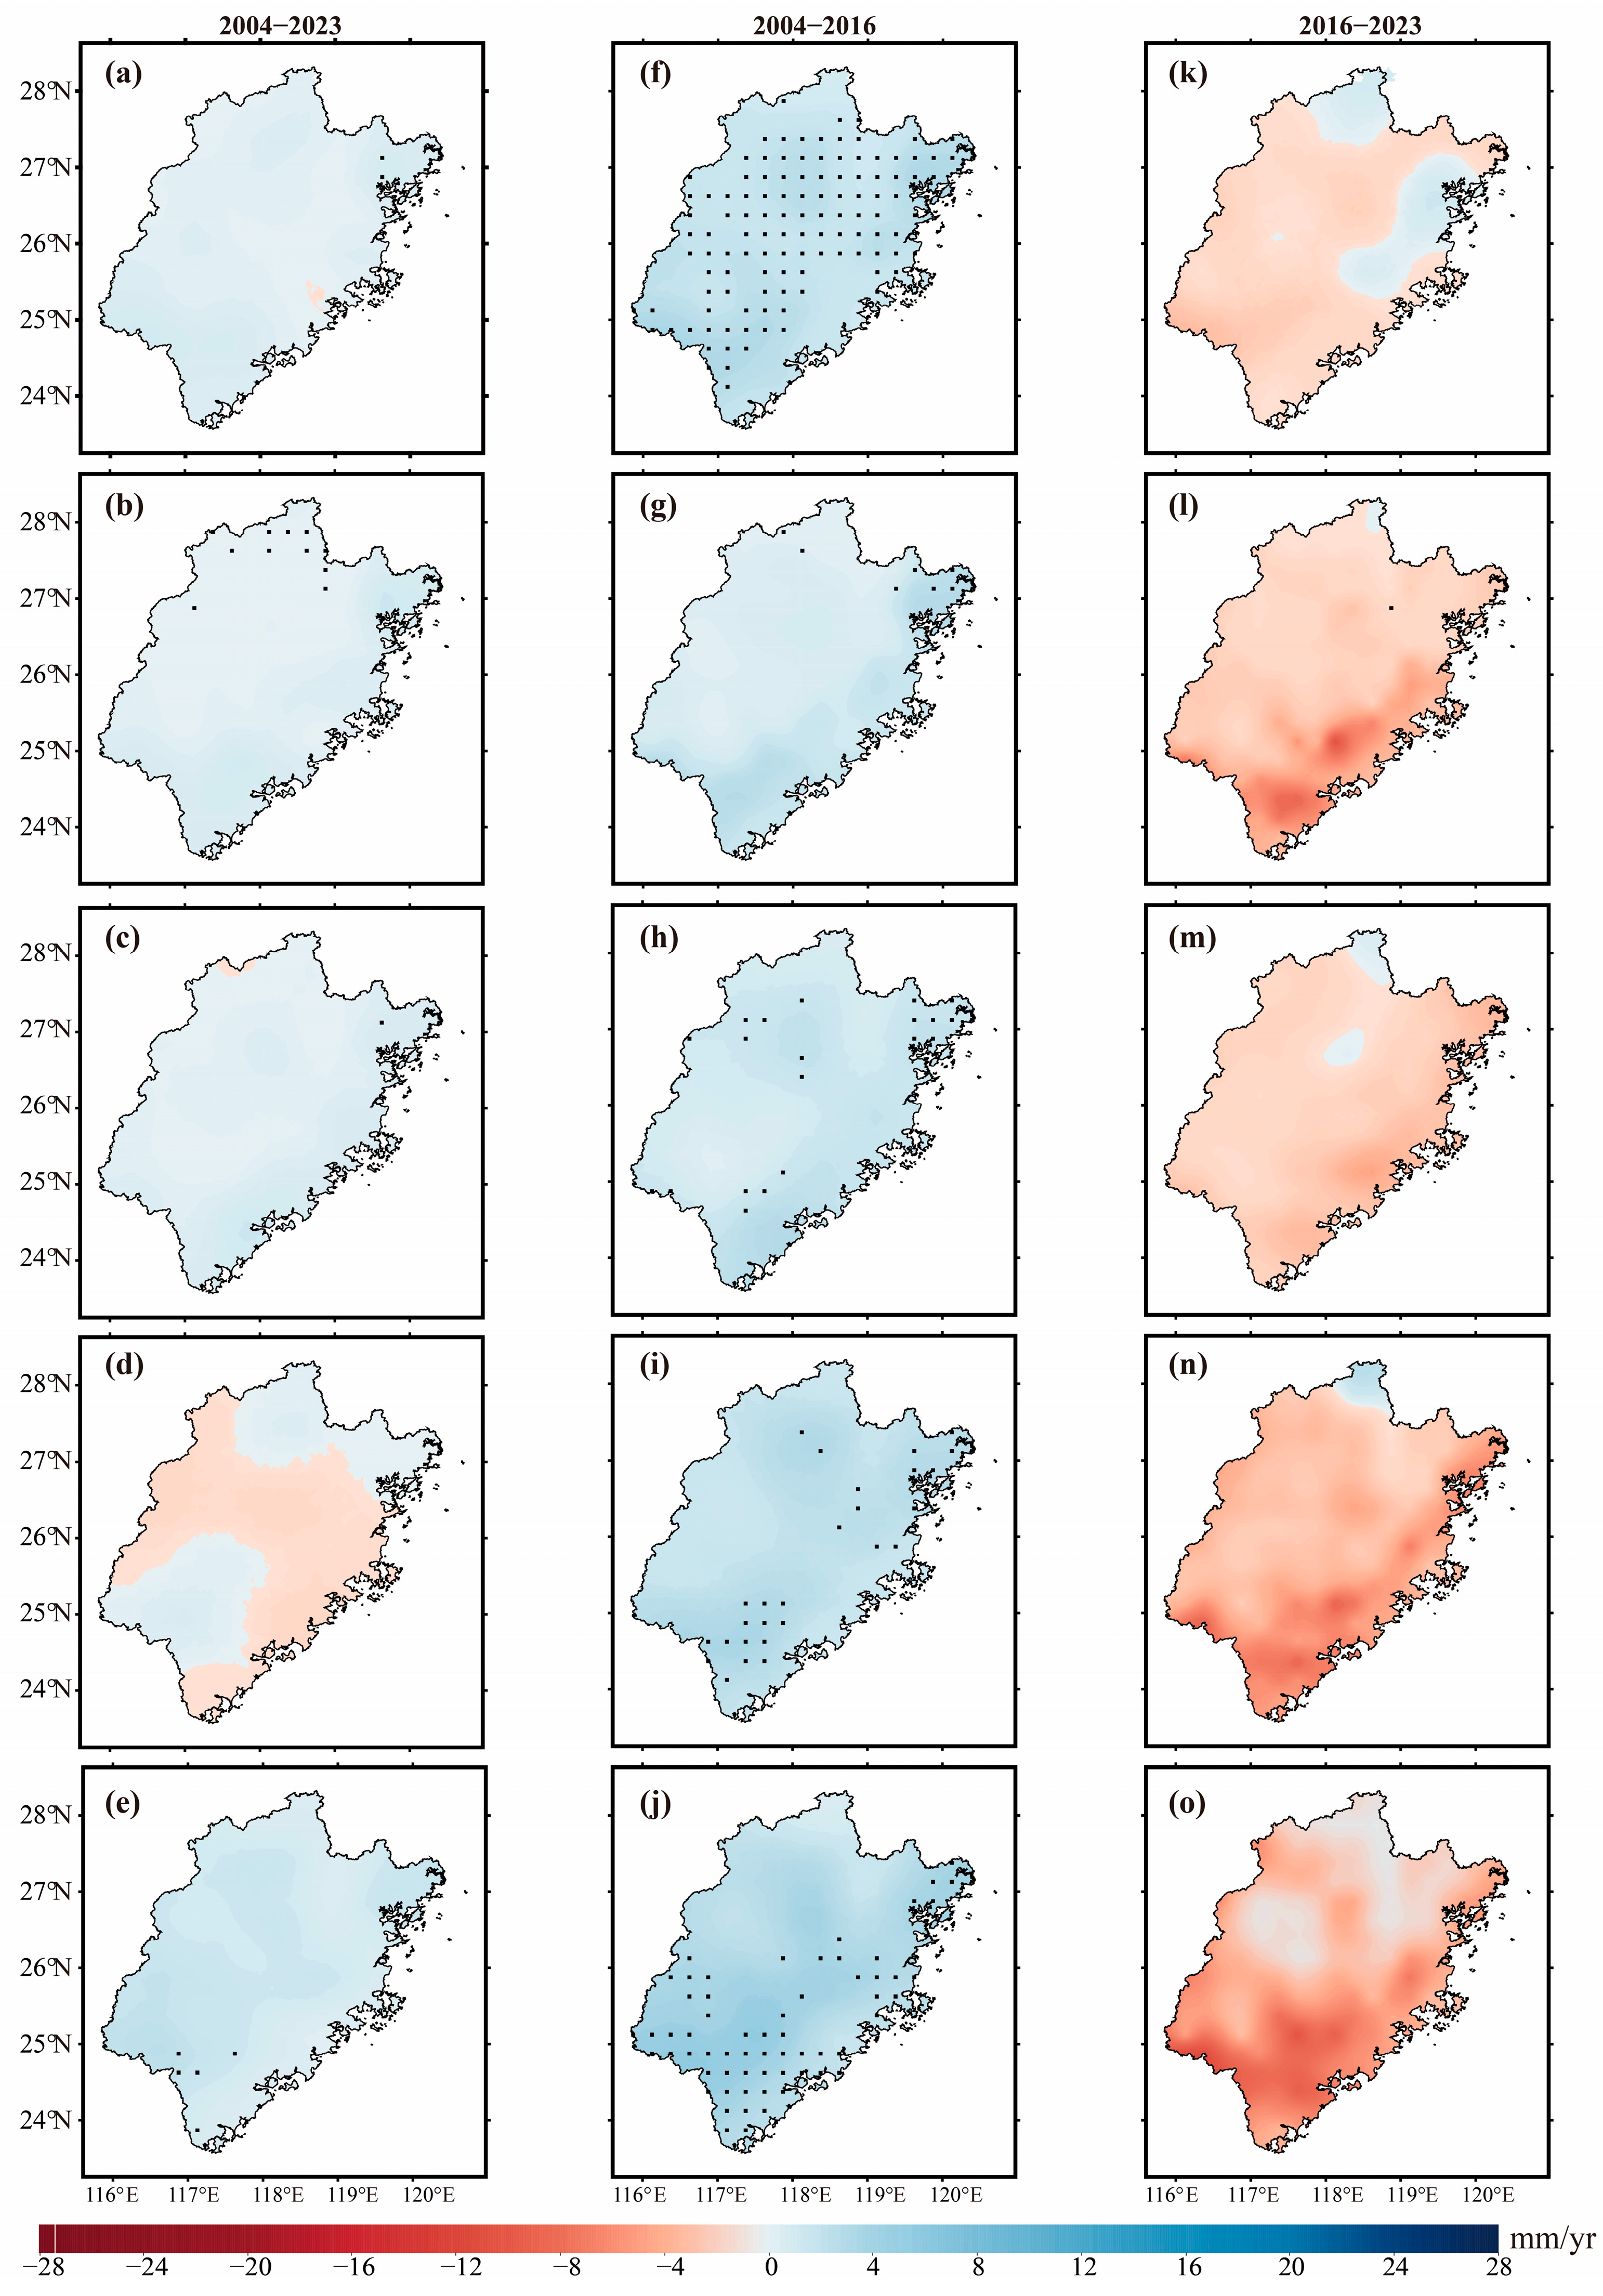
During the period from 2004 to 2023, most areas in Fujian Province exhibited an increasing trend in root-zone soil moisture. Specifically, at the interannual scale, the most pronounced increases occurred in the southern region, the northeastern coastal areas, and the northwestern part of the province (Figure 5a). At the seasonal scale, interannual variations in root-zone soil moisture were relatively modest across all four seasons (Figure 5b–e). Significant increases in spring were concentrated in the northwestern region, while no statistically significant changes were detected in summer. In winter, increases were primarily observed in the southwestern region. Notably, autumn exhibited a decreasing trend in parts of the southeastern coast, western areas, and central Fujian (Figure 5d).
Based on the results presented in Figure 4, root-zone soil moisture exhibited opposite trends during the two sub-periods of 2004–2016 and 2016–2023. Therefore, we further analyzed the spatial variation characteristics for these two timeframes. During the period from 2004 to 2016, root-zone soil moisture demonstrated a significant increasing trend across most parts of Fujian Province at the interannual scale (Figure 5f), with a rate of increase greater than that observed for the entire study period (2004–2023). At the seasonal scale, the increasing trend during spring was relatively modest (Figure 5g). In summer, the increase became more pronounced, with significant areas primarily located in the northwestern and southeastern regions (Figure 5h). The spatial distribution of changes in autumn was relatively balanced, with significantly increasing areas concentrated in the southern part of the province (Figure 5i). In winter, the most pronounced increases in root-zone soil moisture were mainly observed in the southern region of Fujian Province (Figure 5j).
During the period from 2016 to 2023, interannual variation results indicated a declining trend in root-zone soil moisture across most areas of Fujian Province (Figure 5k), with increasing trends observed only in parts of Nanping City and certain sections along the eastern coast. At the seasonal scale, the most substantial decrease in root-zone soil moisture during spring was observed in the southeastern region (Figure 5l). In summer, the declining trend was relatively modest across the province (Figure 5m). In autumn, more pronounced decreases were concentrated in the eastern and southern regions (Figure 5n). In winter, the downward trend was stronger than in the other three seasons (Figure 5o), with the southern region generally exhibiting a greater reduction than the northern region.

3.3. Analysis of the Relationship Between Root-Zone Soil Moisture and Vegetation Transpiration

3.3.1. Correlation Analysis at the Grid Scale

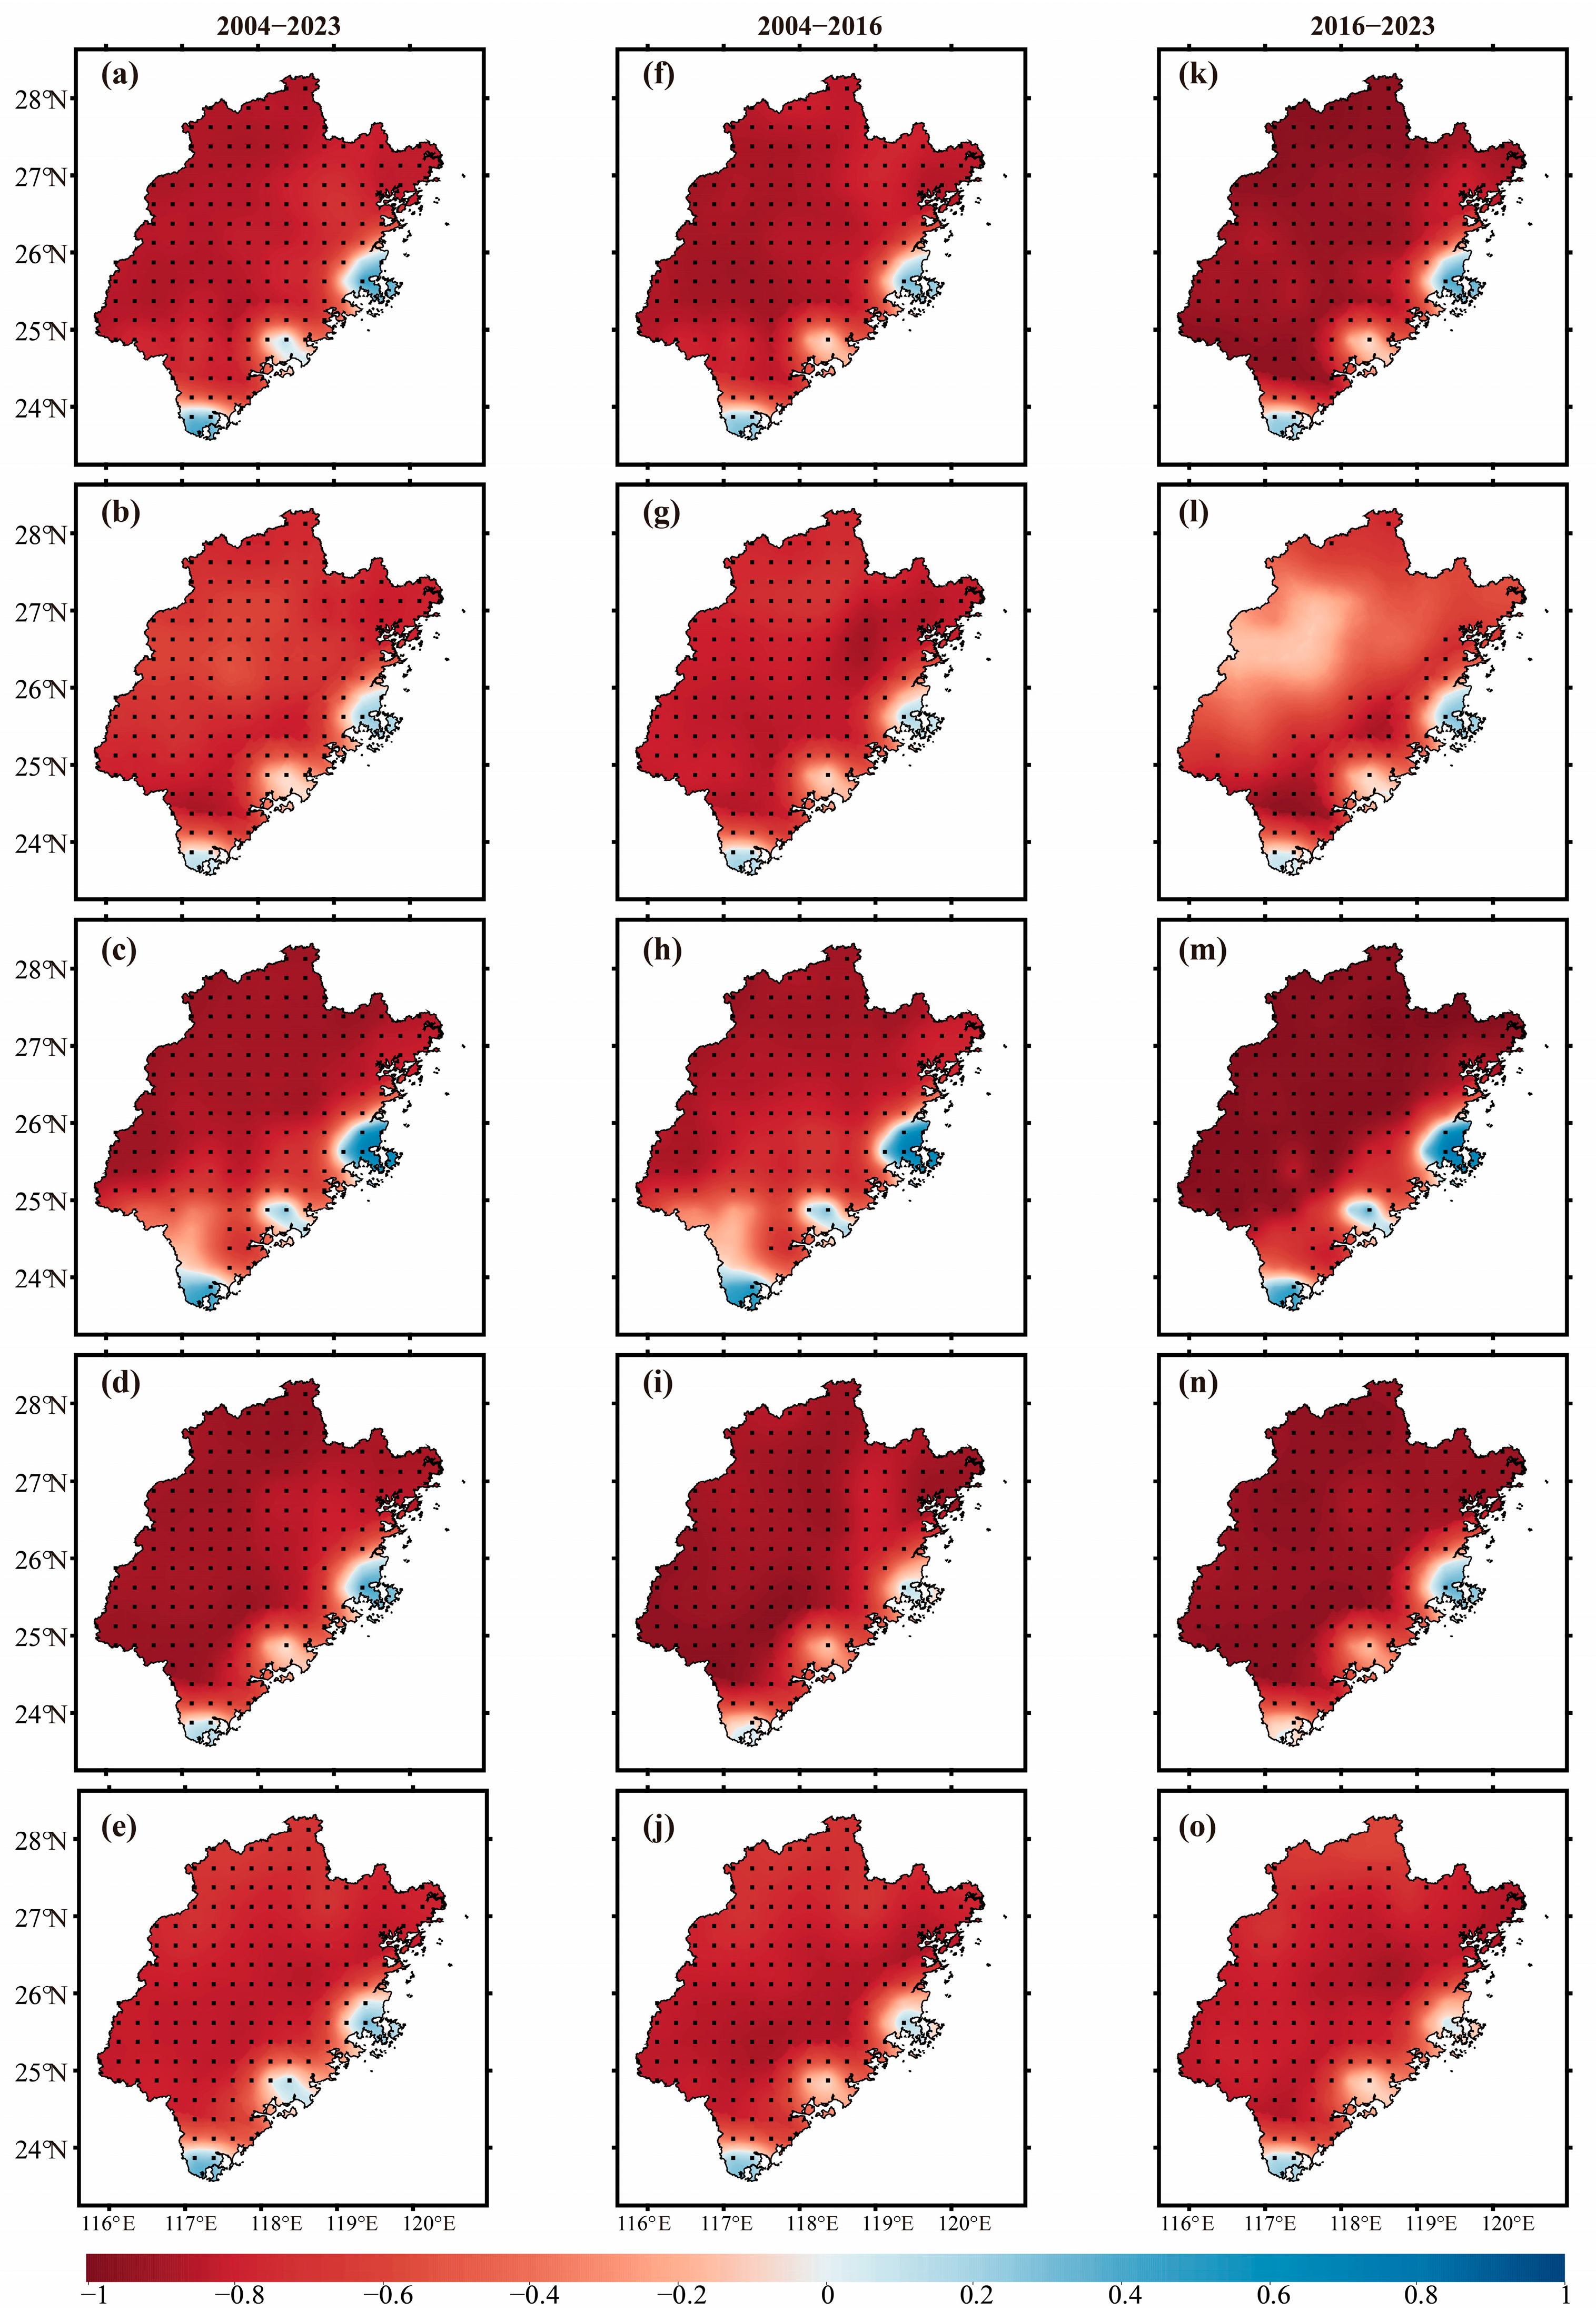
Correlation analyses of interannual and seasonal vegetation transpiration with root-zone soil moisture for the periods 2004–2023, 2004–2016, and 2016–2023 revealed that significant negative correlations predominated across most of the study area. The strength of this negative correlation was particularly pronounced during summer and autumn, with correlation coefficients predominantly ranging between −0.8 and −1.0 (Figure 6c,d,h,i,m,n). Notably, the negative correlation between vegetation transpiration and root-zone soil moisture during spring 2016–2023 was relatively weak compared to other periods and scales, with coefficients mostly between −0.2 and −0.4 (Figure 6l). Furthermore, significant correlations during this spring period were confined primarily to the eastern coastal and southern regions.
To further elucidate the relationship between vegetation transpiration and root-zone soil moisture, SVD analysis was employed to examine their coupled spatial patterns.
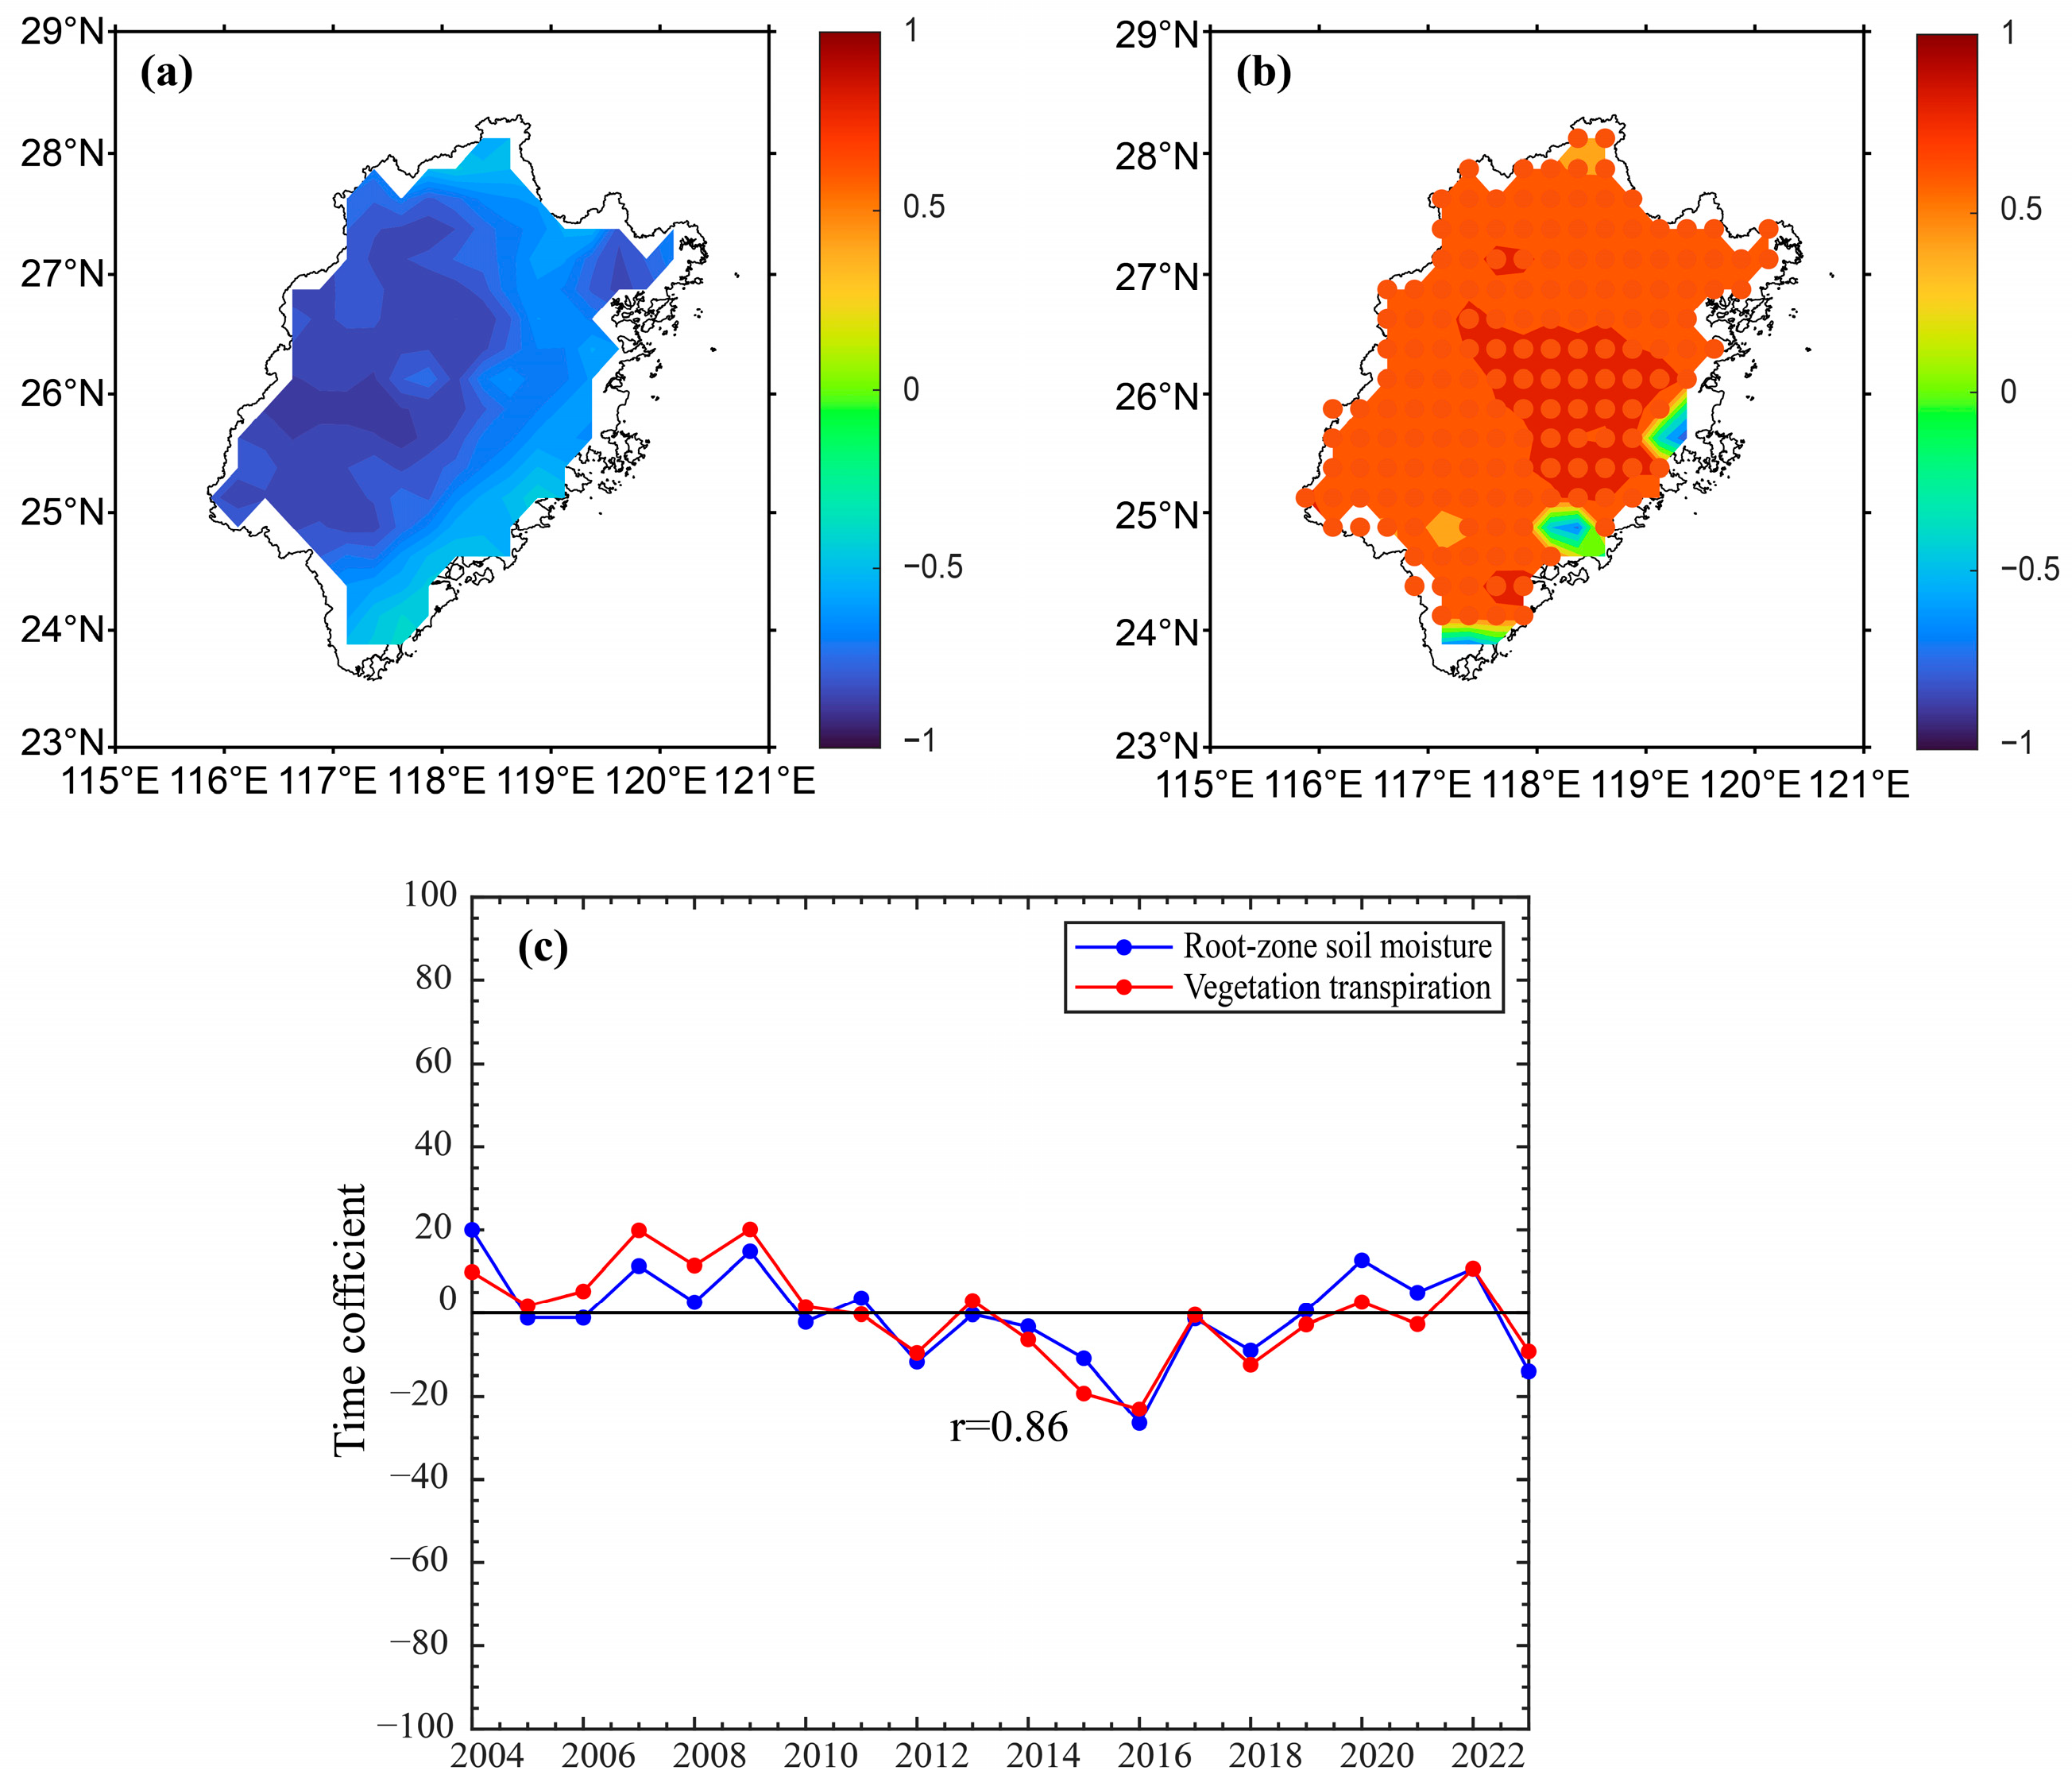
By designating the root-zone soil moisture field as the left field and the vegetation transpiration field as the right field, SVD was performed to analyze the spatiotemporal coupling characteristics between these two variables in Fujian Province. The first mode explained 96.21% of the squared covariance fraction, indicating that it captures the dominant coupled pattern between vegetation transpiration and root-zone soil moisture and that the two fields are strongly linked.
The results presented in Figure 7 show that the heterogeneous correlation map for the root-zone soil moisture field exhibited a predominantly negative pattern across the entire domain. Negative correlation centers with coefficients below −0.8 were identified in the central–western region and a smaller area in the northeast (Figure 7a). This negative correlation signifies a significant driving effect of vegetation transpiration on root-zone soil moisture, particularly in the central–western and northeastern parts of Fujian Province. Specifically, an increase (decrease) in vegetation transpiration corresponds to a decrease (increase) in root-zone soil moisture. This demonstrates the dominant role of vegetation transpiration as the primary process of soil water consumption in governing the distribution and dynamics of root-zone soil moisture in these regions. In contrast, the heterogeneous correlation map for the vegetation transpiration field displayed a predominantly positive pattern over most areas, except for scattered locations along the eastern coast, with the highest positive values concentrated in the central region (Figure 7b). This pattern suggests a potential feedback mechanism from root-zone soil moisture to vegetation transpiration in most areas: increased soil moisture may provide more favorable water conditions, leading to enhanced transpiration. However, given the conclusion that the overall negative correlation is predominant, this promoting effect may be constrained by additional factors such as stomatal conductance and climatic conditions, thereby enhancing the prominence of vegetation transpiration’s dominant role in soil moisture consumption within the overall coupling relationship.
The temporal correlation coefficient between the normalized expansion coefficients of the two fields for the first mode was 0.86 (Figure 7c), indicating a strong synchronous temporal evolution. Furthermore, the temporal coefficients for both fields exhibited a distinct shift around 2016, characterized by an initial decline followed by a subsequent increase, further underscoring the phased nature of their coupling relationship.

3.3.2. Time–Frequency Domain Correlation Analysis

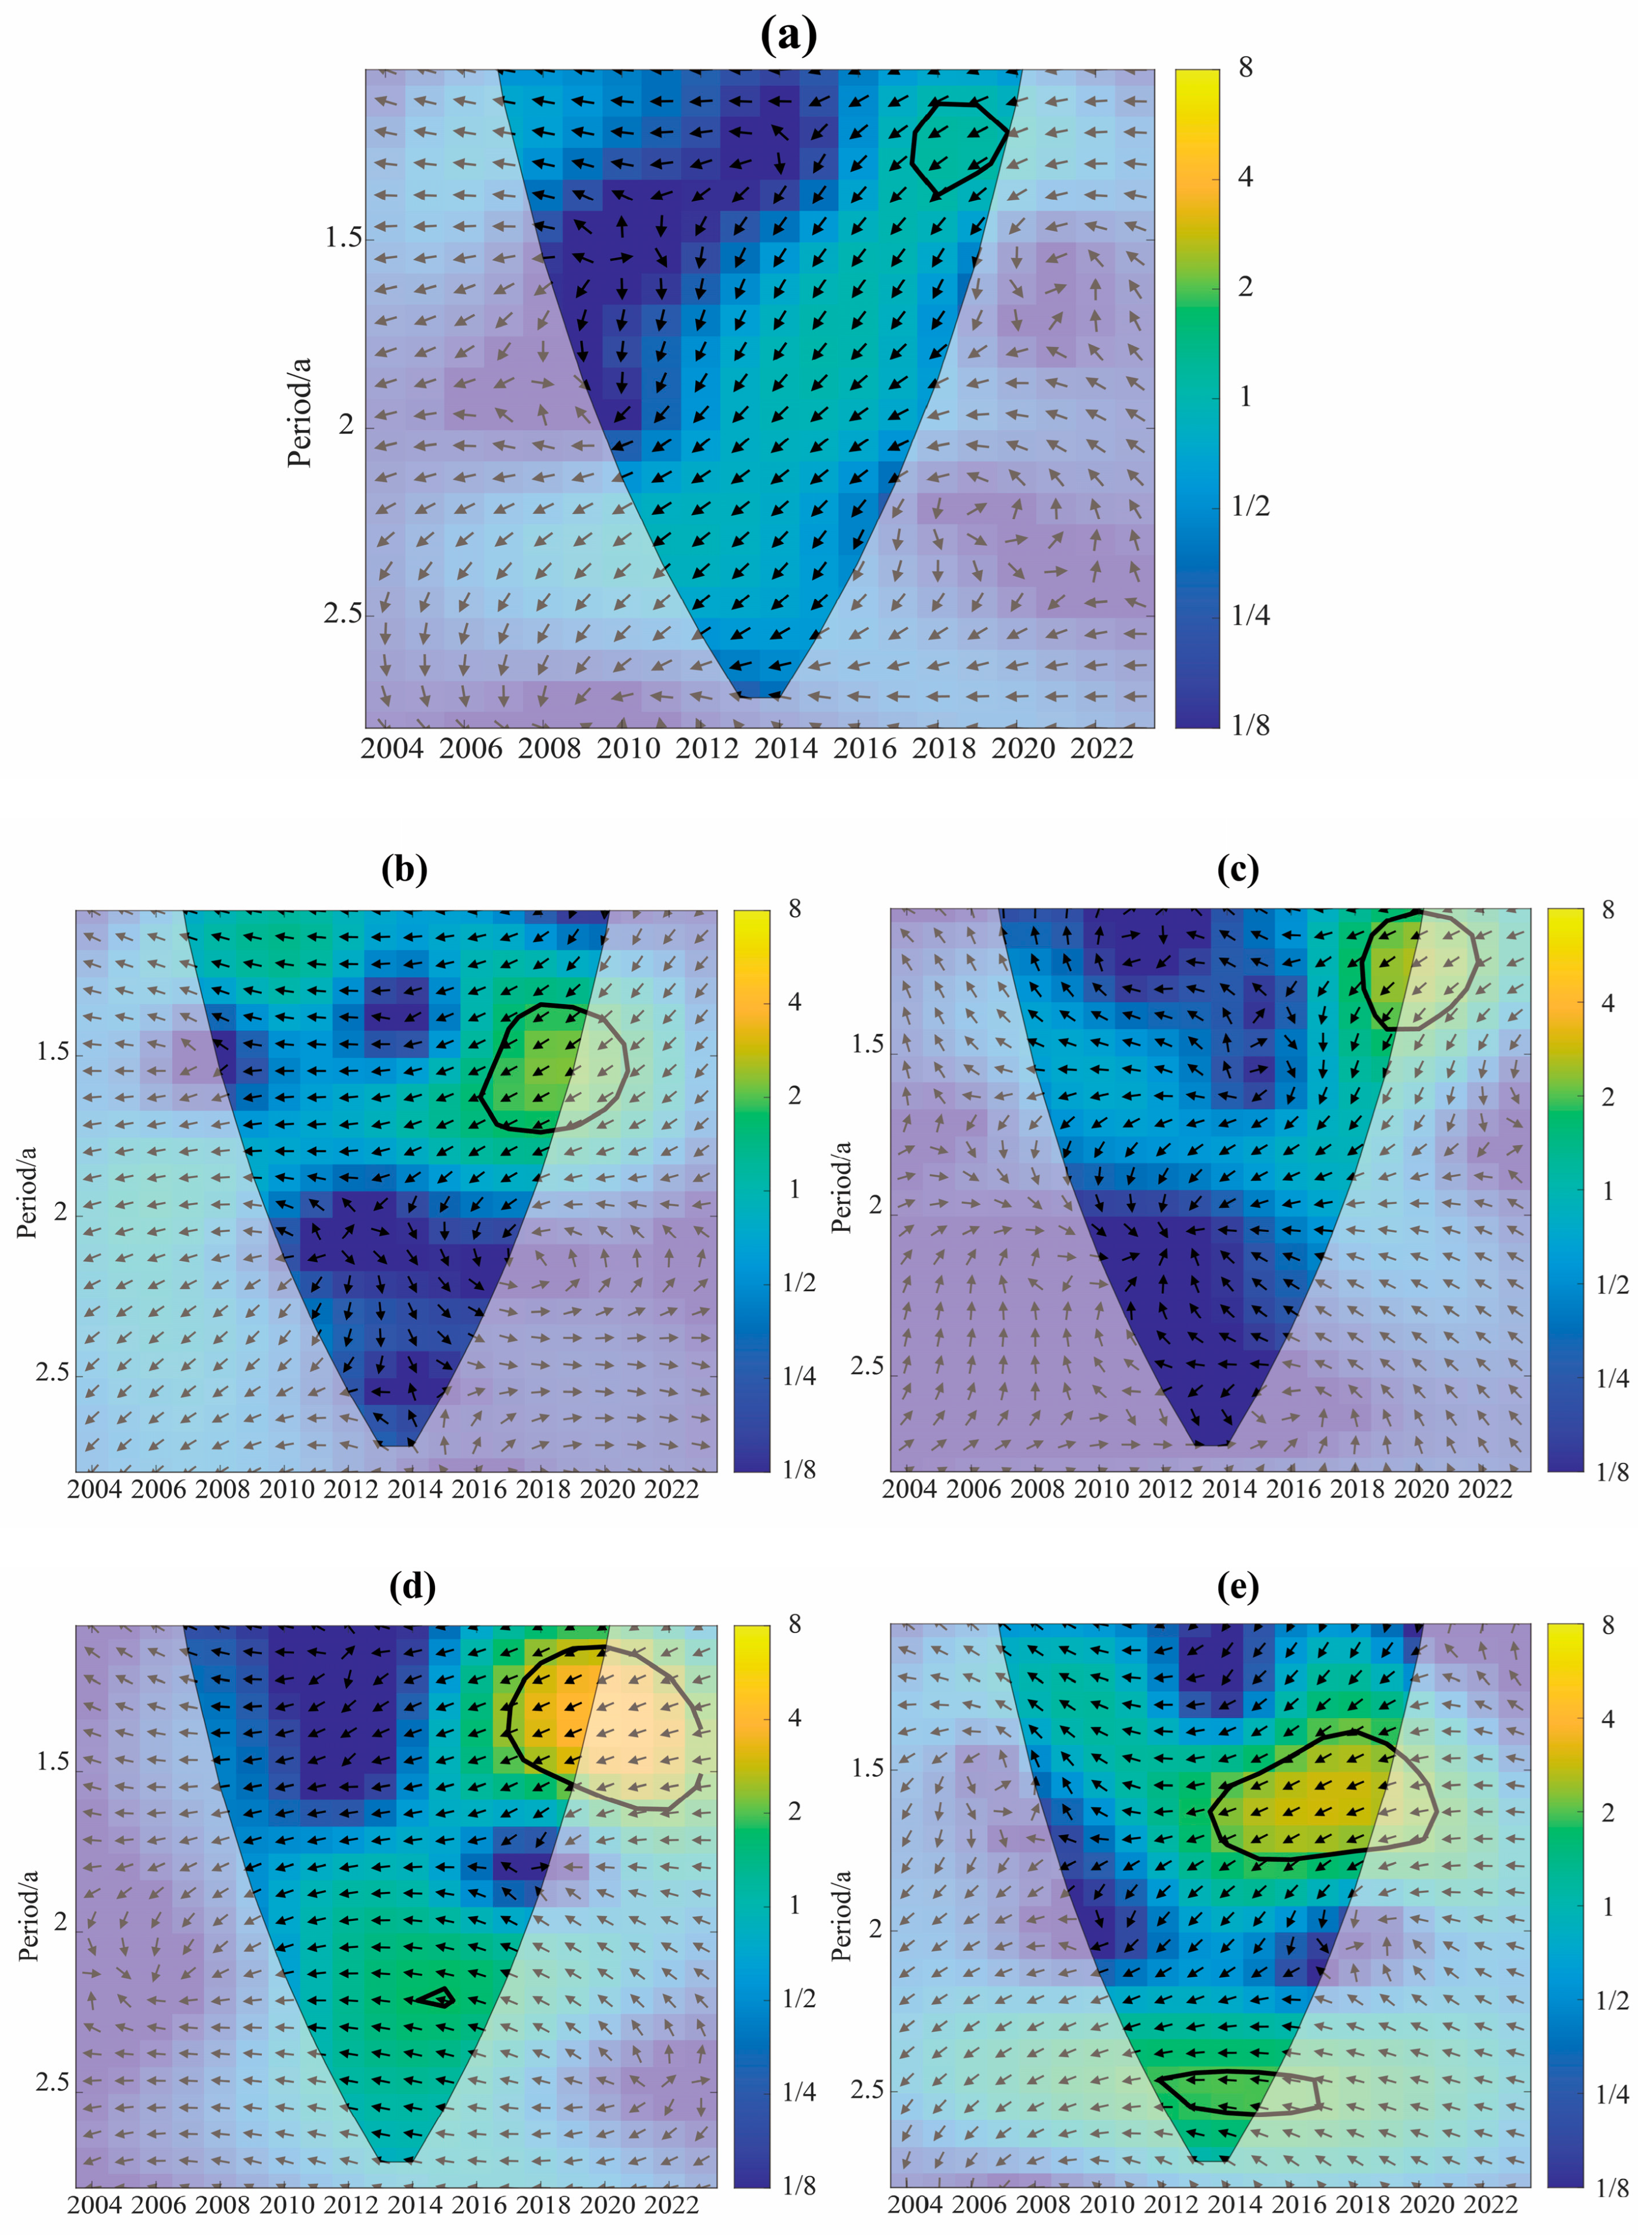
Based on the Morlet wavelet function, a cross-wavelet transform was performed on the seasonal and interannual time series of root-zone soil moisture and vegetation transpiration in Fujian Province to investigate the resonant periods and time-lag characteristics between these two variables. The results are shown in Figure 8.
From the annual perspective (Figure 8a), a significant coherency period in the high-energy band existed between vegetation transpiration and root-zone soil moisture, ranging from 1.13 to 1.38 years. The arrows within this period predominantly pointed toward the lower-left direction, indicating that during 2018–2020, vegetation transpiration in Fujian Province led to the changes in root-zone soil moisture, and the two variables exhibited a significant negative correlation. In spring (Figure 8b), vegetation transpiration and root-zone soil moisture exhibited a significant coherency period during 2016–2019, with a cycle ranging from 1.31 to 1.72 years. During this period, vegetation transpiration led to changes in root-zone soil moisture, and the two variables were significantly negatively correlated. In summer (Figure 8c), a significant negative correlation was observed during 2018–2020, with vegetation transpiration leading root-zone soil moisture and a coherency period of 1.04 to 1.46 years. In autumn (Figure 8d), two distinct coherency periods appeared in the high-energy band between vegetation transpiration and root-zone soil moisture, primarily dominated by the 2017–2020 period (1.13 to 1.54 years); arrows within this period predominantly pointed to the lower-left, indicating that vegetation transpiration preceded changes in root-zone soil moisture. In winter (Figure 8e), two significant coherency periods with negative correlations were identified in the high-energy band during 2012–2015 (2.46 to 2.55 years) and 2014–2019 (1.38 to 1.79 years), with arrows mostly pointing to the lower-left, further confirming that vegetation transpiration led to root-zone soil moisture variations. It is noteworthy that during the winter from 2007 to 2011, vegetation transpiration exhibited a lagged negative correlation with root-zone soil moisture. This phenomenon may be attributed to the generally lower temperatures and the occurrence of extreme cold events, such as snowstorms and cold waves, in Fujian Province during this period [54]. These low temperatures directly suppressed vegetation’s physiological activity, particularly stomatal conductance, which delayed the recovery of physiological functions until temperature conditions became favorable. Consequently, vegetation transpiration lagged behind changes in root-zone soil moisture [55,56].
Overall, vegetation transpiration and root-zone soil moisture exhibited multi-scale resonant cycles and time-lag effects in the time–frequency domain, reflecting a tightly coupled relationship. In Fujian Province, this relationship was predominantly negative, with vegetation transpiration exerting a stronger regulatory influence on root-zone soil moisture than the reverse. These results underscore the pivotal role of vegetation activity in driving soil moisture dynamics and emphasize the significance of transpiration as a primary pathway of soil water depletion.

4. Discussion

4.1. Limitation

This study elucidates the spatiotemporal coupling between vegetation transpiration and root-zone soil moisture; however, several limitations warrant consideration when interpreting the results.
First, the findings are contingent upon the accuracy of the GLDAS Catchment model. While data assimilation systems like GLDAS improve estimation, inherent uncertainties persist due to the parameterization of subsurface hydrological processes and vegetation dynamics [57]. The model’s spatial resolution (0.25°), though standard for large-scale studies, may inadequately represent the fine-scale heterogeneity of Fujian’s complex topography and diverse land cover, potentially obscuring local-scale interactions and introducing aggregation biases. Meanwhile, the validation of model-based trends is constrained by the absence of concurrent, high-resolution in situ measurements for soil moisture and transpiration across the province. This lack of ground-truth data prevents a direct quantification of model error and limits our ability to verify the precise magnitude of the estimated trends and correlations [58]. Furthermore, the methodological approaches, while robust, have inherent constraints. The Mann–Kendall test is sensitive to serial correlation, and the identified shift point around 2016, though supported by the data, should be rigorously tested against alternative breakpoint detection methods in future work [59]. Furthermore, the cross-wavelet transform, powerful for identifying transient relationships, can be influenced by edge effects and requires careful interpretation within the cone of influence. Finally, this analysis focused primarily on natural climatic drivers. We acknowledge that anthropogenic factors—such as afforestation practices, irrigation, and urban expansion—likely modulate the soil moisture–vegetation relationship. Isolating these anthropogenic impacts was beyond the scope of this study but represents a crucial avenue for future research.
Addressing these limitations would require a multi-model ensemble approach, higher-resolution remote sensing products, and dedicated field campaigns to ground-truth the model outputs, thereby strengthening the conclusions drawn from this regional assessment.

4.2. The Mechanism Behind Vegetation and Root-Zone Soil Moisture

Based on the analysis of the results, the coupling relationship between root-zone soil moisture and vegetation transpiration in Fujian Province from 2004 to 2023 exhibited significant spatiotemporal evolutionary characteristics. Time series analysis revealed a strong correlation between the two variables, although this correlation showed some temporal variability. Spatially, the central region consistently emerged as the core zone with the most pronounced coupling, characterized by a significant negative correlation. In contrast, only a few coastal areas displayed a weak positive association. Compared to the positive correlation between soil moisture and vegetation transpiration commonly reported in previous studies [15], the results of this study reveal a contrasting correlation. Analysis of Figure 2 and Figure 4 reveals that from 2004 to 2016, root-zone soil moisture exhibited an overall increasing trend, reaching a peak in 2016, whereas vegetation transpiration showed a decreasing trend, reaching a minimum in 2016. Previous studies have demonstrated that, in addition to root-zone soil moisture, factors such as solar radiation [60,61], temperature [62], saturated vapor pressure [63], and precipitation [64] also play significant roles in influencing vegetation transpiration. To explore the reasons behind the observed negative correlation between root-zone soil moisture and vegetation transpiration, the following section briefly discusses the potential influences of temperature, precipitation, and other related factors.
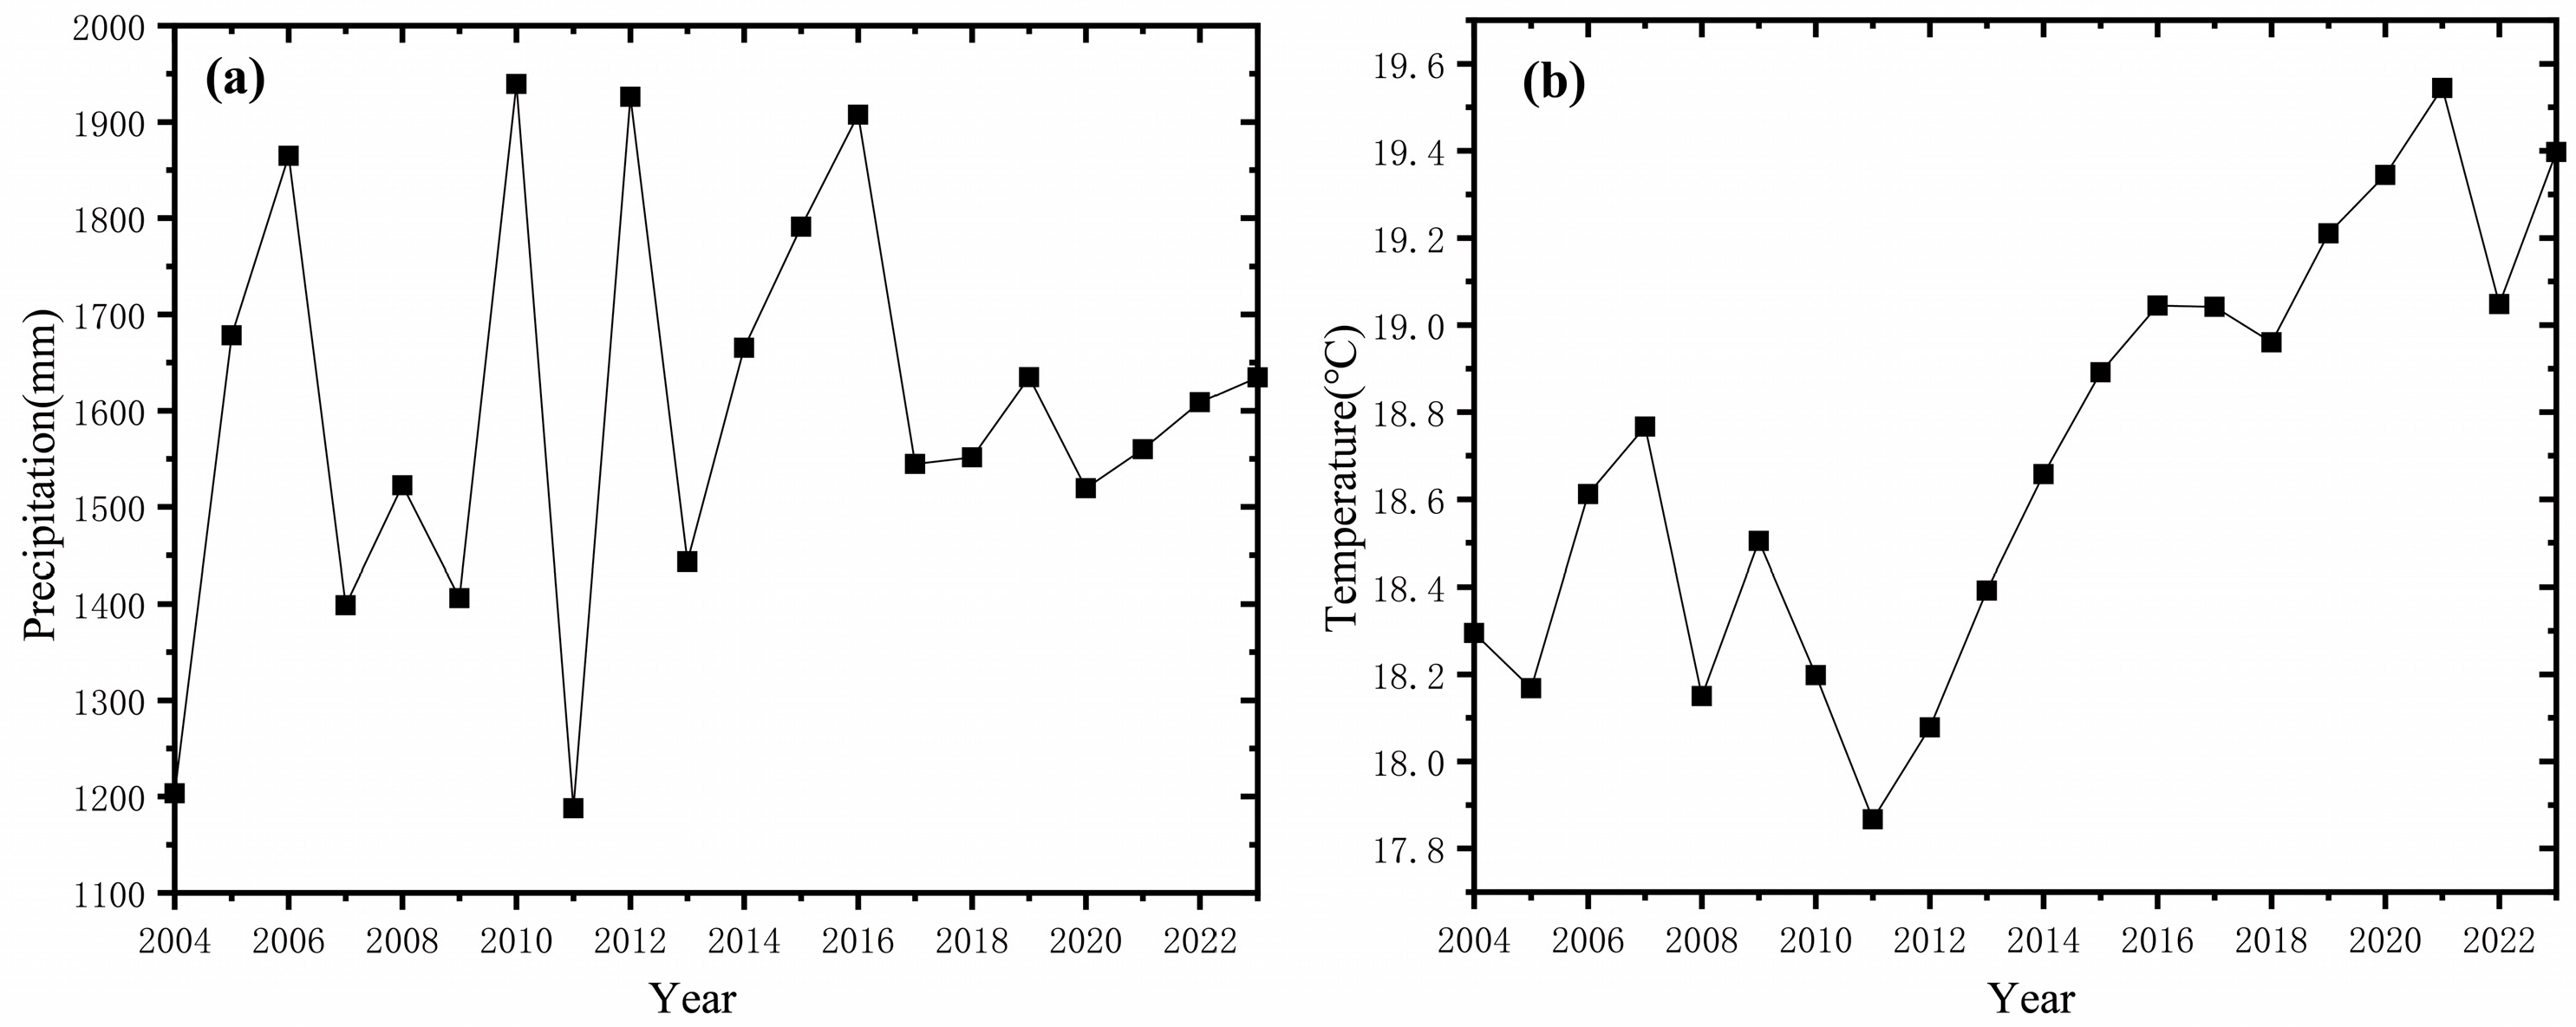
Even with root-zone soil moisture reaching its peak in 2016, the high spatial and temporal variability of precipitation (Figure 9a and Figure 10a–d) markedly diminished water use efficiency. The intense precipitation fluctuations frequently caused a superficial saturation of the soil profile. In this scenario, while surface moisture levels recovered quickly, the deeper root-zone water deficit remained uncorrected, thus failing to support a significant increase in vegetation transpiration [65]. When soil moisture surpasses field capacity, leading to supersaturation, water fills the soil pores and impedes oxygen diffusion. This condition can induce anaerobic respiration in plants, resulting in the accumulation of toxic compounds like acetaldehyde [66]. To mitigate water uptake demands and alleviate hypoxia stress, plants hormonally regulate stomatal closure, thereby directly suppressing transpiration. The observed decline in transpiration around 2016 and following the typhoon season in this study can be partially attributed to this physiological inhibition triggered by waterlogged soil. In the coastal areas of Fujian Province, localized waterlogging frequently occurs during the rainy and typhoon seasons. This makes vegetation stomatal conductance highly sensitive to soil moisture and oxygen status, characterizing a physiologically active down-regulation of transpiration rather than a passive limitation by water supply.
Moreover, in the context of global warming, the annual average temperature in Fujian Province has been rising steadily (Figure 9b). The super El Niño event from 2014 to 2016 altered atmospheric circulation patterns, resulting in elevated temperatures across Fujian [67,68]. The increased temperature caused a significant rise in vapor pressure deficit (VPD), prompting dominant tree species such as Masson pine to activate stomatal closure mechanisms to reduce transpiration [17]. In the summer of 2016, Fujian experienced frequent extreme precipitation events. Typhoon Nepartak brought unprecedented localized rainfall. The resulting overcast and rainy conditions significantly weakened solar radiation, leading to reduced stomatal conductance and markedly lower transpiration rates than those observed in years with below-average precipitation [69]. Overall, this unique “warm–wet” climate combination in Fujian partially reduced the transpiration pull of plant leaves, weakening the driving force of vegetation transpiration and causing anomalies [70,71]. As the province with the highest forest coverage rate in China [21], Fujian’s particular vegetation structure also influences vegetation transpiration. The province boasts rich forest resources, with notable heterogeneity in tree species composition and spatial distribution. In the northwestern mountainous regions, such as the Wuyi Mountains, the dominant vegetation consists of well-preserved, old-growth natural evergreen broadleaved forests and mixed coniferous–broadleaved forests [72]. However, at the provincial scale, the forest landscape is predominantly characterized by extensive coniferous plantations, with Masson pine and Chinese fir as the key species [73,74], widely distributed across the vast hilly and mountainous areas of central, western, and northern Fujian [75]. Since the 12th Five-Year Plan, the continuous advancement of plantation forestry has further consolidated the dominance of coniferous species like Masson pine, resulting in a relatively simplified species composition pattern [76]. It is precisely this vegetation background, fundamentally shaped by coniferous forests, that regulates the regional transpiration dynamics: the inherent physiological characteristics of coniferous tree species, such as small leaf surface area and low stomatal density [77], determine their limitations in water absorption and transport capacity, consequently leading to a relatively weak overall transpiration rate for the region. The “Forest Quality Precision Enhancement Project” implemented after 2021 focuses precisely on optimizing the structure within this coniferous forest matrix. By increasing the proportion of broadleaved tree species, canopy closure and root system interpenetration are enhanced, thereby improving vegetation transpiration efficiency to a certain extent [78,79,80]. Therefore, the spatiotemporal dynamics of vegetation transpiration in Fujian Province are essentially the result of the combined effects of natural physiology and human intervention within the framework dominated by coniferous forests. Since the 12th Five-Year Plan, Fujian has placed greater emphasis on the establishment of plantations, which predominantly consist of coniferous species such as Masson pine, characterized by relatively homogeneous species composition. These species differ in leaf morphology and physiological traits from natural forests; conifer needles have smaller surface areas and lower stomatal densities, limiting water uptake and transport capacities and resulting in comparatively weaker transpiration. After 2021, with the implementation of the “Fujian Province Forest Quality Precision Improvement Project,” forest resources further increased, and the proportion of broadleaf species rose, enhancing canopy closure and root interpenetration, thereby improving vegetation transpiration efficiency. Concurrently, effective pest and disease control measures against threats such as the pine wilt nematode slowed the expansion of degraded forests and gradually restored the transpiration function of dying stands, promoting a gradual increase in vegetation transpiration.

4.3. Practical Implications

The findings of this study offer significant insights for eco-hydrological management and climate adaptation strategies in subtropical humid zones. Given the persistently high forest coverage in Fujian Province [81], vegetation transpiration has emerged as a critical process governing root-zone soil moisture dynamics. To safeguard regional ecological and hydrological security, forest management practices should prioritize the optimization of tree species composition and spatial configuration. This is particularly crucial in regions where transpiration exhibits strong negative water feedback, such as central–western and northeastern Fujian. In these areas, priority should be given to deep-rooted native broadleaved species with higher transpiration efficiency. This approach can enhance the resilience of plant community water use and mitigate soil desiccation caused by excessive water consumption in monoculture coniferous forests.
Furthermore, leveraging the lead time of approximately 1–2 years in which vegetation transpiration signals precede soil moisture changes, an early-warning mechanism for eco-hydrological risks can be established. This system, integrating remote sensing data and land surface models, would provide a proactive basis for seasonal drought mitigation and the scheduling of ecological water use.
Against a backdrop of a “warm and humid” climate paradigm and increasing frequency of extreme weather events [82], water resource assessments must adopt a multi-factor approach. Coordinated evaluation of temperature, precipitation, and vapor pressure deficit (VPD) is essential to prevent misestimation of hydrological responses, which can occur if the suppressive effects of these climatic factors on vegetation transpiration are overlooked.
In conclusion, by elucidating the coupling mechanisms between vegetation transpiration and soil moisture and identifying their dominant driving directions, this research provides a scientific foundation for delineating ecological restoration priorities, implementing precise forest quality improvement measures, and developing high-resolution eco-hydrological models in Fujian Province. This will ultimately strengthen the adaptive capacity of regional ecosystems to climate change.

5. Conclusions

During the period from 2004 to 2023, a significant negative correlation was observed between vegetation transpiration and root-zone soil moisture in Fujian Province, which was particularly pronounced in summer and autumn. Vegetation transpiration exhibited a temporal pattern of decreasing before 2016 and increasing thereafter, while root-zone soil moisture showed the opposite trend—an increase before 2016 followed by a decrease.
This negative correlation is primarily attributed to the driving effect of vegetation transpiration on root-zone soil moisture; that is, changes in root-zone soil moisture had no significant feedback on transpiration dynamics. For instance, in the central–western and northeastern regions of Fujian, an increase (or decrease) in vegetation transpiration corresponded to a decrease (or increase) in root-zone soil moisture.
Furthermore, vegetation transpiration and root-zone soil moisture exhibited a resonance cycle of approximately 1–2 years, and vegetation transpiration was found to lead to changes in soil moisture, reflecting its dominant role in driving soil moisture depletion through water consumption in the root zone.

Author Contributions

Conceptualization, Y.X. and H.D.; data curation, Y.X.; formal analysis, Y.X., Y.W., D.H., X.C., and H.D.; investigation, Y.X. and H.D.; project administration, Y.X., X.C., and H.D.; software, Y.X.; supervision, X.C. and H.D.; validation, Y.X.; visualization, Y.X.; writing—original draft, Y.X., Y.W., and D.H.; writing—review and editing, X.C. and H.D. All authors will be updated at each stage of manuscript processing, including submission, revision, and revision reminder, via emails from our system or the assigned Assistant Editor. All authors have read and agreed to the published version of the manuscript.

Funding

This research was funded by the Projects for National Natural Science Foundation of China (U22A20554 and 42471038), Water Conservancy Science and Technology Project of Fujian, China (MSK202436) and the Natural Science Foundation of Fujian Province (2023J01285).

Institutional Review Board Statement

Not applicable.

Informed Consent Statement

Not applicable.

Data Availability Statement

The original contributions presented in this study are included in the article. Further inquiries can be directed to the corresponding author.

Acknowledgments

We are grateful for the data support provided by the National Tibetan Plateau Data Center, the Goddard Space Flight Center (GSFC), and the National Centers for Environmental Prediction (NCEP), which provided the GLDAS Catchment data. The authors appreciate the comments and encouragement provided by the reviewers, editor, and associate editor.

Conflicts of Interest

The authors declare no conflicts of interest.

References

  1. Xu, X.; Li, Y.; Tan, Z.; Zhang, Q. Water fluxes in the groundwater-soil-plant-atmosphere continuum and water sources of typical wetland vegetation communities in Poyang Lake. J. Lake Sci. 2018, 30, 1351–1367. [Google Scholar]
  2. Angelini, I.M.; Garstang, M.; Davis, R.E.; Hayden, B.; Fitzjarrald, D.R.; Legates, D.R.; Greco, S.; Macko, S.; Connors, V. On the coupling between vegetation and the atmosphere. Theor. Appl. Climatol. 2011, 105, 243–261. [Google Scholar] [CrossRef]
  3. Dubbert, M.; Werner, C. Water fluxes mediated by vegetation: Emerging isotopic insights at the soil and atmosphere interfaces. New Phytol. 2018, 221, 1754–1763. [Google Scholar] [CrossRef]
  4. Hong, S.; Deng, H.; Zheng, Z.; Deng, Y.; Chen, X.; Gao, L.; Chen, Y.; Liu, M. The influence of variations in actual evapotranspiration on drought in China’s Southeast River basin. Sci. Rep. 2023, 13, 21336. [Google Scholar] [CrossRef]
  5. Robock, A.; Vinnikov, K.Y.; Srinivasan, G.; Entin, J.K.; Hollinger, S.E.; Speranskaya, N.A.; Liu, S.X.; Namkhai, A. The Global Soil Moisture Data Bank. Bull. Am. Meteorol. Soc. 2000, 81, 1281–1299. [Google Scholar] [CrossRef]
  6. Gao, H.K.; Hrachowitz, M.; Wang-Erlandsson, L.; Fenicia, F.; Xi, Q.J.; Xia, J.Y.; Shao, W.; Sun, G.; Savenije, H.H.G. Root zone in the Earth system. Hydrol. Earth Syst. Sci. 2024, 28, 4477–4499. [Google Scholar] [CrossRef]
  7. Mahmood, T.; Xie, Z.H.; Jia, B.H.; Habib, A.; Mahmood, R. A Soil Moisture Data Assimilation System for Pakistan Using PODEn4DVar and CLM4.5. J. Meteorol. Res. 2019, 33, 1182–1193. [Google Scholar] [CrossRef]
  8. Fuentes, I.; Padaran, J.; Vervoort, S.W. Towards near real-time national-scale soil water content monitoring using data fusion as a downscaling alternative. J. Hydrol. 2022, 609, 127705. [Google Scholar] [CrossRef]
  9. Liang, Y.; Zhang, F.; Wang, X.-W.; Zhao, J.-H. The Variations of Soil Water of Wheat Field and Its Relation to Precipitation in Loess Plateau Mesa Region. Chin. J. Soil Sci. 2012, 43, 20–24. [Google Scholar] [CrossRef]
  10. Liu, J.; Liu, L.; Yang, B.; Luo, Y.; Bai, L.; Lu, H.; Song, L. Spatial-temporal pattern of soil water content and its response to precipitation in a tropical seasonal rainforest in Xishuangbanna. Chin. J. Ecol. 2024, 43, 3341–3349. [Google Scholar] [CrossRef]
  11. Granier, A.; Loustau, D.; Bréda, N. A generic model of forest canopy conductance dependent on climate, soil water availability and leaf area index. Ann. For. Sci. 2000, 57, 755–765. [Google Scholar] [CrossRef]
  12. Bai, Y.; Zhu, G.F.; Su, Y.H.; Zhang, K.; Han, T.; Ma, J.Z.; Wang, W.Z.; Ma, T.; Feng, L.L. Hysteresis loops between canopy conductance of grapevines and meteorological variables in an oasis ecosystem. Agric. For. Meteorol. 2015, 214, 319–327. [Google Scholar] [CrossRef]
  13. Zhang, M.; Zhang, L.; Chen, Z.; Zhang, X.; Zhao, L.; Li, Q.; Tang, Y.; Gu, S. Effects of evaporation and transpiration on evapotranspiration of degrade meadow in the Three-River Source Region. Acta Ecol. Sin. 2021, 41, 7138–7152. [Google Scholar] [CrossRef]
  14. Ren, X.; Lu, Q.; He, H.; Zhang, L.; Niu, Z. Spatio-temporal variations of the ratio of transpiration to evapotranspiration in forest ecosystems along the North-South Transect of Eastern China. Acta Geogr. Sin. 2019, 74, 63–75. [Google Scholar] [CrossRef]
  15. Jin, J.; Cai, Y.; Guo, X.; Wang, L.; Wang, Y.; Liu, Y. Decoupled driving forces of variabilities of transpiration in Chinese subtropical vegetation based on remote sensing data. Acta Geogr. Sin. 2023, 78, 1779–1791. [Google Scholar] [CrossRef]
  16. Yu, J.-H.; Wang, W.-G.; Chen, Z.-F. Influences of vapor pressure deficit and root⁃zone soil moisture changes on vegetation productivity and its causes across global drylands. Acta Ecol. Sin. 2024, 44, 4808–4819. [Google Scholar] [CrossRef]
  17. Yang, Y.-F.; Zhou, H.-F.; Xu, L.-G. Dynamic variations of soil moisture in Haloxylon ammodendron root zone in Gurbantunggut Desert. Chin. J. Appl. Ecol. 2011, 22, 1711–1716. [Google Scholar] [CrossRef]
  18. Zhu, H.; Hu, S.; Liu, X.; Li, H.; Li, Y. Spatio-temporal variations of soil moisture in the root zone of Haloxylon ammodendron at different life stages. Acta Ecol. Sin. 2017, 37, 860–867. [Google Scholar] [CrossRef]
  19. Zhang, K.-H.; Hu, G.-L.; Zhang, Y.-J.; Fang, Q. Distribution Characteristics and Influencing Factors of Soil Water Content in the Root Zone of Haloxylon ammodendron in Desert-oasis Ecotone in the Middle Reaches of the Heihe River. J. Northwest For. Univ. 2019, 34, 16–25. [Google Scholar] [CrossRef]
  20. Wu, R.; Wang, Z.; Meng, F.; Liu, Y.; Shi, H. Strengthening Coupling Between Vegetation and Soil-Atmosphere Compound Drought over the Past Two Decades. Earth’s Future 2025, 13, e2025EF006311. [Google Scholar] [CrossRef]
  21. Chen, M.; Hong, X.; Peng, Q.; Lin, W.; Su, K. Agricultural carbon footprint evaluation and its influencing factors based on grid search-random forest algorithm: Taking Fujian Province as an example. Acta Ecol. Sin. 2025, 14, 45. [Google Scholar] [CrossRef]
  22. He, W.; Chen, X.; Zhang, Y.; Duan, W.; Deng, H. Spatio-temporal variations of compound precipitation and wind-speed extreme events in Fujian and Jiangxi Provinces, Southeast China. Meteorol. Atmos. Phys. 2024, 137, 7. [Google Scholar] [CrossRef]
  23. Wei, L.; Sun, X.; Dong, J.; Gao, M.; Pan, J.; Shan, G.; Liu, S. Spatiotemporal trends of actual evapotranspiration and evaluation of multi-source evapotranspiration products in China’s exorheic basins. Adv. Water Sci. 2025, 36, 383–396. [Google Scholar] [CrossRef]
  24. Tong, K.; Ju, Q.; Zhao, Y.; Hu, B. Assessment of actual evapotranspiration in the Xijiang River Basin based on water balance. Geogr. Sci. 2025, 45, 910–918. [Google Scholar] [CrossRef]
  25. Puma, M.J.; Mitchell, K.; Dirmeyer, P.A.; Yang, R.; Guo, Z.; Koster, R.D. On the Nature of Soil Moisture in Land Surface Models. J. Clim. 2009, 22, 4322–4335. [Google Scholar] [CrossRef]
  26. Pan, Z.; Wang, K.; Sheng, Z.; Xu, X.; Zhou, Y.; Wang, G.; Tian, W. Comparing multi-source runoff data in different watersheds across China. Geogr. Res. 2024, 43, 1004–1017. [Google Scholar] [CrossRef]
  27. Deng, H.; Lu, Y.; Wang, Y.; Chen, X.; Liu, Q. Assessment of Actual Evapotranspiration in the Minjiang River Basin Based on the GLDAS-Noah Model. Geogr. Sci. 2022, 42, 548–556. [Google Scholar] [CrossRef]
  28. Lu, Y.; Wang, Y.; Liu, Q.; Chen, X.; Zhang, Y.; Gao, L.; Chen, Y.; Liu, M.; Deng, H. Evapotranspiration Variations of the Minjiang River Basin in Southeastern China from 2000 to 2019. Atmosphere 2022, 13, 562. [Google Scholar] [CrossRef]
  29. Vargas, R.; Detto, M.; Baldocchi, D.D.; Allen, M.F. Multiscale analysis of temporal variability of soil CO2 production as influenced by weather and vegetation. Glob. Change Biol. 2010, 16, 1589–1605. [Google Scholar] [CrossRef]
  30. Gao, W.; Li, B.L. Wavelet analysis of coherent structures at the atmosphere-forest interface. J. Appl. Meteorol. Climatol. 1993, 32, 1717–1725. [Google Scholar] [CrossRef]
  31. Grinsted, A.; Moore, J.C.; Jevrejeva, S. Application of the cross wavelet transform and wavelet coherence to geophysical time series. Nonlinear Process. Geophys. 2004, 11, 561–566. [Google Scholar] [CrossRef]
  32. Liu, Q.; Hao, Y.; Stebler, E.; Tanaka, N.; Zou, C.B. Impact of Plant Functional Types on Coherence Between Precipitation and Soil Moisture: A Wavelet Analysis. Geophys. Res. Lett. 2017, 44, 12,197–12,207. [Google Scholar] [CrossRef]
  33. Rocha, A.V.; Armesto, J.J.; Perez-Quezada, J.F.; Blakely, B.; Sharma, P.; Gaxiola, A. Atmosphere, Vegetation, and Soil Water Coupling Determined by Stomatal Regulation of Transpiration. Ecosystems 2025, 28, 38. [Google Scholar] [CrossRef]
  34. Stoy, P.C.; Dietze, M.C.; Richardson, A.D.; Vargas, R.; Barr, A.G.; Anderson, R.S.; Arain, M.A.; Baker, I.T.; Black, T.A.; Chen, J.M.; et al. Evaluating the agreement between measurements and models of net ecosystem exchange at different times and timescales using wavelet coherence: An example using data from the North American Carbon Program Site-Level Interim Synthesis. Biogeosciences 2013, 10, 6893–6909. [Google Scholar] [CrossRef]
  35. Seneviratne, S.I.; Corti, T.; Davin, E.L.; Hirschi, M.; Jaeger, E.B.; Lehner, I.; Orlowsky, B.; Teuling, A.J. Investigating soil moisture–climate interactions in a changing climate a review. Earth-Sci. Rev. 2010, 99, 125–161. [Google Scholar] [CrossRef]
  36. Teuling, A.J.; Hirschi, M.; Ohmura, A.; Wild, M.; Reichstein, M.; Ciais, P.; Buchmann, N.; Ammann, C.; Montagnani, L.; Richardson, A.D.; et al. A regional perspective on trends in continental evaporation. Geophys. Res. Lett. 2009, 36, L02404. [Google Scholar] [CrossRef]
  37. Saleem, J.A.; Salvucci, G.D. Comparison of soil wetness indices for inducing functional similarity of hydrologic response across sites in Illinois. J. Hydrometeorol. 2002, 3, 80–91. [Google Scholar] [CrossRef]
  38. Badakhshan, E.; Vaunat, J. A Specialized Boundary Condition for Soil–Vegetation–Atmosphere Interaction in Embankments. J. Geotech. Geoenvironmental Eng. 2025, 151, 04025133. [Google Scholar] [CrossRef]
  39. Hsu, A.; Sheriff, G.; Chakraborty, T.; Manya, D. Disproportionate exposure to urban heat island intensity across major US cities. Nat. Commun. 2021, 12, 2721. [Google Scholar] [CrossRef]
  40. Chen, J.-F. Systematic Classification and Distribution Law of Mountain Soils in Fujian. Mt. Res. 2001, 19, 1–8, CNKI:SUN:SDYA.0.2001-01-000. [Google Scholar]
  41. Rodell, M.; Houser, P.R.; Jambor, U.; Gottschalck, J.; Mitchell, K.; Meng, C.J.; Arsenault, K.; Cosgrove, B.; Radakovich, J.; Bosilovich, M.; et al. The global land data assimilation system. Bull. Am. Meteorol. Soc. 2004, 85, 381–394. [Google Scholar] [CrossRef]
  42. Peng, S. 1-km Monthly Precipitation Dataset for China (1901–2023); National Tibetan Plateau/Third Pole Environment Data Center: Beijing, China, 2020. [Google Scholar]
  43. Peng, S. 1-km Monthly Mean Temperature Dataset for China (1901–2023); National Tibetan Plateau/Third Pole Environment Data Center: Beijing, China, 2024. [Google Scholar]
  44. Bao, Z.X.; Zhang, J.Y.; Wang, G.Q.; Chen, Q.W.; Guan, T.S.; Yan, X.L.; Liu, C.S.; Liu, J.; Wang, J. The impact of climate variability and land use/cover change on the water balance in the Middle Yellow River Basin, China. J. Hydrol. 2019, 577, 123942. [Google Scholar] [CrossRef]
  45. Guan, X.X.; Zhang, J.Y.; Elmahdi, A.; Li, X.M.; Liu, J.; Liu, Y.; Jin, J.L.; Liu, Y.L.; Bao, Z.X.; Liu, C.S.; et al. The Capacity of the Hydrological Modeling for Water Resource Assessment under the Changing Environment in Semi-Arid River Basins in China. Water 2019, 11, 1328. [Google Scholar] [CrossRef]
  46. Jiang, Y.; Xu, Z.; Wang, J. Comparison among five methods of trend detection for annual runoff series. J. Hydraul. Eng. 2020, 51, 845–857. [Google Scholar] [CrossRef]
  47. Wang, Y.; Li, Q.; Wang, J.; Jiang, T.; Liu, C.; Wang, Y. The Variation Characteristics of Recorded Runoff and Its Annual Distribution in North China during the Recent 60 Years in the Context of Environment Change. J. North China Univ. Water Resour. Electr. Power (Nat. Sci. Ed.) 2020, 41, 36–42. [Google Scholar] [CrossRef]
  48. Ning, Z.-R.; Zang, J.-Y.; Wang, G.-Q. Variation and global pattern of major meteorological elements during 1948~2016. China Environ. Sci. 2021, 41, 4085–4095. [Google Scholar] [CrossRef]
  49. Sun, W.; Cheng, B. Application of Cross Wavelet Transformation to Analysi on Regional Climate Variations. J. Appl. Meteorol. Sci. 2008, 19, 479–487. [Google Scholar]
  50. Prohaska, J.T. A Technique for Analyzing the Linear Relationships between Two Meteorological Fields. Mon. Weather Rev. 1976, 104, 1345–1353. [Google Scholar] [CrossRef]
  51. Fengying, W. Modern Climatic Statistical Diagnosis and Prediction Technology; China Meteorological Press: Beijing, China, 2007. [Google Scholar]
  52. Zhao, Y.-J.; Qian, Y.-F. Analyses of the Impacts of Global SS-TA on Precipitation Anomaly in China. J. Trop. Meteorol. 2009, 25, 561–570. [Google Scholar] [CrossRef]
  53. Liu, H.; Yu, Y.; Xia, D.S.; Zhao, S.P.; Ma, X.Y.; Dong, L.X. Analysis of the relationship between dust aerosol and precipitation in spring over East Asia using EOF and SVD methods. Sci. Total Environ. 2024, 908, 168437. [Google Scholar] [CrossRef] [PubMed]
  54. Ding, J.-M.; Xu, H.-M.; Liu, S.; Wang, J.-S.; Xu, Z.-K.; Ruan, H.-H.; Liu, Y.-S. Effects of snow storm on soil available nitrogen in evergreen broad leaf forest in Wuyi Mountain. J. Nanjing For. Univ. 2010, 34, 136–140. [Google Scholar] [CrossRef]
  55. Huang, R.-Z.; Li, J.-M.; Zhen, H.-Z.; Wang, J.; Zhou, Y.-F. Comparison on photosynthetic characteristics between Pinus massoniana and Schima superba at the two different rehabilitation vegetation, Changting County, Fujian Province. J. Ecol. 2009, 29, 6120–6130. [Google Scholar] [CrossRef]
  56. Wang, F.; Lu, Z.-M.; Wang, J.; Zhang, S.-K.; Li, Y.-X.; Li, S.-C.; Zang, J.-Q.; Yang, Y.-C. Photosynthetic and Stomatal Characteristics of Pinus koraiensis and P. sibirica under Low Temperature Stress. Plant Res. 2021, 41, 205–212. [Google Scholar] [CrossRef]
  57. Liu, E.; Zhu, Y.; Calvet, J.-C.; Lü, H.; Bonan, B.; Zheng, J.; Gou, Q.; Wang, X.; Ding, Z.; Xu, H.; et al. Evaluation of root zone soil moisture products over the Huai River basin. Hydrol. Earth Syst. Sci. 2024, 28, 2375–2400. [Google Scholar] [CrossRef]
  58. Nkiaka, E.; Bryant, R.G.; Ntajal, J.; Biao, E.I. Evaluating the accuracy of gridded water resources reanalysis and evapotranspiration products for assessing water security in poorly gauged basins. Hydrol. Earth Syst. Sci. 2022, 26, 5899–5916. [Google Scholar] [CrossRef]
  59. Yue, S.; Wang, C. The Mann-Kendall Test Modified by Effective Sample Size to Detect Trend in Serially Correlated Hydrological Series. Water Resources Management. 2004, 18, 201–208. [Google Scholar] [CrossRef]
  60. Miao, H.X.; Chen, S.P.; Chen, J.Q.; Zhang, W.L.; Zhang, P.; Wei, L.; Han, X.G.; Lin, G.H. Cultivation and grazing altered evapotranspiration and dynamics in Inner Mongolia steppes. Agric. For. Meteorol. 2009, 149, 1810–1819. [Google Scholar] [CrossRef]
  61. Li, J.; Jiang, S.; Wang, B.; Jiang, W.W.; Tang, Y.H.; Du, M.Y.; Gu, S. Evapotranspiration and Its Energy Exchange in Alpine Meadow Ecosystem on the Qinghai-Tibetan Plateau. J. Integr. Agric. 2013, 12, 1396–1401. [Google Scholar] [CrossRef]
  62. Strilesky, S.L.; Humphreys, E.R. A comparison of the net ecosystem exchange of carbon dioxide and evapotranspiration for treed and open portions of a temperate peatland. Agric. For. Meteorol. 2012, 153, 45–53. [Google Scholar] [CrossRef]
  63. Liu, Z.; Li, S.; Zhang, Y.; Guo, Y.; Wei, W.; Wang, K. Evaporation characteristics of alpine meadow in Tibetan Plateau and the influencing factors. J. Arid Land Resour. Environ. 2019, 33, 87–93. [Google Scholar] [CrossRef]
  64. Niu, Y.-M.; Jia, G.-D.; Wang, X.; Liu, Z.-H. Dynamic changes of transpiration water age and water utilization strategies for trees at different altitudes in Lushan area. J. Ecol. 2024, 48, 1104–1117. [Google Scholar] [CrossRef]
  65. Pan, M.X.; Zhao, F.; Ma, J.Y.; Zhang, L.J.; Qu, J.P.; Xu, L.L.; Li, Y. Effect of Snow Cover on Spring Soil Moisture Content in Key Agricultural Areas of Northeast China. Sustainability 2022, 14, 1527. [Google Scholar] [CrossRef]
  66. Li, J.-J.; Chen, Y.-H.; Zhou, Z.-H.; Wang, Y.-J.; Yang, X.; Guo, L. Research progress on mechanisms of plant adaptation to flooding stress. Plant Sci. J. 2023, 41, 835–846. [Google Scholar] [CrossRef]
  67. Zhao, C.-Z.; Luo, Y.; Huang, J.-B. Global warming and El Niño events. Clim. Change Res. 2023, 19, 663–666. [Google Scholar] [CrossRef]
  68. Lin, J.; Liu, G.; Deng, H. Percipitation Variation and Its Response to ENSO in Fujian Province. J. Subtrop. Resour. Environ. 2023, 18, 71–78. [Google Scholar] [CrossRef]
  69. Lv, T.R.; Jiang, Y.J.; Wu, Z.; Mao, Y.; Qiu, J.; Wu, C. Transpiration characteristics of typical evergreen and deciduous tree species in subtropical karst areas and their responses to environmental factors. Acta Ecol. Sin. 2022, 42, 1047–1058. [Google Scholar] [CrossRef]
  70. Li, X.-Y.; Li, Y.-M.; Sun, L.; Xu, R.; Zhao, S.-T.; Guo, J. Characteristics of transpiration water consumption and its relationship with environmental factors in Ginkgo biloba. J. Beijing For. Univ. 2014, 36, 23–29. [Google Scholar] [CrossRef]
  71. Chen, L.; Li, Y.-L.; Ning, Z.-Y.; Yao, H.-L.; Zhan, J.; Yao, B. Response mechanisms of woody plants to drought stress:a review based on plant hydraulic traits. Acta Ecol. Sin. 2024, 44, 2688–2705. [Google Scholar] [CrossRef]
  72. Yu, Y.; Lin, W.; Chen, S.; Fan, D.; Fu, R.; You, W. Comparison of population quantity characteristics and spatial point pattern of dominant tree species in typical coniferous and broad-leaved mixed forest in Wuyi Mountain. J. Fujian Agric. For. Univ. (Nat. Sci. Ed.) 2023, 52, 649–659. [Google Scholar] [CrossRef]
  73. Xiao, J.; Liu, J.; Zheng, W.; Wang, Z.; Fang, M.; Hong, Y.; Tan, F. Characteristics and dynamic changes of forest carbon storage in Fujian Province from 1974 to 2018. J. Plant Resour. Environ. 2024, 33, 101–108. [Google Scholar] [CrossRef]
  74. Hu, J.; Guo, S.; Huang, J. Calculation of dominant tree species and bamboo forest carbon stock in Fujian Province. J. Shenyang Norm. Univ. (Nat. Sci. Ed.) 2024, 42, 391–397. [Google Scholar] [CrossRef]
  75. Liu, Y.X.; Shi, X.L.; Shi, W.J. Evaluation of water retention services of forest ecosystems in Fujian Province: Comparison between results from the InVEST model and meta-analysis. Acta Ecol. Sin. 2021, 41, 1349–1361. [Google Scholar] [CrossRef]
  76. Sheng, W.-T. Targets of the Silviculture System of Plantation Forestry. J. Temp. For. Res. 2019, 2, 1–5. [Google Scholar] [CrossRef]
  77. Jiang, X.; Zou, A.; Wang, Y.; Zhou, X.; Ji, C. Leaf Stomatal Traits of Woody Plants and Their Response to NitrogenAddition in Typical Forests in Eastern China. Acta Sci. Nat. Univ. Pekin. 2018, 54, 839–847. [Google Scholar] [CrossRef]
  78. Zhang, Z.-A.; Yang, F.; Chen, Z.-Y.; Xu, K.-Z. Relationship Between Diurnal Changes of Net Photosynthetic Rateand Environmental Factors in Leaves of Zizania latifolia. Sci. Agric. Sin. 2006, 39, 502–509. [Google Scholar] [CrossRef]
  79. Jezík, M.; Blazenec, M.; Letts, M.G.; Ditmarová, L.; Sitková, Z.; Strelcová, K. Assessing seasonal drought stress response in Norway spruce (Picea abies (L.) Karst.) by monitoring stem circumference and sap flow. Ecohydrology 2015, 8, 378–386. [Google Scholar] [CrossRef]
  80. Juan, C.; Fangjun, D.; Zhenghong, T.; Liguo, L.; Ting, Z.; Yingchun, C. Leaf stomatal morphological characteristics and their effects on transpiration for two tree species in Maolan Karst area, Guizhou Province. J. Nanjing For. Univ. (Nat. Sci. Ed.) 2021, 45, 125–132. [Google Scholar] [CrossRef]
  81. Ye, C.; Hong, Y.; Zhang, R.; Huang, S.; Pan, S. Spatiotemporal dynamics and spatial heterogeneity of forest ecosystem services in Fujian Province. J. Soil Water Conserv. 2025, 39. [Google Scholar] [CrossRef]
  82. Huang, J. Exacerbated land-air coupling under global warming drives the westward shift of heatwave hotspots. Chin. Sci. Bull. 2025, 70, 4616–4618. [Google Scholar] [CrossRef]
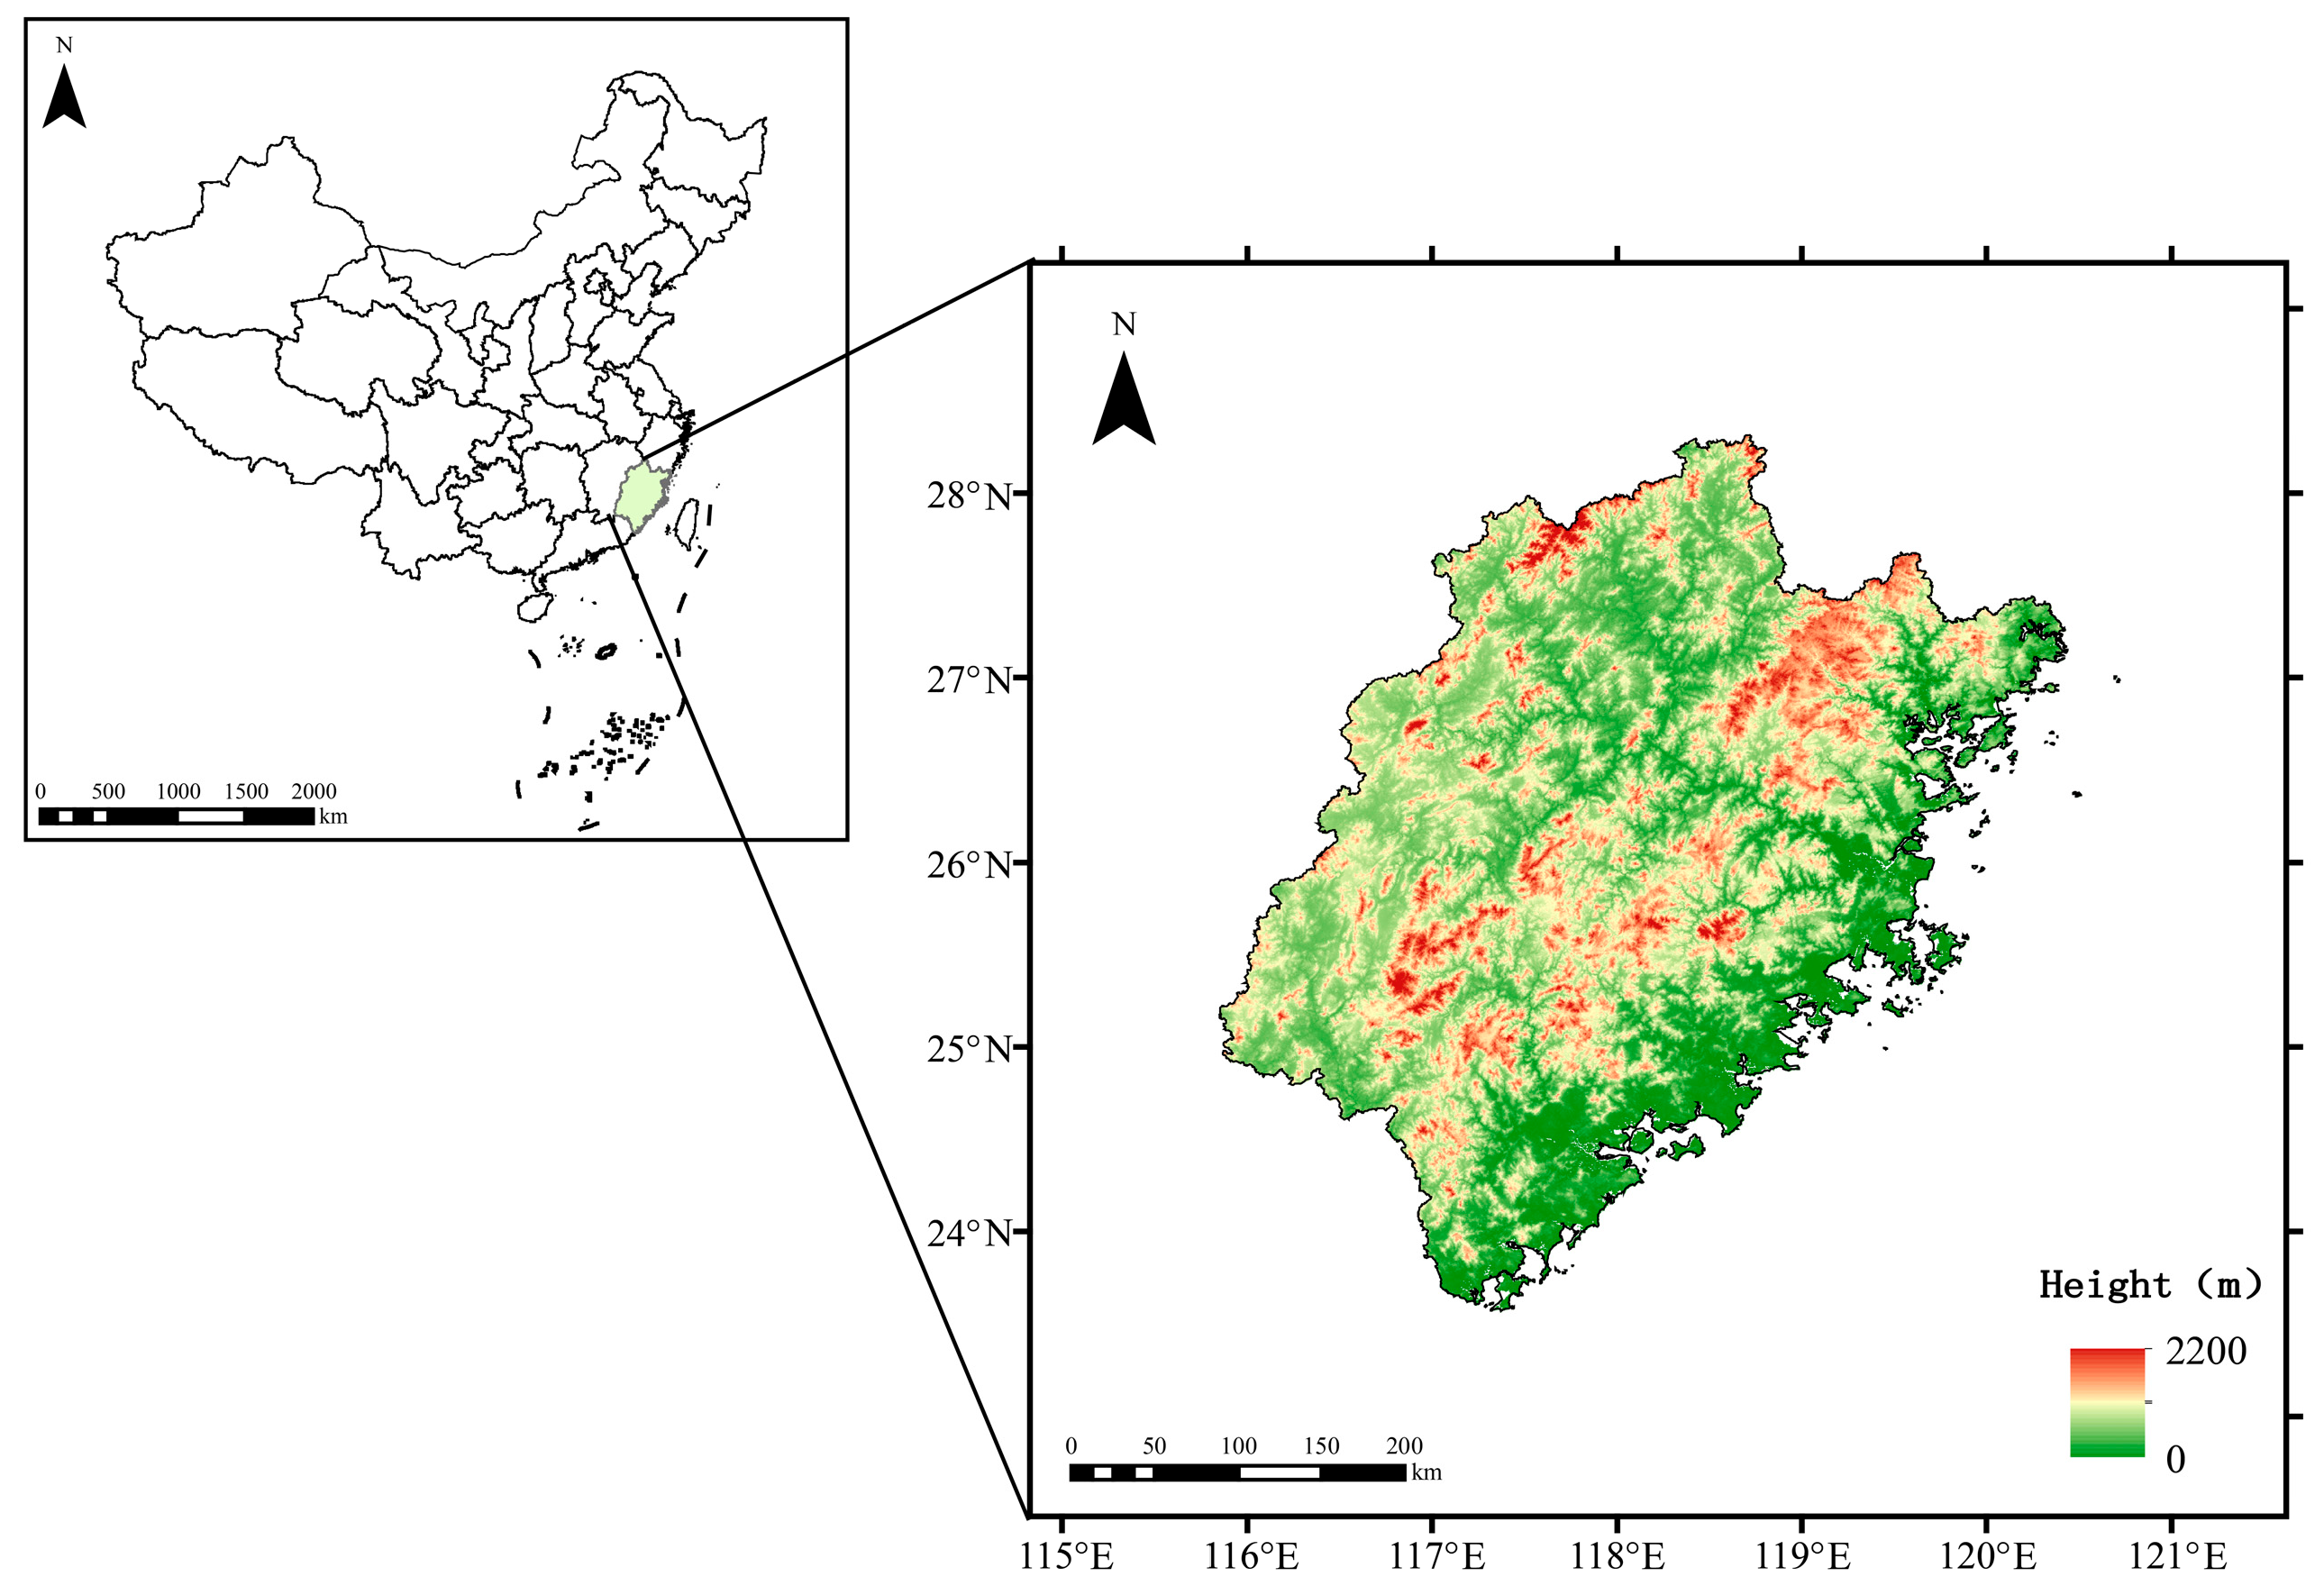
Figure 1. Study region.
Atmosphere 16 01180 g001
Figure 2. Temporal variation characteristics of interannual and seasonal vegetation transpiration in Fujian Province, 2004–2023. (a) The interannual trend. (be) Trend of spring, summer, autumn, and winter, respectively. The red solid line (Slope1) represents the linear fit of vegetation transpiration over the entire period 2004–2023, with 2016 identified as a critical point based on visual inspection. The blue solid line (Slope2) and green solid line (Slope3) denote the linear fits for the periods 2004–2016 and 2016–2023, respectively.
Atmosphere 16 01180 g002
Figure 3. Spatial variation characteristics of interannual and seasonal vegetation transpiration trends in Fujian Province for the periods 2004–2023, 2004–2016, and 2016–2023. (a,f,k) Interannual trends. (be,gj,lo) Trends of spring, summer, autumn, and winter, respectively (black square symbols denote trends significant at the 95% confidence level).
Atmosphere 16 01180 g003
Figure 4. Temporal variation characteristics of interannual and seasonal root-zone soil moisture in Fujian Province, 2004–2023. (a) The interannual trend. (be) Trend of spring, summer, autumn, and winter, respectively. The red solid line (Slope1) represents the linear fit of root-zone soil moisture over the entire period 2004–2023, with 2016 identified as a critical point based on visual inspection. The blue solid line (Slope2) and green solid line (Slope3) denote the linear fits for the periods 2004–2016 and 2016–2023, respectively.
Atmosphere 16 01180 g004
Figure 5. Spatial variation characteristics of interannual and seasonal root-zone soil moisture trends in Fujian Province for the periods 2004–2023, 2004–2016, and 2016–2023. (a,f,k) Interannual trends. (be,gj,lo) Trends of spring, summer, autumn, and winter, respectively (black square symbols denote trends significant at the 95% confidence level).
Atmosphere 16 01180 g005
Figure 6. Spatial patterns of correlation coefficients between interannual and seasonal vegetation transpiration and root-zone soil moisture in Fujian Province for the periods 2004–2023, 2004–2016, and 2016–2023. (a,f,k) Interannual correlations. (be,gj,lo) Correlations of spring, summer, autumn, and winter, respectively (black square symbols denote trends significant at the 95% confidence level).
Atmosphere 16 01180 g006
Figure 7. Heterogeneous correlation maps for the first mode of SVD analysis between root-zone soil moisture and vegetation transpiration in Fujian Province (2004–2023). (a) Heterogeneous correlation map for the root-zone soil moisture field. (b) Heterogeneous correlation map for the vegetation transpiration field; red dots denote grid points passing the 95% confidence level Monte Carlo significance test. (c) Normalized temporal coefficients for the root-zone soil moisture field (left field) and the vegetation transpiration field (right field).
Atmosphere 16 01180 g007
Figure 8. Cross-wavelet power spectra between vegetation transpiration and root-zone soil moisture at different temporal scales. (a) Interannual cross-wavelet power spectrum. (be) Cross-wavelet power spectra for spring, summer, autumn, and winter, respectively. The thick black contours indicate regions where the wavelet power exceeds the 95% confidence level based on a red noise background spectrum. The thin black line denotes the cone of influence, where edge effects become significant, and the area inside represents reliable results. Arrows indicate the phase relationships between vegetation transpiration and root-zone soil moisture, as follows: → in-phase, indicating a positive correlation; ← anti-phase, indicating a negative correlation; ↗ vegetation transpiration leads, with a positive correlation; ↙ vegetation transpiration leads, with a negative correlation; ↘ vegetation transpiration lags, with a positive correlation; ↖ vegetation transpiration lags, with a negative correlation; ↓ vegetation transpiration lags root-zone soil moisture by a quarter cycle; ↑ vegetation transpiration leads root-zone soil moisture by a quarter cycle.
Atmosphere 16 01180 g008
Figure 9. Temporal variations in precipitation and mean air temperature in Fujian Province from 2004 to 2023. (a) Annual precipitation during 2004–2023. (b) Annual mean air temperature during 2004–2023.
Atmosphere 16 01180 g009
Figure 10. Seasonal variation characteristics of annual mean air temperature in Fujian Province, 2004–2023. (ad) Spring, summer, autumn, and winter, respectively.
Atmosphere 16 01180 g010
Disclaimer/Publisher’s Note: The statements, opinions and data contained in all publications are solely those of the individual author(s) and contributor(s) and not of MDPI and/or the editor(s). MDPI and/or the editor(s) disclaim responsibility for any injury to people or property resulting from any ideas, methods, instructions or products referred to in the content.