Article

Carbon Emission Accounting and Emission Reduction Path of Container Terminal Under Low-Carbon Perspective

1
Anhui Eco-Environment Monitoring Center, Hefei 230071, China
2
State Key Laboratory of Transducer Technology, Institute of Intelligent Machines, Hefei Institutes of Physical Science, Chinese Academy of Sciences, Hefei 230031, China
3
Institute of Artificial Intelligence, Hefei Comprehensive National Science Center, Hefei 230088, China
4
State Environmental Protection Key Laboratory of Vehicle Emission Control and Simulation, Chinese Research Academy of Environmental Sciences, Beijing 100012, China
5
Anhui Province Key Laboratory of Intelligent Low-Carbon Information Technology and Equipment, University of Science and Technology of China, Hefei 230026, China
*
Authors to whom correspondence should be addressed.
Atmosphere 2025, 16(10), 1158; https://doi.org/10.3390/atmos16101158
Submission received: 4 September 2025 / Revised: 27 September 2025 / Accepted: 30 September 2025 / Published: 3 October 2025
(This article belongs to the Special Issue Anthropogenic Pollutants in Environmental Geochemistry (2nd Edition))

Abstract

Accurate carbon emission estimation across all operational stages of container terminals is essential for advancing low-carbon development in the transportation sector and designing effective emission reduction pathways. This study develops a two-layer carbon accounting framework that integrates vessel berthing–waiting and terminal operations, tailored to the operational characteristics of Shanghai Port container terminals. The Ship Traffic Emission Assessment Model (STEAM) is applied to estimate emissions during berthing, while a bottom-up method is employed for mobile-mode container handling operations. Targeted mitigation strategies—such as shore power adoption, operational optimization, and “oil-to-electricity” or “oil-to-gas” transitions—are evaluated through comparative analysis. Results show that vessels generate substantial emissions during erthing, which can be significantly reduced (by over 60%) through shore power usage. In terminal operations, internal transport trucks have the highest emissions, followed by straddle carriers, container tractors, and forklifts; in stacking, tire cranes dominate emissions. Comprehensive comparisons indicate that “oil-to-electricity” can reduce total emissions by approximately 39%, while “oil-to-gas” can achieve reductions of about 73%. These findings provide technical and policy insights for supporting the green transformation of container terminals under the national dual-carbon strategy.

1. Introduction

As an important component of the comprehensive three-dimensional transportation network, port hubs play a crucial role in promoting the economic development and urbanization of riverine and coastal areas. With the growth of cargo throughput year by year, the problem of port carbon emissions have become increasingly significant, and the greenhouse gases generated throughout ship berthing and terminal operations are now a major factor constraining the green and low-carbon transition of ports. As one of the important means to respond to the deepening of China’s dual-carbon strategy, accurate carbon accounting from a low-carbon perspective can transform ports from traditional “passive carbon accounting” to “active carbon reduction governance”, effectively driving the use of new carbon accounting technologies and carbon reduction methods, and maximizing environmental benefits. Thus, maximizing environmental benefits can be achieved. Shanghai Port is located in the middle of China’s mainland coastline, the Yangtze River delta front, located in the Yangtze River east–west transportation corridor and the intersection of the coastal north–south transportation corridor, is China’s and even the world’s important shipping and trade hub. From 2010 to 2024, Shanghai Port ranked first in the world for container throughput for fifteen consecutive years, with its annual foreign trade volume accounting for about 20% of China’s major coastal ports [1]. However, as the cargo throughput continues to increase, port carbon emissions have become a significant constraint on the green development transition of ports. During the production operations of container terminals, substantial greenhouse gas emissions often occur, primarily reflected in the fuel consumption during vessel arrival and departure processes and the energy consumption required by port operation machinery [2]. Shanghai Port currently has 49 mainline and feeder container berths, with a combined shoreline length of 280 km, and is mainly equipped with three major coastal port areas [3,4], as shown in Figure 1 below. Studies have shown that pollutants such as carbon dioxide, sulfur dioxide, and nitrogen oxides emitted from terminal operating equipment and ship main and auxiliary engine operations during ship berthing, de-berthing, and operations can have a significant impact on the atmospheric environment [5], and at the same time pose a potential threat to the health of residents living in the adjacent surrounding areas. To further respond to the low-carbon development strategy, major ports around the world have proposed corresponding measures, such as promoting the use of shore power, guiding ships to use clean energy, optimizing trucking [6,7], etc. However, due to the operational complexity and cargo specificity of each port, there are still many challenges to realize a macro and universal carbon reduction strategy.
Currently, scholars both in China and abroad have conducted extensive research on port carbon emission accounting, mainly using bottom-up, top-down, actual measurement, and other calculation methods [8]. Among them, Liu et al. [9] systematically sorted out the existing carbon emission measurement methods, summarized the three major measurement systems, and pointed out that the bottom-up method is the most widely used due to its refinement characteristics. Zhang et al. [10] used the bottom-up method to calculate the shipside and shoreside emissions. Freitas et al. [11] calculated carbon emissions from a number of EU ports and recommended a standardized approach to calculating the carbon footprint of ports. Mou [12] et al. carried out activity-weighted estimation of carbon emissions from US ships from 2019 to 2021 based on AIS data to explore emission characteristics at geographical level.
At present, domestic research mainly focuses on the calculation of carbon emissions in port areas [13,14] and explores the impact of different port operation strategies [15,16,17] on carbon emissions. However, there are relatively few measured studies on specific container terminals. There are studies on the calculation of carbon emissions in container handling [18,19,20], but there are still deficiencies in the consideration of carbon emissions in ship berthing and terminal operations. The potential driving factors of carbon emissions [21] have been analyzed, and port smart technologies and the adoption of clean energy equipment have been applied to improve port carbon emission efficiency [22], etc. Qi et al. [23] proposed a multi-dimensional ship carbon emission feature extraction method. Taking Tianjin Port as the research area, six characteristics of ship carbon emission were obtained, which verified the feasibility of the method. To explore the impact of different port operation strategies ad12,ad13,ad14 on carbon emissions, Yang et al. [24] established an optimization model for investment decision of low-carbon transformation of automated rail-mounted container gantry cranes. But there are relatively few practical studies on each stage of container terminal operations, there are studies on carbon emission estimation of container loading and unloading links [18,19,20], but carbon emission consideration of ship berthing and terminal operation links is still insufficient. In addition, some scholars have proposed carbon reduction paths, but they are mainly aimed at macro-research on waterway transportation [25,26,27]. Tai et al. [28] proposed an activity-based model to calculate ship exhaust emissions. Zhou et al. [29] evaluated the carbon emission reduction effect of port and ship electrification, ship speed optimization and clean fuel measures, but lacked research on specific operation links of terminals, especially emissions of transportation vehicles. In fact, the operation of container terminals will be accompanied by a large number of greenhouse gas emissions, mainly from the fuel consumption of ships in the process of berthing and unberthing and the energy consumption of terminal production machinery. Carbon emissions during ship berthing and departure are important components that cannot be ignored when calculating carbon emissions from port operations. Shanghai Port is speeding up the use of coastal electricity in various ways to form full coverage of coastal electricity and 100% green electricity. Therefore, combining with the actual situation of Shanghai Port container terminal, this paper accurately calculates and evaluates the carbon emission pollution of ship berthing period and terminal operation equipment, and formulates scientific carbon reduction path, which has important practical significance for responding to the national “double carbon” strategy and ensuring the resilience and sustainability in the process of low carbon development.

2. Accounting and Analysis of Carbon Emissions from Shanghai Port Container Terminal

2.1. Carbon Emission Accounting for Shanghai Port Container Terminals

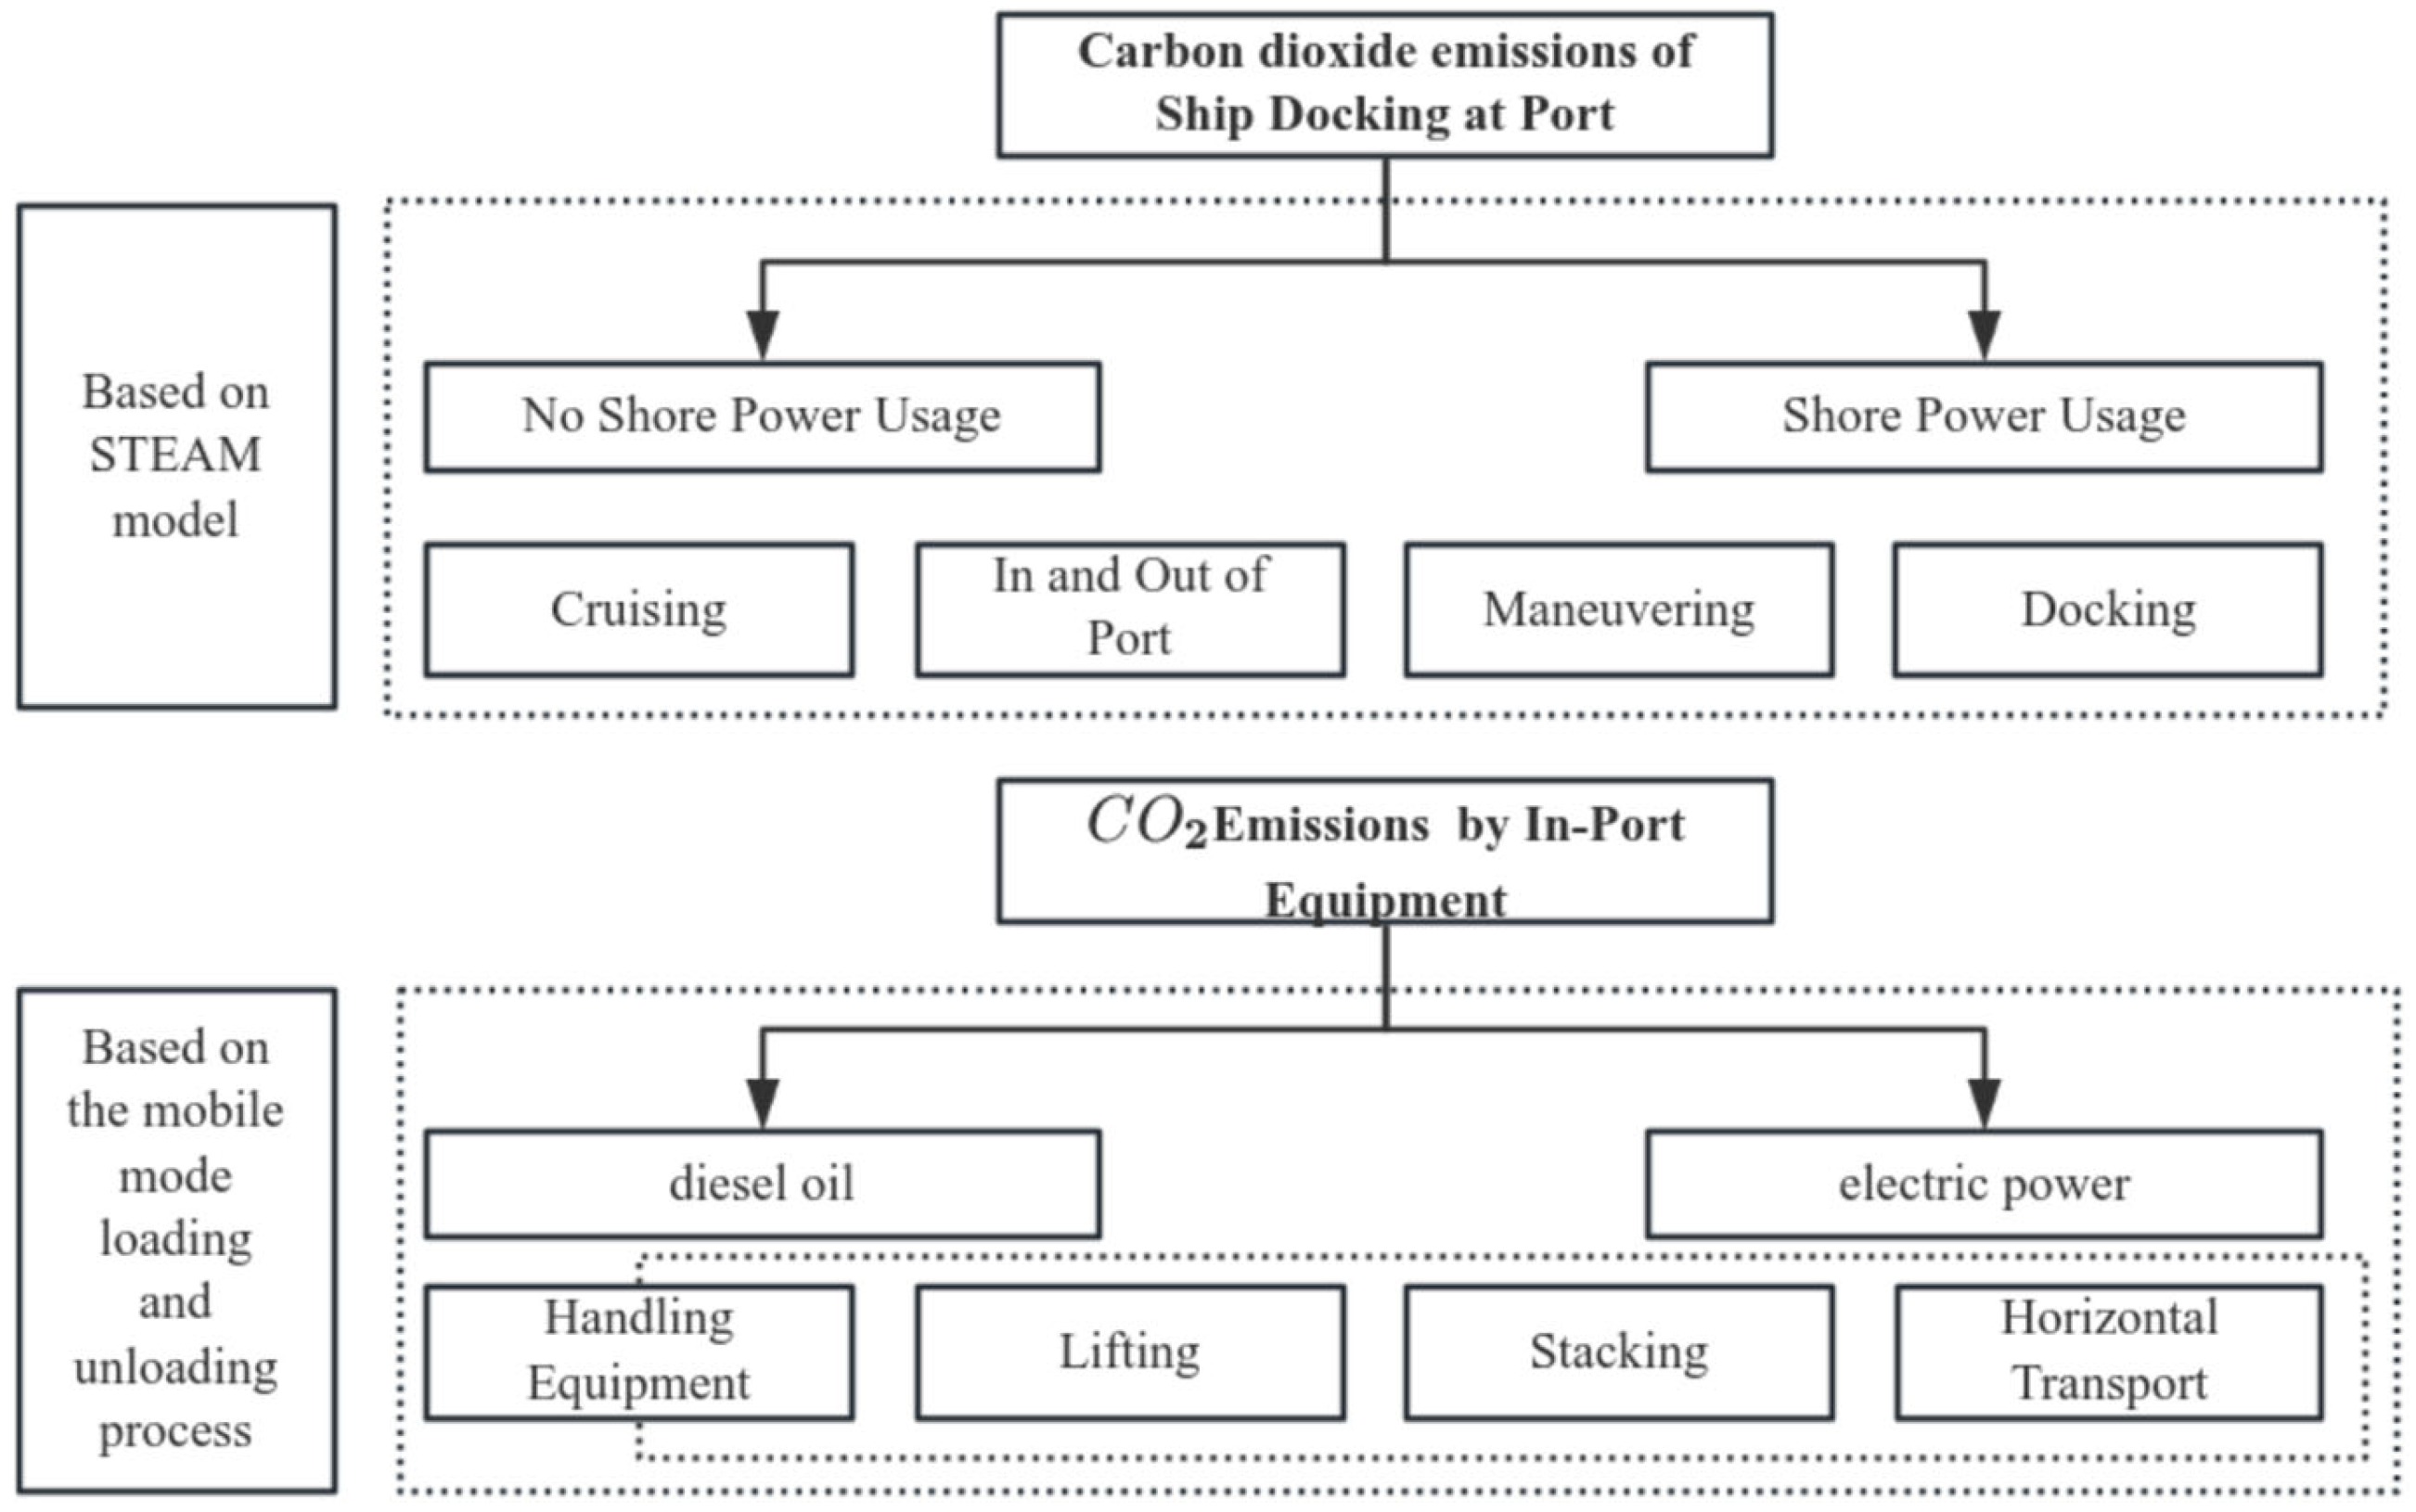
In this work, we establish a Ship Traffic Emission Assessment Model (STEAM) based model to calculates carbon emissions during ship berthing operations at the terminal based on the STEAM. At the same time, it uses a bottom-up carbon emission measurement method and a mobile mode-based carbon emission calculation method for container loading and unloading processes. The overall framework is shown in Figure 2.

2.1.1. Carbon Emissions from Ships Based on the STEAM Accounting

STEAM (Ship Traffic Emission Assessment Model, STEAM), which is a ship traffic emission assessment model [30], can effectively account for the carbon emissions during ship berthing operations. Taking the above harbor as an example, the accounting of carbon emission from ships is shown in the following Equations (1)–(3). If the ships use shore power, the carbon emission is shown in Equation (4). Assuming that the shore power used in Shanghai Port comes from green energy, since Shanghai Port is accelerating the utilization of shore power through various ways to form full coverage of shore power and 100% green power consumption, at present, Yangshan Deepwater Port Phase IV and other terminals have been fully electrified and rated as green ports. Based on this, the emission factor of green power is approximately treated as zero, and no additional carbon emission calculation is made for shore power.
E g = i P i j × L F i j × T j × E F i × L L A
E b = P b × T j × E F b × L L A
E s h i p = E g + E b
E s = P m j × L F m j × T j × E F m × L L A
where Eg represents the diesel carbon emissions from the ship’s main engine and auxiliary engines under different working conditions during berthing; i represents the ship’s engine type (including main engine and auxiliary engines); j is different working conditions; Pij represents the rated power of the ship’s main engine and auxiliary engines; LFij represents the load coefficients of the ship’s main engine and auxiliary engines under different working conditions; Tj represents the ship’s activity time in the port under different working conditions; EFi represents the ship’s engine carbon emission coefficients; LLA is the correction coefficient; Eb represents the boiler carbon emission; Pb represents the boiler power; EFb represents the boiler emission coefficient; Es is the ship engine emission when using shore power; m represents the main engine. The calculation of carbon emission here considers the main engine because it wants to consider the whole process of ship berthing and berthing during dock operation and dock operation after berthing. The berthing and berthing process requires the main engine to work, which will generate carbon emission; the same as Equation (1). In Equation (4), The values Pmj, LFmj and EFm in Equation (4) are the same as those in Equation (1), and they are, respectively, the values under shore power. It should be noted that when a single ship uses shore power, the main engine and auxiliary engine of the ship do not work, and the value is 0. Shore power is used only after the ship is berthed, and ships that need to dock in the port switch off their own auxiliary generators and use clean energy provided by the port. Carbon emissions are generated by the main and auxiliary engines during cruise, maneuvering and port movements. But in practice, ships ready to use shore power usually reduce the load or operating time of their auxiliary engines before docking, so as to be able to switch more quickly once connected. Therefore, our emission estimates include the potential impact of coastal power readiness on these phases.
E F m i x = k S g × α k × E F g k + m S n g × β m × E F n g m
E m i s = E × E F m i x
E m i s = E × S g × k α k × E F g k + 1 S g × m β m × E F n g m
For carbon emissions generated by shore power use in Shanghai Port, it is divided into green energy and non-green energy shore power, EFmix represents the mixed weighted emission factor in Equation (5). Emis represents the total consumption of hybrid shore power in Equations (6) and (7), stands for shore power consumption in Equation (6), Sg indicating the proportion of green energy, Sng indicating the proportion of non-green energy (Sg + Sng = 1). There are many sources of shore power, such as photovoltaic, wind power, fossil fuels, etc., EFgk indicating the emission factor of the ith green energy, αk indicating the proportion of shore power generated by the kth green energy mode, k α k = 1 ; EFngm indicating the emission factor of the mth non-green energy, βm indicating the proportion of shore power generated by the mth non-green energy mode, m β m = 1 . Since it is assumed that all port electricity comes from green energy, EFg is 0, Sg is 1, Emis is 0 in Equation (6), EFg is 0 because the model is used for carbon emission calculation of Shanghai Port, and at this stage, shore electricity utilization is being accelerated through various ways, green electricity policy is implemented, distributed photovoltaic power stations are being built to provide clean electricity for port operation, forming full coverage of shore electricity and 100% green electricity. At present, Yangshan Deepwater Port Phase IV and other terminals have been fully electrified and rated as green ports. Based on this, the emission factor of green power is approximately treated as zero, and the carbon emissions generated by subsequent shore power are not included in the calculation.
The total number of ships entering and leaving Shanghai harbor in 2023 is 2,472,000, and their representative container ship attributes are shown in Table 1 [31,32]. Ship engine gas emission parameters and emission gas correction coefficients under different fuel oils are shown in Table 2 and Table 3, respectively [33].

2.1.2. Carbon Emission Accounting for Container Terminals Based on Mobile Mode Loading and Unloading Processes

Mobile mode loading and unloading technology refers to the cargo movement and operation process plan formed by the port during the loading and unloading of containers or cargo, based on different combinations of loading and unloading equipment and transportation vehicles. The mobile mode loading and unloading process can help to improve the deployment and optimization of container resources in the terminal, thus enhancing the efficiency of loading and unloading operations [34]. Therefore, based on the actual operation scenario of Shanghai port in 2020, this paper proposes the carbon emission accounting method of container loading and unloading process under the mobile mode, and the carbon emission accounting formulas of each link of the loading and unloading operation in the port are shown in Equations (8)–(10).
EMk = Nk × (Ck+ Vk × Lk) × EFM
EEk = Nk × ek × EFE
En = ΣTn × Ek
where EMk represents the carbon dioxide emissions per unit container movement for diesel—powered container terminal equipment; k is the in—port equipment of container terminals, including straddle carriers, gantry trucks, container forklifts, container tractors, and reach stackers, etc.; Nk represents the number of times equipment k completes a unit container move; Ck represents the fixed diesel consumption per unit operation for equipment k; Vk represents the variable diesel consumption per unit distance for equipment k; Lk represents the distance equipment k moves per standard container operation; ek represents the power consumption per unit operation for equipment k; EEk represents the power—based carbon dioxide emissions per unit container movement for container terminal equipment; EFM represents the diesel carbon dioxide emission factor; EFE represents the grid carbon dioxide emission factor; n represents the port production stages, including loading and unloading at container terminals (cranes), horizontal transport (gantry trucks), and yard operations (rubber—tyred gantry cranes); Tn represents the average annual operation volume of representative equipment in each stage (data not available). By using the “Bottom—Up” carbon emission estimation method, data on energy consumption per unit, movement distance per unit, and operation times per unit of different handling equipment at Shanghai Port’s container terminal are obtained and categorized by driving energy as shown in Table 4 and Table 5 [35]. Table 4 classifies commonly—used container terminal equipment by function, dissects the loading and unloading operation stages, and lays a foundation for subsequent carbon emission calculations that account for individual equipment characteristics.
In addition, according to the data query released by the United Nations Intergovernmental Panel on Climate Change (IPCC) and the National Power Corporation in 2022, the CO2 emission factors for diesel and electric power drive are 2.67 kg/L for diesel and 0.5617 kg/kwh for electric power drive, respectively. From the above, the CO2 emissions per unit of operation of each type of equipment in the production activities of Shanghai Port Container Terminal (SPCT) can be obtained through Equations (8) and (9), and the CO2 gas emissions of the loading and unloading link (bridge crane), the horizontal transportation link (container trucks), and the yard operation link (tire cranes) of the SPCT in a year can be obtained further through Equation (10). In summary, the “bottom-up” approach breaks down carbon emissions into a number of components, which are then counted according to the characteristics of their respective production activities, and finally summed up to obtain the overall carbon emissions. Comparison of the emissions of each segment of Shanghai Port Container Terminal can be analyzed according to the carbon dioxide emission intensity of each segment. In this paper, carbon dioxide emission intensity is defined as the carbon dioxide emission generated by completing a unit of port throughput in a year (unit: kg/TEU), and the carbon dioxide emission intensity is shown in the following Equation (11).
I n = E n T br - to - break  
where In represents the CO2 emission intensity of different operational segments; En represents the CO2 emission of different segments in one year; T represents the annual throughput of Shanghai Port.
This section describes the calculation methods and formulas needed to calculate the carbon emission of Shanghai Port Container Terminal, lists the correlation coefficients and corresponding values used, and analyzes the calculation results in detail in the next section.

2.2. Results and Discussion

2.2.1. Carbon Emissions from Container Ship Port Call Operations Analysis of Accounting Results

The following is a comparison between the use of shore power and the use of shore power in the process of arriving ships at the port. Through Equations (1)–(3) and based on the data in Table 1, Table 2 and Table 3, the emissions from each segment of ship arrivals in Shanghai harbor can be calculated, and the results are shown in Table 6.
The emission ratio of each link under the two energy use cases (the ratio of carbon dioxide emissions to total energy use) is shown in Table 6, the mooring condition without the use of shore power has the highest percentage of CO2 emissions because the activity time of the mooring condition is much longer than that of the rest of the conditions, and the mooring segment needs to rely on auxiliary engines and boilers to generate electricity. Consequently, berthing without shore power produces the highest emissions. If the ship is connected to shore power, the shore power system replaces the auxiliary engine and boiler to supply power for the berthing of the ship. However, the whole process of berthing and deberthing of the ship and berthing operation after berthing is carried out step by step, and the main engine still participates in the work. Therefore, the energy consumption of the ship at berthing can be ignored. The emission depends on the energy consumption of the main engine. When the ship cruises within the port water area, the ship does not start to decelerate. The ship speed under this state is far greater than that of the ship in the inbound and outbound and maneuvering links. Therefore, when the ship is cruising, the main engine load factor is high, the actual power is high, and the main engine energy consumption of the ship is high. Therefore, the ship has the highest carbon emissions in this link.

2.2.2. Carbon Emissions from Container Terminal In-Port Operations Analysis of Accounting Results

Through Equations (8) and (9), based on the data in Table 5, the carbon emission results per unit of operation of the container terminal, i.e., under the operation of different equipment, can be calculated as shown in Table 7 below.
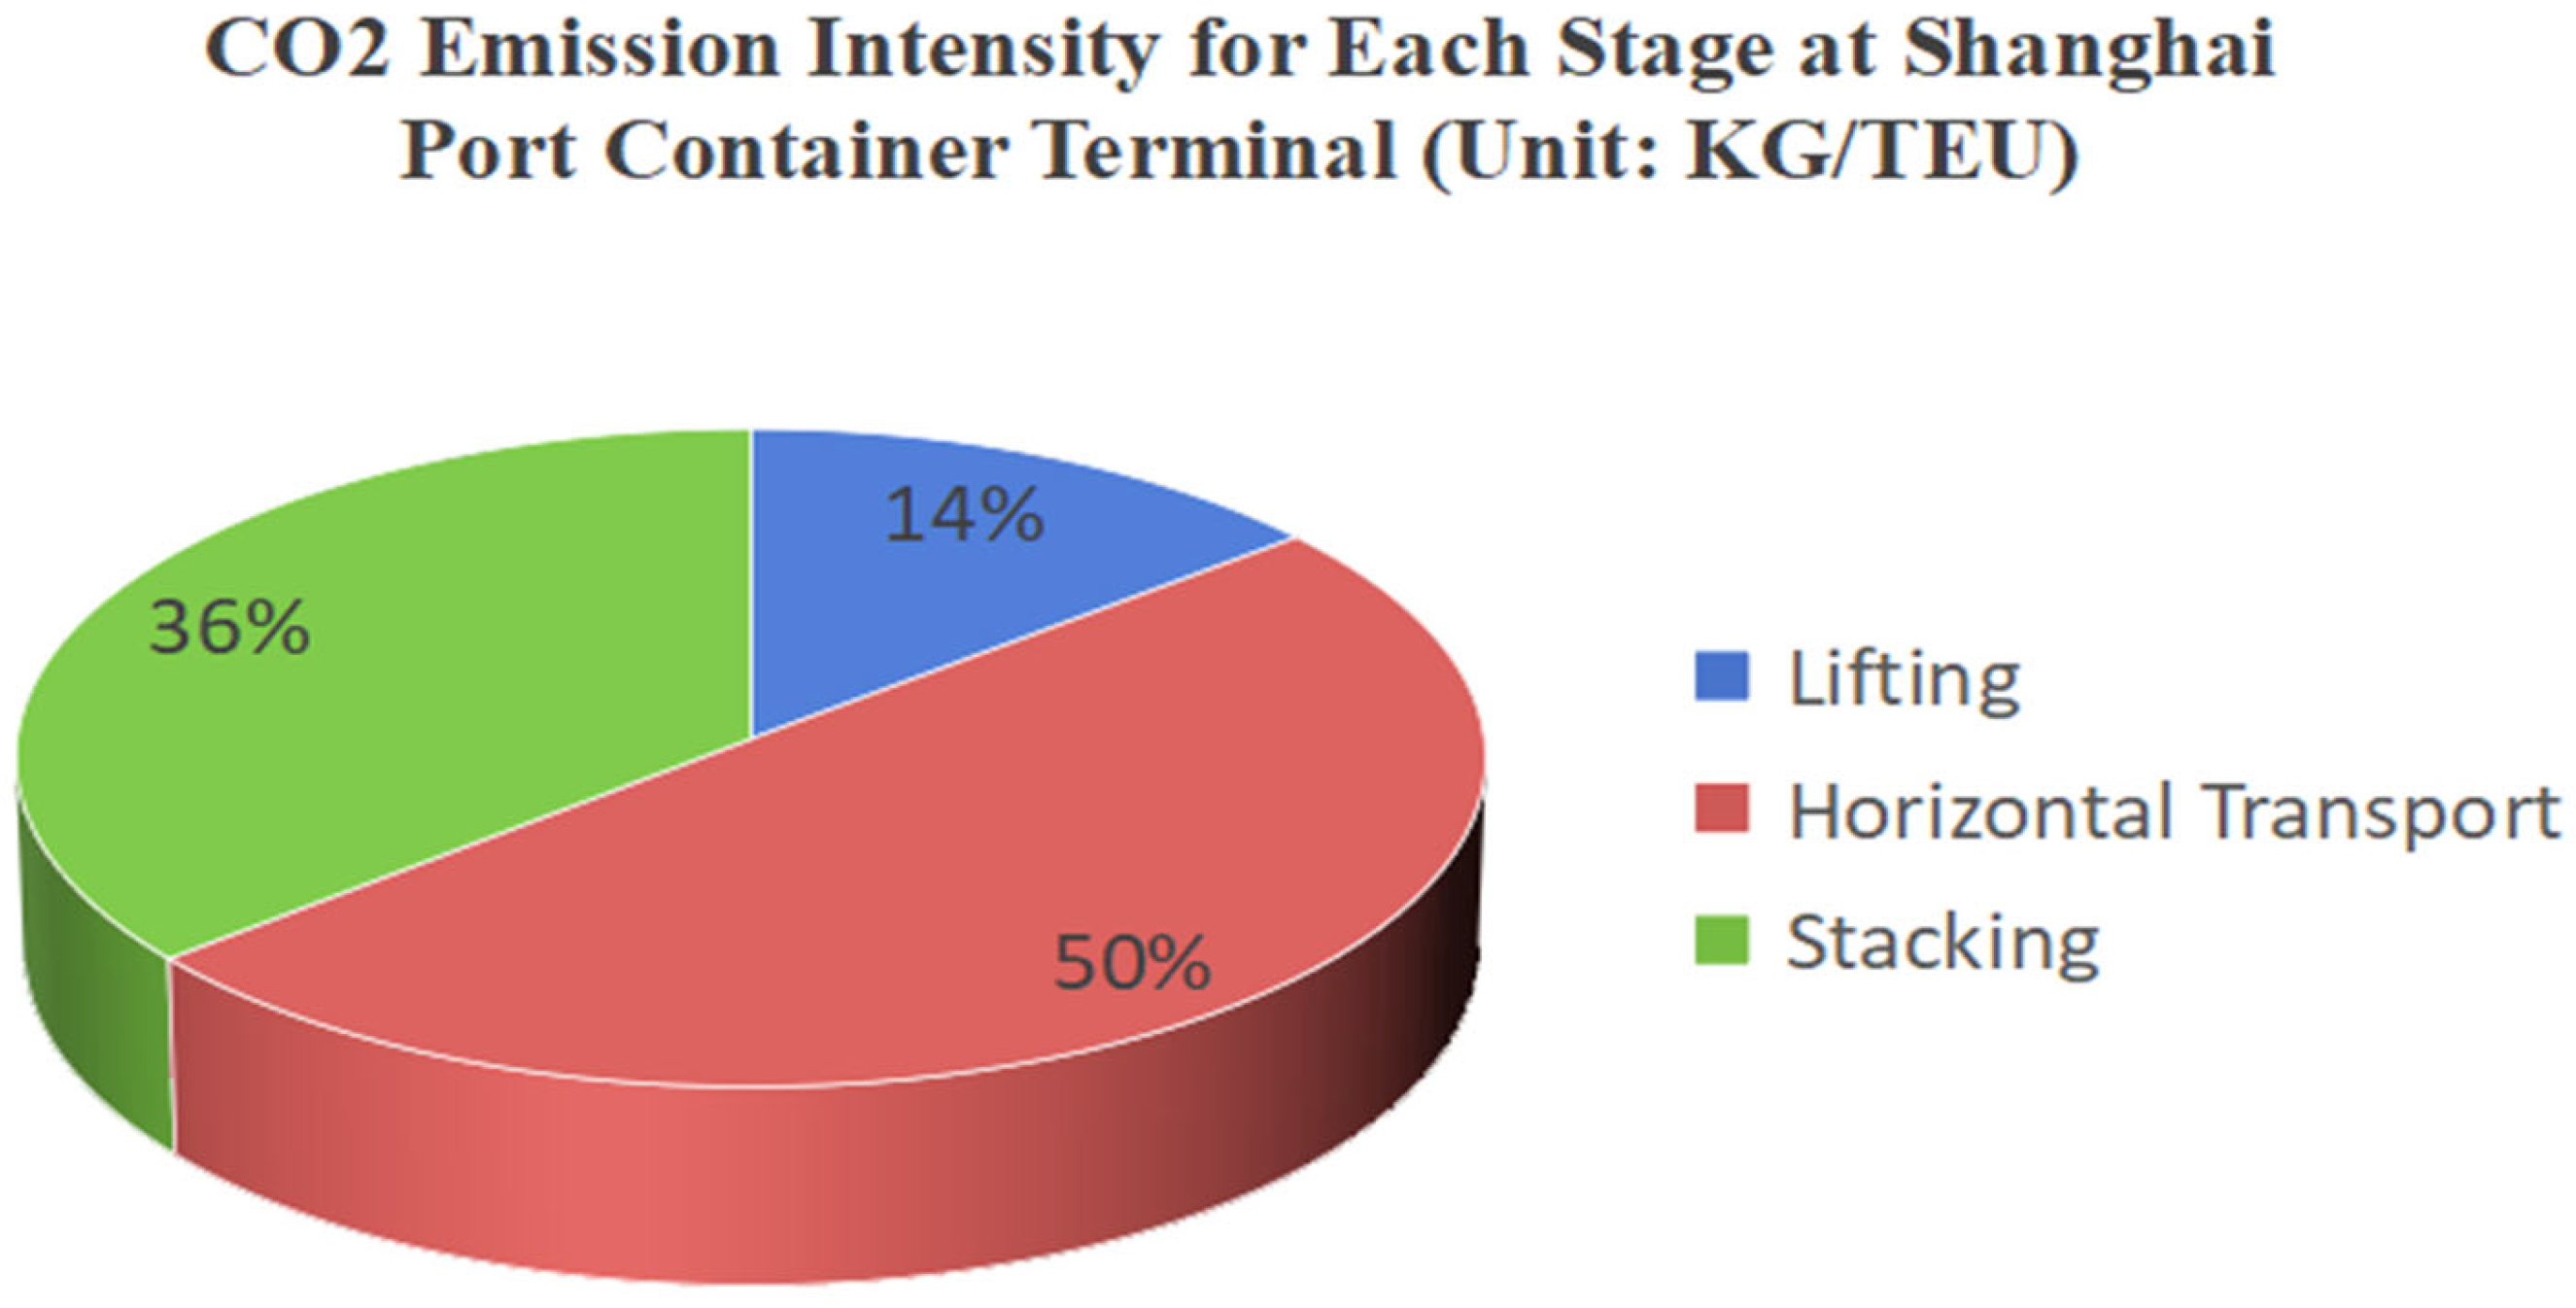
As can be seen from Table 7, in the horizontal transportation link, the emissions from container movement operations per unit of different equipment, in descending order, are: in-port container trucks (hereinafter referred to as container trucks), straddle carriers, container tractors and forklifts. In-port container trucks have the highest CO2 emissions per unit of operation. And in the stacking segment, the emission intensities of different equipment unit container operations are, in descending order: tire cranes, automatic stacker cranes and barge cranes. The carbon dioxide emission intensity of each operation link of Shanghai Port Container Terminal can be calculated through Equations (10) and (11), as shown in Figure 3.
This section provides an analysis of CO2 emissions from container ship port call operations and in-port terminal operations at Shanghai Port. The results show that the highest emissions during ship port calls occur when ships are docking without shore power, as auxiliary engines and boilers are used for power generation. Using shore power eliminates these emissions during docking. The cruising phase produces the highest emissions due to high main engine load and energy consumption.
For in-port terminal operations, container trucks exhibit the highest CO2 emissions per unit of operation, followed by straddle carriers and container tractors. In the stacking phase, tire cranes contribute the most to emissions. The horizontal transport phase, particularly involving container trucks, has the highest carbon emission intensity across all terminal operations. These findings highlight key areas where emission reductions can be made, particularly through the adoption of shore power and the optimization of equipment used in terminal operations

3. Shanghai Port Container Terminal Emission Reduction Path Study

3.1. Study on Emission Reduction Countermeasures for Container Ship Port Calling Process Considering Ship Shore Power Usage

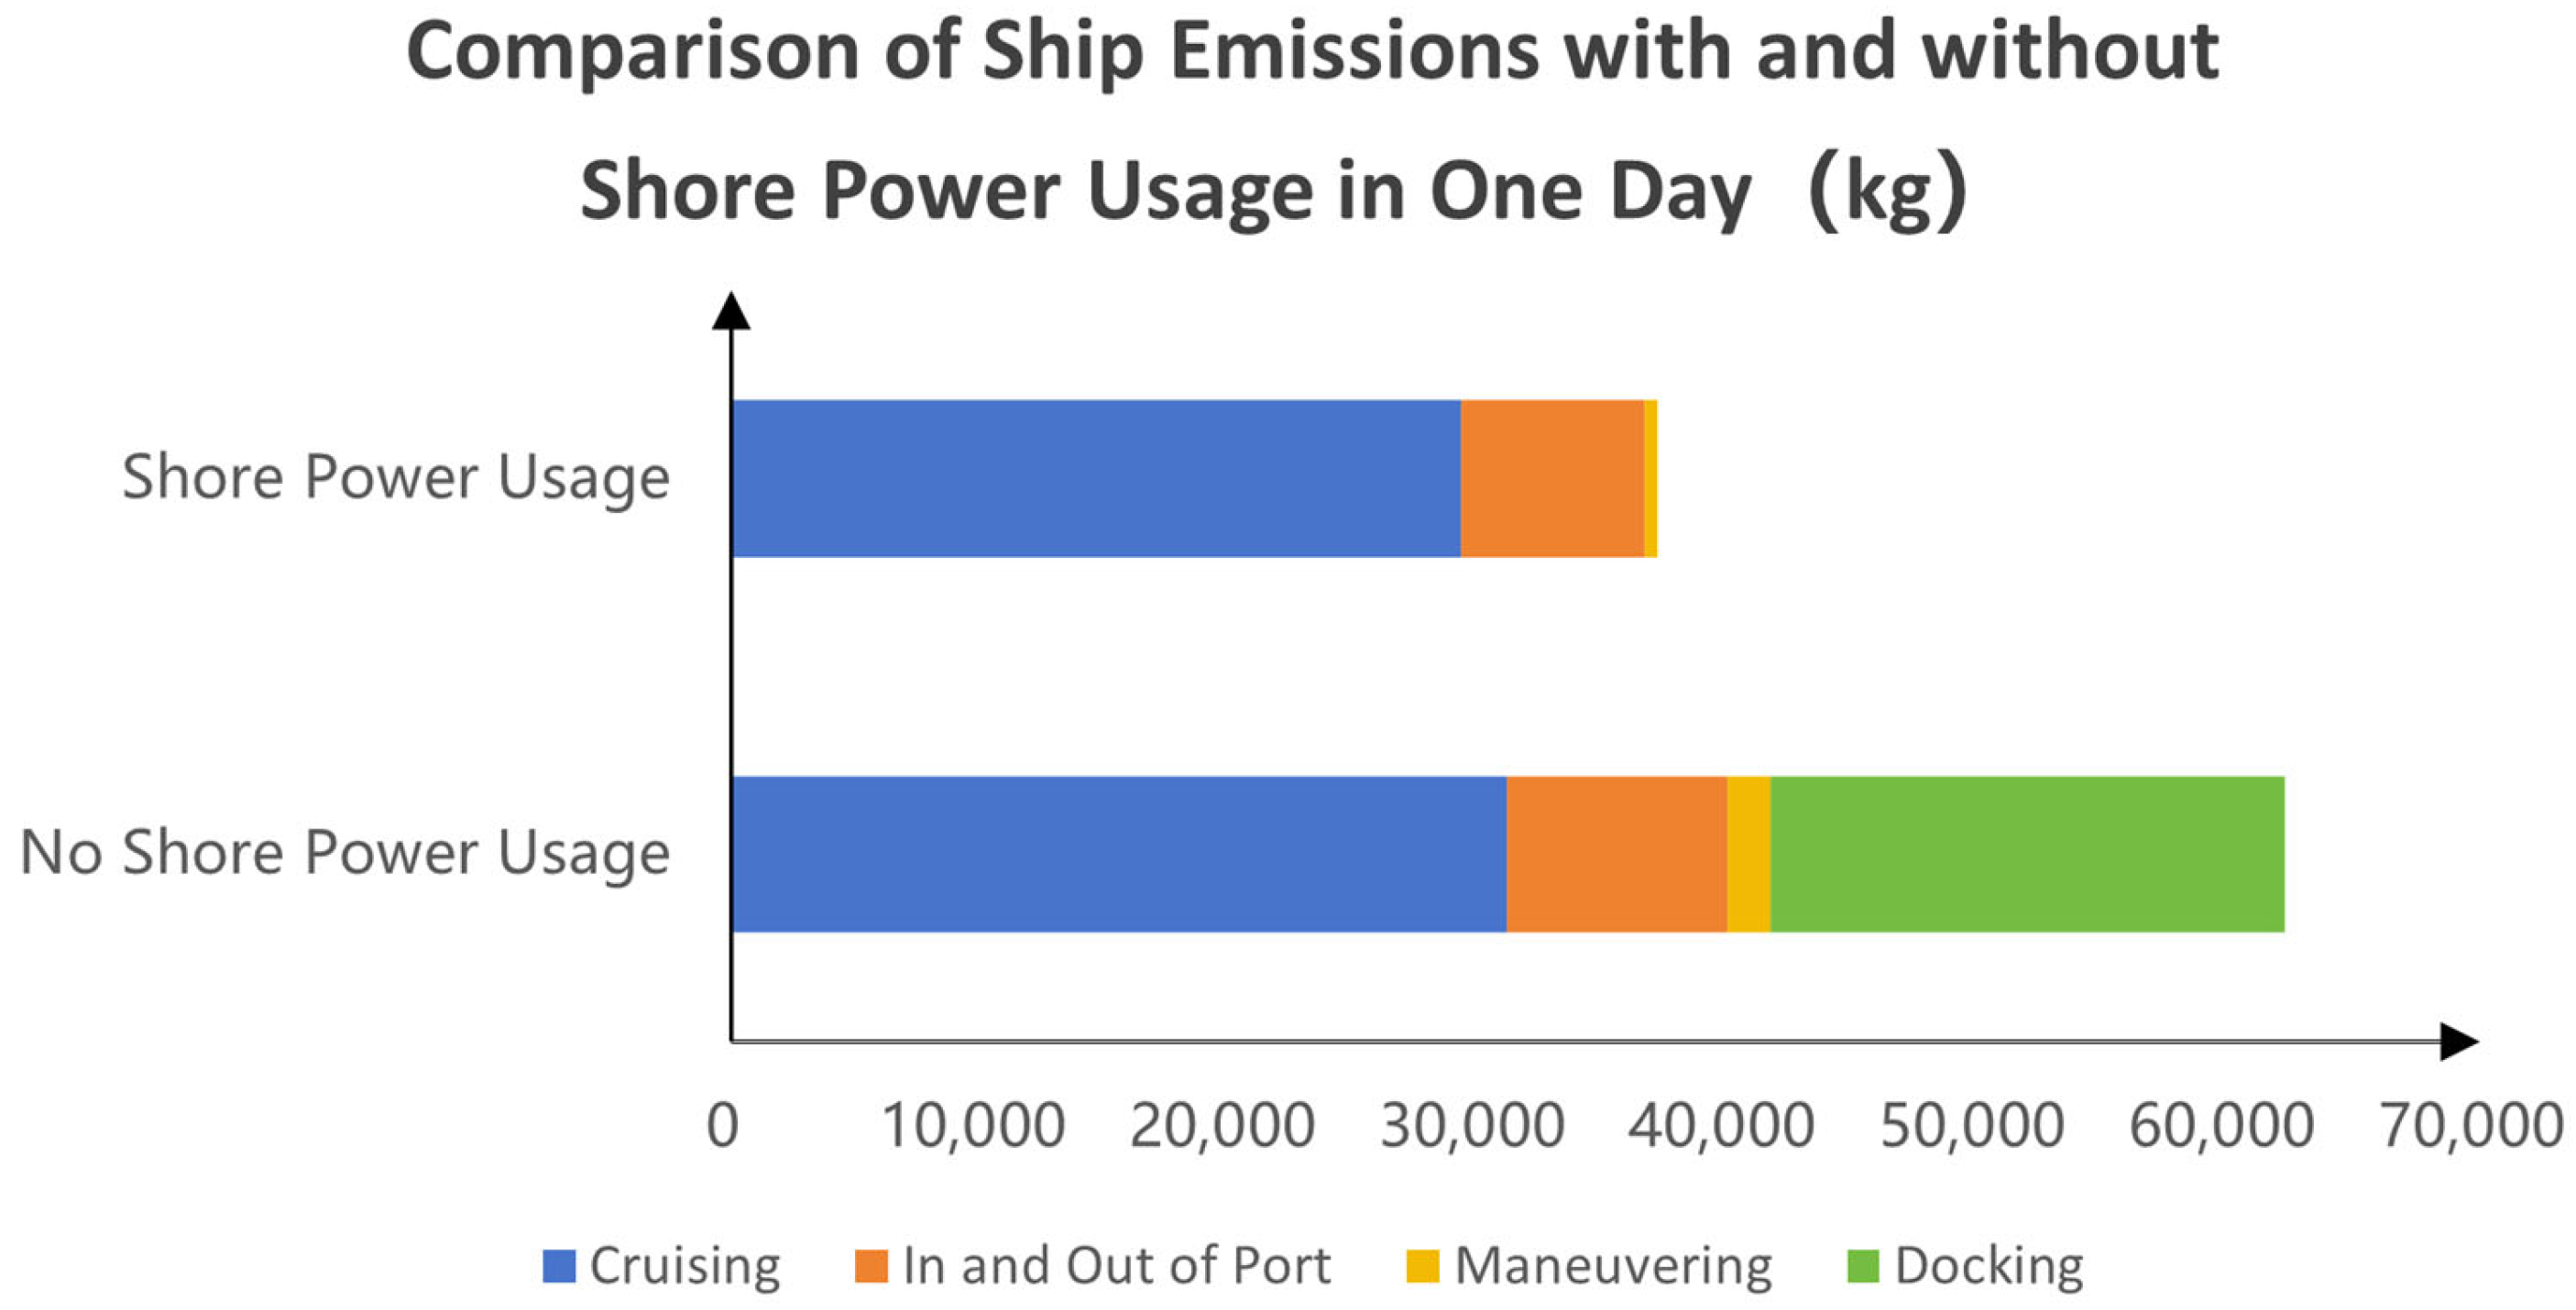
According to the analysis in Section 2.2.1, when ships call at port to use auxiliary engines and boilers for power generation and supply, the carbon emissions in the berthing segment are the highest, so reducing the energy consumption of diesel auxiliary engines is the main means to reduce the emissions from berthing conditions. The implementation of the shore power policy has led to the development and use of shore power systems, and the use of shore power can partially replace the energy use of diesel engines in ship berthing and realize emission reduction. According to the STEAM in Section 2.1, the total emissions of main engine, auxiliary engine and boiler of container ships at Shanghai Port can be obtained by using Equations (1)–(3), which is the ship’s emission without shore power. Emissions under shore power, where only the main engine is used for power supply, are calculated using Equation (4). Figure 4 shows the comparison of emission results between the two cases.
Comparison of the data of the two schemes in Figure 4 shows that, when the container ships in Shanghai port call at port to use shore power, the carbon emissions are greatly reduced, the proportion of the reduction is more than 60%, the use of shore power on the container ships in Shanghai port emission reduction effect is significant. Therefore, encouragement or incentive strategies can be taken to further improve the use of shore power in Shanghai port container ships. However, influenced by the unsound standardization system of shore power use, the lack of leading policies and the high cost of shore power, the average value of shore power use rate of domestic cargo ships is less than 20%, which is a big gap with the target. Up to now, the proportion of emissions from ships at berthing in Shanghai harbor is still high. Based on the current policy and the emission characteristics of berthing conditions in Shanghai port, the following recommendations can be made:
  • Port management and power-related departments can further optimize the power supply and power system between ports and ships, improve the degree of their matching, and enhance the technical level of the shore power system.
  • Government departments can increase financial support and improve tariff preferential policies to control the cost of shore power not to be higher than the cost of fuel power generation.
  • Port authorities may provide subsidies to shipping companies that use shore power during port calls. Maritime and related management departments can give priority to the passage of ships using shore power, and give priority to berths for ships with power receiving facilities, so as to enhance the enthusiasm of ships using shore power in ports and harbors.
Through the above initiatives, the utilization rate of shore power on board ships can be further enhanced and the energy consumption of fuel engines at berthing can be reduced.

3.2. Emission Reduction Path of Shanghai Port Container Terminal’s In-Harbor Operations

3.2.1. Container Terminal Handling Side Optimization

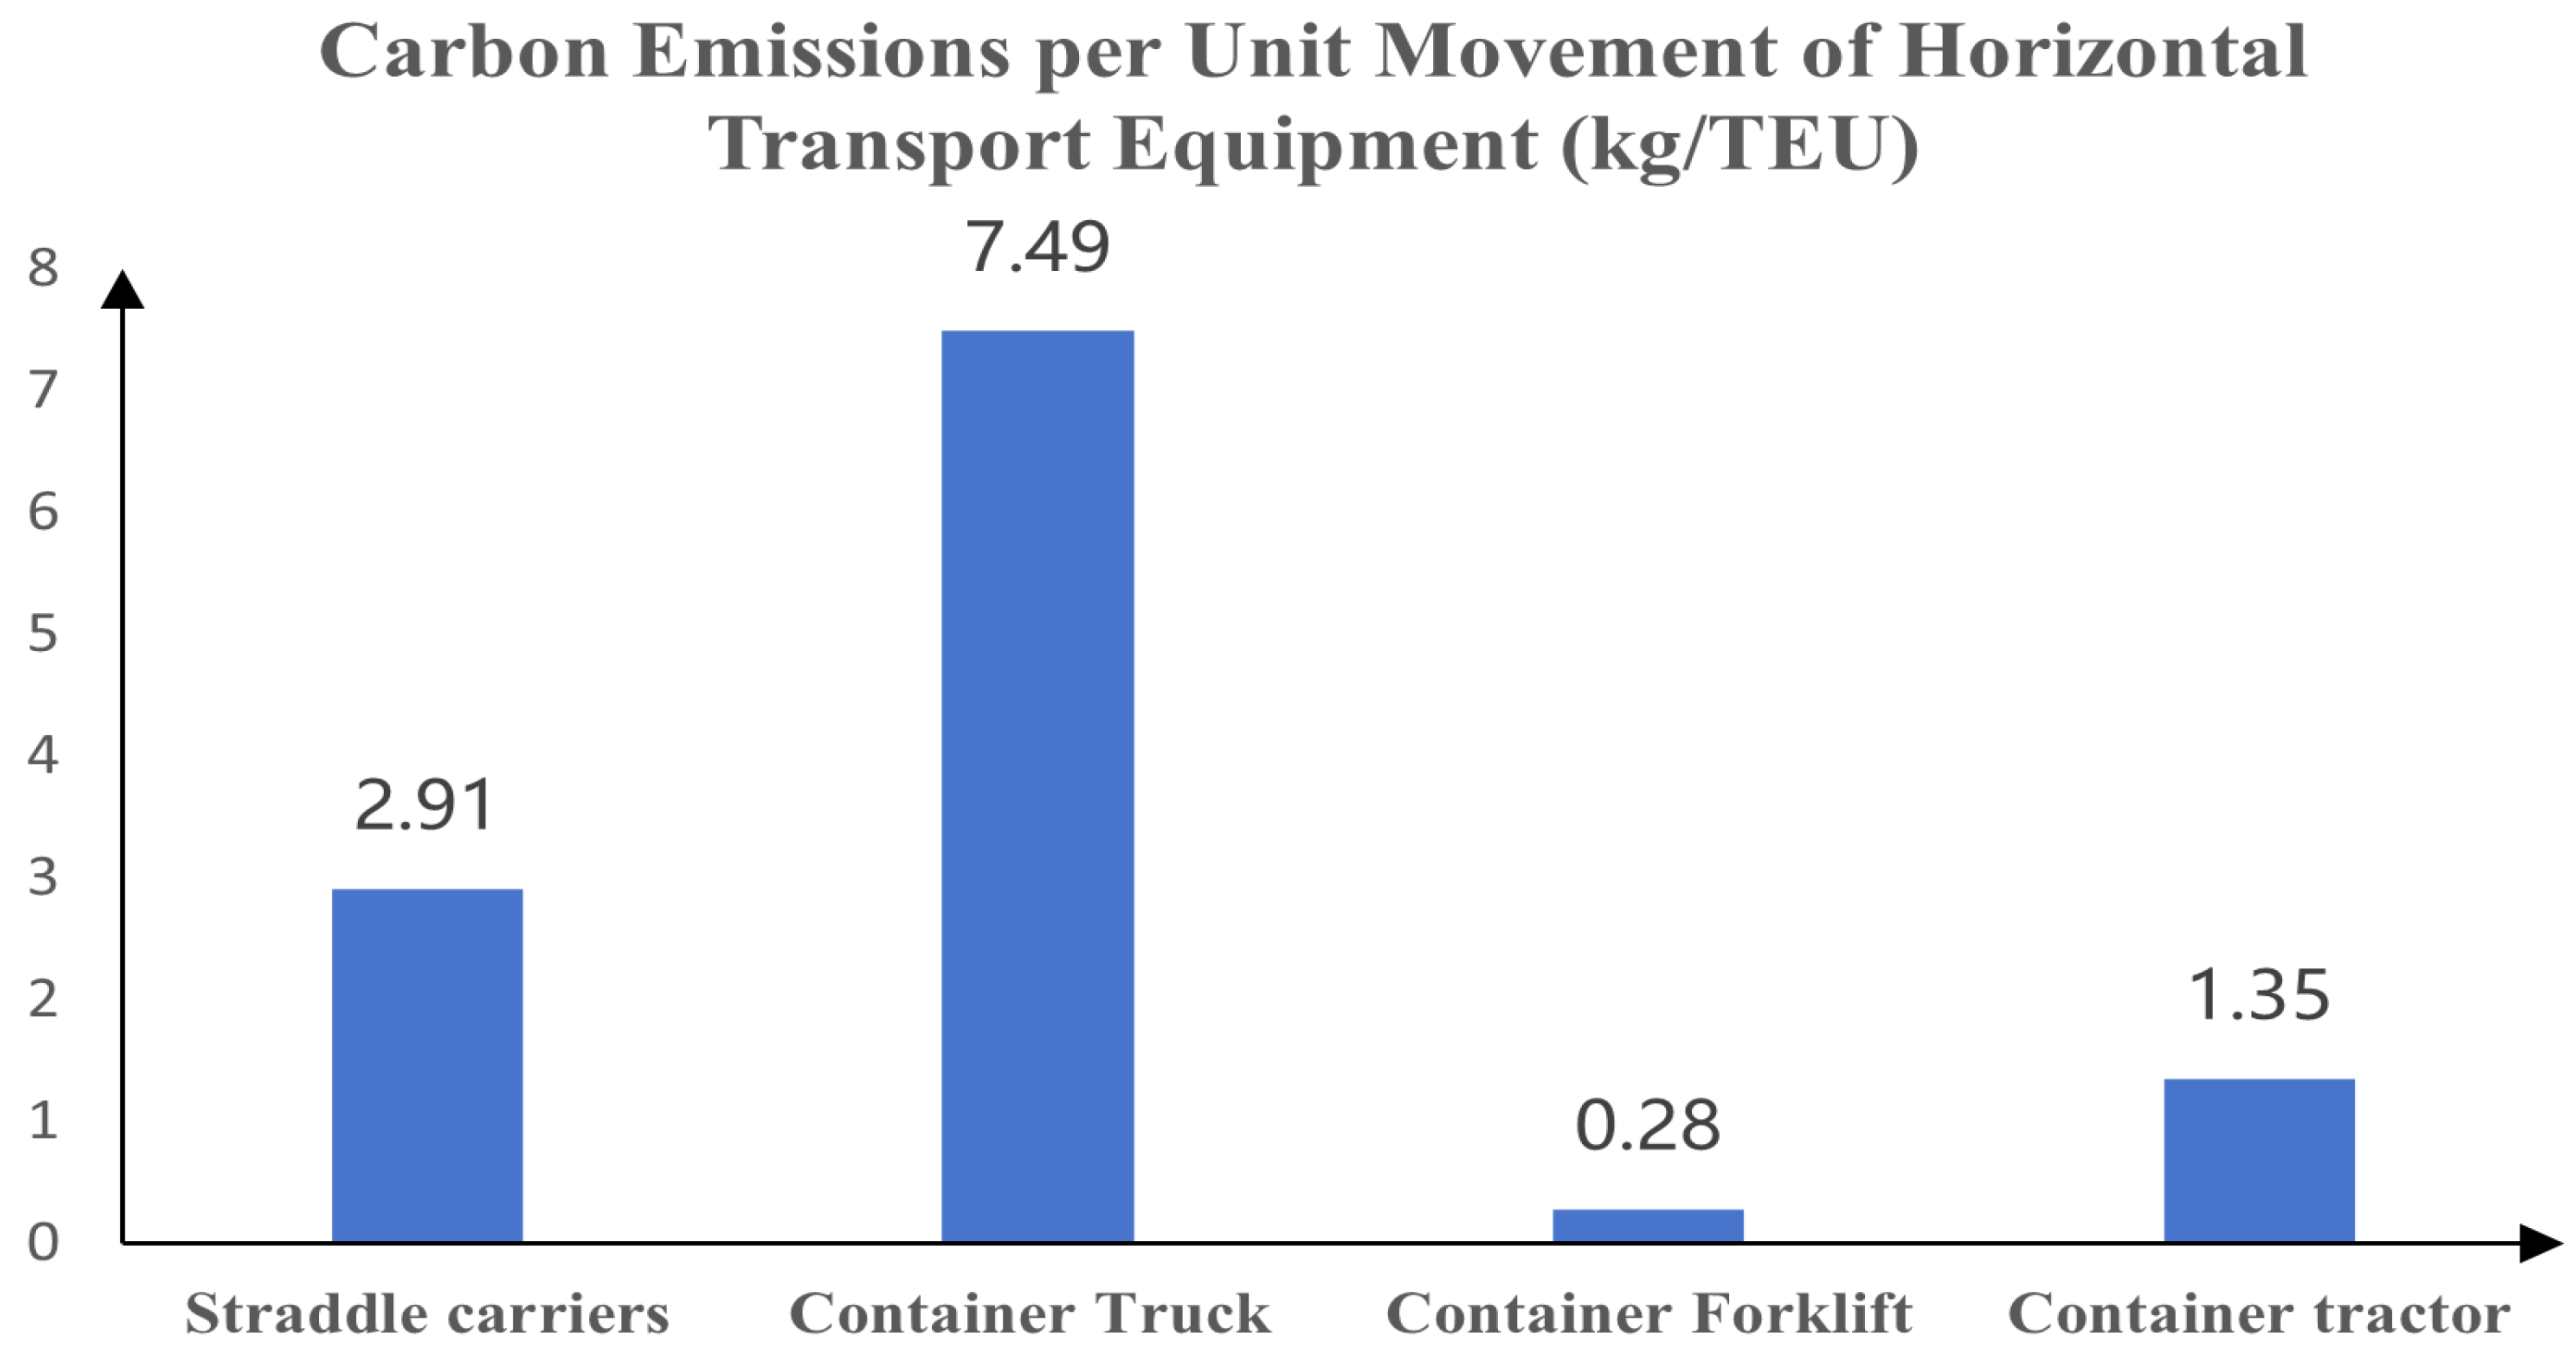
Based on the calculations in Equations (8) and (9), it is possible to compare the emissions per unit of container movement operation for different equipment in the horizontal transportation chain, as shown in Figure 5.
As can be seen from Figure 5, among the main horizontal transportation equipment in Shanghai Port Container Terminal, the emission per unit of mobile work volume of the collector truck is the largest; therefore, Shanghai Port Container Terminal should appropriately reduce the utilization rate of container trucks in the transportation link, improve the utilization rate of high-efficiency and low-carbon transportation equipment, and replace the traditional container trucks for container horizontal transportation operations with “straddle trucks, tractor-trailers, and automatic stacker cranes”. Replacing traditional trucks for horizontal container transportation, so as to optimize the traditional non-automatic loading and unloading scheme of container terminals.

3.2.2. “Oil-to-Gas” Conversion of In-Port Transportation Equipment

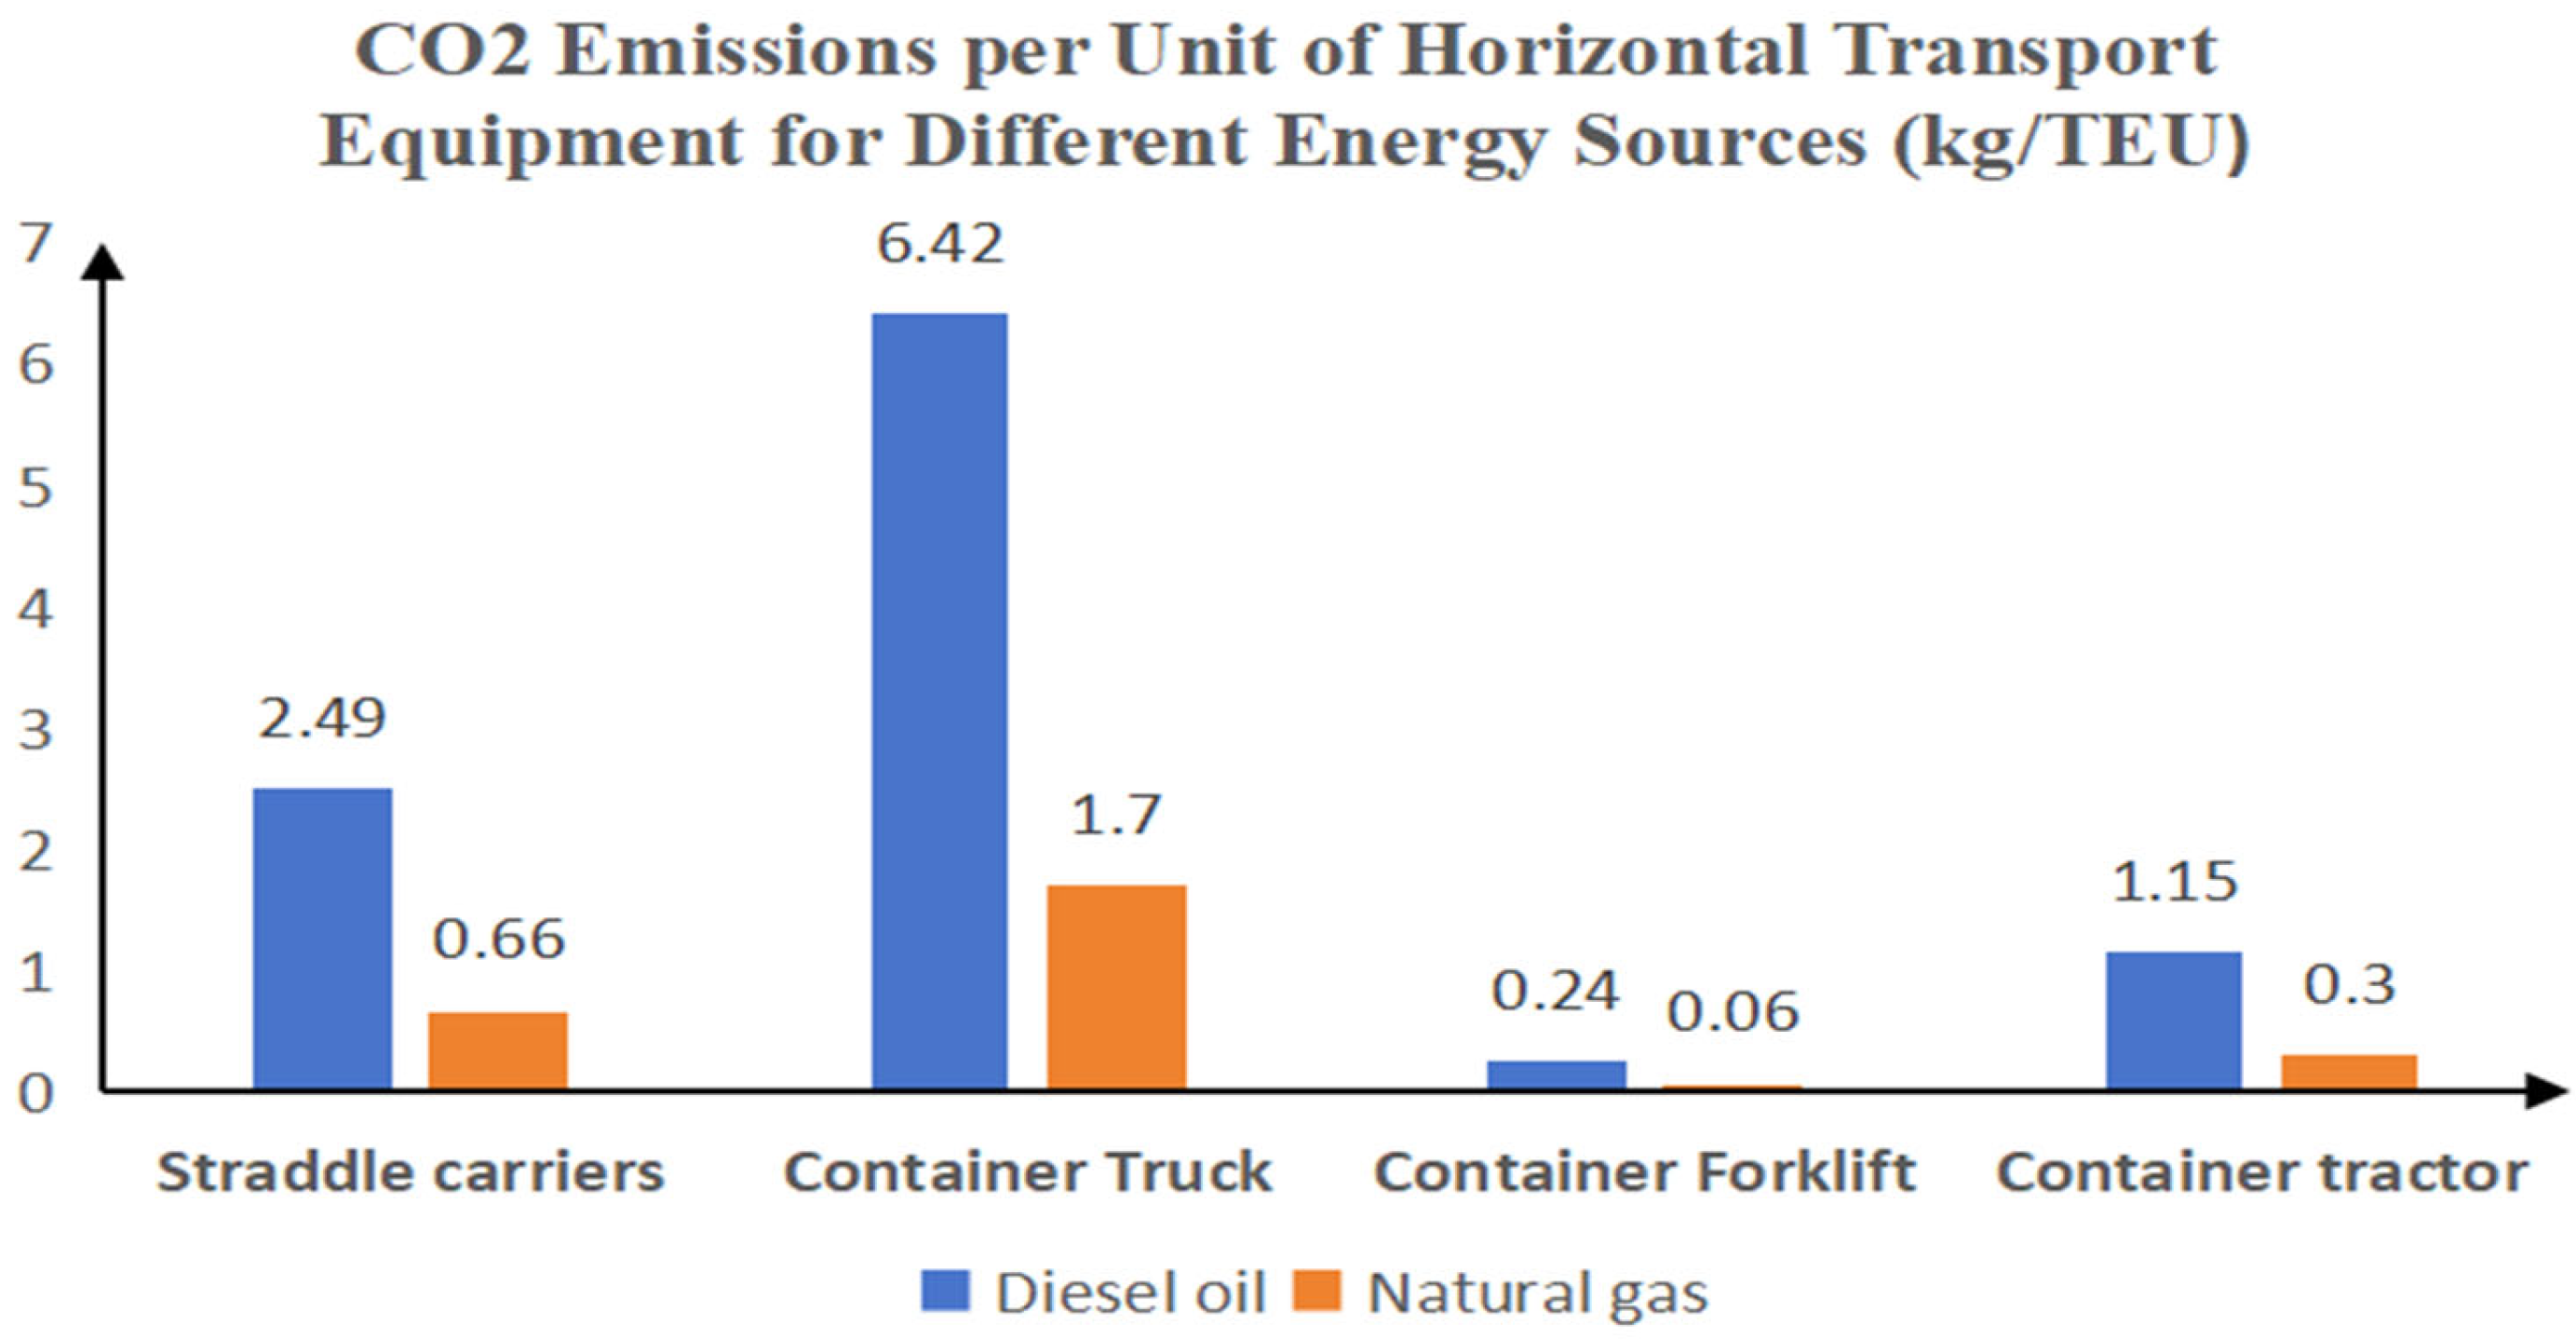
According to the analysis of Section 2.2.2, it can be seen that the highest carbon emission in the in-port operation of Shanghai Port Container Terminal is the horizontal transportation link, which has the highest carbon dioxide emission intensity, and the carbon dioxide is mainly generated from the energy consumption of diesel, so the emission reduction effect of the horizontal transportation equipment in Shanghai Port can be analyzed from the energy point of view. The CO2 emission coefficient of natural gas is 0.181 kg/kWh. Combined with the coefficients given in the previous section, the diesel and natural gas emissions of the horizontal transportation equipment can be calculated for a certain amount of operation, and the results are shown in Figure 6.
As can be seen in Figure 6, the use of natural gas for power generation by horizontal transportation equipment can reduce carbon dioxide emissions by about 73% compared with diesel power generation for the same amount of containerized TEU movement. Therefore, in order to realize the emission reduction of equipment, can adopt the “oil to gas” strategy, can be rubber tire container gantry crane, traditional diesel in-port container trucks and other equipment, fossil fuels to hydrogen fuel, natural gas, oil and other low-carbon clean energy, or to solar energy, wind power and other renewable energy does not cause carbon oxides, sulfur oxides emissions, so as to improve the energy utilization rate of power generation, reduce the work unit of the port equipment to reduce carbon dioxide emissions. Thus improving the energy utilization rate of power generation, reducing the energy consumption of port equipment, reducing the intensity of carbon dioxide, sulfur dioxide and other greenhouse gas emissions.

3.2.3. “Oil-to-Electricity” Conversion of In-Port Transportation Equipment

According to the latest regulations issued by Shanghai Electric Power Company and Shanghai Bureau of Ecology and Environment in 2022, the emission factor of Shanghai’s power grid has been adjusted from 0.788 kg/kwh issued in 2020 to 0.42 kg/kwh. Benefiting from the significant increase in the proportion of new energy power, the electricity consumption of the production and operation equipment of the container terminals in Shanghai port has been increasing year by year, and the utilization rate of power-driven horizontal transportation equipment has been continuously rising. From Equations (8) and (9), we calculate and compare the difference in the emissions of horizontal transportation equipment in Shanghai Port container terminal when power-driven is used instead of diesel-driven, as shown in Figure 7.
As can be seen from Figure 7, in the case of completing the same amount of container TEU mobile operations, the carbon dioxide emissions of electric-powered horizontal transportation equipment are significantly smaller than those of diesel-powered electricity generation, and the use of power supply for horizontal transportation equipment can reduce carbon dioxide emissions by about 39% compared with diesel-powered electricity generation. To reduce emissions from equipment, an “oil-to-electricity” strategy can be implemented by replacing traditional internal combustion machinery, such as diesel gantry cranes and container trucks with pure electric gantry cranes, electric trucks, and automated trolleys, etc., so as to reduce the use of diesel as a representative of the fossil fuel emissions from diesel-based fossil fuel power generation.

4. Discussion

This study introduces a two-layer accounting framework spanning ship berthing/waiting and terminal operations, enabling like-for-like assessment of multiple decarbonization pathways within a unified operational boundary. The analysis shows that the use of shore power reduces berthing emissions by about 60%; within terminal operations, container trucks are the dominant source of emissions, while tire cranes contribute most in stacking. Under a common baseline, transitions from diesel to electricity and to natural gas yield total-emissions reductions of about 39% and about 73%, respectively. These magnitudes are consistent with reports for other ports and regions, supporting the robustness of the framework and its ability to provide decision-relevant signals without cross-study scope inconsistencies.
Notwithstanding these strengths, the current formulation focuses on typical operational phases and does not fully capture latent emissions arising from discontinuous activities such as storage, queuing, and transfer. In addition, the treatment of electricity should be refined to distinguish renewable versus conventional shore-power inputs and to assign the corresponding emission factors. Explicit accounting for energy use and emissions associated with substituted electricity (e.g., grid supply displacing onboard generation) would further enhance accuracy and applicability. These extensions will improve the framework’s precision and generalizability, enabling more comprehensive cross-regional benchmarking and deeper insights for green-port transformation.

5. Conclusions

The proposed methodology, framed within a unified operational boundary, offers a quantitative assessment of various decarbonization measures. Specifically, it demonstrates that shore power can reduce berthing emissions by approximately 60%, while transitioning from oil to electricity and oil to gas can achieve total emissions reductions of about 39% and 73%, respectively. These findings provide a robust basis for prioritizing decarbonization strategies in the green-port transformation process. However, it is important to recognize that ship decarbonization is a complex, long-term endeavor, influenced by factors such as costs, equipment renewal cycles, and infrastructure limitations. Future research will aim to broaden the scope of the model by addressing discontinuous activities, incorporating source-resolved accounting for shore power with accurate emission factors, and conducting systematic cross-regional comparisons to further refine the model’s applicability and generalizability across different operational contexts.

Author Contributions

Conceptualization, Z.X. and B.L.; methodology, B.L.; software, B.L.; validation, H.W. and L.C.; formal analysis, C.P. and Z.X.; investigation, B.L.; resources, C.P. and J.L.; data curation, B.L. and H.W.; writing—original draft preparation, B.L.; writing—review and editing, Z.X.; visualization, L.C. and J.L.; supervision, Z.X. and C.P.; project administration, Z.X. and C.P.; funding acquisition, Z.X. All authors have read and agreed to the published version of the manuscript.

Funding

This work was supported in part by the Open Research Fund of Key Laboratory for Vehicle Emission. Control and Simulation of the Ministry of Ecology and Environment, Chinese Research Academy of Environmental Sciences (VECS2024K03), and the Fundamental Research Funds for the Central Public-interest Scientific Institution (2024YSKY-03), the National Natural Science Foundation of China (62103124, 62033012), and the open research fund of Anhui Provincial Key Laboratory of Intelligent Low-Carbon Information Technology and Equipment.

Institutional Review Board Statement

Not applicable.

Informed Consent Statement

Not applicable.

Data Availability Statement

The data presented in this study are available on request from the corresponding author.

Conflicts of Interest

The authors declare no conflicts of interest.

References

  1. Liu, R.; Liu, Z.; Zhao, J.Y.; Cui, D.D.; Jiang, H. Research on Carbon Emission Accounting Methods in the Logistics Industry at Home and Abroad. Transp. Energy Conserv. Environ. Prot. 2023, 19, 64–71. [Google Scholar] [CrossRef]
  2. Chen, W.J.; Song, B.L.; Zhang, J.S. Carbon emission from coastal container ports in China based on AIS data. China Environ. Sci. 2022, 42, 3403–3411. [Google Scholar] [CrossRef]
  3. Tao, X.Z.; Li, H.Q.; Wang, Q.Y. Development process, policy measures, and social benefits analysis of shore power construction and utilization in Shanghai Port. Transp. Port Navig. 2022, 9, 73–77. [Google Scholar] [CrossRef]
  4. Zeng, B.; Zhao, J. Exploration of ship emission reduction strategies in Shanghai Port. China Ocean. Law Rev. 2015, 2, 324–332. [Google Scholar] [CrossRef]
  5. Zeng, F.T.; Lv, J. Ship emission inventory and port eco-efficiency evaluation of Xiamen Port. China Environ. Sci. 2020, 40, 2304–2311. [Google Scholar] [CrossRef]
  6. Berechman, J.; Tseng, P.H. Estimating the environmental costs of port related emissions: The case of Kaohsiung. Transp. Res. Part D Transp. Environ. 2012, 17, 35–38. [Google Scholar] [CrossRef]
  7. Li, X.D.; Kuang, H.B.; He, H.Y. Evolutionary game research on emission reduction in port and shipping systems under government environmental regulation. J. Transp. Syst. Eng. Inf. Technol. 2023, 23, 17–29. [Google Scholar] [CrossRef]
  8. Chen, Z.S.; Huang, Y.D.; Zhang, Y. Discussion on Statistical and Calculation Methods for Transportation Carbon Emissions. West. China Commun. Sci. Technol. 2023, 7, 204–206. [Google Scholar] [CrossRef]
  9. Liu, L.; Ding, H. Review of Estimation and Decomposition Methods for Greenhouse Gas Emissions. Value Eng. 2010, 29, 223–224. [Google Scholar]
  10. Zhang, Z.; Rong, W.; Liu, Y.; Yang, Y. Port carbon emission estimation: Principles, practices, and machine learning applications. Transp. Res. Part E: Logist. Transp. Rev. 2025, 199, 104159. [Google Scholar] [CrossRef]
  11. Freitas, D.; Gervásio, H. The challenge of benchmarking carbon emissions in maritime ports. Environ. Pollut. 2024, 363, 125170. [Google Scholar] [CrossRef]
  12. Mou, N.; Zhang, X.; Yang, T.; Xu, H.; Zheng, Y.; Wang, J.; Niu, J. Carbon footprints: Uncovering multilevel spatiotemporal changes of ship emissions during 2019–2021 in the US. Sci. Total Environ. 2024, 912, 169395. [Google Scholar] [CrossRef]
  13. Villalba, G.; Gemechu, E.D. Estimating GHG emissions of marine ports—The case of Barcelona. Energy Policy 2011, 39, 1363–1368. [Google Scholar] [CrossRef]
  14. Fan, A.H.; Yan, X.P.; Li, Z.K.; Zhang, H.Y. The Demand, Pathways, and Prospects of Green and Low-Carbon Development in China's Shipping Industry. Ship Ocean. Eng. 2024, 53, 1–5+12. [Google Scholar]
  15. Budiyanto, M.A.; Huzaifi, M.H.; Sirait, S.J.; Prayoga, P.H.N. Evaluation of CO2 emissions and energy us with different container terminal layouts. Sci. Rep. 2021, 11, 5476. [Google Scholar] [CrossRef] [PubMed]
  16. Yang, Y.C. Operating strategies of CO2 reduction for a container terminal based on carbon footprint perspective. J. Clean. Prod. 2017, 141, 472–480. [Google Scholar] [CrossRef]
  17. Chang, C.C.; Wang, C.M. Evaluating the effects of green port policy: Case study of Kaohsiung harbor in Taiwan. Transp. Res. Part D Transp. Environ. 2012, 17, 185–189. [Google Scholar] [CrossRef]
  18. Yang, Y.C.; Lin, C.L. Performance analysis of cargo-handling equipment from a green container terminal perspective. Transp. Res. Part D Transp. Environ. 2013, 23, 9–11. [Google Scholar] [CrossRef]
  19. Okşaş, O. Carbon emission strategies for container handling equipment using the activity-based method: A case study of Ambarlı container port in Turkiye. Mar. Policy 2023, 149, 105480. [Google Scholar] [CrossRef]
  20. Zhang, Y.; Peng, Y.Q.; Wang, W.; Gu, J.; Wu, X.J.; Feng, X.J. Air emission inventory of container ports’ cargo handling equipment with activity-based “bottom-up” method. Adv. Mech. Eng. 2017, 9, 1687814017711389. [Google Scholar] [CrossRef]
  21. Wang, L.; Li, Y. Estimation methods and reduction strategies of port carbon emissions-what literatures say? Mar. Pollut. Bull. 2023, 195, 115451. [Google Scholar] [CrossRef]
  22. Zhang, C.; Yang, Y.; Wang, N. Port governance and sustainable development: The impact of port smartization on port carbon emission efficiency. Ocean. Coast. Manag. 2024, 259, 107485. [Google Scholar] [CrossRef]
  23. Qi, Y.; Yang, J.; Qin, K.S. Spatial-temporal analysis of carbon emissions from ships in ports based on AIS data. Ocean. Eng. 2024, 308, 118394. [Google Scholar] [CrossRef]
  24. Yang, A.; Meng, X.; He, H.; Wang, L.; Gao, J. Towards optimized armgs’ low-carbon transition investment decision based on real options. Energies 2022, 15, 5153. [Google Scholar] [CrossRef]
  25. Li, Q. Current Situation of Carbon Emissions in China’s Waterway Transportation and Analysis of Carbon Reduction Paths . Transp. Energy Conserv. Environ. Prot. 2021, 17, 1–4+12. [Google Scholar] [CrossRef]
  26. Liang, J.B.; Chen, R. Research and Application of a Port Carbon Emission Accounting System. Port Waterw. Eng. 2024, 07, 51–55. [Google Scholar] [CrossRef]
  27. Peng, C.S. Port Carbon Emissions Accounting Methods: A Case Study of the 2010 Carbon Footprint Report of Jurong Port, Singapore. Port Econ. 2012, 7, 5–9. [Google Scholar]
  28. Tai, H.H.; Chang, Y.H. Reducing pollutant emissions from vessel maneuvering in port areas. Marit. Econ. Logist. 2022, 24, 651. [Google Scholar] [CrossRef]
  29. Zhou, C.; Tang, W.; Liu, Z.; Huang, H.; Huang, L.; Xiao, C.; Wu, L. Exploring carbon emission reduction in inland port ship based on a multi-scenario model. J. Mar. Sci. Eng. 2024, 12, 1553. [Google Scholar] [CrossRef]
  30. Chang, Y.T.; Song, Y.; Roh, Y. Assessing greenhouse gas emissions from port vessel operations at the Port of Incheon. Transp. Res. Part D Transp. Environ. 2013, 25, 1–4. [Google Scholar] [CrossRef]
  31. Fu, Q.; Shen, Y.; Zhang, J. Study on the Emission Inventory of Atmospheric Pollutants from Ships in Shanghai Port. J. Saf. Environ. 2012, 12, 57–64. [Google Scholar] [CrossRef]
  32. Xuan, H.; Liang, P.; Sun, J.; Zhang, Q. Problems and Countermeasures for the Green and Low-Carbon Development of the Waterway Transport Industry. Environ. Impact Assess. 2022, 44, 59–64. [Google Scholar] [CrossRef]
  33. Kontovas, C.; Psaraftis, H.N. Reduction of emissions along the maritime intermodal container chain: Operational models and policies. Marit. Policy Manag. 2011, 38, 451–469. [Google Scholar] [CrossRef]
  34. Georgakaki, A.; Coffey, R.A.; Lock, G.; Sorenson, S.C. Transport and Environment Database System (TRENDS): Maritime air pollutant emission modelling. Atmos. Environ. 2005, 39, 2357–2365. [Google Scholar] [CrossRef]
  35. Dong, G.; He, X. Research on Carbon Emissions of Container Terminals Based on Loading and Unloading Processes. Mod. Manag. Sci. 2014, 2, 99–101. [Google Scholar] [CrossRef]
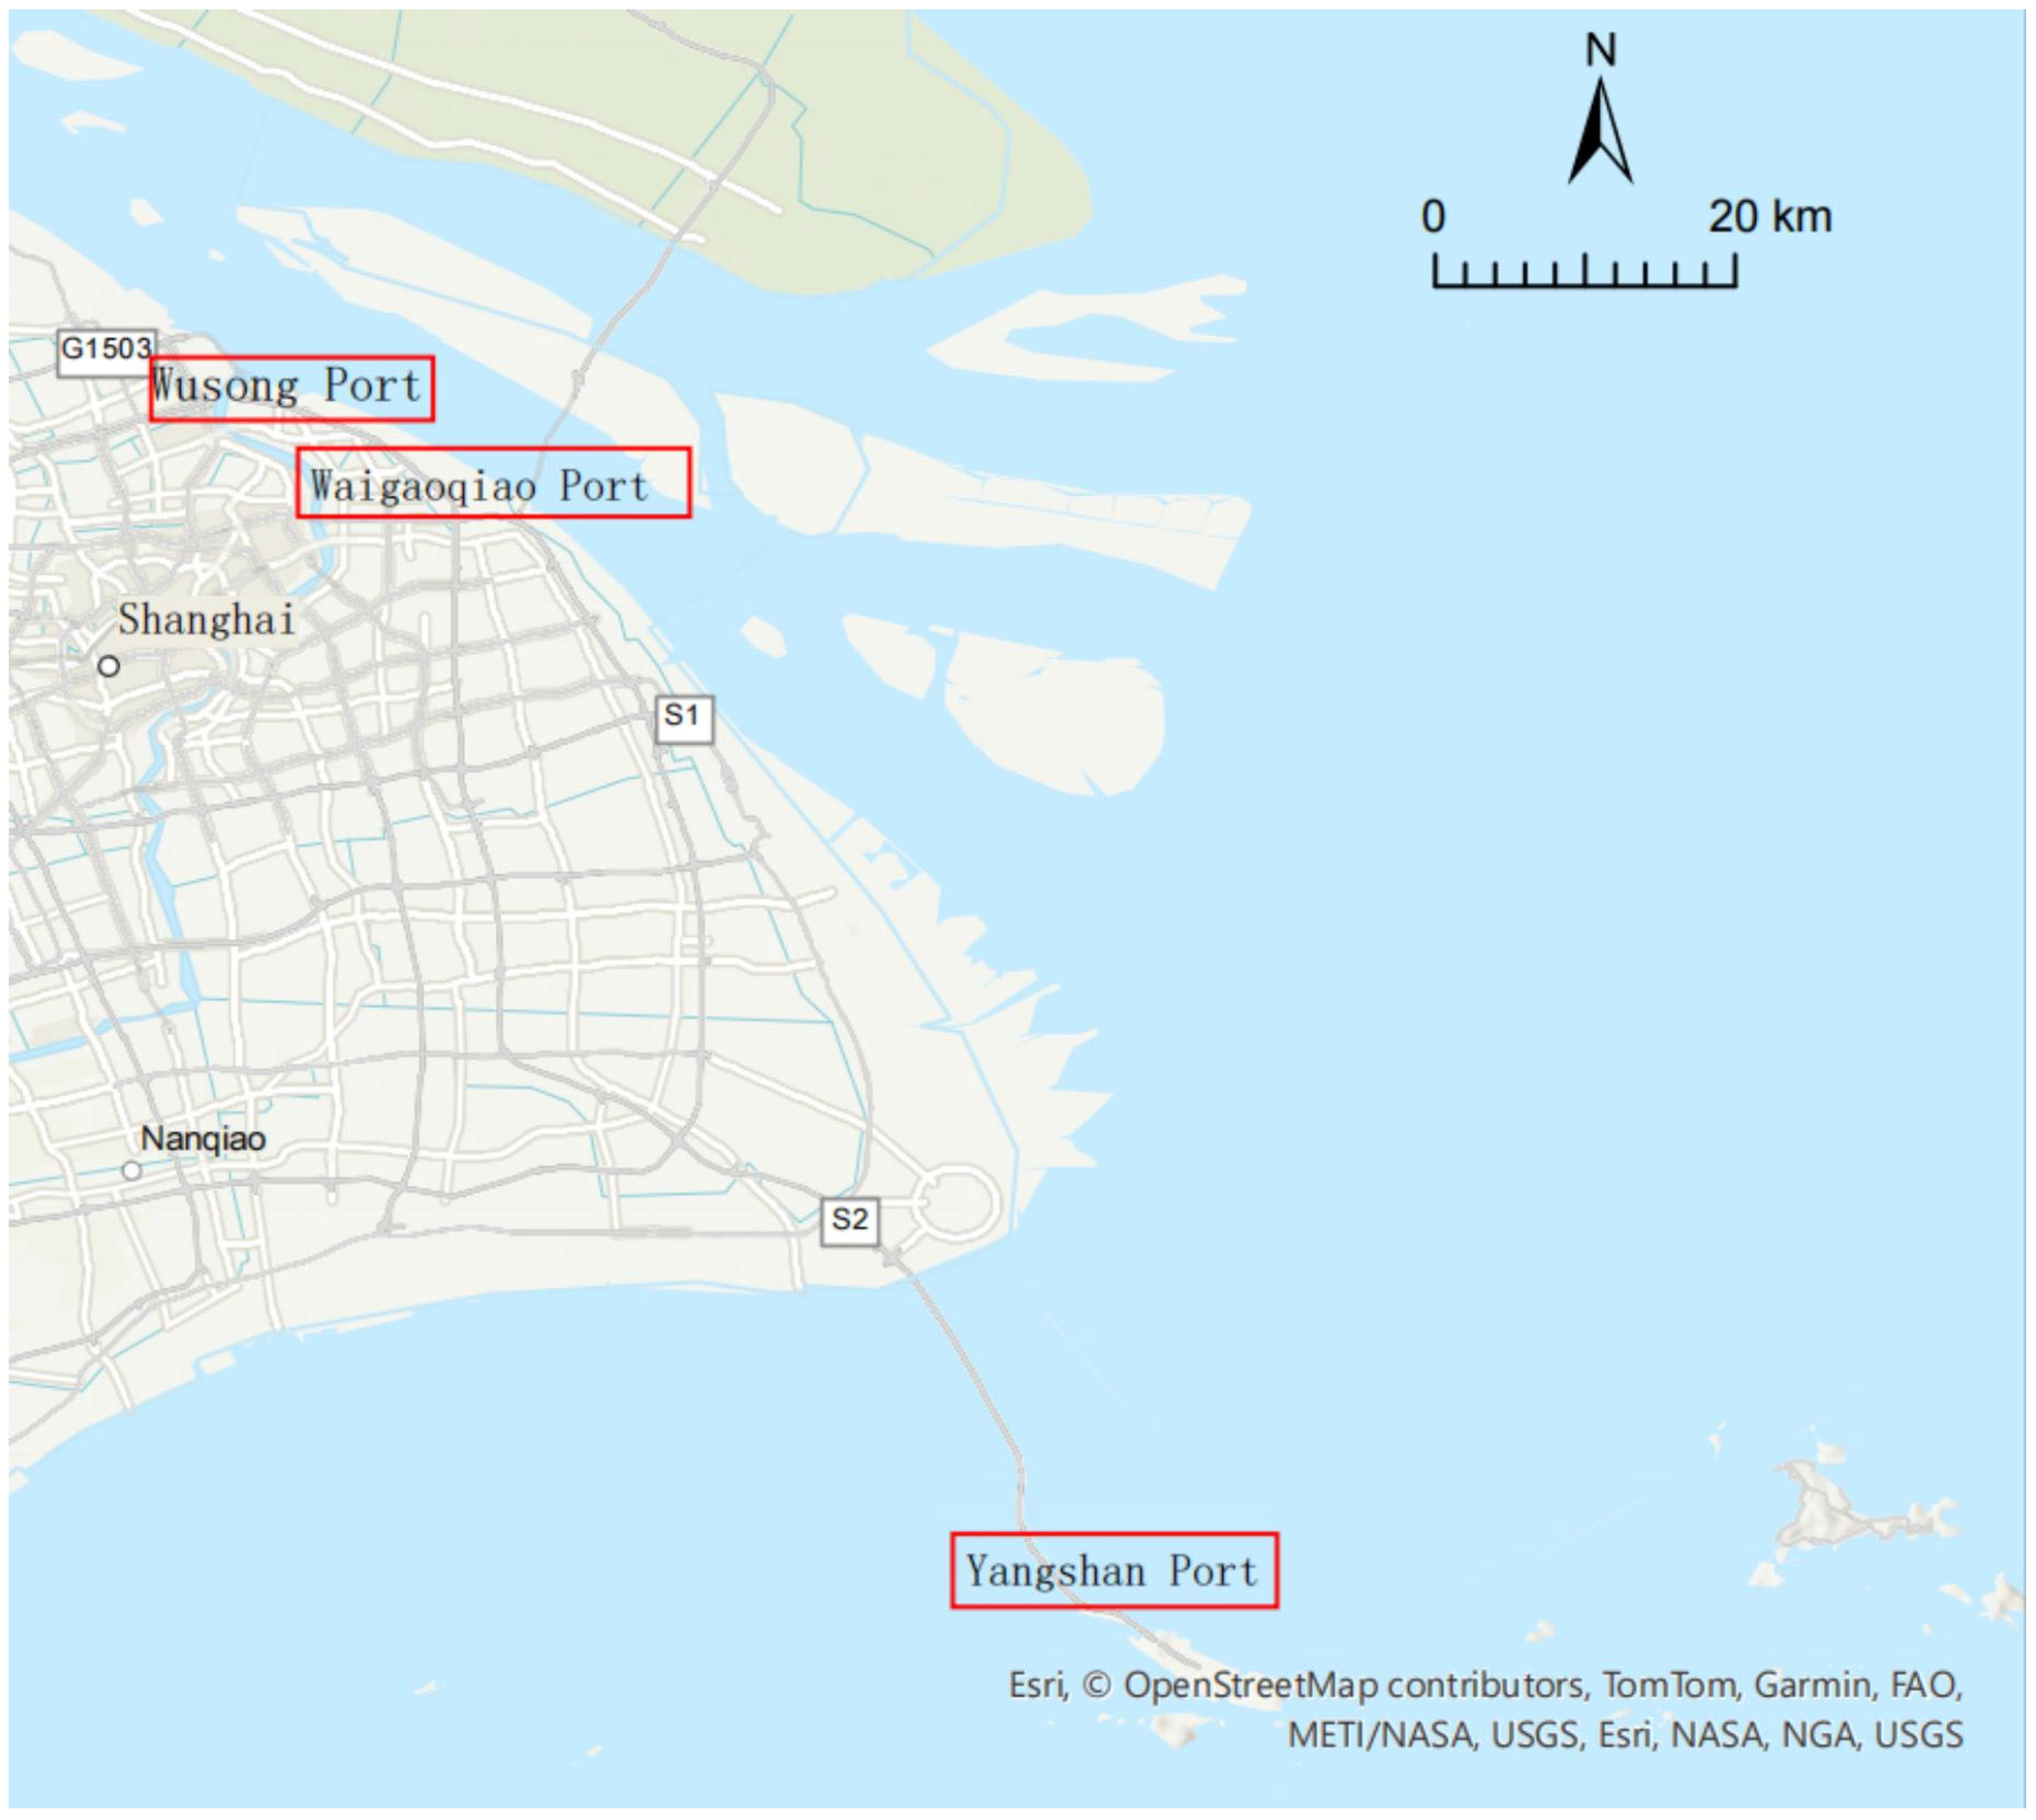
Figure 1. Location Distribution Map of Container Terminals in the Three Major Port Areas of Shanghai Port.
Atmosphere 16 01158 g001
Figure 2. Container carbon bi-level estimation framework.
Atmosphere 16 01158 g002
Figure 3. CO2 Emission Intensity for Each Stage at Shanghai Port Container Terminal (Unit: KG/TEU). It can be seen that among the three links of lifting and loading (bridge crane), horizontal transportation (container trucks) and yard operation (tire cranes), the highest carbon emission intensity of container terminals is in the horizontal transportation link based on the mode of container trucks, i.e., the link of the activity of transporting to the yards after completing the loading and unloading from the front of the terminals.
Atmosphere 16 01158 g003
Figure 4. Comparison of Ship Emissions with and without Shore Power Usage in One Day (kg).
Atmosphere 16 01158 g004
Figure 5. Carbon Emissions per Unit Movement of Horizontal Transport Equipment (kg/TEU).
Atmosphere 16 01158 g005
Figure 6. CO2 Emissions per Unit of Horizontal Transport Equipment for Different Energy Sources (kg/TEU).
Atmosphere 16 01158 g006
Figure 7. CO2 Emissions from Horizontal Transport Equipment for Different Energy Sources during Power Generation or Supply.
Atmosphere 16 01158 g007
Table 1. Berthing Data of Representative Container Vessels at Shanghai Port.
Ship AttributesData (Unit)
Average Ship Length
Average Ship Width
Average Tonnage
Average Type
Main Engine Rated Power
Auxiliary Engine Rated Power
Boiler Power Usage
400 m
60 m
200,000 t
20,000 TEU
77,000 kw
3000 kw
1000 kw
Main Engine/Auxiliary Engine Load FactorCruising
In and Out of Port
Maneuvering
Docking
0.37/0.13
0.14/0.25
0.01/0.5
0/0.17
Average Activity TimeCruising
In and Out of Port
Maneuvering
Docking
1.5 h
1 h
0.6 h
15.6 h
Table 2. Ship Engine Gas Emission Coefficients (kg/kWh).
CategorySO2
Main Engine
Auxiliary Engine Boiler
Boiler
0.012
0.012
0.017
Table 3. Correction Coefficients for Different Diesel Emission Gases.
Fuel TypeCO2SO2
Diesel10.56
0.5% Light Diesel10.18
0.2% Light Diesel10.07
Table 4. Container Terminal Handling Equipment Inventory.
FunctionEquipment Name
LiftingGantry Crane
Barge Crane
Horizontal TransportContainer Transporter
Container Truck
Container Forklift
Container tractors
StackingReach Stacker
Rail Mounted Gantry Crane
Automatic Stacking
Table 5. Unit Movement Values for In-Port Operational Equipment at Shanghai Port Container Terminals.
DriveEquipmentNumber of Unit
Container
Displacements
Completed
(Times/TEU)
Unit
Fixed
Energy
Consumption
Unit
Variable
Energy
Consumption
Operation
Distance
per Unit
Container
Displacement
(km/Times)
diesel oilContainer Transporter0.650.80 L3.50 L/km0.25
Container Truck0.861.10 L1.80 L/km1.2
Container Forklift0.04/4.00 L/km0.65
Container tractor0.06/4.20 L/km2
electric powerGantry Crane0.486.00 kwh//
Barge Crane0.294.00 kwh//
Tire Crane15.00 kwh//
Automatic Stacking Crane15.00 kwh//
Table 6. Carbon dioxide emissions of each link of ships arriving at Shanghai port.
Shore Power UsageActivity StageCO2 Emissions (kg)Percentage (%)
No Shore Power UsageCruising31,042.5549.93
In and Out of Port8844.9914.23
Maneuvering1722.612.77
Docking20,565.9533.07
Shore Power UsageCruising29,188.0078.72
In and Out of Port7362.7419.86
Maneuvering525.911.42
Docking0.000.00
Table 7. CO2 Emissions per Unit Standard Container Movement by In-Port Equipment at Container Terminals.
StageEquipmentCO2 Unit Emission (kg/TEU)
LiftingGantry Crane1.62
Barge Crane0.65
StackingTire Crane2.81
Automatic Stacking Crane2.81
Horizontal TransportStraddle carriers2.91
Container Truck (Horizontal Transport)7.49
Container Forklift0.28
Container tractor1.35
Disclaimer/Publisher’s Note: The statements, opinions and data contained in all publications are solely those of the individual author(s) and contributor(s) and not of MDPI and/or the editor(s). MDPI and/or the editor(s) disclaim responsibility for any injury to people or property resulting from any ideas, methods, instructions or products referred to in the content.