Article

Diverging Carbon Balance and Driving Mechanisms of Expanding and Shrinking Cities in Transitional China

1
School of Land Science and Technology, China University of Geosciences, Beijing 100190, China
2
Department of Urban Planning and Design, Faculty of Architecture, The University of Hong Kong, Hong Kong, China
3
Technology Innovation Center for Ecological Conservation and Restoration in Dongting Lake Basin, Ministry of Natural Resources, Beijing 100006, China
*
Author to whom correspondence should be addressed.
These authors contributed equally to this work.
Atmosphere 2025, 16(10), 1155; https://doi.org/10.3390/atmos16101155
Submission received: 23 August 2025 / Revised: 28 September 2025 / Accepted: 29 September 2025 / Published: 1 October 2025
(This article belongs to the Section Air Quality)

Abstract

The synergy between carbon neutrality and urbanization is essential for effective climate governance and socio-ecological intelligent transition. From the perspective of coupled urban dynamic evolution and carbon metabolism systems, this study integrates the Sen-MK trend test and the geographical detector model to explore the spatial–temporal differentiation patterns and driving mechanisms of carbon balance across 337 prefecture-level cities in China from 2012 to 2022. The results reveal a spatial–temporal mismatch between carbon emissions and carbon storage, forming an asymmetric carbon metabolism pattern characterized by “expansion-dominated and shrinkage-dissipative” dynamics. Carbon compensation rates exhibit a west–high to east–low gradient distribution, with hotspots of expansionary cities clustered in the southwest, while shrinking cities display a dispersed pattern from the northwest to the northeast. Based on the four-quadrant carbon balance classification, expansionary cities are mainly located in the “high economic–low ecological” quadrant, whereas shrinking cities concentrate in the “low economic–high ecological” quadrant. Industrial structure and population scale serve as the dual-core drivers of carbon compensation. Expansionary cities are positively regulated by urbanization rates, while shrinking cities are negatively constrained by energy intensity. These findings suggest that differentiated regulation strategies can help optimize carbon governance within national territorial space.

1. Introduction

Since the advent of the industrial era, the deep-seated conflict between humans and nature has become increasingly evident in the process of generating material wealth. The Sixth Assessment Report of the Intergovernmental Panel on Climate Change [1] indicates that the continuous increase in global greenhouse gas emissions driven by human activities is the principal cause of global warming. The acceleration of industrialization and the consumption of fossil fuels have led to rising greenhouse gas emissions, triggering climate change and threatening ecological security [2]. This poses challenges to human survival and constrains the sustainable development process of Asian economies [3]. Reaching net-zero greenhouse gas emissions, commonly referred to as carbon neutrality, represents a vital measure for mitigating climate change and advancing sustainable development [4]. Against the backdrop of Asia’s widespread challenges of surging energy demand and environmental pressures [5], China—as a developing nation within this region—is progressively moving away from traditional industrial development models by implementing low-carbon strategies tailored to its unique resource endowments [6]. Through technological advancements and supply chain optimization, China is exerting a radiating influence on neighboring countries [7]. Accordingly, it is imperative to examine the spatiotemporal patterns and driving forces of carbon budgets in different types of cities, so as to inform theory and practice for achieving a comprehensive green transition in both economic and social development.
The current research in carbon balance primarily focuses on the accounting of carbon sources and sinks at various scales, the spatiotemporal evolution of carbon budgets, and the analysis of driving factors [8]. The accuracy and reliability of data results are crucial for carbon budget accounting methods. Currently, the estimation of carbon emissions mainly relies on production [9] and consumption accounting methods [10,11], such as Nel et al. assessed the impact of fossil fuel reserves and low-carbon technologies on global warming projections using the Energy Reference Case (ERC) [12]. However, inconsistencies in the statistical scope and missing sectoral data in urban energy inventories prevent the current framework from meeting energy consumption carbon accounting requirements. Given the strong correlation between nighttime light data and energy consumption carbon emissions, existing international studies have shown that nighttime light data can be effectively used to estimate energy carbon emissions [13,14]. The carbon sink function of ecosystems essentially involves the process of converting atmospheric carbon into organic carbon and storing it long-term in vegetation and soil [15]. As the primary output of this conversion process, net primary productivity serves as a key determinant of ecosystem carbon sinks and regulates ecological processes [16]. Carbon sinks can be simulated through the vegetation-climate relationship, which helps predict the dynamic impact of climate change on terrestrial carbon balance [17]. As a comprehensive and complex system, carbon balance is influenced by human activities such as energy structure, economic development levels, and social environments, all of which can affect ecosystem services to some extent. The LMDI index method enables residual-free decomposition of carbon emission drivers for historical attribution [18]; the STIRPAT model is primarily used to test the elasticity of various drivers on the dependent variable and conduct multi-scenario projections [19]; spatial econometric models focus on identifying and quantifying spatial dependencies and spillover effects between the dependent variable and its drivers [20]; Geodetector methods reveal interactions among multiple drivers. Zhang et al. employed this method to detect spatial heterogeneity in carbon emissions, effectively quantifying synergistic or nonlinear enhancement relationships among various factors [21].
Under the global trend of urbanization driven by economic globalization, regions such as Europe [22], the United States [23], and China [24] face downward pressures from regional contraction. The phenomenon of urban shrinkage, a stage in the objective development of cities, is drawing widespread attention. The Shrinking City International Research Network [25] defines urban shrinkage by observing structural crises such as population outflow and economic recession. Urban shrinkage can be assessed through multiple indicators. For instance, Wolff et al. identified European cities experiencing or at risk of contraction by screening for nonlinear evolution of urban decline based on economic and demographic factors [22]. Jiang et al. used the Detroit metropolitan area as a case study to demonstrate how housing transactions drive urban shrinkage and capture the overall contraction effect in the housing market [26]. Among these, population loss is a key indicator for measuring urban shrinkage, as it effectively reflects the contraction in social and economic dimensions [27]. Urban shrinkage is often accompanied by deindustrialization, which can lead to overreliance on energy consumption for economic growth. Conversely, urban expansion can result in significant land use changes that exacerbate high carbon emissions within cities [28]. Empirical study has shown that the evolution of urban form profoundly influences carbon emissions [29]. Low-carbon transition pathways must therefore integrate spatial governance with carbon balance zoning to harmonize urbanization with carbon neutrality goals [30].
After a comprehensive review of the literature, it is evident that the field of urban carbon balance research has produced a wealth of results, yet several shortcomings remain. (1) Most early studies focused on static cities [31], with limited attention to the spatiotemporal evolution of carbon balance during urban scale changes. Further research is needed on the carbon cycle of regional composite ecosystems. (2) While existing studies have explored the mechanisms driving urban carbon dynamics and the pathways of carbon sources and sinks [32,33], they lack a deep understanding of the diverse urban forms and their unique carbon balance characteristics. (3) Traditional methods for identifying spatial heterogeneity, such as factor analysis, regression analysis, and principal component analysis, struggle to reveal the differences and interactions among driving factors, which hinders the provision of more targeted and practical guidance for urban carbon management.
To address these gaps, this study selects shrinking and expanding cities in China as its research objects and employs multi-source remote sensing data to quantify urban carbon emissions and carbon sequestration. The research will include: (1) comparing and analyzing the spatiotemporal patterns of carbon budgets in shrinking and expanding cities, thereby revealing similarities and differences in spatial variation of carbon emissions and carbon sequestration for these two city types; (2) using the geodetector method to measure the impact of socio-economic factors on carbon balance in both types of cities, clarifying their mechanisms in the carbon cycle ecosystem; and (3) considering the interactions between driving factors, analyzing the impact of urban dynamic changes on carbon balance. This study aims to provide guidance for climate action and clean energy promotion, supporting the achievement of low-carbon development. It also seeks to advance sustainable urban and community development, optimize resource utilization efficiency, establish green transition and responsible production models, and facilitate comprehensive green transformation of the economy and society in cities at different stages of development [10].

2. Material and Methods

2.1. Study Area

As the largest developing country, China’s strategic pathway toward achieving net-zero carbon emissions is of critical importance both domestically and globally for reaching peak carbon and carbon neutrality targets. This study focuses on mainland Chinese cities defined by administrative divisions. To ensure data completeness and quality, 337 prefecture-level cities were selected as the study objects. Based on population change trends from 2012 to 2022, these cities were classified into two categories—shrinking and growing (Figure 1)—in order to analyze differences in carbon balance patterns and driving mechanisms between the two types.

2.2. Data Sources

The base map of national administrative boundaries was obtained from the National Geographic Information Center of China (Approval No. GS (2024)0650) (Table 1). The selected socio-economic statistical data were sourced from the China City Statistical Yearbook, China Urban Construction Statistical Yearbook, and China Energy Statistical Yearbook spanning 2012–2022, encompassing metrics such as population and energy consumption. The selected socio-economic statistical data were sourced from the China City Statistical Yearbook, China Urban Construction Statistical Yearbook, and China Energy Statistical Yearbook spanning 2012–2022, encompassing metrics such as population and energy consumption. The original NPP-VIIRS nighttime light imagery was derived from annual spatial data provided by the U.S. National Polar-orbiting Partnership Environmental Satellite. Land cover data for carbon storage estimation originated from the 30 m resolution China Land Cover Dataset (CLCD) produced annually using Google Earth Engine. Meteorological data, including temperature and precipitation records, were obtained from the National Meteorological Information Center of the China Meteorological Administration. NDVI data were extracted from the monthly 1 km vegetation index spatial distribution dataset provided by the Environmental Science Data Center of the Chinese Academy of Sciences.

2.3. Research Methodology

2.3.1. Identification of Urban Expansion and Shrinkage

This paper selects population indicators to measure urban development status, combining Theil–Sen Median trend analysis and Mann–Kendall tests to identify data trends of urban expansion and contraction from 2012 to 2022 [34]. Among them, the Sen slope robustly characterizes the trend direction by calculating the median of slopes between all adjacent time points in the population panel data, with the calculation formula as:
β = m e d i a n x k x i k i
where 2012 ≤ i < k ≤ 2022; xi and xk represent values at times i and k, respectively; median denotes the median function. β > 0 indicates an increasing trend, β = 0 signifies stability, and β < 0 denotes a decreasing trend.
The MK test compares the rank orders of urban long-term time series, with the formula for its statistical measure being:
S = i = 1 n 1 k = i + 1 n s g n ( x k x i )
where S is the test statistic; sgn is the sign function.
s g n ( x k x i ) = 1 , x k x i > 0 0 , x k x i = 0 1 , x k x i < 0
The statistical significance of trends is verified through standardized Z-values, with the testing procedure as follows:
Z = S 1 V a r ( S ) , S > 0                 0             , S = 0 S + 1 V a r ( S ) , S < 0
where V a r ( S ) = n ( n 1 ) ( 2 n + 5 ) 18 ; |Z| ≥ 1.28, 1.64 and 2.32 represents passing the significance test with p-values of 0.1, 0.05, and 0.01, respectively.

2.3.2. Carbon Source and Sink Estimation

Carbon Emissions
The provincial-level energy consumption emissions across the country were calculated using the “2006 Greenhouse Gas Emissions Inventory” methodology published by IPCC, as shown in Equation (5).
C i = E i j t × η j
where E i j t represents the consumption of the j-th type of energy in province i during year t; η j denotes the carbon emission coefficient of the j-th type of energy; j includes nine types of energy consumption: raw coal, coke, crude oil, gasoline, diesel, fuel oil, natural gas, and electricity; the energy conversion coefficients and carbon emission coefficients are shown in Table 2.
Nighttime light (NTL) imagery is recognized for its high precision, stability, and strong correlation with socioeconomic activity [35]. To dynamically capture the spatiotemporal variations in carbon emissions across prefecture-level cities, we first preprocessed the NTL data by removing outliers based on the optimal threshold for built-up areas. On this basis, administrative boundaries are utilized to obtain the total nighttime light values for each province, thereby establishing the relationship between nighttime light and carbon emission statistics (Equation (6)). According to the NPP-VIIRS OLS nighttime light data, provincial-level carbon emissions are converted into city-level energy consumption emissions, with a fitting degree R2 reaching approximately 0.8.
C i = a × S D N + b
where S D N represents the total value of night light; a and b are the parameters of the regression equation.
Carbon Storage
This study employs a terrestrial vegetation net primary productivity model based on light use efficiency and a plant mortality model to estimate the aboveground vegetation carbon density in urban areas, deriving the carbon sequestration (CS) and its economic value in urban ecosystems. The carbon content of vegetation dry matter accounts for approximately 45% of the total NPP, meaning that for every 1 g of organic matter produced by vegetation, 1.62 g of CO2 is sequestered. The CASA model is determined by two variables: the light use efficiency (ε) of vegetation absorption and the absorbed photosynthetically active radiation (APAR).
N P P ( x , t ) = A P A R ( x , t ) × ε ( x , t )
where A P A R ( x , t ) is the absorbed photosynthetically active radiation for pixel x in month t (MJ/m2/month); ε ( x , t ) is the actual light use efficiency for pixel x in month t (gC/MJ).

2.3.3. Carbon Balance Zoning

Carbon Compensation Rate
Carbon offset rate (CCR) characterizes the city’s carbon emission reduction pressure.
C C R = C S i C i
where C S i and C i represent a city’s carbon sequestration and carbon emissions, respectively. C C R > 1 indicates a net carbon sink city, while C C R < 1 indicates a net carbon source city.
Economic Contribution Coefficient of Carbon Emissions
From the perspective of economic benefits, we selected the Economic Contribution Coefficient of Carbon Emissions (ECC) to characterize carbon productivity.
E C C = G i G / C i C
where G i and C i are the city’s GDP and carbon emissions; G and C are the national GDP and carbon emissions. E C C > 1 indicates higher energy use efficiency and carbon productivity, while E C C < 1 indicates lower efficiency.
Ecological Support Coefficient of Carbon
The carbon ecological carrying coefficient (ESC) represents a city’s carbon sink capacity.
E S C = ( C S i C S × C i C )
where C S i and C i are the city’s carbon sequestration and carbon emissions; C S and C are the national carbon sequestration and carbon emissions. E S C > 1 indicates a relatively higher carbon sink capacity, while E S C < 1 indicates a lower capacity.
Spatial Autocorrelation Analysis
We employed the Global Moran’s I index to analyze the degree of spatial agglomeration or dispersion of Carbon Compensation Rate between the two types of cities. Furthermore, we combined local hotspot analysis [36] to identify high-value (hotspot) and low-value (cold spot) clusters. Additionally, the standard deviation ellipse (SDE) spatial statistical method was adopted to characterize the centrality, dispersion, directionality, and spatial morphology of geographic elements in expanding and shrinking cities [37].
M o r a n s   I = i = 1 n j = 1 n w i j ( x i x ¯ ) ( x j x ¯ ) i = 1 n j = 1 n w i j i = 1 n ( x i x ¯ ) 2
z ( I ) = I E ( I ) v a r ( I )
where n is the number of expanding/shrinking cities; x i and x j are the CCR values for cities i and j; x ¯ is the mean CCR; w i j is the spatial connectivity matrix between cities; v a r ( I ) is the variable coefficient. Moran’s I ranges from [−1, 1]. I > 0 indicates positive spatial autocorrelation, classified as strong (I > 0.7), moderate (0.3 < I ≤ 0.7), or weak (0 < I ≤ 0.3). I ≈ 0 suggests no significant autocorrelation, and I < 0 indicates negative autocorrelation. Significance is determined by p-values and Z-scores.
G = j i n w i j ( d ) x j j i n x j
Z ( G ) = G i E ( G i ) v a r ( G i )
where n represents the number of expanding/contracting cities; w i j is the spatial connection matrix between cities i and j; E ( G i ) is the mathematical expectation; v a r ( G i ) is its variance coefficient; Z ≥ 1.96 indicates a hotspot area, while Z ≤ 1.96 indicates a coldspot area.

2.3.4. Driving Mechanism Analysis

The Geodetector method is a statistical approach effective for revealing spatial heterogeneity and driving factors with minimal sample size constraints and proficiency in handling categorical data [38]. In this study, we apply the factor detector to quantify the degree to which different urban expansion/shrinkage factors influence the carbon compensation rate, using the q-statistic. Eight explanatory variables were selected: Annual GDP (EL), Urbanization Rate (UR), Population Size (PZ), Construction Land Area (CA), Road Area (RA), Industrial Structure (IS), Technological Advancement (TA), and Energy Consumption Intensity (ES). The interactive detector is used to assess the explanatory power of different urban factors on carbon compensation rates, examining whether there are synergistic or antagonistic effects among the factors, including five types of two-factor interactions: nonlinear weakening, single-factor nonlinear weakening, mutual independence, dual-factor enhancement, and nonlinear enhancement.
q = 1 h = 1 L N h σ h 2 N σ 2
where N and N h are the number of units in the entire study area and sub-region h , respectively; σ 2 and σ h   2 are the variances of CCR in the entire area and sub-region h, respectively. The q-statistic ranges from [0, 1], where higher values indicate stronger explanatory power of the driver on the spatial heterogeneity of CCR.

3. Results

3.1. Classification and Spatiotemporal Dynamics of Urban Expansion and Contraction in China

From 2012 to 2022, the study area comprised 295 expanding cities and 42 shrinking cities (Table 3). The expanding cities showed a growth trend, characterized by overall concentration and partial dispersion, mainly in South and North China. Among them, 186 cities showed significant expansion, including major eastern and southwestern cities such as Nanjing and Chengdu, predominantly located in provinces like Henan, Jiangsu, and Guangdong. Another 109 cities showed non-significant expansion, including Taiyuan in central China and Jilin in the northeast, mainly distributed across Zhejiang and Fujian provinces. In contrast, shrinking cities demonstrated a decreasing trend, with spatial characteristics of local clustering but overall dispersion and relatively small-scale population changes. These were mainly distributed in the northeast, northwest, and northern regions. Among them, six cities, such as Fuxin in the northeast and Shihezi in the northwest, exhibited significant shrinkage, mainly located in Hebei, Jilin, and Xinjiang; 36 cities showed non-significant shrinkage, including Chengde in the north and Yulin in the northwest, largely distributed in Heilongjiang, Xinjiang, and Shaanxi.

3.2. Carbon Sources and Sinks in China

As shown in Figure 2, carbon emissions from 2012 to 2022 showed a significant upward trend, with notable fluctuations in 2015 and 2019. In expanding cities, total carbon emissions increased from 4.521 to 8.226 billion tons, with their national share rising from 87.50% to 88.11%. Emissions per unit area (EU) rose from 2322.07 t/km2 to 3765.59 t/km2, while the per capita carbon emission (EP) was 5.41–9.63 t. According to the natural breakpoints, urban carbon emissions were categorized into three levels (Figure 3). Expanding cities with high carbon emissions were primarily provincial capitals and coastal cities, displaying a spatial pattern of higher emissions in the east and lower in the west. The distribution of emissions shifted, with an increasing share of medium and high-emission zones, notably in central and coastal cities such as Yantai and Wenzhou. For shrinking cities, total carbon emissions increased from 646 million to 1.110 billion tons, but their national share declined from 12.50% to 11.89%. The unit carbon emission (SU) decreased from 2889.62 t/km2 but steadily increased to 3972.45 t/km2, while per capita emissions (SP) ranged from 12.28 to 20.77 t, both values consistently higher than those in expanding cities. Xinjiang and Shaanxi had relatively high carbon emissions, with a generally stable distribution pattern, and the high-value areas increased during this period.
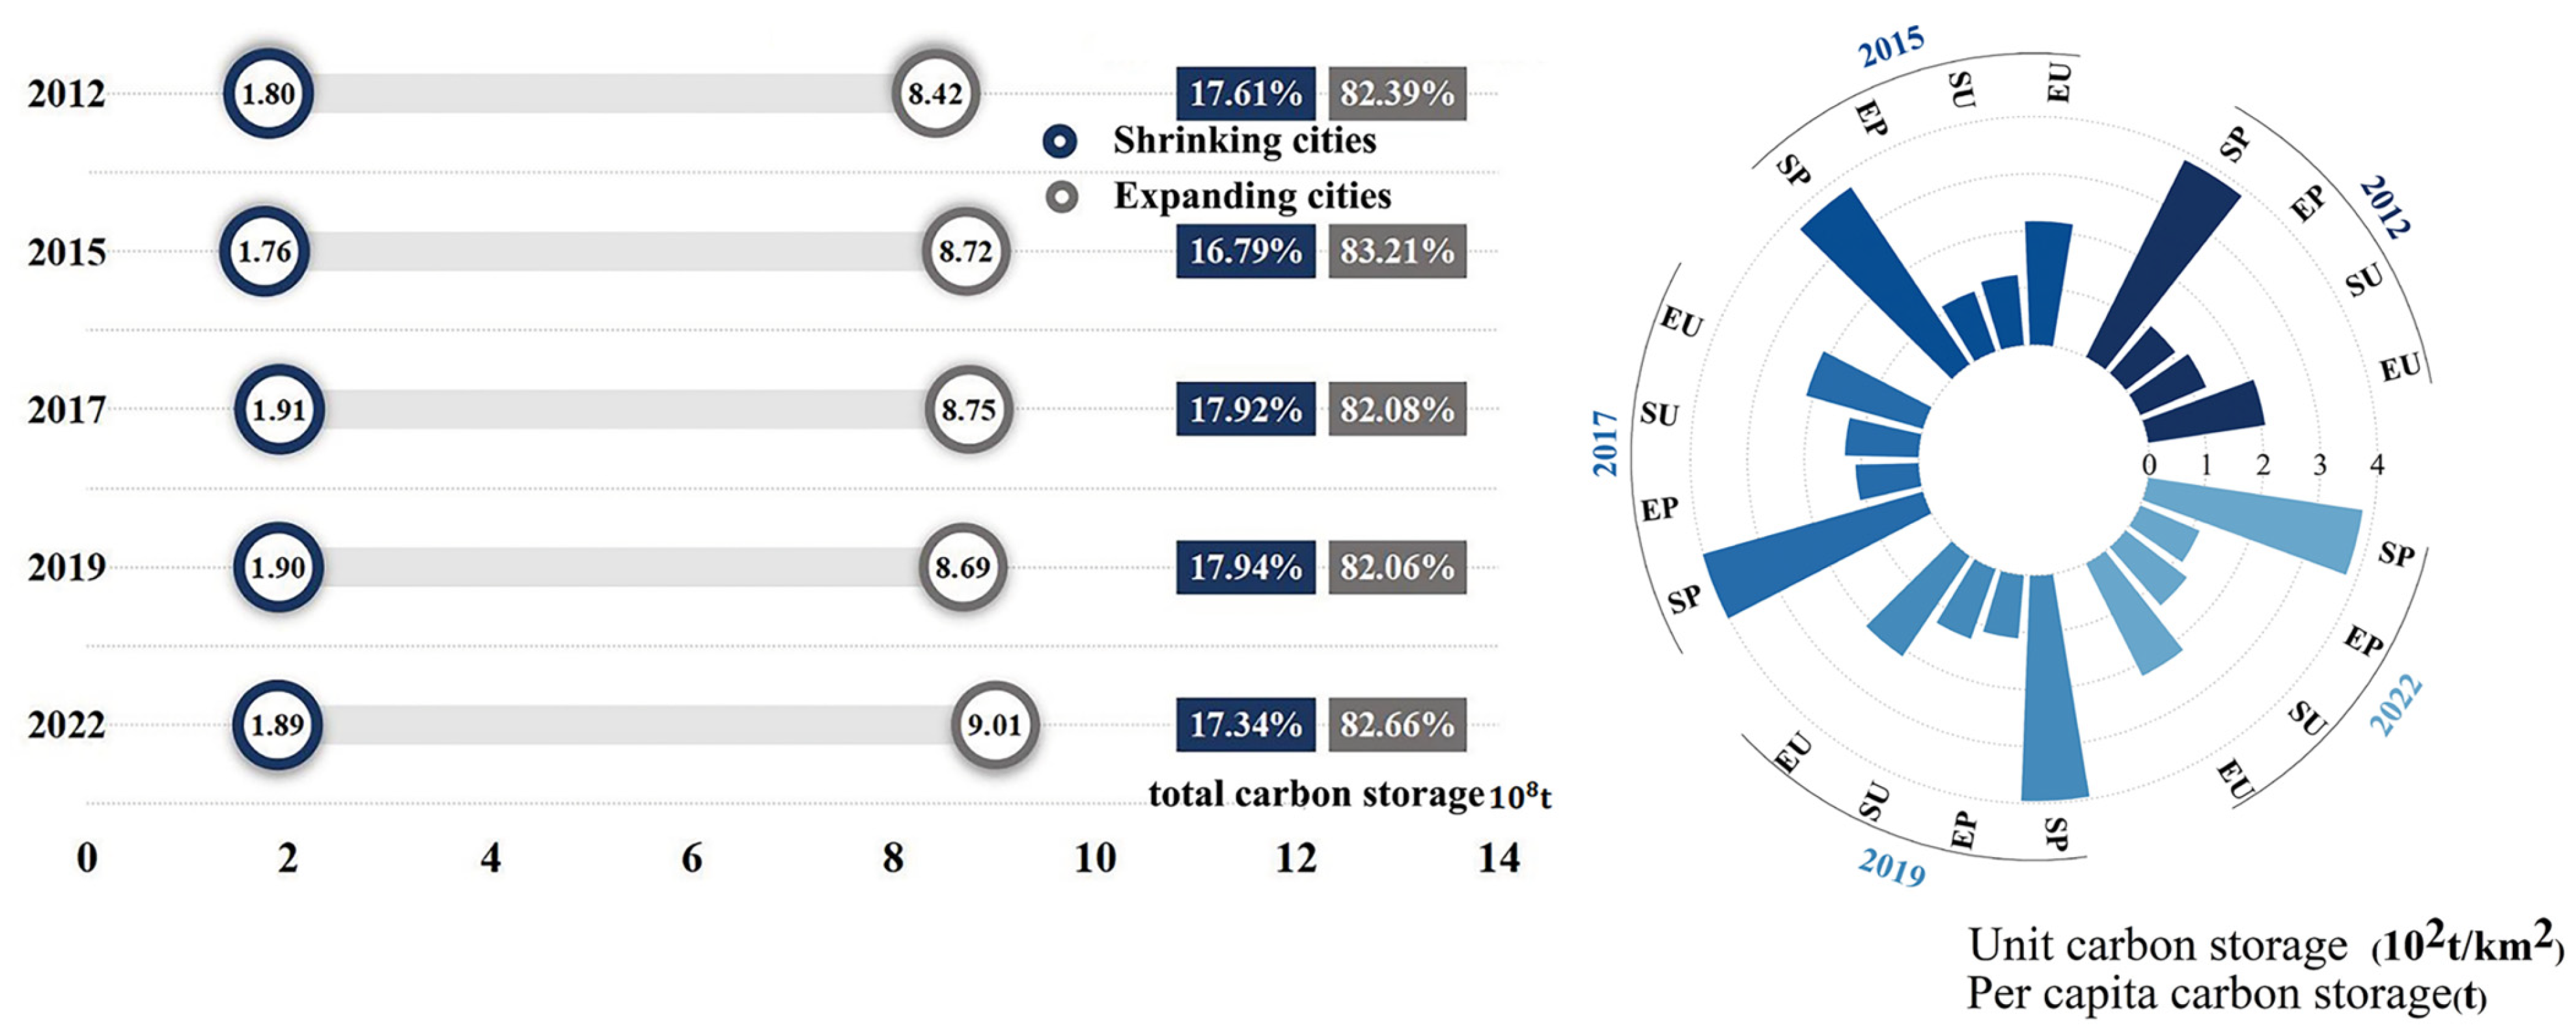
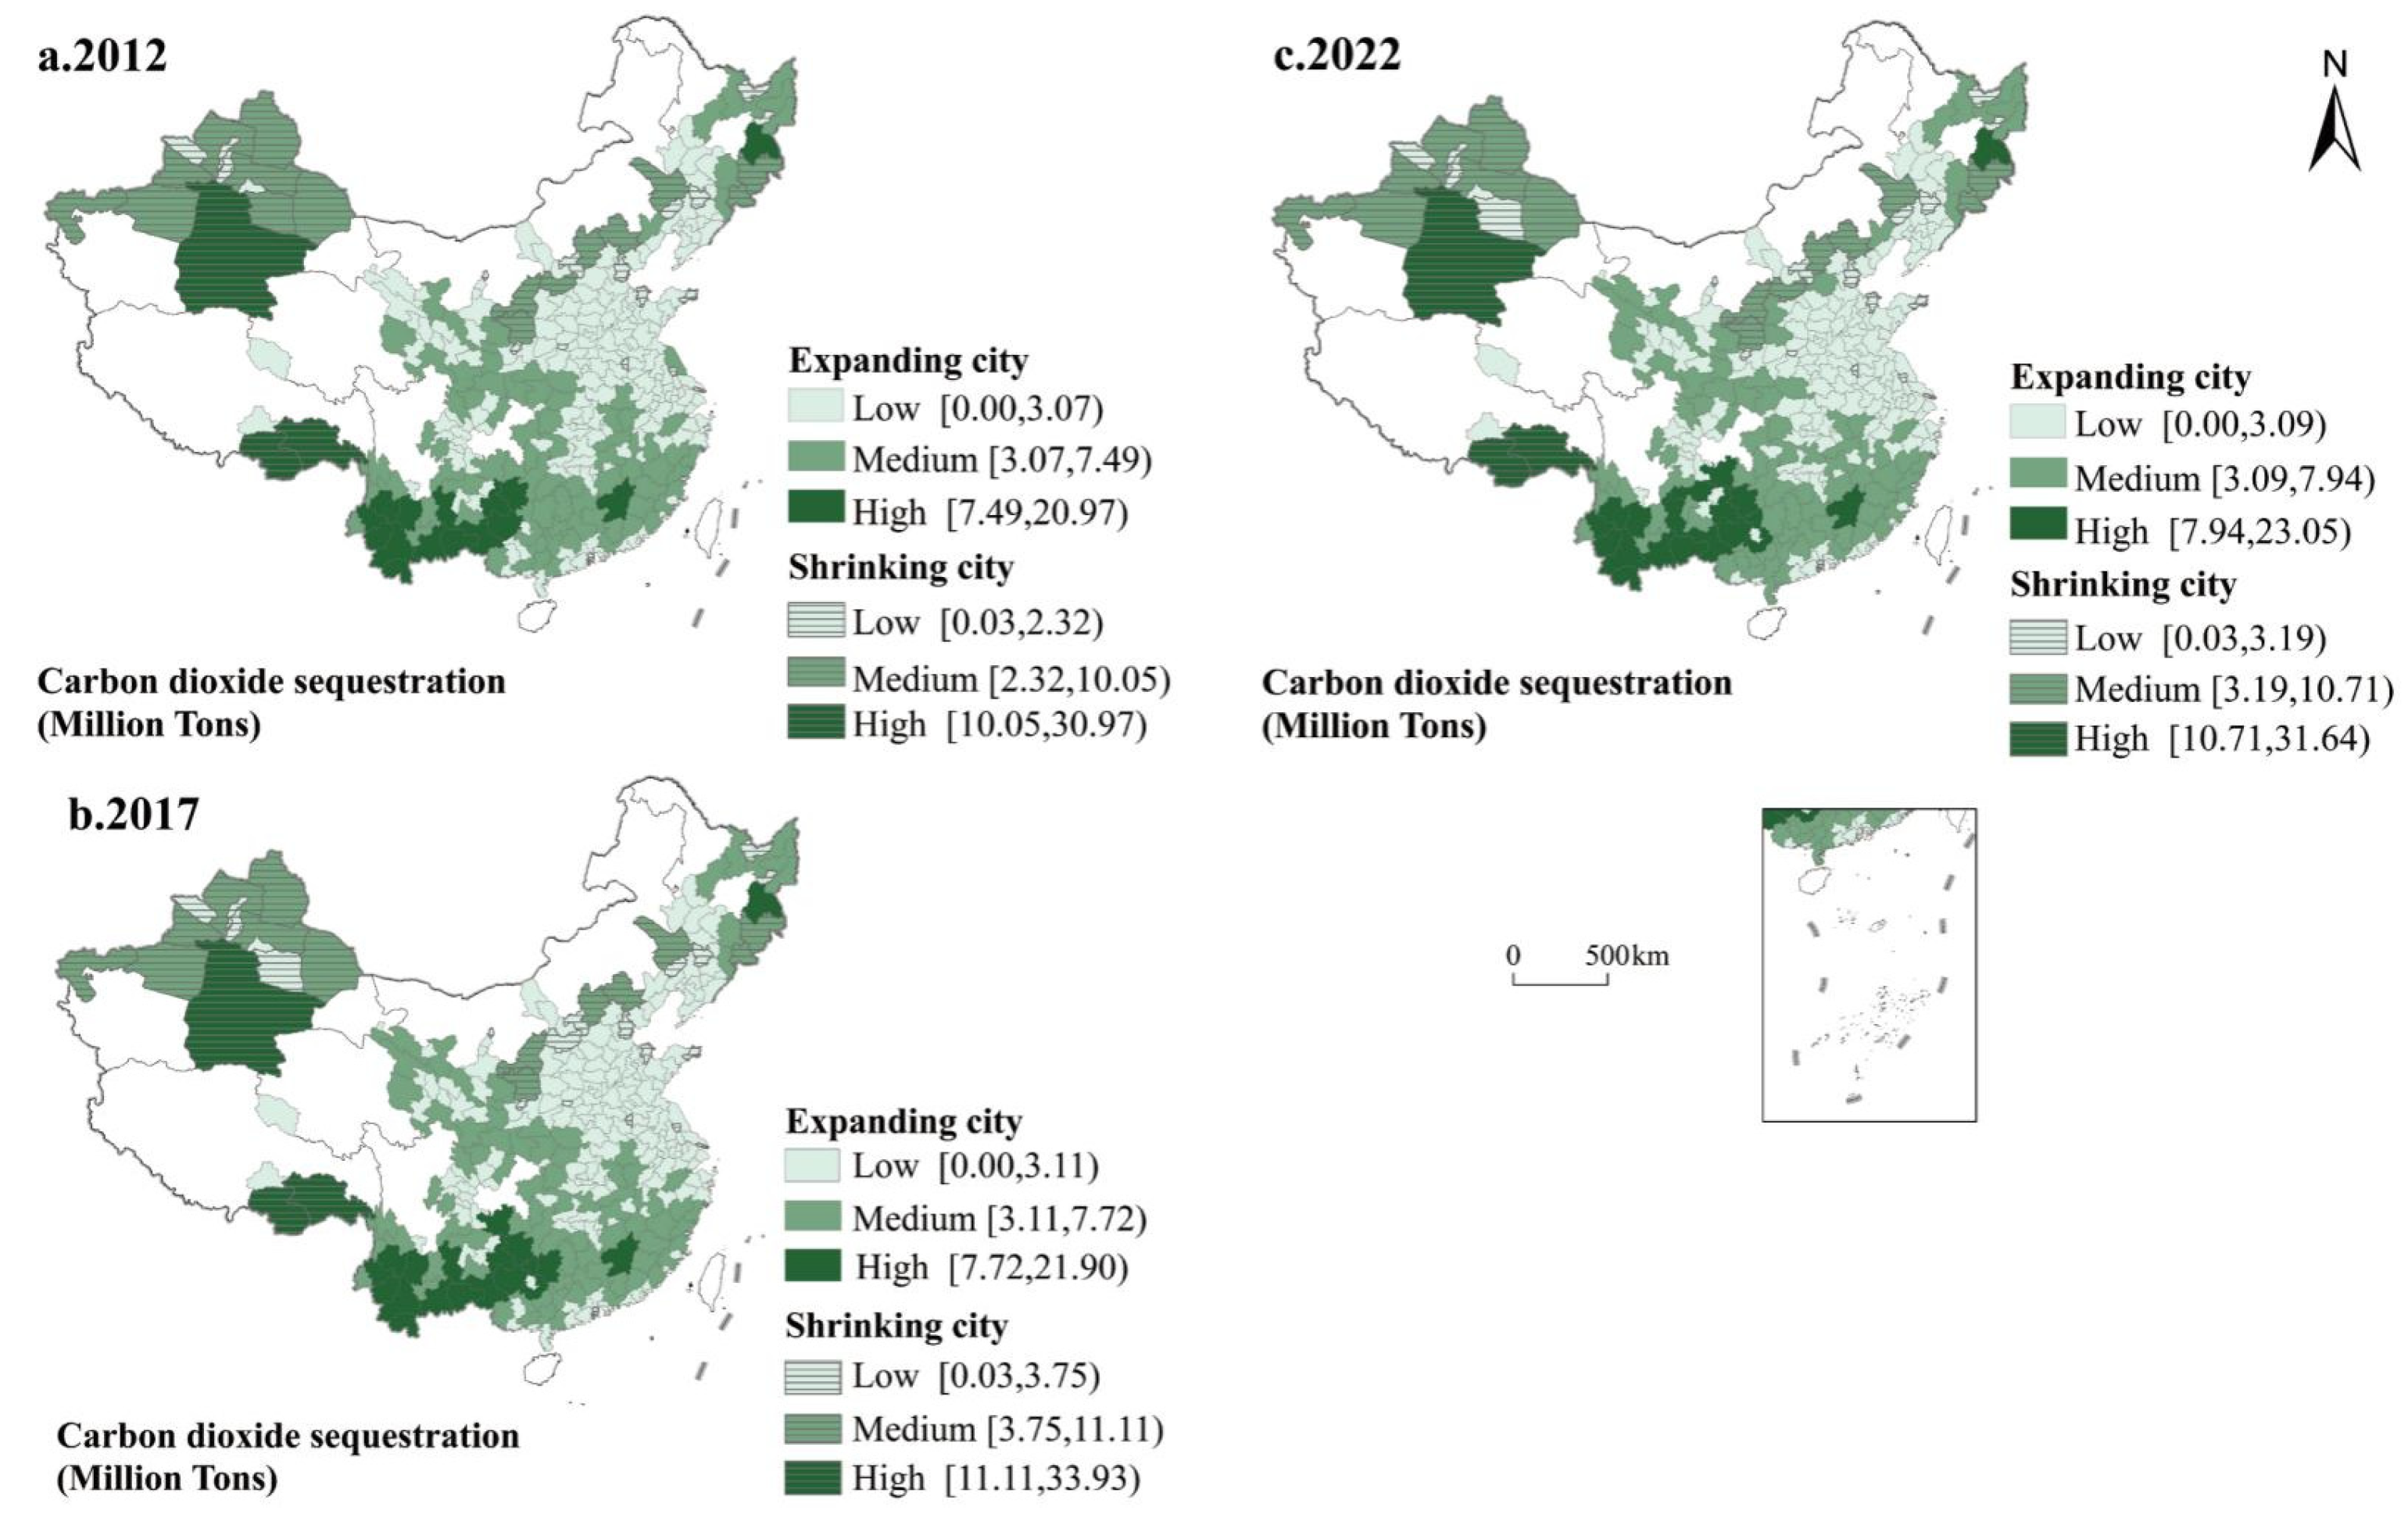
As shown in Figure 4, carbon sinks showed an overall increasing trend from 2012 to 2022, albeit with a dip around 2017 and a relatively slow growth rate compared to total carbon storage. Total carbon storage in expanding cities increased from 0.842 billion tons to 0.901 billion tons, maintaining a stable national share of approximately 82%. Carbon storage per unit area grew from 207.25 t/km2 to 220.57 t/km2, and per capita carbon storage ranged between 1.10 t/person and 1.13 t/person. Yunnan, Guangxi, and Hainan had higher carbon storage, while the Yellow River Basin had lower carbon storage, showing a spatial difference of higher in the south and lower in the north. The distribution pattern of carbon storage remained stable during this period (Figure 5). Shrinking cities saw an increase in total carbon storage from 180 to 189 million tons, with a consistent national share of about 17%. Storage per unit area rose from 125.13 to 134.99 t/km2, while per capita storage ranged from 3.74 to 4.01 t. These values were lower and higher, respectively, than those in expanding cities. Xinjiang and Hebei had higher carbon storage, and the distribution pattern of carbon storage remained stable during this period.

3.3. Carbon Balance Zoning

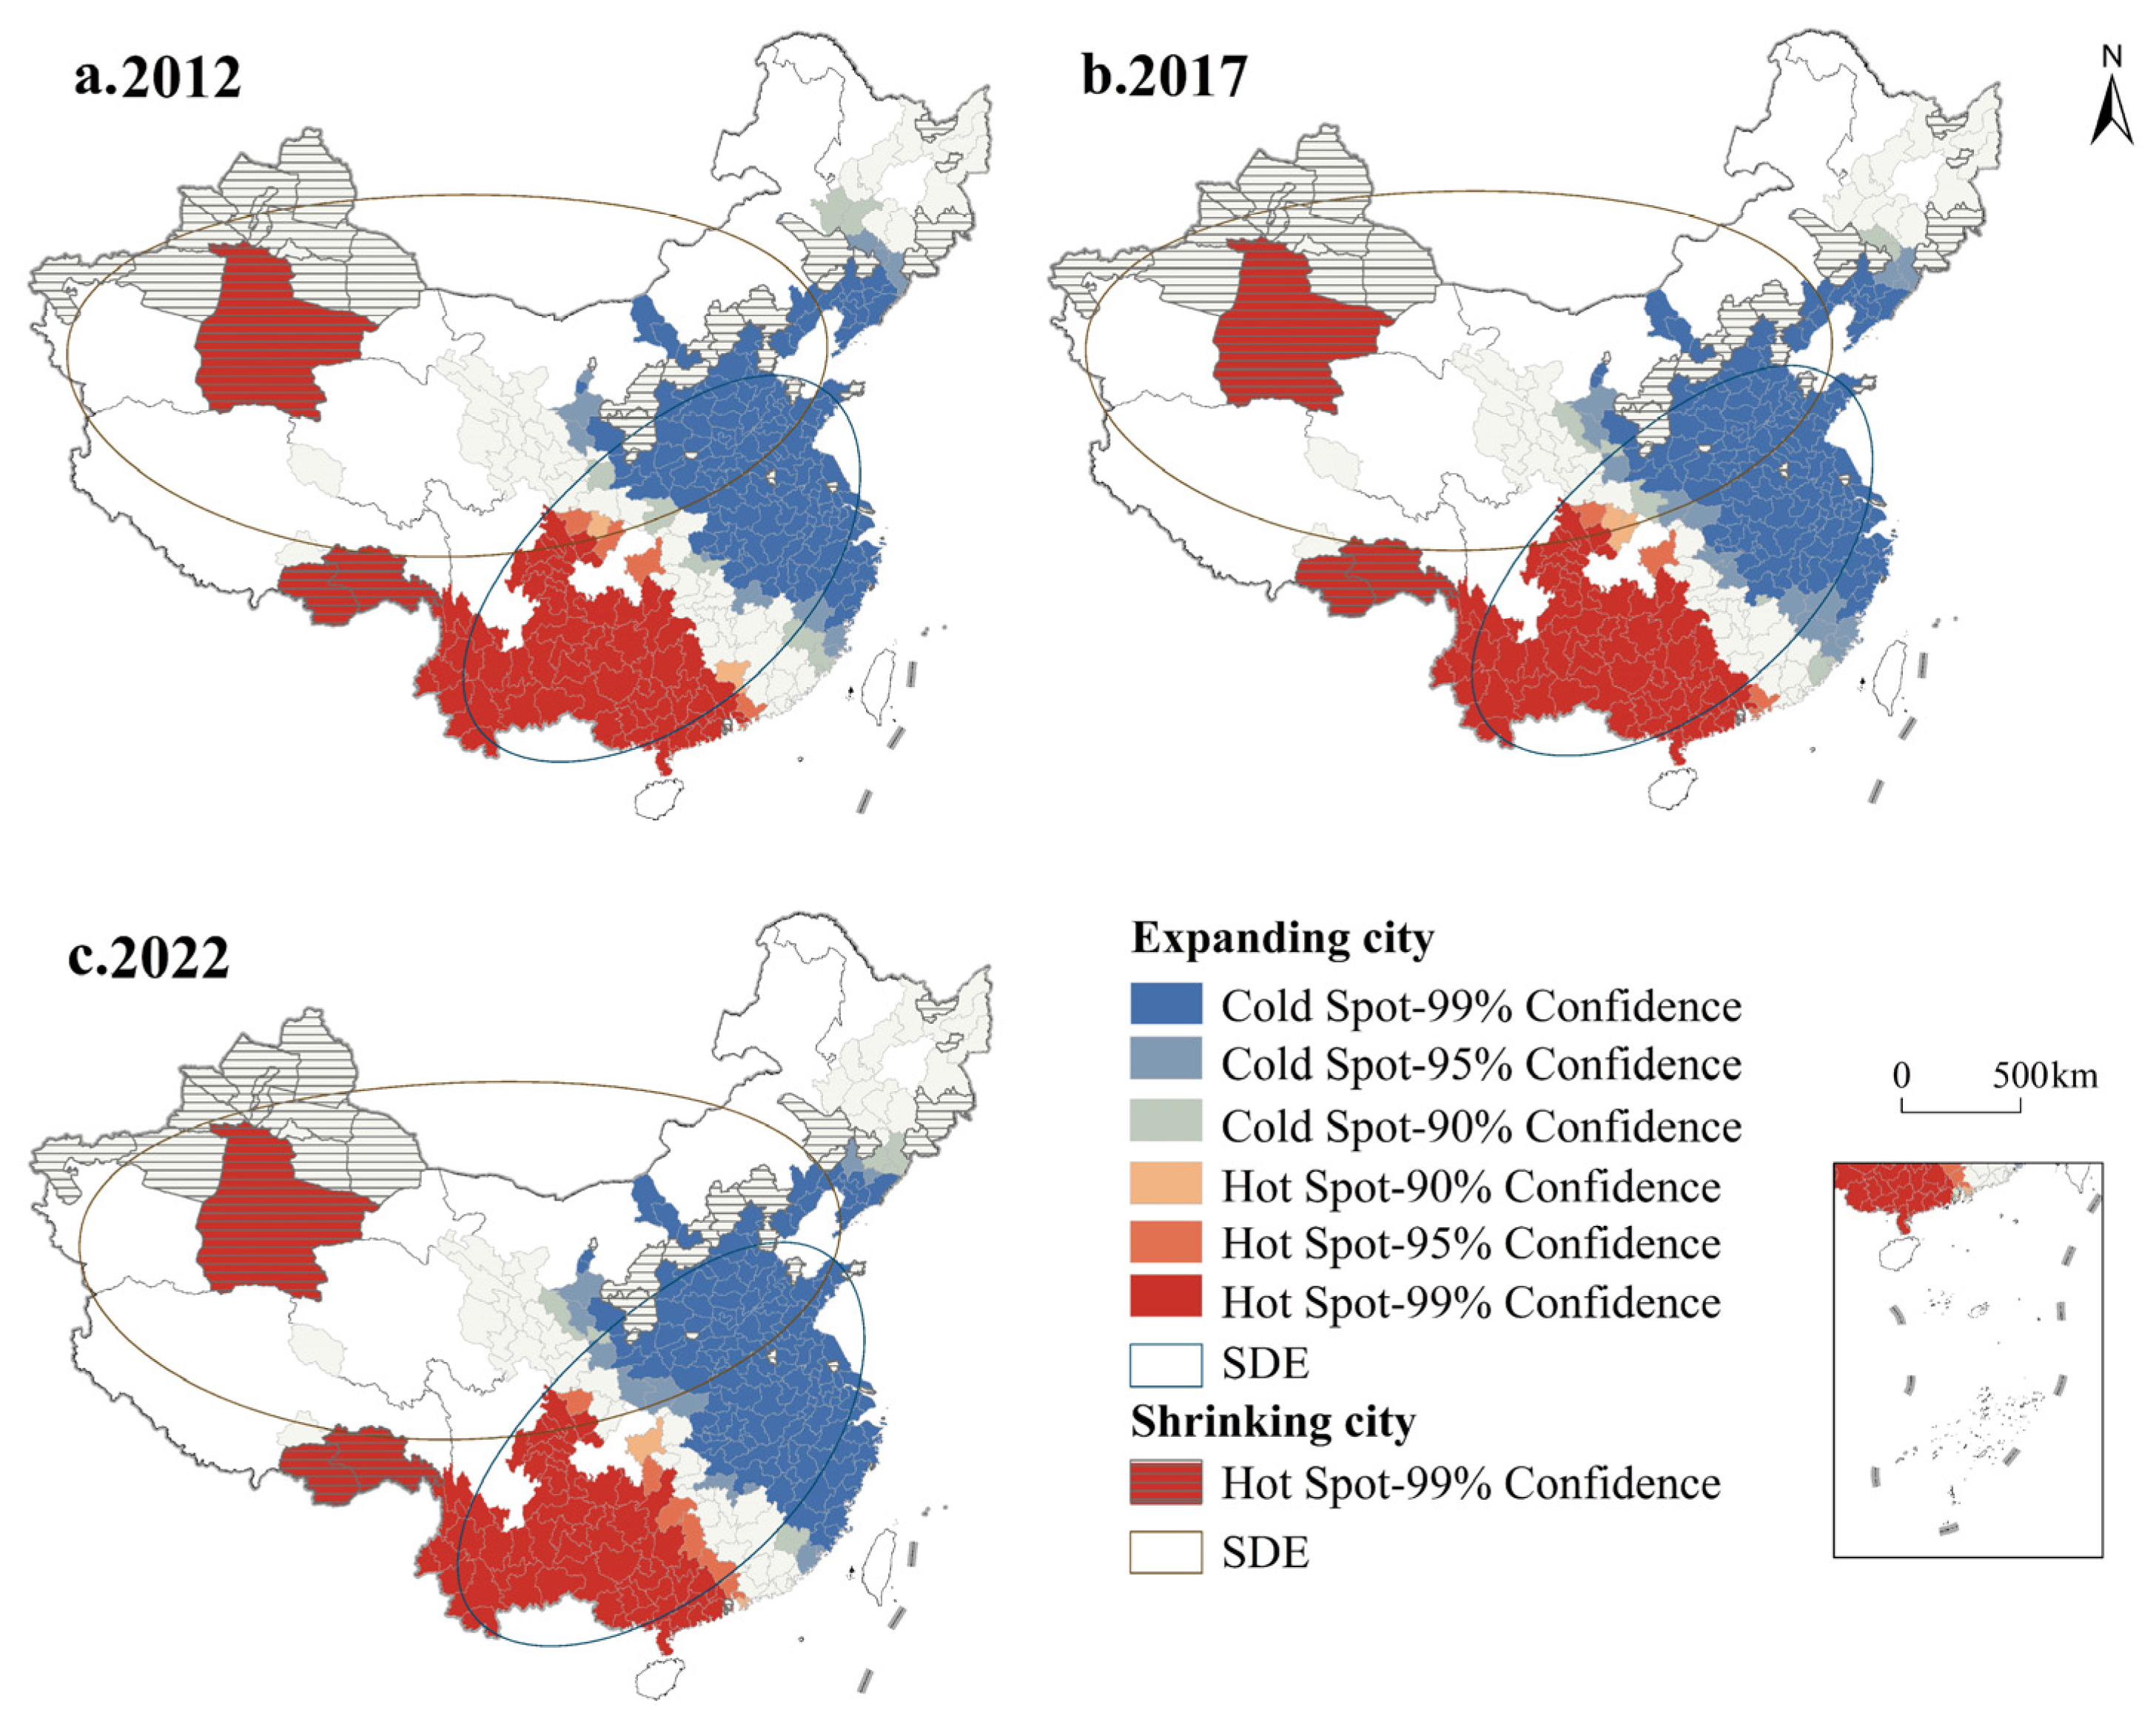
From 2012 to 2022, China’s CCR generally showed a downward trend, all indicating a net carbon source. In expansive urban areas, the CCR decreased from the southwest to the central region (Figure 6), with maximum and minimum values at 154.96% and 0.02%, respectively. Temporally, average CCR declined from 19.38% to 10.98%, while the share of medium and high-value areas increased. Shrinking cities displayed a CCR pattern with high values in the west (up to 186.77%) and low values in central areas (minimum 0.02%). The average CCR rose slightly from 23.42% and then declined to 13.86%. The proportion of mid-value areas increased. Spatial autocorrelation analysis (Figure 7) showed that CCR in expanding cities had a Moran’s I of 0.21–0.23 (Table 4), indicating increasing spatial clustering. Hotspots accounted for 25.76%, mainly located in the southwestern cities, while coldspots covered 55.60%, primarily in eastern cities. In contracting urban areas, the Moran’s I was 0.15–0.16, failing to pass the significance test, indicating a dispersed spatial pattern with fewer hotspots, including some cities in the west. The CCR center of gravity in expansive urban areas remained stable in the central region, with the SDE showing a distribution from the southwest to the northeast, and a slight increase in the long axis. In contracting urban areas, the center of gravity remained in the western region, with the SDE showing a distribution from the northwest to the northeast, and no significant change in area.
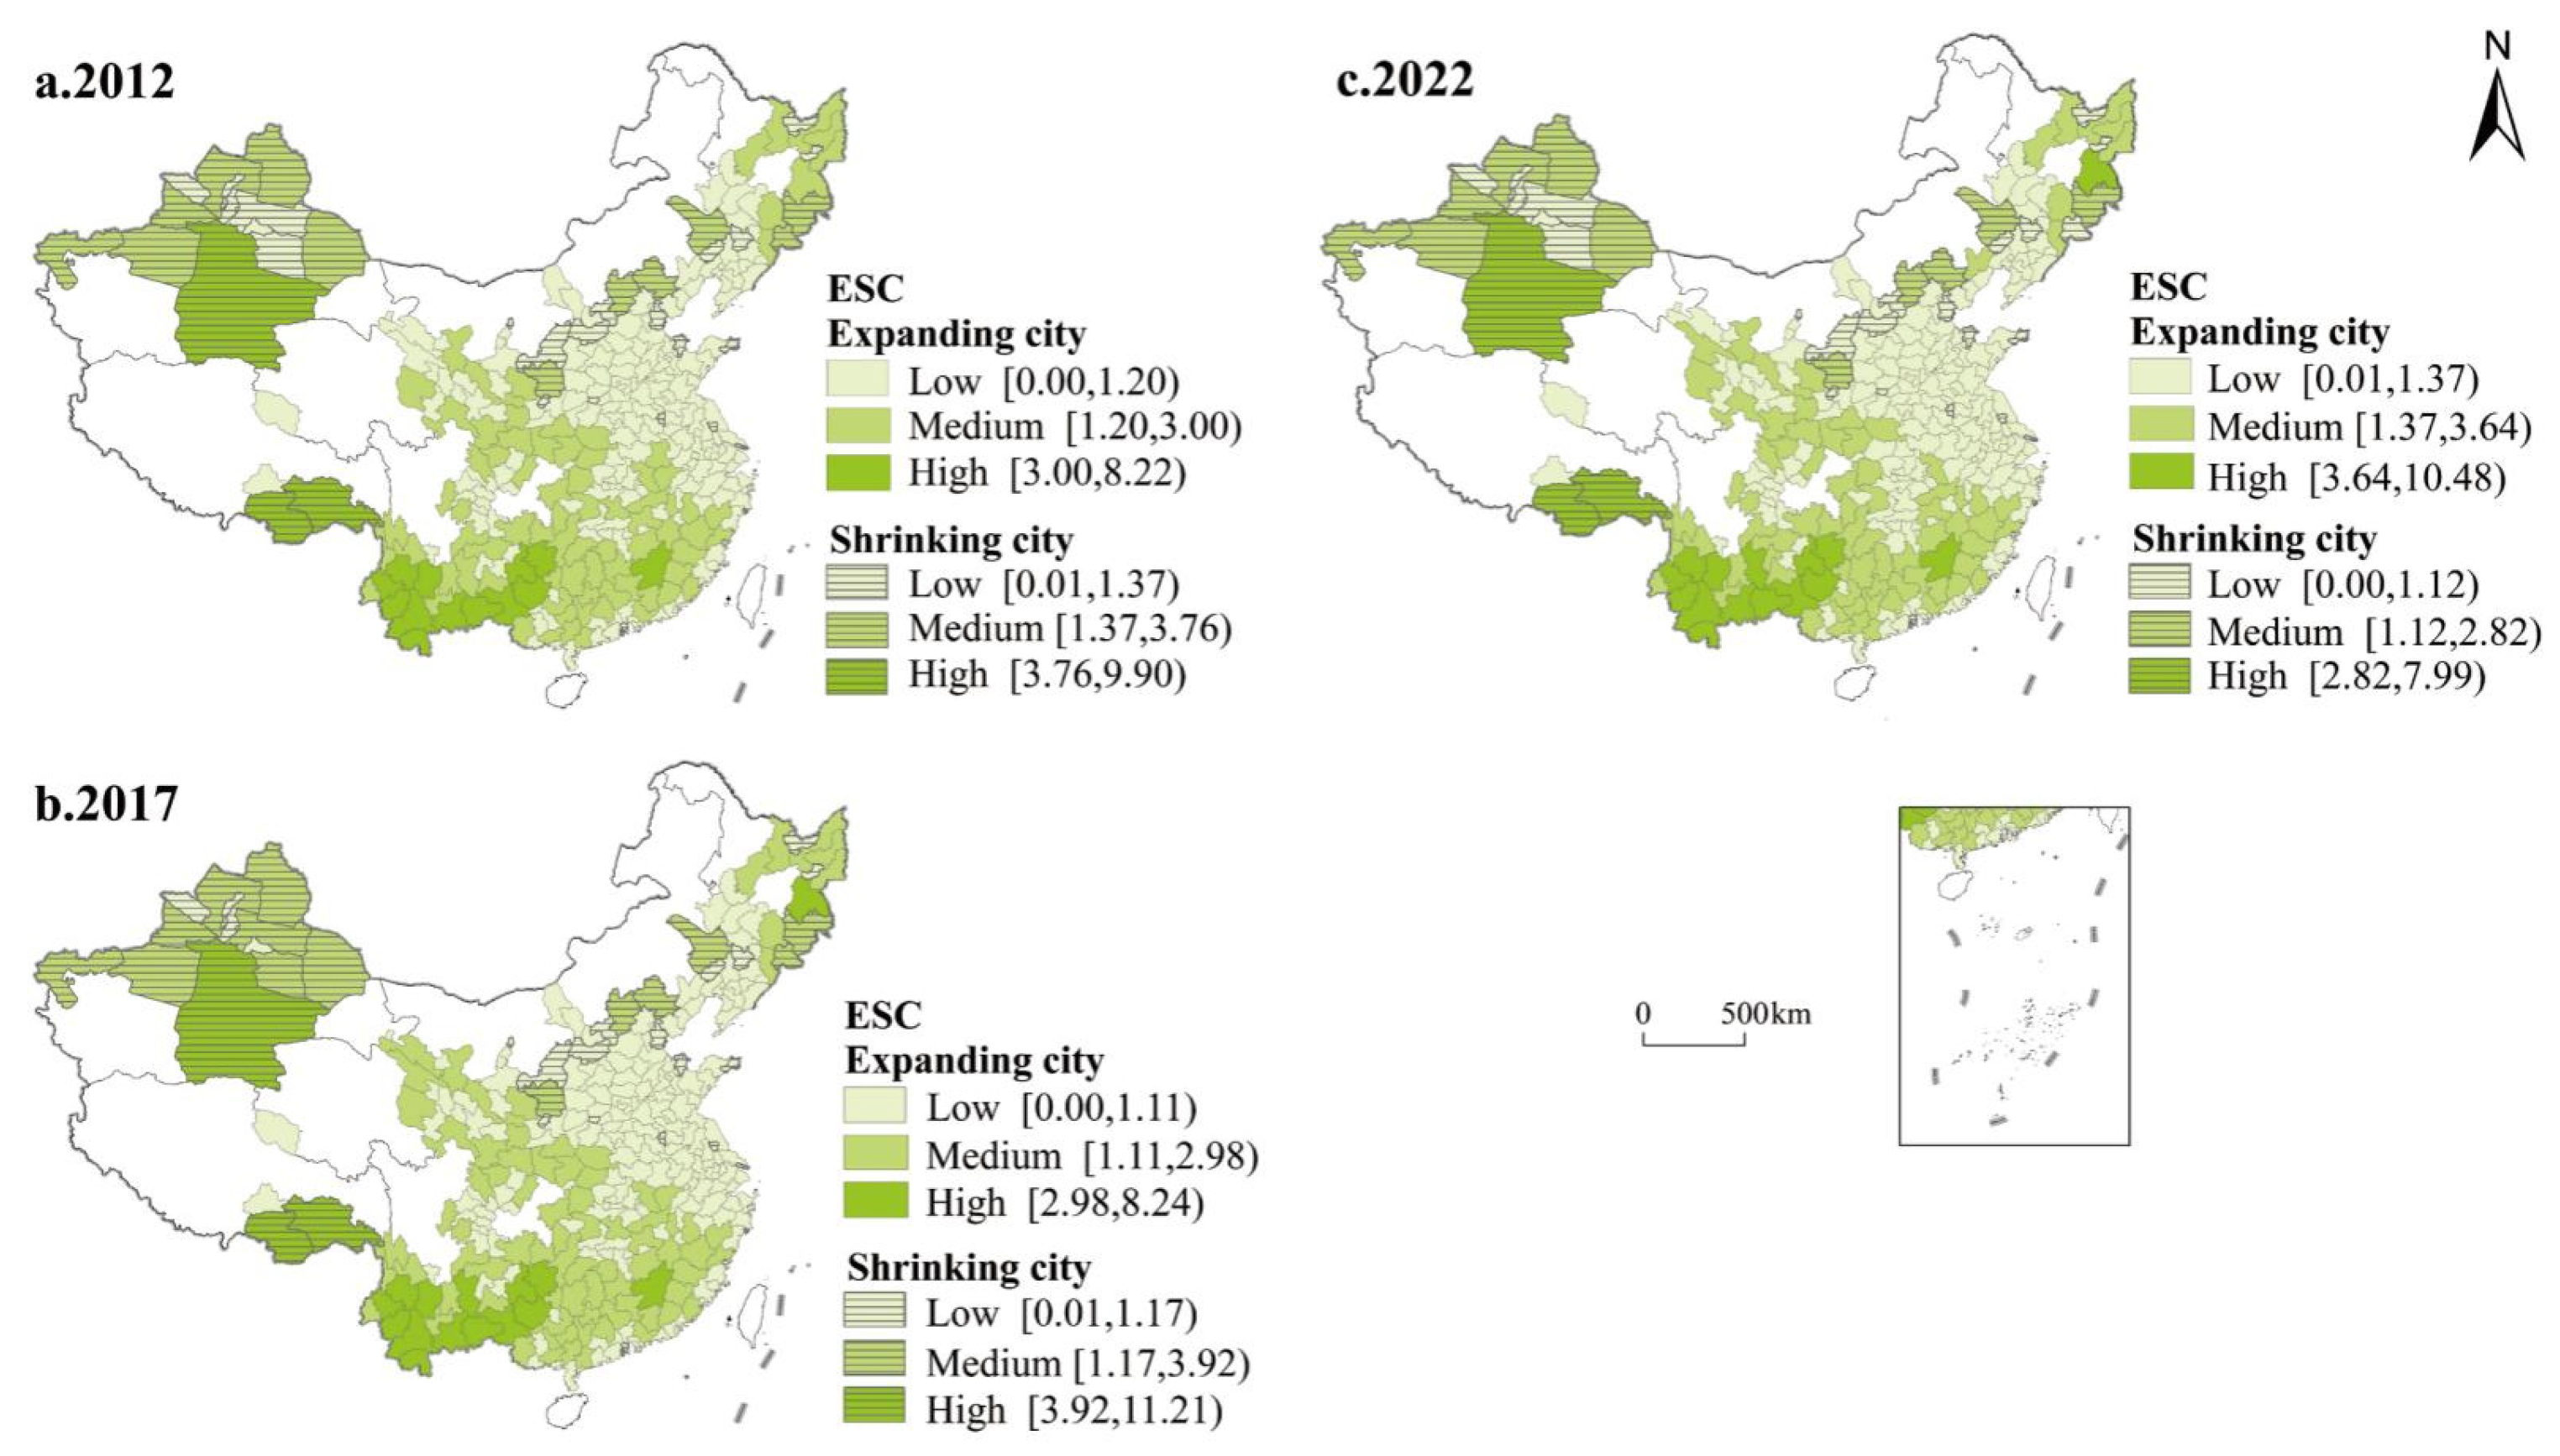
Over the past decade, the ECC of expanding cities steadily increased from 0.86 to 1.05, with higher values in provincial capitals and coastal cities. The proportion of high-value areas first decreased and then rebounded to 25.59%, primarily in the eastern region. For shrinking cities, ECC values rose then declined, stabilizing at 1.04, showing a spatial distribution pattern of being higher in the east and lower in the west, and higher in the south and lower in the north. The share of high-ECC areas increased to 16.67%, lower than that of expanding cities (Figure 8). Meanwhile, the national average ECS is greater than 1 but shows a downward trend. The ECS for expanding cities ranges from 0.01 to 8.21, decreasing from the southwest to the central plains. Cities with high carbon sink capacity, after a decline, have rebounded to 105, mainly located in the Yangtze River Basin and Northeast China. The average for shrinking cities is higher than that of expanding cities, ranging from 0.01 to 9.90, with high-value areas including 19 cities in Northwest and Northeast China, which are stably distributed (Figure 9).
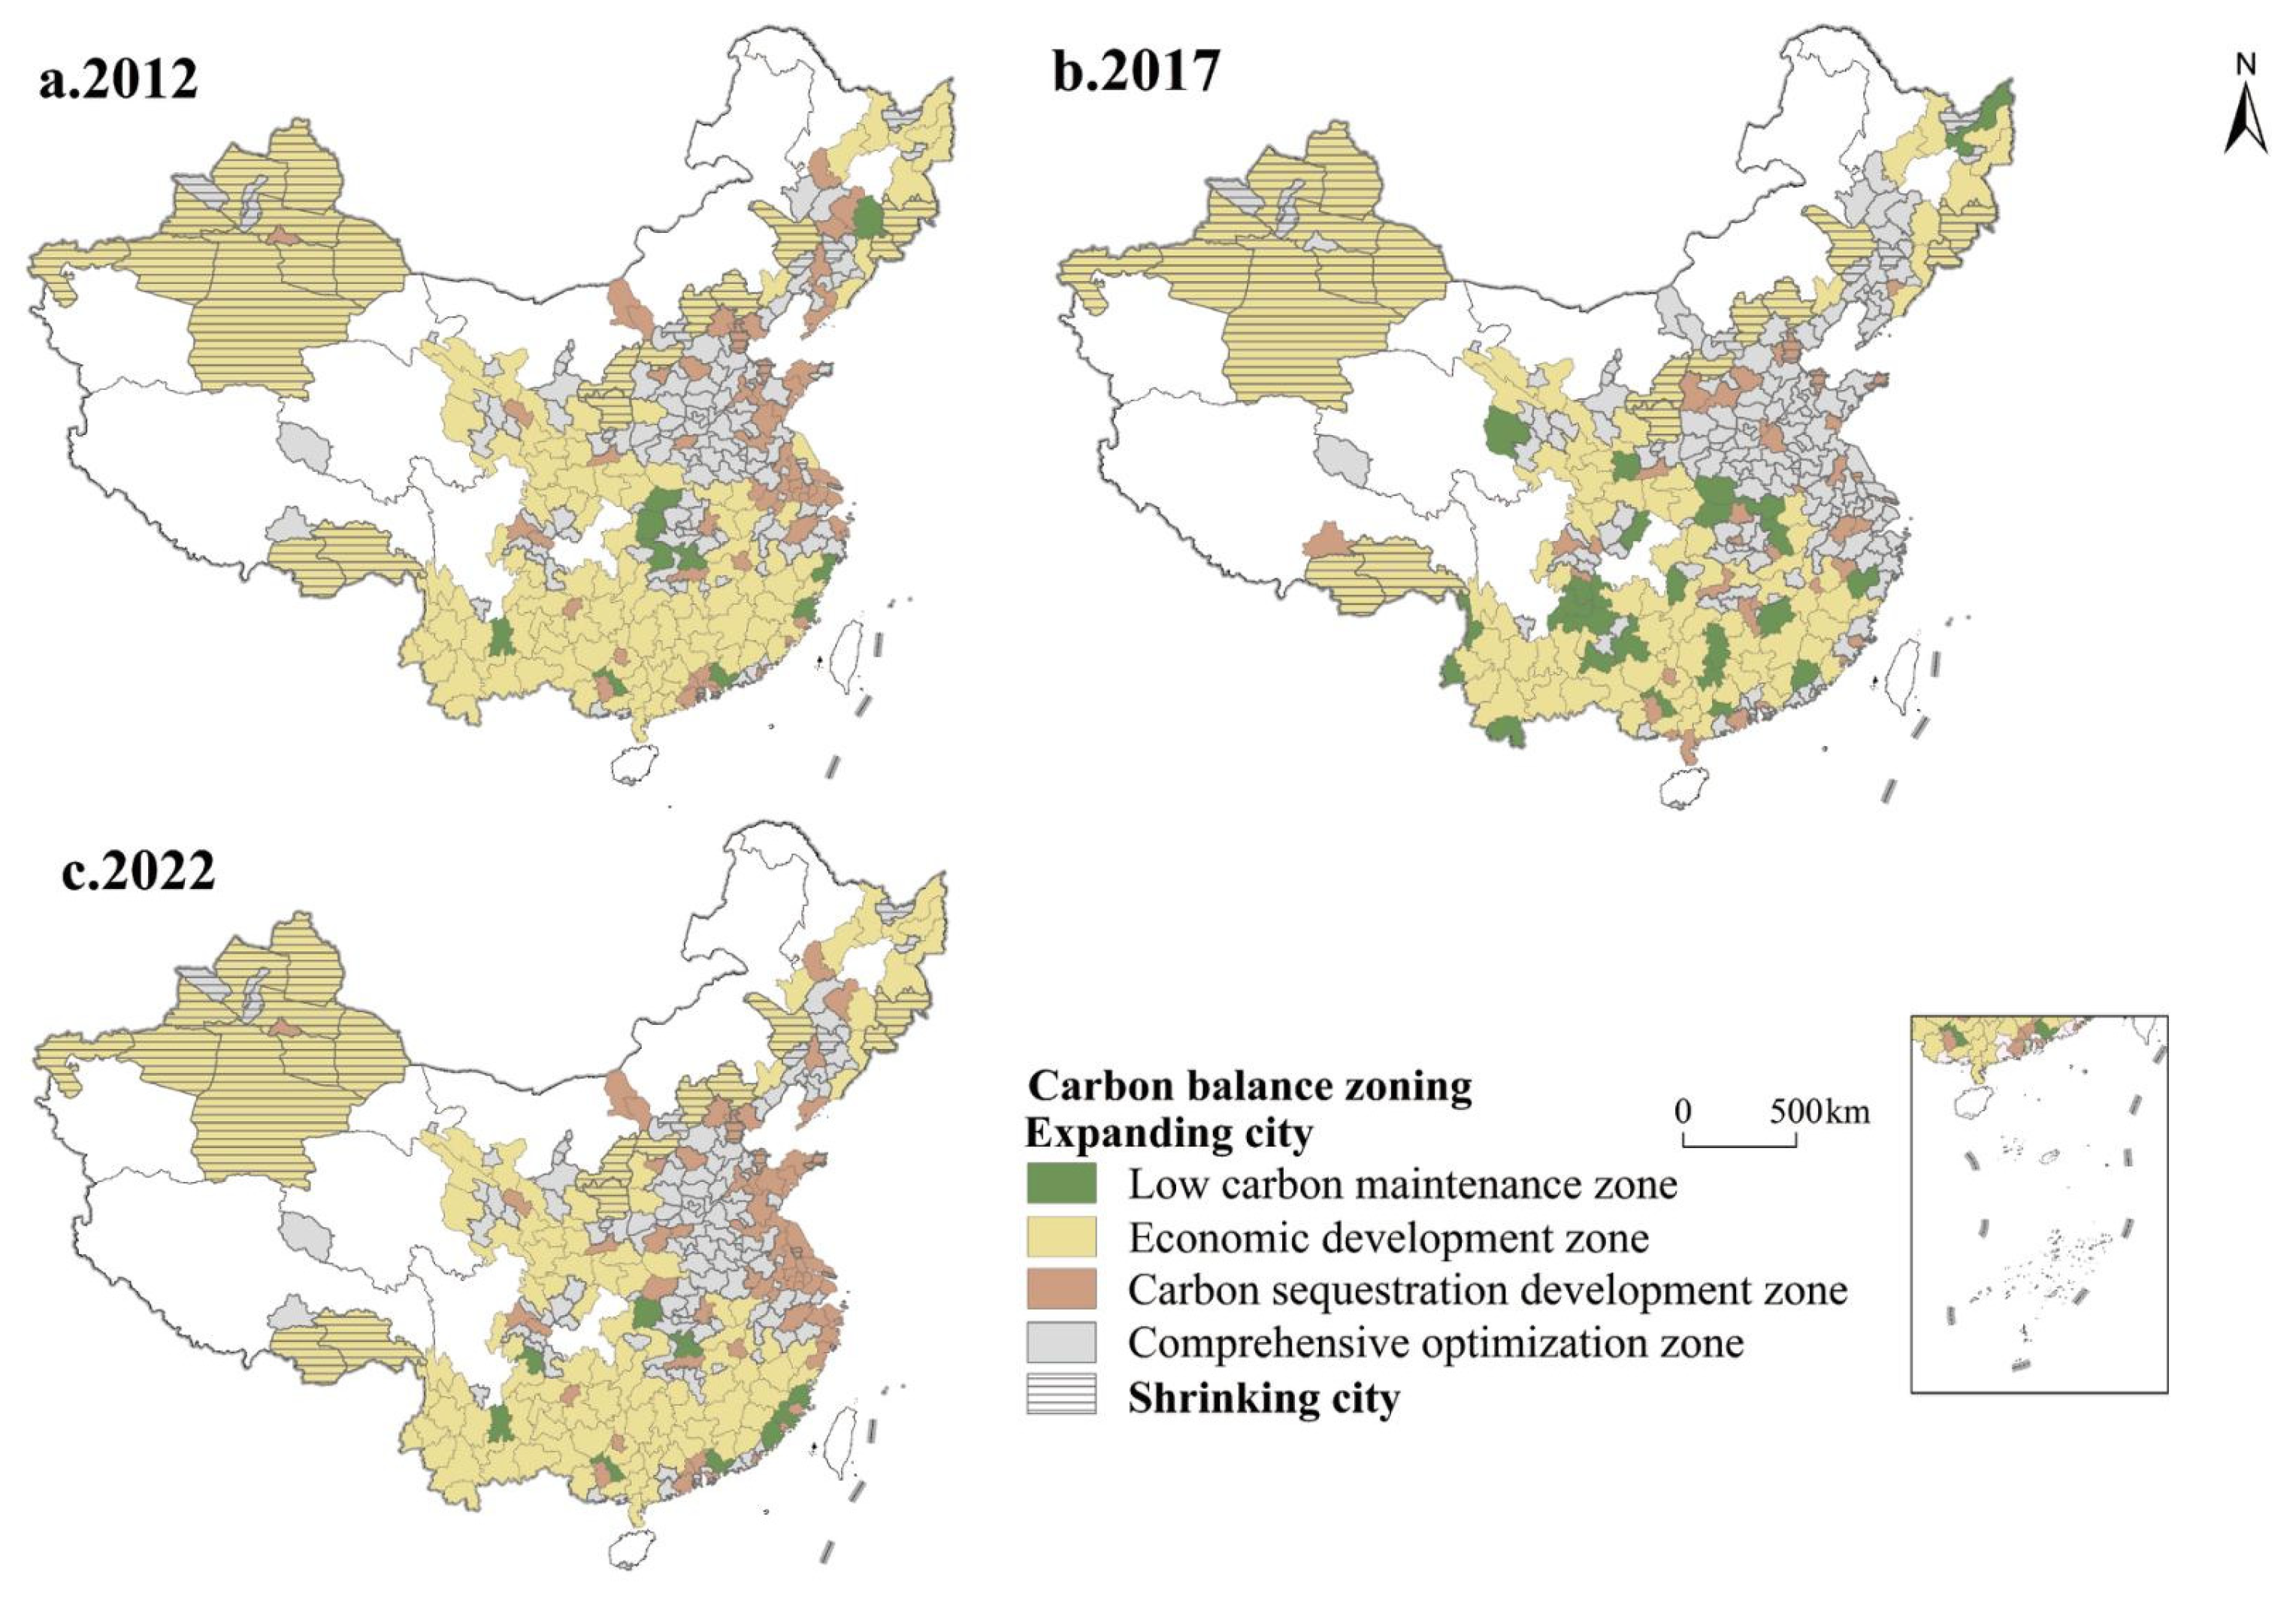
From 2012 to 2022, the carbon balance zoning of expanding and shrinking cities showed clear differences and slight changes. Among expanding cities, 3% were low-carbon maintenance areas (ECC > 1, ESC > 1), characterized by a relatively balanced economic development and natural resource protection, mainly in the southeastern coastal regions. 32% were economic development areas (ECC < 1, ESC > 1), with strong carbon sink capabilities but lower levels of science and technology and carbon production, showing a downward trend, primarily in the northeastern and western regions. 22% were carbon sink development areas (ECC > 1, ESC < 1), characterized by rapid economic growth and high levels but insufficient regional ecosystem carbon sequestration, showing an upward trend, including cities in the eastern coastal regions. 42% were comprehensive optimization areas (ECC < 1, ESC < 1), characterized by room for improvement in both economic construction and ecological environmental protection, mainly in provinces such as Henan, Ningxia, and Liaoning. Shrinking cities had no low-carbon maintenance areas, while economic development areas accounted for 45% of these cities, showing an upward trend, mainly in the northwestern and northern regions. Carbon sink development areas accounted for 14%, mainly located in the eastern coastal regions. Comprehensive optimization areas accounted for 40%, distributed in provinces such as Xinjiang, Shaanxi, Shanxi, and Liaoning, with a fragmented spatial pattern (Figure 10).

3.4. Driving Force Analysis

The GeoDetector results (Table 5) indicate that after screening, nine indicators passed the significance test (p < 0.05). For expanding cities, the q-values of PZ and IS were greater than 0.5, indicating a significant impact of industrial structure on carbon compensation rates. The q-values for UR, RA, TA, and ES were relatively high. The explanatory power of EL and CA for the spatial variation of carbon compensation rates was weak, with low significance. For shrinking cities, PZ was a more dominant factor than IS compared to expanding cities. Other factors had relatively high q-values, but none were less than 0.1. The interaction effects of each factor with other factors all exceeded the q-value of any single factor. In expanding cities, there was a nonlinear enhancement in the interactions between EL and PZ, and UR and ES, while the rest showed dual-factor enhancements. The interactions between PZ and IS with other factors were particularly significant, with the highest interaction value being IS and ES (0.841), followed by PZ and IS (0.795), and seven other interactions had explanatory power greater than 0.6. The lowest interaction value was EL and CA (0.104). In shrinking cities, nine combinations, such as EL∩ES, UR∩TA, and CA∩TA, exhibited nonlinear enhancement, while others were bi-factor enhanced. Key indicators such as PZ, IS, TA, and ES displayed strong interaction effects with other drivers (Figure 11).

4. Discussion

4.1. Trends and Key Areas of Carbon Source and Sink Under Urban Spatial Morphological Transformation

Through the statistical analysis of urban spatial expansion and contraction over a decade, China’s cities exhibit an asymmetric distribution in their dynamic evolution. Expanding cities constitute the dominant form within China’s urban system, forming a polycentric, networked spatial structure. This trend aligns with Zeng et al.’s findings that China’s urban expansion exhibits enhanced intensity, speed, and efficiency, yet shows pronounced regional disparities [39]. It also concurs with Seto et al.’s conclusion that urban land conversion is concentrated in Asia, with China forming coastal urban corridors that will bear the brunt of high-probability expansion outcomes [28]. The expansion of expansion-oriented cities, centered around the Pearl River Delta in South China and Beijing-Tianjin-Hebei in North China, indicates that urban expansion requires a stable internal and external growth mechanism, involving labor attraction and industrial upgrading [40], which leads to increased density in the city core and the transfer of industries and population from surrounding counties. In contrast, shrinking cities are embedded within low-density urban systems, exhibiting patchy clusters of shrinkage. Contraction-oriented cities exhibit a lock-in effect of partial concentration and overall dispersion in the old industrial clusters in Northeast China and resource-based cities in Northwest China, indicating that urban contraction often involves negative resource cycles and human capital loss. This characteristic aligns with Chen et al.’s findings that urban shrinkage in Northeast China exhibits two primary spatial distribution patterns: “peripheral agglomeration” and “ring-shaped core city belts” [41]. The contraction cores of these cities are often constrained by mining geography, typically relying on resource extraction for short-term capital accumulation, but over time, the feedback of resource loss leading to economic decline and population outflow becomes evident, resulting in urban allocation imbalances and a vicious cycle of spatial contraction and resource waste. This finding aligns with Martinez-Fernandez et al.’s assertion that urban decline is essentially an inevitable consequence of capital outflow driven by production restructuring and deindustrialization [25]. Furthermore, Haase et al. emphasize that urban regrowth requires systemic integration achieved through coordinated economic recovery and planning, synergistically promoting sustainable population and economic development [42].
Based on carbon source and sink estimates for expanding and shrinking Chinese cities from 2012 to 2022, we observed an overall upward trend in national carbon emissions, exhibiting a bimodal, non-equilibrium spatial pattern of “expansion-dominant, shrinkage-dissipative.” This horizontal and vertical heterogeneity can be attributed to several factors. Firstly, the dynamic mechanism driving carbon emissions in expanding cities may be due to CO2’s sensitivity to the expansion of construction land [43,44]. Traditional urban expansion, marked by economic growth and the non-agricultural use of land, has led to a continuous increase in carbon emissions [45,46]. The industrialization model has fostered urban spatial patterns reliant on fossil fuels, and these urban forms have in turn entrenched high-carbon production and lifestyles. This aligns with the findings of Rahman et al., who observed that urban expansion and industrialization in the Asia-Pacific region have driven elevated energy demand and carbon emissions, with household consumption and capital formation serving as the primary emission sources [47]. Secondly, the high carbon intensity dissipation structure in contracting cities may be due to resource depletion and the gradual decline of heavy industry, leading to population reduction and the inability of cities to reduce carbon emissions through agglomeration and scale advantages [48,49], hindering industrial metabolic efficiency upgrades, and complicating the allocation of carbon sequestration costs. From an overall perspective, the stabilization of the national carbon sequestration surface indicates that recent ecological engineering compensation and policy intervention measures have begun to show results, ensuring the deep dynamic balance of intergenerational carbon pool conversion and carbon storage space replacement. As Zhang et al. assessed, human activities are the key driver behind the enhancement of ecological service values through ecological restoration in China [50]. Meanwhile, Fu et al. noted that restoration projects have evolved from single-ecotype management to comprehensive system restoration, achieving significant results [51]. Based on a local perspective, cities that have shrunk are more commonly found in temperate and inland regions compared to those that have expanded. The climate-vegetation state locks the net primary productivity of plants [52]. Carbon sinks are constrained by water and heat conditions [53], such as the high degree of synergy between water retention and carbon storage in the arid northwest region [54]. Furthermore, some areas may experience abandonment and degradation, exacerbating the spatial imbalance in the demand for urban ecosystem services and leading to a decline in carbon sink functions [55,56].

4.2. Carbon Balance Zoning and Driving Force Heterogeneity Based on Urban Expansion–Contraction Evolution

From 2012 to 2022, China’s terrestrial carbon compensation efficiency showed a trend of decline, with the system dynamics attributed to the phase space reconstruction of carbon metabolic imbalance. This aligns with the quantitative results of carbon compensation by Wu et al. [57]. Carbon emissions during our study period displayed super-linear growth, while carbon sink capacity showed sub-linear growth. This implies that the expansion of economic scale in the late industrialization phase, driven by increased production capacity in heavy industries, led to annual emission growth. Meanwhile, the rise in urbanization rates resulted in direct annual losses in carbon sinks due to the expansion of new urban areas. The imbalance between the growth rates of carbon sources and sinks exacerbated the imbalance in the carbon balance. This phenomenon is also relatively common in other Asian countries, where dense populations and rapid economic development have led to a prominent conflict between economic growth and environmental sustainability, with per capita GDP growth exacerbating environmental degradation [58]. The spatial gradient mechanism of carbon compensation rates in expanding cities can be explained by the growth in carbon sink capacity driven by natural bases such as forests in southwestern regions, while social and economic development in central regions promoted or constrained the spread of carbon compensation hotspots and cold spots. For example, changes in urban land use affected the ecological space structure, altering the carbon balance pattern [59]. Urban spatial spillovers caused the flow of carbon balance nodes [60,61]. The spatial heterogeneity of carbon compensation rates in contracting cities can be analyzed from aspects such as industrial collapse and metabolic reorganization, and the lack of internal driving forces. The decline in the secondary industry’s share has laid a quantitative and qualitative foundation for increasing carbon sinks by releasing ecological space. However, the economic lag and technological adaptation challenges triggered by population migration pose constraints. On one hand, the reclamation of industrial land provides a platform for ecological restoration, directly enhancing carbon sink capacity through vegetation recovery and soil improvement [62]. On the other hand, population outflow creates a dual dilemma for ecological governance—funding shortages and insufficient technical support—which hinders industrial restructuring [63].
Under the novel perspective of assessing the coupling coordination between carbon sources and sinks in different city types, we constructed a carbon balance-oriented comprehensive evaluation system. This reveals that the spatial differentiation of urban CCR is predominantly driven by the dual-core of “industry-population” and the nonlinear coupling of multiple factors. Industrial structure emerges as the core driver due to its role in representing the carbon intensity differentiation of economic metabolism and the implicit regulatory capacity of service economies. The secondary industry, reliant on fossil fuels and subject to carbon lock-in, exhibits higher carbon emission intensity per unit of energy than the tertiary sector. Conversely, producer services can enhance manufacturing energy efficiency through digital technology enablement and shifts in consumption patterns. As Ou et al. point out, industrial upgrading and the promotion of green technological innovation can significantly curb carbon emissions, with regional variations and spatial spillover effects observed in their effectiveness [64]. Changes in industrial structure help curb regional carbon emissions to varying degrees [65,66]. Population scale is another essential factor influencing carbon balance on multiple levels [67]. Population density has an economic threshold effect; excessively high values can lead to the compression of carbon sink space, while excessively low values can result in infrastructure redundancy, leading to increased per capita carbon emissions [68]. Notably, in expansion cities, strong nonlinear coupling between industry and energy indicates a positive feedback loop between energy-intensive industries and coal dependency, necessitating simultaneous improvements in both industrial structure and energy efficiency [69]. In contracting cities, the interaction collapse between population and land suggests that population loss leads to increased idle construction land and rising marginal costs for ecological restoration. As Gunko et al. point out, the infrastructure systems in post-socialist regions are fragmented, revealing governance crises and escalating costs stemming from systemic dysfunctions at both spatial and managerial levels [70]. In summary, spatial governance strategies should be differentiated: expansion cities should adopt a triadic optimization model encompassing industrial, energy, and technological structures to address structural lock-in [71], while contraction cities should pursue systemic renewal through “population redistribution–land redevelopment–infrastructure reorganization,” turning population–land interactions into levers for enhancing carbon sink capacity.

4.3. Research Significance and Innovation Points

In terms of research scale and precision, this study establishes a high-accuracy correlation model between nighttime light (NTL) data and provincial carbon emissions to achieve a downscaled estimation of municipal energy consumption and emissions. This effectively addresses data gaps and insufficient granularity in urban-level carbon emissions. Theoretically, we construct a dual-mode urban carbon metabolism framework incorporating both contraction and expansion patterns. By introducing three indicators—CCR, ECC, and ESC [72] to measure the differentiated response mechanisms of two types of cities in achieving a dynamic carbon source–sink balance. This enables the identification of spatial patterns and process evolution analysis of heterogeneous urban carbon balances, reflecting the multi-objective trade-offs cities face in sustainable development. It thereby synergistically advances decent work and economic growth, sustainable cities and communities, and climate action. Spatial statistics and geographic detector methods are employed to analyze driving mechanisms, revealing the formation mechanisms of spatial differentiation in urban carbon metabolism. Through global and local spatial autocorrelation analysis, the spatial clustering patterns of carbon compensation rates are characterized. Furthermore, quantitative analysis quantifies the independent explanatory power of factors such as GDP, urbanization rate (UR), and technical assistance (TA) on carbon compensation rates, along with their interactions. This validates the nonlinear relationship between urban development stages and carbon balance states, identifies key control points, and provides references for enhancing urban carbon neutrality effectiveness.
To better serve global climate governance, this study demonstrates that under the influence of factor agglomeration, expansive cities form polycentric network structures, while the intertwining of industrial and energy systems further exacerbates carbon lock-in effects. This carbon source-dominated growth exposes the inertia of traditional development models. Conversely, shrinking cities face a “shrinkage-dissipation” dilemma due to resource depletion and human capital loss. Although national carbon sink volume shows resilient growth, reflecting the effectiveness of ecological restoration projects such as reforestation, carbon compensation efficiency continues to decline. Therefore, we recommend building a differentiated regulatory system: expansion cities should impose constraints on the carbon intensity of built-up land and promote low-carbon industrial development and smart governance; contraction cities should innovate mechanisms for ecological product value realization and transform carbon sink increments into development rights compensation. Synergizing carbon reduction in urban agglomerations with quality improvement in ecological barriers is essential to achieve the deep integration of high-quality development and carbon neutrality goals.

4.4. Limitations

While this study yields significant findings, several limitations warrant acknowledgment: (1) Due to data availability limitations, prefecture-level city data were incomplete, hindering comprehensive coverage of urban shrinkage and expansion nationwide. The analysis of the driving mechanisms behind urban expansion and shrinkage also has limitations, as these processes are influenced by multifaceted factors, including economic development, population migration, and land use policies, requiring further quantitative analysis and empirical research. (2) This study primarily relied on NTL data and the CASA model to estimate urban carbon emissions and sequestration in China. While adhering to model principles, discrepancies may exist compared to estimates derived from other models or key variables. Future research should incorporate multi-regional and multi-temporal comparative analyses to enhance empirical validity and data accuracy.

5. Conclusions

This study integrates urban dynamic evolution theory with carbon metabolic mechanisms and constructs a multi-scale coupling analysis framework of “development dynamics—carbon source/sink heterogeneity—eco-economic synergy”. By applying the Sen-MK trend test and the geographical detector model, the spatial–temporal differentiation of carbon balance across 295 expansionary and 42 shrinking cities in China from 2012 to 2022 is revealed. The results show a general upward trend in total carbon emissions, while the relative growth in carbon storage remains limited, resulting in a west–high to east–low gradient pattern in carbon compensation rates. The findings indicate that expansionary cities exhibit an advantage in economic efficiency of carbon emissions, with carbon compensation hotspots concentrated in the southwest, driven by industrial structure and energy intensity. In contrast, shrinking cities display a stronger carbon sink background, with hotspots aligned along the Hu Huanyong Line, primarily influenced by population scale and the constraints of built-up land. Based on the classification of carbon balance regulation units derived from the ecological carbon carrying coefficient and the economic carbon contribution coefficient, 82.7% of expansionary cities fall into the “high economic–low ecological” quadrant, indicating the need to decouple the superlinear coupling between industry and energy. Meanwhile, 63.4% of shrinking cities are located in the “low economic–high ecological” quadrant, suggesting that land reallocation elasticity could be leveraged to reactivate ecological network reconstruction. Based on research findings, China must implement differentiated carbon governance strategies in advancing its modernization process: expanding cities should focus on low-carbon transformation and resource efficiency to curb environmental degradation, while shrinking cities need to tap into their ecological restoration and carbon sink enhancement potential to drive low-carbon economic transition. Concurrently, providing industrial and energy decoupling pathways for Asian cities at different developmental stages will promote the regional integration of urban sustainable development theory and practice.

Author Contributions

Software, J.L.; Validation, K.L.; Formal analysis, J.L.; Investigation, J.L.; Resources, Z.W.; Data curation, K.L.; Writing—original draft, J.L.; Writing—review and editing, K.L. and Z.W.; Supervision, Z.W.; Project administration, Z.W. and L.X.; Funding acquisition, Z.W.; Resources, L.X. All authors have read and agreed to the published version of the manuscript.

Funding

This study was supported by Technology Innovation Center for Ecological Conservation and Restoration in Dongting Lake Basin, Ministry of Natural Re-sources (Project NO.: DTB.TICECR-2024-10), National Natural Science Foundation of China (Project NO.: 42207530) and Fundamental Research Funds for the Central Universities (Project NO.: 292022004).

Institutional Review Board Statement

Not applicable.

Informed Consent Statement

Not applicable.

Data Availability Statement

The original contributions presented in this study are included in the article. Further inquiries can be directed to the corresponding authors.

Conflicts of Interest

The authors declare no conflicts of interest.

References

  1. Semenov, S.M. Intergovernmental Panel on Climate Change: Results, Problems, and Prospects. Izv. Atmos. Ocean. Phys. 2024, 60, S323–S330. [Google Scholar] [CrossRef]
  2. Wang, J.; Zhu, X.; Chen, Y. Climate Change, Carbon Neutrality: The Role of Spatial Economics. Ann. Reg. Sci. 2024, 73, 459–466. [Google Scholar] [CrossRef]
  3. Anwar, A.; Sinha, A.; Sharif, A.; Siddique, M.; Irshad, S.; Anwar, W.; Malik, S. The Nexus between Urbanization, Renewable Energy Consumption, Financial Development, and CO2 Emissions: Evidence from Selected Asian Countries. Environ. Dev. Sustain. 2022, 24, 6556–6576. [Google Scholar] [CrossRef]
  4. Chen, L.; Msigwa, G.; Yang, M.; Osman, A.I.; Fawzy, S.; Rooney, D.W.; Yap, P.-S. Strategies to Achieve a Carbon Neutral Society: A Review. Environ. Chem. Lett. 2022, 20, 2277–2310. [Google Scholar] [CrossRef]
  5. Derouez, F.; Ifa, A. Assessing the Sustainability of Southeast Asia’s Energy Transition: A Comparative Analysis. Energies 2025, 18, 287. [Google Scholar] [CrossRef]
  6. Li, W.; Ma, H.; Lu, C. Research on the Economic Abatement Pathway of Carbon Peaking in China Based on Marginal Abatement Costs and Abatement Tasks Allocation. Environ. Sci. Pollut. Res. 2023, 30, 7956–7972. [Google Scholar] [CrossRef] [PubMed]
  7. Urata, T.; Yamada, T.; Itsubo, N.; Inoue, M. Modeling and Balancing for Costs and CO2 Emissions in Global Supply Chain Network among Asian Countries. Procedia CIRP 2015, 26, 664–669. [Google Scholar] [CrossRef]
  8. Yue, T.; Li, M.; Chen, H.; Long, R.; Wang, Y. Carbon Neutrality Research Hotspots and Evolution Trend: Based on the Scientific Knowledge Map. Resour. Sci. 2022, 44, 701–715. [Google Scholar] [CrossRef]
  9. Pielke, R.; Burgess, M.G.; Ritchie, J. Plausible 2005–2050 Emissions Scenarios Project between 2 °C and 3 °C of Warming by 2100. Environ. Res. Lett. 2022, 17, 024027. [Google Scholar] [CrossRef]
  10. Rahman, M.M.; Ahmed, R.; Mashud, A.H.M.; Malik, A.I.; Miah, S.; Abedin, M.Z. Consumption-Based CO2 Emissions on Sustainable Development Goals of SAARC Region. Sustainability 2022, 14, 1467. [Google Scholar] [CrossRef]
  11. Liddle, B. Consumption-Based Accounting and the Trade-Carbon Emissions Nexus in Asia: A Heterogeneous, Common Factor Panel Analysis. Sustainability 2018, 10, 3627. [Google Scholar] [CrossRef]
  12. Nel, W.P.; Cooper, C.J. Implications of Fossil Fuel Constraints on Economic Growth and Global Warming. Energy Policy 2009, 37, 166–180. [Google Scholar] [CrossRef]
  13. Chen, H.; Zhang, X.; Wu, R.; Cai, T. Revisiting the Environmental Kuznets Curve for City-Level CO2 Emissions: Based on Corrected NPP-VIIRS Nighttime Light Data in China. J. Clean. Prod. 2020, 268, 121575. [Google Scholar] [CrossRef]
  14. Guo, W.; Li, Y.; Li, P.; Zhao, X.; Zhang, J. Using a Combination of Nighttime Light and MODIS Data to Estimate Spatiotemporal Patterns of CO2 Emissions at Multiple Scales. Sci. Total Environ. 2022, 848, 157630. [Google Scholar] [CrossRef] [PubMed]
  15. Piao, S.; Yue, C.; Ding, J.; Guo, Z. Perspectives on the Role of Terrestrial Ecosystems in the ‘Carbon Neutrality’ Strategy. Sci. China Earth Sci. 2022, 65, 1178–1186. [Google Scholar] [CrossRef]
  16. Hubau, W.; Lewis, S.L.; Phillips, O.L.; Affum-Baffoe, K.; Beeckman, H.; Cuni-Sanchez, A.; Daniels, A.K.; Ewango, C.E.N.; Fauset, S.; Mukinzi, J.M.; et al. Asynchronous Carbon Sink Saturation in African and Amazonian Tropical Forests. Nature 2020, 579, 80–87. [Google Scholar] [CrossRef] [PubMed]
  17. Chen, J.M.; Ju, W.; Ciais, P.; Viovy, N.; Liu, R.; Liu, Y.; Lu, X. Vegetation Structural Change since 1981 Significantly Enhanced the Terrestrial Carbon Sink. Nat. Commun. 2019, 10, 4259. [Google Scholar] [CrossRef] [PubMed]
  18. Ortega-Ruiz, G.; Mena-Nieto, A.; Golpe, A.A.; Garcia-Ramos, J.E. CO2 Emissions and Causal Relationships in the Six Largest World Emitters. Renew. Sustain. Energy Rev. 2022, 162, 112435. [Google Scholar] [CrossRef]
  19. Li, B.; Rahman, M.M.; Haneklaus, N.; Li, S.; Zhou, Y. Green Transition Initiatives to Reduce Environmental Degradation: Adaptation, Mitigation and Synergistic Effects. Environ. Impact Assess. Rev. 2025, 115, 107993. [Google Scholar] [CrossRef]
  20. Kopczewska, K.; Elhorst, P. New Developments in Spatial Econometric Modelling. Spat. Econ. Anal. 2024, 19, 1–7. [Google Scholar] [CrossRef]
  21. Zhang, X.; Zhao, Y. Identification of the Driving Factors’ Influences on Regional Energy-Related Carbon Emissions in China Based on Geographical Detector Method. Environ. Sci. Pollut. Res. 2018, 25, 9626–9635. [Google Scholar] [CrossRef]
  22. Wolff, M.; Wiechmann, T. Urban Growth and Decline: Europe’s Shrinking Cities in a Comparative Perspective 1990–2010. Eur. Urban Reg. Stud. 2018, 25, 122–139. [Google Scholar] [CrossRef]
  23. Wiechmann, T.; Pallagst, K.M. Urban Shrinkage in Germany and the USA: A Comparison of Transformation Patterns and Local Strategies. Int. J. Urban Reg. Res. 2012, 36, 261–280. [Google Scholar] [CrossRef] [PubMed]
  24. Meng, X.; Long, Y. Shrinking Cities in China: Evidence from the Latest Two Population Censuses 2010–2020. Environ. Plan.-Econ. Space 2022, 54, 449–453. [Google Scholar] [CrossRef]
  25. Martinez-Fernandez, C.; Audirac, I.; Fol, S.; Cunningham-Sabot, E. Shrinking Cities: Urban Challenges of Globalization. Int. J. Urban Reg. Res. 2012, 36, 213–225. [Google Scholar] [CrossRef]
  26. Jiang, N.; Crooks, A.; Wang, W.; Xie, Y. Simulating Urban Shrinkage in Detroit via Agent-Based Modeling. Sustainability 2021, 13, 2283. [Google Scholar] [CrossRef]
  27. Morckel, V. Population Decline and Data Discrepancies: Evaluating ACS Estimates and Comprehensive Plan Projections for a Subset of U.S. Shrinking Cities. Plan. Pract. Res. 2025, 40, 954–964. [Google Scholar] [CrossRef]
  28. Seto, K.C.; Gueneralp, B.; Hutyra, L.R. Global Forecasts of Urban Expansion to 2030 and Direct Impacts on Biodiversity and Carbon Pools. Proc. Natl. Acad. Sci. USA 2012, 109, 16083–16088. [Google Scholar] [CrossRef]
  29. Fang, C.; Wang, S.; Li, G. Changing Urban Forms and Carbon Dioxide Emissions in China: A Case Study of 30 Provincial Capital Cities. Appl. Energy 2015, 158, 519–531. [Google Scholar] [CrossRef]
  30. Delavar, Y.; Delavar, A.; Suzanchi, K.; Ochoa, K.S. GreenPlotter: An AI-Driven Low-Carbon Design Algorithm for Land Partitioning and Sustainable Urban Development. Technol. Des. 2024, 8, 380–392. [Google Scholar] [CrossRef]
  31. Roncero-Tarazona, M.; Ribo-Perez, D.; Rodolfo-Martinez, L.; Gil-Chong, P.; Montagud-Montalva, C.; Gomez-Navarro, T. Scale Matters: A 3 Scope Urban Carbon Footprint Accounting at the Neighborhood Level. Sustain. Cities Soc. 2025, 130, 106429. [Google Scholar] [CrossRef]
  32. Purcell, L.; O’Regan, A.C.; McGookin, C.; Nyhan, M.M. Modelling Urban Carbon Emissions for Multiple Sectors in High Spatial Resolution for Achieving Sustainable & Net-Zero Cities. Sustain. Cities Soc. 2025, 126, 106370. [Google Scholar] [CrossRef]
  33. Felix, N.B.; Campos, P.C.D.O.; Paz, I.; Marques, M.E.S. Geoprocessing Applied to the Assessment of Carbon Storage and Sequestration in a Brazilian Medium-Sized City. Sustainability 2022, 14, 8761. [Google Scholar] [CrossRef]
  34. Zheng, H.; Zhang, R. Identification of Shrinkage Patterns in Japan’s Four Major Metropolitan Areas Based on Nighttime Light and Population Data. Int. J. Appl. Earth Obs. Geoinf. 2025, 136, 104391. [Google Scholar] [CrossRef]
  35. Levin, N.; Kyba, C.C.M.; Zhang, Q.; de Miguel, A.S.; Roman, M.O.; Li, X.; Portnov, B.A.; Molthan, A.L.; Jechow, A.; Miller, S.D.; et al. Remote Sensing of Night Lights: A Review and an Outlook for the Future. Remote Sens. Environ. 2020, 237, 111443. [Google Scholar] [CrossRef]
  36. Bivand, R.S.; Wong, D.W.S. Comparing Implementations of Global and Local Indicators of Spatial Association. Test 2018, 27, 716–748. [Google Scholar] [CrossRef]
  37. Wang, B.; Shi, W.; Miao, Z. Confidence Analysis of Standard Deviational Ellipse and Its Extension into Higher Dimensional Euclidean Space. PLoS ONE 2015, 10, e0118537. [Google Scholar] [CrossRef]
  38. Song, Y.; Wang, J.; Ge, Y.; Xu, C. An Optimal Parameters-Based Geographical Detector Model Enhances Geographic Characteristics of Explanatory Variables for Spatial Heterogeneity Analysis: Cases with Different Types of Spatial Data. GISci. Remote Sens. 2020, 57, 593–610. [Google Scholar] [CrossRef]
  39. Zeng, J.; Cui, X.; Chen, W.; Yao, X. Impact of Urban Expansion on the Supply-Demand Balance of Ecosystem Services: An Analysis of Prefecture-Level Cities in China. Environ. Impact Assess. Rev. 2023, 99, 107003. [Google Scholar] [CrossRef]
  40. Salvati, L.; Lamonica, G.R. Containing Urban Expansion: Densification vs. Greenfield Development, Socio-Demographic Transformations and the Economic Crisis in a Southern European City, 2006–2015. Ecol. Indic. 2020, 110, 105923. [Google Scholar] [CrossRef]
  41. Chen, X.; Lang, W.; Yuan, Y.; Yan, G.; Hou, X. Conceptualizing the Nexus between Spatiotemporal Shrinkage Patterns of Natural Cities and Driving Mechanisms: Insights into Urban Shrinkage in Northeast China. Cities 2024, 152, 105179. [Google Scholar] [CrossRef]
  42. Haase, A.; Bontje, M.; Couch, C.; Marcinczak, S.; Rink, D.; Rumpel, P.; Wolff, M. Factors Driving the Regrowth of European Cities and the Role of Local and Contextual Impacts: A Contrasting Analysis of Regrowing and Shrinking Cities. Cities 2021, 108, 102942. [Google Scholar] [CrossRef]
  43. Huo, T.; Li, X.; Cai, W.; Zuo, J.; Jia, F.; Wei, H. Exploring the Impact of Urbanization on Urban Building Carbon Emissions in China: Evidence from a Provincial Panel Data Model. Sustain. Cities Soc. 2020, 56, 102068. [Google Scholar] [CrossRef]
  44. Huo, T.; Ma, Y.; Xu, L.; Feng, W.; Cai, W. Carbon Emissions in China’s Urban Residential Building Sector through 2060: A Dynamic Scenario Simulation. Energy 2022, 254, 124395. [Google Scholar] [CrossRef]
  45. Huang, L.; Krigsvoll, G.; Johansen, F.; Liu, Y.; Zhang, X. Carbon Emission of Global Construction Sector. Renew. Sustain. Energy Rev. 2018, 81, 1906–1916. [Google Scholar] [CrossRef]
  46. Zhou, Y.; Chen, M.; Tang, Z.; Mei, Z. Urbanization, Land Use Change, and Carbon Emissions: Quantitative Assessments for City-Level Carbon Emissions in Beijing-Tianjin-Hebei Region. Sustain. Cities Soc. 2021, 66, 102701. [Google Scholar] [CrossRef]
  47. Rahman, M.M.; Anan, N.; Mashud, A.H.M.; Hasan, M.; Tseng, M.-L. Consumption-Based CO2 Emissions Accounting and Scenario Simulation in Asia and the Pacific Region. Environ. Sci. Pollut. Res. 2022, 29, 34607–34623. [Google Scholar] [CrossRef]
  48. Liu, X.; Wang, M.; Qiang, W.; Wu, K.; Wang, X. Urban Form, Shrinking Cities, and Residential Carbon Emissions: Evidence from Chinese City-Regions. Appl. Energy 2020, 261, 114409. [Google Scholar] [CrossRef]
  49. Shen, W.; Liang, H.; Dong, L.; Ren, J.; Wang, G. Synergistic CO2 Reduction Effects in Chinese Urban Agglomerations: Perspectives from Social Network Analysis. Sci. Total Environ. 2021, 798, 149352. [Google Scholar] [CrossRef]
  50. Zhang, Y.; Zhao, X.; Gong, J.; Luo, F.; Pan, Y. Effectiveness and Driving Mechanism of Ecological Restoration Efforts in China from 2009 to 2019. Sci. Total Environ. 2024, 910, 168676. [Google Scholar] [CrossRef]
  51. Fu, B.; Liu, Y.; Meadows, M.E. Ecological Restoration for Sustainable Development in China. Natl. Sci. Rev. 2023, 10, nwad033. [Google Scholar] [CrossRef]
  52. Wen, D.; He, N. Forest Carbon Storage along the North-South Transect of Eastern China: Spatial Patterns, Allocation, and Influencing Factors. Ecol. Indic. 2016, 61, 960–967. [Google Scholar] [CrossRef]
  53. Schwalm, C.R.; Anderegg, W.R.L.; Michalak, A.M.; Fisher, J.B.; Biondi, F.; Koch, G.; Litvak, M.; Ogle, K.; Shaw, J.D.; Wolf, A.; et al. Global Patterns of Drought Recovery. Nature 2017, 548, 202–205. [Google Scholar] [CrossRef] [PubMed]
  54. Bie, Q.; Huang, C. Land Use/Cover Changes Lead to a Decrease in Carbon Storage in Arid Regions-a Case Study of Northwest China. Sci. Total Environ. 2025, 992, 179993. [Google Scholar] [CrossRef] [PubMed]
  55. Chen, J.; Kinoshita, T.; Li, H.; Luo, S.; Su, D.; Yang, X.; Hu, Y. Toward Green Equity: An Extensive Study on Urban Form and Green Space Equity for Shrinking Cities. Sustain. Cities Soc. 2023, 90, 104395. [Google Scholar] [CrossRef]
  56. Safransky, S. Greening the Urban Frontier: Race, Property, and Resettlement in Detroit. Geoforum 2014, 56, 237–248. [Google Scholar] [CrossRef]
  57. Wu, L.; Sun, L.; Qi, P.; Ren, X.; Sun, X. Energy Endowment, Industrial Structure Upgrading, and CO2 Emissions in China: Revisiting Resource Curse in the Context of Carbon Emissions. Resour. Policy 2021, 74, 102329. [Google Scholar] [CrossRef]
  58. Ahmed, T.; Rahman, M.M.; Aktar, M.; Das Gupta, A.; Abedin, M.Z. The Impact of Economic Development on Environmental Sustainability: Evidence from the Asian Region. Environ. Dev. Sustain. 2023, 25, 3523–3553. [Google Scholar] [CrossRef]
  59. Ou, Y.; Bao, Z.; Ng, S.T.; Song, W.; Chen, K. Land-Use Carbon Emissions and Built Environment Characteristics: A City-Level Quantitative Analysis in Emerging Economies. Land Use Policy 2024, 137, 107019. [Google Scholar] [CrossRef]
  60. Li, J.; Jiao, L.; Li, F.; Lu, X.; Hou, J.; Li, R.; Cai, D. Spatial Disequilibrium and Influencing Factors of Carbon Emission Intensity of Construction Land in China. J. Clean. Prod. 2023, 396, 136464. [Google Scholar] [CrossRef]
  61. Ren, X.; Xiong, R.; Ni, T. Spatial Network Characteristics of Carbon Balance in Urban Agglomerations—A Case Study in Beijing-Tianjin-Hebei City Agglomeration. Appl. Geogr. 2024, 169, 103343. [Google Scholar] [CrossRef]
  62. Peng, X.; Zhou, Y.; Fu, X.; Xu, J. Study on the Spatial-Temporal Pattern and Evolution of Surface Urban Heat Island in 180 Shrinking Cities in China. Sustain. Cities Soc. 2022, 84, 104018. [Google Scholar] [CrossRef]
  63. Zhang, J.; Fu, M.; Wang, L.; Liang, Y.; Tang, F.; Li, S.; Wu, C. Impact of Urban Shrinkage on Pollution Reduction and Carbon Mitigation Synergy: Spatial Heterogeneity and Interaction Effects in Chinese Cities. Land 2025, 14, 537. [Google Scholar] [CrossRef]
  64. Ou, Y.; Li, Y.; Zhang, T. Implementation Pathways for Carbon Emission Reduction Through Environmental Regulations: Synergistic Mechanisms of Industrial Intelligence and Green Technological Innovation. Sustainability 2025, 17, 7918. [Google Scholar] [CrossRef]
  65. Cheng, Z.; Li, L.; Liu, J. Industrial Structure, Technical Progress and Carbon Intensity in China’s Provinces. Renew. Sustain. Energy Rev. 2018, 81, 2935–2946. [Google Scholar] [CrossRef]
  66. Chen, J.; Yuan, H.; Tian, X.; Zhang, Y.; Shi, F. What Determines the Diversity of CO2 Emission Patterns in the Beijing-Tianjin-Hebei Region of China? An Analysis Focusing on Industrial Structure Change. J. Clean. Prod. 2019, 228, 1088–1098. [Google Scholar] [CrossRef]
  67. Bu, Y.; Wang, E.; Qiu, Y.; Moest, D. Impact Assessment of Population Migration on Energy Consumption and Carbon Emissions in China: A Spatial Econometric Investigation. Environ. Impact Assess. Rev. 2022, 93, 106744. [Google Scholar] [CrossRef]
  68. Yang, W.; Pan, J. How Do Trade-Offs between Ecological Construction and Urbanization Affect Regional Carbon Balance? A Case Study from China’s Yellow River Basin. Catena 2024, 247, 108534. [Google Scholar] [CrossRef]
  69. Mi, Z.-F.; Pan, S.-Y.; Yu, H.; Wei, Y.-M. Potential Impacts of Industrial Structure on Energy Consumption and CO2 Emission: A Case Study of Beijing. J. Clean. Prod. 2015, 103, 455–462. [Google Scholar] [CrossRef]
  70. Gunko, M. Postsocialism through the Lens of Shrinking Cities and Urban Infrastructure. Eurasian Geogr. Econ. 2025, 66, 697–704. [Google Scholar] [CrossRef]
  71. Xie, R.; Teo, T.S.H. Green Technology Innovation, Environmental Externality, and the Cleaner Upgrading of Industrial Structure in China—Considering the Moderating Effect of Environmental Regulation. Technol. Forecast. Soc. Change 2022, 184, 122020. [Google Scholar] [CrossRef]
  72. Xiong, S.; Yang, F.; Li, J.; Xu, Z.; Ou, J. Temporal-Spatial Variation and Regulatory Mechanism of Carbon Budgets in Territorial Space through the Lens of Carbon Balance: A Case of the Middle Reaches of the Yangtze River Urban Agglomerations, China. Ecol. Indic. 2023, 154, 110885. [Google Scholar] [CrossRef]
Figure 1. Study area.
Atmosphere 16 01155 g001
Figure 2. Temporal trends of carbon emissions in expanding and shrinking cities, 2012–2022.
Atmosphere 16 01155 g002
Figure 3. Spatial distribution of carbon emissions in expanding and shrinking cities, 2012–2022.
Atmosphere 16 01155 g003
Figure 4. Temporal trends of carbon sequestration in expanding and shrinking cities, 2012–2022.
Atmosphere 16 01155 g004
Figure 5. Spatial distribution of carbon sequestration in expanding and shrinking cities, 2012–2022.
Atmosphere 16 01155 g005
Figure 6. Spatial distribution of carbon offset in expanding and shrinking cities, 2012–2022.
Atmosphere 16 01155 g006
Figure 7. Hotspot distribution of carbon emissions in expanding and shrinking cities.
Atmosphere 16 01155 g007
Figure 8. Spatial distribution of ECC in expanding and shrinking cities, 2012–2022.
Atmosphere 16 01155 g008
Figure 9. Spatial distribution of ESC in expanding and shrinking cities, 2012–2022.
Atmosphere 16 01155 g009
Figure 10. Spatial distribution of carbon balance zoning in expanding and shrinking cities.
Atmosphere 16 01155 g010
Figure 11. Interaction results of impact factors of carbon offset.
Atmosphere 16 01155 g011
Table 1. Data type and source.
TypesDataPrecisionSources
Remote sensing imageNighttime light data500 mhttps://www.ngdc.noaa.gov/ (assessed on 19 December 2024)
Land cover data30 mhttps://zenodo.org/records/12779975 (assessed on 1 September 2024)
Meteorological datamonthlyhttps://data.cma.cn/ (assessed on 22 March 2025)
NDVI raster data1000 mhttps://www.resdc.cn/ (assessed on 14 October 2024)
Statistical dataSocioeconomic datayearlyhttp://www.stats.gov.cn/ (assessed on 2 June 2025)
Other auxiliary dataAdministrative boundaryGS(2024)0650https://cloudcenter.tianditu.gov.cn (assessed on 3 February 2025)
Table 2. Carbon emission factor for different types of fuels.
Carbon Emission SourcesDiscount Factor for Standard Coal (t Standard Coal/t)Carbon Emission Coefficient
(104 t Carbon/104 t Standard Coal)
Raw coal0.710.76
Coke0.970.86
Crude oil1.430.59
Gasoline1.470.55
Kerosene1.470.57
Diesel1.480.59
fuel oil1.430.62
natural gas1.330.45
Heat34.120.67
Electricity0.3450.272
Note: The unit for heat conversion to standard coal is kg ce/million kJ, and the conversion coefficient unit for electricity is kg/kWh.
Table 3. Classification of the number of cities in China.
YearShrinking Cities (%)Expanding Cities (%)
Significant ShrinkageNon-Significant ShrinkageSignificant ExpansionNon-Significant Expansion
2012–20170.7822.1465.6539.74
2017–20222.089.6845.7842.08
2012–20221.8114.3528.3855.06
Table 4. Moran index of carbon compensation from 2012 to 2022.
YearShrinking CitiesExpanding Cities
Moran’s IZMoran’s IZ
20120.1677671.5975660.218301 ***26.409825
20170.1559891.5241040.231272 ***27.964083
20220.1615091.5719220.232322 ***28.123701
Note: ***: p < 0.01.
Table 5. Detection results of urban change on carbon offset impact factor.
TypesVariablesELURPZCARAISTAES
Expanding citiesq0.07440.23430.50890.08030.16610.52370.08510.3656
p0.0000.0000.0000.0000.0000.0000.0000.000
Shrinking citiesq0.29510.45580.86330.38650.26090.74620.16030.2367
p0.0000.0000.0000.0000.0000.0000.00510.000
Disclaimer/Publisher’s Note: The statements, opinions and data contained in all publications are solely those of the individual author(s) and contributor(s) and not of MDPI and/or the editor(s). MDPI and/or the editor(s) disclaim responsibility for any injury to people or property resulting from any ideas, methods, instructions or products referred to in the content.