Article

Study on Characteristics and Numerical Simulation of a Convective Low-Level Wind Shear Event at Xining Airport

1
China Meteorological Administration Key Laboratory for Aviation Meteorology, Civil Aviation Flight University of China, Guanghan 618307, China
2
College of Aviation Meteorology, Civil Aviation Flight University of China, Guanghan 618307, China
3
Hebei Provincial Meteorological Observatory, Shijiazhuang 050000, China
4
College of Electronic Engineering, Chengdu University of Information Technology, Chengdu 610225, China
5
College of Meteorological Observation, Chengdu University of Information Technology, Chengdu 610225, China
*
Authors to whom correspondence should be addressed.
Atmosphere 2025, 16(10), 1137; https://doi.org/10.3390/atmos16101137
Submission received: 11 August 2025 / Revised: 22 September 2025 / Accepted: 23 September 2025 / Published: 27 September 2025
(This article belongs to the Section Meteorology)

Abstract

Low-level wind shear (LLWS) is a critical issue in aviation meteorology, posing serious risks to flight safety—especially at plateau airports with high elevation and complex terrain. This study investigates a convective wind shear event at Xining Airport on 29 May 2021. Multi-source observations—including the Doppler Wind Lidar (DWL), the Doppler weather radar (DWR), reanalysis datasets, and automated weather observation systems (AWOS)—were integrated to examine the event’s fine-scale structure and temporal evolution. High-resolution simulations were conducted using the Large Eddy Simulation (LES) framework within the Weather Research and Forecasting (WRF) model. Results indicate that the formation of this wind shear was jointly triggered by convective downdrafts and the gust front. A northwesterly flow with peak wind speeds of 18 m/s intruded eastward across the runway, generating multiple radial velocity couplets on the eastern side, closely associated with mesoscale convergence and divergence. A vertical shear layer developed around 700 m above ground level, and the critical wind shear during aircraft go-around was linked to two convergence zones east of the runway. The event lasted about 30 min, producing abrupt changes in wind direction and vertical velocity, potentially causing flight path deviation and landing offset. Analysis of horizontal, vertical, and glide-path wind fields reveals the spatiotemporal evolution of the wind shear and its impact on aviation safety. The WRF-LES accurately captured key features such as wind shifts, speed surges, and vertical disturbances, with strong agreement to observations. The integration of multi-source observations with WRF-LES improves the accuracy and timeliness of wind shear detection and warning, providing valuable scientific support for enhancing safety at plateau airports.

1. Introduction

Low-level wind shear (LLWS) remains a critical challenge in aviation meteorology, posing severe threats to flight safety due to its sudden onset, transient behavior, and underlying complexity. It is widely recognized as one of the most severe and frequent weather phenomena affecting low-altitude airspace [1]. According to the U.S. National Transportation Safety Board, LLWS constitutes the leading cause of hazardous low-altitude weather events impacting aircraft, accounting for approximately 52% of such incidents [2]. Western China, dominated by plateaus and mountainous terrain, presents particularly demanding meteorological environments. As of 2022, nearly half of the 268 civil transport airports in China were situated in the western regions, among which about 45% are classified as high-altitude airports—including plateau and extreme-altitude airports—based on data from the Civil Aviation Administration of China. The complex interplay of highly variable meteorological conditions and pronounced spatial heterogeneity in atmospheric thermodynamic fields near these airports frequently triggers severe LLWS, underscoring the urgent need for enhanced monitoring and forecasting capabilities [3].
At plateau airports, complex topography and unique meteorological processes lead to particularly intricate formation mechanisms of LLWS [4]. Convective wind shear, often associated with thunderstorm activity, characterized by abrupt onset and high intensity, represents one of the primary threats to aviation safety in these regions [5]. Statistical analyses, such as that by Zhao et al. [6] covering LLWS events at Xi’an Xianyang International Airport from 1992 to 2005, indicate that approximately 70% of events occurred between June and August and were closely linked to convective weather, with a discernible increasing annual trend. Similarly, a 2018–2022 statistical review of LLWS events at Xining Airport confirms that convective wind shear is the predominant type, especially during spring and early summer [7]. Studies have demonstrated that convective LLWS commonly arises from mesoscale convective cell activity. For instance, research at Hefei Airport has tied LLWS to turbulent flows at the base of such cells, typically developing under conditions of atmospheric instability and low-level convergence, often triggered by interactions between gust fronts and surface convergence lines [8]. Similarly, microburst analyses at Guangzhou Baiyun Airport further highlight the crucial role of intense convective cells in wind shear formation, manifested through rapid evolution of meteorological parameters and dynamic cell behavior [9]. Research at Longnan Airport further indicated that downdraft outflows under weak thunderstorm conditions are a dominant mechanism for severe shear [10]. Against this background, the event at Xining.
Within civil aviation, primary wind shear detection technologies include the Low-Level Wind Shear Alert System (LLWAS), Doppler weather radar (DWR), Doppler wind profiler radar, and Doppler Wind Lidar (DWL). While conventional DWR and profilers offer monitoring capabilities, their spatiotemporal resolution is often limited. DWL has emerged as a critical tool due to its high resolution, enabling more reliable wind shear detection. This is especially relevant in complex terrain, where multi-radar synthesis can significantly improve accuracy [11]. Li et al. [12] proposed a LiDAR-based regional divergence algorithm to determine wind shear intensity and location. Han et al. [13] employed high-resolution LiDAR to dissect gust front structures, including shear intensity and horizontal/vertical organization. Huang et al. [14] clarified the distinct formation mechanisms between tailwind shear and headwind shear, finding they are, respectively, dominated by momentum downward transport and cold front activity, and quantified the spatiotemporal evolution characteristics of both types. Zhang et al. [15] conducted a detailed dynamical analysis of microburst-induced LLWS at Xining Airport using LiDAR data, revealing fine-scale structures and kinematic processes. This work provides theoretical foundations for improving wind shear warning systems at plateau airports.
High-resolution numerical experiments, particularly using the Weather Research and Forecasting (WRF) model with Large Eddy Simulation (LES) capabilities, hold substantial promise for LLWS research. The WRF model provides both the mesoscale initial conditions and the framework needed for LES, enabling realistic simulations of atmospheric processes. Chen et al. [16] successfully applied WRF-LES to simulate a terrain-induced LLWS at Hong Kong International Airport, demonstrating strong consistency with observations and the potential for real-time warning systems. Dzebre et al. [17] compared several PBL schemes over the coastal region of Ghana and found that MYNN3 and ACM2 generally performed well, while YSU showed closer agreement with observations under high wind speed conditions, demonstrating stronger stability and applicability. Similarly, the study by Xing et al. [18] over the complex terrain of the Gaoligong Mountains indicated that YSU performed best in reproducing temperature simulations and diurnal variations in wind direction. Although MYNN3 had an advantage in minimizing wind direction errors, its overall consistency with observations was still inferior to that of YSU. Doubrawa et al. [19], through three sets of WRF-LESs using gray-zone planetary boundary layer schemes, found that the YSU and SH schemes showed little difference in long-term simulations, and that gray-zone parameterization yielded more accurate predictions of wind shear and related phenomena than LES, with its impact being more critical than increasing nested resolution. Li et al. [20] conducted wind field simulations at 1 km and hectometer scales in the Mentougou area using WRF-LES, revealing that the YSU scheme outperformed LES at the 1 km scale. Liu et al. [21] and Zhang et al. [22] implemented nested WRF-LES setups with resolutions as fine as 37 m over complex terrain, showing that high-resolution topography combined with LES improves local wind field accuracy, especially when refined land surface data and updated initial conditions are used.
Nonetheless, convective LLWS research—particularly focusing on plateau airports—remains limited. The formation and evolution mechanisms under high-altitude complex terrain are not fully understood. Although LiDAR offers high-resolution wind field detection and has advanced the study of gust fronts and microbursts, its application at plateau airports still faces challenges. Similarly, while WRF-LES has improved complex-terrain wind modeling, its performance in simulating LLWS at high-altitude airports requires further validation. The scarcity of continuous, high-resolution 3D wind observations in these regions hinders thorough evaluation of small-scale LES structures. Moreover, strong convective activity over plateaus often entails more intricate wind and thermodynamic patterns. In this context, detailed case studies of individual LLWS events hold significant scientific value. Unlike statistical analyses that mainly reveal occurrence frequency and climatological patterns, single-event studies can uncover the fine-scale dynamical and thermodynamical processes often hidden in long-term averages. By documenting the spatiotemporal evolution of a representative convective wind shear, such investigations not only enhance understanding of extreme events and support model evaluation, but also demonstrate the feasibility of applying high-resolution modeling approaches (e.g., 100 m grid simulations) in complex terrain. Such efforts provide informative model configurations and practical reference scenarios for operational warning systems, while encouraging further studies to adopt and refine similar methodologies. In light of these challenges, this paper examines a typical convective LLWS event at Xining Airport—a representative high-altitude airport with unique topographic and meteorological features—through the integrated use of DWL, DWR, reanalysis datasets, and automated weather observing systems (AWOS), combined with WRF-LES. Through synergistic analysis of multi-source observations and simulations, this study reveals the formation mechanisms and local responses of convective LLWS under complex plateau terrain, and evaluates the applicability and limitations of WRF-LES for high-altitude airport environments. It should be noted that while the study of LLWS mechanisms may involve analysis of related phenomena such as low-level jets (LLJs), the specific focus of this work is on the wind shear itself, not on the prediction of LLJs. This study, through synergistic analysis of multi-source observations and simulations, aims to reveal the formation mechanisms of convective LLWS under complex plateau terrain and investigate the applicability and feasibility of WRF-LES in high-altitude complex terrain.

2. Study Area and Data Collection

2.1. Introduction to Xining Airport

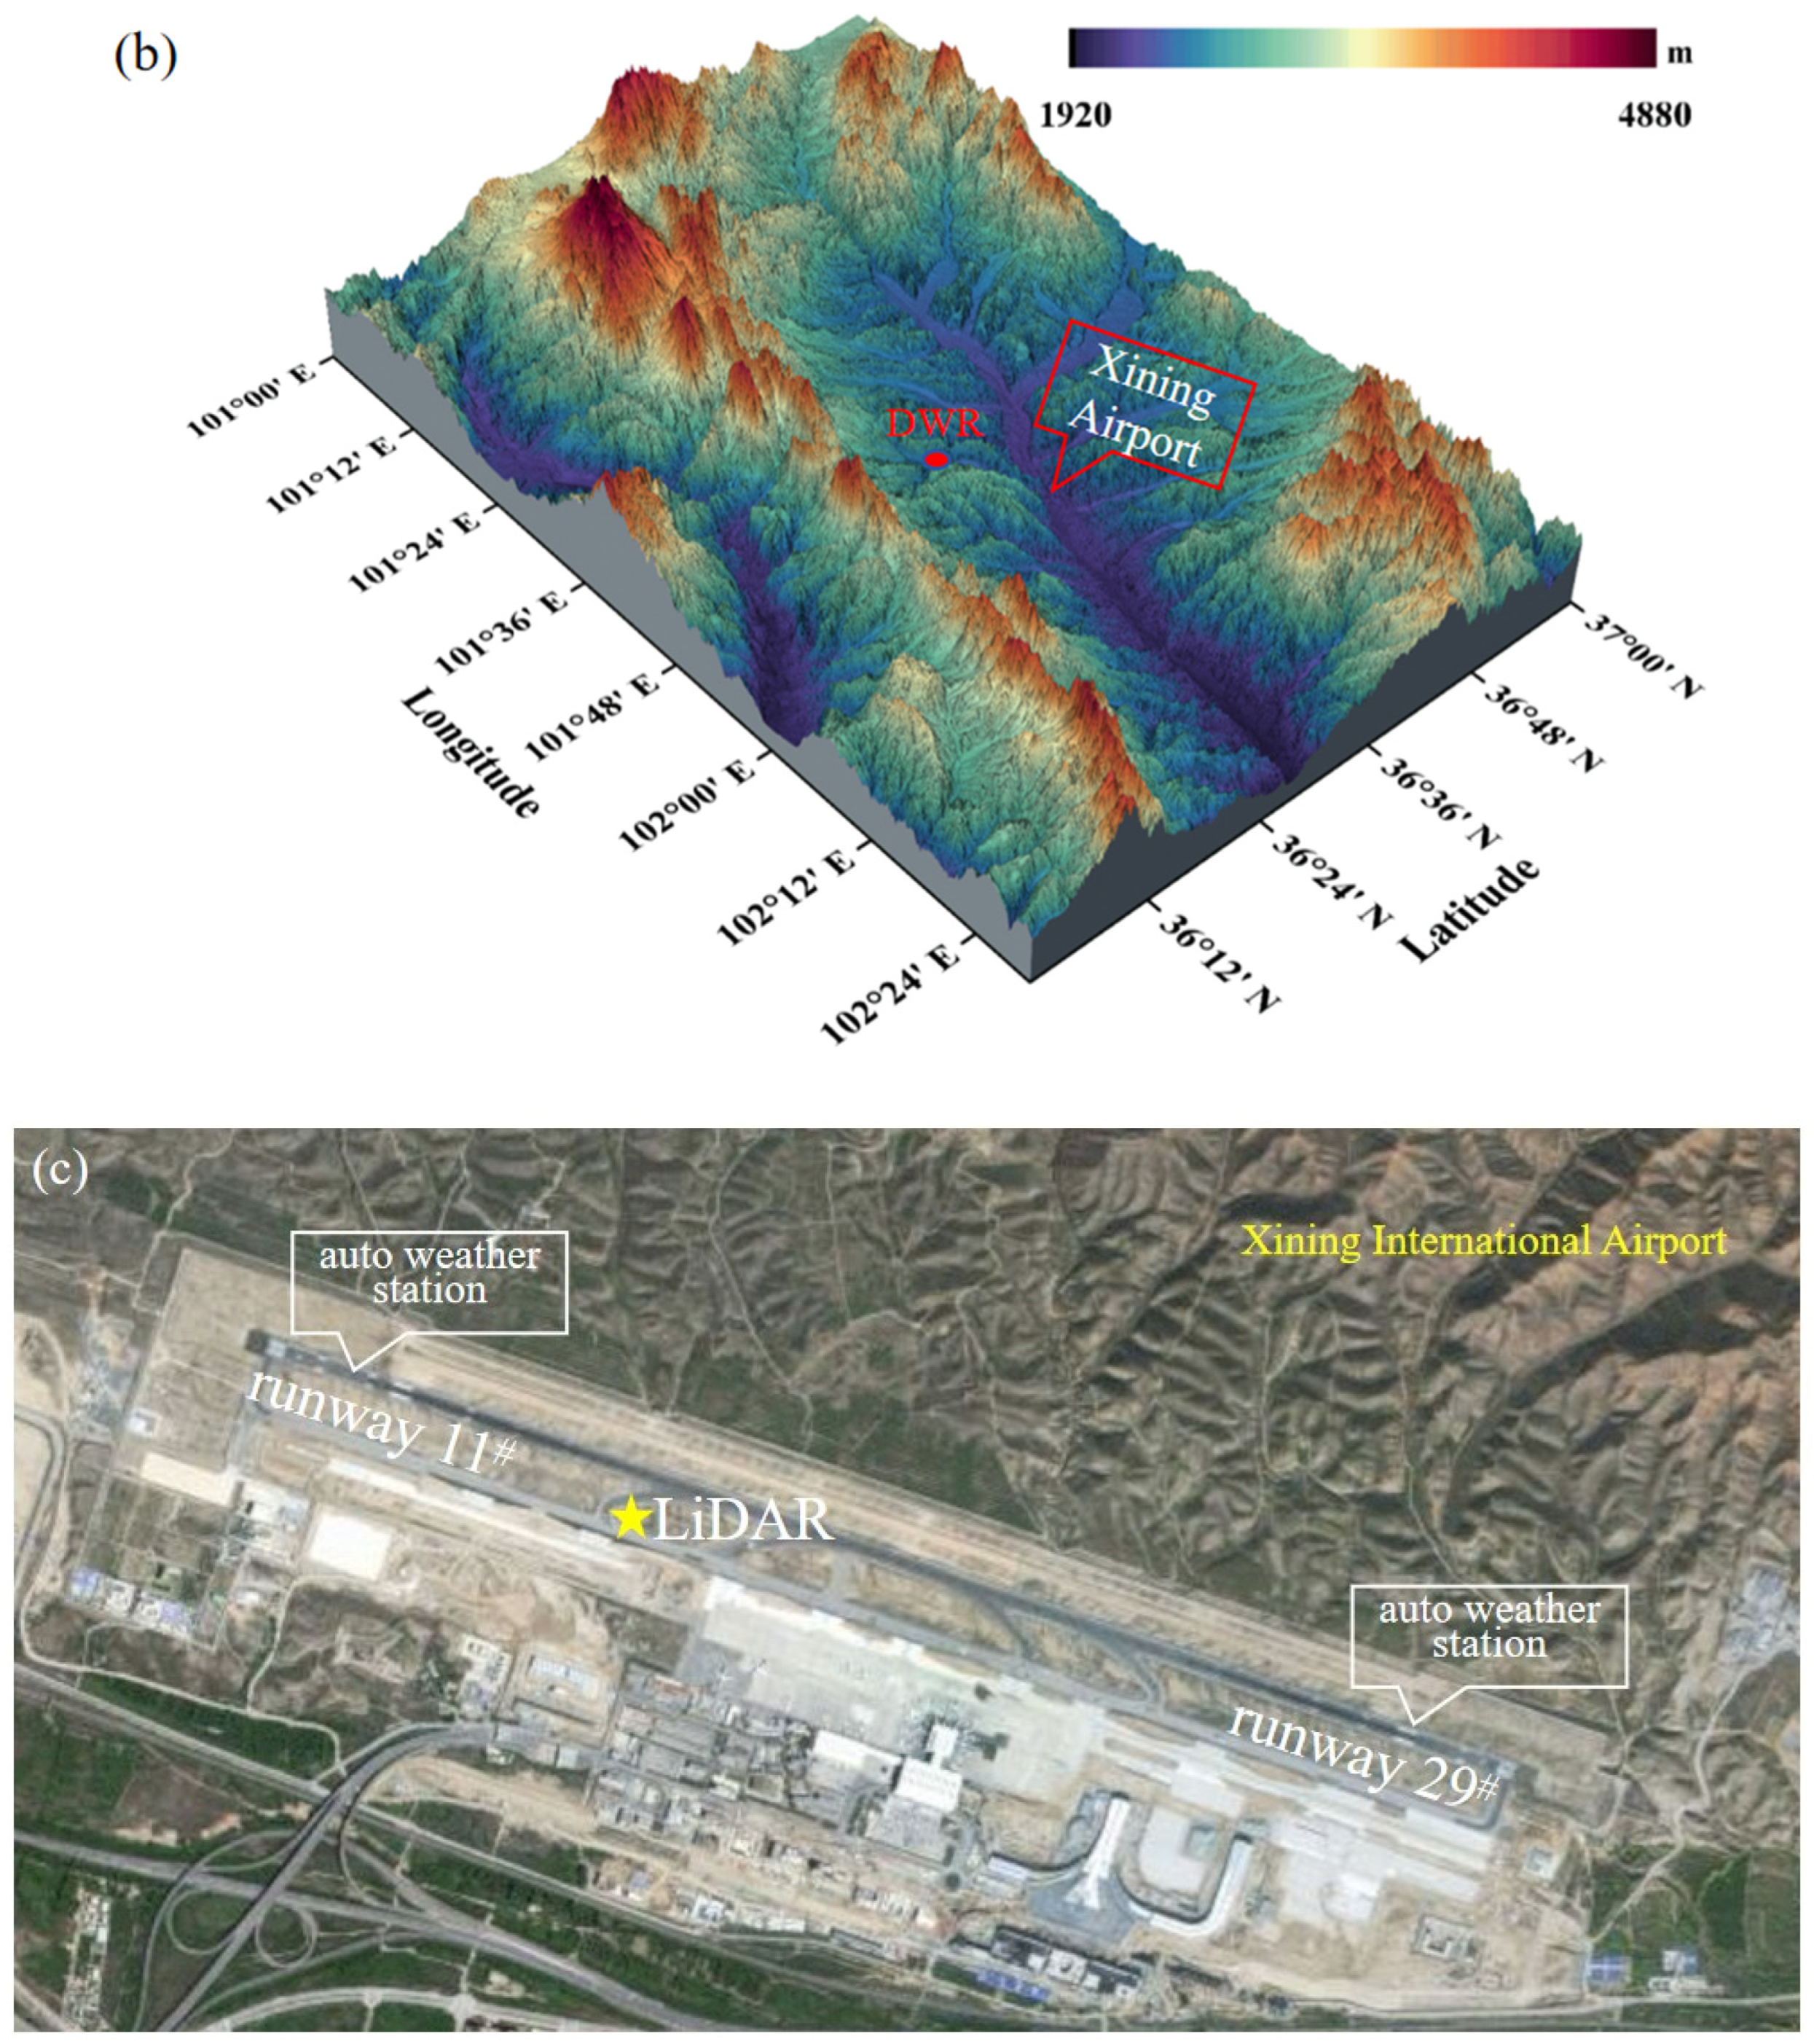
Xining Caojiapu International Airport (Figure 1, hereafter referred to as Xining Airport) is situated on a plateau at an elevation of 2184 m. The runway is 3800 m in length and 45 m in width, classifying it as a typical high-elevation plateau airport. As a 4E-class international civil airport, its runway is oriented in an east–west direction, serving as a critical transportation hub on the Qinghai–Tibet Plateau and the primary gateway for Qinghai Province. Xining Airport features a distinctive “canyon terrain,” which frequently gives rise to localized wind phenomena such as mountain-valley breezes, canyon wind effects, and turbulent flows. Being one of the busiest high-altitude airports in western China, Xining Airport experiences particularly severe issues with LLWS. The airport experiences a high frequency of LLWS events with diverse synoptic backgrounds and formation mechanisms. These include multiple influencing systems such as upper-level troughs, high-altitude jets, and plateau shear-line frontal systems, as well as various dynamic processes including momentum downward transport, vertical convection, and topographic forcing. Xining Airport is equipped with cutting-edge detection systems including dual-polarization DWR and 3D scanning DWL, providing robust technical support for LLWS research.

2.2. Instruments and Data Selection

As shown in Figure 1, the main runway (Runway 11 and 29) at Xining Airport is oriented at 111° and 291°, with AWOS installed at both ends. A LiDAR is deployed near the touchdown zone of Runway 11, complemented by a DWR operated by Qinghai Province in Xining City. These observation systems collectively provide comprehensive wind field characterization for both runway ends. The touchdown zones on both sides of the runway are officially designated as 11# and 29#. For clarity in this study, the touchdown zones on the western (11#) and eastern (29#) sides of the runway are designated as RWY-W and RWY-E, respectively, while the automated weather observing systems located on the western and eastern sides are identified as W#AWOS and E#AWOS correspondingly.
This study employs the following datasets:
(1) The European Centre ERA5 reanalysis dataset, with a spatial resolution of 0.25° × 0.25° and temporal resolution of 1 h, is primarily employed for analyzing synoptic-scale circulation fields. This dataset offers significant advantages including high data quality and strong consistency, representing a “synthetic” product that integrates surface station observations, satellite remote sensing, and numerical model simulations. It provides an “optimal” representation of atmospheric conditions, though certain limitations exist such as its finite resolution, which imposes constraints when studying mesoscale phenomena.
(2) Observation Data from Xining Airport: The dataset includes measurements from AWOS, DWR, and DWL. The AWOS consists of ground-based meteorological sensors and information transmission units that meet ICAO and WMO technical standards. It is typically installed near airport runways to provide real-time observation data for air traffic control and meteorological operations. In this study, two Vaisala MIDAS-IV AWOS units were installed near the touchdown point of the runway at Xining Airport. These systems automatically and continuously measure meteorological parameters including temperature, humidity, pressure, wind direction, and wind speed. The sampling interval is 30 s for wind direction and wind speed, and 1 min for the other variables. All data are transmitted and displayed in real time, providing continuous and reliable surface observations to support airport weather forecasting and operational safety.
The DWR operates in the C band (wavelength 5 cm, beamwidth 0.55°) and detects microbursts, gust fronts, and other low-level wind shear phenomena as well as severe weather such as tornadoes by acquiring radial velocity from the echoes of cloud and precipitation particles. With advantages of a narrow beam, fast scanning, and high resolution, it is usually deployed 10–20 km from the airport. The DWR can perform azimuth scans at a given elevation layer to obtain headwind, crosswind, and tailwind distributions along aircraft arrival and departure paths.
The FC-III DWL, developed by the Southwest Institute of Technical Physics, adopts a Doppler pulsed, all-fiber coherent system with a wavelength of 1.55 μm. It receives backscattered echoes from atmospheric aerosols and retrieves wind direction and speed using Doppler frequency shifts. It is capable of pitch scanning from 0° to 180° and azimuth scanning from 0° to 360°. Its operating mode is a hybrid scan, including Plan Position Indicator (PPI) scans at three elevation angles (3°, 4°, and 6°), two Range Height Indicator (RHI) scans along the runway azimuth, one Doppler Beam Swinging (DBS) scan, and two Glide Path (GP) scans. Each scanning cycle takes 12 min and can operate continuously in all weather conditions to obtain data such as radial velocity, horizontal and vertical wind direction and speed, spectral width, and signal-to-noise ratio. The main technical parameters of the FC-III DWL are shown in Table 1.

2.3. Model Configuration

This experiment is based on the WRF model (version 4.5) with four nested domains. The physical parameterization schemes and grid configurations used in the simulation are summarized in Table 2. According to Zhou’s findings [23], the choice of planetary boundary layer (PBL) scheme depends on the relationship between model grid resolution and the energy-containing turbulence eddy scale. When the grid spacing is significantly larger than the energy-containing eddy scale, all turbulence processes must be represented through parameterization; when the grid resolution is sufficient to resolve the primary turbulent eddies, the Large Eddy Simulation (LES) approach can be applied to directly compute them. In this study, different turbulence treatments were applied to different nested domains: d01 and d02 (with grid spacings of 7500 m and 1500 m, respectively) used the YSU PBL scheme [24]; d04 (100 m high resolution) adopted the LES approach with a TKE-based subgrid closure scheme. Specifically, for the “gray zone” intermediate-resolution domains, d02 (1500 m) retained the same parameterization scheme as d01, whereas d03 (300 m) adopted the same LES method as d04. This hierarchical treatment strategy effectively balances the simulation requirements for turbulence processes across different spatial scales.

3. Synoptic Situation and Observations

According to pilot reports from Xining Airport, at approximately 17:46 on 29 May 2021 (herein, Beijing Standard Time, BJT), Sichuan Airlines Flight 8902 triggered an onboard wind shear warning while on the Instrument Landing System approach to Runway 29, at about 2.4 km altitude (approximately 3 nautical miles from touchdown). This event ultimately resulted in a go-around maneuver.

3.1. Synoptic Background Analysis

To understand the synoptic conditions associated with this LLWS event, we analyzed the weather patterns on 29 May 2021 using ERA5 reanalysis data. At 17:00 BJT, the 200 hPa analysis (Figure 2a) shows the westerly jet stream dominated over Xining Airport and adjacent areas, with upper-level divergence observed above the airport, generating a configuration conducive to unstable energy accumulation in the region. At 500 hPa, a “two-trough-one-ridge” circulation pattern prevailed across mid-high latitudes of Eurasia. As the troughs propagated eastward, the westerly flow intensified them, eventually forming closed low centers. Vertical motion analysis at this level (Figure 2b) showed ascending air over Xining Airport at 17:00 BJT, providing dynamic forcing for moisture uplift and cloud/precipitation formation, which peaked around 18:00 BJT. With nearly parallel isotherms and flow direction, temperature advection was negligible, making vertical motion the dominant mechanism. At the 700 hPa level (Figure 2c), the θe over Qinghai Lake was notably higher than at Xining Airport at 17:00 BJT, indicating the presence of relatively warm and moist air. The westerly flow transported this warm, moisture-rich airmass toward Xining Airport, providing favorable moisture conditions for convective development. The θe at Xining Airport reached ≥320 K and peaked around 18:00 BJT, establishing optimal thermodynamic conditions for convective weather formation. Surface analysis (Figure 2d) showed significant CAPE was present both west and northwest of Xining Airport, with particularly strong instability to the west where CAPE reached approximately 700 J/kg. The westerly and northwesterly flows transported the unstable airmass into the vicinity of the airport, establishing favorable conditions for convective weather development. Based on the above analysis, the upper-level trough and divergence field at 200 hPa provided dynamic forcing for low-level air lifting. Combined with the ascending motion at 500 hPa, the warm-moist air transport at 700 hPa, and the surface-based unstable energy, these factors collectively established a favorable environment for convective weather development at Xining Airport.

3.2. Observation Analysis

Convective weather caused drastic changes in the meteorological elements around the runway. According to the records from the Xining Airport Meteorological Station, Figure 3 shows the time series variations of the QNH and temperature observed by the AWOS at site #11, as well as horizontal wind speeds observed at sites #11 and #29, during 17:20–18:20. Figure 3a indicates that starting at 17:20, under the influence of convective weather, the QNH rose steadily from 1016 hPa to about 1018 hPa, while the temperature gradually dropped from 25 °C to 21.5 °C. From 17:50 onward, the QNH began to fall and the temperature to rise, and after 18:10, the changes in both variables slowed, suggesting the gradual weakening of the convective process. Figure 3b,c show that at the W# AWOS, wind speed rose rapidly from 3 m/s to 10 m/s (an increase of 7 m/s) between 17:20 and 17:38, dropped to 6 m/s at 17:40, then surged again to 11 m/s between 17:48 and 17:53; before and after the go-around, the wind speed varied by about 5 m/s. At the E# AWOS, wind speed rose from 3 m/s to 9 m/s (an increase of 6 m/s) before the go-around, dropped abruptly to 3 m/s during the go-around, and then sharply increased to 10 m/s (an increase of 7 m/s) at 17:54. Initially, the environmental wind direction over the runway was northerly. Subsequently, the AWOS at both runway ends rotated counterclockwise, pointing to the north and northwest, respectively, and by 18:20, the wind direction had rotated nearly 180°. In summary, during 17:20–18:20, cold downdrafts triggered a marked temperature drop and a sharp QNH rise, and induced multiple episodes of rapid wind speed changes and large wind direction rotations near the runway, forming a typical wind shear process that posed a significant threat to flight safety.

3.3. Analysis of Radar Echoes

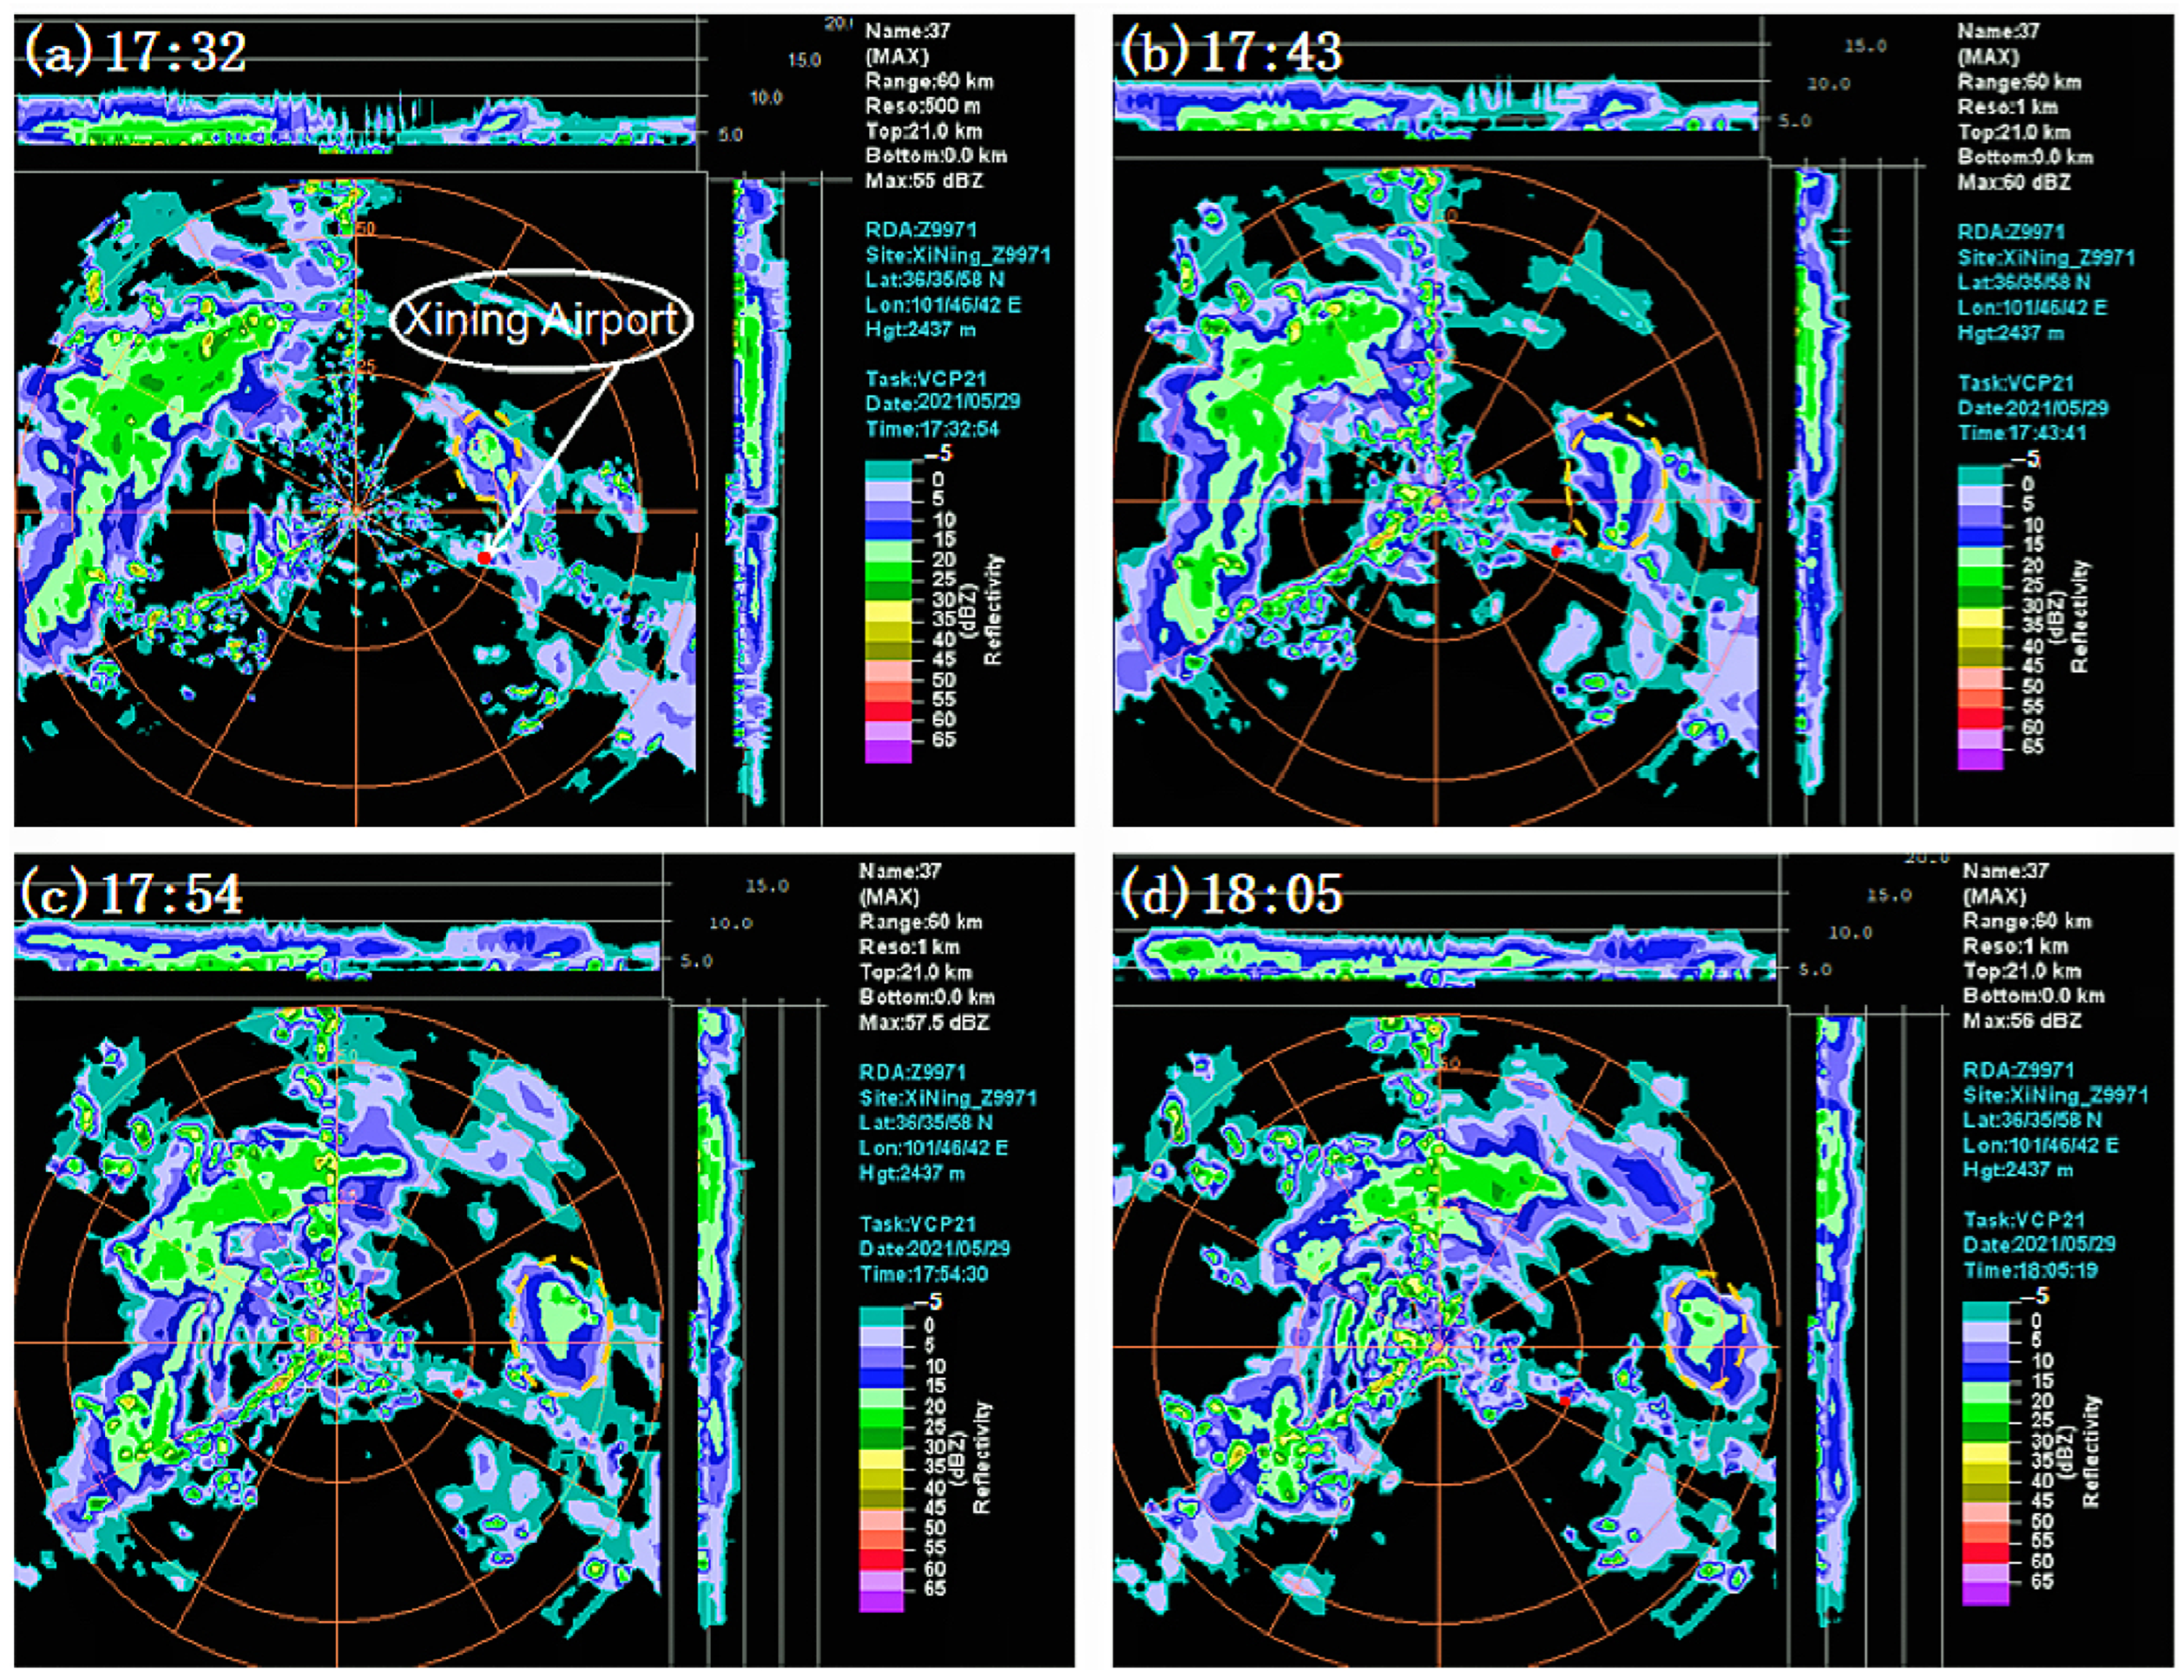
Radar echoes indicated that on the afternoon of 29 May 2021, mesoscale and small-scale convective cells developed near Xining Airport, moving from northwest to southeast. At 17:32, a cell formed about 25 km north of the airport (Figure 4a), with echo intensity of 20–25 dBZ and a top height of approximately 7 km. By 17:43, it had developed to the northeast of the airport (Figure 4b), expanding to 18 km × 20 km in size, with intensity increasing to 20–30 dBZ and top height reaching about 10 km. A localized strong core (25–30 dBZ) to the south approached the airport, corresponding to the occurrence of marked wind shear on Runway 29. At 17:54, the cell began to move away and weaken (Figure 4c), with the top height decreasing to 6 km; by 18:05, it had moved to a point 25 km northeast of the airport (Figure 4d), with the top height reduced to 5 km and the area continuing to shrink. In combination with Figure 3, between 17:55 and 18:00, the surface wind speed on the runway surged from 3 m/s to 10 m/s, likely due to downdrafts within the convective cell transporting high-level momentum downward. These results indicate that during its formation, development, and dissipation, this mesoscale convective system significantly altered the intensity, scale, and structure of the radar echoes and, when approaching the airport, triggered wind shear, exerting a critical influence on the near-surface wind field.

4. Analysis of the Structure and Evolution Characteristics of Wind Shear

4.1. Analysis of the Evolution Characteristics of the Horizontal Wind Field

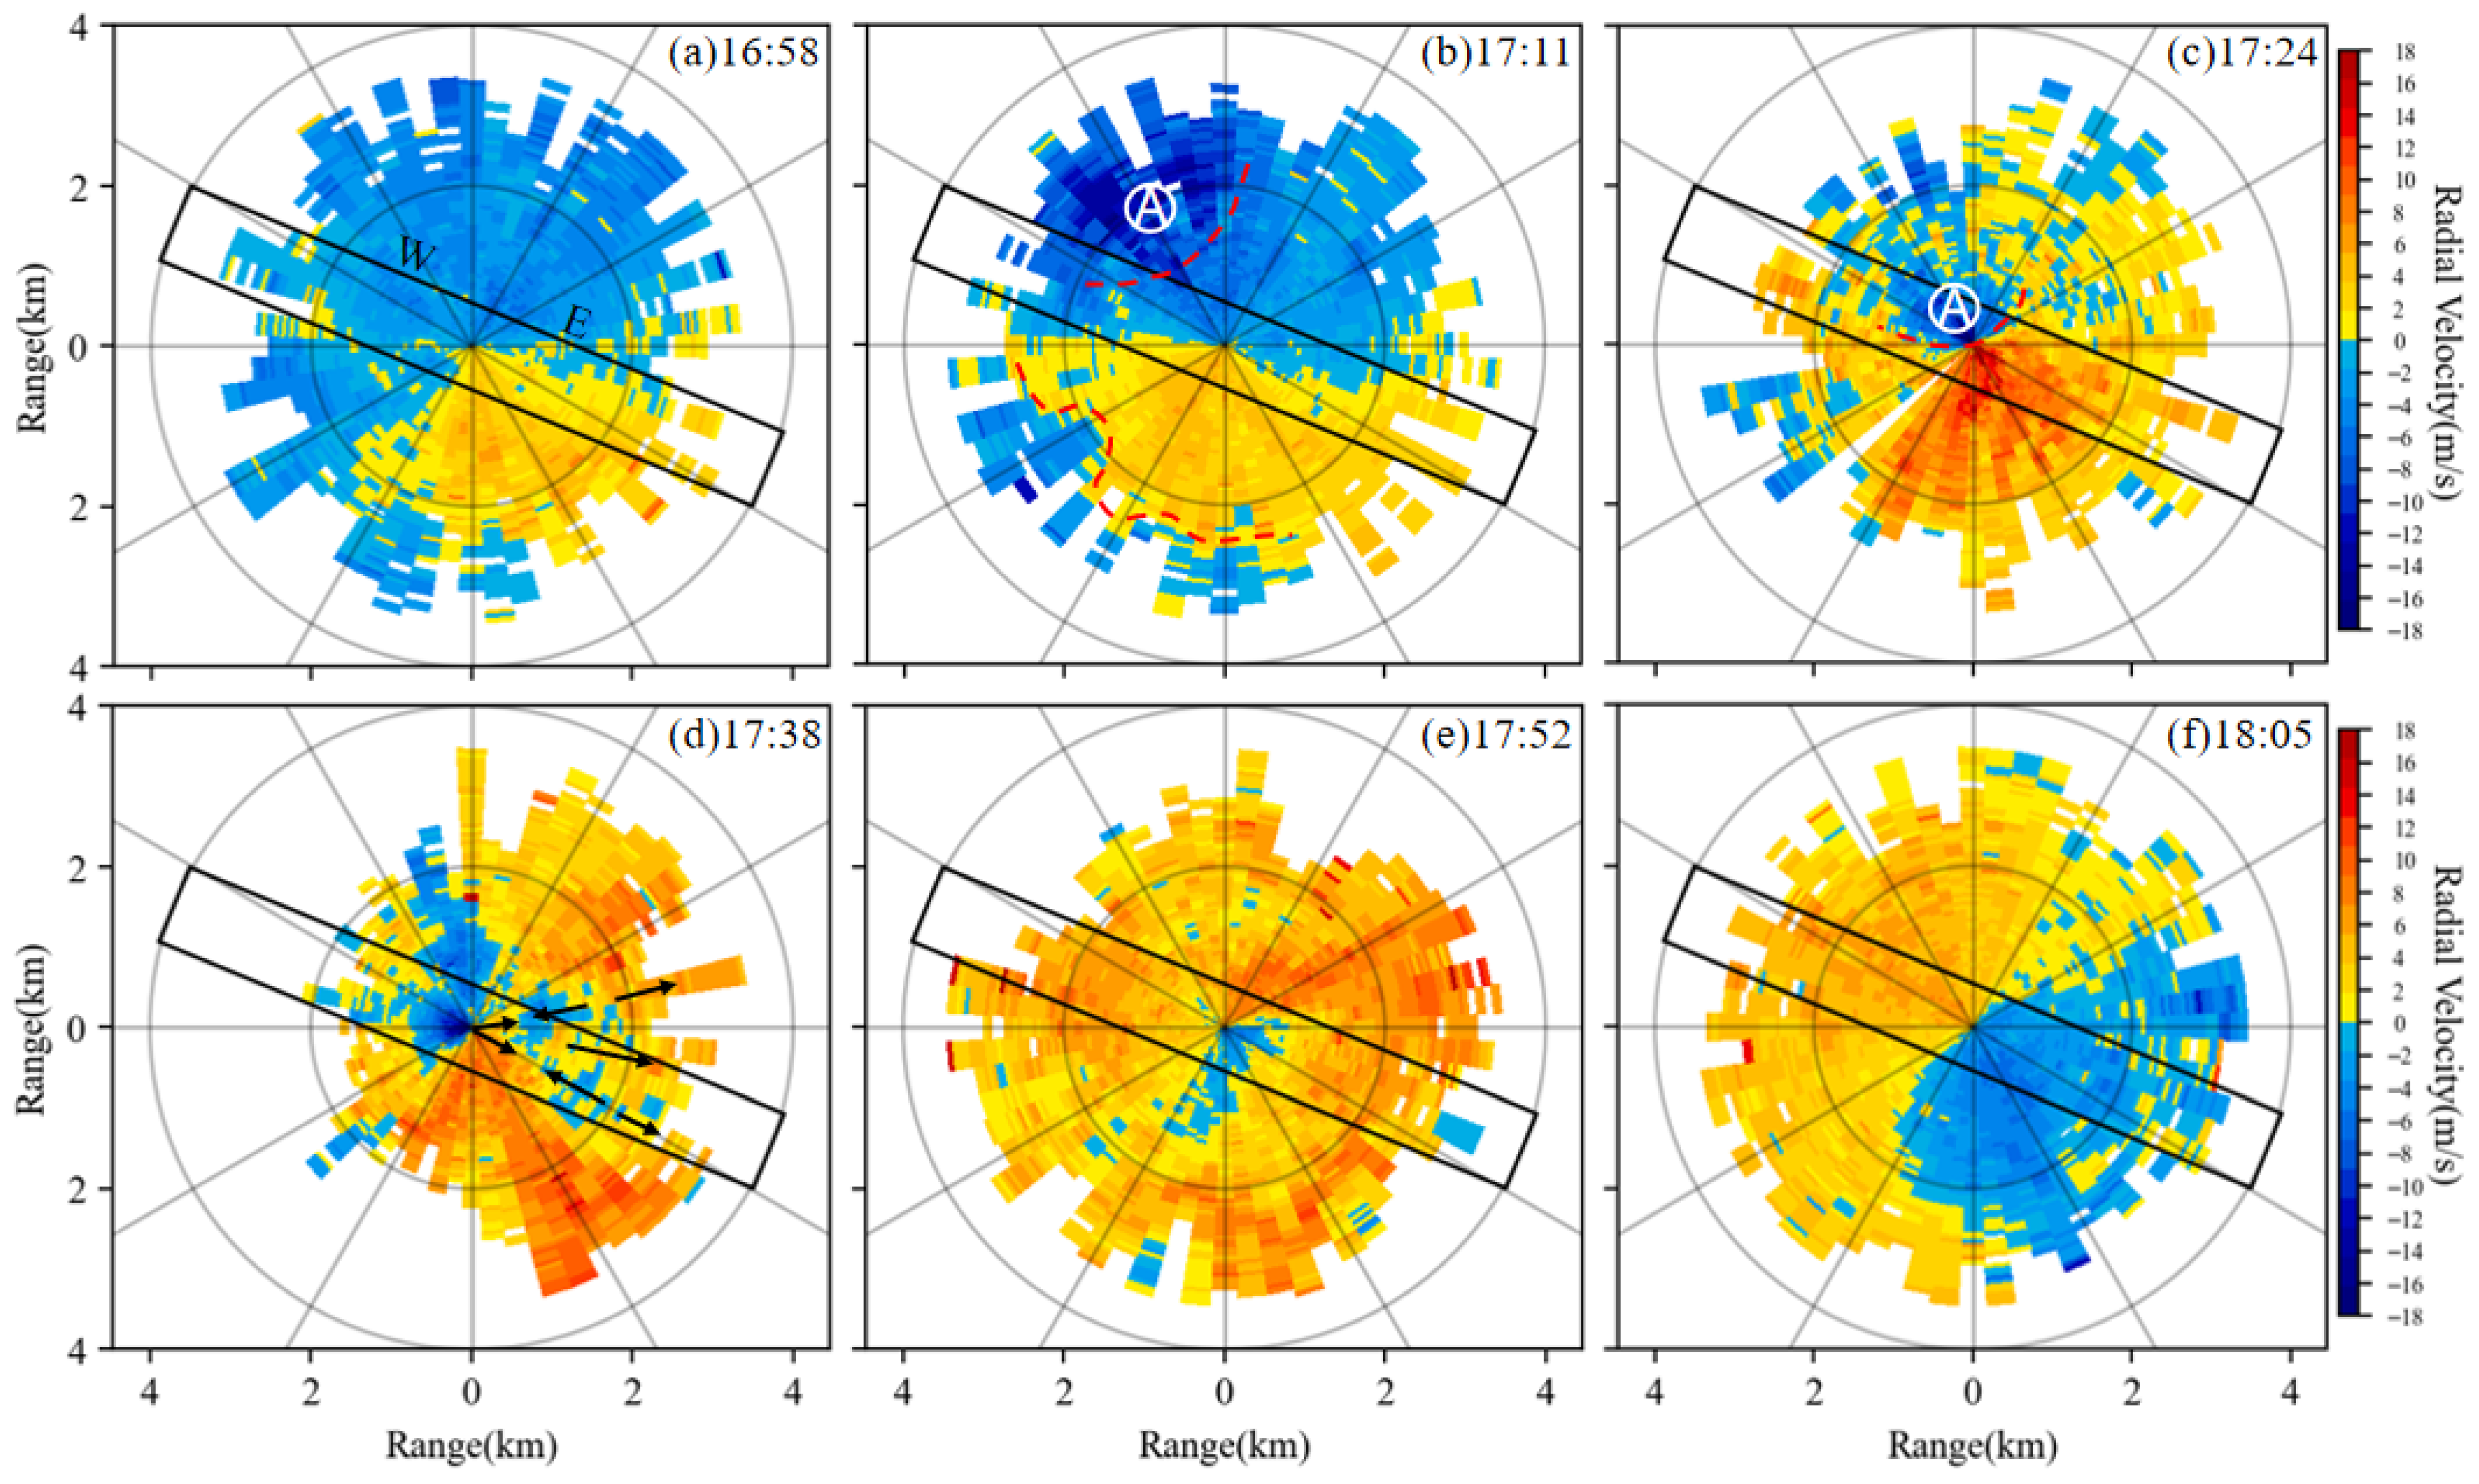
To investigate the horizontal characteristics of the convective weather and associated wind field, Figure 5 presents DWL radial velocity PPI scans at 10 min intervals from 16:58 to 18:05. The quality control in this study was based on the signal-to-noise ratio, with data marked as missing when SNR < 10 dB. Missing values, which may result from insufficient aerosols, attenuation by clouds or precipitation, or beam path obstructions, were filled using nearest-neighbor interpolation. In the shaded areas of the plots, negative values indicate radial velocities toward the LiDAR, while positive values indicate the opposite. Before the convection (Figure 5a), the runway was under the control of a uniform northwesterly flow of 0–4 m/s. At 17:11 (Figure 5b), the downdraft of convective cell “A” and the leading edge of the gust front intruded into the western glide path of the runway, with a northerly wind maximum reaching 16 m/s, forming significant wind shear on the west side and converging with the outflow from the southwest. At 17:24 (Figure 5c), the downdraft shifted to the center of the runway, the area of maximum radial wind speed shrank but its intensity increased to 18 m/s, and the wind speed in the surface layer exceeded that in the upper layer. Scattered convergence and divergence zones appeared on the northeast side. At 17:38 (Figure 5d), the cell split, the maximum wind speed zone weakened, and the convergence/divergence zones moved to the east side of the runway, forming a “negative-positive-negative” radial velocity pattern. Near the time of the go-around, an abrupt change in wind speed occurred on the east side, preliminarily attributed to mesoscale convergence/divergence. At 17:52 (Figure 5e), the system entered its dissipation stage, with the runway affected by a weak “positive–negative–positive” radial velocity field and disturbances from a southeasterly wind, while the wind direction shifted from north to southwest. By 18:05 (Figure 5f), the system had completely dissipated, and the background wind shifted from northerly to southeasterly. Throughout the process, the intrusion of cold downdrafts and gust fronts was the primary trigger mechanism for wind shear, while local convergence/divergence enhanced the heterogeneity of the wind field. During the most active stage of the convective cell, wind speed differences between both sides of the runway were significant and the structures complex, forming a typical LLWS. Once the system decayed, the wind shear quickly disappeared and no longer posed a threat to flight safety.

4.2. Analysis of the Evolution Characteristics of the Vertical Wind Field

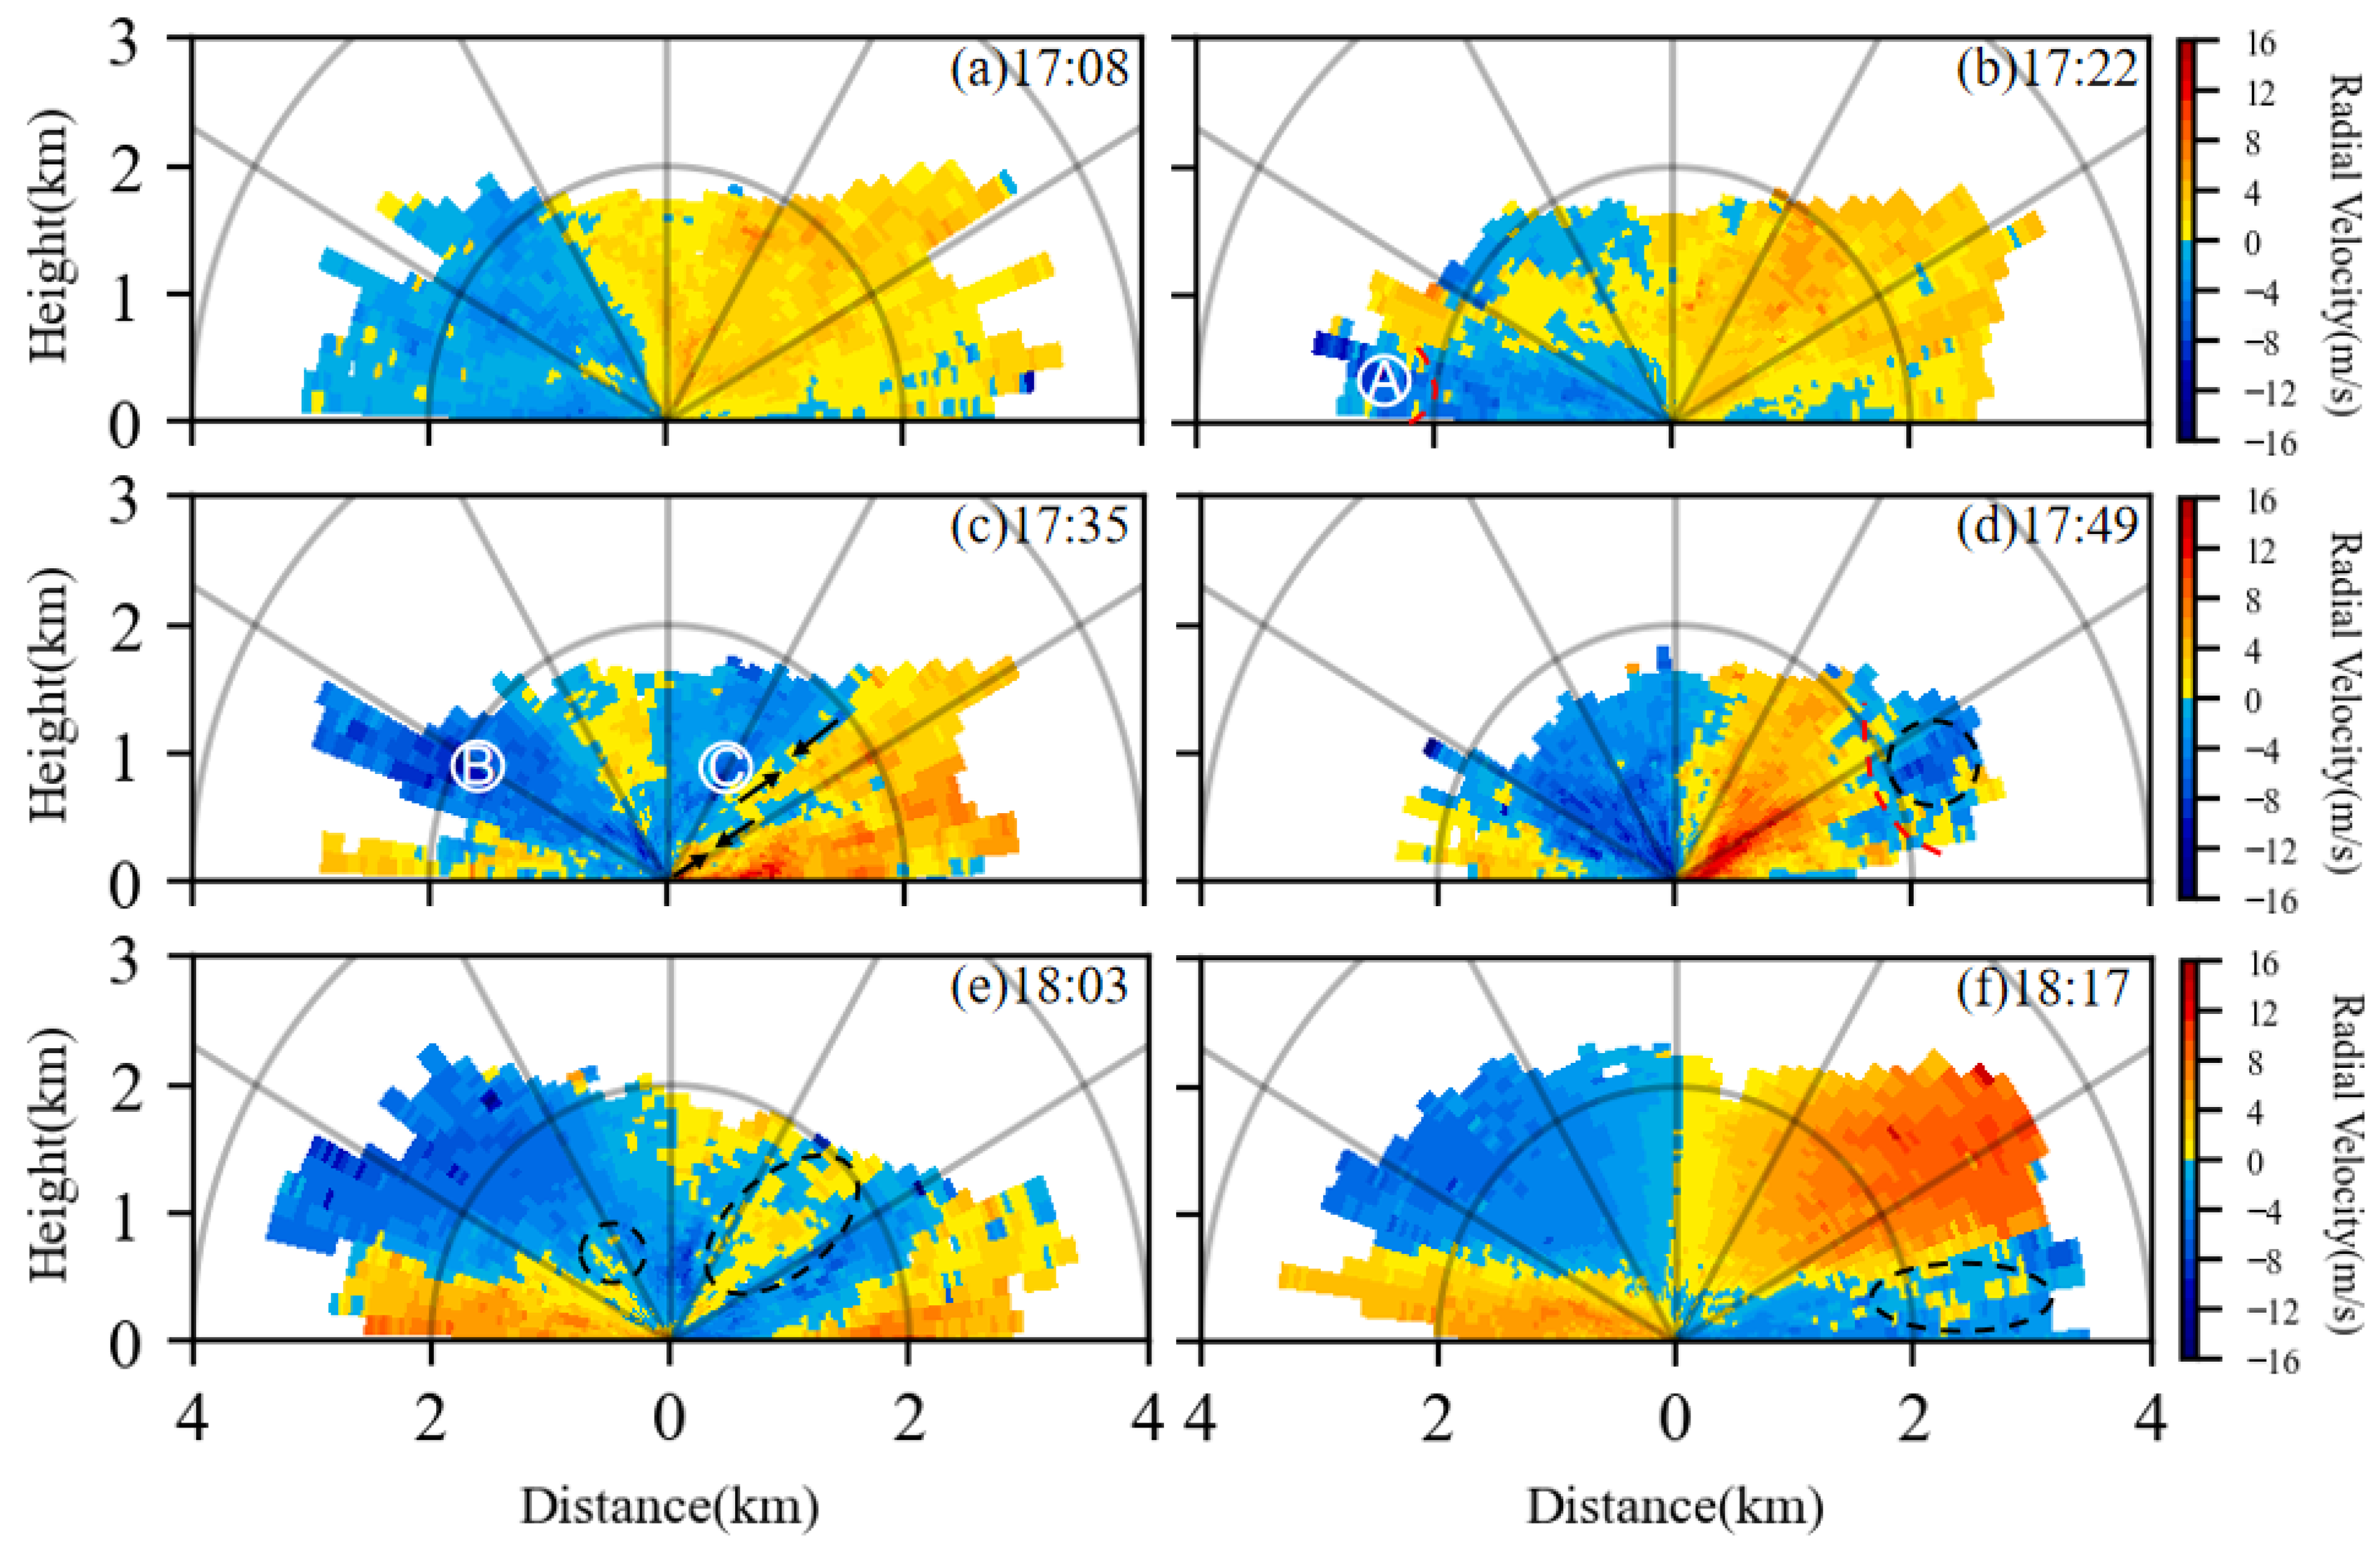
In this section, DWL’s RHI mode measurements are analyzed to investigate the vertical structure of the convective weather and the evolution of the associated wind field. Figure 6 presents six consecutive RHI observations over the runway from 17:08 to 18:17. At 17:08 (Figure 6a), before cell “A” intruded into the runway, the radial wind speed distribution was uniform, with weak outflow from a convective cell located west of the runway. At 17:22 (Figure 6b), the outflow from cell “A” descended and spread to the near-surface layer, with a maximum radial wind speed of about 10 m/s, and a divergence layer appeared at an altitude of 700 m. At 17:35 (Figure 6c), under the influence of the divergence layer, “A” split into cells “B” and “C” separated by about 1 km. “B” located west of the runway, reached a radial wind speed of 12 m/s and formed a shear layer, while its leading edge, with 8 m/s strong winds at the surface, enhanced the wind speed on the east side. “C” interacted with the initial background wind field on the east side, generating turbulence and shear zones. At 17:49 (Figure 6d), the downdraft strong wind zone of “B” reached the ground and passed over the LiDAR site. Low-level wind speeds on both the east and west sides reached 12 m/s, with a maximum northeasterly wind of 8 m/s at about 1 km altitude on the east side. Another convergence zone formed at 2 km altitude, coinciding with the aircraft wind shear alert time. At 18:03 (Figure 6e), the system weakened, wind speeds decreased, and the easterly extension of the northeast flow blocked the eastward movement of the system. Low-level convergence and turbulence zones still existed. At 18:17 (Figure 6f), the outflow dissipated, with easterly winds in the lower layer and westerly winds aloft, though a divergence and turbulence zone below 600 m persisted on the eastern glide path. During this process, interactions between the downdraft and divergence layer caused the splitting of the convective cell structure, forming multiple shear and turbulence zones. In particular, the simultaneous appearance of dual convergence zones at 17:49 was the main cause of the go-around. Although the convective system weakened significantly after 18:03, the residual low-level divergence and turbulence could still pose safety threats to subsequent flights.

4.3. Characteristics of the Vertical Wind Field of the Convective System

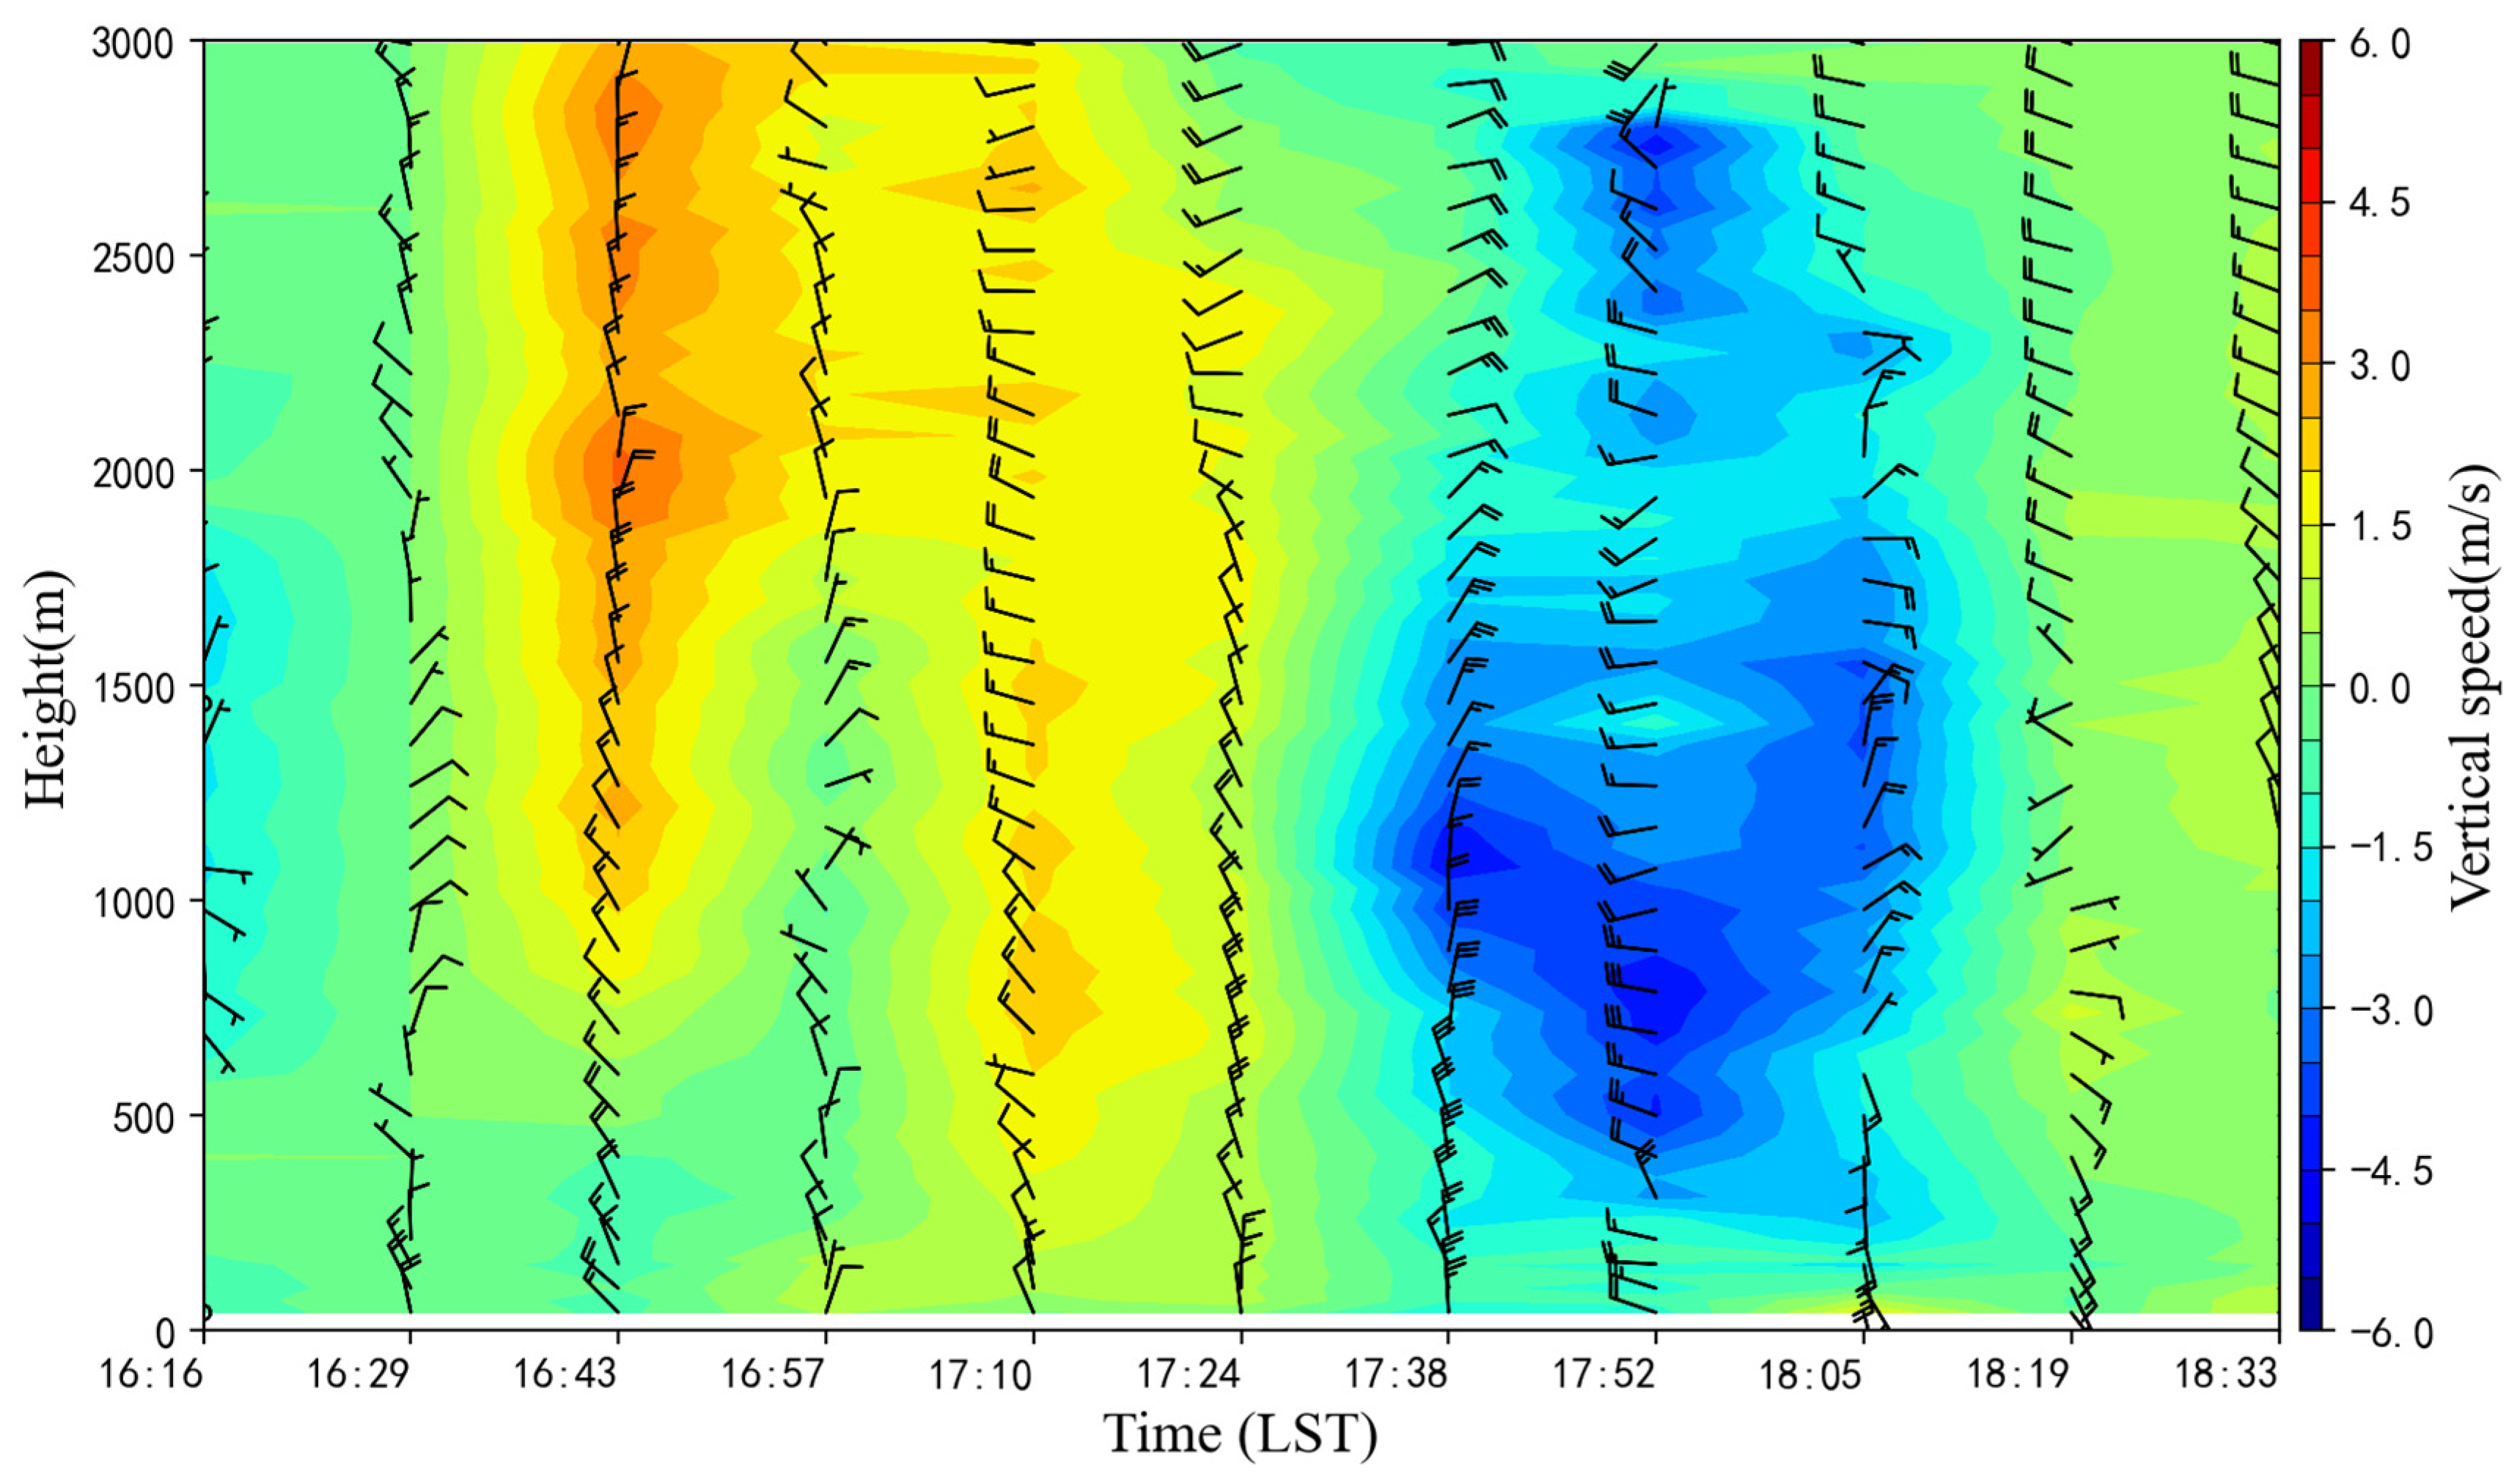
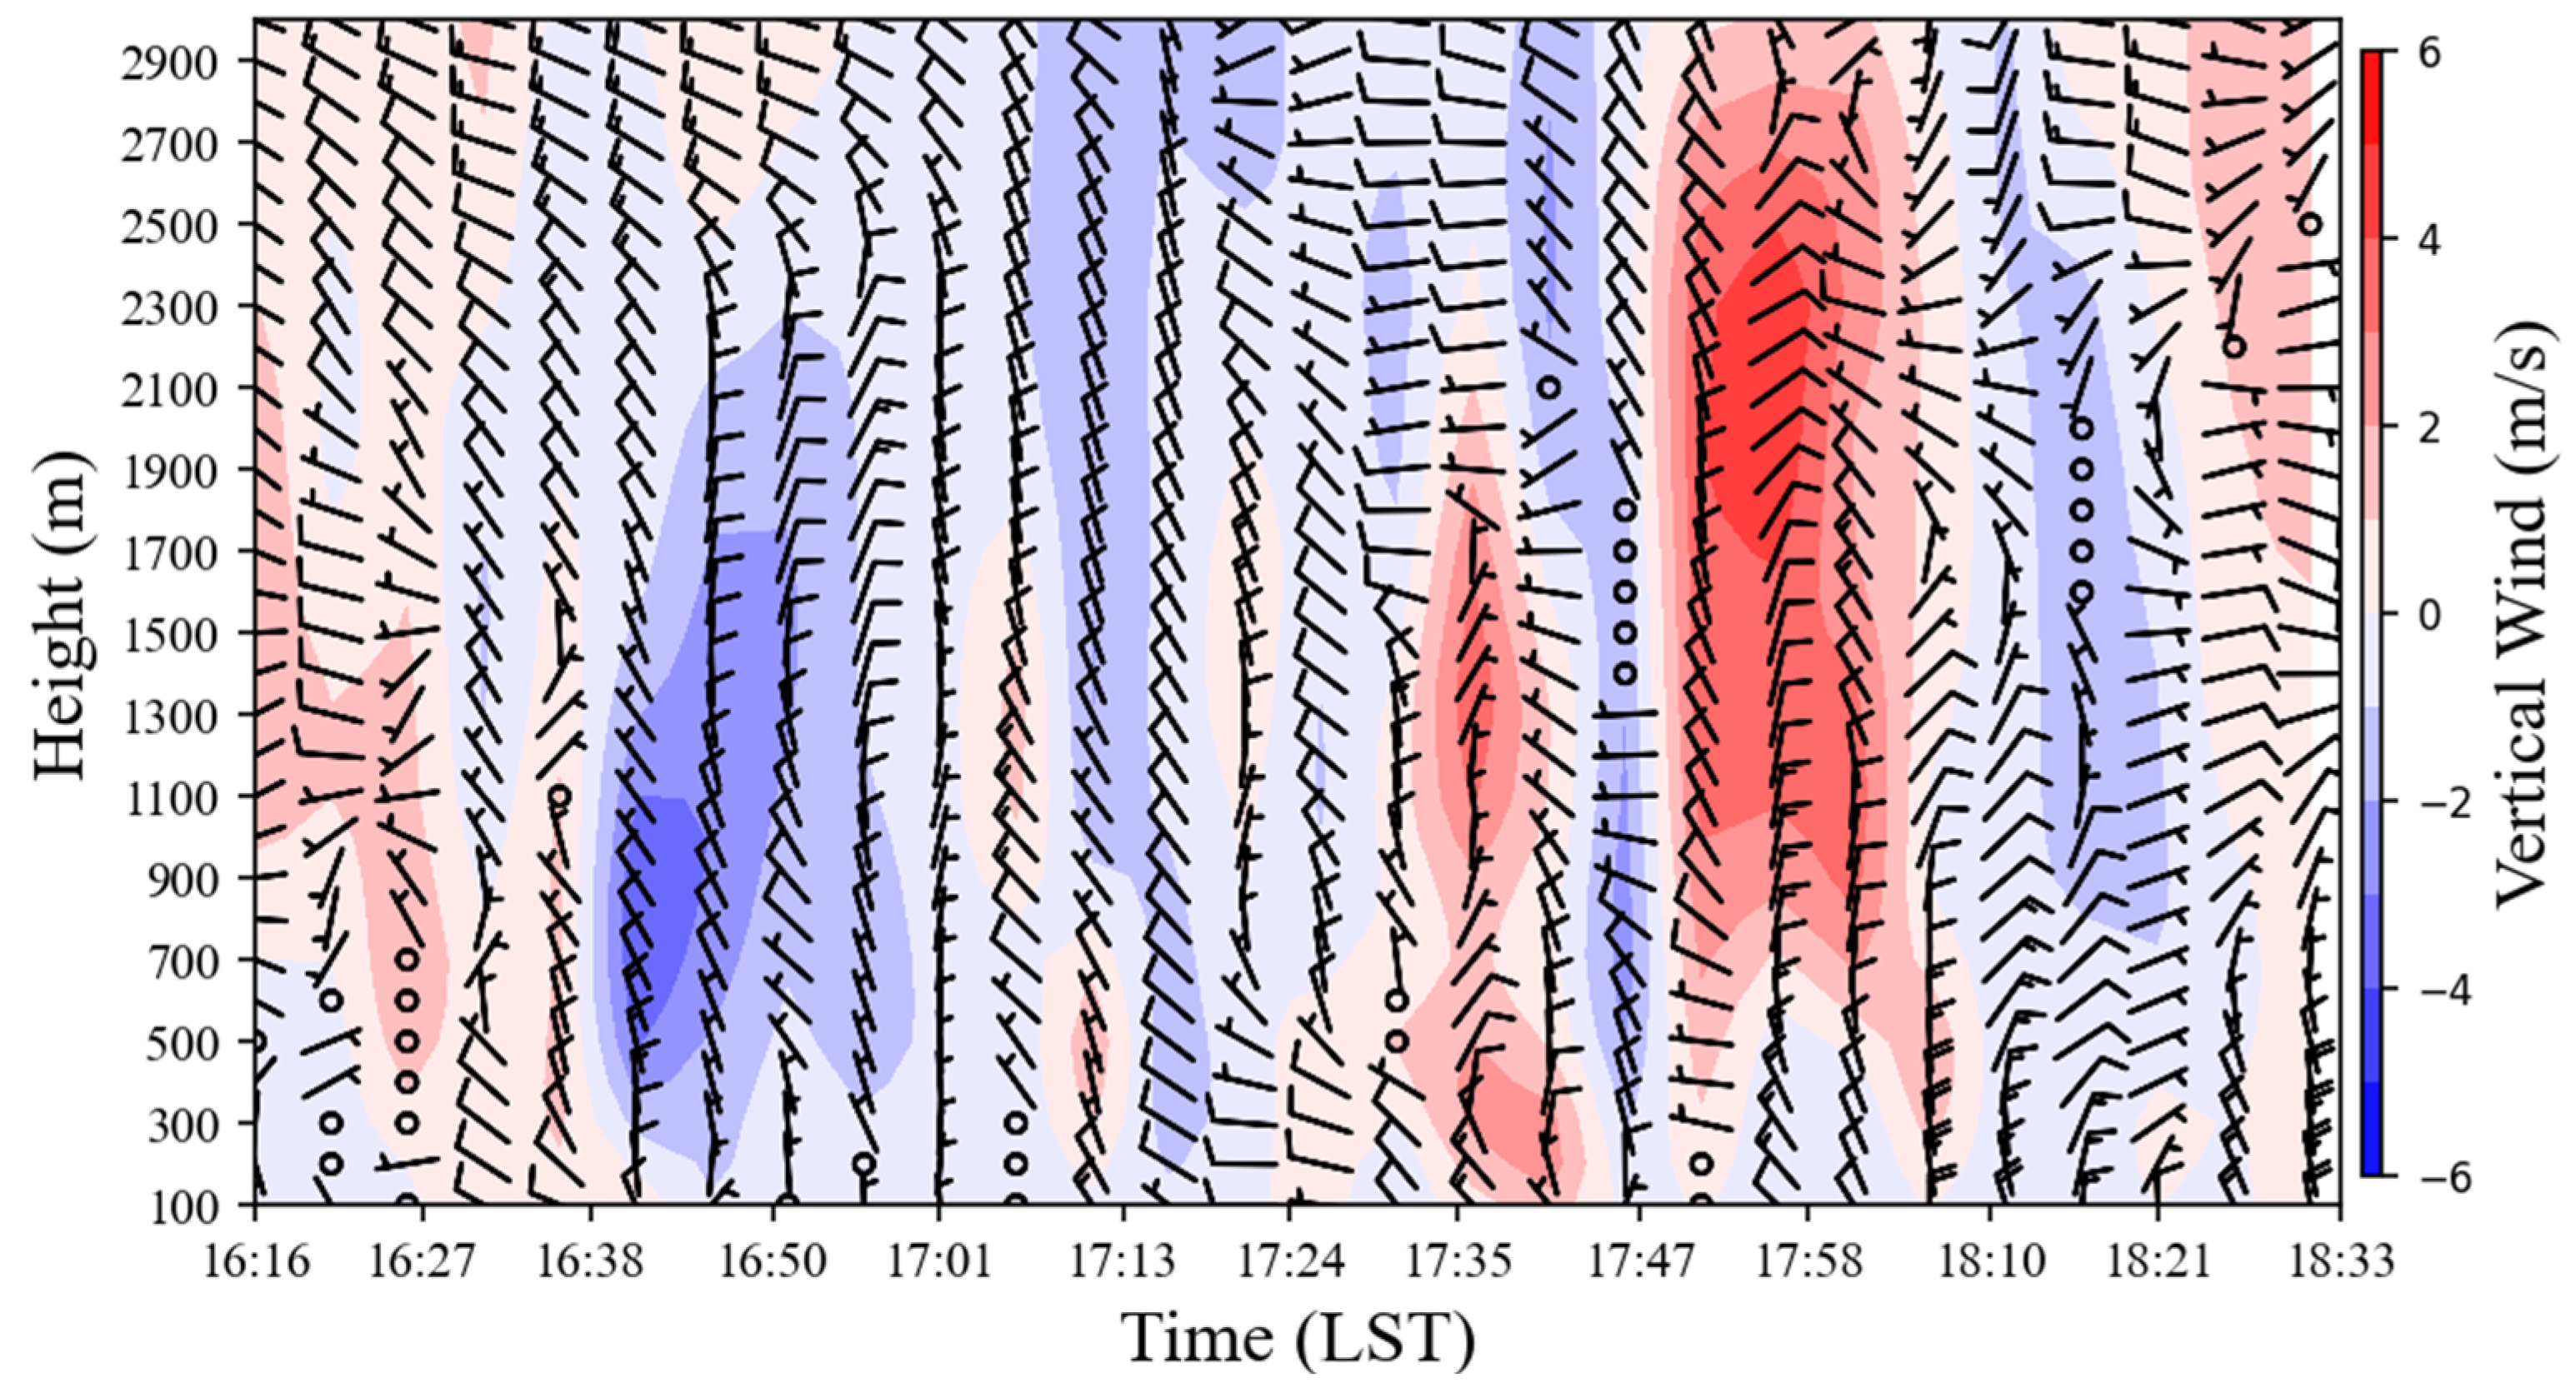
Figure 7 shows the evolution process of the wind field in the altitude range of 0–3 km measured by the DBS mode of the DWL during the period from 16:29 to 18:33 BJT, which can be generally divided into three stages. In the initial stage (before 16:57 BJT), the ambient wind field was mainly composed of a northerly wind with a speed of 2–5 m/s, and the vertical movement was mainly updrafts. During the convective influence stage (from 17:10 to 18:05 BJT), accompanied by the intrusion of the outflow from the convective cell “A”, the horizontal wind field at the airport changed significantly. During the period from 17:10 to 17:24 BJT, the northerly wind turned into a westerly wind and a northwesterly wind, and the wind speed increased by 2–4 m/s. The wind speed near the ground reached 10 m/s at 17:24 BJT. After 17:38 BJT, a systematic reversal occurred in the wind field. The wind above 2 km turned into an easterly wind, and the wind below 2 km turned into a northeasterly wind. The northerly wind below 1 km strengthened to 12 m/s. Within 15 min, the wind direction throughout the layer reversed by 180°, and a strong southwesterly wind (10–16 m/s) above 2.8 km was formed. The vertical movement also changed synchronously. Before 17:38 BJT, the updraft was dominant, and after that, the downdraft took the lead. Large-value centers of vertical velocity of −4 m/s appeared at the altitudes of 1 km and 2.8 km, respectively. It is worth noting that during the aircraft’s go-around period (from 17:38 to 17:52 BJT), the wind field showed violent shear, and the reversal of the horizontal wind direction occurred simultaneously with the transformation of the vertical movement. In the dissipation stage (after 18:05 BJT), the downdraft weakened to below 2 m/s. The wind direction at an altitude of 2.3 km rotated counterclockwise to become an easterly wind, and the lower layer turned into a weak westerly wind with a speed of 4–6 m/s. The wind field structure below 2 km indicates that the weak cold advection dominated the downward movement. After 18:19 BJT, the wind field between 1 km and 3 km tended to be stable, maintaining a uniform westerly wind. In conclusion, the wind shear process affected the airport for approximately half an hour. This process clearly reflected the evolution of the wind field caused by the passage of the convective cell, especially the sudden increase in the wind speed at the lower layer, the abrupt change in the systematic wind direction, and the strong downdraft resulting from the outflow boundary. Among them, the strong wind shear during the go-around stage had a significant impact on aviation safety.

4.4. Analysis of the Wind Field Characteristics from the Perspective of the Glide Path

The aircraft needs to land along the preset track. Given the suddenness and randomness of wind shear, for the glide path area of the currently used runway, the glide path mode is adopted to detect the radial velocity profiles within the effective range, so as to obtain the wind shear information at different positions in the key area for aircraft landing. The radial data indicate the wind speed distribution and changes in this area. Since the DWL adopts a multi-mode combined scanning strategy, only the glide path mode data at four time points during the influence of the convective weather process can be used as a reference. Therefore, this section divides them into four time groups. According to the records of the AWOS, before 18:06 BJT, the surface wind on 29# was mainly northerly, as shown in Figure 3. Therefore, in this section, it is assumed that the aircraft is in the direction of 29# in accordance with the regulations for landing against the wind, and the flight trajectories and possible flight states of the aircraft during the landing phase under the four situations are analyzed.
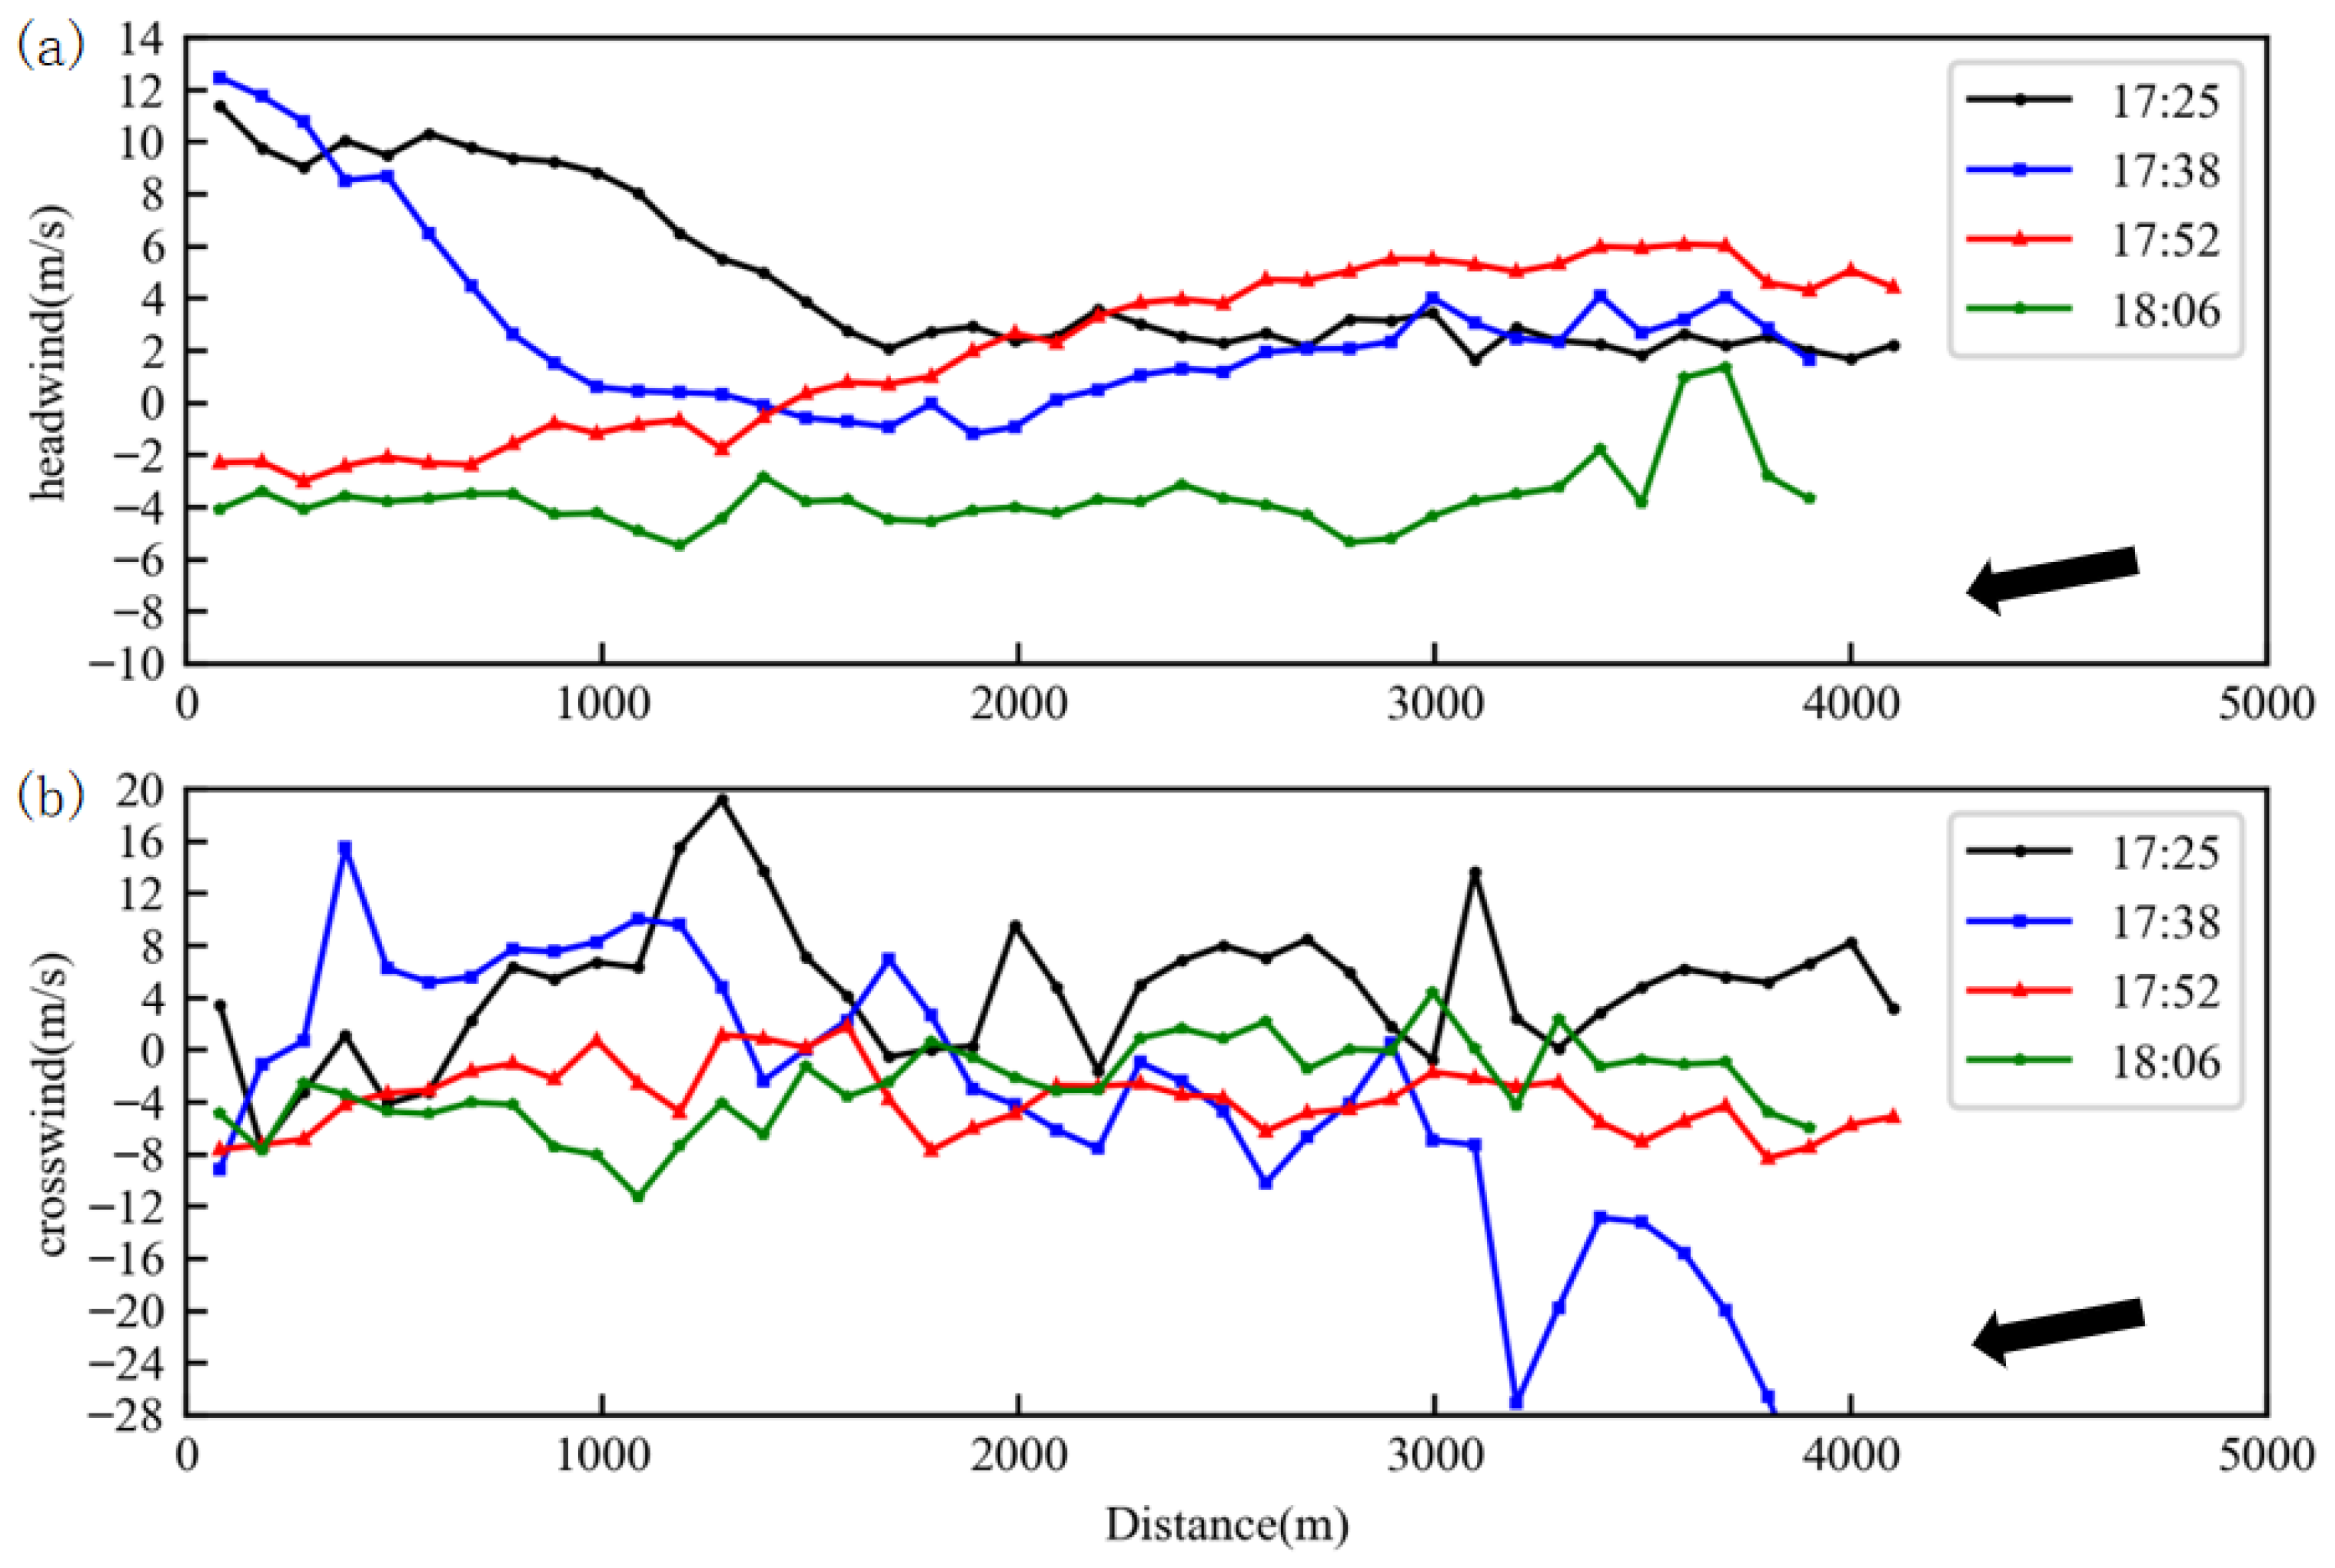
Figure 8 shows the variation in headwind and crosswind radial wind speeds along the RWY-E GP during the wind shear process. At 17:25 (Figure 8a), the downdraft outflow from cell “A” reached the surface and overlapped with the gust front, resulting in strong headwind shear near the runway threshold: beyond 1.7 km from the runway, the headwind speed remained steady at 0–4 m/s, while within 1.7 km it abruptly increased from 0 m/s to 12 m/s. Aircraft in this range encountered stronger headwinds, causing the touchdown point to shift slightly beyond the expected location. At 17:38, mesoscale convergence-divergence developed, keeping the headwind along the glide path stable at 2–4 m/s beyond 3 km, but within 3 km it first decreased and then rose to 12 m/s. This headwind shear increased lift during landing, shifting the touchdown point farther down the runway. At 17:52, the convective system entered the dissipation stage, with the cold downdraft weakening. Within 4 km, the wind speed decreased from 5 m/s to 0 m/s, and at 1.4 km from the runway the wind direction shifted to a light tailwind, creating tailwind shear, which could cause earlier touchdown. At 18:06, the system had fully dissipated, and the background wind shifted to a southeasterly flow. At 3.5 km, the wind speed changed from positive to negative, and near the runway threshold it maintained a tailwind of 2–6 m/s. This tailwind shear lowered the touchdown point and caused earlier landing than expected.
In terms of the crosswind (Figure 8b), at 17:25, under the influence of convective cell “A” and its outflow, crosswinds within 4 km exhibited multiple discontinuous changes. At 1.3 km, the right crosswind reached 20 m/s before quickly decreasing; within 700 m, alternating shifts in wind direction caused the aircraft to yaw left and right, ultimately leading to a left-offset landing. At 17:38, as convergence-divergence developed, the left crosswind at 3.2 km dropped sharply to 12 m/s, then rose to 28 m/s, and dropped again to 8 m/s. At 1.8 km, the wind direction shifted to a right crosswind, which increased to 16 m/s at 400 m before decreasing again, and shifted back to a left crosswind near touchdown, resulting in a right-offset landing. At 17:52, with convection weakening, crosswinds fluctuated between 0 and 8 m/s, causing a right-offset touchdown. At 18:06, after the system dissipated, crosswinds fluctuated slightly between 4 and 1.5 km. Near the runway threshold, the left crosswind first increased and then decreased, resulting in a slight right-offset landing.
It should be noted that the actual flight experience may be more complex than the wind conditions mentioned above. Other influencing factors, such as flight speed, aircraft load, aircraft type, and human intervention, are not taken into account here.

5. WRF-LES Evaluation

5.1. Wind Field Simulation Performance at 10 m

This experiment primarily focuses on evaluating the capability of WRF-LES to reproduce near-surface wind fields at Xining Airport. To this end, simulation outputs were compared with observations from automatic weather stations, with the aim of assessing the advantages of WRF-LES over mesoscale simulations in local applications.
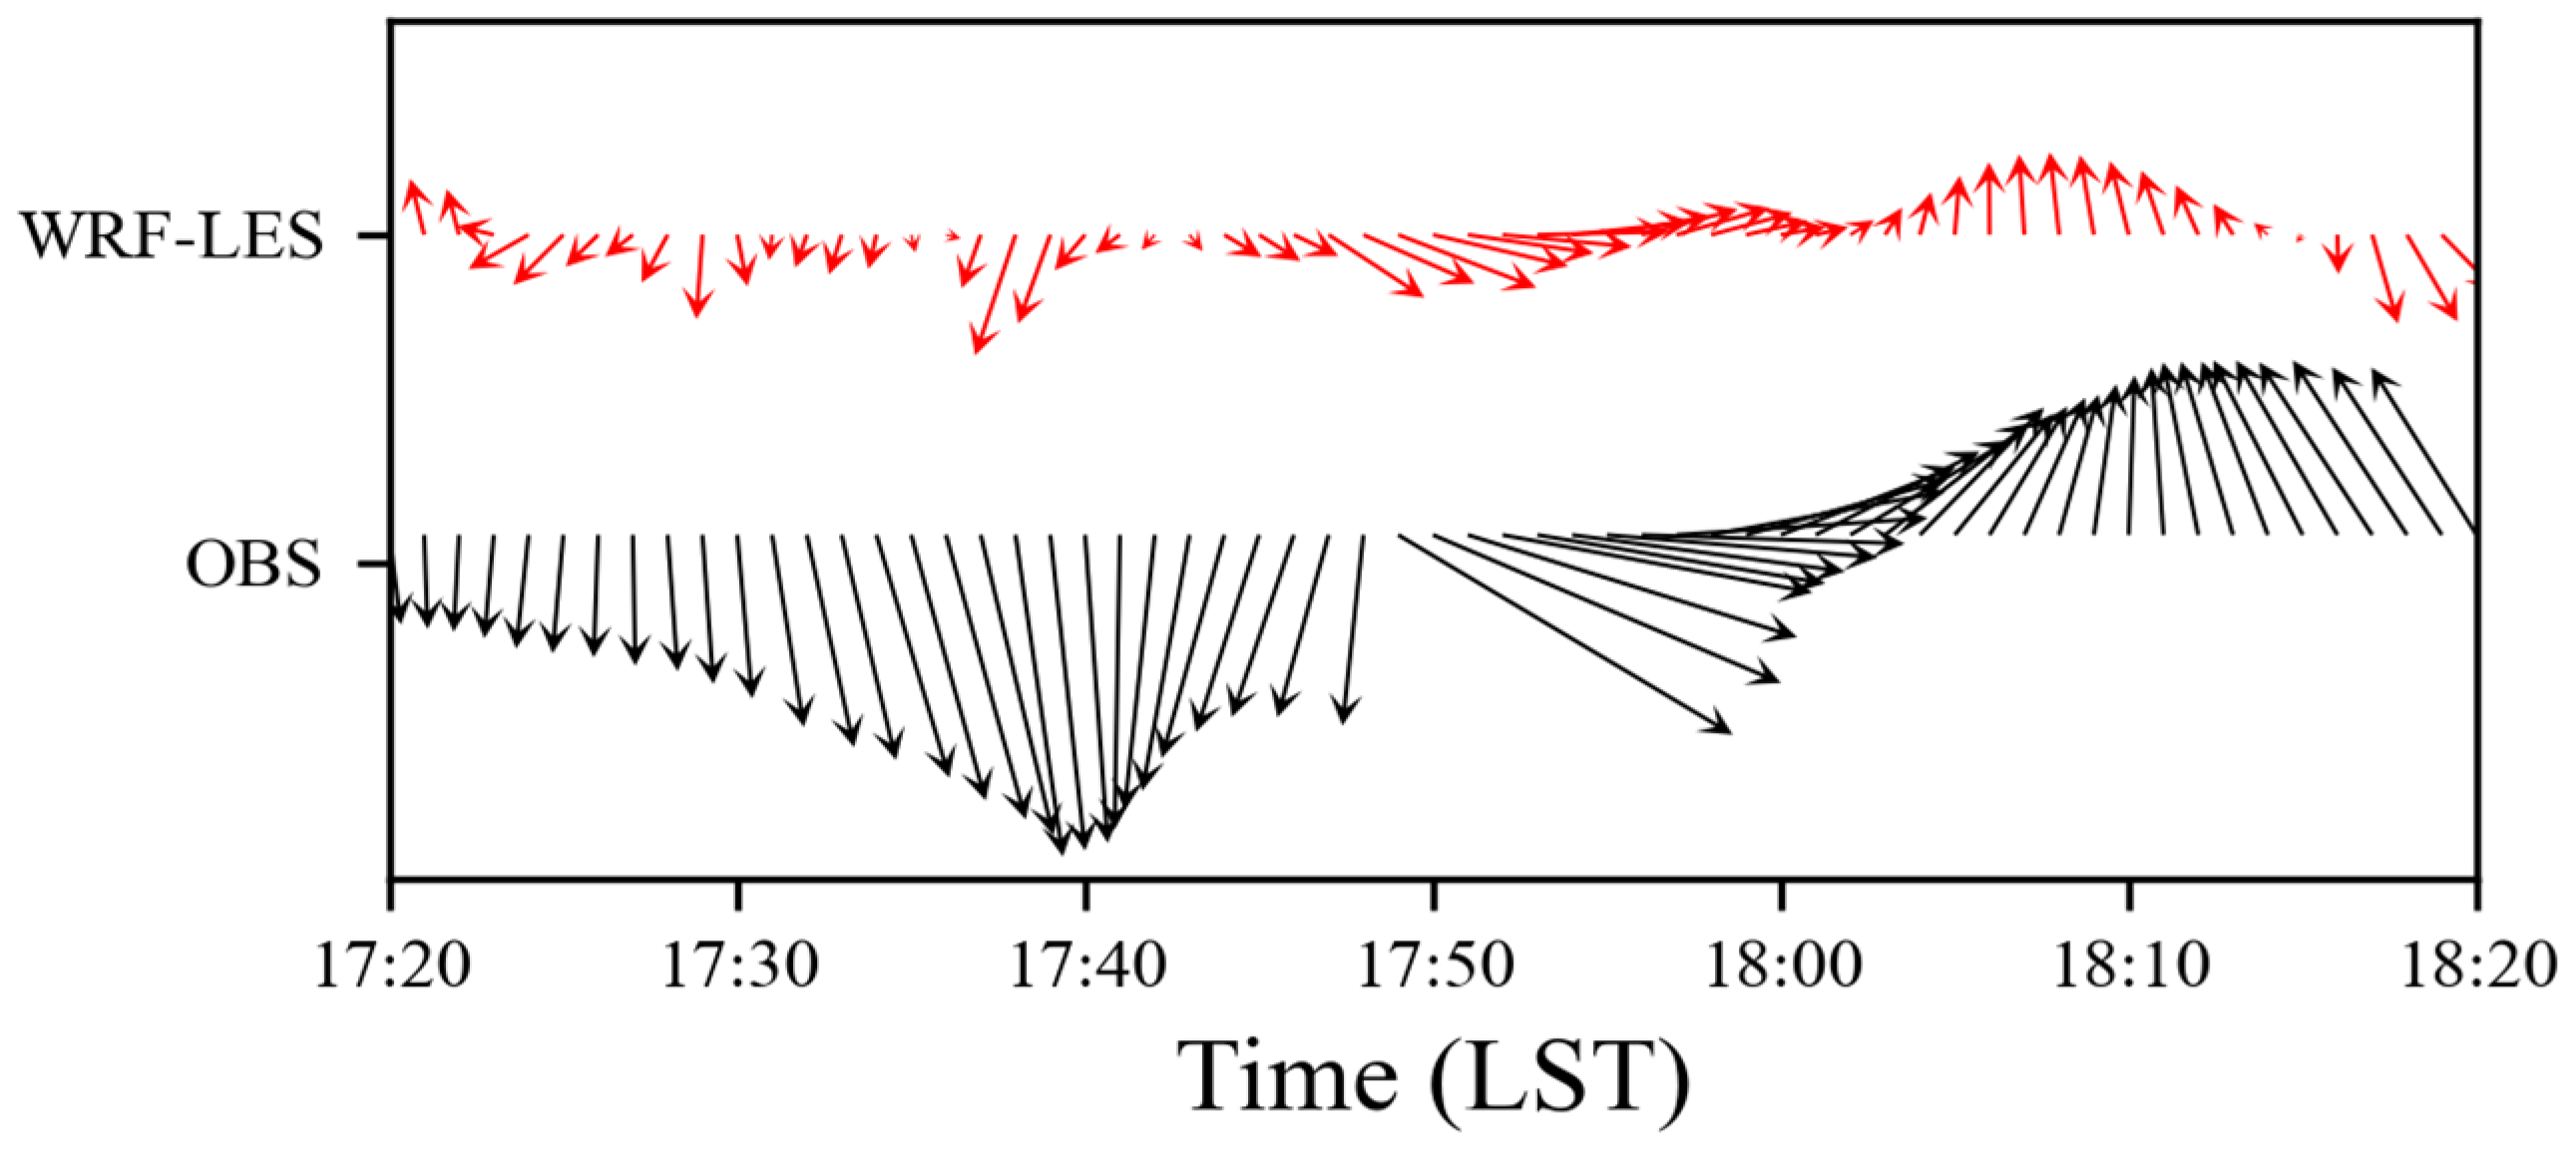
From the temporal structure of wind direction changes (Figure 9), WRF-LES successfully reproduced the key feature of an approximately 180° counterclockwise rotation between 17:50 and 18:15, showing high consistency with LiDAR observations. The simulation accurately captured the evolution from northerly to northwesterly and eventually to southerly winds, reflecting the horizontal perturbations in the surface wind field during the passage of the convective system. During the period of strongest LLWS (17:40–18:05), the OBS wind direction exhibited pronounced oscillations. While WRF-LES smoothed part of the high-frequency fluctuations and slightly underestimated the total directional change, it correctly identified the timing of the abrupt shift, consistent with the observational conclusion that “the convergence zone east of the runway triggered discontinuous wind direction changes” (Section 4.2). In addition, the model reproduced intermittent reverse flow structures in the abrupt-change region, with the wind adjustment process aligning with observed trends. This indicates that under the high-resolution LES configuration, WRF responds well to wind direction reconstruction induced by complex terrain and can stably simulate wind field evolution driven by downdraft propagation and gust-front boundary interactions. Combined with the gust-front structure revealed in the PPI scans (Section 4.1), it can be concluded that WRF-LES accurately reproduced the modulation of the surface wind field by mesoscale dynamical structures during this period.
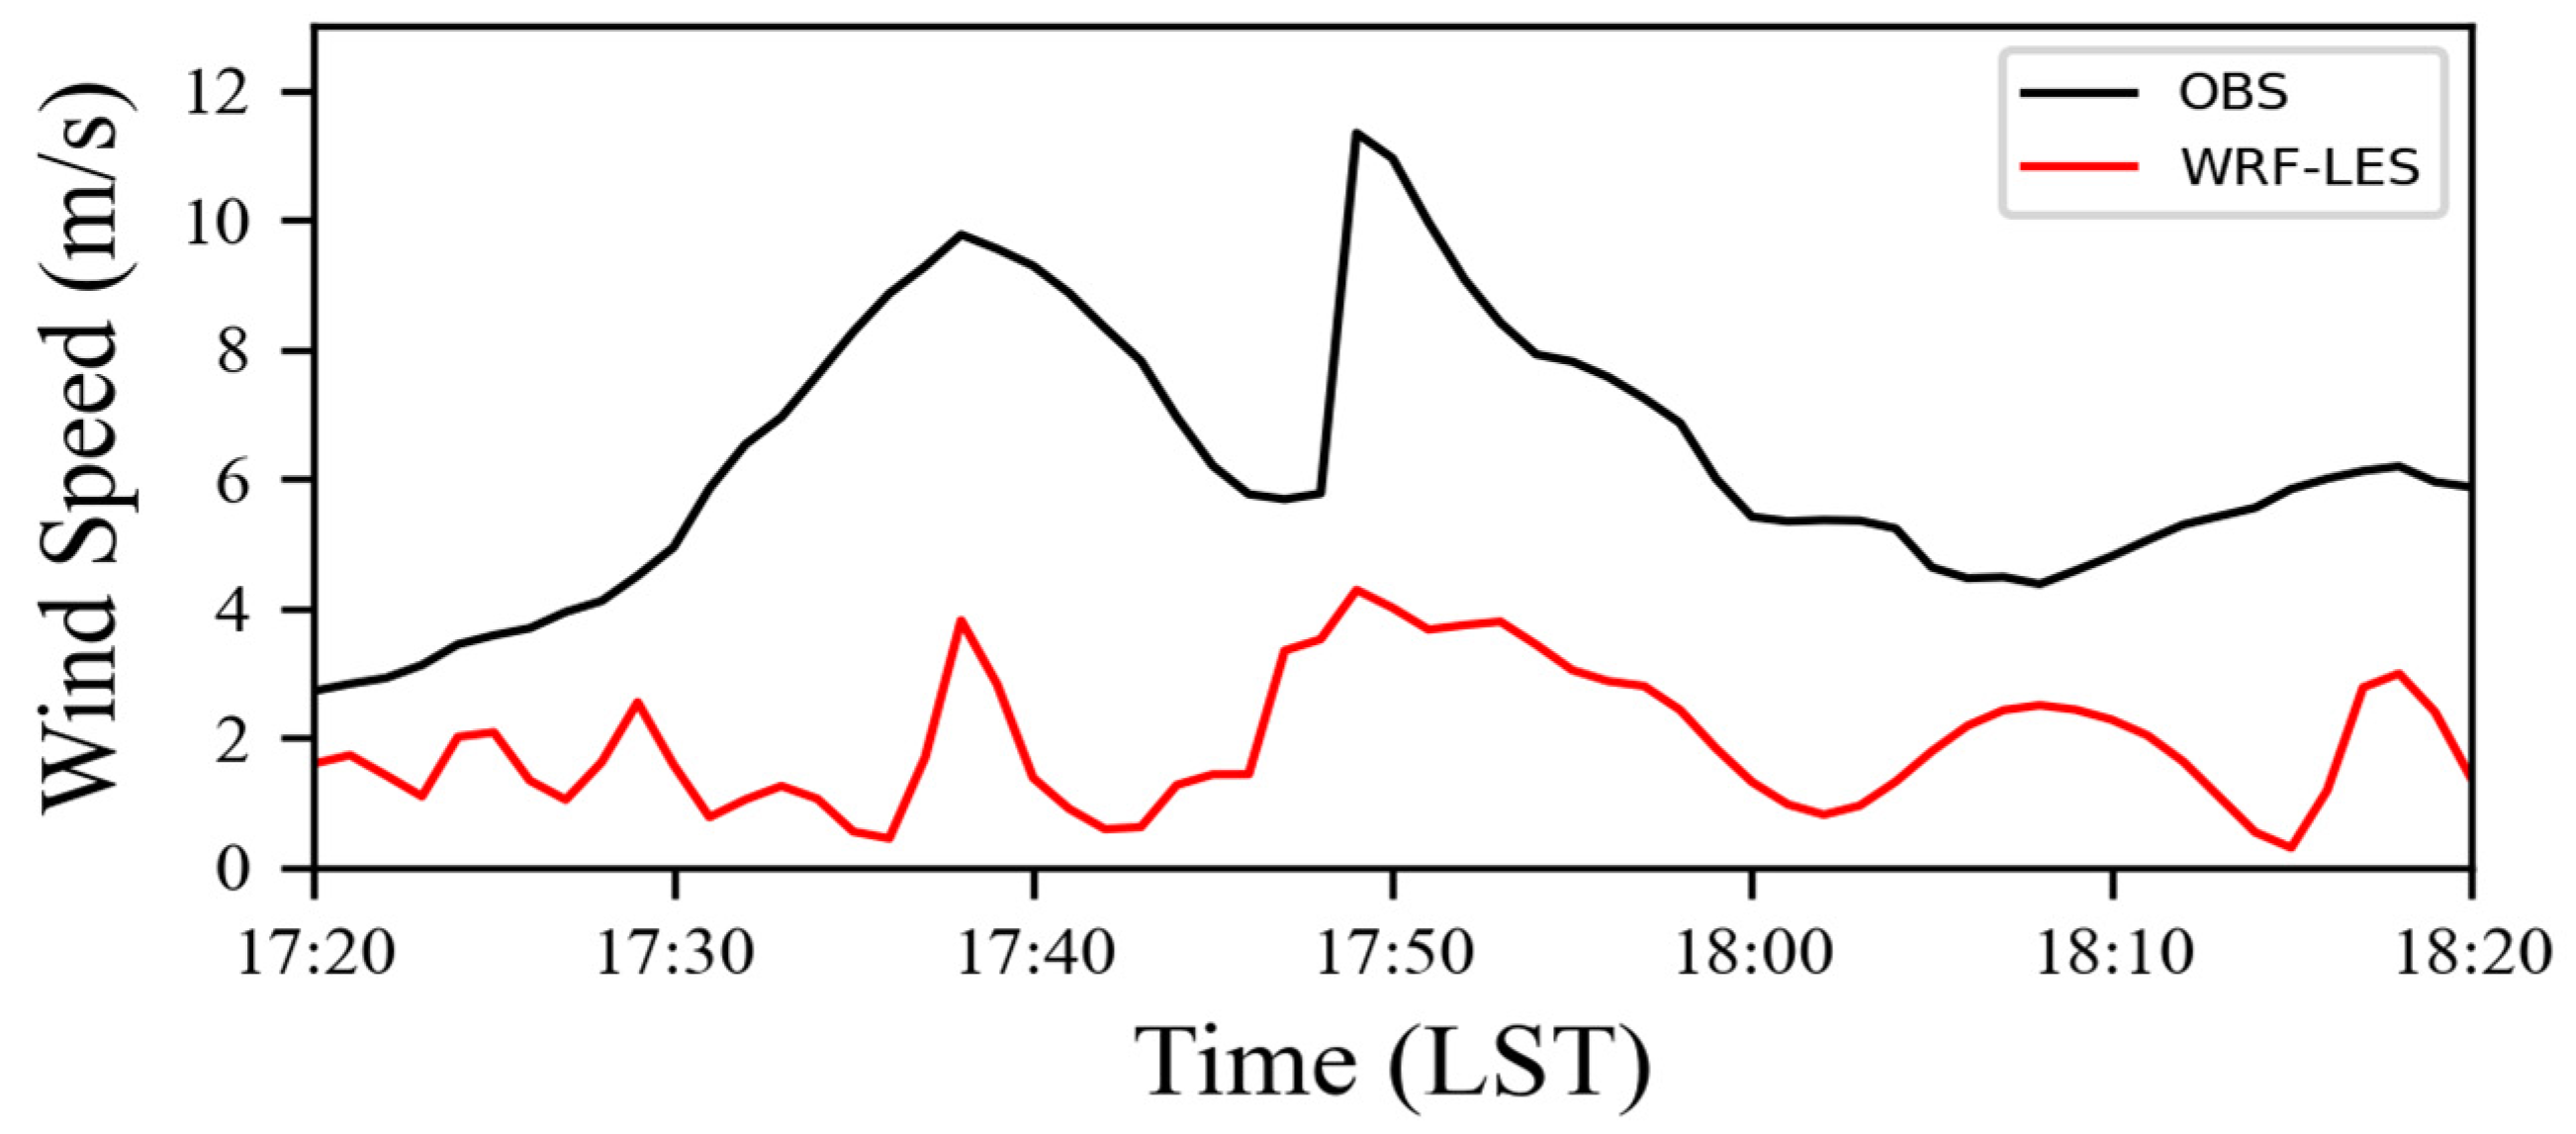
From the evolution of wind speed (Figure 10), WRF-LES successfully reproduced the main surge features. Between 17:20 and 17:38, the OBS wind speed increased from 3 m s−1 to 10 m s−1, with the simulation showing a synchronous rise, reflecting the initial downward momentum transport associated with downdrafts. From 17:48 to 17:53, the observed wind speed abruptly increased to 11 m s−1, a surge also captured by WRF-LES, indicating its response to wind speed enhancement induced by convective outflow (Section 4.1). During the critical aircraft go-around period (17:44–17:48), the OBS wind speed surged by 5–6 m s−1, exhibiting a typical “low-level headwind surge” structure. Although the simulated magnitude was slightly smaller (4 m s−1), it reproduced the rapid wind speed perturbation, supporting the conclusion in Section 4.2 that the go-around wind shear was triggered by the convergence zone to the east of the runway. The simulated intensity was underestimated in some intervals, possibly due to limitations in the model’s treatment of turbulent structure diffusion and its resolution of near-surface downdrafts. Nevertheless, the overall trend agreed well with observations, indicating that WRF-LES exhibits good adaptability and responsiveness in simulating LLWS events at plateau airports.

5.2. Wind Profile Simulation Performance

Figure 11 presents the temporal evolution of wind profiles simulated by WRF-LES. Comparison with LiDAR observations (Section 4.3) shows a high degree of consistency in wind field structure, disturbance patterns, and key time periods. During the early convective stage (16:30–17:10), both observations and simulations indicate northerly winds, weak wind speeds, and updrafts, suggesting stable atmospheric stratification with convection not yet established. Starting at 17:10, pronounced downdrafts developed above 700 m, accompanied by wind speed increases and a shift to northwesterly winds. WRF-LES reproduced this structure at similar altitudes, with maximum downdraft speeds reaching 6 m s−1. During the LLWS outbreak stage (17:38–17:52), LiDAR data revealed the formation of dual convergence zones below 1 km, abrupt wind direction shifts, vertical flow reversals, and a rapid increase in headwind. WRF-LES simultaneously captured strong vertical disturbances interlaced between 1 and 2.5 km, with disordered wind vectors, effectively reconstructing the three-dimensional structure of the wind shear. After 18:10, convection weakened, wind speed and direction stabilized, and disturbances dissipated, with the simulated trends matching the observations. Overall, WRF-LES accurately reproduced the main evolution of this LLWS event, particularly in terms of abrupt wind direction changes, downdraft impingement, and the spatial positioning of the wind shear. This validates its applicability and reliability for high-resolution simulation and diagnosis of LLWS under complex plateau terrain conditions.
In summary, WRF-LES accurately reproduced the spatiotemporal evolution of the convective LLWS event that occurred at Xining Airport on 29 May 2021. The 10 m near-surface wind field simulation showed excellent agreement with observations in the timing of abrupt wind direction changes, capturing key disturbance features such as a rapid counterclockwise shift and wind speed surges, thereby reflecting the model’s responsiveness to gust-front passage and low-level wind variations during the critical go-around period. The simulated wind profiles also exhibited strong structural fidelity, accurately depicting the three-dimensional disturbance patterns during the LLWS outbreak stage, including alternating updrafts and downdrafts, abrupt wind direction shifts, and enhanced wind speed gradients, all of which closely matched LiDAR observations. The results demonstrate that WRF-LES possesses robust capabilities for simulating and diagnosing LLWS in complex plateau terrain, providing reliable support for aviation meteorological services and wind shear early warning system development. However, discrepancies remain in reproducing small-scale, high-frequency wind speed perturbations, revealing certain limitations of the parameterization schemes. In intermediate-resolution “gray zone” domains, the YSU scheme may be insufficient to accurately represent turbulence structures. In high-resolution LES domains, although turbulence can be resolved, fixed parameter settings may weaken the reproduction of high-frequency wind speed fluctuations. Furthermore, the YSU scheme tends to underestimate near-surface disturbances over complex plateau terrain, and insufficient coupling with actual surface thermal boundaries may contribute to low-level wind speed biases. Overall, while the current configuration adequately supports LLWS simulation in this case, there remains room for improvement in local high-frequency response and gray-zone turbulence representation.

6. Conclusions and Discussions

Based on coherent DWL, DWR, AWOS, and ERA5 reanalysis data, combined with high-resolution WRF-LESs, this study systematically analyzed a typical convective LLWS event at Xining Airport on 29 May 2021. The main conclusions are as follows:
(1)
The synergistic use of multi-source observations enabled a refined depiction of the entire life cycle of wind shear generation, evolution, and dissipation. DWR revealed the synchronous relationship between rapid echo-top descent and surface wind acceleration, confirming the role of downdrafts during the dissipating stage of convective cells as the primary triggering mechanism. PPI and RHI scans captured the formation of the initial shear zone and the vertical shear layer near 700 m, while high-frequency AWOS measurements documented 5–6 m/s wind surges during the go-around phase, providing direct evidence for identifying critical risk periods.
(2)
DBS mode reconstructed the three-dimensional wind field from the surface to 3 km, showing a near-180° counterclockwise wind shift and vertical flow reversal induced by downdrafts, forming a typical shear structure. The GP mode further quantified the flight impacts at different stages: during the convective development phase, multiple headwind shears (maximum 12 m/s) caused landing points to shift rearward, while in the decaying phase, tailwind shear combined with crosswinds up to 20 m/s and alternating wind reversals led to yaw deviations, providing quantitative support for flight risk assessment.
(3)
Multi-source data jointly confirmed the enhancement effect of mesoscale convergence and divergence on shear intensity. As the convective cell shifted eastward, multiple radial velocity couplets appeared on the eastern runway side; at the go-around stage, two convergence bands overlapped, producing a peak shear intensity of 8 m/s/km. This structure was further corroborated by AWOS observations of wind speed differences between the western (11 m/s) and eastern (3 m/s) stations, delineating the spatial distribution of the highest-risk zone.
(4)
WRF-LES successfully reproduced the key dynamical characteristics of the event: the 10 m wind field accurately simulated the near-180° counterclockwise wind shift and two episodes of wind acceleration, while the vertical wind profiles reproduced alternating disturbances between 1 and 2.5 km (including a strong downdraft core) that matched well with DWL observations, validating its capability to simulate mesoscale dynamical processes in complex plateau terrain.
In summary, this study reveals the dynamic mechanisms and three-dimensional structure of a typical convective LLWS event at Xining Airport and confirms the applicability of WRF-LES in complex plateau terrain. This convective wind shear event represents a prototypical case at a high-altitude airport. Its key characteristics—including the initiation of convective cells, the interaction between gust fronts and downdrafts, and the presence of dual convergence zones—are closely associated with common mechanisms of wind shear on plateaus, such as topographic forcing and momentum descent. This case thus offers broad representativeness for studying similar environments, such as those at Lhasa and Diqing airports.
High-resolution observations combined with LESs effectively overcome observational gaps in plateau regions, enabling accurate reconstruction of gust front position, downdraft progression, wind shifts, and wind profile disturbances. We note that the configuration and performance of the WRF-LES model require further validation with independent events in future studies, particularly its limitations in representing gray-zone turbulence and high-frequency perturbations, which indicate the need to optimize boundary layer parameterization schemes and enhance local adaptability. As the first step in a series of ongoing investigations, we are currently collecting additional wind shear cases from various high-altitude airports to rigorously test and validate the methodology developed and preliminary findings obtained in this study.

Author Contributions

Conceptualization, J.G.; methodology, Y.Q.; software, Y.Q. and S.Z.; writing—original draft preparation, J.G. and Y.Q.; writing—review and editing, Y.Q., S.Z. and X.Y.; investigation, S.Z. and X.Y.; visualization, S.L.; project administration, J.Z.; All authors have read and agreed to the published version of the manuscript.

Funding

This research has been supported by the Open Foundation of China Meteorological Administration Key Laboratory for Aviation Meteorology (HKQXZ-2024005) and supported by the Fundamental Research Funds for the Central Universities (TD2025CZ08).

Institutional Review Board Statement

Not applicable.

Informed Consent Statement

Not applicable.

Data Availability Statement

The data presented in this study are available on request from the corresponding author. The data were obtained from the Qinghai Air Traffic Management Branch and are available from the corresponding author with the permission of the Qinghai Air Traffic Management Branch.

Acknowledgments

The authors are grateful to the reviewers for their insightful feedback and constructive suggestions, which have greatly enhanced the clarity and impact of this work.

Conflicts of Interest

The authors declare no conflicts of interest.

References

  1. Lin, C.; Zhang, K.; Chen, X.; Liang, S.; Wu, J.; Zhang, W. Overview of low-level wind shear characteristics over Chinese mainland. Atmosphere 2021, 12, 628. [Google Scholar] [CrossRef]
  2. Gultepe, I.; Agelin-Chaab, M.; Komar, J.; Elfstrom, G.; Boudala, F.; Zhou, B. A meteorological supersite for aviation and cold weather applications. Pure Appl. Geophys. 2019, 176, 1977–2015. [Google Scholar] [CrossRef]
  3. Cheng, X. Characteristics of Plateau Meteorology and Countermeasures for Aviation Meteorological Support. Guide Sci-Tech Mag. 2012, 28, 335. [Google Scholar]
  4. Krüs, H.W. Criteria for crosswind variations during approach and touchdown at airports. In Advances in Simulation of Wing and Nacelle Stall; Radespiel, R., Niehuis, R., Kroll, N., Behrends, K., Eds.; Springer International Publishing: Cham, Switzerland, 2016; pp. 167–187. [Google Scholar]
  5. Wang, S.J. Preliminary Analysis of Wind Shear at Xining Airport in Qinghai Province. Beijing Agric. 2013, 27, 137–138. [Google Scholar]
  6. Zhao, Z.J.; Cai, G.S. Statistics and Analysis of Low-level Wind Shear Weather Processes at Xi’an Xianyang International Airport. In Proceedings of the 2006 Annual Meeting of the China Meteorological Society, Chengdu, China, 25–27 October 2006. [Google Scholar]
  7. Hua, Z.Q.; Huang, X.; Zhao, Q.; Tian, W.; Sun, Y. Statistics on the Characteristics of Low-level Wind Shear at Xining Airport and a Preliminary Exploration of Early Warning Indicators. J. Civ. Aviat. 2024, 8, 99–103, 169. [Google Scholar]
  8. Shan, N.C.; Zhou, H.F.; Chen, S.Q.; Zhao, Q. Mechanism Analysis of a Low-level Wind Shear Event at Hefei Airport. Meteorol. Sci. Technol. 2018, 46, 1240–1250. [Google Scholar]
  9. Guo, Z.L.; Xie, W.F.; Zhong, J.J.; Li, W.B.; Chen, S.M. Analysis of a Low-level Wind Shear Process Caused by a Microburst at Guangzhou Baiyun Airport. Desert Oasis Meteorol. 2019, 13, 71–78. [Google Scholar]
  10. Lu, Y.; Chen, L.J. Analysis of the Action Mechanism of a Convective Low-level Wind Shear at Longnan Airport. J. Meteorol. Disaster Prev. 2023, 30, 34–39. [Google Scholar]
  11. Feng, L.T.; Zhou, J.; Fan, Q.; Chen, Y.X.; Liu, Z.P.; Lu, M.T.; Zhou, D.F.; Hou, T.J. Three-dimensional Wind Lidar for Wind Shear Detection and Early Warning at Civil Aviation Airports. Acta Photonica Sin. 2019, 48, 192–202. [Google Scholar]
  12. Li, L.; Shao, A.; Zhang, K.; Ding, N.; Chan, P.-W. Low-level wind shear characteristics and lidar-based alerting at Lanzhou Zhongchuan international airport, China. J. Meteorol. Res. 2020, 34, 633–645. [Google Scholar] [CrossRef]
  13. Han, Y.; Liu, J.; Sun, D.; Han, F.; Zhou, A.; Zhao, R.; Xue, X.; Chen, T.; Zhen, F.; Lu, Y. Fine gust front structure observed by coherent doppler lidar at Lanzhou airport (103°49′ E, 36°03′ N). Appl. Opt. 2020, 59, 2686. [Google Scholar] [CrossRef]
  14. Huang, X.; Zheng, J.F.; Zhang, J.; Ma, X.L.; Tian, W.D.; Hua, Z.Q. Study on the Structure and Characteristics of a Low-level Wind Shear Event at Xining Airport. Laser Technol. 2022, 46, 206–212. [Google Scholar]
  15. Zhang, T.; Li, Q.; Zheng, J.F.; Zhang, W.L.; Fan, Q.; Zhang, J. Study on Low-level Wind Shear Caused by Microburst Using Wind Lidar. Laser Technol. 2020, 44, 563–569. [Google Scholar]
  16. Chen, F.; Peng, H.; Chan, P.; Huang, Y.; Hon, K.K. Identification and analysis of terrain-induced low-level windshear at Hong Kong international airport based on WRF–LES combining method. Meteorol. Atmos. Phys. 2022, 134, 60. [Google Scholar] [CrossRef]
  17. Dzebre, D.E.K.; Adaramola, M.S. A preliminary sensitivity study of planetary boundary layer parameterisation schemes in the weather research and forecasting model to surface winds in coastal Ghana. Renew. Energy 2020, 146, 66–86. [Google Scholar] [CrossRef]
  18. Xing, W.W.; Sun, J.H.; Liu, H.Z.; Xu, L. Numerical Simulation of the Local Circulation of Complex Topography on the Gaoligong Mountains. Chin. J. Atmos. Sci. 2021, 45, 746–758. (In Chinese) [Google Scholar] [CrossRef]
  19. Doubrawa, P.; Montornès, A.; Barthelmie, R.J.; Pryor, S.C.; Casso, P. Analysis of different gray zone treatments in WRF-LES real case simulations. Wind. Energy Sci. Discuss. 2018, 2018, 1–23. [Google Scholar] [CrossRef]
  20. Li, Y.Q.; Shi, C.X.; Shen, R.P.; Li, Y.; Zhang, D.J.; Ge, L.L. Near-surface wind field simulation and boundary layer scheme sensitivity study in the Mentougou area based on WRF-LES. Plateau Meteorol. 2023, 42, 758–770. [Google Scholar]
  21. Liu, Y.J.; Miao, S.G.; Hu, F.; Liu, Y.B. Large-eddy simulation study of boundary layer wind field in the Xiaohaituo Mountain competition area of the Winter Olympics. Plateau Meteorol. 2018, 37, 1388–1401. [Google Scholar]
  22. Zhang, S.; Wang, Z.M.; Huang, G.; Xue, X.W. Local wind field simulation over complex terrain in Chongli based on WRF-LES. Plateau Meteorol. 2023, 42, 197–209. [Google Scholar]
  23. Zhou, B.; Simon, J.S.; Chow, F.K. The Convective Boundary Layer in the Terra Incognita. J. Atmos. Sci. 2014, 71, 2545–2563. [Google Scholar] [CrossRef]
  24. Noh, Y.; Cheon, G.W.; Hong, Y.S.; Raasch, S. Improvement of the K-profile Model for the Planetary Boundary Layer based on Large Eddy Simulation Data. Bound.-Layer Meteorol. 2003, 107, 401–427. [Google Scholar] [CrossRef]
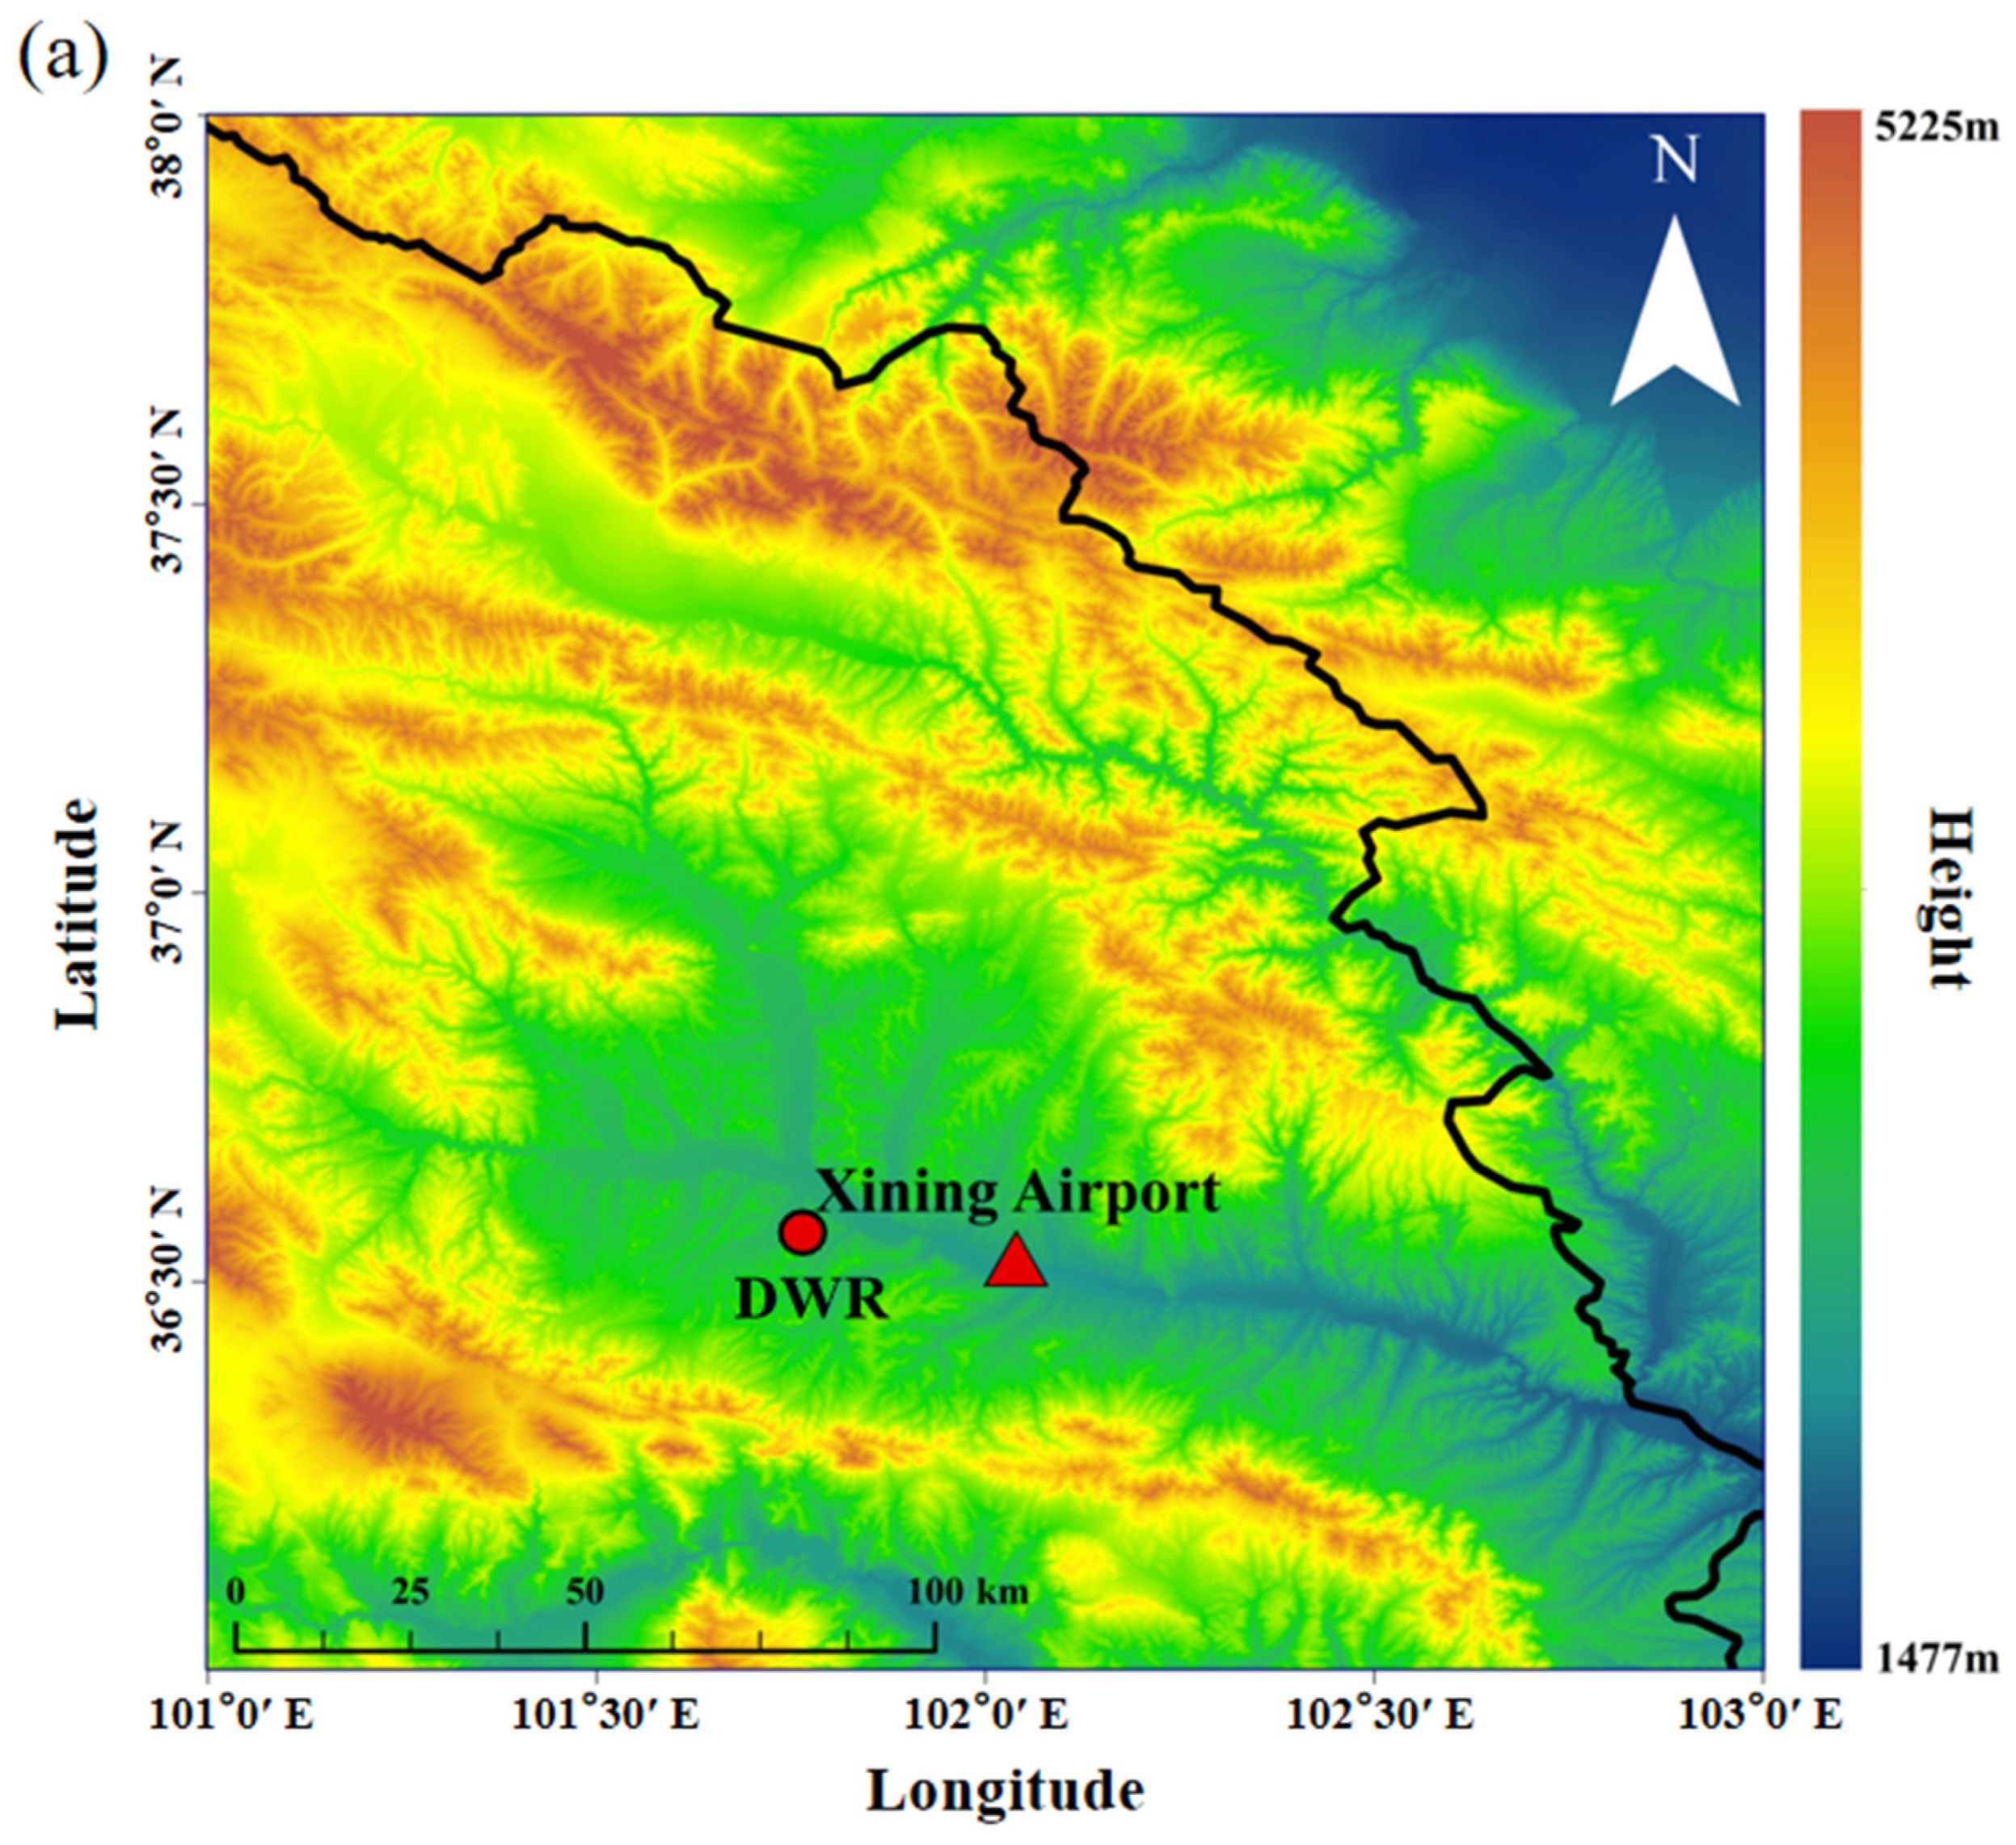
Figure 1. (a,b) The geographical environment of Xining Airport from different perspectives. The red circle in the figures represents DWR in Xining City, while the red triangles and rectangular annotation boxes represent Xining Airport. (c) A distribution map of the runway and meteorological instruments at Xining Airport. In the figure, the yellow five-pointed star indicates the location of DWL, the white rectangular annotation box represents AWOS, and “#” is an abbreviated symbol for “number”.
Atmosphere 16 01137 g001aAtmosphere 16 01137 g001b
Figure 2. Synoptic-scale circulation with associated dynamic and thermodynamic variables at 17:00 BJT on 29 May 2021. Panel (a) displays the 200 hPa geopotential height contours (blue solid lines, gpm) overlaid with the divergence field (div, 10−5 m/s; shaded colors where positive/negative values indicate divergence/convergence, respectively), overlaid with horizontal wind vectors. Panel (b) displays the 500 hPa geopotential height contours (blue solid lines, gpm), temperature field (red dashed lines), and vertical velocity (vv, Pa/s; shaded areas where positive and negative values represent downward and upward motion, respectively), overlaid with horizontal wind vectors. Panel (c) presents the 700 hPa geopotential height contours (blue solid lines, gpm) and equivalent potential temperature (θe, K; the shaded area), overlaid with horizontal wind vectors. Panel (d) displays the composite surface analysis with the sea-level pressure (blue solid lines, hPa), convective available potential energy (CAPE, J/kg; the shaded area), and 10 m surface wind vectors overlaid. Qinghai Province is delineated by a purple solid-line border, while Xining Airport is marked with a red five-pointed star symbol (36.52° N, 102.04° E).
Atmosphere 16 01137 g002
Figure 3. Time series of Query Normal Height Pressure (QNH), temperature, and horizontal winds observed by AWOS from 17:20 to 18:20 BJT on 29 May 2021. Panel (a) displays QNH and temperature measured at W# AWOS, while panels (b,c) present horizontal winds observed at W#AWOS and E#AWOS, respectively, with the aircraft go-around time indicated by black dashed lines.
Atmosphere 16 01137 g003
Figure 4. Vertical distribution of the 60 km radar reflectivity factor (dBZ) of the C-band DWR at Xining Airport. The red dot represents the location of Xining Airport, and the orange elliptical dotted line indicates the convective cell. Panels (ad) represent radar reflectivity at 17:32, 17:43, 17:54, and 18:05, respectively.
Atmosphere 16 01137 g004
Figure 5. From 16:58 to 18:05 BJT, the PPI images (m/s) at 10 min intervals were observed by the DWL at an elevation angle of 3°. The black rectangular area represents the airport runway and part of the glide path. In panel (a), “W” and “E” denote the west side and the east side of the runway, respectively. The combination of letters and circles typically indicates the location of the outflows of a downburst. The red dashed line represents the gust front or the convergence line, and the black arrow indicates the direction of the air current movement. Panels (af) represent radar observations at 16:58, 17:11, 17:24, 17:38, 17:52, and 18:05 BJT, respectively.
Atmosphere 16 01137 g005
Figure 6. The RHI of the radial velocities measured by the DWL on the runway during the period from 17:08 to 18:17 BJT. The meanings of the auxiliary markings are the same as those described in Figure 5. In addition, the black dashed ellipse in the figure represents the obvious change in the wind field. Panels (af) correspond to observations at 17:08, 17:22, 17:35, 17:49, 18:03, and 18:17 BJT, respectively.
Atmosphere 16 01137 g006
Figure 7. The time–height cross-section of the horizontal wind (wind barbs) below 3 km and the vertical air current (colored part) observed by DBS mode of the DWL during the period from 16:29 to 18:33 BJT. The long and short lines in the wind barbs represent 4 m/s and 2 m/s, respectively. For the vertical wind, positive values and negative values represent the updraft and the downdraft, respectively.
Atmosphere 16 01137 g007
Figure 8. Wind components along the glide path of runway 29# at four time groups (17:25, 17:38, 17:52, and 18:06 BJT). (a) Headwind speed variation with distance. (b) Crosswind speed variation with distance. The black arrows indicate the landing direction of the aircraft.
Atmosphere 16 01137 g008
Figure 9. Wind direction changes of 10 m between 17:20 and 18:20 from OBS (black arrows) and WRF-LESs (red arrows).
Atmosphere 16 01137 g009
Figure 10. Wind speed changes of 10 m between 17:20 and 18:20 from OBS (black solid line) and WRF-LESs (red solid line).
Atmosphere 16 01137 g010
Figure 11. Time–height cross-section of horizontal winds (wind barbs) below 3 km and vertical velocity (shaded) from 16:29 to 18:33 simulated by WRF-LES. In the wind barbs, long and short lines represent 4 m s−1 and 2 m s−1, respectively. Positive and negative vertical velocities indicate downdrafts and updrafts, respectively.
Atmosphere 16 01137 g011
Table 1. Main technical parameters of FC-III wind LiDAR.
ParametersValue
Average power/W≤200
Wavelength/nm1550
Scan range (azimuth/pitch)/(°)0–360/0–90
Detection range/km0.05–10
Range resolution/m100
Scanning modeDBS/PPI/RHI/GP
Minimum time resolution/s≤2
Elevation resolution/(°)≤0.1
Wind speed range/(m·s−1)−60–+60
Wind velocity accuracy/(m·s−1)≤0.5
Wind angle accuracy (profile mode)/(°)≤10
Measurementsradial velocity, wind profile, vertical air motion, spectrum width, signal-to-noise ratio, etc.
Table 2. Model configuration.
Scheme/ParameterDescription
Terrain dataDefault GTPO30 dataset
Map projectionLambert
Simulation period29 May 2021
Background meteorological data 0.25 × 0.25 . ERA5 reanalysis (temporal resolution: 1 h)
Domain center coordinates36.5° N, 102° E
Nested domains4 nested domains
Grid spacing7500 m; 1500 m; 300 m; 100 m
Number of grid points 300 × 300 , 231 × 231 , 231 × 231 , 232 × 232
Vertical levels60
MicrophysicsNew Thompson graupel scheme
Longwave radiationRapid Radiative Transfer Model (RRTM)
Shortwave radiationRapid Radiative Transfer Model for GCMs (RRTMG)
Surface layerMonin–Obukhov scheme
Planetary boundary layerYSU scheme for d01 and d02
Cumulus parameterizationShallow convection Kain–Fritsch (new Eta) scheme for the outermost domain; none for others
Land surfaceNoah land surface model
Disclaimer/Publisher’s Note: The statements, opinions and data contained in all publications are solely those of the individual author(s) and contributor(s) and not of MDPI and/or the editor(s). MDPI and/or the editor(s) disclaim responsibility for any injury to people or property resulting from any ideas, methods, instructions or products referred to in the content.