Article

Monitoring and Dispersion of SO2 Emissions from Power Plants Using UV Camera and AERMOD: A Case Study of Baja California Sur, Mexico

by
Benedetto Schiavo
1,*,
Wolfgang Stremme
2,
Jaqueline Valenzuela Meza
3,
Rodrigo Rangel-Rodríguez
3,
Cristina Carolina Carbajal-Aguilar
3 and
Paulina Annette Ortega-Flores
3
1
Instituto de Geofísica, Universidad Nacional Autónoma de México, Mexico City 04510, Mexico
2
Instituto de Ciencias de la Atmósfera y Cambio Climático, Universidad Nacional Autónoma de México, Mexico City 04510, Mexico
3
Centro de Energía Renovable y Calidad Ambiental, La Paz, Baja California Sur 23000, Mexico
*
Author to whom correspondence should be addressed.
Atmosphere 2025, 16(10), 1128; https://doi.org/10.3390/atmos16101128
Submission received: 4 August 2025 / Revised: 11 September 2025 / Accepted: 24 September 2025 / Published: 26 September 2025

Abstract

This work assesses sulfur dioxide (SO2) emissions from two power plants in Baja California Sur, Mexico, using ground-based UV camera measurements and AERMOD dispersion modeling. Field campaigns conducted during 2022 in La Paz and Puerto San Carlos captured spatial and temporal variations in SO2 slant column densities (SCDs) and fluxes, revealing higher emissions at the larger Punta Prieta (CTPP) thermoelectric power facility (mean flux: 1.13 kg s−1) compared to the Agustín Olachea (CCI AO) internal combustion power plant (mean flux: 0.59 kg s−1). The UV camera effectively monitored plume structure and dynamics, with error analyses indicating uncertainties of ~12% in flux estimates. AERMOD simulations showed ground-level SO2 concentrations exceeding WHO and Mexican air quality standards near the plants, with localized exposure risks particularly for workers. The results underscore the substantial contribution of these facilities to regional SO2 pollution and demonstrate the utility of combining remote sensing with modeling to assess industrial emissions and inform air quality management in sensitive regions.

1. Introduction

Industrial air pollution, particularly sulfur dioxide (SO2) emissions from power plants and other combustion-based facilities, has become a critical environmental and public health issue worldwide [1,2]. SO2 is one of the principal pollutants released during the combustion of sulfur-containing fossil fuels such as coal, diesel, and heavy oils, which remain a cornerstone of energy production in many countries [3]. These emissions contribute significantly to atmospheric pollution, adversely affecting local and regional air quality, human health, ecosystems, and even climate processes.
Power plants fueled by coal and oil are among the largest anthropogenic sources of SO2, emitting thousands of tons annually, particularly in regions where environmental controls are limited or outdated [4]. Despite increasing awareness and regulatory efforts in recent decades, SO2 continues to account for a significant fraction of total sulfur emissions, with high concentrations detected in densely populated urban areas and surrounding rural communities located near power generation facilities [5]. In many industrial regions, SO2 levels often exceed national or international air quality guidelines, posing ongoing challenges for public health protection and environmental sustainability [6]. International agreements such as the 1979 Convention on Long-Range Transboundary Air Pollution and subsequent protocols have contributed to notable reductions in SO2 emissions in some regions [7]. However, these gains are unevenly distributed, and many developing countries still face significant challenges in reducing industrial SO2 emissions while meeting growing energy demands.
SO2 is recognized as a criteria air pollutant due to its short- and long-term impacts on human health. Acute exposure to elevated SO2 concentrations is associated with respiratory and cardiovascular diseases, particularly among vulnerable populations such as children, the elderly, and individuals with pre-existing conditions [8]. Chronic exposure has been linked to increased rates of morbidity and mortality, with adverse outcomes even at concentrations below established regulatory thresholds [9]. Beyond its health implications, SO2 also plays a central role in acid deposition phenomena, forming sulfuric acid aerosols that acidify soils and aquatic environments, degrade vegetation, and accelerate the weathering of built structures [10]. Additionally, SO2 contributes to atmospheric radiative forcing through the formation of sulfate aerosols, which interact with cloud properties and influence regional climate dynamics [11]. Globally, the primary anthropogenic sources of SO2 are power generation (coal, oil), industrial combustion processes, smelters, and shipping [12]. While natural emissions, especially from active volcanoes, contribute substantially to the global sulfur budget, anthropogenic sources dominate in highly industrialized and populated regions [13]. The spatial and temporal variability of SO2 concentrations near industrial facilities highlights the necessity for continuous monitoring and targeted mitigation strategies. Understanding SO2 emissions at the local and regional scales is particularly important given the strong spatial heterogeneity of their impacts. Areas near power plants often experience short-term peak exposures that are not always captured by regional monitoring networks [14]. This is especially relevant in developing regions, where monitoring infrastructure is limited, and industrial activities are expanding rapidly to meet energy and economic growth demands [15]. Consequently, localized assessments of SO2 emissions and dispersion patterns are critical to identify pollution hotspots, assess compliance with air quality standards, and design effective control measures.
Accurate measurement and monitoring of SO2 emissions from industrial sources are essential for understanding their magnitude, temporal variability, dispersion, and impacts. These assessments provide the basis for evaluating compliance with environmental standards, designing emission control strategies, and protecting public health. Furthermore, dispersion modeling of SO2 emissions complements observational data by simulating their transport and dilution in the atmosphere, allowing for the assessment of downwind concentration profiles and exposure levels over time and space [16,17]. By integrating measurement and modeling approaches, researchers and policymakers can better predict the effects of emissions under varying meteorological and topographical conditions, ultimately supporting evidence-based decision-making. Industrial SO2 emissions remain a major contributor to air pollution, with well-documented health, environmental, and climatic effects. Monitoring these emissions through reliable measurement techniques and robust dispersion modeling is fundamental for assessing their impacts and informing effective management policies. Despite notable progress in reducing SO2 emissions in some parts of the world, persistent high levels in many regions underscore the need for continued research and monitoring efforts, particularly in areas where data remain scarce.
Therefore, the aim of this study is to assess SO2 emissions from power plants in Baja California Sur, Mexico, by estimating plume concentrations and fluxes using ground-based remote sensing measurements with a UV camera. Additionally, we model the dispersion of SO2 in the surrounding environment using the AERMOD software (version 24.0.112), with the goal of characterizing the spatial and temporal distribution of these emissions and evaluating their potential impacts on regional air quality. The findings contribute to the understanding of industrial pollution dynamics in semi-arid regions, providing valuable information to support local air quality management and mitigation strategies.

2. Materials and Methods

2.1. Study Area and Field Campaign

The city of La Paz (24°08′32″N, 110°18′39″W) is the capital of Baja California Sur, with a population of approximately 272,711 inhabitants (Figure 1A), according to the 2015 census by the National Institute of Statistics and Geography [18]. The region has a predominantly arid environment, classified as very dry semi-warm, with an annual average temperature ranging between 22 °C and 24 °C [19]. Rainfall is scarce, with an annual average of less than 100 mm, concentrated between July and September. The average annual evaporation is around 215 mm, and relative humidity ranges from 62% to 70%. The local wind regime exhibits two dominant seasonal patterns: from April to October, morning winds are predominantly from the southeast and afternoon winds from the southwest; during the rest of the year, winds shift to the northwest and south directions [20]. The second site, Puerto San Carlos (24°47′22″N, 112°6′30″W), is a small coastal community located in the municipality of Comondú, Baja California Sur, on the shores of Magdalena Bay (Figure 1B). While specific meteorological data for Puerto San Carlos are less detailed, the area shares the arid to semi-arid climatic conditions of the Baja California peninsula, with high evaporation rates, low precipitation, and seasonal wind patterns influenced by the Pacific Ocean. Its geographic location and lower population density make it representative of a more rural industrial setting.
The field campaign was carried out between 15 and 22 June 2022, covering the two facilities: the Punta Prieta Power Plant (CTPP) in La Paz and the Agustín Olachea Internal Combustion Power Plant (CCI AO) in Puerto San Carlos. Measurements at CTPP were conducted on 17 June 2022, while measurements at CCI AO were carried out on June 19, 2022. The measurement dates were selected within the June 2022 campaign to coincide with the early summer season, a period of increased electricity demand in Baja California Sur, ensuring that plant activity was representative of peak operating conditions. Additionally, meteorological forecasts indicated stable conditions (clear sky and moderate winds), which favored both UV camera measurements and dispersion modeling.
The CTPP operates with two main stacks. Based on visual inspection and field photogrammetry, the stacks have an estimated height of ~50 m and an outlet diameter of ~2 m. The CCI AO power plant is characterized by smaller-scale combustion units. In the absence of publicly available technical specifications, indicative values consistent with plants of similar capacity were considered: a stack height of approximately 35 m and an outlet diameter of ~1.5 m. These values are reported for comparative context, although the dispersion modeling relied on field-derived SO2 fluxes and meteorological parameters rather than nominal stack characteristics.
In both cases, each measurement session lasted approximately one hour per site. The field instrumentation included a UV camera, a laptop computer, an inverter, and a battery power supply. Images were acquired in raw black-and-white format using Maxim XL software (version 5), with post-processing performed in the laboratory using a Python-based (version 3.13.5) retrieval algorithm developed in-house. Observation sites were chosen based on the following criteria: (1) the camera’s viewing angle was nearly perpendicular to the plume direction; (2) sufficient open-sky background was available behind the plume; (3) the sun was positioned overhead or behind the camera to minimize stray light; and (4) absence of clouds in the plume path. During fieldwork, a cardboard collimator was used on the camera to reduce direct and scattered sunlight on the lens, further improving image quality. A canopy tent was also set up at each site to protect the equipment, particularly the camera and computers, from direct solar radiation and overheating. The use of the canopy also helped reduce internal noise in the UV camera (dark current) and prevented saturation of the spectral images.

2.2. Emission Inventory of Power Plants

Among the main emission sources in Baja California Sur are the electricity generation plants operated by the Comisión Federal de Electricidad (CFE). The state has three major power plants, two internal combustion power plants and one thermoelectric power plant. Of these, two are located in the municipality of La Paz: CTPP, with an installed capacity of 155 MW supplying approximately 26% of total demand, and the Baja California Sur Internal Combustion Power Plant (CCI BCS), with an installed capacity of 235.6 MW supplying approximately 42% of total demand. The third facility, the CCI AO, is located in the fishing community of Puerto San Carlos, in the municipality of Comondú, with an installed capacity of 77.6 MW and supplying approximately 20% of total demand [21,22].
The emission data reported for CCI BCS and CTPP were obtained from the Emission Inventory for La Paz, Baja California Sur [21]. The values presented in the inventory were calculated following the INECC and SEMARNAT methodologies for emission inventories and estimates from stationary sources, using 2010 as the base year (Table 1). Emissions were estimated based on emission factors, which relate the amount of a pollutant released to the activity generating it over a given time period.
In addition, emissions reported in the Annual Operation Certificates (COA), calculated and published by Rivera-Cárdenas et al. [23], were also considered. The COA-based estimates (Table 2) were derived using activity data, emission factors, and the efficiency of emission control systems, where applicable. For the power plants, activity data correspond to the fuel consumption of each generation unit as well as other auxiliary equipment. It is important to note that, among the three main power plants presented in this inventory, only the SO2 emissions from the CTPP and the CCI AO were directly measured in the field using the UV camera method as part of this study. Emission data for the CCI BCS were obtained from existing inventories and literature sources.

2.3. UV Camera

The UV (or SO2) camera is a passive, ground-based remote sensing instrument that exploits solar ultraviolet radiation at specific wavelengths to detect and quantify atmospheric SO2. By simultaneously acquiring images at two wavelengths and applying differential absorption principles based on the Beer–Lambert law, the camera calculates the optical density (OD) of the plume and generates two-dimensional maps of the SO2 slant column density (SCD). The apparent absorbance (τAA) of SO2 is calculated from the measured OD at two interference filters as:
τ A A = τ F 1 τ F 2 = l n I 0 I F 1 l n I 0 I F 2
where F1 and F2 are the two interference filters, I0 is the background light intensity, and I is the measured intensity. Once the τAA and the calibration factor are obtained, the SO2 SCD can be derived. The SO2 flux (Φ) is then computed by integrating the SCD across the plume cross-section (l):
Φ ( l ) = f 1 S S O 2 · v e f f · d p i · Δ s
where f is the focal length of the lens, m denotes the pixel interpolation across the two-dimensional image, veff is the effective plume speed, dpi is the optical path step, and Δs is the integration path length increment. The estimation of SO2 flux is typically implemented within a retrieval algorithm known as Optical Flow (OF) [36], which uses sequential images to estimate plume and wind velocities. During image acquisition, user-controlled parameters include the exposure time, lens aperture diameter, calibration cell frequency, and the selection of band-pass filters. This instrument is widely applied to both volcanic and industrial SO2 measurements [37,38].
In this study, a Quantum Scientific Imaging (QSI) UV camera, model RS, with a 1.6-megapixel Kodak KAF-1603ME CCD sensor was used. The CCD chip is equipped with a microlens array optimized for UV applications in the 250–450 nm range. The camera features a 5-position automatic filter wheel, fitted with two Andover Optics band-pass filters centered at 310 nm and 330 nm, each with a full width at half maximum (FWHM) of 10 nm. A UG340 cut-off filter was also used during measurements to block stray ultraviolet radiation, defined as electromagnetic radiation outside the target absorption band. The camera was operated from a laptop computer running a Visual Basic (VB) script for acquisition and a Python-based processing algorithm. Table 3 summarizes the main parameters of the UV camera.
For SO2 measurements, two band-pass filters are essential: one centered at 310 nm, where SO2 strongly absorbs, and another at 330 nm, outside the SO2 absorption region, serving as the background. Background SO2 concentrations were not explicitly subtracted, since the differential imaging technique using two band-pass filters (310 nm and 300 nm) effectively cancels background interferences. This approach isolates the absorption signature of SO2 in the plume, ensuring that the retrieved slant column densities are not biased by ambient concentrations. This configuration allows for an accurate estimation of SO2 absorption while minimizing interferences from aerosols and other atmospheric species. Aerosols, in particular, can scatter incoming radiation and increase measurement uncertainty [37].
The UV camera was calibrated in the field at the measurement sites using five reference calibration cells filled with pure SO2 at different concentrations (493, 987, 2497, 4135, and 6060 ppm·m). During calibration, the objective of the camera was pointed toward a clear-sky section to provide a uniform background, and the exposure time was adjusted to optimize image contrast and avoid sensor saturation. This procedure ensured an accurate conversion between optical density and SO2 slant column density (SCD) values under the same atmospheric and illumination conditions as those of the actual plume measurements.

2.4. Error Analysis

The uncertainty in the slant column density (SCD) was estimated as the root mean square (RMS) of pixel intensities in a background area outside the plume, representing instrumental and atmospheric noise. The relative uncertainty in the SCD was calculated as:
δ S C D = σ S C D S C D
where SCD is the mean SCD within the plume and σSCD is the RMS. This provides a direct measure of the noise level in the camera signal and is reported alongside the flux as an indicator of measurement reliability.
The uncertainty in the calculated SO2 flux was estimated by propagating the main sources of error in the measurement process. The total SO2 flux (F) was determined by integrating the SCD (in ppm·m) measured across the plume and multiplying it by the perpendicular wind speed (v) at plume height:
F ( x ) = S C D x , y · v x , y · d s
The main sources of uncertainty in this calculation are the instrumental noise of the UV camera, the radiometric calibration, and the wind speed. Among these, the wind speed (σv) is recognized as the dominant source of error, given its direct and linear effect on the flux value and the typical difficulty in accurately measuring or estimating it at plume altitude and direction. The absolute uncertainty of the flux (σF) was calculated by propagating the pixel-by-pixel contributions of the uncertainties quadratically:
σ F = i , j σ S C D · v i , j 2 + S C D i , j · σ v 2
where i,j indexes the pixels across the plume. In practice, the RMS was calculated from regions without visible plume signal, typically in the corners of the image, and was applied uniformly to all pixels as the SCD uncertainty.
This detailed approach to uncertainty estimation in both SCD and flux has been applied in previous studies of SO2 measurements with UV cameras and is recommended for properly assessing the dominant contributions of instrumental noise and wind speed errors [39,40].

2.5. Air Dispersion Modeling

Atmospheric dispersion of SO2 emissions from the two measured power plants was simulated using the AERMOD modeling system (Lakes Environmental™, Waterloo, ON, Canada; https://www.weblakes.com/ (accessed on 30 August 2025)), a steady-state Gaussian plume model widely used for regulatory and research applications. AERMOD is designed to estimate the short-range dispersion of pollutants (source–receptor distances up to 50 km) within the planetary boundary layer (PBL), which governs the transport, mixing, and dilution of pollutants in the lower atmosphere [41]. Its algorithm accounts for terrain complexity, plume rise, buoyancy effects, building downwash, and surface–atmosphere interactions, while assuming that pollutants behave inertly during transport. The model does not incorporate chemical transformations or reactions between atmospheric compounds, making it suitable for primary pollutant assessments such as SO2 [42].
The modeling required an emission inventory including source strength (SO2 concentration and flux measured in this study), geographic coordinates, stack elevation, gas exit temperature, stack diameter, and exit velocity. After preliminary tests, a modeling radius of 3 km around each source was selected to optimize resolution and minimize errors due to the coastal and complex terrain characteristics of the study area. The dispersion simulations were configured to correspond to the same periods as the UV camera field measurements. In each case, the average SO2 flux derived from the observations and the wind parameters estimated from sequential plume images were used as model inputs. The maps shown in Section 3.4 represent the standard AERMOD output, which does not include a coordinate grid; to facilitate interpretation, scale bars were added to indicate plume extent and concentration ranges. AERMOD was implemented together with its meteorological and terrain preprocessors: AERMET and AERMAP, respectively. AERMET processes on-site and regional meteorological data, producing boundary layer parameters such as friction velocity, mixing height, and heat fluxes, which are required by AERMOD to simulate atmospheric turbulence and stability. In this study, hourly wind speed and direction measurements, along with surface meteorological variables, were collected from a nearby monitoring station and processed through AERMET to characterize the dispersion conditions. AERMAP, in turn, utilizes high-resolution digital elevation data (GeoTIFF format, 30 m resolution) to define the receptor grid and represent the topographic influence on plume behavior [43].
Dispersion results were calculated at a receptor height of 1.5 m above ground level (AGL), consistent with typical breathing height for human exposure assessments. Individual dispersion maps were generated for each source and measurement period, with scales adjusted to reflect the range of predicted concentrations.

3. Results

3.1. Descriptive Statistics of SO2 Emissions

These results of CTPP and CCI AO power plant are summarized in Table 4, which presents the descriptive statistics for both the SCD and the SO2 flux. The measurements provide a detailed characterization of the SO2 emissions during the campaign, highlighting both the magnitude and variability of the pollutant under operational and meteorological conditions representative of typical plant activity.

3.2. CTPP Power Plant

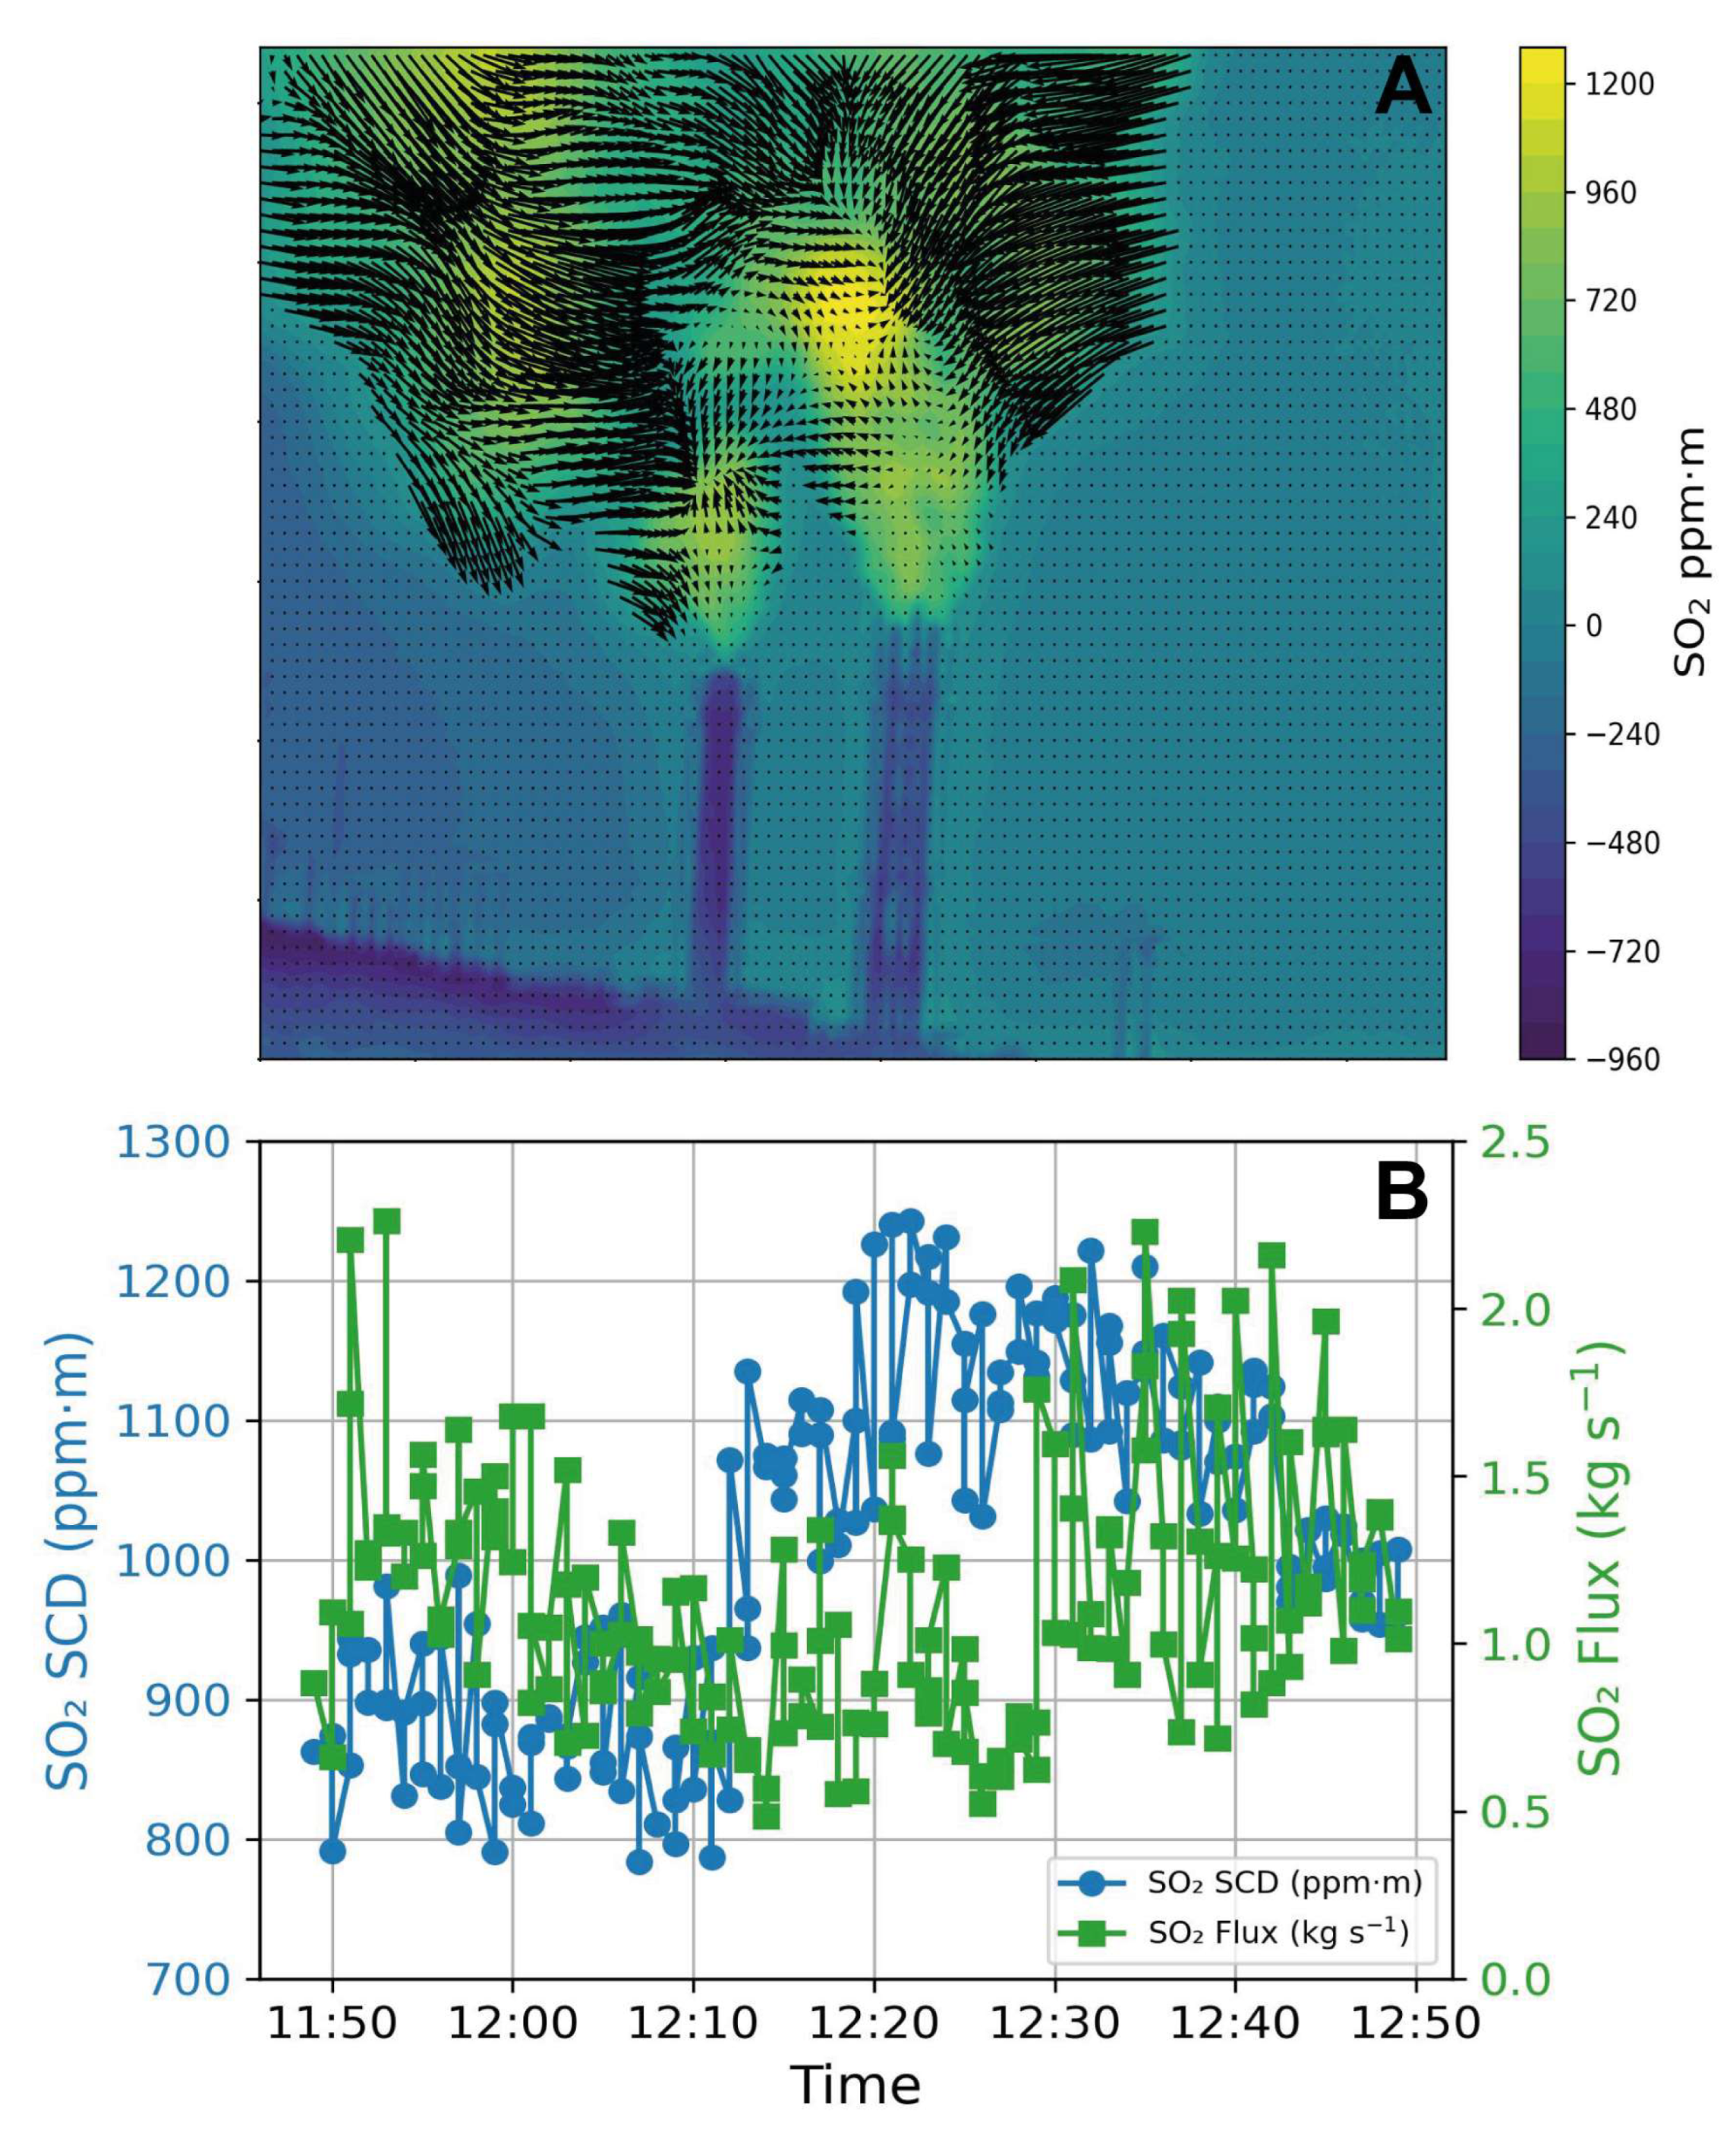
The SO2 plume emitted by the CTPP was captured using the UV camera operating at 310 nm, revealing its spatial distribution and wind structure (Figure 2A). The spectral image clearly delineates the two emission stacks, with their respective plumes extending downwind under the influence of the prevailing winds. The SO2 SCD, expressed in ppm·m, is color-coded, with the highest concentrations concentrated directly above the emission points. The plume exhibits a heterogeneous distribution, with peak SCD values exceeding 1200 ppm·m near the stacks and progressively decreasing as the plume disperses into the atmosphere. The superimposed wind vectors, obtained from the Optical Flow algorithm, shows a complex and heterogeneous pattern, with notable directional changes and localized perturbations, indicating variable flow conditions rather than a steady horizontal regime during the measurement period.
The time series of SO2 SCD and SO2 flux was recorded over approximately one hour at CTPP, showing the temporal variability of the emissions (Figure 2B). The SO2 SCD time series reveals noticeable fluctuations around a mean value of 1009.2 ppm·m, with a maximum of 1242.8 ppm·m and a minimum of 784.1 ppm·m. The variability, characterized by a standard deviation of 125.9 ppm·m, reflects short-term changes in the plume structure and emission intensity, likely influenced by transient variations in combustion processes and plume dynamics. The median SCD value was slightly higher than the mean (1020.1 ppm·m), suggesting a distribution skewed toward higher concentrations during some intervals. The SO2 flux time series shows a similar pattern of variability, with a mean of 1.13 kg/s, maximum and minimum values of 2.26 kg s−1 and 0.49 kg s−1, respectively, and a standard deviation of 0.39 kg s−1. The flux shows a median value of 1.06 kg s−1, indicative of intermittent peaks in emission rate, possibly associated with operational cycles of the power plant. The average wind speed derived from the analysis of sequential spectral images during the observation period was estimated at 3.6 m s−1, consistent with the uniform wind direction inferred from the wind vectors. The coherent orientation and magnitude of the wind vectors suggest stable atmospheric conditions, which facilitated plume transport and allowed for reliable flux estimation.
Error analysis of the measurements indicates that the estimated RMS noise in the background was 40.2 ppm·m, while the mean SCD in the plume was 356.6 ppm·m, yielding a relative SCD error of 11.3%. The relative uncertainty in wind speed estimation was 5.1%, translating into a propagated relative flux error of 12.4%. Accordingly, the mean SO2 flux for CTPP was reported as 1.13 ± 0.14 kg s−1, encompassing both instrumental and algorithmic uncertainties.

3.3. CCI AO Power Plant

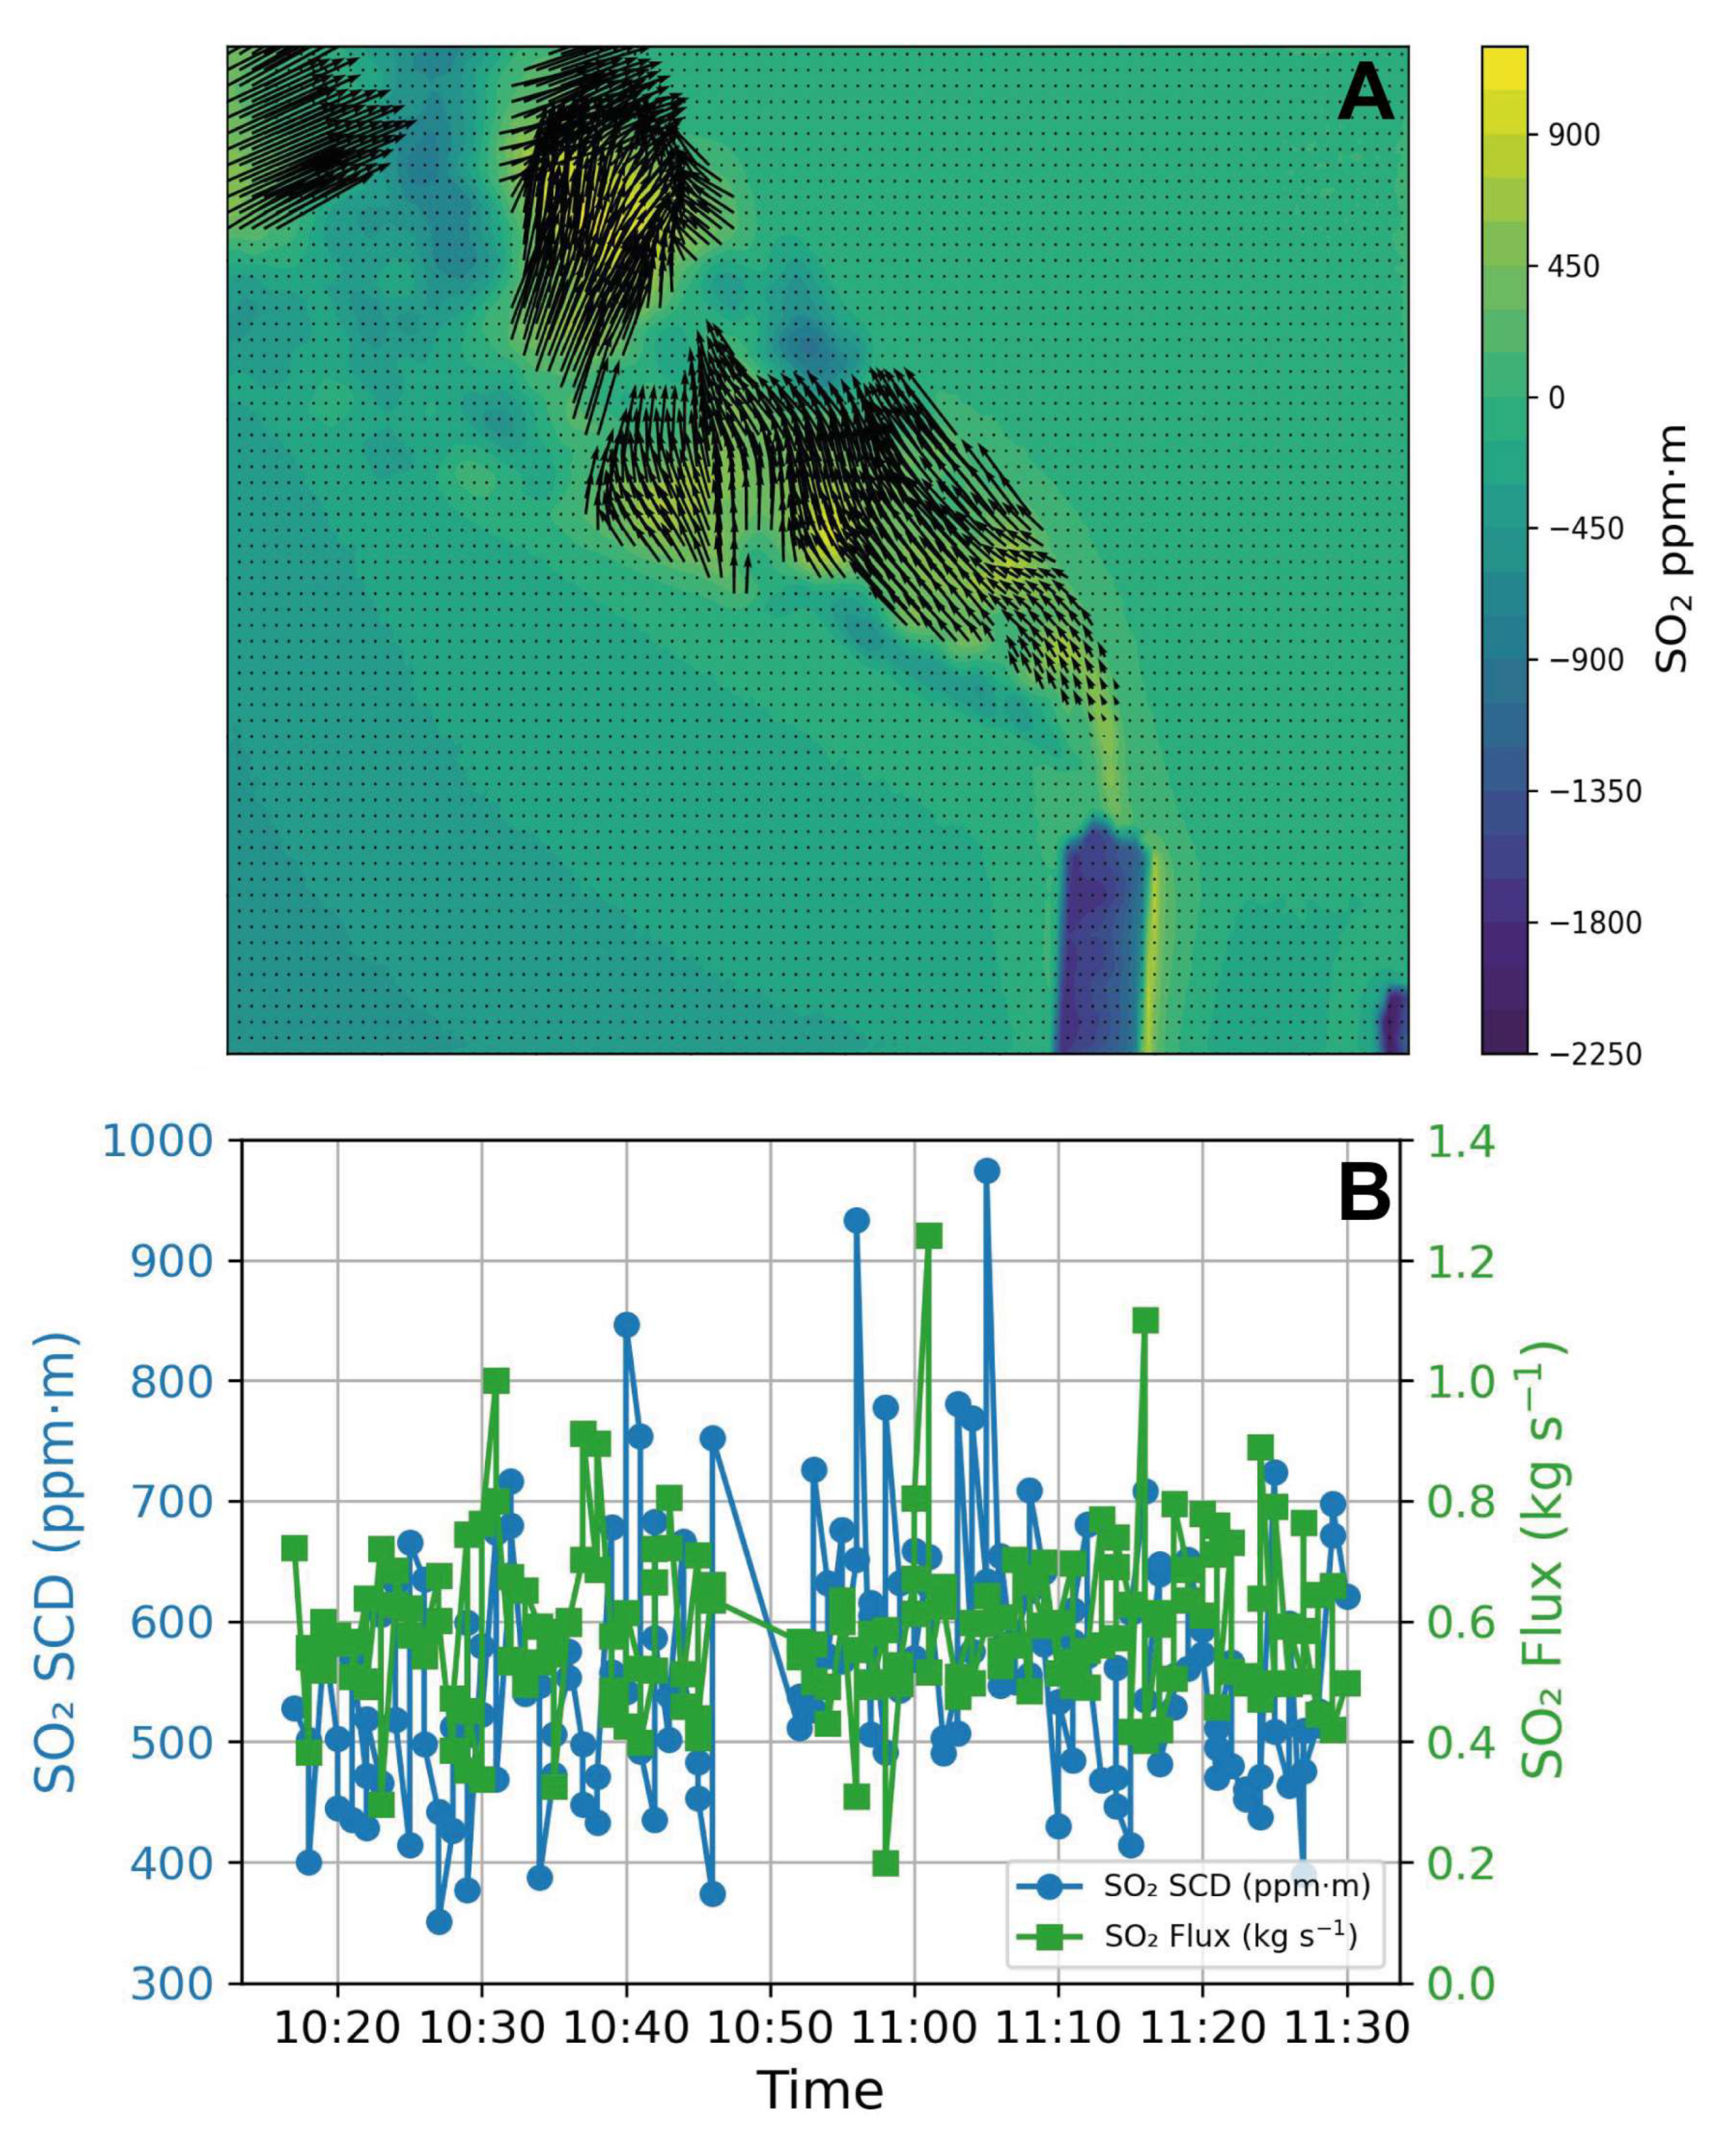
The SO2 plume emitted by the CCI AO was captured using the UV camera operating at 310 nm, revealing its spatial distribution and wind structure (Figure 3A). The spectral image clearly delineates the single emission stack, with the plume extending downwind under the influence of the prevailing winds. The SO2 SCD, expressed in ppm·m, is color-coded, with the highest concentrations concentrated directly above the emission point. The plume exhibits a heterogeneous distribution, with peak SCD values exceeding 900 ppm·m near the stack and progressively decreasing as the plume disperses into the atmosphere. The superimposed wind vectors, derived from the analysis of sequential spectral images, show a predominantly eastward flow with significant local directional variability and vertical components, suggesting a non-uniform wind structure rather than a strictly steady and homogeneous regime during the measurement period.
The time series of SO2 SCD and SO2 flux was recorded over approximately one hour at CCI AO, showing the temporal variability of the emissions (Figure 4B). The SO2 SCD time series reveals noticeable fluctuations around a mean value of 559.4 ppm·m, with a maximum of 974.5 ppm·m and a minimum of 350.5 ppm·m. The variability, characterized by a standard deviation of 103.1 ppm·m, reflects short-term changes in the plume structure and emission intensity. The median SCD value was slightly lower than the mean (549.3 ppm·m), indicating a relatively symmetric distribution of concentrations during the measurement period. The SO2 flux time series shows a similar pattern of variability, with a mean of 0.59 kg s−1, maximum and minimum values of 1.24 kg s−1 and 0.20 kg s−1, respectively, and a standard deviation of 0.14 kg s−1. The flux shows a median value of 0.57 kg s−1, suggesting modest but consistent emission rates with occasional peaks. The average wind speed derived from the analysis of sequential spectral images during the observation period was estimated at 2.2 m s−1, consistent with the uniform wind direction inferred from the wind vectors. The coherent orientation and magnitude of the wind vectors support the stability of the atmospheric conditions, enabling reliable plume tracking and flux calculation.
Error analysis of the measurements indicates that the estimated RMS noise in the background was 17.7 ppm·m, while the mean SCD in the plume was 266.9 ppm·m, yielding a relative SCD error of 6.6%. The relative uncertainty in wind speed estimation was 5.1%, translating into a propagated relative flux error of 8.4%. Accordingly, the mean SO2 flux for CCI AO was reported as 0.59 ± 0.06 kg s−1, accounting for both instrumental and algorithmic uncertainties.

3.4. SO2 Dispersion Modeling

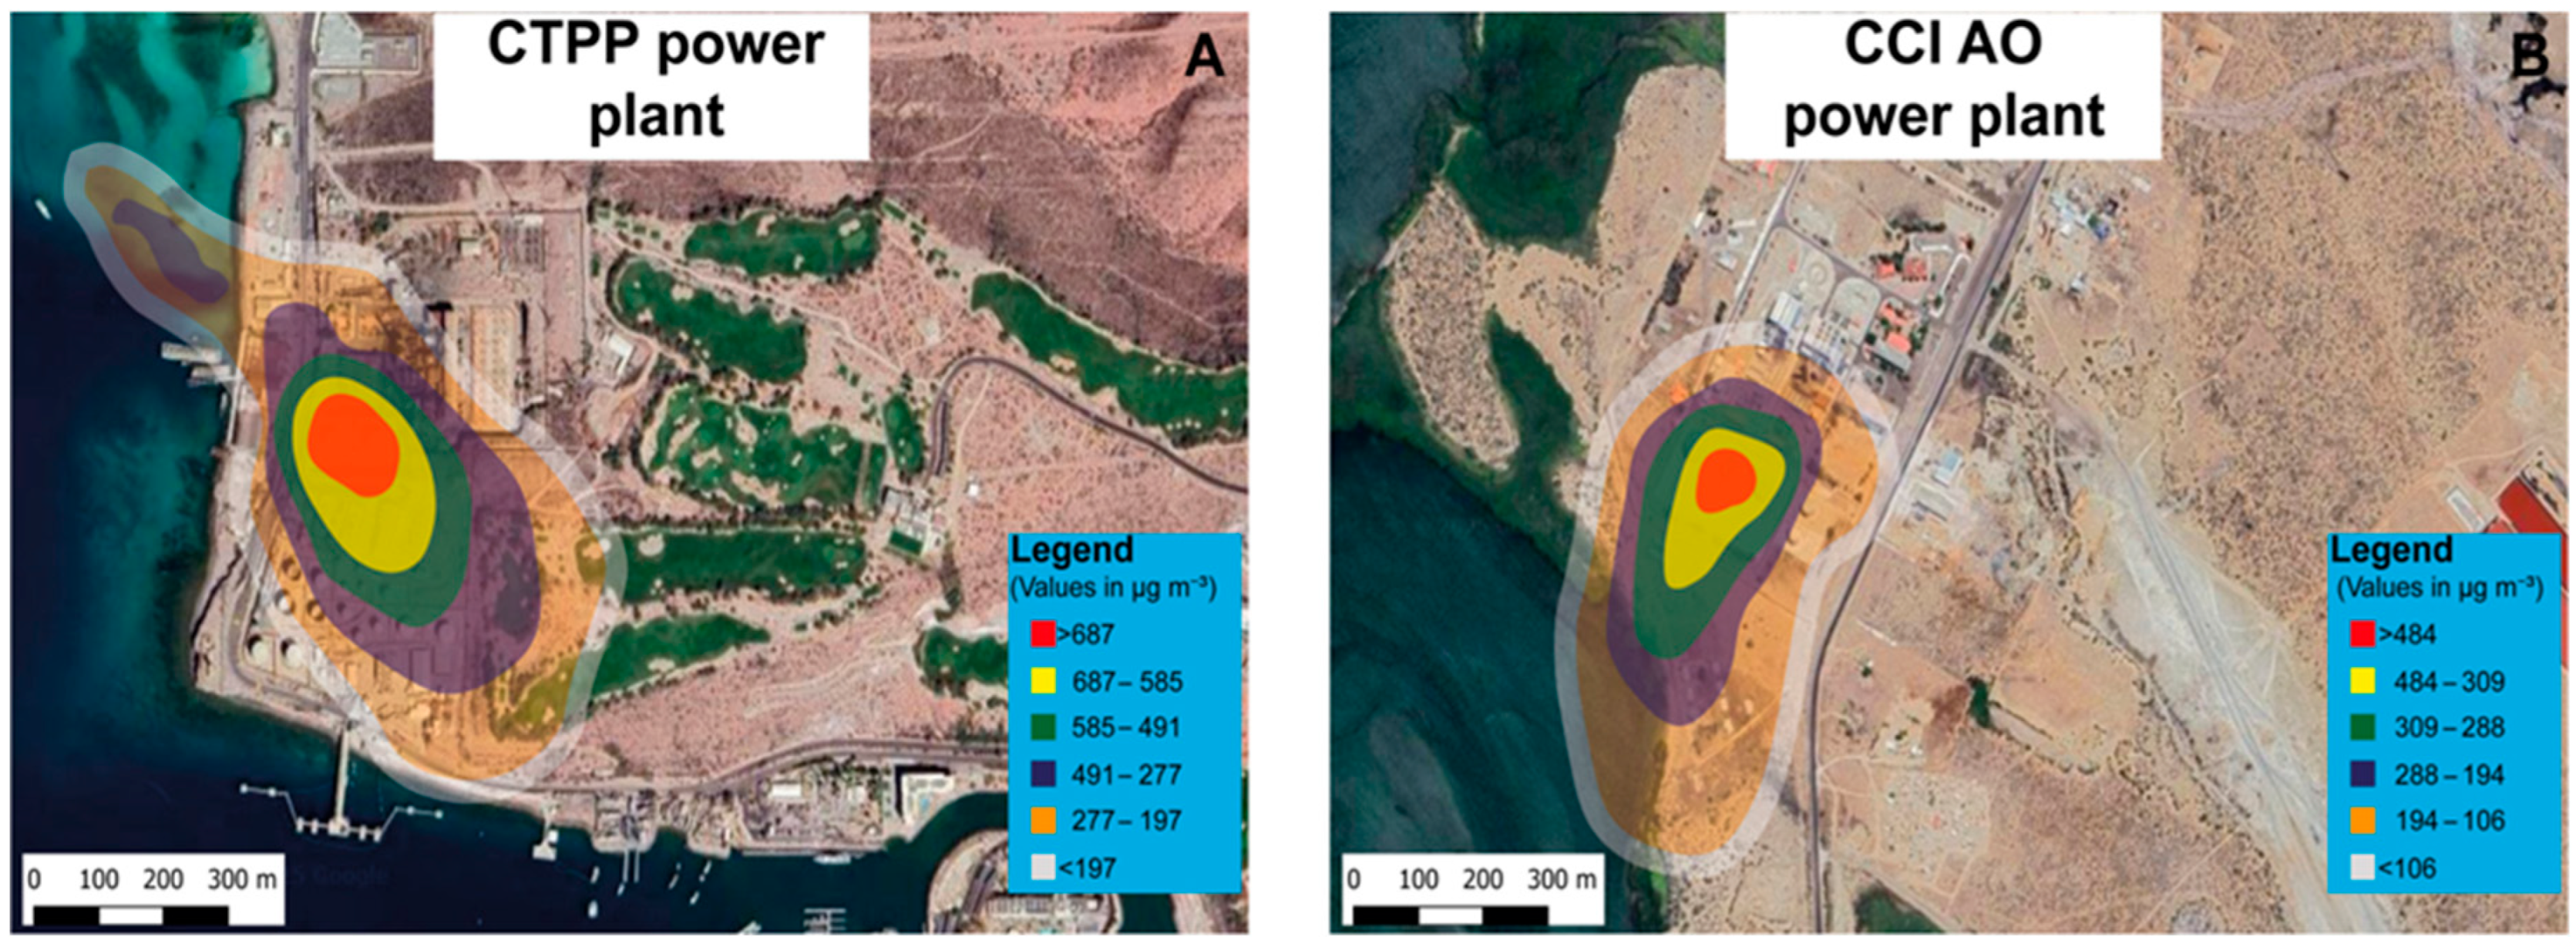
The dispersion of measured SO2 emissions from the CTPP and CCI AO power plants was simulated using the AERMOD model to evaluate the spatial distribution of ground-level concentrations in the vicinity of the facilities under typical operational and meteorological conditions. The output concentration fields are presented in Figure 4A (CTPP) and Figure 4B (CCI AO), where color-coded contours indicate different concentration ranges in µg m−3.
For the CTPP power plant (Figure 4A), the highest modeled SO2 concentrations were located directly downwind of the stacks, with a maximum ground-level concentration exceeding 687 µg m−3 (red contour). The plume exhibited a clear elongation in the prevailing wind direction, showing a gradual decrease in concentration with increasing distance from the emission source. Intermediate concentration ranges between 687 and 585 µg m−3 (yellow) and 585 to 491 µg m−3 (green) were observed within a few hundred meters of the plant, while the lowest modeled concentrations below 197 µg m−3 beyond the immediate surroundings of the facility. The spatial pattern of the plume reflects the influence of wind speed, direction, and the plant’s emission rate.
In the case of the CCI AO power plant (Figure 4B), the maximum ground-level SO2 concentration modeled was slightly lower, exceeding 484 µg m−3 (red contour) in the immediate downwind area. The plume was more confined compared to CTPP, consistent with the lower emission rate and different wind conditions at this site. Intermediate concentration levels between 484 and 309 µg m−3 (yellow) and 309 to 288 µg m−3 (green) were present close to the plant, while concentrations below 106 µg m−3 extended over a wider area downwind. The plume morphology shows a narrower footprint, indicating less dispersion compared to CTPP.

4. Discussion

The results of this study provide a comprehensive characterization of SO2 emissions from two power plants in Baja California Sur, highlighting both the magnitude of emissions and their spatial dispersion. The ground-based UV camera measurements revealed clearly distinguishable plume dynamics at each facility, underscoring how local conditions and plant-specific factors influence the emissions’ intensity and behavior. The estimated SO2 plume concentrations and fluxes showed significant differences between the two plants, with CTPP exhibiting consistently higher emission rates compared to CCIAO. These differences are consistent with the observed operational characteristics of each facility: CTPP is a larger plant, operating at higher capacity and using fuels with higher sulfur content, while CCIAO operates at a smaller scale with comparatively lower combustion rates. Such variability has been well documented in the literature, with larger coal- or oil-fired power plants typically producing greater SO2 emissions due to higher fuel throughput and less efficient pollution controls [15,44]. It should be noted that the field campaign was conducted under relatively stable meteorological conditions, characterized by clear skies and moderate winds. These conditions favored plume visualization with the UV camera and ensured reliable dispersion modeling. While factors such as precipitation, long-range transport, and seasonal variability can further influence air quality, they were beyond the scope of this episode-based study.
In addition to plant capacity and fuel type, meteorological factors and stack configuration likely contribute to the observed differences. Higher exit velocities and stack temperatures can enhance plume rise and initial dispersion, temporarily reducing ground-level concentrations near the source [39]. Conversely, plants with lower stack heights or cooler exhaust gases may produce plumes that stay closer to the ground, increasing localized exposure [15]. These site-specific characteristics explain not only the differences in absolute emission rates but also the spatial patterns of SO2 dispersion observed in the AERMOD simulations. The variability observed between CTPP and CCI AO highlights the importance of conducting plant-level assessments rather than relying solely on generalized emission factors, which may underestimate or mischaracterize local pollution burdens [45]. The calculated mean annual emissions were approximately 36,136 tons per year (t yr−1) for CTPP and 18,408 tons per year for CCI AO. At CTPP, emissions ranged from a minimum of 15,326 t yr−1 to a maximum of 71,310 t yr−1, with a standard deviation of 12,602 t yr−1 and a median of 33,453 t yr−1. At CCI AO, emissions ranged from 6264 t yr−1 to 39,117 t yr−1, with a standard deviation of 4358 t yr−1 and a median of 17,888 t yr−1. These estimates were derived directly from the UV camera measurements conducted during the monitoring campaign and reflect real-time plant performance during the sampling period. It is important to note that these measurements coincided with the summer months, when energy demand from the population and industrial activities is typically highest in the region. Consequently, the observed emissions likely represent peak operating conditions, and annual averages may vary depending on seasonal demand and plant operating schedules throughout the year. When compared to the most recent official emission inventory reported in Table 2 [23], which lists 23,971 t yr−1 for CTPP and 6634 t yr−1 for CCIAO in 2022, the UV camera-based estimates are markedly higher, corresponding to increases of 33.6% and 63.9%, respectively. The discrepancies between the reported values are mainly attributed to differences in monitoring techniques and in the treatment of wind speed for flux calculations. The measurements reported by Rivera-Cárdenas et al. [23] using mobile mini-DOAS were obtained by driving around the power plants, where this technique generally samples the more diluted portions of the plume and the wind speed was taken from a nearby meteorological station. In contrast, the UV camera method captures images of the densest section of the plume and, through the optical flow algorithm applied to sequential images, directly derives the plume transport velocity. The dilution effect, which can be a significant source of uncertainty for the UV camera technique [37], is considered negligible in this case given the short distance (~200 m) between the camera and the stack. It is important to note that the UV camera–derived SO2 fluxes represent short-term episodic measurements and therefore tend to capture higher values than those reported in official inventories. Inventories and COA-reported values are typically based on fuel consumption data and emission factors, which smooth out short-term variability and may underestimate peak emissions. By contrast, UV camera observations directly quantify plume dynamics under operating conditions, providing upper-bound estimates that complement inventory-based averages. Similar discrepancies have been reported using other UV spectroscopy techniques, such as mini-DOAS, which also measured higher SO2 concentrations compared to COA data. This consistency across independent optical methods reinforces the interpretation that inventory values may underestimate actual short-term emissions.
When compared with previously published ground-based measurements of SO2 emissions at other power plants worldwide (Table 5), the fluxes derived in this study fall within the higher range of reported values. Previous studies at fuel-oil power plants in Montevideo, Uruguay, documented SO2 fluxes of about 0.32 kg s−1 [44], while a coal-fired facility in Bucharest, Romania, showed 715 ppm·m and 1.27 kg s−1 [46]. Fluxes of 1.11 kg s−1 were reported for a 2670 MW coal plant in Dezhou, China [47], and 1.29 kg s−1 for a fuel-oil plant in Kuwait [48]. Lower fluxes (~0.09 kg s−1) were observed in a 50 MW coal plant in Shandong, China [49], while the highest emissions to date (4.28 kg s−1) were recently reported for a 1605 MW fuel-oil plant in Tula, Mexico [50]. In comparison, our UV camera measurements yielded SO2 fluxes between 0.58 and 2.71 kg s−1 at CTPP and between 0.24 and 1.49 kg s−1 at CCIAO, confirming that both facilities contribute substantially to local SO2 pollution and exhibit emission rates comparable to medium- and large-scale fossil-fuel-fired power plants reported worldwide. These discrepancies can be attributed to several factors, including seasonal variability, differences in plant capacity, the type of fuel used, and the timing of the measurements. Fossil-fuel power plants do not operate at a constant load throughout the year; rather, they adjust their output according to energy demand, often reaching maximum capacity during periods of extreme heat or cold.
Consequently, the contribution of these facilities to atmospheric SO2 can vary substantially over time. These results emphasize the importance of complementing annual emission inventories with targeted field campaigns capable of capturing peak operational conditions and short-term emission episodes, thereby providing a more accurate and robust basis for regulatory assessments and mitigation strategies. In addition to the anthropogenic plumes measured at the power plants, the UV camera system also captured SO2 emissions from a ship plume [51], demonstrating the applicability of this technique to other point sources. The use of UV cameras for SO2 emission quantification has been widely adopted in natural environments, particularly at active volcanoes, where emission rates can be significantly higher than those observed in industrial facilities. For example, studies at Etna (Italy) and Guallatiri (Chile) reported fluxes several times larger than those documented here [52]. In contrast, relatively low SO2 fluxes have been observed at Stromboli (Italy), reflecting its more modest eruptive activity [53]. Unlike power plants, where emission variability is strongly linked to fuel type, operational load, and demand, the differences in volcanic SO2 output are primarily governed by geodynamic context, tectonic setting, and the magmatic processes feeding each system.
The dispersion modeling results further illustrate the spatial impact of these emissions under prevailing meteorological conditions. AERMOD simulations indicated that the highest SO2 concentrations are confined to areas immediately surrounding the power plants, with workers on site being the most exposed population. This finding aligns with prior studies showing that occupational exposure at plant facilities is a critical concern [54]. At greater distances, the plume becomes progressively diluted depending on wind speed and direction, significantly lowering SO2 concentrations by the time it reaches nearby cities. La Paz, located approximately 9 km from CTPP, and Puerto San Carlos, about 3.3 km from CCIAO, are both affected by the plume; however, model outputs suggest that the concentrations at these distances are lower than those at the source but remain significant, particularly under unfavorable meteorological conditions. Despite the dilution effect, the maximum simulated SO2 concentrations at both facilities exceeded international and national air quality standards. According to the World Health Organization (WHO) guidelines, the recommended daily mean SO2 concentration should not exceed 40 µg m−3, and the 10-min mean should remain below 500 µg m−3 [6]. Similarly, Mexican standards [55] set limits of 104.8 µg m−3 for the 24-h mean and 196.5 µg m−3 for the 1 h mean. In our simulations, peak concentrations at the plant boundaries and immediate surroundings surpassed both the WHO and Mexican limits, particularly during periods of atmospheric stability and low wind speeds, when dispersion is limited. Our evaluation was limited to the averaging times defined by current standards (hourly and daily means). While these metrics are useful for regulatory purposes, they do not capture the short-term peak concentrations that may occur over intervals of only a few minutes. Such acute peaks could be particularly relevant for occupational exposure at the facilities and for nearby communities. Addressing this aspect would require continuous monitoring or high-resolution modeling specifically configured for shorter averaging times, which was beyond the scope of the present work. We therefore suggest that future research should incorporate short-term averaging periods (e.g., 10 min) to better assess acute exposure risks. This result underscores the urgent need for effective emission control strategies to reduce workers’ exposure and minimize downwind impacts on neighboring communities. Moreover, thermoelectric facilities emit not only SO2 but also other pollutants such as NOx, particulate matter (PM), and volatile organic compounds (VOCs). Although our study focused exclusively on SO2 due to methodological constraints, combined exposure to multiple pollutants may exacerbate adverse health outcomes, particularly respiratory and cardiovascular effects. Future studies should therefore adopt a multi-pollutant perspective, integrating monitoring and modeling of co-emitted species to provide a more comprehensive evaluation of air quality impacts.
The findings of this study have important implications for regional air quality management and public health. The identification of power plant workers as the most exposed population highlights the necessity for workplace monitoring and protective measures. Furthermore, while concentrations in La Paz and Puerto San Carlos are lower than at the plant boundaries, they remain a source of concern given their potential to contribute to long-term health effects and cumulative pollution burdens. Similar patterns of localized high exposures have been reported in other studies of coal-fired power plants [50], confirming that even with plume dilution, nearby communities remain vulnerable. It should be emphasized that the field campaigns covered only short-term episodes (approximately one hour at each site). While these measurements were conducted under representative operating and meteorological conditions, they cannot account for seasonal or operational variability. Therefore, the results should be interpreted as episodic estimates rather than annual emission values. Future research should extend monitoring to longer timeframes and varied operational scenarios to refine annual emission inventories and health risk assessments.

5. Conclusions

This study presents a comprehensive evaluation of SO2 emissions from two power plants in Baja California Sur, Mexico, integrating direct field measurements with a UV camera and atmospheric dispersion modeling using AERMOD. The combination of methodologies allowed not only the quantification of emissions but also an assessment of their spatial distribution and potential impacts on air quality.
The results indicate that the CTPP exhibits significantly higher SO2 emissions and ground-level concentrations compared to the smaller CCI AO facility, reflecting differences in installed capacity and operational characteristics. Temporal and spatial analyses of the plume dynamics, derived from UV camera measurements, highlighted fluctuations in emission rates and plume morphology, influenced by both operational cycles and meteorological variability. Error analysis demonstrated acceptable uncertainties in the measurement and modeling procedures, confirming the reliability of the results. AERMOD simulations revealed that SO2 concentrations near the power plants often exceeded recommended thresholds established by the WHO and national standards, especially in the immediate downwind areas. This finding underscores the potential health risks to workers and nearby communities, particularly in semi-arid environments with limited atmospheric dispersion. Sequential spectral imaging techniques, combined with dispersion modeling, have proven to be an effective tool for real-time monitoring and regulatory assessment of industrial emissions. This integrated approach provides actionable information that can support policy decisions, improve emission inventories, and guide mitigation strategies. Continuous monitoring, investment in cleaner technologies, and the implementation of stricter emission limits are strongly recommended to reduce the environmental and health impacts of power generation in Baja California Sur.
Future work should expand the monitoring network, include other pollutants of concern, and assess long-term exposure risks to fully characterize the impacts of industrial air pollution in the region. In addition, conducting sampling campaigns throughout different periods of the year, encompassing both peak and reduced operational phases of the power plants, would enable a more precise estimation of the total annual pollutant emissions and provide a more comprehensive understanding of emission scenarios.

Author Contributions

Conceptualization, B.S. and W.S.; Data curation, B.S.; Formal analysis, B.S.; Methodology, B.S. and W.S.; Supervision, J.V.M. and R.R.-R.; Visualization, J.V.M. C.C.C.-A. and P.A.O.-F.; Writing—original draft, B.S.; Writing—review & editing, W.S. and J.V.M. All authors have read and agreed to the published version of the manuscript.

Funding

This research was funded by DGAPA UNAM with projects PAPIIT grant number IN106024.

Institutional Review Board Statement

This study did not require ethical approval.

Informed Consent Statement

Not applicable.

Data Availability Statement

The data presented in this study are available on request from the corresponding author.

Acknowledgments

The author acknowledges the CERCA group for their logistical and financial support in conducting this study. We also thank Alejandro Bezanilla for his technical support.

Conflicts of Interest

The authors declare no conflicts of interest.

References

  1. Sicard, P.; Agathokleous, E.; Anenberg, S.C.; De Marco, A.; Paoletti, E.; Calatayud, V. Trends in urban air pollution over the last two decades: A global perspective. Sci. Total Environ. 2023, 858, 160064. [Google Scholar] [CrossRef]
  2. Lin, Y.; Zhao, Y.; Zhang, Y.; Hong, Y.; Hattori, S.; Itahashi, S.; Fan, M.; Xie, F.; Zhao, Z.; Yu, M.; et al. China’s SO2 Emission Reductions Enhance Atmospheric Ozone—Driven Sulfate Aerosol Production in East Asia. Proc. Natl. Acad. Sci. USA 2025, 122, e2414064122. [Google Scholar] [CrossRef]
  3. Guttikunda, S.K.; Jawahar, P. Atmospheric emissions and pollution from the coal-fired thermal power plants in India. Atmos. Environ. 2014, 92, 449–460. [Google Scholar] [CrossRef]
  4. Zhao, X.; Shen, Z.; Han, F.; Bharti, B.; Feng, S.; Du, J.; Li, Y. Pollution Characteristics and Health Risk Assessment of Heavy Metals in PM2.5 in Fuxin, China. Environ. Geochem. Health 2024, 46, 511. [Google Scholar] [CrossRef]
  5. Xue, W.; Wang, L.; Li, X.; Xu, Q.; Yang, Z. The Impacts of Heat-Power Cogeneration on Air Pollution: An Empirical Study Based on the Measures for the Administration of Heat-Power Cogeneration Policy in China. J. Clean. Prod. 2025, 486, 144472. [Google Scholar] [CrossRef]
  6. WHO. WHO Global Air Quality Guidelines: Particulate Matter, Ozone, Nitrogen Dioxide, Sulfur Dioxide and Carbon Monoxide; World Health Organization: Geneva, Switzerland, 2021; Available online: https://www.who.int/publications/i/item/9789240034228 (accessed on 1 August 2025).
  7. Amann, M.; Klimont, Z.; Wagner, F. Regional and global emissions of air pollutants: Recent trends and future scenarios. Annu. Rev. Environ. Resour. 2013, 38, 31–55. [Google Scholar] [CrossRef]
  8. Schraufnagel, D.E.; Balmes, J.R.; Cowl, C.T.; Matteis, S.D.; Jung, S.H.; Mortimer, K.; Perez-Padilla, R.; Rice, M.B.; Riojas-Rodriguez, H.; Sood, A.; et al. Air pollution and noncommunicable diseases: A review by the Forum of International Respiratory Societies’ Environmental Committee. Chest 2019, 155, 409–416. [Google Scholar] [CrossRef] [PubMed]
  9. Pope, C.A.; Turner, M.C.; Burnett, R.T.; Jerrett, M.; Gapstur, S.M.; Diver, W.R.; Krewski, D.; Brook, R.D.; Arden Pope, C. Relationships between fine particulate air pollution, cardiometabolic disorders, and cardiovascular mortality. Circ. Res. 2018, 122, 1570–1595. [Google Scholar] [CrossRef] [PubMed]
  10. Likens, G.E.; Driscoll, C.T.; Buso, D.C. Long-term effects of acid rain: Response and recovery of a forest ecosystem. Environ. Pollut. 2022, 300, 118983. [Google Scholar] [CrossRef]
  11. Myhre, G.; Shindell, D.; Breon, F.M.; Collins, W.; Fuglestvedt, J.; Huang, J.; Koch, D.; Lamarque, J.F.; Lee, D.; Mendoza, B.; et al. Anthropogenic and natural radiative forcing. In Climate Change 2013: The Physical Science Basis. Contribution of Working Group I to the Fifth Assessment Report of the Intergovernmental Panel on Climate Change (IPCC AR5); Cambridge University Press: Cambridge, UK, 2013. [Google Scholar] [CrossRef]
  12. Fioletov, V.E.; McLinden, C.A.; Krotkov, N.; Li, C. Lifetimes and emissions of SO2 from point sources estimated from OMI. Geophys. Res. Lett. 2015, 42, 1969–1976. [Google Scholar] [CrossRef]
  13. Carn, S.A.; Fioletov, V.E.; McLinden, C.A.; Li, C.; Krotkov, N.A. A decade of global volcanic SO2 emissions measured from space. Sci. Rep. 2017, 7, 44095. [Google Scholar] [CrossRef]
  14. Chen, X.; Yang, T.; Wang, Z.; Hao, Y.; He, L.; Sun, H. Investigating the Impacts of Coal-Fired Power Plants on Ambient PM2.5 by a Combination of a Chemical Transport Model and Receptor Model. Sci. Total Environ. 2020, 727, 138407. [Google Scholar] [CrossRef]
  15. Kim, J.; Lee, G.; Jun, J.; Seo, B.-K.; Choi, Y. Quantification of SO2 and CO2 Emission Rates from Coal-Fired Power Plants in the Korean Peninsula via Airborne Measurements. Sci. Total Environ. 2025, 978, 179430. [Google Scholar] [CrossRef]
  16. Schaap, M.; Timmermans, R.M.A.; Roemer, M.; Boersen, G.A.C.; Builtjes, P.J.H.; Sauter, F.J.; Velders, G.J.M.; Beck, J.P. The LOTOS–EUROS Model: Description, Validation and Latest Developments. Int. J. Environ. Pollut. 2008, 32, 2. [Google Scholar] [CrossRef]
  17. Cimorelli, A.J.; Perry, S.G.; Venkatram, A.; Weil, J.C.; Paine, R.J.; Wilson, R.B.; Lee, R.F.; Peters, W.D. AERMOD: A dispersion model for industrial source applications. Part I: General model formulation and boundary layer characterization. J. Appl. Meteorol. 2005, 44, 682–693. [Google Scholar] [CrossRef]
  18. INEGI. Principales Resultados del Censo de Población y Vivienda 2020: Baja California Sur; INEGI: Aguascalientes, México, 2023; Available online: https://www.inegi.org.mx/contenidos/productos/prod_serv/contenidos/espanol/bvinegi/productos/nueva_estruc/702825198091.pdf (accessed on 1 August 2025).
  19. INEGI. Compendio de Información Geográfica Municipal 2010: La Paz, Baja California Sur; INEGI: Aguascalientes, México, 2010; Available online: https://www.inegi.org.mx/contenidos/app/mexicocifras/datos_geograficos/03/03003.pdf (accessed on 1 August 2025).
  20. García, J.A. Ambientes geológicos costeros del litoral de la Bahía de La Paz, Baja California Sur, México. CICIMAR—Instituto Politécnico Nacional, 2009. Available online: https://repositorioslatinoamericanos.uchile.cl/handle/2250/2885887?show=full (accessed on 18 June 2025).
  21. Bermúdez, C.A.; Ivanova Boncheva, A.; de la Peña Barron, A.; Bermúdez, A.; Casillas, E.; Landa, P.; Pérez, Y.; Lucero, B. Inventario de emisiones para la ciudad de La Paz, Baja California Sur. Centro de Energía Renovable y Calidad Ambiental (CERCA), 2016. Available online: https://www.cerca.org.mx/wp-content/uploads/2017/10/Inventario-de-emisiones-La-Paz-Informe-final.pdf (accessed on 1 August 2025).
  22. Comisión Federal de Electricidad (CFE). Cédula de Operación Anual Central Diesel Gral. Agustín Olachea Avilés 2013. Comisión Federal de Electricidad, 2013. Available online: https://cerca.org.mx/wp-content/uploads/2023/05/COA-GAO-2013.-AGUSTINOLACHEA-2013.pdf (accessed on 1 August 2025).
  23. Rivera-Cárdenas, C.I.; Barrera-Huertas, H.A.; Valenzuela, J.; Rangel, R.; López-Zamudio, E.; Carbajal-Aguilar, C.C. Emissions to the atmosphere by power plants in Baja California Sur, Mexico. Renew. Energy Biomass Sustain. 2024, 6, 28–42. [Google Scholar] [CrossRef]
  24. Comisión Federal de Electricidad (CFE). SO2 emissions reported in the Cédula de Operación Anual for the Gral. Agustín Olachea Avilés Diesel Power Plant, 2010. Comisión Federal de Electricidad, 2010. Available online: https://cerca.org.mx/wp-content/uploads/2023/05/COA-GAO-2010.-AGUSTINOLACHEA-2010.pdf (accessed on 1 August 2025).
  25. Comisión Federal de Electricidad (CFE). Cédula de Operación Anual C.D.E. Gral. Agustín Olachea Avilés 2014. Comisión Federal de Electricidad, 2014. Available online: https://cerca.org.mx/wp-content/uploads/2023/05/COA-GAO-2014.-AGUSTINOLACHEA-2014.pdf (accessed on 30 November 2023).
  26. Comisión Federal de Electricidad (CFE). Cédula de Operación Anual Central de Combustión Interna Baja California Sur 2018. Comisión Federal de Electricidad, 2018a. Available online: https://cerca.org.mx/wp-content/uploads/2023/05/COA-CCIBCS-2018-PUBLICA.pdf (accessed on 1 August 2025).
  27. Comisión Federal de Electricidad (CFE). Cédula de Operación Anual C.D.E. Gral. Agustín Olachea Avilés 2018. Comisión Federal de Electricidad, 2018b. Available online: https://cerca.org.mx/wp-content/uploads/2023/05/COA-2018-GAO-Testada-pdf.pdf (accessed on 1 August 2025).
  28. Comisión Federal de Electricidad (CFE). Cédula de Operación Anual Central de Combustión Interna Baja California Sur 2019. Comisión Federal de Electricidad, 2019a. Available online: https://cerca.org.mx/wp-content/uploads/2023/05/COA-2019-CCIBCS-Publica.pdf (accessed on 1 August 2025).
  29. Comisión Federal de Electricidad (CFE). Cédula de Operación Anual C.D.E. Gral. Agustín Olachea Avilés 2019. Comisión Federal de Electricidad, 2019b. Available online: https://cerca.org.mx/wp-content/uploads/2023/05/COA-2019-PUBLICA-v1.pdf (accessed on 1 August 2025).
  30. Comisión Federal de Electricidad (CFE). Cédula de Operación Anual Central Termoeléctrica Punta Prieta y Turbo Gas La Paz 2019. Comisión Federal de Electricidad, 2019c. Available online: https://cerca.org.mx/wp-content/uploads/2023/05/COA-2019-CT-PUNTA-PRIETA-PUBLICA.pdf (accessed on 1 August 2025).
  31. Comisión Federal de Electricidad (CFE). Cédula de Operación Anual Central de Combustión Interna Baja California Sur 2020. Comisión Federal de Electricidad, 2020a. Available online: https://cerca.org.mx/wp-content/uploads/2023/05/COA-2020-CCIBCS-Publica-V2.pdf (accessed on 1 August 2025).
  32. Comisión Federal de Electricidad (CFE). Cédula de Operación Anual C.D.E. Gral. Agustín Olachea Avilés 2020. Comisión Federal de Electricidad, 2020b. Available online: https://cerca.org.mx/wp-content/uploads/2023/05/COA-2020-PUBLICA-v1.pdf (accessed on 1 August 2025).
  33. Comisión Federal de Electricidad (CFE). Cédula de Operación Anual Central Termoeléctrica Punta Prieta y Turbo Gas La Paz 2020. Comisión Federal de Electricidad, 2020c. Available online: https://cerca.org.mx/wp-content/uploads/2023/05/COA-2018-CT-PUNTA-PRIETA-TESTADO-v1.pdf (accessed on 1 August 2025).
  34. Comisión Federal de Electricidad (CFE). Cédula de Operación Anual C.C.I. Gral. Agustín Olachea Avilés 2021. Comisión Federal de Electricidad, 2021a. Available online: https://cerca.org.mx/wp-content/uploads/2023/05/COA-2021-Agustin-OlacheaPUBLICA.pdf (accessed on 1 August 2025).
  35. Comisión Federal de Electricidad (CFE). Cédula de Operación Anual Central de Combustión Interna Baja California Sur 2021. Comisión Federal de Electricidad, 2021b. Available online: https://cerca.org.mx/wp-content/uploads/2023/05/COA-CCI-La-Paz-2021.pdf (accessed on 1 August 2025).
  36. Farneback, G. Two-Frame Motion Estimation Based on Polynomial Expansion. In Image Analysis: SCIA 2003; Bigun, J., Gustavsson, T., Eds.; Springer: Berlin/Heidelberg, Germany, 2003; Volume 2749, pp. 363–370. [Google Scholar] [CrossRef]
  37. Schiavo, B.; Stremme, W.; Grutter, M.; Campion, R.; Guarin, C.A.; Rivera, C.; Inguaggiato, S. Characterization of a UV Camera System for SO2 Measurements from Popocatépetl Volcano. J. Volcanol. Geotherm. Res. 2019, 370, 82–94. [Google Scholar] [CrossRef]
  38. Dalton, M.P.; Watson, I.M.; Nadeau, P.A.; Werner, C.; Morrow, W.; Shannon, J.M. Assessment of the UV Camera Sulfur Dioxide Retrieval for Point Source Plumes. J. Volcanol. Geotherm. Res. 2009, 188, 358–366. [Google Scholar] [CrossRef]
  39. Kern, C.; Kick, F.; Lübcke, P.; Vogel, L.; Wöhrbach, M.; Platt, U. Theoretical description of functionality, applications, and limitations of SO2 cameras for the remote sensing of volcanic plumes. Atmos. Meas. Tech. 2010, 3, 733–749. [Google Scholar] [CrossRef]
  40. Mori, T.; Burton, M. The SO2 camera: A simple, fast and cheap method for ground-based imaging of SO2 in volcanic plumes. Geophys. Res. Lett. 2006, 33, L24804. [Google Scholar] [CrossRef]
  41. Vita, F.; Schiavo, B.; Inguaggiato, C.; Inguaggiato, S.; Mazot, A. Environmental and Volcanic Implications of Volatile Output in the Atmosphere of Vulcano Island Detected Using SO2 Plume (2021–2023). Remote Sens. 2023, 15, 3086. [Google Scholar] [CrossRef]
  42. Cimorelli, A.J.; Perry, S.G.; Venkatram, A.; Weil, J.C.; Paine, R.J.; Wilson, R.B.; Lee, R.F.; Peters, W.D.; Paumier, J.O. AERMOD: Description of Model Formulation; U.S. Environmental Protection Agency Report; EPA 2003 454/R,03,002d; U.S. EPA: Washington, DC, USA, 2003; 85p. Available online: https://gaftp.epa.gov/Air/aqmg/SCRAM/models/preferred/aermod/aermod_mfd_454-R-03-004.pdf (accessed on 1 August 2025).
  43. Vita, F.; Schiavo, B.; Inguaggiato, C.; Cabassi, J.; Venturi, S.; Tassi, F.; Inguaggiato, S. Output of Volcanic SO2 Gases and Their Dispersion in the Atmosphere: The Case of Vulcano Island, Aeolian Archipelago, Italy. Atmosphere 2025, 16, 651. [Google Scholar] [CrossRef]
  44. Frins, E.; Ibrahim, O.; Casaballe, N.; Osorio, M.; Arismendi, F.; Wagner, T.; Platt, U. Ground Based Measurements of SO2 and NO2 Emissions from the Oil Refinery “La Teja” in Montevideo City. J. Phys. Conf. Ser. 2011, 274, 012083. [Google Scholar] [CrossRef]
  45. Andri, B.H.; Basuki, E.S.; Seputro, E.; Kusuma, E. Efforts to Reduce SO2 Emission in Paiton Coal-Fired Power Plant. IOP Conf. Ser. Mater. Sci. Eng. 2021, 1096, 012125. [Google Scholar] [CrossRef]
  46. Nisulescu, G.C.; Ionel, I.; Malan, B.; Dobrin, M. Remote SO2 Monitoring with UV Cameras for Stack Emissions. Rev. Chim. 2012, 63, 940–944. [Google Scholar] [CrossRef]
  47. Tan, W.; Liu, C.; Wang, S.; Liu, H.; Zhu, Y.; Su, W.; Hu, Q.; Liu, J. Long-Distance Mobile MAX-DOAS Observations of NO2 and SO2 over the North China Plain and Identification of Regional Transport and Power Plant Emissions. Atmos. Res. 2020, 245, 105037. [Google Scholar] [CrossRef]
  48. Ramadan, A.A.; Al-Sudairawi, M.; Alhajraf, S.; Khan, A.R. Total SO2 Emissions from Power Stations and Evaluation of Their Impact in Kuwait Using a Gaussian Plume Dispersion Model. Am. J. Environ. Sci. 2008, 4, 1–12. [Google Scholar] [CrossRef]
  49. Zhang, Y.G.; Wang, H.S.; Somesfalean, G.; Wang, Z.Y.; Lou, X.T.; Wu, S.H.; Zhang, Z.G.; Qin, Y.K. Broadband UV Spectroscopy System Used for Monitoring of SO2 and NO Emissions from Thermal Power Plants. Atmos. Environ. 2010, 44, 4266–4271. [Google Scholar] [CrossRef]
  50. González Rivero, R.A.; Rivera Cárdenas, C.I.; Barrera Huertas, H.A.; Trueba Vázquez, M. Assessment of NO2 and SO2 Emissions in the Tula Industrial Complex, Hidalgo, Using the Mobile Mini-DOAS Technique Combined with the AERMOD Dispersion Model. Environ. Monit. Assess. 2025, 197, 864. [Google Scholar] [CrossRef]
  51. Prata, A.J. Measuring SO2 Ship Emissions with an Ultraviolet Imaging Camera. Atmos. Meas. Tech. 2014, 7, 1213–1229. [Google Scholar] [CrossRef]
  52. Gliß, J.; Stebel, K.; Kylling, A.; Sudbø, A. Improved Optical Flow Velocity Analysis in SO2 Camera Images of Volcanic Plumes—Implications for Emission-Rate Retrievals Investigated at Mt Etna, Italy and Guallatiri, Chile. Atmos. Meas. Tech. 2018, 11, 781–801. [Google Scholar] [CrossRef]
  53. Lo Bue Trisciuzzi, G.; Aiuppa, A.; Salerno, G.; Bitetto, M.; Curcio, L.; Innocenti, L.; Lacanna, G.; Nogueira Lages, J.P.; Lo Forte, F.M.; Maugeri, S.R.; et al. Improved Volcanic SO2 Flux Records from Integrated Scanning-DOAS and UV Camera Observations. J. Volcanol. Geotherm. Res. 2024, 455, 108207. [Google Scholar] [CrossRef]
  54. Nurhisanah, S.; Hasyim, H. Environmental Health Risk Assessment of Sulfur Dioxide (SO2) at Workers around in Combined Cycle Power Plant (CCPP). Heliyon 2022, 8, e09388. [Google Scholar] [CrossRef] [PubMed]
  55. Norma Oficial Mexicana (NOM-022-SSA1-2019). Salud Ambiental. Criterios para evaluar la calidad del aire; Secretaría de Salud: México City, México. 2019. Available online: https://www.dof.gob.mx/nota_detalle.php?codigo=5568395&fecha=20/08/2019#gsc.tab=0 (accessed on 1 August 2025).
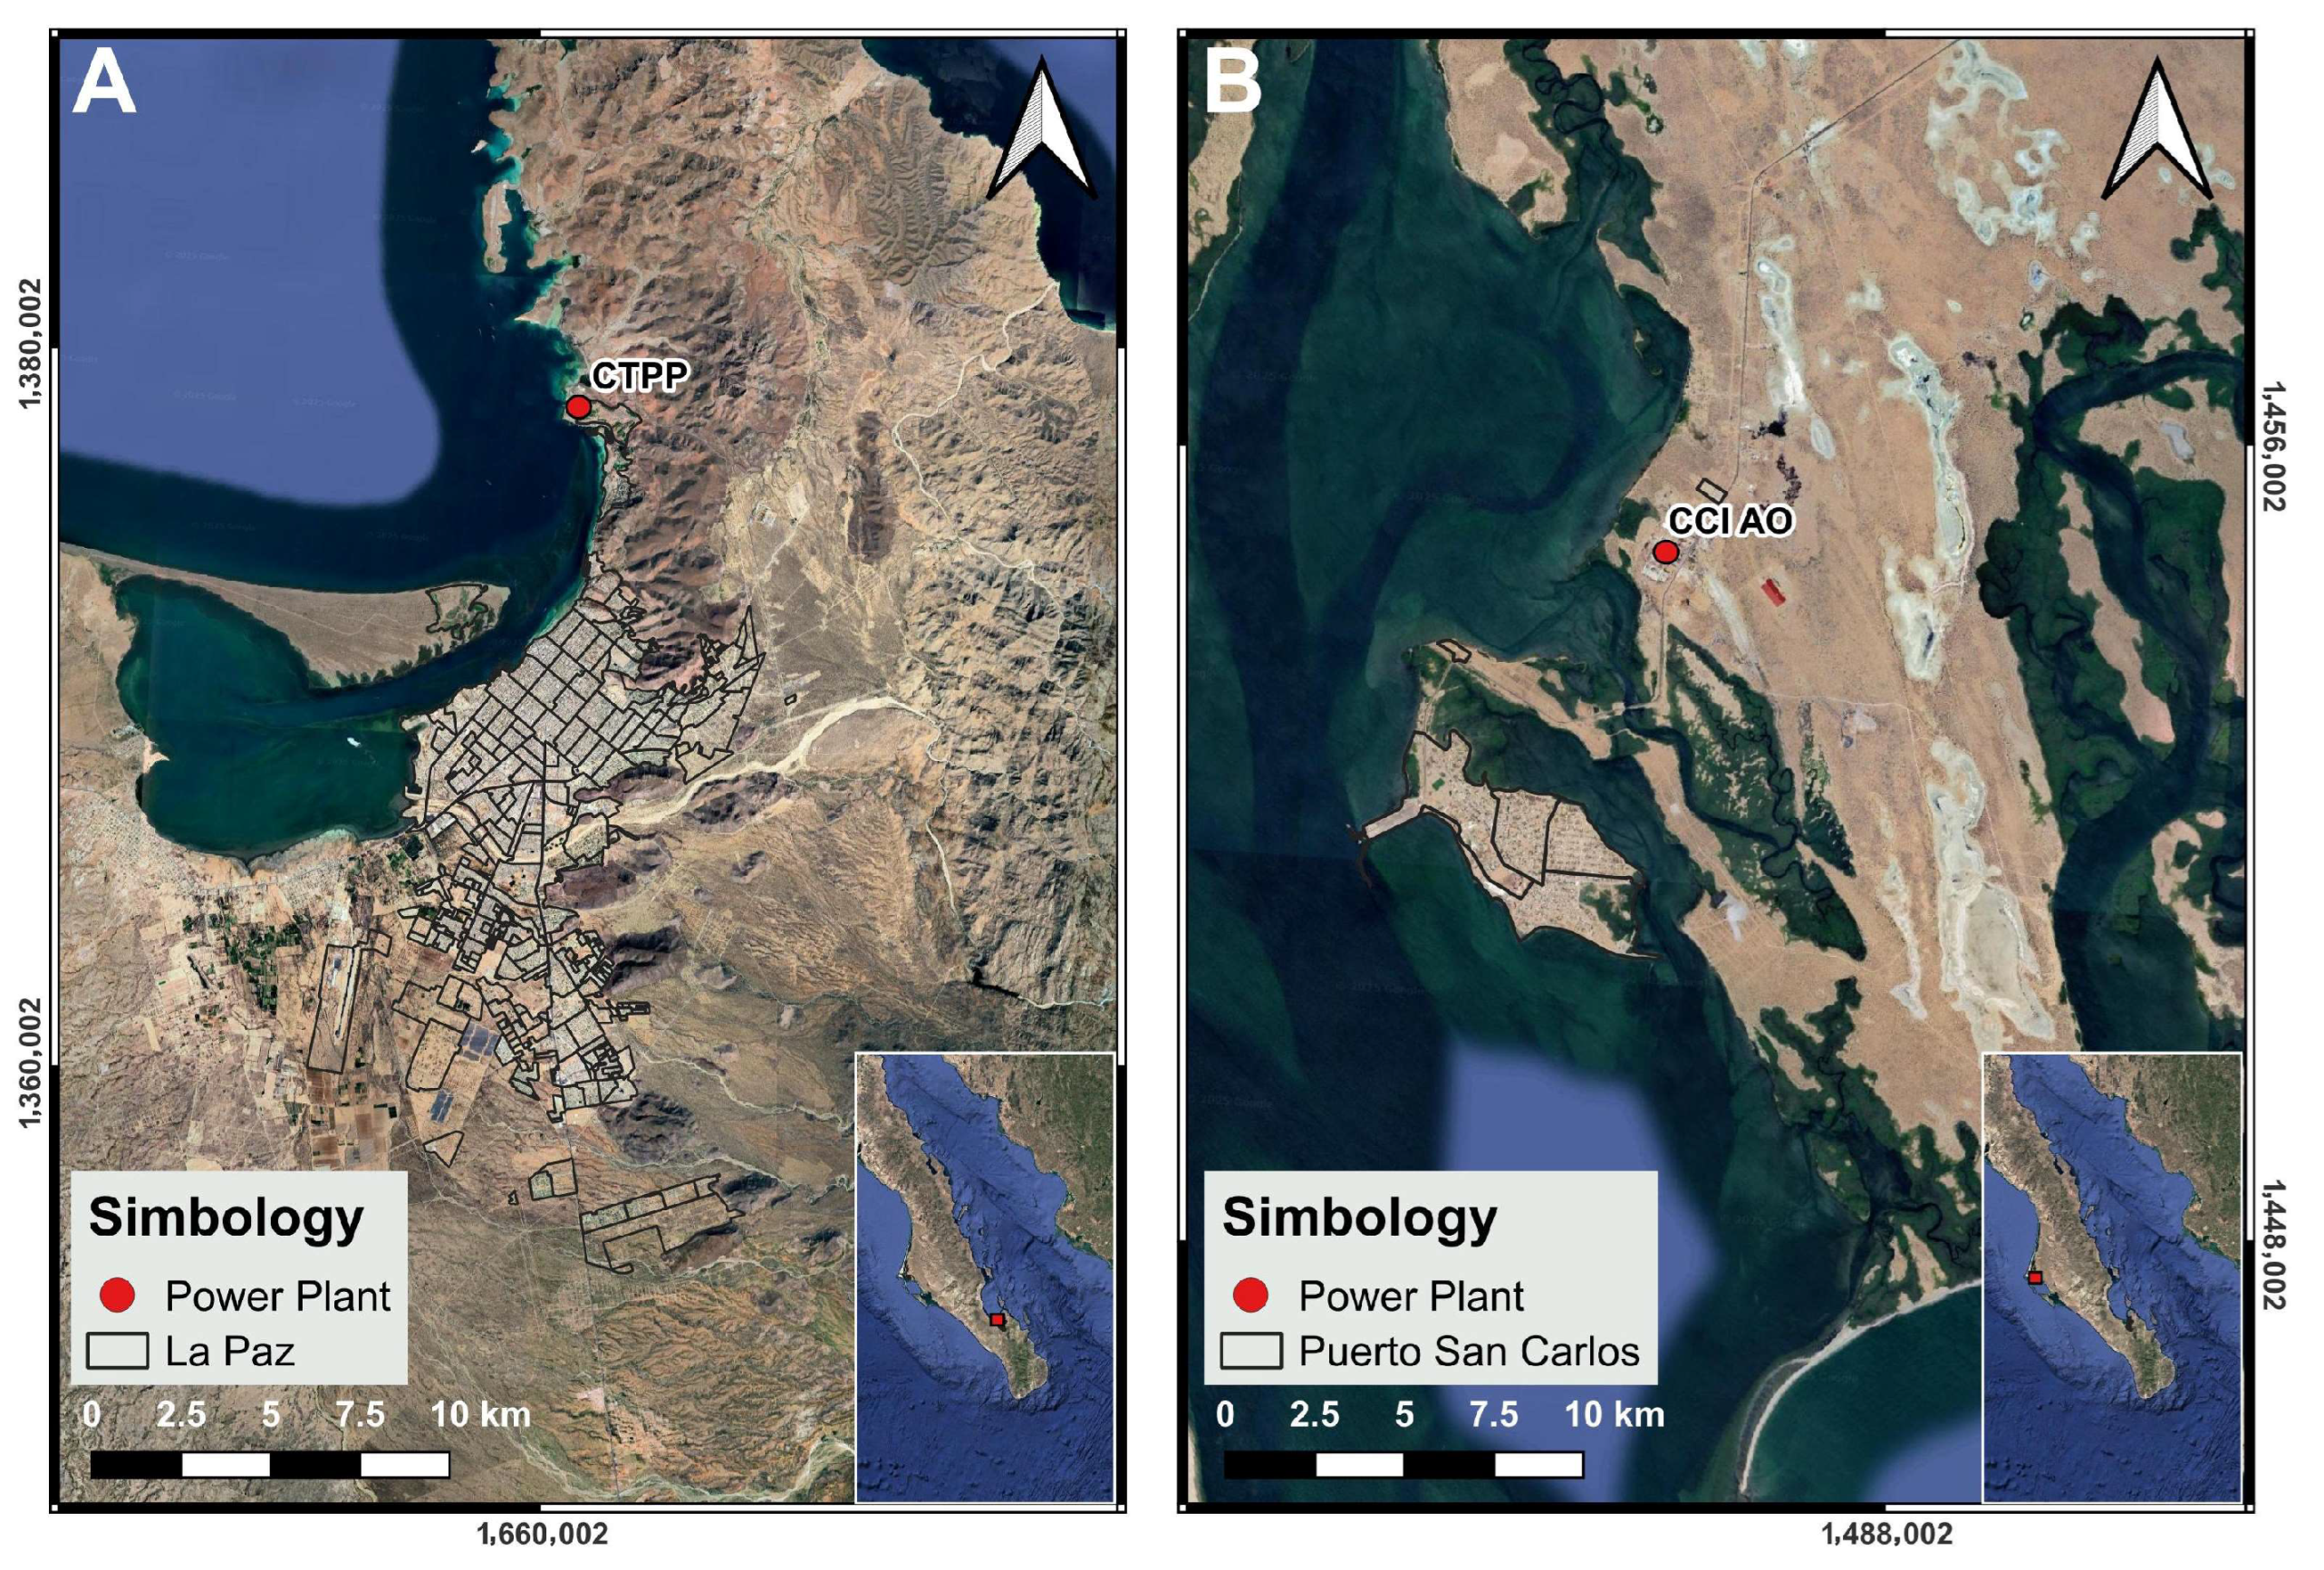
Figure 1. Location of the two power plants studied in Baja California Sur, Mexico. Panel (A) shows the location of the power plant (CTPP) in the city of La Paz, and panel (B) shows the location of the power plant (CCI AO) in the municipality of Puerto San Carlos. Red dots indicate the regional position of each plant within the Baja California Peninsula.
Atmosphere 16 01128 g001
Figure 2. (A) Spectral image of the SO2 plume from the CTPP power plant captured using a UV camera with a 310 nm filter. The color scale represents SO2 SCD (ppm·m), while black arrows indicate wind vectors within the plume. Slightly negative values on the scale are due to background noise in the differential absorption retrieval and do not correspond to real concentrations. The camera was positioned at approximately 1.5 m above ground level (AGL). (B) Time series of SO2 plume measurements from the CTPP power plant. The blue line shows the SO2 slant column density (SCD, in ppm·m) on the left axis, while the green line shows the SO2 flux (in kg s−1) on the right axis. Measurements were conducted on 17 June 2022.
Atmosphere 16 01128 g002
Figure 3. (A) Spectral image of the SO2 plume from the CCI AO power plant captured using a UV camera with a 310 nm filter. The color scale represents SO2 SCD (ppm·m), while black arrows indicate wind vectors within the plume. Slightly negative values on the scale are due to background noise in the differential absorption retrieval and do not correspond to real concentrations. The camera was positioned at approximately 1.5 m above ground level (AGL). (B) Time series of SO2 plume measurements from the CCI AO power plant. The blue line shows the SO2 slant column density (SCD, in ppm·m) on the left axis, while the green line shows the SO2 flux (in kg s−1) on the right axis. Measurements were conducted on 19 June 2022.
Atmosphere 16 01128 g003
Figure 4. Modeled SO2 ground-level concentration plumes from CTPP (A) and CCI AO (B) power plants based on AERMOD simulations. The colored contours represent different SO2 concentration ranges (µg/m3) as indicated in the legend.
Atmosphere 16 01128 g004
Table 1. Estimated emissions (tons/year) of air pollutants from the main power plants in Baja California Sur based on the 2013 Emission Inventory.
Power PlantsSO2NOxCOPM10PM2.5VOC
CTPP a2428.1987.4108.730.8266.316.2
CCI BCS a11,916.411,439.32473.1808.417.50
CCI AO b4913.23930.3nd9999nd
a data from Bermúdez et al. [21], b CFE, [22]. nd: no data.
Table 2. Reported SO2 emissions (tons/year) from the Annual Operation Certificates (COAs) and Mini-DOAS field campaign of the three major power plants in Baja California Sur.
YearCTPPCCI BCSCCI AOSourceReference
2010ndnd16,028.89COAsCFE, [24]
20132428.111,916.438704.90COAsBermúdez et al. [21]; CFE, [22]
2014ndnd6786.13COAsCFE, [25]
2018nd17,183.737988.00COAsCFE, [26,27]
201914,033.515,359.786431.64COAsCFE, [28,29,30]
202013,628.917,649.016490.20COAsCFE, [31,32,33]
2021nd14,398.964913.19COAsCFE, [34,35]
202223,970.616,322.606633.84Mini-DOASRivera-Cárdenas et al. [23]
Table 3. Main specifications of the UV camera used in this study.
InstrumentParameters
Focal length (mm)Measurement range (nm)CCDLens diameter (mm)Image
resolution
UV camera50from 300 to 450KAF-1603ME (1.6 MP)251536 × 1024
Table 4. Overview of SO2 SCD (in ppm·m), SO2 flux (in kg s−1), and wind speed (in m s−1) measured at the CTPP and the CCI AO during the field campaign. Values are reported as mean (range), median, and standard deviation (SD).
CTPPCCI AO
SCD (ppm·m)Mean
(min–max)
1009.2
(784.1–1242.8)
559.4
(350.5–974.5)
Median1020.1549.3
SD125.9103.1
Flux (kg s−1)Mean
(min–max)
1.13
(0.49–2.26)
0.59
(0.20–1.24)
Median1.060.57
SD0.390.14
Wind Speed (m s−1)Mean3.62.2
Table 5. Comparative measurements of SO2 emissions at power plants using ground-based techniques. The table summarizes reported column densities (in ppm·m), fluxes (in kg s−1), plant types, and measurement distances from selected published studies.
SitePlant Type/FuelPower
(MW)
SO2 SCD * (ppm·m)SO2 Flux (kg s−1)Reference
CTPPFuel oil1551009.21.13This work
CCI AOFuel oil77.6559.40.59This work
Montevideo, UruguayFuel oilnrnr0.32Frins et al. [44]
Bucharest, RumaniaCoalnr7151.27Nisulescu et al. [46]
Dezhou, ChinaCoal2670nr1.11Tan et al. [47]
Doha, KuwaitFuel oil nr1.29Ramadan et al. [48]
Shandong, ChinaCoal50nr0.09Zhang et al. [49]
Tula, MexicoFuel oil1605nr4.28González-Rivero et al. [50]
* SCD: Slant Column Density; nr: not reported.
Disclaimer/Publisher’s Note: The statements, opinions and data contained in all publications are solely those of the individual author(s) and contributor(s) and not of MDPI and/or the editor(s). MDPI and/or the editor(s) disclaim responsibility for any injury to people or property resulting from any ideas, methods, instructions or products referred to in the content.