Article

Regional Emission Performance Benchmarks for Cookstove Stacking in the Purepecha Region, Mexico

by
Víctor M. Ruiz-García
1,
Rufus D. Edwards
2,*,
Paulo C. Medina Mendoza
3,
María de Lourdes Cinco Izquierdo
4,
Minerva Lopez
4,
Juan Vázquez
1,
Víctor Berrueta
5 and
Omar Masera
1
1
Laboratorio de Innovación y Evaluación de Bioenergía (LINEB), Laboratorio de Bioenergía y Grupo de Innovación Ecotecnológica y Bioenergía (GIEB), Instituto de Investigaciones en Ecosistemas y Sustentabilidad, Universidad Nacional Autónoma de México (UNAM), Morelia 58190, Mexico
2
Department of Environmental and Occupational Health, Joe C. Wen School of Population and Public Health, University of California Irvine, Irvine, CA 92697, USA
3
División de Ingeniería Mecánica, Mecatrónica e Industrial, Tecnológico de Estudios Superiores de Ecatepec (TESE), Ecatepec de Morelos 55210, Mexico
4
Posgrado de Ingeniería Química, Universidad Michoacana de San Nicolás de Hidalgo, Morelia 58030, Mexico
5
Secretaría de Ciencia, Humanidades, Tecnología e Innovación (Secihti), Universidad Intercultural Indígena de Michoacan (UIIM), Pátzcuaro 58010, Mexico
*
Author to whom correspondence should be addressed.
Atmosphere 2025, 16(10), 1127; https://doi.org/10.3390/atmos16101127
Submission received: 1 August 2025 / Revised: 19 September 2025 / Accepted: 22 September 2025 / Published: 26 September 2025
(This article belongs to the Section Air Quality and Health)

Abstract

The National Cookstove Program has been launched by the Federal Government of Mexico, attempting to reach one million rural homes by the year 2030. Voluntary ISO emission standards for fine particulate matter (PM2.5) and carbon monoxide (CO) relate emission rates from stoves to indoor air concentrations using a single zone box model (SZM) to derive performance tiers. Region-specific emission benchmarks for cookstove performance that are linked to estimated benefits in reduced indoor air concentrations and resultant health impacts will be important in product selection. Here we compare the SZM to measured indoor PM2.5 and CO concentrations for five stove stacking combinations using controlled cooking tests of typical foods from the Purepecha region of Mexico to derive region-specific benchmarks. The results demonstrate that the SZM systematically overpredicted PM2.5 emissions based on thermal plume effects and ventilation which can be adjusted based on strong relationships (Adjusted r2 = 0.96, p < 0.001) with emission rates and air changes per hour. Adjustment of PM2.5 ISO voluntary standards for systematic bias caused by plume buoyancy and ventilation is important in ensuring that the ISO benchmarks reflect the actual indoor concentrations measured in homes. The ISO benchmarks for CO should be revisited as the indoor concentrations from traditional stoves met the most stringent benchmarks but were in the range of concentrations associated with adverse health impacts in adults and psychosocial impacts in children.

1. Introduction

Approximately 36% of people worldwide in 2020 used polluting fuels for cooking [1]. Most households cook on open fires and rustic unvented stoves using biomass, with important environmental and health implications [1]. A variety of improved biomass cookstoves and other stoves and devices using other fuels—like LPG and electricity—have been promoted to replace traditional fires, which lower the health risk and associated morbidity and mortality [2]. The National Cookstove Program has been launched by the Federal Government of Mexico, attempting to reach one million rural homes by the year 2030 (https://www.gob.mx/sener/articulos/programa-de-estufas-eficientes-de-lena-para-el-bienestar-395098?state=published accessed on 1 July 2025). Emission performance tests for cookstoves are typically used by donors, implementers, and procurement organizations as a criterion for product selection to help identify which products meet their goals [3] by simulating whether a single stove meets the 2014 World Health Organization (WHO) air quality guidelines in a home (https://www.who.int/publications/i/item/9789241548885 accessed on 1 July 2025). The ISO voluntary standard ISO 19867-3:2018 (https://www.iso.org/standard/73935.html accessed on 1 July 2025) Clean cookstoves and clean cooking solutions—Harmonized laboratory test protocols—Part 3: Voluntary performance targets for cookstoves based on laboratory testing (https://www.iso.org/standard/73935.html accessed on 1 July 2025) establishes performance tiers for stoves across five criteria: efficiency, emissions of fine particulate matter (PM2.5), emissions of carbon monoxide, safety, and durability. Tiered performance targets provide a set of reference values against which to monitor and assess progress ranging from Tier 0 at the lowest performance benchmark typical of open fires to Tier 5 at the highest benchmark. Henceforward, in this paper we refer to the PM2.5 and CO emissions performance targets of the ISO. Based on models developed as part of the 2014 WHO indoor air quality guidelines [4], the emissions performance benchmarks for PM2.5 relate emission rates from stoves to indoor air concentrations to derive the highest performance, Tier 5, that would meet the previous WHO air quality guideline of 10 µg/m3 for 90% of homes. Using dose–response curves for child acute lower respiratory infection, this tier would have a relative risk of 1.0. Intermediate emission rate tiers were then set to achieve levels of indoor air quality equivalent to relative risks for child ALRI of 3.15 (Tier 1), 3.0 (Tier 2), 2.5 (Tier 3), and 1.5 (Tier 4). Estimating the equivalent emission rate that would achieve these relative risk benchmarks was performed using a simulation of which emission rates would produce indoor air concentrations equivalent to the indoor air concentration associated with each specific ALRI relative risk, using default values for room size, ventilation, and cooking time from the literature [5].
Current emission benchmarks are based on laboratory test results. While in-field results are acknowledged to be substantially different to controlled laboratory test results in ISO protocols, the benchmarks that are derived are based on relative risk and there is an implicit assumption that the relationships between different stoves are of similar magnitude between laboratory stoves and in-field use. Relative risk benchmarks that relate indoor concentrations to health endpoints are based on absolute concentrations; however, systematic underestimation of emissions in controlled testing will result in relative risks that are substantially higher during normal usage in homes. Further, experimental evaluation of water boiling tests in comparison to normal cooking has demonstrated that the combustion conditions in controlled testing do not represent the combustion conditions during normal cooking [6,7], for a variety of reasons that include stoves not having sufficient turn-down ability for low-power cooking tasks, variations in tending, and differences in fuel quality [8,9,10]. Since the laboratory water boiling test is designed to favor high power output, but most cooking tasks in the Purepecha region use low power output [6], validation is required to demonstrate that a stove’s performance in ISO benchmark testing is transferable to performance in the field for the tiers be useful in evaluating these stoves. In addition, the ISO benchmarks are framed in the context of individual stoves. It is now widely acknowledged that stove stacking is the norm [11], where multiple stoves replace traditional stoves, often retaining a role for the traditional stove, and continued use of the stoves is dependent on a range of sociocultural factors [12]. For regional benchmarks to be useful for evaluation of the National Cookstove Program, they should reflect the overall indoor air concentrations that result from the combination of stoves typically used to cook staple foods of the region.
The ISO voluntary performance targets allows for benchmark values to be determined for individual locations based on different model inputs and assumptions when neither the default nor the low- and high-ventilation conditions scenarios adequately represent the local conditions. Thus, in this paper we demonstrate an approach to derive region-specific ISO benchmarks for particulate emissions in the Purepecha region in Mexico, adjusting for bias in SZM caused by thermal plume effects and ventilation; this allows SZM to more accurately reflect measured indoor concentrations. The paper is highly relevant and timely for the National Cookstove Program of Mexico which aims to disseminate one million improved woodburning stoves from the year 2025 to 2030. Region-specific emission benchmarks for cookstove performance that more accurately reflect measured indoor concentrations under local and regional circumstances will be important in product selection based on the estimated benefits of reduced indoor air concentrations and health impacts.

2. Materials and Methods

2.1. Devices, Fuels, and Cooking Tasks

Stoves and dishes. The test kitchen measurements were performed by a local cook on a suite of stove stacking combinations to evaluate the potential impacts on indoor air quality and emissions in comparison to individual stoves. Stove stacking combinations and fuels are shown in Table 1.
The Controlled Cooking Cycle (CCC) consisted of typical regional staple dishes: (a) make 3 kg of tortillas, (b) boil 1 kg of beans, (c) fry 5 eggs and ½ kg of beans, (d) cook ½ kg of rice, (e) boil 1 L of water, (f) reheat 1 ½ kg of tortillas and cooked dishes, (g) boil 2 kg of nixtamal (corn to make tortillas) and heat 20 L of water for bathing (temperature around 309 K). For stove stacking scenarios, cooking tasks were allocated to each of the stoves depending on local usage patterns of the locality (Table 1).
Fuels. The fuel used in the Patsari stove and the “U”-type open fire was white oak (Quercus spp.) with an average moisture content on a wet basis of 10.6 ± 1.8% and a range of 7.2–14.4%. The moisture was measured with the wood moisture meter Protimeter Timbermaster (GE, Billerica, MA, USA). The initial and final firewood consumption was measured with a digital scale with a resolution of 1 g (Ranger R41ME30 OHAUS, Shanghai, China). In the liquefied petroleum gas (LPG) stove, LPG was used from a 20 kg gas cylinder (fuel + cylinder) to carry out the cooking tasks and was placed on a digital scale with a resolution of 10 g to measure the initial and final gas consumption (SR 50/100, Model OSR50 Torrey SA de CV, Monterrey, Mexico). The “U”-type and Patsari stove were started with soaked kindling with 95% isopropyl alcohol (~25 g), and kitchen matches for the LPG stove were used as the fire starter material. Pictures of stoves are shown in the Supplemental Information in Figure S1.

2.2. Test Kitchen

Location. The kitchen was located in Tzentzenguaro, Michoacán, México (19°53′12″ N 101°64′43″ W). The design is representative of a typical rural kitchen of the region (size, materials, and type of door, windows, and roof).
Air exchange rate. Air exchange rates were estimated using carbon monoxide (CO) decay rates (n = 33 measurements) measured with a Q-Trak (Model 7575, TSI Inc., Shoreview, MN, USA) every 2 s, located at a height of 1.5 m. A mixing fan was used to reduce stratification effects in the kitchen during decay rate tests, but not during cooking tests [13,14]. The average air exchange rate of the simulated kitchen was 42 ± 3 air changes per hour (ACH).
Volume. The test kitchen volume was 41 m3 which was based on the measurement of kitchen volume in 627 kitchens in four local Purepecha communities (Comachuen 19°34′20″ N 101°54′16″ W, La Mojonera 19°42′01″ N 101°50′01″ W, Quinceo 19°44′07″ N 101°13′27″ W and Turicuaro 19°34′14″ N 101°56′18″ W). The kitchen volume measured in these communities was 41 ± 12 m3.

2.3. Fugitive and Chimney Emissions Measurements

Fugitive emissions were measured as a fraction of the total emission using two hoods that simultaneously and separately capture emissions through the chimney and fugitive emissions into the kitchen (see Figure 1). Similar to the laboratory evaluations of Ruiz-García et al. [14], chimney and fugitive emissions were measured for all devices during the CCC test (overall emissions = chimney emissions + fugitive emissions). Measurement of carbon dioxide (CO2) and carbon monoxide (CO) emissions in the chimney was performed using a Portable Emissions Measurement System (PEMS) (Aprovecho Research Center, Cottage Grove, OR, USA). Fugitive emissions into the kitchen were measured using a Q-Trak (Model 7575, TSI Inc., Shoreview, MN, USA). Both instruments employ a non-dispersive infrared (NDIR) sensor for CO2 and an electrochemical cell to measure CO. CO2 and CO sensors were calibrated using zero-air and a mixture of 500 ppm CO and 5000 ppm CO2. The factory-calibrated Q-trak has been shown to perform well in quantifying low CO2 and CO concentrations compared to analysis by GC FID with a preconcentrator and methanizer [9]. Fine particulate matter (PM2.5) in chimney emissions and fugitive emissions was collected with a PM2.5 cyclone on glass fiber filters for gravimetric determination. The sample flow rate for fugitive emissions was 4 L/min with 47 mm filters and 16.7 L/min with 102 mm filters for chimney emissions. Flows were measured before and after sampling using a primary flow meter (Mesa Labs Bios Defender 520-M, Brandt Instruments, Prairieville, LA, USA). Filters were equilibrated for 48 h at 21 ± 2 C and 35 ± 5% relative humidity. Filters were weighed immediately after the equilibration periods on a microbalance with a resolution of 1 μg (Mettler-Toledo GmbH, model XPR10 8606, Greifensee, Switzerland) and 10 μg (model EX225D, OHAUS, Parsippany, NJ, USA). An antistatic neutralizer (Sartorius-pen YSTP01, Sartorius, AG, Göttingen, Germany) was also used to eliminate static charge. Each filter was weighed five times and its weight was accepted if variability was lower than 2 μg for 47 mm filters and 20 μg for 102 mm filters, respectively. Microbalance calibration was verified during each weighing session using standard calibration weights from 1 mg to 5 g (Sartorius YCS011-352-00, Sartorius, AG, Göttingen, Germany). Blank laboratory control filters were used to maintain quality control between each weigh-in. The same analyst performed the weighing before and after collecting the sample in the filter.

2.4. Indoor Air Pollution Measurements

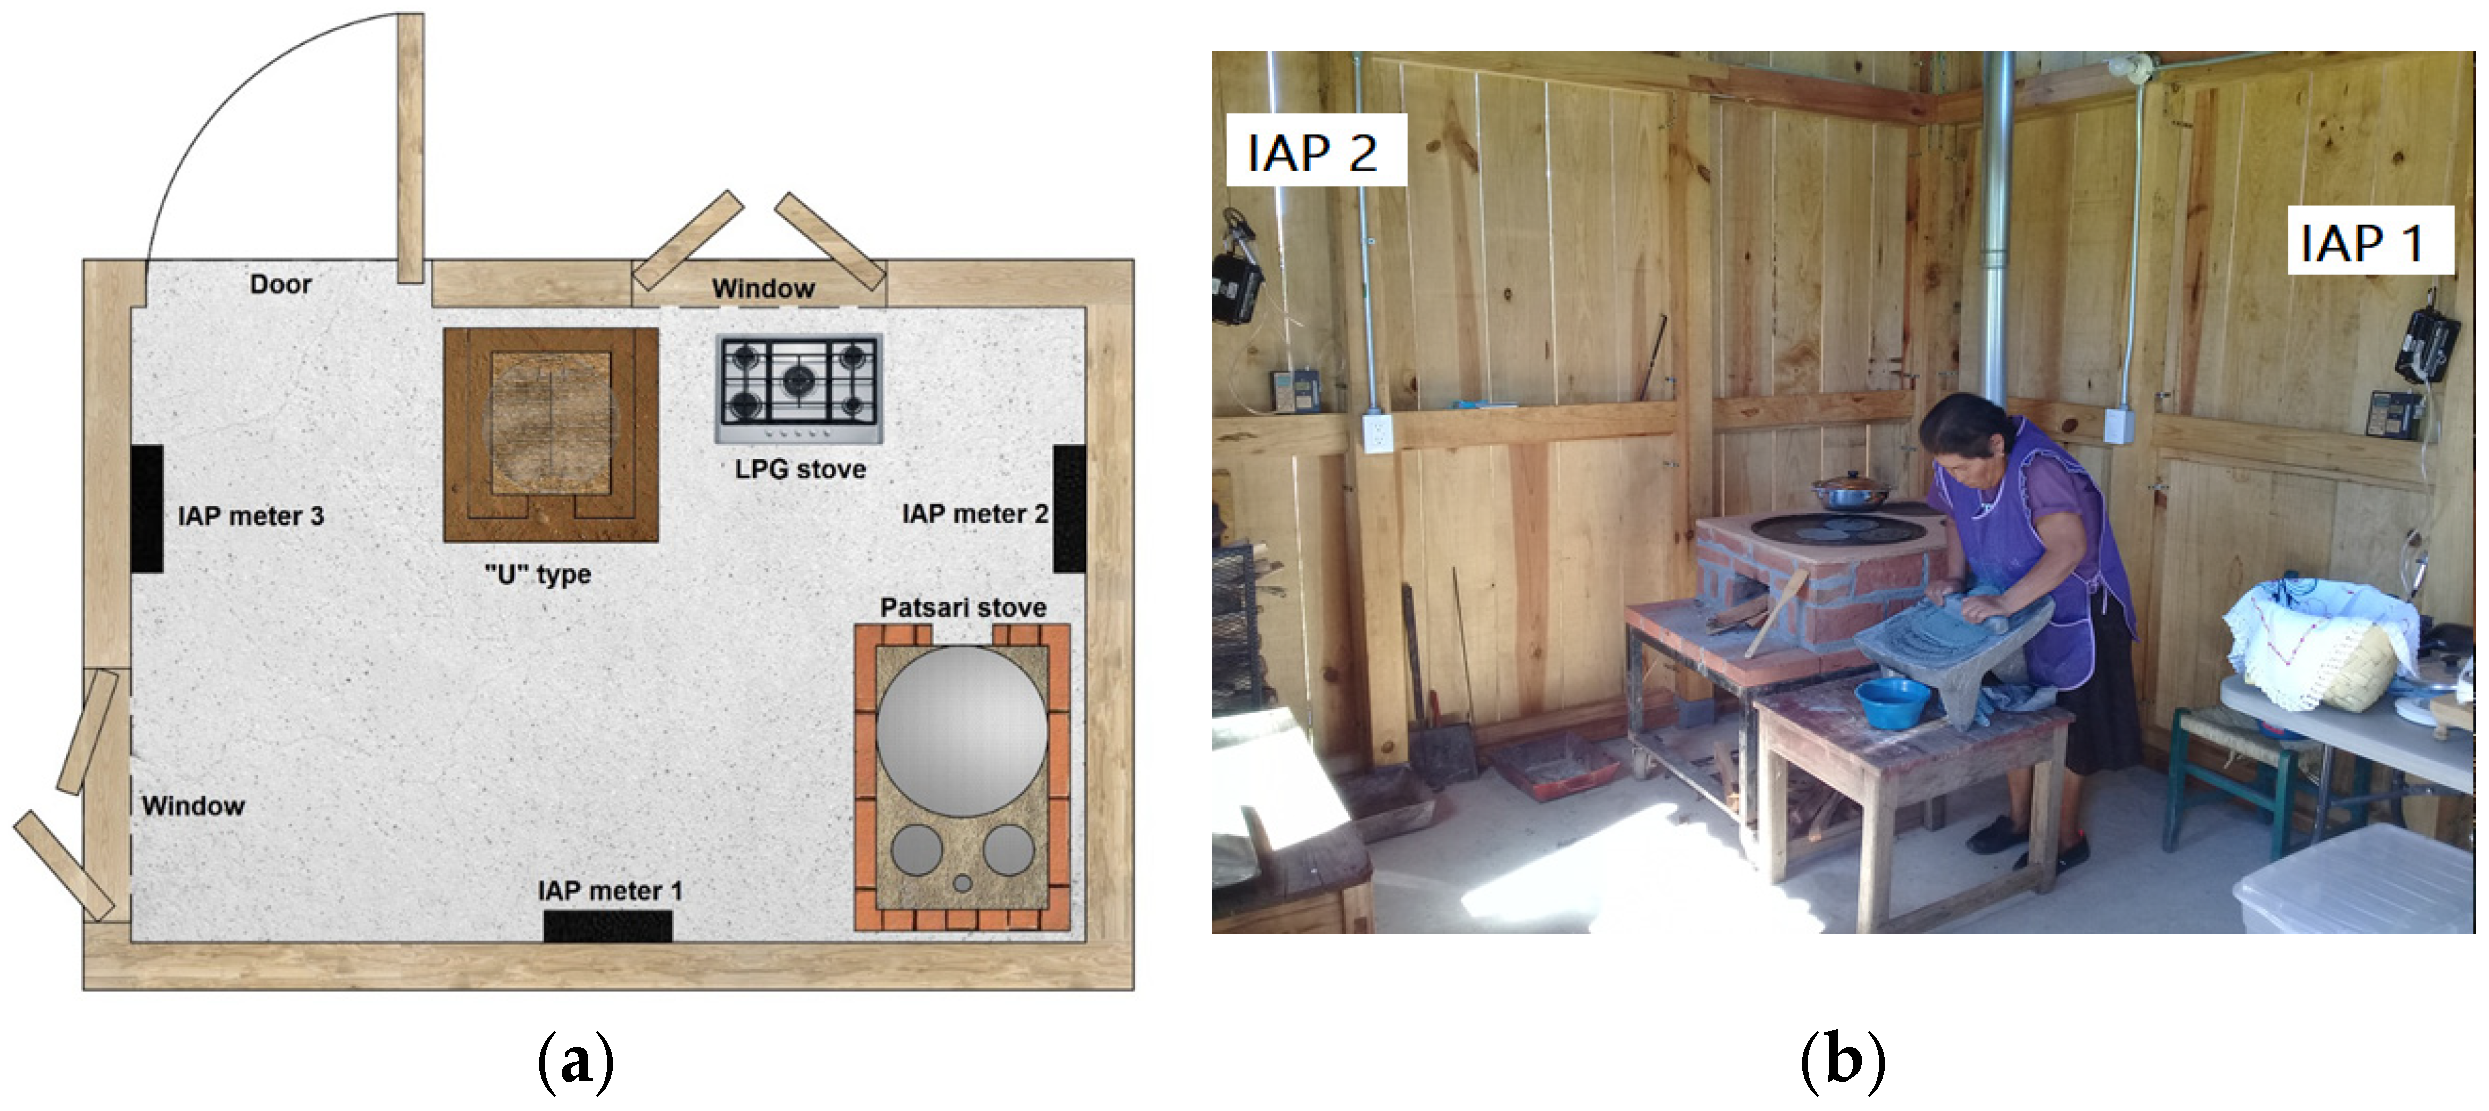
PM2.5 and CO indoor concentration measurements in the test kitchen were determined in real-time during the CCC with three 5000 series Indoor Air Pollution (IAP) meters (Aprovecho Research Center, OR, USA) (see Figure 2). The 5000 series IAP meters use a light scattering sensor and an electrochemical cell to measure PM2.5 and CO concentrations, respectively. In this study, IAP meters were calibrated according to the manufacturer’s specifications (Aprovecho Research Center, 2013) using zero-air and a mixture of 500 ppm CO and 5000 ppm CO2 (Praxair Technology, Inc., Danbury, CT, USA) and continuous measurements were recorded every 9 s. Three IAP meters were installed in the simulated kitchen [15]. The 5000 series IAP light scattering sensors were calibrated using gravimetric PM2.5 samples were collected on 37 mm Teflon filters (SKC Inc., Eighty Four, Pittsburgh, PA, USA), while using air sampling pumps (Model 224-PCXR8, SKC Inc., Eighty Four, Pittsburgh, PA, USA). with PM2.5 cyclones (Aluminum respirable dust cyclone, SKC Inc., Eighty Four, Pittsburgh, PA, USA) and a flow rate of 4 L/min. As in the chimney and fugitive emissions section (Section 2.3), flows were measured before and after sampling measurements using a primary flowmeter. Filter equilibration, weighing, quality assurance, and validation was performed using the same methods as presented in Section 2.3.

2.5. Single Zone Model

The single zone model (SZM) is a well-characterized Monte Carlo single-box model that combines stove emission rates with distributions of kitchen volumes and air exchange rates to estimate indoor air concentrations that can be used to compare to the likelihood of meeting WHO air quality guidelines [5] and to derive ISO emission benchmarks [16]. The measurement of field indoor pollution was validated against SZM using a t-Student distribution with α = 0.05. See more details about SZM equations in [4,5].

3. Results

3.1. Fugitive and Chimney Emissions

Table 2 shows the emission rates of CO and PM2.5 from each stove in a stacking combination and, where stoves had a chimney, separate emission factors for chimney and fugitive emissions. Exclusive use of the “U”-type has the highest emission rates with 471.6 ± 167.3 mg PM2.5/min, 6294 ± 2936 mg CO/min, and 83.6 ± 2.7 gCO2/min. Combined use of the Patsari stove and the LPG stove reduces the fugitive emission rates to 1.8 ± 0.1 (Patsari) and 0.1 ± 0.1 mg PM2.5/min (LPG), and in the case of CO emission rates are reduced to 10 ± 7 and 25 ± 8 mg CO/min, respectively. For Patsari stoves, fugitive emissions represent 1 ± 1% for CO and 3 ± 1% for PM2.5 of total emissions (See Table 2). Table 3 shows the emission factors, cooking time, modified combustion efficiency (MCE), and fuel and energy consumption for the same stove stacking combinations as Table 2. In general, the Patsari and U-type traditional stove had similar durations for the cooking tasks. When LPG was included, these cooking times were reduced and overall LPG on its own resulted in the shortest cooking time; however, these cooking times do not account for cooking tasks occurring simultaneously, and LPG use in the region is perceived to be more expensive to households in the region. The average MCE for the “U”-type was ~89%, and for the Patsari stove ~95%, while for the LPG stove it was ~99%.

3.2. Indoor Air Pollution

Table 4 shows the indoor air pollution directly measured in the test kitchen during the cooking tasks for each stove stacking combination, and thus represents the overall indoor air pollution for the multiple stoves used in the stacking combination. As expected, exclusive or combined use of the “U”-type open fire has the highest contributions of PM2.5 and CO. The “U”-type indoor concentration of PM2.5 for the “U”-type stove ranged from 80 ± 8 to 225 ± 48 µg/m3 depending on the stove stacking combination, with the combinations that included a Patsari at the low end of the range and exclusive use of the traditional stove at the high end. Similarly, average concentrations of CO (24 h) for all the cooking devices ranged between 0.8 and 4.2 mg/m3, depending on exclusive or combined use of the stoves.
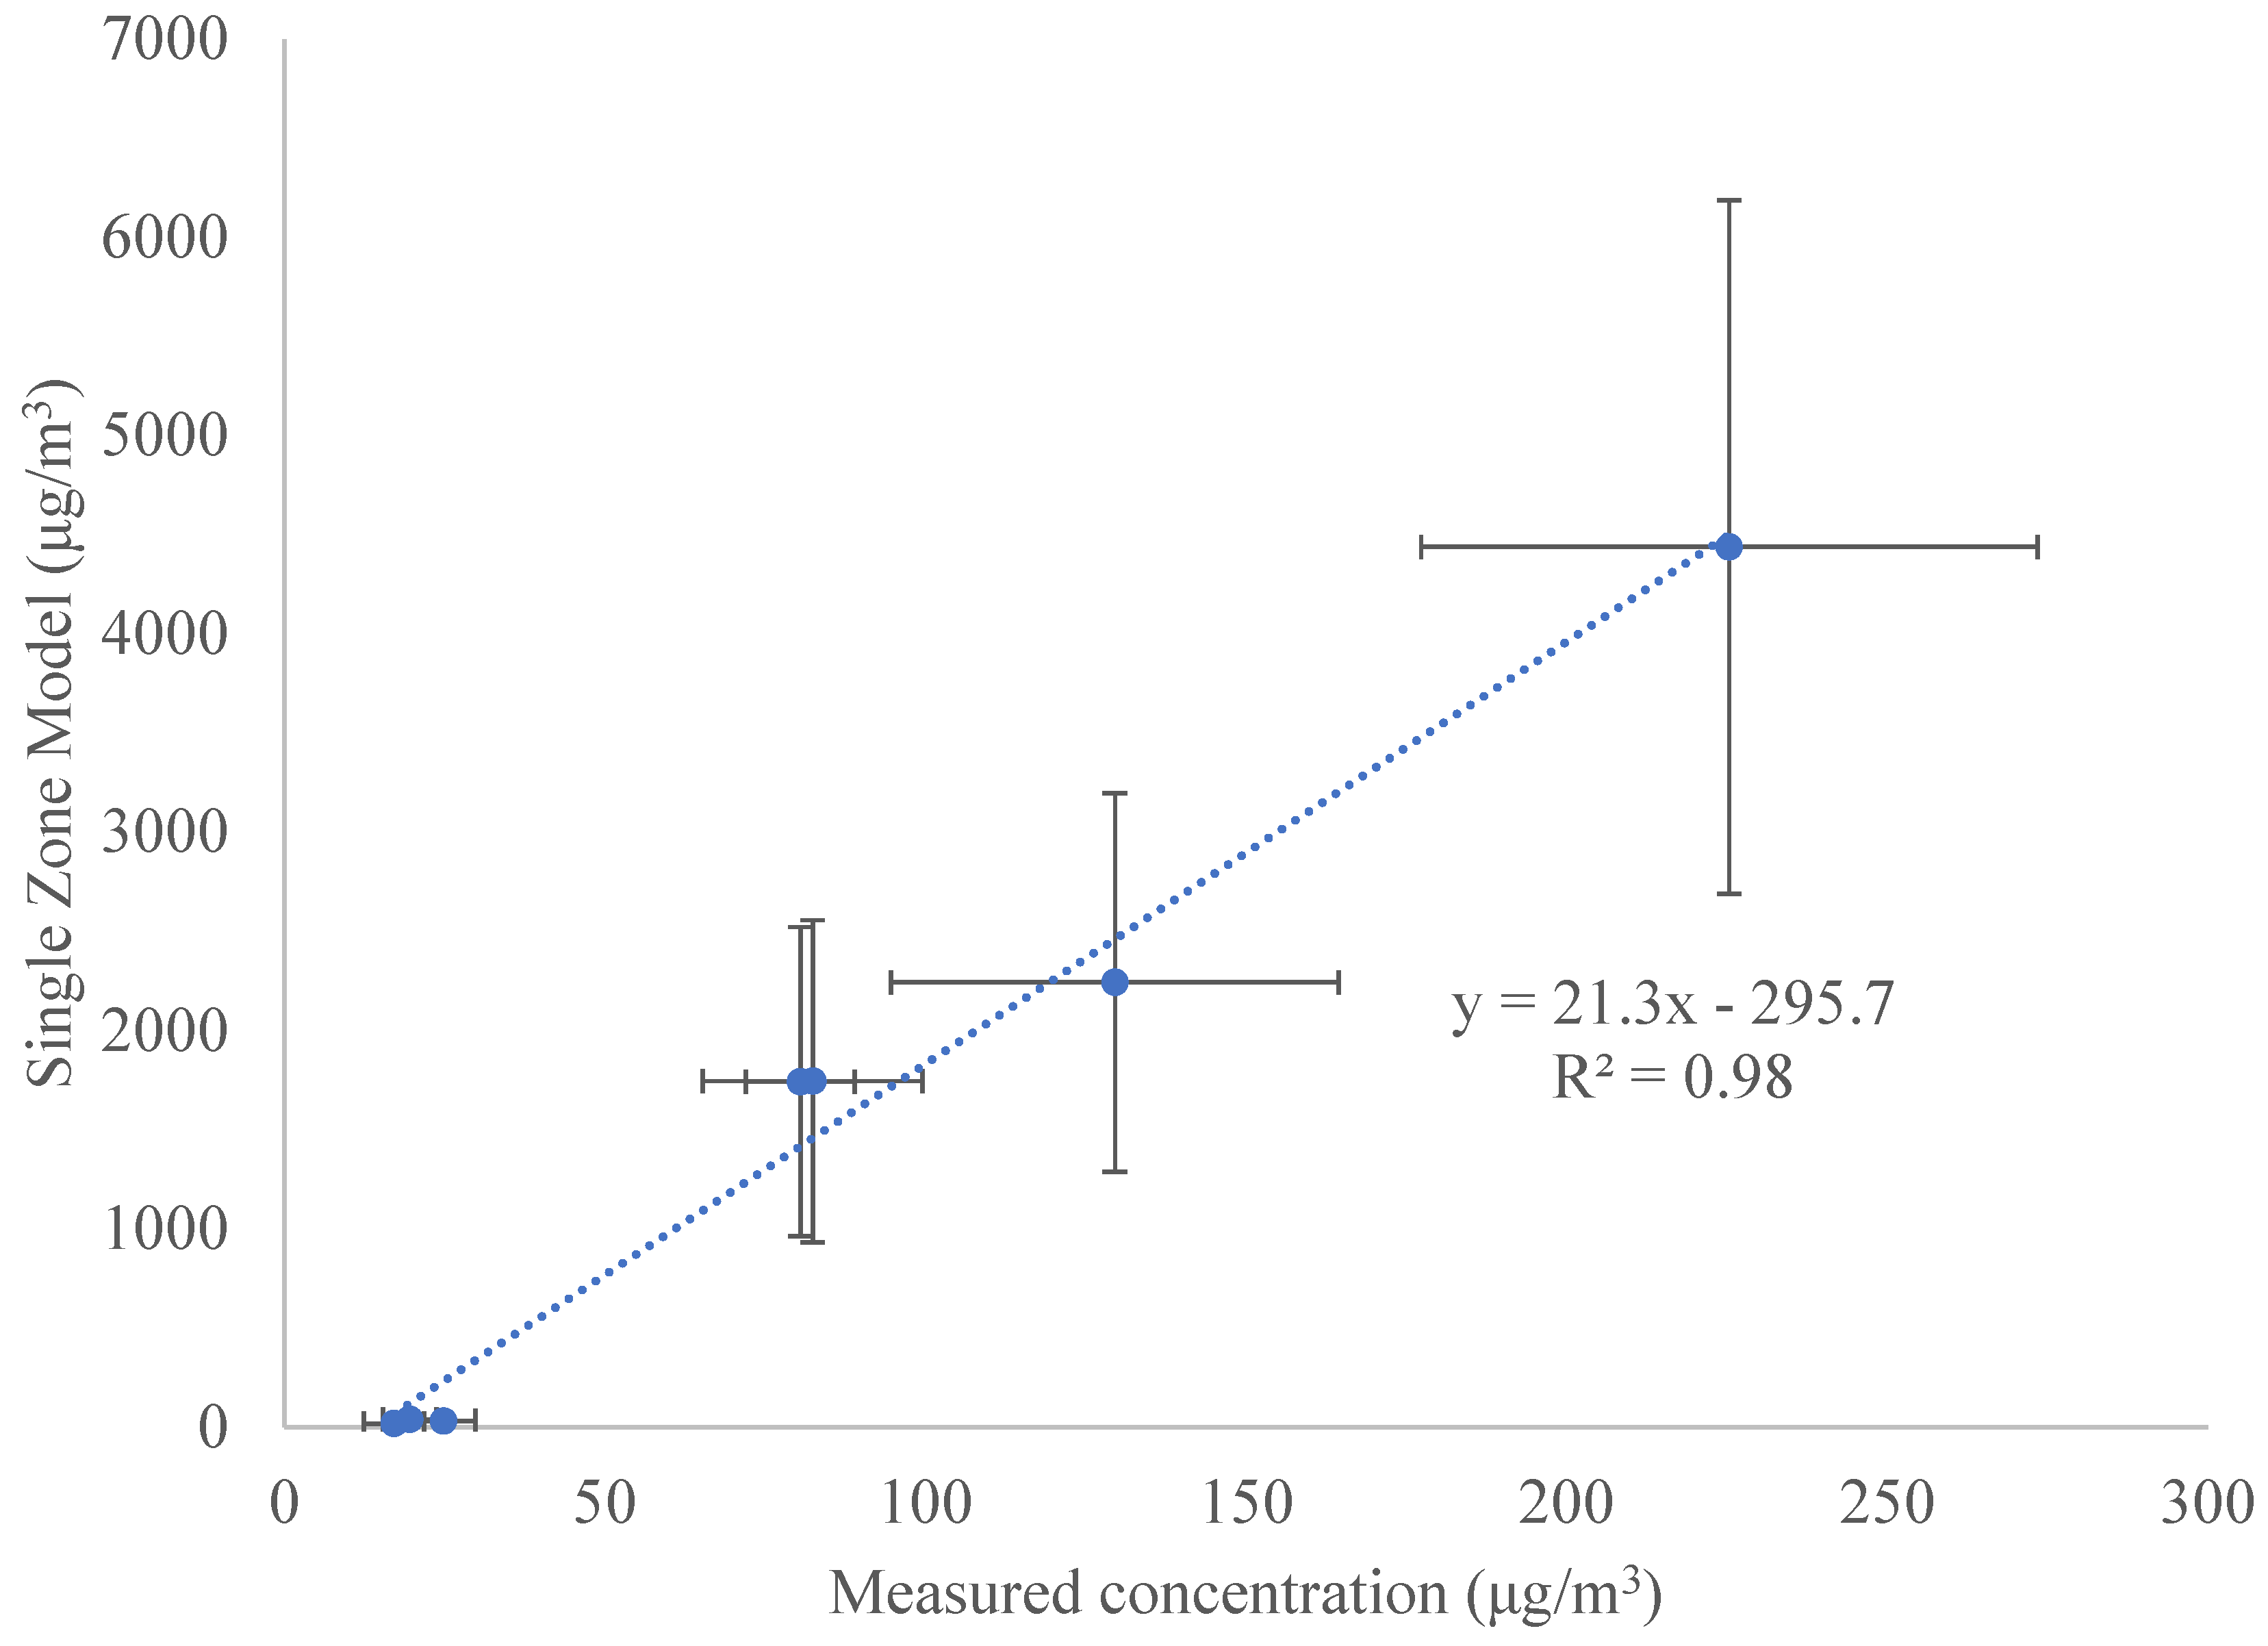
In comparison, Table 4 also shows PM2.5 indoor air concentrations calculated using SZM to estimate ISO tier levels which show significant differences between measured and SZM estimated indoor concentrations. The model does not show significant differences between field and simulated indoor concentrations for the LPG stove, which show similar values, and for the Patsari–LPG combination. For the Patsari, SZM overestimated indoor PM2.5 concentrations by a factor of 2. For the rest of the estimates that included a “U”-type traditional stove, SZM substantially overestimated indoor PM2.5 concentrations by a factor of 21. Figure 3 shows linear regression between the measured and SZM PM2.5 concentrations where there is a systematic overestimation of indoor air pollution by a factor of 21 in SZM compared to measured indoor air pollution in the kitchen (R2 = 0.98).

4. Discussion

Evaluation of stoves for climate and health endpoints has typically focused on evaluation of exclusive use of a single technology. The default ISO voluntary standard performance tiers for PM2.5 emissions relate emission rates from stoves during water boiling tests in laboratories to indoor air concentrations using an SZM simulation of which emission rates would produce indoor air concentrations equivalent to the indoor air concentration associated with each specific ISO tier, using default values for room size, ventilation, and cooking time. Although the WHO HOMES model allows for three emission sources (https://www.who.int/tools/household-multiple-emission-source-homes-model accessed on 1 July 2025), current ISO protocols and tiers are hard to adapt to the assessment of stove stacking combinations which have been shown to represent the majority of situations globally [11]. Further, a large body of evidence has now shown that emissions from water boiling tests in laboratories do not represent emissions during normal daily cooking activities, e.g., [7,17], as the combustion is fundamentally different from in-field tests [6]. ISO tiers for PM2.5 emissions were framed around dose–response curves for child acute lower respiratory infection where tiers were set to achieve levels of indoor air quality equivalent to relative risks for child ALRI of 3.15 (Tier 1), 3.0 (Tier 2), 2.5 (Tier 3), and 1.5 (Tier 4). Use of water boiling tests to determine ISO tiers will therefore not equate to a theoretical reduction in lower respiratory infections. Although the ISO protocol indicates that field studies are most appropriate to determine specific reductions, the ISO tier framework is widely used by donors, implementers, and procurement organizations as a criterion for product selection to help identify which products meet their goals. It is important, therefore, to develop regional benchmarks that do not include a systematic bias towards products based on overly optimistic estimates of benefits from some stoves, particularly if these are at the expense of interventions that have demonstrated reliable reductions in field studies.
In the current study, stove emissions and indoor concentrations for stacking combinations common to the Purepecha region were evaluated simultaneously through direct measurement and by using the single zone model (SZM) to determine ISO performance benchmarks. The results showed SZM overestimated measured indoor concentrations during the cooking of staple foods in a test kitchen with similar construction and ventilation to kitchens in homes in the Purepecha region. Overestimation of SZM in relation to indoor measurements has been reported by other studies [4,18,19]. Field measurements of emissions during uncontrolled cooking tests using the carbon balance approach in Kenya [18] showed similar overestimation to the current study using dilution hoods and controlled cooking tasks. Indoor PM2.5 concentrations in Kenya were overestimated by SZM by a factor of 21 for wood stoves without a chimney, a factor of 17 for charcoal stoves, and a factor of 2 for LPG stoves [18]. Similarly, for CO concentrations, in Kenya the model overestimated by a factor of 10 for biomass stoves, 4 charcoal stoves, and 5 for LPG stoves, respectively [18]. Ambient measurements of PM2.5 and CO were consistently low during the kitchen tests with a mean of 5 ± 1 µg/m3 for PM2.5 and 1 ± 1 mg/m3 for CO. Fugitive emissions from Patsari stoves were much lower than the default values for woodburning biomass stoves recommended by the World Health Organization (WHO). Even during normal cooking activities, these stove emissions represent from 1 ± 1% for CO to 3 ± 1% for PM2.5 of total emissions compared with the default values recommended by the WHO indoor air quality guidelines (25% of the total emission enters the kitchen; 10% standard deviation; range 1–50).
Reasons for the bias between measured and modeled indoor concentrations have largely focused on deviation from model assumptions that pollutants are completely mixed throughout the room. Measurements of pollution by height have shown stratified PM2.5 and CO concentrations with pooling of PM2.5 and CO higher in the kitchen [18]. Systematic investigation was conducted of the SZM performance in relation to room concentrations for 70 water boiling tests using a common rocket stove operating at known firepower and emission rates in a test kitchen constructed of wood framing and plywood sheathing with 48 evenly spaced 2-inch-diameter holes around the bottom perimeter and 48 along the top perimeter [20]. The results demonstrated that PM2.5 concentrations increased in an S-shaped curve, with less pronounced stratification with increasing ventilation. Importantly, the effects of ventilation on stratification were substantially eliminated once ventilation rates reached 20 ACH [20]. In comparison, ventilation rates of 42 ACH in the current study would imply a very limited stratification effect; however, SZM showed a substantial overestimate of the measured concentrations which was more pronounced for unvented solid fuel stoves (Figure 3). Importantly, the stoves in the current study and in Kenya [18] indicate that stoves with lower emission rates showed a smaller overestimation factor by SZM compared to stoves with higher emission rates. This systematically larger overprediction for stoves with higher emissions has important implications for comparisons to ISO voluntary standards, as expected reductions in indoor air concentrations and resultant estimates of potential health benefits from transitioning to lower emission stoves are similarly overestimated. Reconciling SZM-modeled concentrations and measured concentrations is therefore critical to derive relative risk estimates that reflect measured indoor concentrations. This is particularly important for Mexico where the National Cookstove Stove just launched by the Federal Government is relying on correctly estimating the health and other potential benefits associated with Patsari-type woodburning cookstoves and other options.
PM2.5 and other pollutants stratify vertically due to the upward buoyancy of the plume. In the kitchen environment, pollutant fumes from the cooking process are conveyed into the ambient air by convection plumes. The impacts of thermal plumes from kitchen appliances are well recognized empirically and theoretically [21,22,23]. With stoves, the heat emitted to the room has an instantaneous power significantly larger than the room heat losses which leads to thermal stratification in the room which can be computed from the plume volume flow, momentum, and buoyancy flux [22]. Strong buoyancy flow from direct emissions from the stove is observed and most of the particles emitted follow the thermal flume into the upper level of the kitchen [24]. Both simulations and measurements show strong plume effects that affect spatial concentrations of particles [25]. Higher firepower and higher emission factors from cookstoves also led to greater stratification [20]. Linear regression models of average emission, ventilation, and indoor concentrations from stoves in Kenya and stoves in the current study as shown in Table 5 showed strong relationships (Adjusted r2 = 0.96, p < 0.001) that allow for correction of the bias in ISO voluntary targets. Kitchen volume was not a significant predictor in these models but may be an important variable in studies with a wider distribution of volumes.
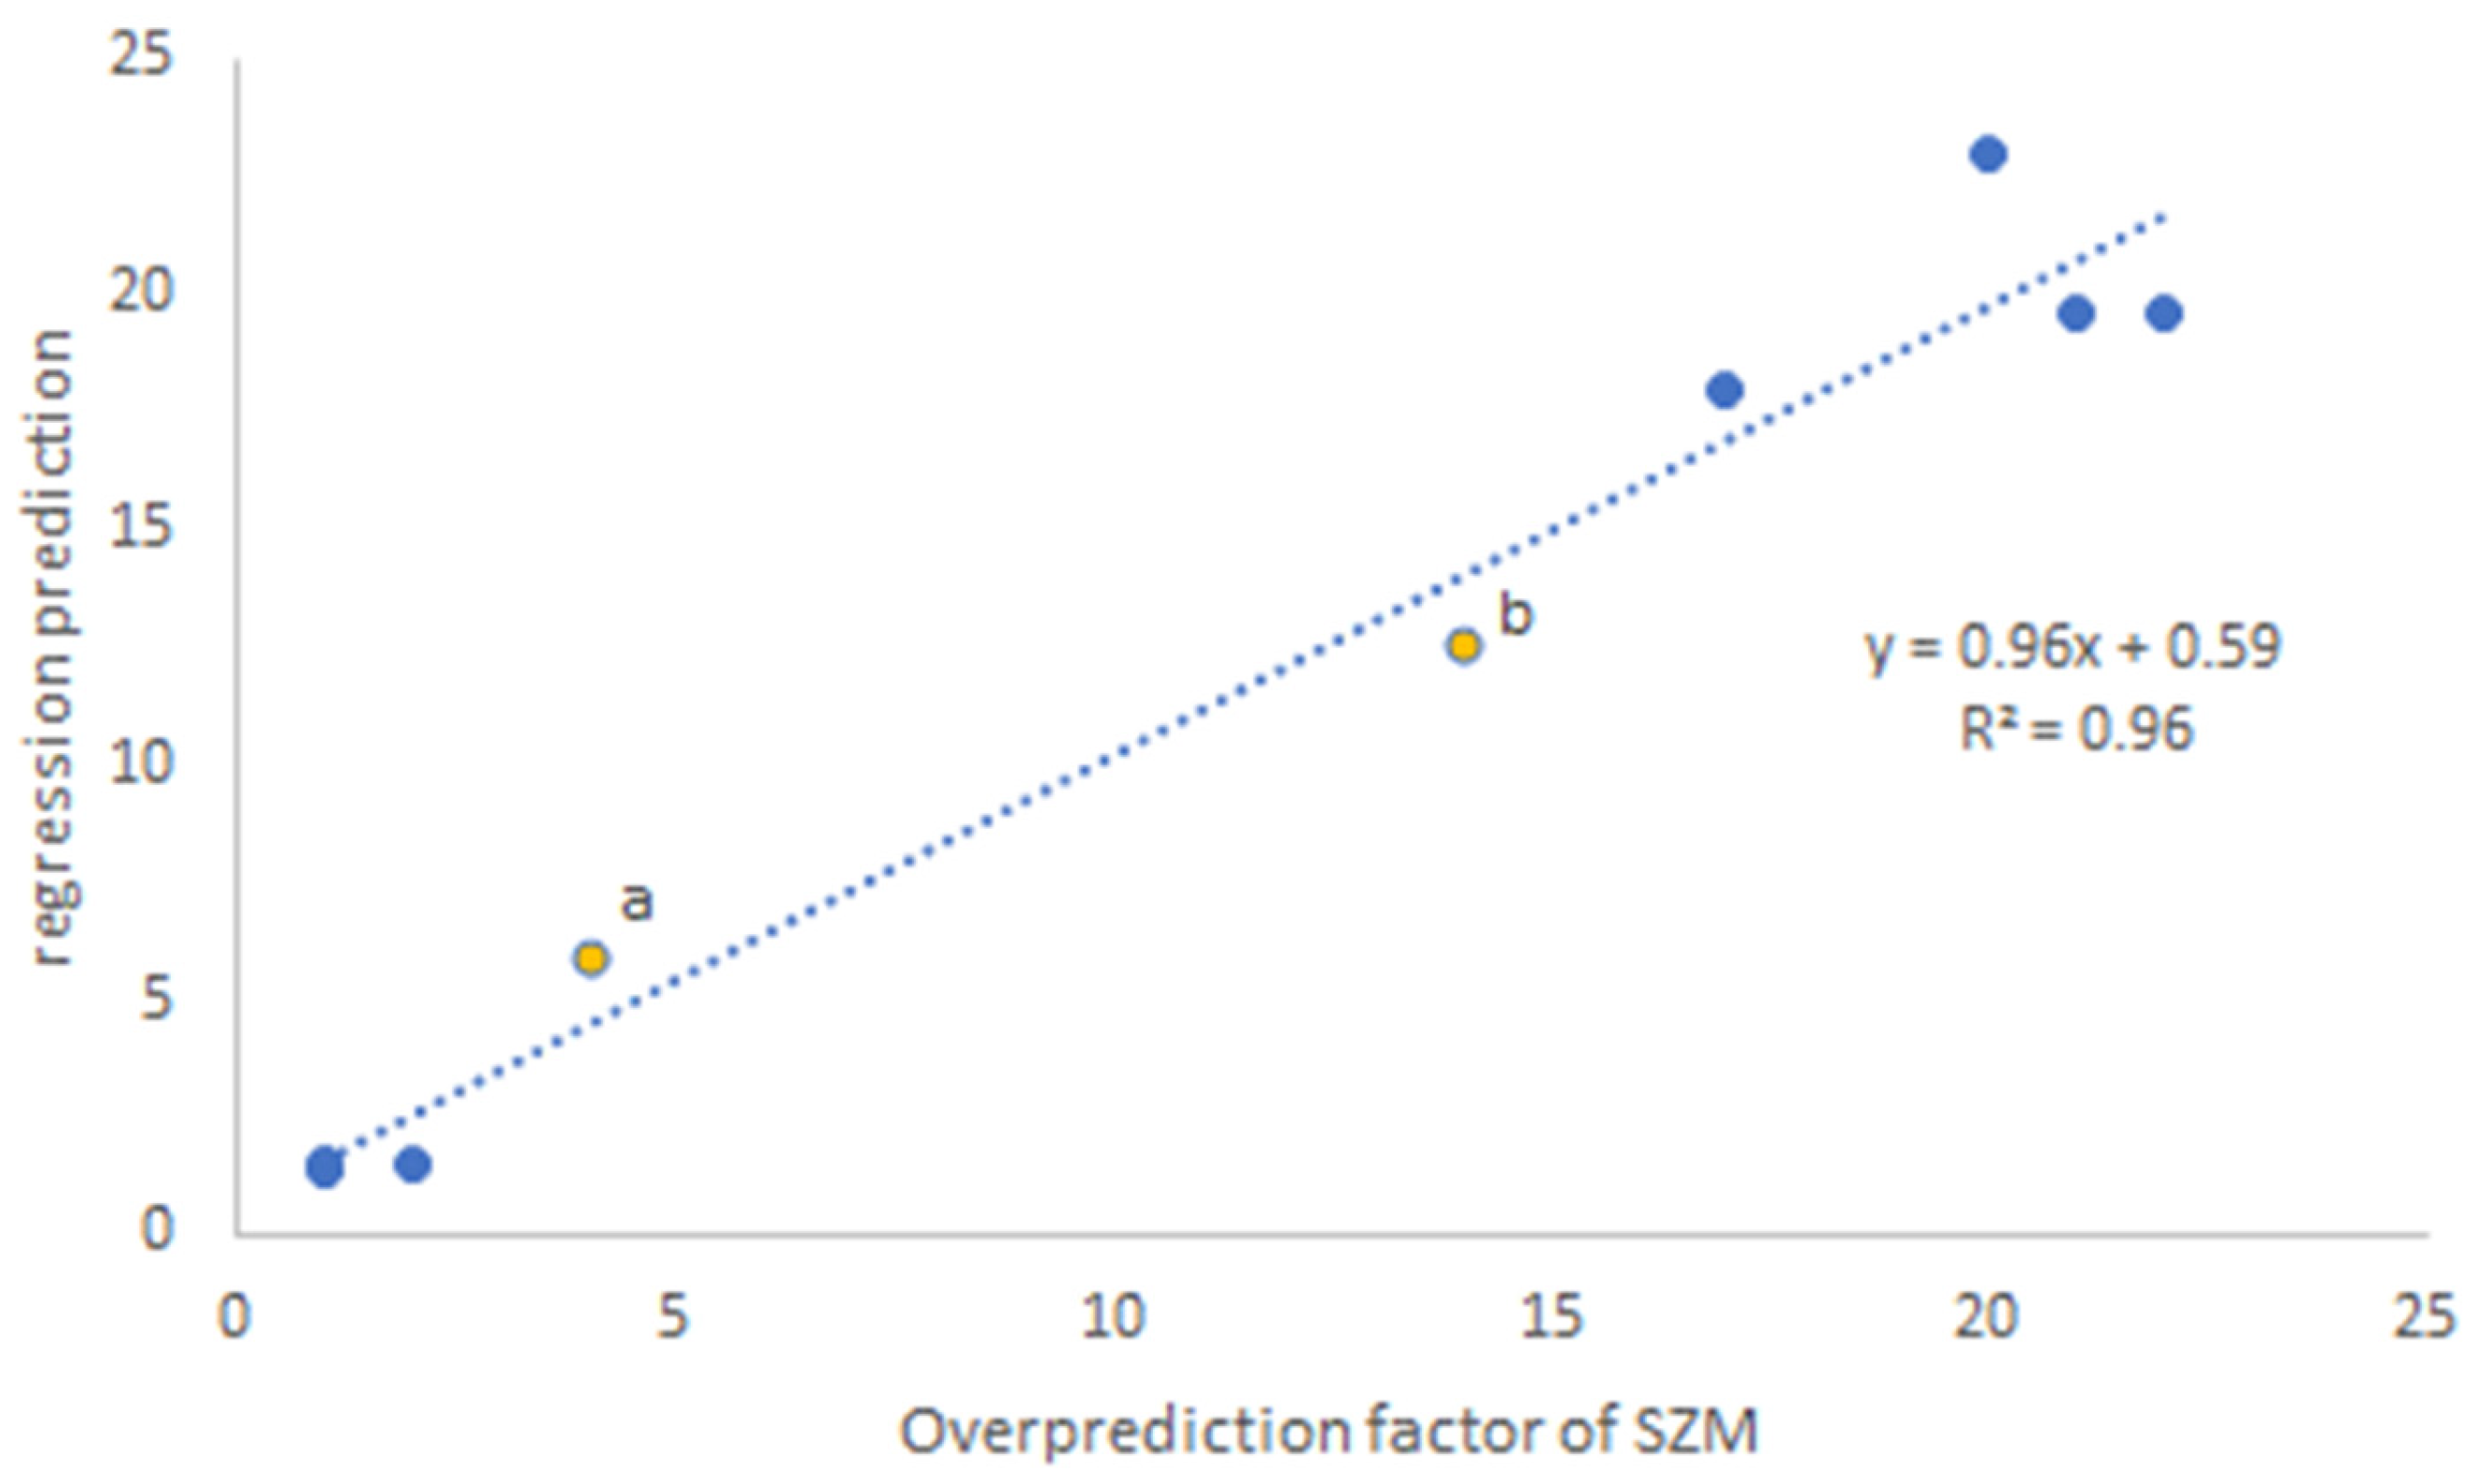
The stoves in Kenya [18] and in the current study were quite different in ventilation, kitchen volume, fuel type, stove type, cooking time and emissions. Figure 4 demonstrates, however, that overestimation of SZM for tests of unvented wood, charcoal stoves and LPG in Kenya were consistent with tests in the current study, which implies that similar thermal plume effects are present although in quite different contexts. While the current study focusses on the potential of these tests to derive local ISO benchmarks for the Purepecha region, these results imply that these models have the potential to be applicable more widely, with appropriate validation.
While less frequently discussed the ISO also allows for benchmark values to be determined for individual locations based on different model inputs and assumptions when neither the default nor the low and high ventilation conditions scenarios adequately represent the local conditions. The regression model in Table 5 can be used to derive region-specific ISO emission tiers 1–5 for the Purepecha region in Mexico (shown in Table 6). Although Table 6 shows regional benchmarks for CO, all stacking combinations including traditional ‘U’ type stoves were lower than the WHO AQG for CO similar to previous studies e.g., [8,26]. Since CO concentrations within the range of indoor concentrations measured in this study have been associated with increases in both cardiovascular and total deaths in European cities [27], and associated with negative impacts on neuropsychological performance in children as a result of exposures in the third trimester [28] current ISO benchmarks for CO should be revisited.
Although these models demonstrate that adjustment of ISO voluntary targets can be used to develop region-specific ISO tiers for Mexico, the stove types and geographical regions used to develop the model were limited, and a greater variety of stove models and comparisons would improve the models developed in this paper. In particular, a wider distribution of kitchen volumes would determine if kitchen volume plays a significant role in SZM overestimation. Similarly, a greater variety of controlled cooking tests typical of other regions of Mexico or Latin America should be evaluated to develop region-specific ISO benchmarks. Ventilation rates in the current study were based on a large-scale evaluation of ventilation rates in the region (42 ± 3, n = 23), seasonal variability can impact kitchen ventilation rates, which are not considered here. Despite these limitations the results demonstrate that adjustment for the systematic bias of SZM in developing voluntary ISO emission targets can be performed relatively simply for the Purepecha region, which better reflects the actual concentrations from cooking in real homes.

5. Conclusions

The following conclusions can be drawn from the results presented in this paper:
The SZM systematically overpredicted emissions based on thermal plume effects and ventilation which can be adjusted using the regression models provided to develop region-specific ISO benchmarks. Since zero stratification very seldom occurs in real ventilated spaces, adjustment of the ISO voluntary standards for systematic bias caused by plume buoyancy and ventilation is important in ensuring that the ISO benchmarks reflect the actual indoor concentration measured in homes. Use of the existing ISO approach would overestimate the benefits of implementation of LPG and clean alternatives, since the emission rate directly impacts the degree to which SZM overestimates indoor concentrations. Thus, locally-adjusted ISO benchmarks should be used to estimate the potential benefit of large cookstove programs such as the recently launched Mexican National Cookstove Program.
Regional benchmarks should be assessed using controlled cooking tests using stove stacking combinations in use in homes to generate a more accurate estimation of emissions that reflects concentrations in homes during daily cooking activities.
Fugitive emissions were ~3% and ~1% of primary emissions from Patsari stoves, and the indoor air concentrations from the use of Patsari or Patsari in combination with LPG were similar to those with the use of LPG alone.

Supplementary Materials

The following supporting information can be downloaded at: https://www.mdpi.com/article/10.3390/atmos16101127/s1, Figure S1: Linear regression between measured and SZM CO concentrations; Additional information on linear regression between measured indoor CO concentrations and modeled SZM CO concentrations.

Author Contributions

Conceptualization, R.D.E., O.M. and V.B.; methodology, V.M.R.-G. and M.d.L.C.I.; validation, O.M.; formal analysis, V.M.R.-G. and R.D.E.; investigation, V.M.R.-G., P.C.M.M., M.L. and J.V.; data curation, M.L.; writing—original draft preparation, V.M.R.-G. and R.D.E.; writing—review and editing, P.C.M.M., M.d.L.C.I., M.L., J.V., V.B. and O.M.; visualization, R.D.E.; supervision, O.M.; funding acquisition, R.D.E. and O.M. All authors have read and agreed to the published version of the manuscript.

Funding

This research was funded by NIH-5585744 Fogarty International Center Clean Cooking Implementation Science Network (ISN); SENER CONACYT 2014 246911 Cluster de biocombustibles sólidos para la generación térmica y eléctrica; Laboratorio Nacional CONAHCYT de Biocombustibles Sólidos (BIOENER) (ApoyoLNC-2023-40). The contents are solely the responsibility of the authors and do not necessarily represent the official views of the aforementioned institutions. Further, the aforementioned institutions do not endorse the purchase of any commercial products or services mentioned in the publication.

Institutional Review Board Statement

The results published here do not involve human subject research.

Data Availability Statement

Data sets used to generate the figures and tables are available upon request.

Acknowledgments

The authors thank Sarai Ramos, Juan Vazquez, Dante Villanueva, René Martinez, and Alfredo Fuentes at the LINEB, Bioenergy, and Ecotec lab facilities, and GIRA and GIEB for their support during measurement of field parameters.

Conflicts of Interest

The authors declare no conflicts of interest.

References

  1. Stoner, O.; Lewis, J.; Martínez, I.L.; Gumy, S.; Economou, T.; Adair-Rohani, H. Household cooking fuel estimates at global and country level for 1990 to 2030. Nat. Commun. 2021, 12, 5793. [Google Scholar] [CrossRef]
  2. Puzzolo, E.; Fleeman, N.; Lorenzetti, F.; Rubinstein, F.; Li, Y.; Xing, R.; Shen, G.; Nix, E.; Maden, M.; Bresnahan, R.; et al. Estimated health effects from domestic use of gaseous fuels for cooking and heating in high-income, middle-income, and low-income countries: A systematic review and meta-analyses. Lancet Respir. Med. 2024, 12, 281–293. [Google Scholar] [CrossRef] [PubMed]
  3. Jetter, J.; Zhao, Y.; Smith, K.R.; Khan, B.; Yelverton, T.; DeCarlo, P.; Hays, M.D. Pollutant emissions and energy efficiency under controlled conditions for household biomass cookstoves and implications for metrics useful in setting international test standards. Environ. Sci. Technol. 2012, 46, 10827–10834. [Google Scholar] [CrossRef] [PubMed]
  4. World Health Organization. WHO Guidelines for Indoor Air Quality: Household Fuel Combustion; World Health Organization: Geneva, Switzerland, 2014. [Google Scholar]
  5. Johnson, M.; Lam, N.; Brant, S.; Gray, C.; Pennise, D. Modeling indoor air pollution from cookstove emissions in developing countries using a Monte Carlo single-box model. Atmos. Environ. 2011, 45, 3237–3243. [Google Scholar] [CrossRef]
  6. Johnson, M.; Edwards, R.; Berrueta, V.; Masera, O. New approaches to performance testing of improved cookstoves. Environ. Sci. Technol. 2010, 44, 368–374. [Google Scholar] [CrossRef]
  7. Roden, C.A.; Bond, T.C.; Conway, S.; Pinel, A.B.O.; MacCarty, N.; Still, D. Laboratory and field investigations of particulate and carbon monoxide emissions from traditional and improved cookstoves. Atmos. Environ. 2009, 43, 1170–1181. [Google Scholar] [CrossRef]
  8. Johnson, M.A.; Garland, C.R.; Jagoe, K.; Edwards, R.; Ndemere, J.; Weyant, C.; Patel, A.; Kithinji, J.; Wasirwa, E.; Nguyen, T. In-home emissions performance of cookstoves in Asia and Africa. Atmosphere 2019, 10, 290. [Google Scholar] [CrossRef]
  9. Weltman, R.M.; Edwards, R.D.; Fleming, L.T.; Yadav, A.; Weyant, C.L.; Rooney, B.; Seinfeld, J.H.; Arora, N.K.; Bond, T.C.; Nizkorodov, S.A. Emissions measurements from household solid fuel use in Haryana, India: Implications for climate and health co-benefits. Environ. Sci. Technol. 2021, 55, 3201–3209. [Google Scholar] [CrossRef]
  10. Eilenberg, S.R.; Bilsback, K.R.; Johnson, M.; Kodros, J.K.; Lipsky, E.M.; Naluwagga, A.; Fedak, K.M.; Benka-Coker, M.; Reynolds, B.; Peel, J. Field measurements of solid-fuel cookstove emissions from uncontrolled cooking in China, Honduras, Uganda, and India. Atmos. Environ. 2018, 190, 116–125. [Google Scholar] [CrossRef]
  11. Shankar, A.V.; Quinn, A.K.; Dickinson, K.L.; Williams, K.N.; Masera, O.; Charron, D.; Jack, D.; Hyman, J.; Pillarisetti, A.; Bailis, R. Everybody stacks: Lessons from household energy case studies to inform design principles for clean energy transitions. Energy Policy 2020, 141, 111468. [Google Scholar] [CrossRef]
  12. Catalán-Vázquez, M.; Fernández-Plata, R.; Martínez-Briseño, D.; Pelcastre-Villafuerte, B.; Riojas-Rodríguez, H.; Suárez-González, L.; Pérez-Padilla, R.; Schilmann, A. Factors that enable or limit the sustained use of improved firewood cookstoves: Qualitative findings eight years after an intervention in rural Mexico. PLoS ONE 2018, 13, e0193238. [Google Scholar] [CrossRef] [PubMed]
  13. Traynor, G.; Apte, M.; Dillworth, J.; Hollowell, C.; Sterling, E. The effects of ventilation on residential air pollution due to emissions from a gas-fired range. Environ. Int. 1982, 8, 447–452. [Google Scholar] [CrossRef]
  14. Ruiz-García, V.M.; Edwards, R.D.; Ghasemian, M.; Berrueta, V.M.; Princevac, M.; Vázquez, J.C.; Johnson, M.; Masera, O.R. Fugitive emissions and health implications of plancha-type stoves. Environ. Sci. Technol. 2018, 52, 10848–10855. [Google Scholar] [CrossRef] [PubMed]
  15. Grabow, K.; Still, D.; Bentson, S. Test Kitchen studies of indoor air pollution from biomass cookstoves. Energy Sustain. Dev. 2013, 17, 458–462. [Google Scholar] [CrossRef]
  16. Champion, W.M.; Hays, M.D.; Williams, C.; Virtaranta, L.; Barnes, M.; Preston, W.; Jetter, J.J. Cookstove emissions and performance evaluation using a new ISO protocol and comparison of results with previous test protocols. Environ. Sci. Technol. 2021, 55, 15333–15342. [Google Scholar] [CrossRef]
  17. Johnson, M.; Edwards, R.; Frenk, C.A.; Masera, O. In-field greenhouse gas emissions from cookstoves in rural Mexican households. Atmos. Environ. 2008, 42, 1206–1222. [Google Scholar] [CrossRef]
  18. Johnson, M.; Piedrahita, R.; Pillarisetti, A.; Shupler, M.; Menya, D.; Rossanese, M.; Delapeña, S.; Penumetcha, N.; Chartier, R.; Puzzolo, E. Modeling approaches and performance for estimating personal exposure to household air pollution: A case study in Kenya. Indoor Air 2021, 31, 1441–1457. [Google Scholar] [CrossRef]
  19. Piedrahita, R.; Johnson, M.; Bilsback, K.R.; L’Orange, C.; Kodros, J.K.; Eilenberg, S.R.; Naluwagga, A.; Shan, M.; Sambandam, S.; Clark, M. Comparing regional stove-usage patterns and using those patterns to model indoor air quality impacts. Indoor Air 2020, 30, 521–533. [Google Scholar] [CrossRef]
  20. MacCarty, N.; Bentson, S.; Cushman, K.; Au, J.; Li, C.; Murugan, G.; Still, D. Stratification of particulate matter in a kitchen: A comparison of empirical to predicted concentrations and implications for cookstove emissions targets. Energy Sustain. Dev. 2020, 54, 14–24. [Google Scholar] [CrossRef]
  21. Mundt, E. Convection Flows in Rooms with Temperature Gradients-Theory and Measurements; DANVAK: Lyngby, Denmark, 1992. [Google Scholar]
  22. Georges, L.; Thalfeldt, M.; Skreiberg, Ø.; Fornari, W. Validation of a transient zonal model to predict the detailed indoor thermal environment: Case of electric radiators and wood stoves. Build. Environ. 2019, 149, 169–181. [Google Scholar] [CrossRef]
  23. Kosonen, R.; Koskela, H.; Saarinen, P. Thermal plumes of kitchen appliances: Idle mode. Energy Build. 2006, 38, 1130–1139. [Google Scholar] [CrossRef]
  24. Lai, A.C.; Chen, F. Modeling of cooking-emitted particle dispersion and deposition in a residential flat: A real room application. Build. Environ. 2007, 42, 3253–3260. [Google Scholar] [CrossRef]
  25. Lai, A.; Ho, Y. Spatial concentration variation of cooking-emitted particles in a residential kitchen. Build. Environ. 2008, 43, 871–876. [Google Scholar] [CrossRef]
  26. Shen, X.; Wang, P.; Zhang, X.; Cao, X.; Shi, Y.; Li, X.; Yao, X.; Yao, Z. Real-time measurements of black carbon and other pollutant emissions from residential biofuel stoves in rural China. Sci. Total Environ. 2020, 727, 138649. [Google Scholar] [CrossRef]
  27. Samoli, E.; Touloumi, G.; Schwartz, J.; Anderson, H.R.; Schindler, C.; Forsberg, B.; Vigotti, M.A.; Vonk, J.; Košnik, M.; Skorkovsky, J. Short-term effects of carbon monoxide on mortality: An analysis within the APHEA project. Environ. Health Perspect. 2007, 115, 1578–1583. [Google Scholar] [CrossRef] [PubMed]
  28. Dix-Cooper, L.; Eskenazi, B.; Romero, C.; Balmes, J.; Smith, K.R. Neurodevelopmental performance among school age children in rural Guatemala is associated with prenatal and postnatal exposure to carbon monoxide, a marker for exposure to woodsmoke. Neurotoxicology 2012, 33, 246–254. [Google Scholar] [CrossRef] [PubMed]
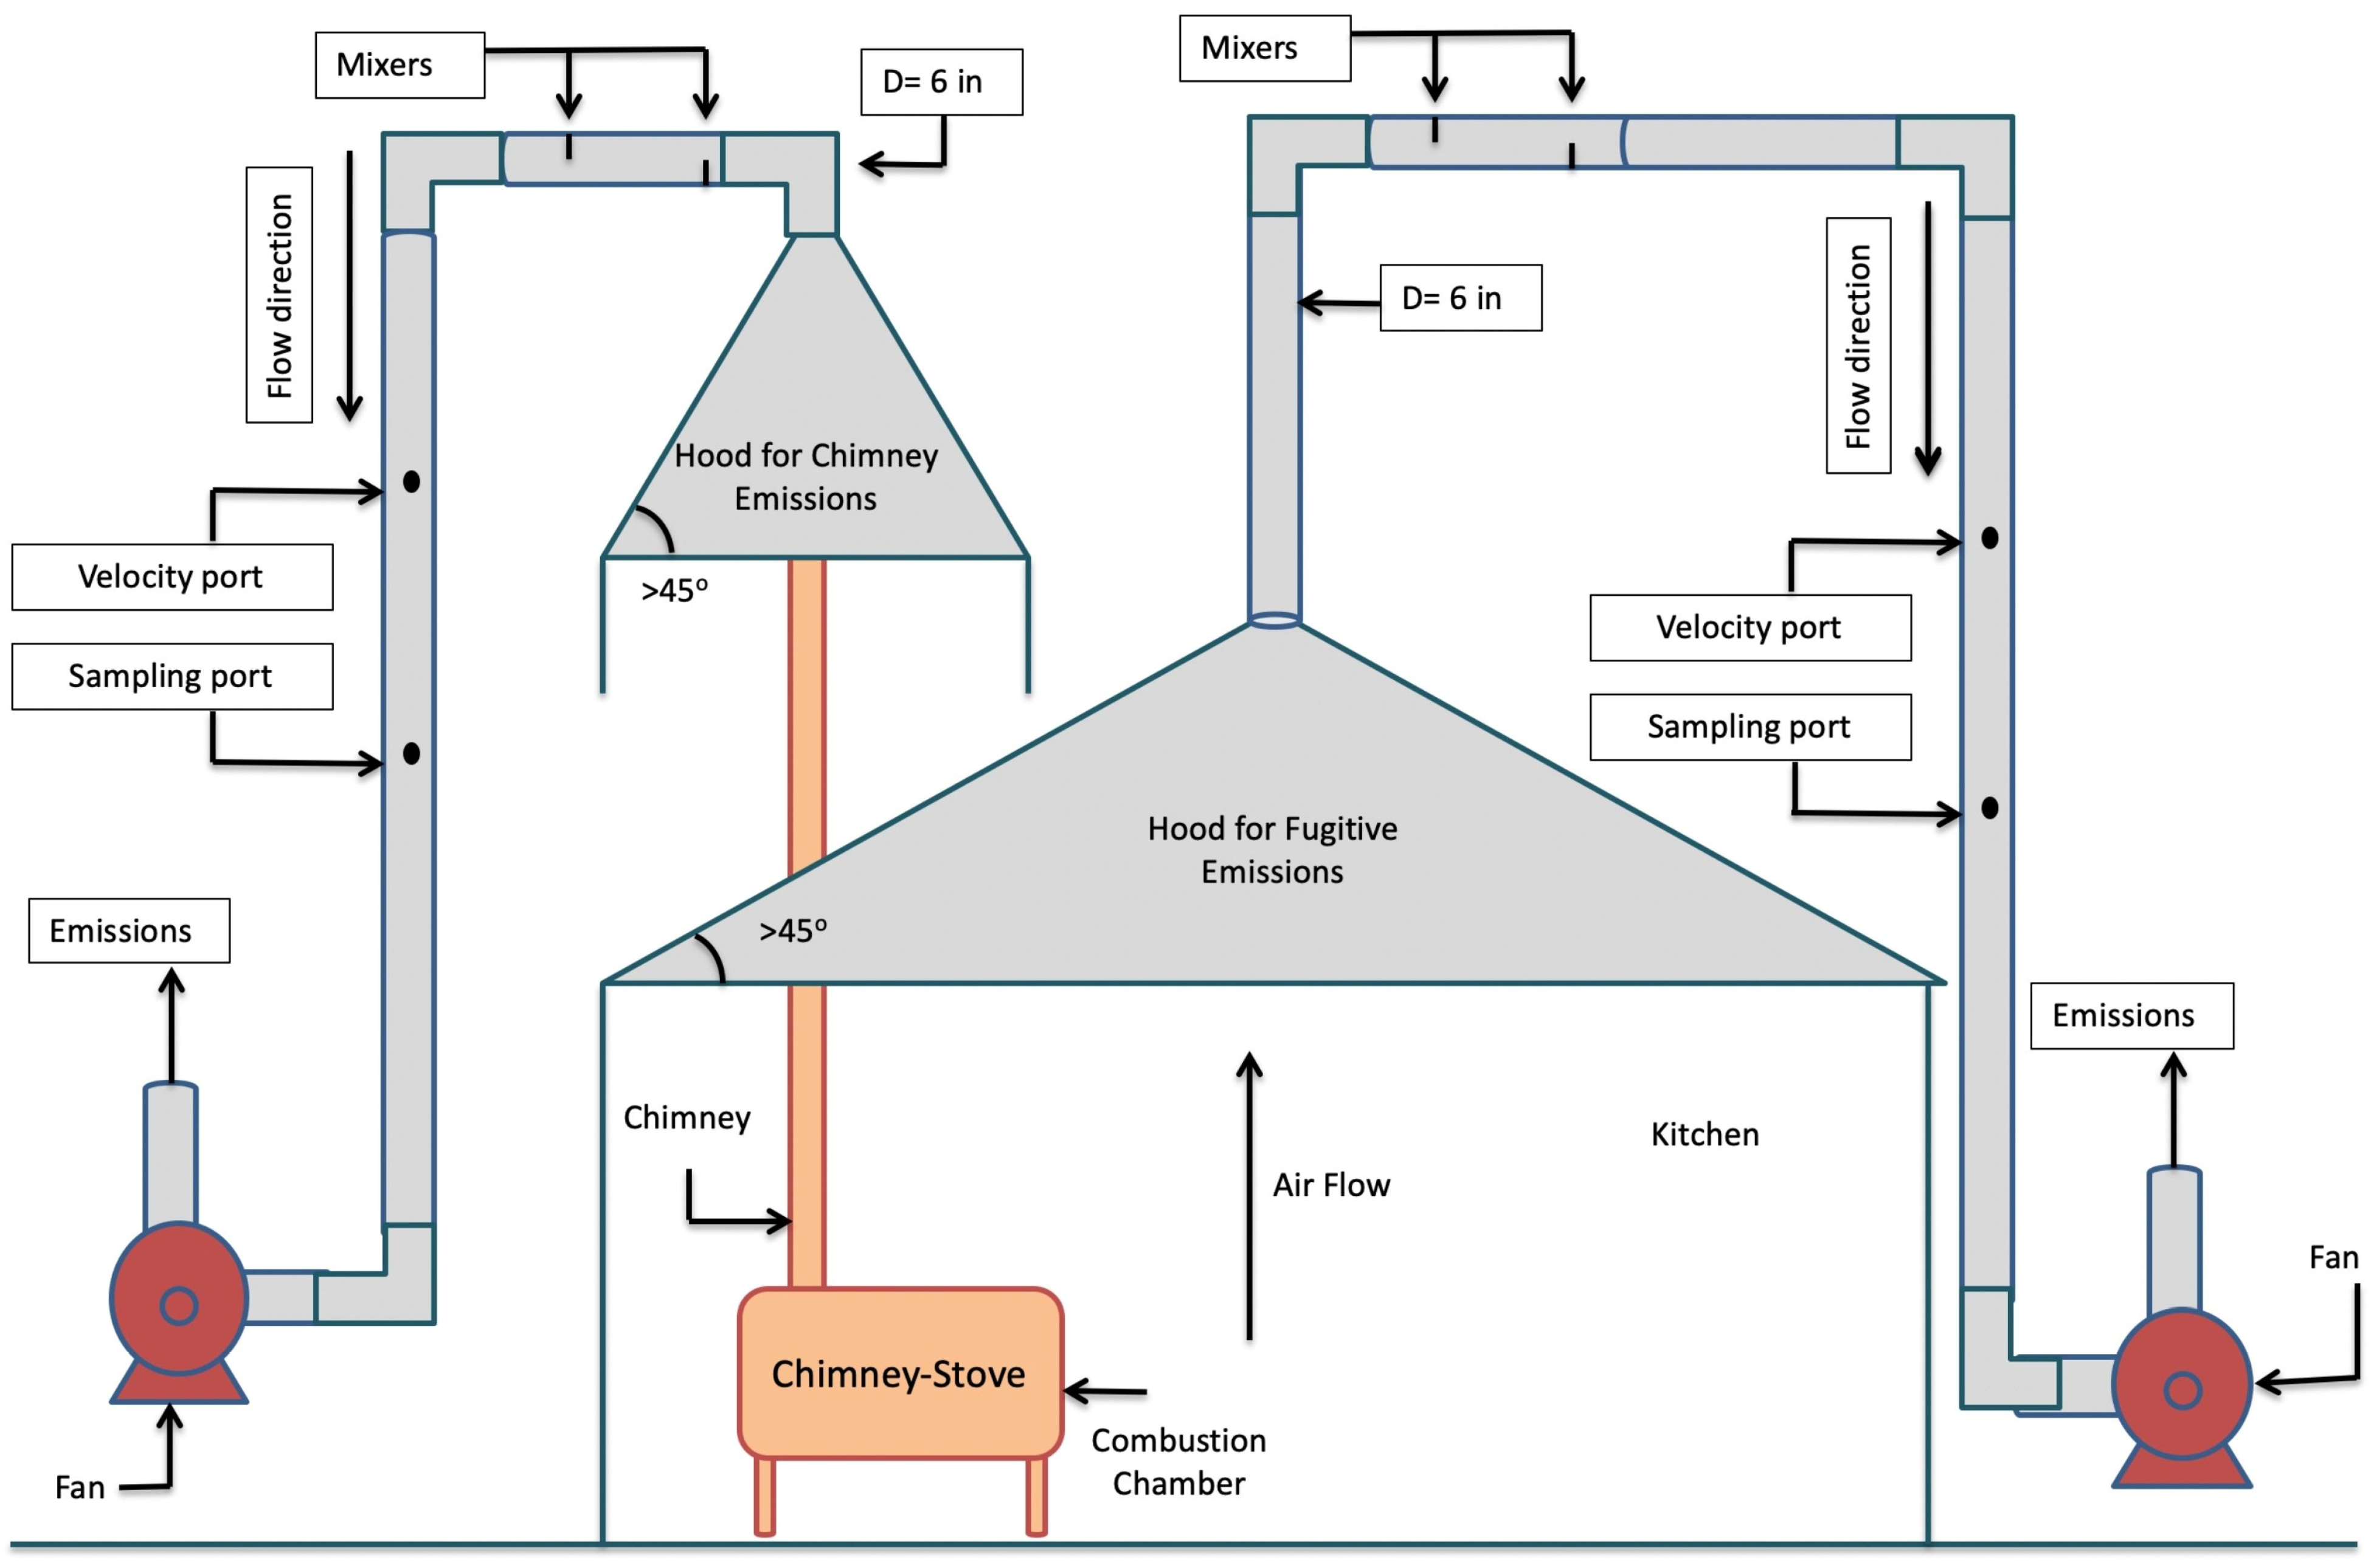
Figure 1. Double-hood scheme for field measurements (chimney and fugitive emissions).
Atmosphere 16 01127 g001
Figure 2. Simulated kitchen. (a) Diagram of the location of the IAP meters and cooking devices; (b) image of the location of the IAP meters and the cook during a CCC.
Atmosphere 16 01127 g002
Figure 3. Linear regression between measured and SZM PM2.5 concentrations.
Atmosphere 16 01127 g003
Figure 4. Plotted residuals from linear regression models. Charcoal a and Wood b from Johnson et al. [18].
Atmosphere 16 01127 g004
Table 1. Cooking Tasks and Which Stove Performs Each Task Under Different Stacking Options.
Cooking TaskStacking Option
Patsari-“U” TypePatsari-LPGLPG-“U” TypePatsari-LPG-“U” Type
1. TortillasPatsariPatsari“U” typePatsari
2. Fried ricePatsariPatsari“U” typePatsari
3. Boil beans“U” typePatsari“U” type“U” type
4. Boil waterPatsariLPGLPGLPG
5. Reheating (tortillas and meals)PatsariLPGLPGLPG
6. Fried food (eggs and beans)PatsariLPGLPGLPG
7. Nixtamal and heating bath waterPatsariPatsari“U” typePatsari
Table 2. Fugitive and Chimney Emission Rates for Different Stacking Options.
Stacking TypeChimney Emissions RateFugitive Emissions RatePercent of Overall
g CO2/minmg CO/minmg PM2.5/ming CO2/minmg CO/minmg PM2.5/minCO (%)PM2.5 (%)
Patsari54 ± 1.61.6 ± 0.261.3 ± 140.5 ± 0.118 ± 91.9 ± 0.31.1 ± 0.53.1 ± 1
“U” type58 ± 4.94.9 ± 2.1395.5 ± 180.758.1 ± 20.84873 ± 2145395.5 ± 180.7
Patsari47 ± 0.60.6 ± 0.268.2 ± 33.50.5 ± 0.110 ± 71.8 ± 0.11.5 ± 0.52.8 ± 0.9
LPG9 ± 0.020.02 ± 00.1 ± 0.19 ± 2.525 ± 80.1 ± 0.1
“U” type66 ± 5.25.2 ± 1.4361.2 ± 31.966 ± 6.65195 ± 1434361.2 ± 31.9
LPG9 ± 0.020.02 ± 00.1 ± 0.19 ± 2.525 ± 80.1 ± 0.1
Patsari37 ± 1.11.1 ± 0.250.5 ± 17.20.4 ± 017 ± 91.6 ± 0.31.5 ± 0.53.1 ± 0.4
“U” type58 ± 4.94.9 ± 2.1395.5 ± 180.758.1 ± 20.84873 ± 2145395.5 ± 180.7
LPG9 ± 0.020.02 ± 00.1 ± 0.19 ± 2.525 ± 80.1 ± 0.1
Patsari56 ± 1.71.7 ± 0.388.6 ± 44.80.6 ± 022 ± 132.5 ± 0.91.2 ± 0.43 ± 1
“U” type84 ± 6.36.3 ± 2.9471.6 ± 167.383.6 ± 2.76294 ± 2936471.6 ± 167.3
LPG10 ± 00 ± 0.20.2 ± 0.110 ± 0.428 ± 40.2 ± 0.1
Note: Values shown are mean ± standard deviation. For all tests, n = 5.
Table 3. Emissions Factors, Cooking Time, and Fuel and Energy Consumption During a CCC.
Stacking TypeEmission Factor (gC/kg Dry Fuel)MCETimeDry Fuel ConsumptionEnergy Consumption
CO2COPM2.5%mingMJ
Patsari437 ± 220 ± 21.7 ± 0.595.6 ± 0.4186 ± 246196 ± 216112 ± 4
“U” type362 ± 3147 ± 98 ± 1.288.5 ± 1.5162 ± 287309 ± 3110132 ± 56
Patsari445 ± 109 ± 22.1 ± 0.797.9 ± 0.4287 ± 558107 ± 585374 ± 27
LPG816 ± 14 ± 10.04 ± 099.6 ± 0.143 ± 4126 ± 276 ± 1
“U” type413 ± 950 ± 87.6 ± 0.489.1 ± 1.8230 ± 249988 ± 836180 ± 15
LPG816 ± 14 ± 10.04 ± 099.6 ± 0.143 ± 4126 ± 276 ± 1
Patsari423 ± 920 ± 21.9 ± 0.595.5 ± 0.5147 ± 133503 ± 18763 ± 7
“U” type362 ± 947 ± 98 ± 1.288.5 ± 1.5162 ± 287309 ± 3110132 ± 56
LPG816 ± 14 ± 10.04 ± 099.6 ± 0.143 ± 4126 ± 276 ± 1
Patsari437 ± 1821 ± 42.3 ± 1.195.4 ± 0.9350 ± 2312,272 ± 1538221 ± 28
“U” type395 ± 346 ± 217.4 ± 2.489.6 ± 4.3338 ± 1719,194 ± 981345 ± 22
LPG816 ± 14 ± 10 ± 099.6 ± 0.1251 ± 9838 ± 1139 ± 1
Note: Values shown are mean ± standard deviation. For all tests, n = 5.
Table 4. Indoor Air Pollution During a CCC.
Indoor Air Particulate Matter (PM2.5)Indoor Air Carbon Monoxide
Stacking TypeMeasured (Field)Modeled (SZM)p-ValueMeasured (Field)Modeled (SZM)p-Value
μg/m3μg/m3 mg/m3mg/m3
LPG (single)17 ± 518 ± 0.1<0.20.8 ± 0.20.03 ± 0.01<0.01
Patsari (single)20 ± 440 ± 11<0.051.7 ± 0.40.2 ± 0.1<0.01
Patsari-LPG25 ± 532 ± 6<0.22.8 ± 00.1 ± 0.05<0.01
Patsari-“U” type-LPG80 ± 81742 ± 779<0.012.7 ± 0.421.3 ± 9.6<0.05
Patsari-“U” type82 ± 171746 ± 812<0.012.2 ± 0.221.8 ± 10.5<0.01
“U” type-LPG130 ± 352244 ± 954<0.014.2 ± 132.1 ± 13.1<0.01
“U” type (single)225 ± 484438 ± 1748<0.013.7 ± 0.359.2 ± 25.5<0.01
Note: Mean ± standard deviation. Field IAP values were tested against SZM IAP using a t-distribution with *** α = 0.01, ** α = 0.05, and * α = 0.10.
Table 5. Linear regression of overprediction of SZM as a function of emission rate and ventilation.
Independent Variables
Dependentr2Adjusted r2Sig.(Constant) *Emission (mg/min) *ACH *
SZM overprediction0.960.95<0.0008.08 (2.60) 0.0170.05 (0.00) 0.00−0.16 (−0.19) 0.068
* β (Std error) sig.
Table 6. ISO Tier and Equivalent Emissions Rate for the Purépecha Region.
ISO TierParticulate Matter PM2.5Carbon Monoxide
Emission RateEmission Rate
Tiermg/minmg/min
5228
4961064
31892101
22833137
13764174
04705210
Disclaimer/Publisher’s Note: The statements, opinions and data contained in all publications are solely those of the individual author(s) and contributor(s) and not of MDPI and/or the editor(s). MDPI and/or the editor(s) disclaim responsibility for any injury to people or property resulting from any ideas, methods, instructions or products referred to in the content.