Article

Spatiotemporal and Synoptic Analysis of PM10 Based on Self-Organizing Map (SOM) During Asian Dust Events in South Korea

Atmospheric Environmental Research Department, National Institute of Environmental Research, Incheon 22689, Republic of Korea
*
Author to whom correspondence should be addressed.
Atmosphere 2025, 16(10), 1116; https://doi.org/10.3390/atmos16101116
Submission received: 18 August 2025 / Revised: 17 September 2025 / Accepted: 18 September 2025 / Published: 24 September 2025
(This article belongs to the Special Issue Atmospheric Aerosol Pollution)

Abstract

This study analyzes the spatiotemporal characteristics of PM10 across 53 Asian dust events that affected the Korean Peninsula between January 2019 and June 2024. Self-Organizing Map (SOM) analysis was applied to sea level pressure and 850 hPa wind fields from the NCEP/DOE Reanalysis II dataset, classifying synoptic patterns into four distinct clusters. Cluster 1, associated with a deep low over Manchuria and strong westerly inflow, produced the highest PM10 concentrations and the longest durations across most regions, with sharp afternoon peaks and the highest skewness values, and was mainly sourced from the Gobi Desert. Cluster 2 featured a high–low pressure dipole, generating localized impacts in northwestern regions and shorter durations, with moderate afternoon increases, originating primarily from the Gobi Desert and Inner Mongolia. Cluster 3, linked to a low east of Japan, resulted in elevated PM10 mainly in central and southeastern regions, with peaks often occurring earlier in the day, and was associated with Manchurian dust sources. Cluster 4 exhibited a straight northwesterly flow with the high shifted eastward, producing moderate but spatially widespread concentrations and relatively consistent afternoon peaks, also linked to Manchurian sources. These results suggest that integrating synoptic pattern classification into dust forecasting can improve accuracy, enable early recognition of high-concentration events, and support the development of timely and region-specific warning strategies.

1. Introduction

Asian dust should be regarded not simply as an air quality issue, but as a complex environmental phenomenon due to its variability and impact on public health (locally referred to as “Hwangsa” in Korea) [1]. In East Asia, springtime dust events frequently elevate particulate matter (PM10) concentrations, leading to severe air quality deterioration and significant public health concerns [2,3,4]. These dust storms primarily originate in the Gobi Desert in Mongolia and the Inner Mongolia and Manchuria regions of China, and are transported over long distances under the influence of strong surface winds, unstable atmospheric conditions, and strong upper-level winds [5,6,7]. During long-range transport, dust particles undergo significant chemical aging, often serving as reaction sites for secondary inorganic and organic aerosol formation [8,9]. Previous studies have reported that elevated PM10 levels from dust events pose serious respiratory health risks [10], underscoring the need for timely and accurate forecasting to protect public safety. However, recent trends in desertification and stagnant atmospheric conditions have increased the frequency and persistence of springtime dust events [2,11,12], making the prediction of large-scale dust transport across East Asia increasingly challenging. Notably, the spring of 2021 experienced exceptionally intense dust storms across northern China and East Asia, which have been documented as the strongest events in the past decade [13,14,15,16,17].
Asian dust has been studied from diverse perspectives, including the identification of source regions, simulation of transport routes, analysis of synoptic conditions, and assessment of air quality impacts. Meteorological factors play a critical role in dust generation and long-range transport, as demonstrated by numerical model simulations of dust movement and concentrations [18]. As part of these studies, Lagrangian models have been employed to investigate dust dispersion mechanisms [19], detailed simulations of a major 1998 dust event were conducted within a regional forecasting framework [20], and spatial dust distributions across China have been analyzed using combined satellite imagery and ground-based observations [21]. In the Korean context, numerous dust events affecting the Korean Peninsula have been statistically categorized to identify common synoptic conditions for high-concentration episodes [22], and the relationships between meteorological factors and PM10 concentrations have been examined to propose methods for improving forecasting accuracy [23].
In this context, Korea operates an air quality forecasting system encompassing PM10, PM2.5 and O3. The National Institute of Environmental Research (NIER) provides PM10 forecasts for 19 regions nationwide based on daily mean concentrations, classifying them as “Good” (≤30 µg m−3), “Moderate” (31–80 µg m−3), “Bad” (81–150 µg m−3), or “Very Bad” (≥151 µg m−3). A PM10 advisory is issued when the hourly mean concentration is ≥151 µg m−3 for at least two consecutive hours, and a PM10 warning when it is ≥300 µg m−3 for at least two consecutive hours. Although these forecasts rely on atmospheric chemistry models and air quality monitoring data, accurate dust prediction requires the integration of synoptic meteorological analysis and the expertise of trained meteorologists.
Therefore, the Korea Meteorological Administration (KMA), the National Institute of Meteorological Sciences (NIMS), and NIER jointly convene the “Emergency Response Team for Asian Dust and Fine Dust” (DustER-Team) when synoptic patterns suggest the potential transport of dust originating from the Gobi Desert, Inner Mongolia, or Manchuria to the Korean Peninsula. However, the location and intensity of dust intrusions into Korea can vary substantially depending on the emission magnitude at the source regions and the configuration of synoptic pressure systems, which complicates the delivery of precise forecasts and timely information. A classification framework that integrates synoptic pattern analysis with spatial PM10 variability is highly needed, and this study presents such a framework.
To enhance the spatial and temporal accuracy of PM10 forecasting in Korea, this study proposes a classification framework for Asian dust events using the Self-Organizing Map (SOM), an unsupervised machine learning technique. SOM was applied to classify the synoptic meteorological patterns of dust events and to analyze the spatiotemporal PM10 characteristics for each pattern. Unlike previous studies that primarily used SOM for meteorological pattern classification or atmospheric variable analysis, this study combines synoptic pattern classification with PM10 feature analysis, enabling a more comprehensive assessment of dust impacts.

2. Materials and Methods

2.1. Data and Case Selection

This paper examined 53 cases of Asian dust that impacted the Korean Peninsula during the period from January 2019 to June 2024. Meteorological data were obtained from the NCEP/DOE Reanalysis II dataset provided by the National Oceanic and Atmospheric Administration (NOAA), which provides global atmospheric variables at 6 h intervals from 1979 to the present. Specifically, sea level pressure (SLP) and the horizontal wind components (u and v) at the 850 hPa level were extracted at 6 h intervals. The 850 hPa level is widely recognized as a key transport layer for Asian dust [24,25]. In several documented cases, strong northwesterly winds at this level, driven by cyclonic activity over Mongolia, have transported dust toward the Korean Peninsula [24,25]. The analysis domain covers East Asia, approximately from 20° to 60° N and 100 to 150° E, with a spatial resolution of 2.5° (Figure 1a).
PM10 concentration data were obtained from AirKorea (https://www.airkorea.or.kr/web/) (accessed on 9 September 2025), operated by the Korea Environment Corporation (KECO) under the Ministry of Environment (MOE). AirKorea is a national web-based platform that provides hourly observations of major air pollutants (PM10, PM2.5, ozone, nitrogen dioxide, carbon monoxide, and sulfur dioxide), collected from more than 600 monitoring stations across the country, including urban, roadside, and background sites. In this study, we used data from 531 urban air quality monitoring stations, focusing on areas where the population is most concentrated. This extensive monitoring network provides essential observational data for accurately analyzing the spatial and temporal characteristics of air quality deterioration events. For each Asian dust event between 2019 and 2024, hourly PM10 measurements from nationwide monitoring stations were compiled and aggregated into 19 forecast regions (Figure 1b,c). For each region, two metrics were calculated per event: (1) the average PM10 concentration and (2) the duration of dust influence. The duration was defined as the time span from the initial increase in PM10 concentrations above 81 µg m−3 to their complete dissipation below that threshold. These regional metrics were then averaged across events within each synoptic cluster to capture temporal patterns, hourly box plots, mean values, and skewness of PM10 concentrations were analyzed. Skewness, a statistical measure of distribution asymmetry, was used to identify clusters with a higher frequency of high concentrations. Asian dust cases were selected based on events identified by the DustER-Team. The term “expected PM10 impact” refers to model simulations by NIER (https://www.airkorea.or.kr/web/dustForecast?pMENU_NO=113) (accessed on 9 September 2025) and KMA (https://www.weather.go.kr/w/dust/model-prediction.do) (accessed on 9 September 2025) indicating dust inflow and potential increases in PM10 concentrations, even when dust was not visually observed. Selection was made based on the expected PM10 impact in Korea, and as such, some cases may not exactly match the official dust observation dates designated by the KMA. The above cases are listed in Appendix A for each cluster and were identified through the DustER-Team using a combination of synoptic meteorological conditions, dust transport model outputs, and observed PM10 increases to distinguish them from non-dust haze episodes.

2.2. Self-Organizing Map (SOM)

SOM, developed by Teuvo Kohonen, is an unsupervised learning algorithm based on artificial neural networks [26]. It projects high-dimensional data onto a two-dimensional grid, enabling the classification of patterns based on data similarity while preserving topological relationships. SOM has been widely applied in atmospheric sciences due to its ability to quantitatively classify and visualize complex meteorological patterns [27,28,29,30,31]. The SOM architecture comprises an input layer and a competitive layer, the latter consisting of neurons arranged in a two-dimensional grid. Each neuron is associated with a weight vector w j that has the same dimensionality as the input vector x , and all weights are randomly initialized at the beginning of training. During training, the Euclidean distance | | x w j | | is computed between the input vector and each neuron’s weight vector to identify the Best Matching Unit (BMU). Once the BMU is identified, the weight vectors of the BMU and its neighboring neurons are updated to more closely reflect the input data. Both the learning rate and the neighborhood radius decrease over time, allowing the network to gradually converge [26].
SOM has been widely utilized in atmospheric science for classifying various synoptic and mesoscale patterns. For example, SOM has been applied to classify North Atlantic Oscillation (NAO) patterns [27,28], and to identify large-scale circulation types [29]. In Korea, it has been used to classify mesoscale precipitation systems [30] and to analyze strong wind patterns on the lee side of mountain ranges [31]. The present study adopts the SOM framework and methodological design proposed in [31].
In this study, the SOM algorithm was applied using sea level pressure (SLP) and 850 hPa wind fields (u and v components) at the time of inflow into the Korean Peninsula for each Asian dust event as input variables. The gridded meteorological data over the East Asian domain (20–60° N, 100–150° E) were vectorized to form a high-dimensional input matrix. To determine the optimal number of clusters, various SOM grid configurations—from 1 × 1 to 3 × 10—were tested, and both the slope of the Explained Cluster Variance (ECV) and the Topographic Error (TE) were evaluated [31,32]. Based on the evaluation metrics, a four-cluster SOM configuration was selected as optimal. At this point, the slope of the ECV curve plateaued, indicating minimal information loss, and the TE was also lower than in other configurations, suggesting improved cluster separation. ECV is defined as the ratio of the within-cluster sum of squares (WSS) to the total sum of squares (TSS), which quantifies how well the cluster centroids represent the data [32]. Although ECV generally increases with the number of clusters, the marginal gain diminishes beyond a certain point, signaling a potential risk of overfitting [32].
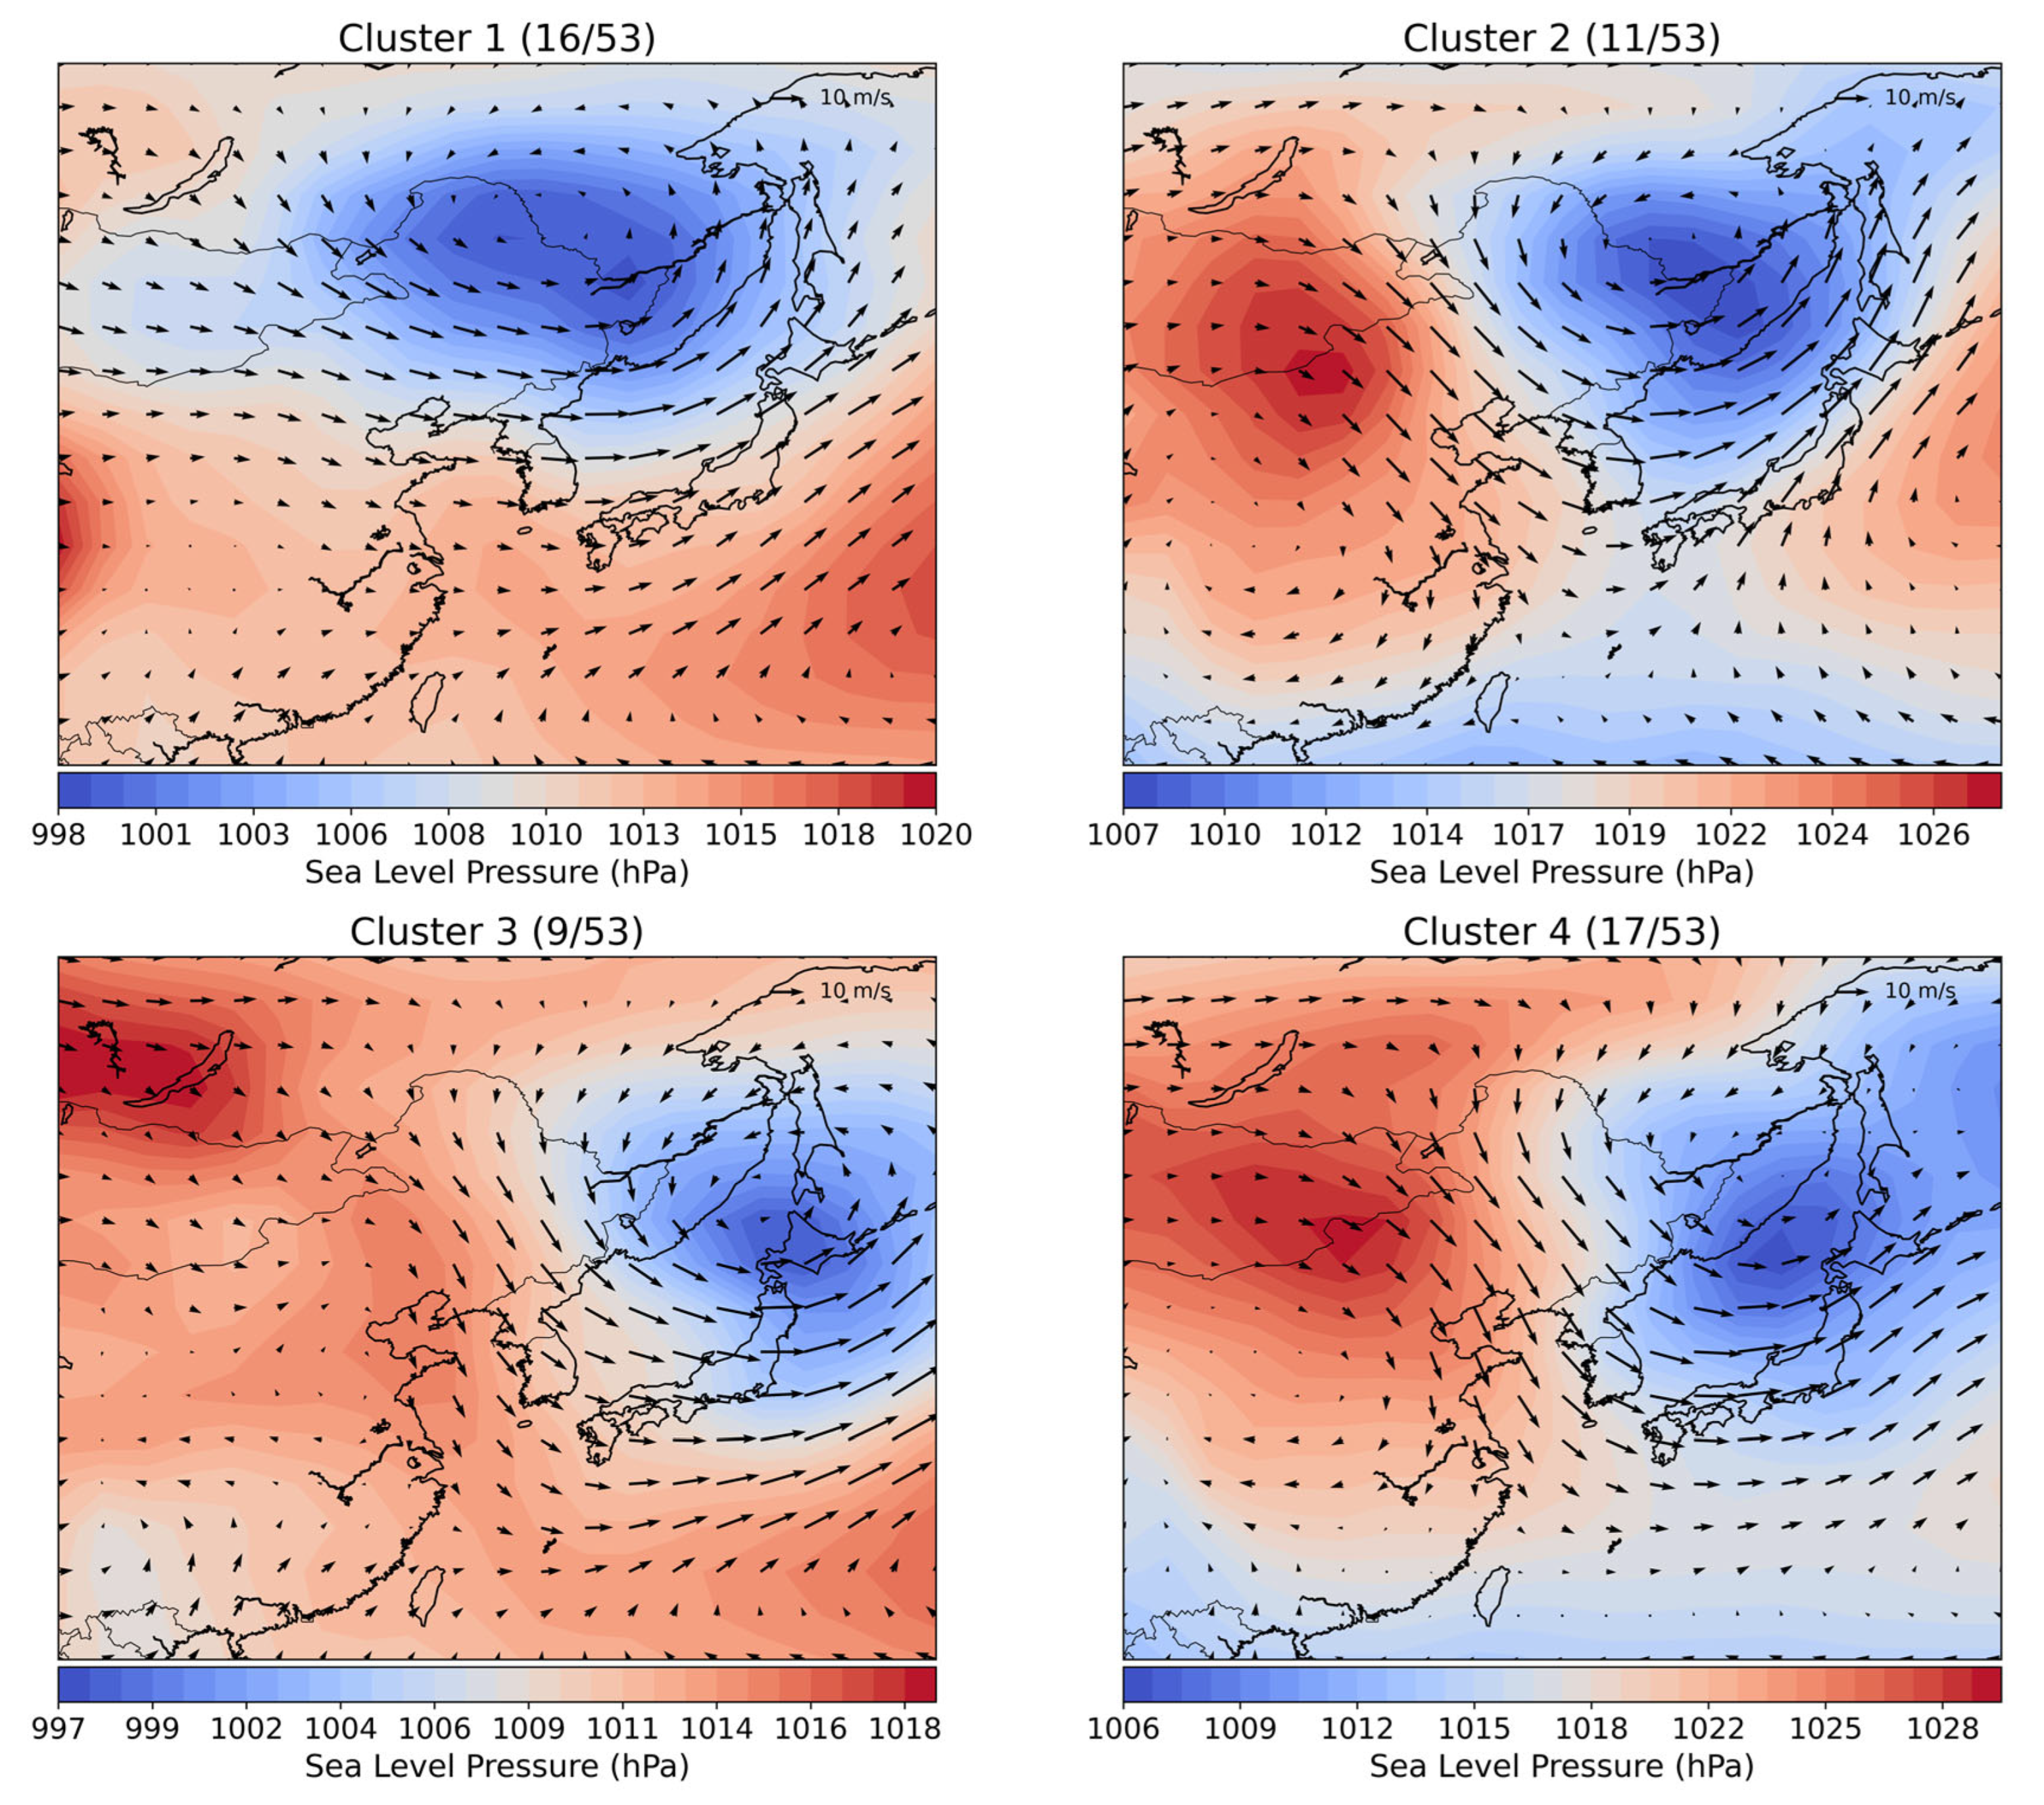
Considering all evaluation metrics, we concluded that a four-cluster SOM configuration offered the optimal balance between minimizing overfitting and maximizing interpretability and consistency with observed dust event patterns. Accordingly, the final SOM classification was performed using four clusters (Figure 2).
To the best of our knowledge, this study represents the first attempt to apply the Self-Organizing Map (SOM) to systematically classify synoptic patterns of Asian dust events over Korea and to evaluate their spatiotemporal PM10 characteristics.

3. Results

3.1. Spatial Distribution Characteristics of PM10 by Cluster

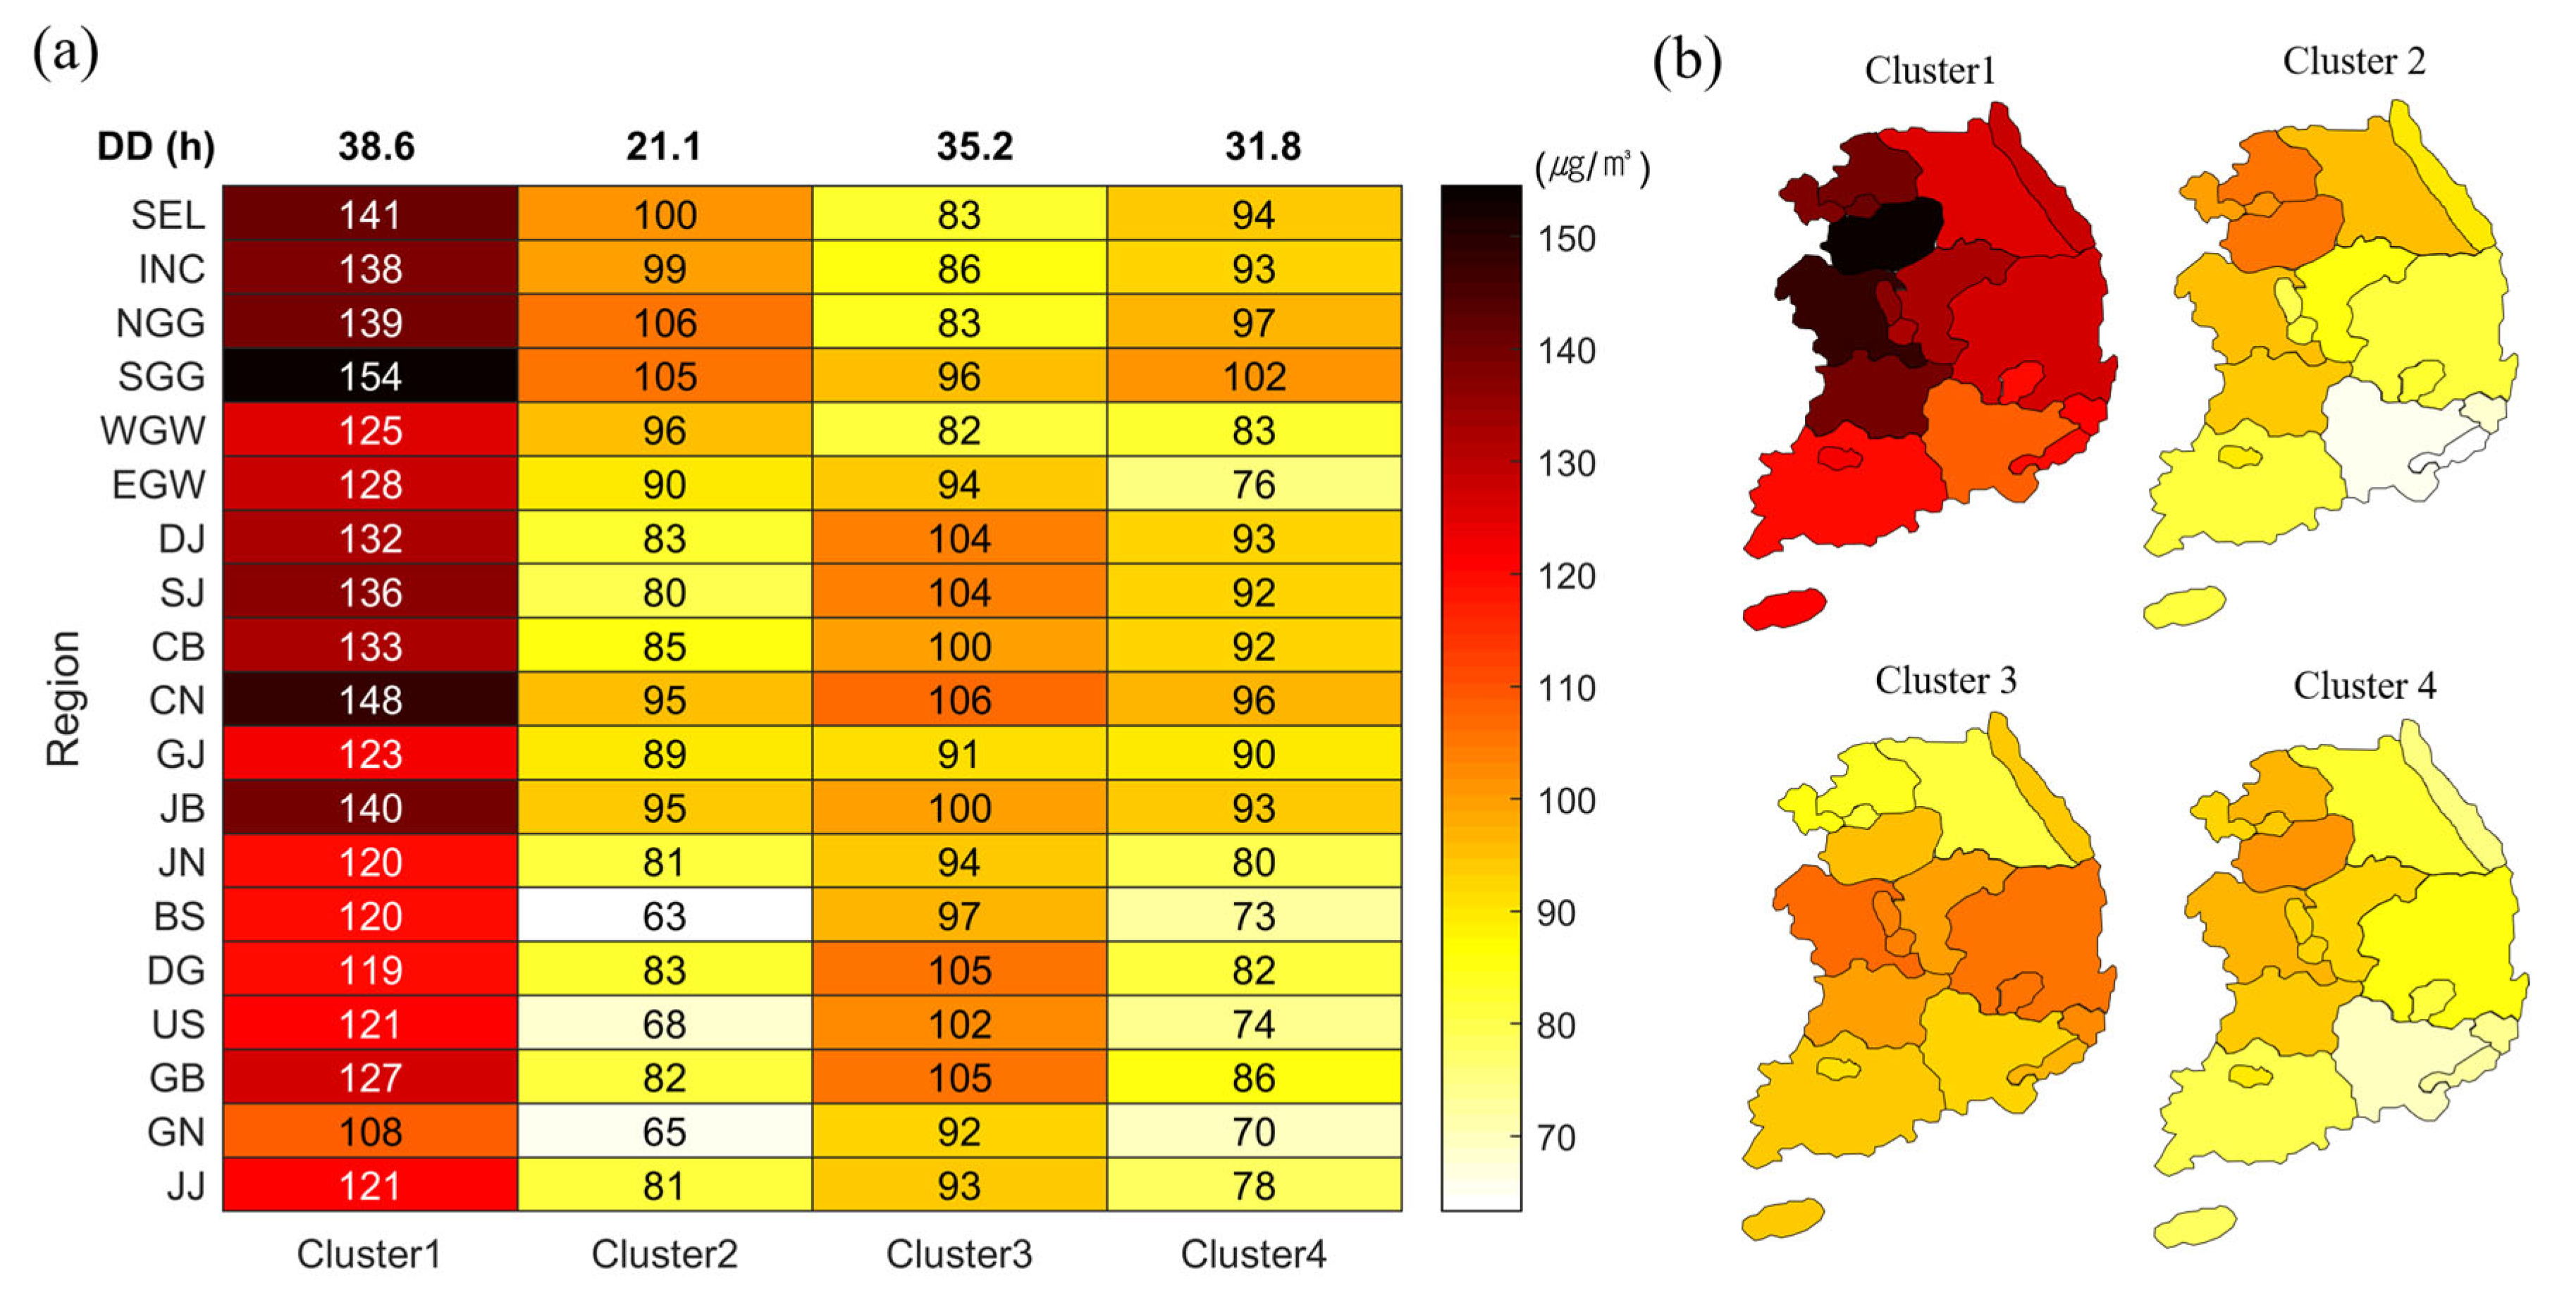
The four clusters derived from the SOM analysis exhibited distinct synoptic pressure patterns, which in turn resulted in clear differences in the spatial distribution of PM10 concentrations and the regions affected (Figure 3 and Figure 4). Based on these results, the spatial characteristics and impact intensity of Asian dust events were quantitatively compared across the clusters.
Cluster 1 primarily represents dust originating from the Gobi Desert, transported to the Korean Peninsula under the influence of a deep low-pressure system over the Manchuria–Russia border and strong westerly winds at 850 hPa. A total of 16 cases fell into this cluster, with a mean PM10 concentration of 130 µg m−3 across the peninsula. The highest concentration was observed in SGG (154 µg m−3), and several western regions—including SEL, INC, NGG, CN, and JB—also exceeded 130 µg m−3. Even in non-western regions, concentrations were around 120 µg m−3, indicating a widespread, high-intensity dust event. In addition, Cluster 1 exhibited the longest average dust duration among the four clusters, lasting approximately 38.6 h (Figure 4, top panel: DD). This extended duration likely resulted from the absence of strong post-frontal wind patterns following the departure of the low-pressure system, which led to weak airflows and prolonged dust stagnation over the Korean Peninsula.
The second cluster primarily represents dust originating from the Gobi Desert and Inner Mongolia, transported to the Korean Peninsula by strong northwesterly winds under a high–low pressure dipole pattern. The mean PM10 concentration for this cluster was 87 µg m−3. Concentrations exceeded 100 µg m−3 in northwestern regions such as NGG, SGG, and SEL, with moderately high values in INC, CN, and JB. In contrast, southeastern regions including BS, US, and GN recorded lower concentrations below 70 µg m−3, indicating that the dust was mainly confined to the northwestern part of the peninsula. The average dust duration for Cluster 2 was 21.1 h—the shortest among the four clusters. This limited duration likely resulted from the rapid advection of dust by persistent northwesterly winds driven by the continental high-pressure system. Therefore, Cluster 2 can be categorized as a localized, moderate-intensity type characterized by fast inflow and short-lived impact.
The third cluster primarily represents dust originating from Manchuria, transported to the Korean Peninsula by northerly to northwesterly winds on the rear side of a low-pressure system east of Japan. The mean PM10 concentration for this cluster was 95 µg m−3. High concentrations (above 100 µg m−3) were observed in central and southeastern regions such as DJ, SJ, CB, CN, US, GB, and DG. In contrast, northern regions including SEL, INC, NGG, SGG, and WGW showed lower concentrations around 80–90 µg m−3. This cluster contained the fewest number of cases among the four types and was characterized by pronounced local impacts during specific events. These features suggest that Cluster 3 represents an atypical or spatially confined dust event pattern, likely resulting from unique synoptic conditions or regionally limited inflow pathways [26,32].
Cluster 4 primarily represents dust originating from Manchuria, transported to the Korean Peninsula under a high–low pressure pattern similar to Cluster 2 but with the high-pressure center shifted farther east and a more upright northwesterly flow. With 17 cases, this was the most frequently observed cluster in the study, and the mean PM10 concentration was 87 µg m−3. Concentrations were moderately high and relatively uniform across most regions, indicating a widespread dust influence. However, southeastern regions such as BS, DG, US, and GN recorded comparatively lower concentrations—a spatial feature also observed in Clusters 1 and 2. This southeastward concentration gradient is likely due to the prevailing northwesterly transport path, along which dust undergoes progressive dry deposition over the northwest before reaching the southeastern regions with reduced intensity.

3.2. Temporal Characteristics of PM10

This section analyzes the temporal characteristics of PM10, considering annual, monthly, and hourly variations to identify seasonal and diurnal trends by cluster.
First of all, examining the annual number of dust days, as shown in Table 1, no clear increasing or decreasing trend is observed. Moreover, even when the same dust event frequency occurs within a given year, the intensity can differ, making it important to analyze both frequency and intensity together. Although both 2020 and 2021 recorded the same number of dust events (11), the intensity and impact in 2021 were markedly higher. In 2020, only 94 advisories and 2 warnings were issued, with an annual mean of hourly maximum PM10 concentration at 181 µg m−3. In contrast, 2021 saw a sharp increase, with 318 advisories, 134 warnings, and a significantly higher mean peak concentration of 382 µg m−3—more than double that of the previous year. This finding is consistent with previous reports describing the March 2021 dust storms as the most severe in East Asia in the past decade, driven by anomalous synoptic conditions and regional climate factors [13,14,15,16,17]. This indicates that the dust events in 2021 were not only more impactful but also included a greater number of high-concentration cases. Notably, five of the 2021 events were classified as Cluster 1, which is associated with strong low-pressure systems and intense westerly inflow, typically leading to nationwide large-scale dust outbreaks. Furthermore, 2021 and 2023 together accounted for 21 out of the total 53 dust events (approximately 40%), but more strikingly, these two years were responsible for 232 of the 270 total PM10 warnings (about 86%). This concentration of warnings strongly suggests that these years experienced a disproportionately high number of severe dust events. In 2023, despite a relatively even distribution of events across clusters, several cases still reached warning-level concentrations, highlighting the variability of intensity even within similar synoptic categories. This illustrates that the intensity of dust events is not necessarily proportional to their frequency, but rather shaped by the prevailing synoptic circulation patterns of each year. Prior studies have similarly suggested that both emission conditions and atmospheric dynamics jointly determine dust transport and concentration levels [8,9].
Examining the monthly frequency of Asian dust impacts, as shown in Figure 5, the frequency is generally higher in spring (March, April, and May), with March showing the highest occurrence. This seasonal pattern reflects favorable surface and atmospheric conditions in dust source regions such as the Gobi Desert and Inner Mongolia during spring. In particular, Cluster 1 events—typically associated with strong low-pressure systems and widespread dust transport—were concentrated in March, April, and May. While spring remains the peak season, the occurrence of events in autumn and winter also indicates that dust outbreaks can influence Korea throughout the year under appropriate synoptic conditions. These seasonal characteristics are consistent with previous studies [21,22].
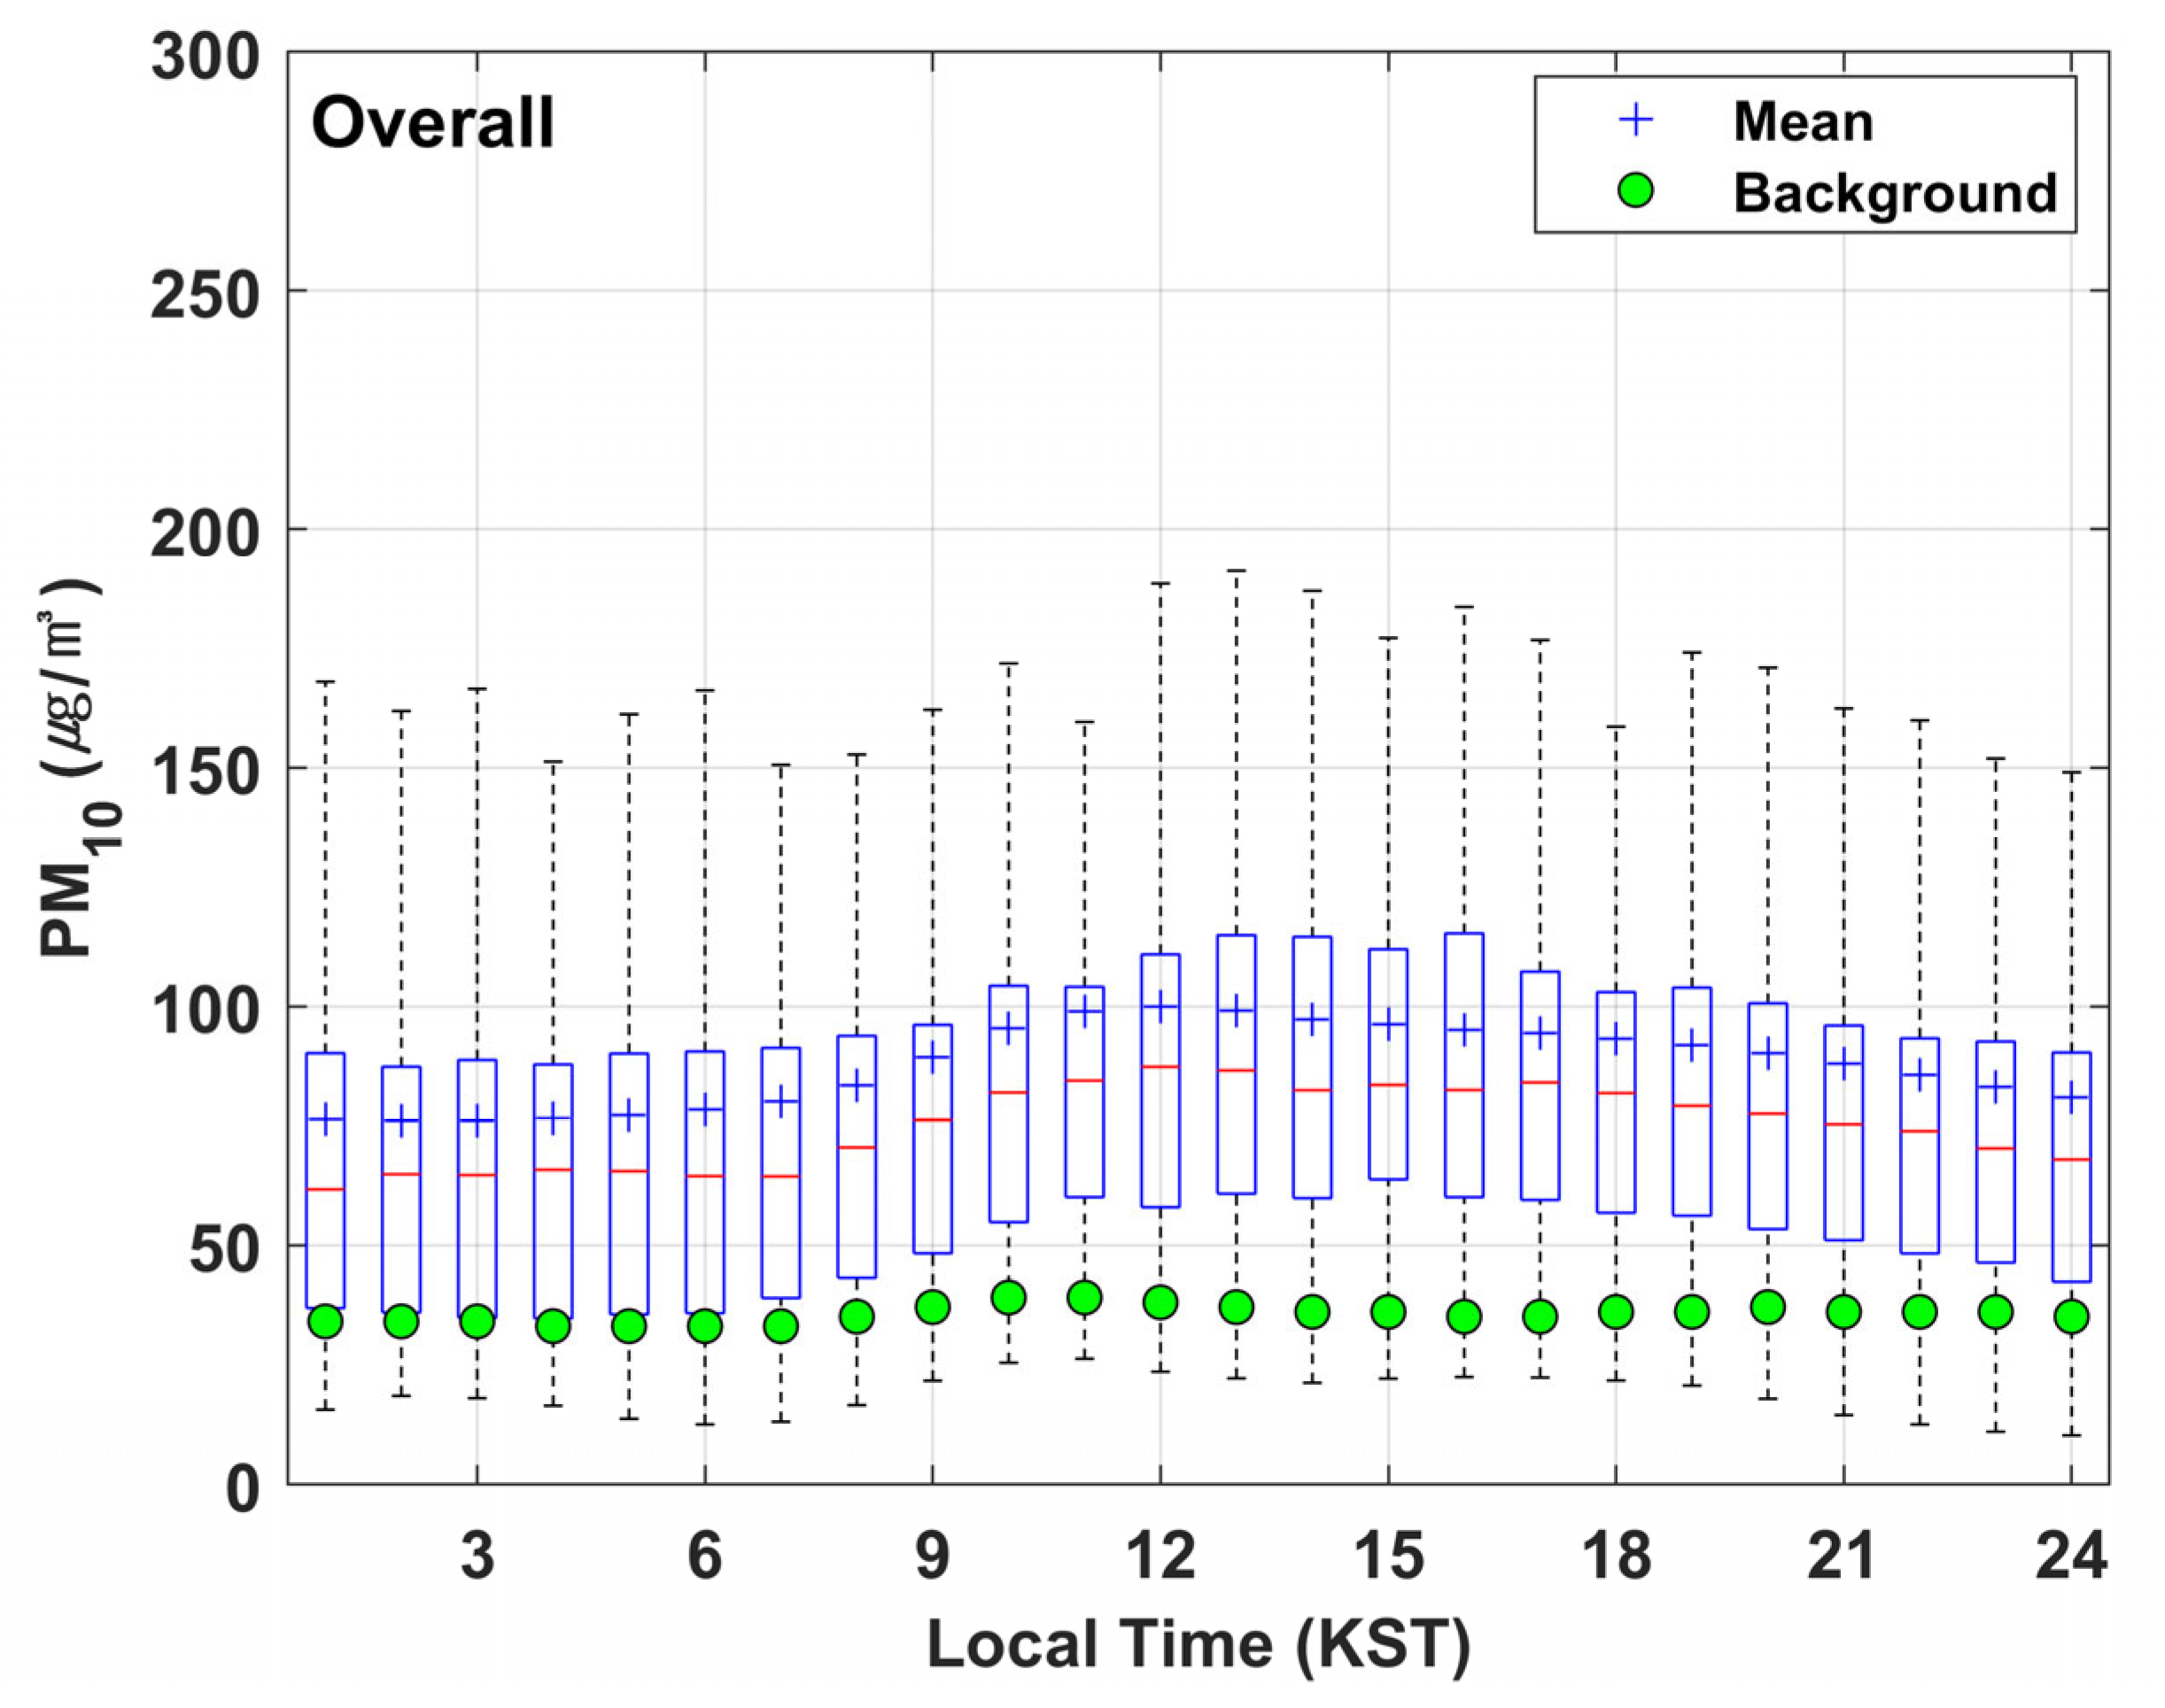
Figure 6 clearly demonstrates that surface PM10 concentrations during dust events increase markedly in the daytime. The mean concentration between 09:00 and 18:00 was 96 µg m−3, about 14 µg m−3 higher than the mean of 82 µg m−3 observed during other hours (01:00–08:00 and 19:00–24:00). Unlike the general dilution effect associated with boundary layer growth driven by solar heating [33,34], this daytime increase is explained by the entrainment of elevated dust layers into the boundary layer, resulting in enhanced surface concentrations. This interpretation is supported by previous studies showing that daytime boundary-layer growth can entrain lofted dust into the mixed layer, thereby enhancing surface concentrations [35,36]. In most cases, the convective boundary layer began to grow in the late morning, with peak concentrations typically occurring in the early afternoon.
For comparison, the green circles in Figure 6 represent background PM10 concentrations. These values were calculated as hourly means from urban monitoring data across 19 forecast regions during January 2019–June 2024. Under background conditions, the mean concentration was 37 µg m−3 during the day and 34 µg m−3 at night, showing only a small difference of about 3 µg m−3. Such a minor diurnal variation has been attributed in previous studies to anthropogenic activities such as increased traffic [37]. In contrast, the 14 µg m−3 difference observed during dust cases—nearly five times larger—cannot be explained by anthropogenic activity alone. This provides strong evidence that the daytime increase is primarily due to the entrainment of elevated dust layers associated with boundary layer growth.
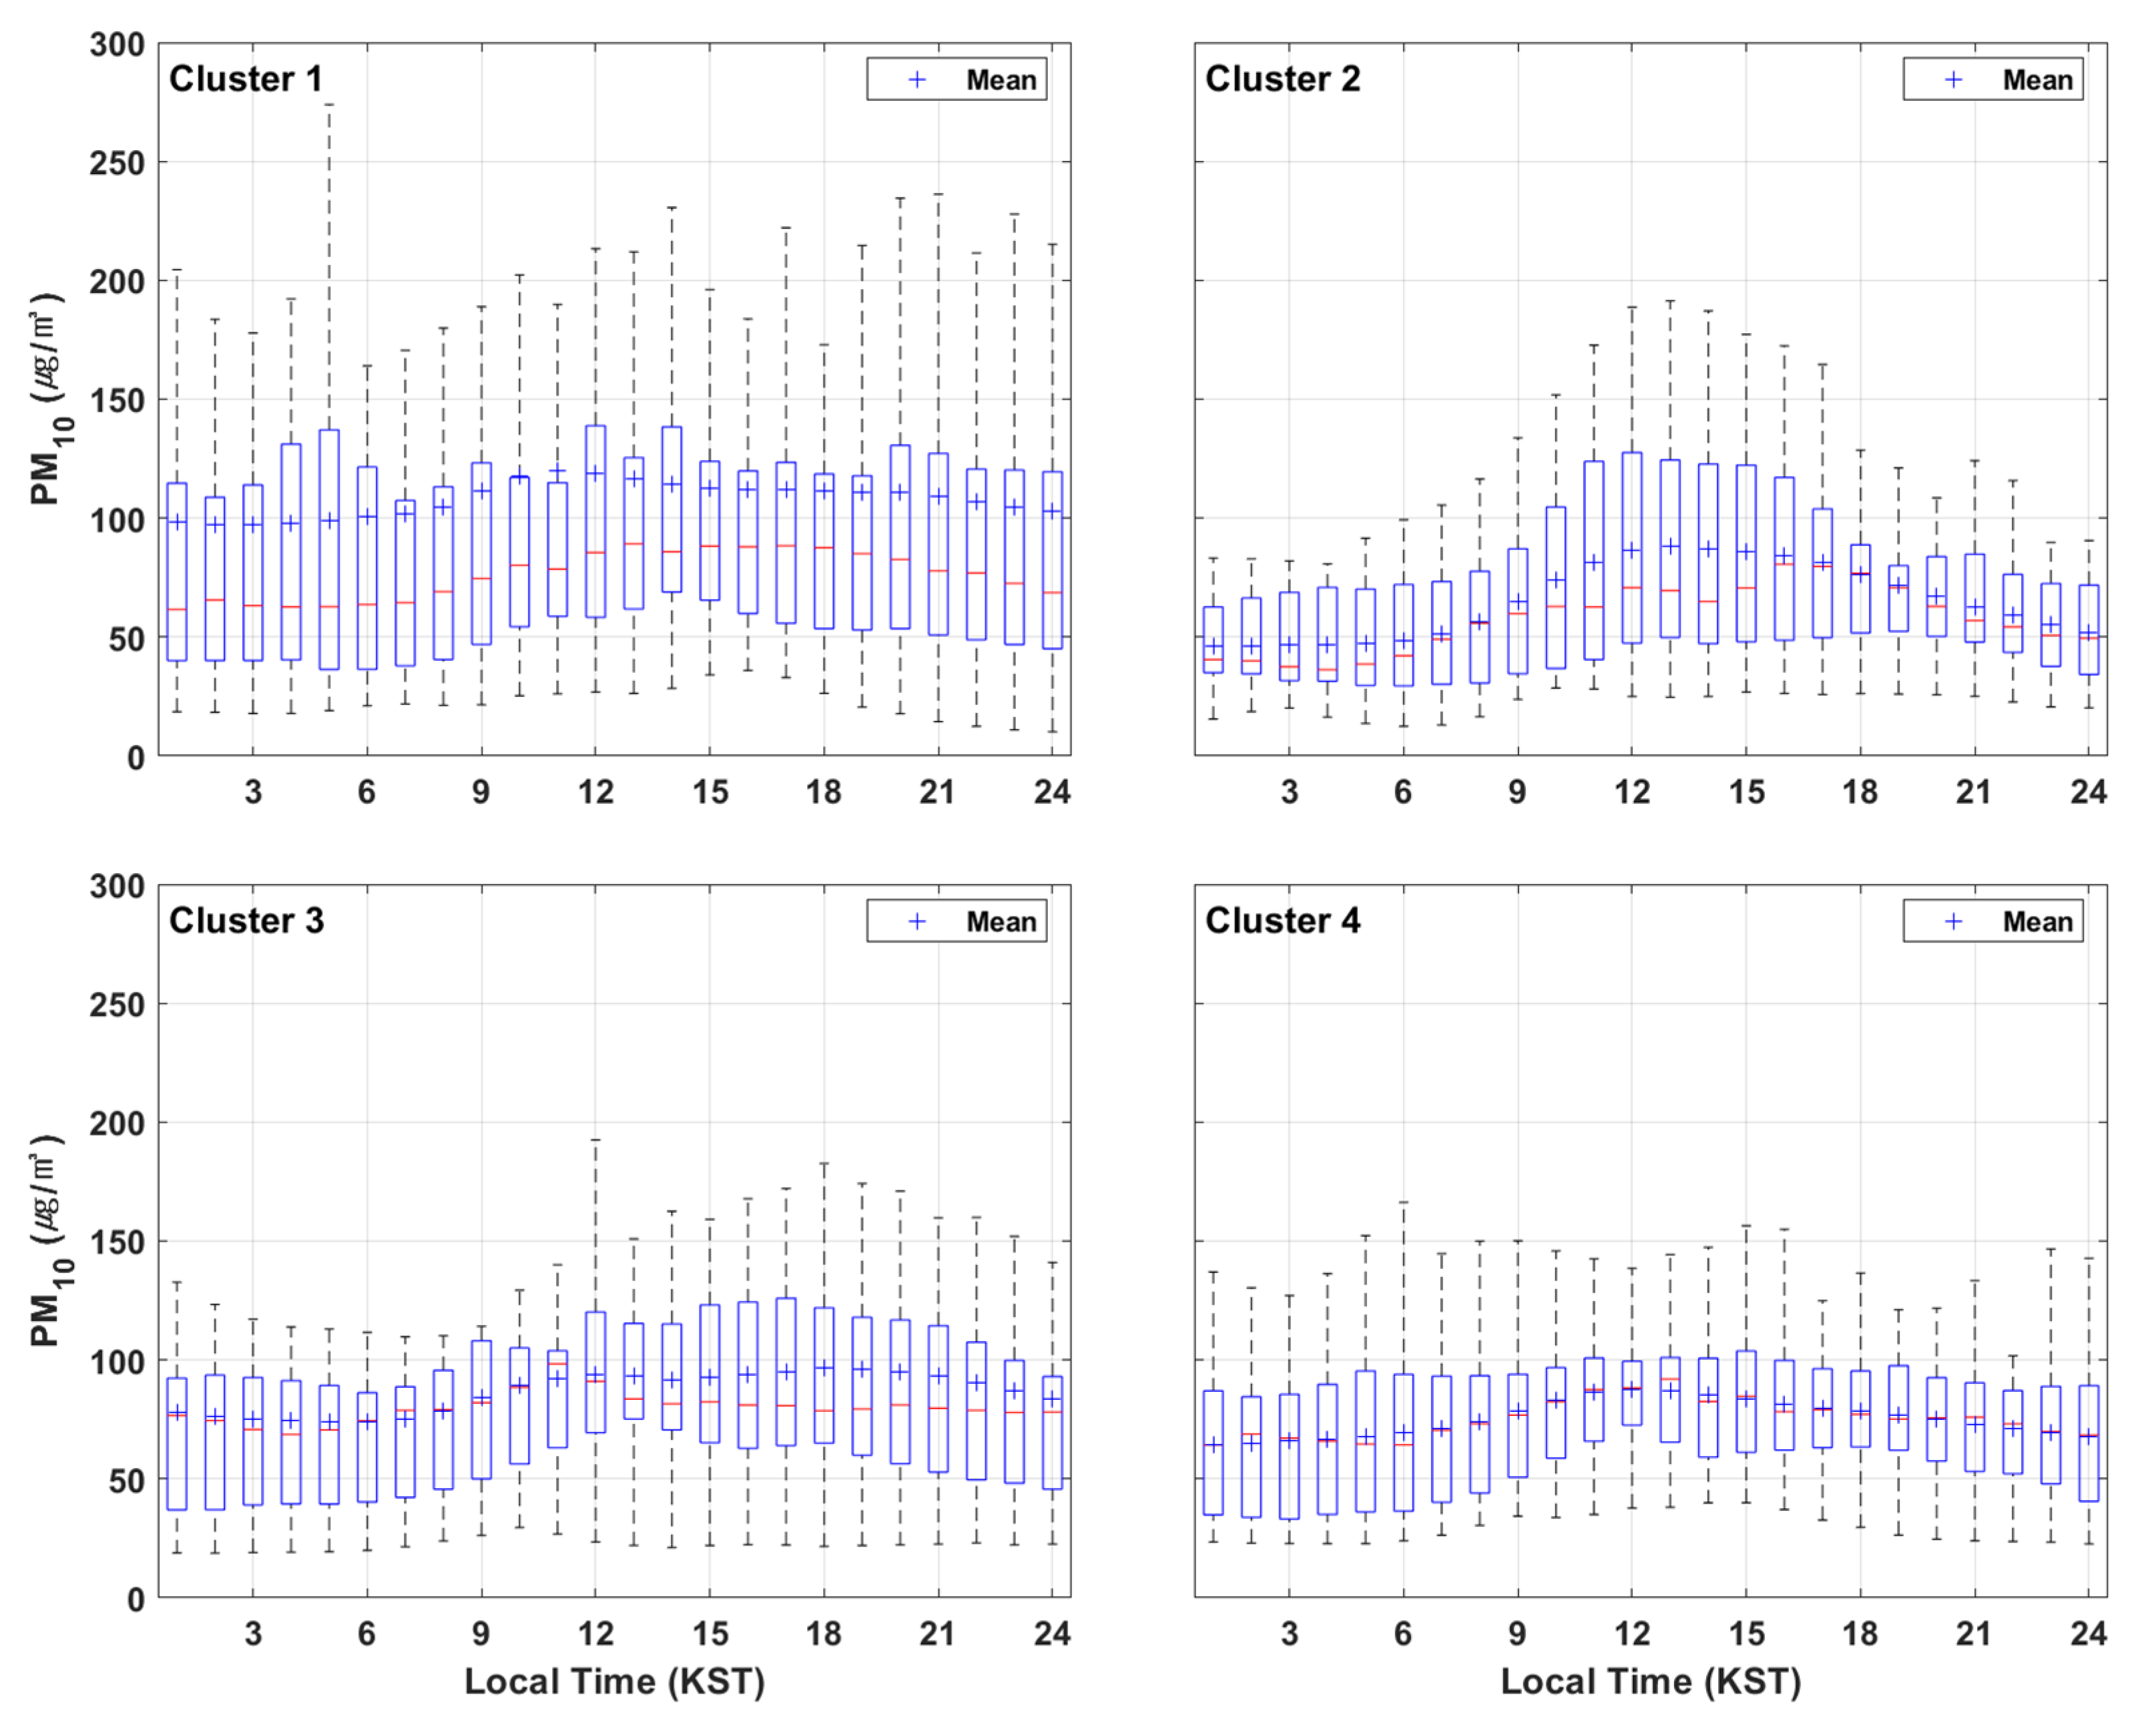
Using the same analytical approach, Figure 7 presents box plots of diurnal PM10 variations for each cluster. In addition, skewness was analyzed to evaluate the frequency of high-concentration dust events by cluster. Cluster 1 exhibited the highest mean and peak concentrations, with maximum values typically observed during the afternoon hours (13:00–15:00), and showed the greatest variability across all hours. This pattern corresponds to a typical large-scale dust inflow driven by strong westerly winds. Its skewness was notably high at 3.28, and the overall distribution was right-skewed, with mean values consistently exceeding medians—indicating that the highest number of high-concentration cases were included in Cluster 1. Clusters 2 and 4 exhibit similar synoptic structures in Figure 3 but differ in their diurnal behavior. Cluster 2 showed greater intra-day variability, with mean values higher than medians and a skewness of 1.91, suggesting frequent occurrences of high concentrations during the day. Cluster 4, in contrast, exhibited a more stable distribution with smaller box sizes and similar mean and median values. However, the increase in lower quartile values in the afternoon suggests that boundary layer development still influenced concentrations during the daytime. In addition, the skewness of 1.22, the lowest among all clusters, indicates that case-to-case variability was the smallest. Cluster 3 showed a distinct pattern, with concentrations rising from the morning, peaking relatively early, and remaining elevated throughout the afternoon. Its skewness value of 2.06 suggests a moderately asymmetric distribution, reflecting the presence of several high-concentration cases concentrated in specific time periods.
Overall, all clusters exhibited positive skewness, confirming that PM10 concentrations tend to be higher during the daytime hours. Among them, Cluster 1 stands out due to its frequent, intense, and prolonged high-concentration events, requiring particular attention in forecasting and response strategies.

4. Conclusions

Recent Asian dust events identified by the DustER-Team were examined to explore their synoptic patterns and associated PM10 characteristics. Using SOM analysis on NCEP/DOE Reanalysis II data, these events were classified into four clusters, each exhibiting distinct PM10 distributions and durations. Cluster 1, driven by a deep low-pressure system over Manchuria and intense westerly inflow, produced the highest concentrations and longest durations, representing a large-scale high-risk type sourced mainly from the Gobi Desert. Cluster 2 showed localized and short-lived impacts under strong northwesterly flow, with dust primarily originating from the Gobi Desert and Inner Mongolia. Cluster 3 exhibited regionally confined influence with early peak times, linked to dust from Manchuria. Cluster 4 was the most frequent pattern, with moderate and spatially widespread PM10 levels, also associated with Manchurian sources.
In the temporal dimension, all clusters demonstrated a clear daytime increase in PM10 levels, with mean concentrations during 09:00–18:00 exceeding nighttime levels by about 14 µg m−3. Skewness analysis revealed that high-concentration events were most common in Cluster 1, indicating a right-skewed tendency.
These results demonstrate the value of integrating synoptic pattern classification into dust forecasting, enabling simultaneous consideration of both the spatial distribution and diurnal variation in dust events. In particular, when a high-risk pattern such as Cluster 1 is identified, the potential occurrence of high-concentration dust can be recognized in advance, allowing sufficient lead time for response. This approach not only enhances forecast accuracy but also contributes to the timely issuance of warnings and the development of proactive response strategies. By applying cluster analysis to synoptic pressure patterns and 850 hPa wind fields—variables that can be reliably predicted by numerical weather models—this study provides a robust framework for improving the accuracy and reliability of PM10 forecasts.

5. Discussion

The SOM-based classification highlighted distinct spatial distributions across the four clusters, with Cluster 1 showing the most widespread and intense PM10 impacts compared to the other types. In the temporal dimension, all clusters demonstrated a clear daytime increase in PM10 levels, with mean concentrations during 09:00–18:00 exceeding nighttime levels by about 14 µg m−3. Although particulate matter concentrations usually decrease during the daytime due to dilution by boundary layer growth, our results revealed the opposite during dust episodes, suggesting that the diurnal variation cannot be explained by anthropogenic activity or dilution alone.
This interpretation is supported by previous studies. Bravo-Aranda et al. (2015) [36] demonstrated that convective processes entrain lofted dust layers into the mixed layer, while Lee et al. (2019) [35] reported enhanced surface concentrations in Seoul due to downward mixing during boundary-layer development. The consistency with these findings strengthens our interpretation that entrainment of elevated dust drives the daytime increase observed in this study.
Despite these contributions, some limitations should be acknowledged. This study focused on synoptic circulation and PM10, without explicitly analyzing meteorological variables such as precipitation, humidity, temperature, and boundary layer height, which can strongly affect dust transport and surface concentrations. In addition, only PM10 was examined, while co-occurring pollutants and source-region processes were not addressed. Future research should integrate multi-pollutant data, high-resolution meteorological observations, and chemical transport modeling to better capture the complexity of dust events and their impacts.

Author Contributions

Conceptualization, D.S. and J.S.; methodology, D.S.; validation, J.S. and J.Y.; writing—original draft preparation, D.S.; writing—review and editing, D.S.; visualization, D.-J.K.; supervision, J.-B.L.; All authors have read and agreed to the published version of the manuscript.

Funding

This research was funded by the project “A study on the demand-oriented methodologies to improve the reliability of high-concentration air quality forecast(I)” (NIER-2025-01-11-004) funded by the National Institute of Environmental Research (NIER), Republic of Korea. The authors would like to express their gratitude to NIER and the Ministry of Environment (MOE) for their continued support and provision of environmental and meteorological data essential for this study.

Institutional Review Board Statement

Not applicable.

Informed Consent Statement

Not applicable.

Data Availability Statement

The meteorological data used in this study were obtained from the NCEP/DOE Reanalysis II dataset, provided by the NOAA Physical Sciences Laboratory (https://psl.noaa.gov/data/gridded/data.ncep.reanalysis2.html, accessed on 15 July 2025). PM10 concentration data were collected from the national air quality monitoring network operated by the Korean Ministry of Environment and the National Institute of Environmental Research (https://www.airkorea.or.kr, accessed on 20 July 2025). All datasets are publicly available from the respective sources.

Conflicts of Interest

The authors declare no conflicts of interest.

Appendix A

Table A1 presents the 53 Asian dust events that occurred over Korea between 2019 and 2024, classified into four synoptic clusters using the Self-Organizing Map (SOM) method. For each event, the table lists the date, maximum hourly PM10 concentration, the highest concentration area among the 19 forecast regions, and the number of PM10 advisories and warnings issued in the corresponding administrative districts.
Table A1. Summary of classified Asian dust events by cluster.
No.Cluster
Type
DatePM10 Hourly Max
(µg m−3)
Highest
Concentration
Area
PM10
AdvisoryWarning
1Cluster 122-Apr-19169SGG6-
229-Oct-19259US49-
319-Mar-20172GJ1-
411-May-20202NGG10-
514-May-20227GJ272
604-Jun-20137WGW--
723-Mar-21265EGW9-
829-Mar-211309JJ8958
928-Apr-21179GJ6-
1007-May-21869INC7864
1124-May-21304SEL371
1211-Apr-23599JJ11452
1307-Dec-23137SEL--
1429-Mar-24509INC6716
1516-Apr-24295EGW181
1625-Apr-24147DG--
1Cluster 218-Nov-19275NGG28-
222-Feb-20160SGG--
322-Oct-20211GJ23-
407-Nov-20123INC--
513-Jan-21174SEL6-
616-Apr-21324SEL1110
717-Apr-21275EGW41-
826-Nov-22112INC--
913-Dec-22395NGG6312
1015-Mar-23134INC--
1112-May-24251DG311
1Cluster 313-Mar-1971SGG--
205-Apr-19231SGG38-
302-May-19240JJ14-
414-Jan-21109WGW2-
527-Apr-22242INC25-
616-Apr-23203DG24-
721-Apr-23616US8937
821-May-23207EGW8-
924-Jun-24177DG4-
1Cluster 428-Jan-19150NGG1-
204-Feb-19155GJ8-
331-Oct-19202NGG41-
404-Apr-20233GJ23-
521-Apr-20111NGG--
622-Apr-20254NGG10-
725-Apr-20169DJ--
815-Jan-21185US1-
916-Mar-21218DG291
1004-Mar-22278INC59-
1116-Mar-22142DJ--
1207-Jan-23251SJ36-
1320-Jan-23178INC20-
1402-Mar-2392NGG--
1523-Mar-23358INC529
1617-Mar-24309INC416
17 19-Mar-24243JJ5-
Note: A PM10 advisory is issued when the hourly mean concentration exceeds 150 µg m−3 for at least two consecutive hours, and a PM10 warning is issued when it exceeds 300 µg m−3 for the same duration. Unlike the 19 forecast regions used in this study for spatial analysis, advisories and warnings are issued for smaller administrative districts. Consequently, a single dust event may result in multiple advisories or warnings being recorded.

References

  1. Middleton, N. Desert Dust Hazards: A Global Review. Aeolian Res. 2017, 24, 53–63. [Google Scholar] [CrossRef]
  2. Middleton, N.; Al-Hemoud, A. Sand and Dust Storms: Recent Developments in Impact Mitigation. Sustainability 2024, 16, 7121. [Google Scholar] [CrossRef]
  3. Lee, H.; Heo, H.H.; Kim, C.S. Effects of the Asian Dust Events on Daily Mortality in Seoul Korea. Environ. Res. 2013, 124, 15–20. [Google Scholar] [CrossRef]
  4. Hashizume, M.; Kim, Y.; Ng, C.F.S.; Chung, Y.; Madaniyazi, L.; Bell, M.L.; Guo, Y.L.; Kan, H.; Honda, Y.; Yi, S.-M.; et al. Health Effects of Asian Dust: A Systematic Review and Meta-Analysis. Environ. Health Perspect. 2020, 128, 066001. [Google Scholar] [CrossRef]
  5. Bae, C.; Kim, B.-U.; Kim, H.C.; Yoo, C.; Kim, S. Long-Range Transport Influence on Key Chemical Components of PM2.5 in the Seoul Metropolitan Area, South Korea, during the Years 2012–2016. Atmosphere 2020, 11, 48. [Google Scholar] [CrossRef]
  6. Kwon, S.H.; Kim, J.; Shim, S.; Seo, J.; Byun, Y.H. Analysis of Weather Patterns Related to Wintertime PM10 Concentration in Seoul Metropolitan Area, South Korea. Atmosphere 2020, 11, 1161. [Google Scholar] [CrossRef]
  7. Kong, S.S.K.; Pani, S.K.; Griffith, S.M.; Ou-Yang, C.F.; Ravindra Babu, S.; Chuang, M.T.; Ooi, M.C.G.; Huang, W.S.; Sheu, G.R.; Lin, N.H. Distinct transport mechanisms of East Asian dust and the impact on downwind marine and atmospheric environments. Sci. Total Environ. 2022, 827, 154255. [Google Scholar] [CrossRef]
  8. Li, W.; Wang, Y.; Huang, R.J.; Chen, Y.; Wang, Q.; Zhang, X.; Wu, L.; Guo, J.; Chen, J.; Cao, J.; et al. Aqueous-phase secondary organic aerosol formation on aged dust particles over land. Natl. Sci. Rev. 2025, 12, nwaf221. [Google Scholar] [CrossRef]
  9. Lu, D.; Li, H.; Tian, M.; Wang, G.; Qin, X.; Zhao, N.; Huo, J.; Yang, F.; Lin, Y.; Chen, J.; et al. Secondary aerosol formation during a special dust transport event: Impacts from unusually enhanced ozone and dust backflows over the ocean. Atmosphere 2023, 14, 13853–13868. [Google Scholar] [CrossRef]
  10. Tobías, A.; Querol, X.; Roqué, M.; Lwin, K.S.; Yuan, L.; Ith, S.; Wai, H.Z.; Chua, P.L.; Solá, I.; Renzi, M.; et al. Short-Term Exposure to Desert Dust and Sandstorms and All-Cause and Cause-Specific Mortality and Morbidity: A Systematic Review and Meta-Analysis. Environ. Int. 2025, 181, 109277. [Google Scholar] [CrossRef]
  11. Shao, Y.; Wyrwoll, K.H.; Chappell, A.; Huang, J.; Lin, Z.; McTainsh, G.H.; Mikami, M.; Wang, X.; Yoon, S.; Oku, Y.; et al. Dust Cycle: An Emerging Core Theme in Earth System Science. Aeolian Res. 2011, 2, 181–204. [Google Scholar] [CrossRef]
  12. United Nations Environment Programme (UNEP). Global Assessment of Sand and Dust Storms; UNEP: Nairobi, Kenya, 2016; Available online: https://wedocs.unep.org/20.500.11822/20764 (accessed on 31 July 2025).
  13. Jin, J.; Pang, M.; Segers, A.; Han, W.; Fang, L.; Li, B.; Feng, H.; Lin, H.X.; Liao, H. Inverse modeling of the 2021 spring super dust storms in East Asia. Atmosphere 2022, 13, 6393–6410. [Google Scholar] [CrossRef]
  14. Yin, Z.; Wan, Y.; Zhang, Y.; Wang, H. Why super sandstorm 2021 in North China? Atmosphere 2021, 12, nwab165. [Google Scholar] [CrossRef]
  15. Tang, W.; Dai, T.; Cheng, Y.; Wang, S.; Liu, Y. A Study of a Severe Spring Dust Event in 2021 over East Asia with WRF-Chem and Multiple Platforms of Observations. Atmosphere 2022, 13, 3795. [Google Scholar] [CrossRef]
  16. Hu, Z.; Ma, Y.; Jin, Q.; Idrissa, N.F.; Huang, J.; Dong, W. Attribution of the March 2021 exceptional dust storm in North China. Atmosphere 2023, 104, E749–E755. [Google Scholar] [CrossRef]
  17. Li, T.; Tan, C.; Zhao, Z.; Yao, W. The Lower Atmospheric Characteristics of Dust Storms Using Ground-Based Sensor Data: A Comparative Analysis of Two Cases in Jinan, China. Atmosphere 2024, 15, 282. [Google Scholar] [CrossRef]
  18. Qian, W.; Leung, J.C.H.; Ren, J.; Du, J.; Feng, Y.; Zhang, B. Anomaly-Based Synoptic Analysis and Model Prediction of Six Dust Storms that Originated from Mongolia and Moved to Northern China in Spring 2021. J. Geophys. Res. Atmos. 2022, 127, e2021JD036272. [Google Scholar] [CrossRef]
  19. Westphal, D.L.; Toon, O.B.; Carlson, T.N. A Case Study of Mobilization and Transport of Saharan Dust. J. Atmos. Sci. 1987, 44, 2349–2365. [Google Scholar] [CrossRef]
  20. Uno, I.; Carmichael, G.R.; Streets, D.G.; Satake, S.; Takahashi, T.; Woo, J.H.; Uematsu, M. Regional Chemical Weather Forecasting System CFORS: Model Descriptions and Analysis of Surface Observations at Japanese Island Stations. J. Geophys. Res. Atmos. 2001, 106, 18347–18366. [Google Scholar] [CrossRef]
  21. Zhang, X.Y.; Gong, S.L.; Zhao, T.L.; Arimoto, R.; Wang, Y.Q.; Zhou, Z.J. Sources of Asian Dust and Role of Climate Change versus Desertification in Asian dust emission. J. Geophys. Res. 2003, 108, 4385. [Google Scholar] [CrossRef]
  22. Lee, S.; Yoon, J.W.; Park, S.K. Primary Factors and Synoptic Pattern Classification of Mega Asian Dust Storms in Korea. Asia-Pac. J. Atmos. Sci. 2024, 60, 655–667. [Google Scholar] [CrossRef]
  23. Kim, B.-Y.; Lim, Y.-K.; Cha, J.W. Short-Term Prediction of Particulate Matter (PM10 and PM2.5) in Seoul, South Korea Using Tree-Based Machine Learning Algorithms. Atmos. Pollut. Res. 2022, 13, 101547. [Google Scholar] [CrossRef]
  24. Jeong, G.Y.; Kim, J.Y.; Seo, J.; Kim, G.M.; Jin, H.C.; Chun, Y. Long-Range Transport of Giant Particles in Asian Dust Identified by Physical, Mineralogical, and Meteorological Analysis. Atmos. Chem. Phys. 2014, 14, 505–521. [Google Scholar] [CrossRef]
  25. Chun, Y.; Boo, K.-O.; Kim, J.; Park, S.-U.; Lee, M. Synopsis, Transport, and Physical Characteristics of Asian Dust in Korea. J. Geophys. Res. Atmos. 2001, 106, 18461–18469. [Google Scholar] [CrossRef]
  26. Kohonen, T. Self-Organizing Maps, 3rd ed.; Springer: Berlin/Heidelberg, Germany, 2001. [Google Scholar] [CrossRef]
  27. Johnson, N.C.; Feldstein, S.B.; Tremblay, B. The continuum of Northern Hemisphere teleconnection patterns and a description of the NAO shift with the use of self-organizing maps. J. Clim. 2008, 21, 6354–6371. [Google Scholar] [CrossRef]
  28. Horton, D.E.; Johnson, N.C.; Singh, D.; Swain, D.L.; Rajaratnam, B.; Diffenbaugh, N.S. Contribution of changes in atmospheric circulation patterns to Northern Hemisphere temperature extremes (1979–2013) as revealed by self-organizing maps. Nature 2015, 522, 465–469. [Google Scholar] [CrossRef]
  29. Huang, W.; Lu, R.; Zhang, Y. Exploring combined effects of Arctic Oscillation and filled in large-scale pressure patterns using self-organizing maps. J. Geophys. Res. Atmos. 2017, 122, 9107–9129. [Google Scholar] [CrossRef]
  30. Jo, E.; Park, C.; Son, S.-W.; Roh, J.-W.; Lee, G.-W.; Lee, Y.-H. Classification of Localized Heavy Rainfall Events in South Korea. Asia-Pac. J. Atmos. Sci. 2020, 56, 77–88. [Google Scholar] [CrossRef]
  31. Shin, Y.; Kim, J.-H.; Chun, H.-Y.; Jang, W.; Son, S.-W. Classification of Synoptic Patterns with Mesoscale Mechanisms for Downslope Windstorms in Korea Using a Self-Organizing Map. J. Geophys. Res. Atmos. 2022, 127, e2021JD035867. [Google Scholar] [CrossRef]
  32. Vesanto, J.; Alhoniemi, E. Clustering of the Self-Organizing Map. IEEE Trans. Neural Netw. 2000, 11, 586–600. [Google Scholar] [CrossRef]
  33. Zhou, Q.; Cheng, L.; Zhang, Y.; Wang, Z.; Yang, S. Relationships between Springtime PM2.5, PM10, and O3 Pollution and the Boundary Layer Structure in Beijing, China. Sustainability 2022, 14, 9041. [Google Scholar] [CrossRef]
  34. Li, X.; Wang, Y.; Shen, L.; Zhang, H.; Zhao, H.; Zhang, Y.; Ma, Y. Characteristics of Boundary Layer Structure during a Persistent Haze Event in the Central Liaoning City Cluster, Northeast China. J. Meteorol. Res. 2018, 32, 302–312. [Google Scholar] [CrossRef]
  35. Lee, H.J.; Jo, H.Y.; Kim, S.W.; Park, S.M.; Cho, S.; Lee, K.H. Impacts of atmospheric vertical structures on transboundary aerosol transport from China to South Korea. Sci. Rep. 2019, 9, 13040. [Google Scholar] [CrossRef]
  36. Bravo-Aranda, J.A.; Navas-Guzmán, F.; Guerrero-Rascado, J.L.; Pérez-Ramírez, D.; Granados-Muñoz, M.J.; Olmo, F.J.; Alados-Arboledas, L. Study of mineral dust entrainment in the planetary boundary layer by lidar depolarisation technique. Tellus B Chem. Phys. Meteorol. 2015, 67, 26180. [Google Scholar] [CrossRef]
  37. Jaworski, A.; Balawender, K.; Kuszewski, H.; Jaremcio, M. The Assessment of PM2.5 and PM10 Immission in Atmospheric Air in a Climate Chamber during Tests of an Electric Car on a Chassis Dynamometer. Atmosphere 2024, 15, 270. [Google Scholar] [CrossRef]
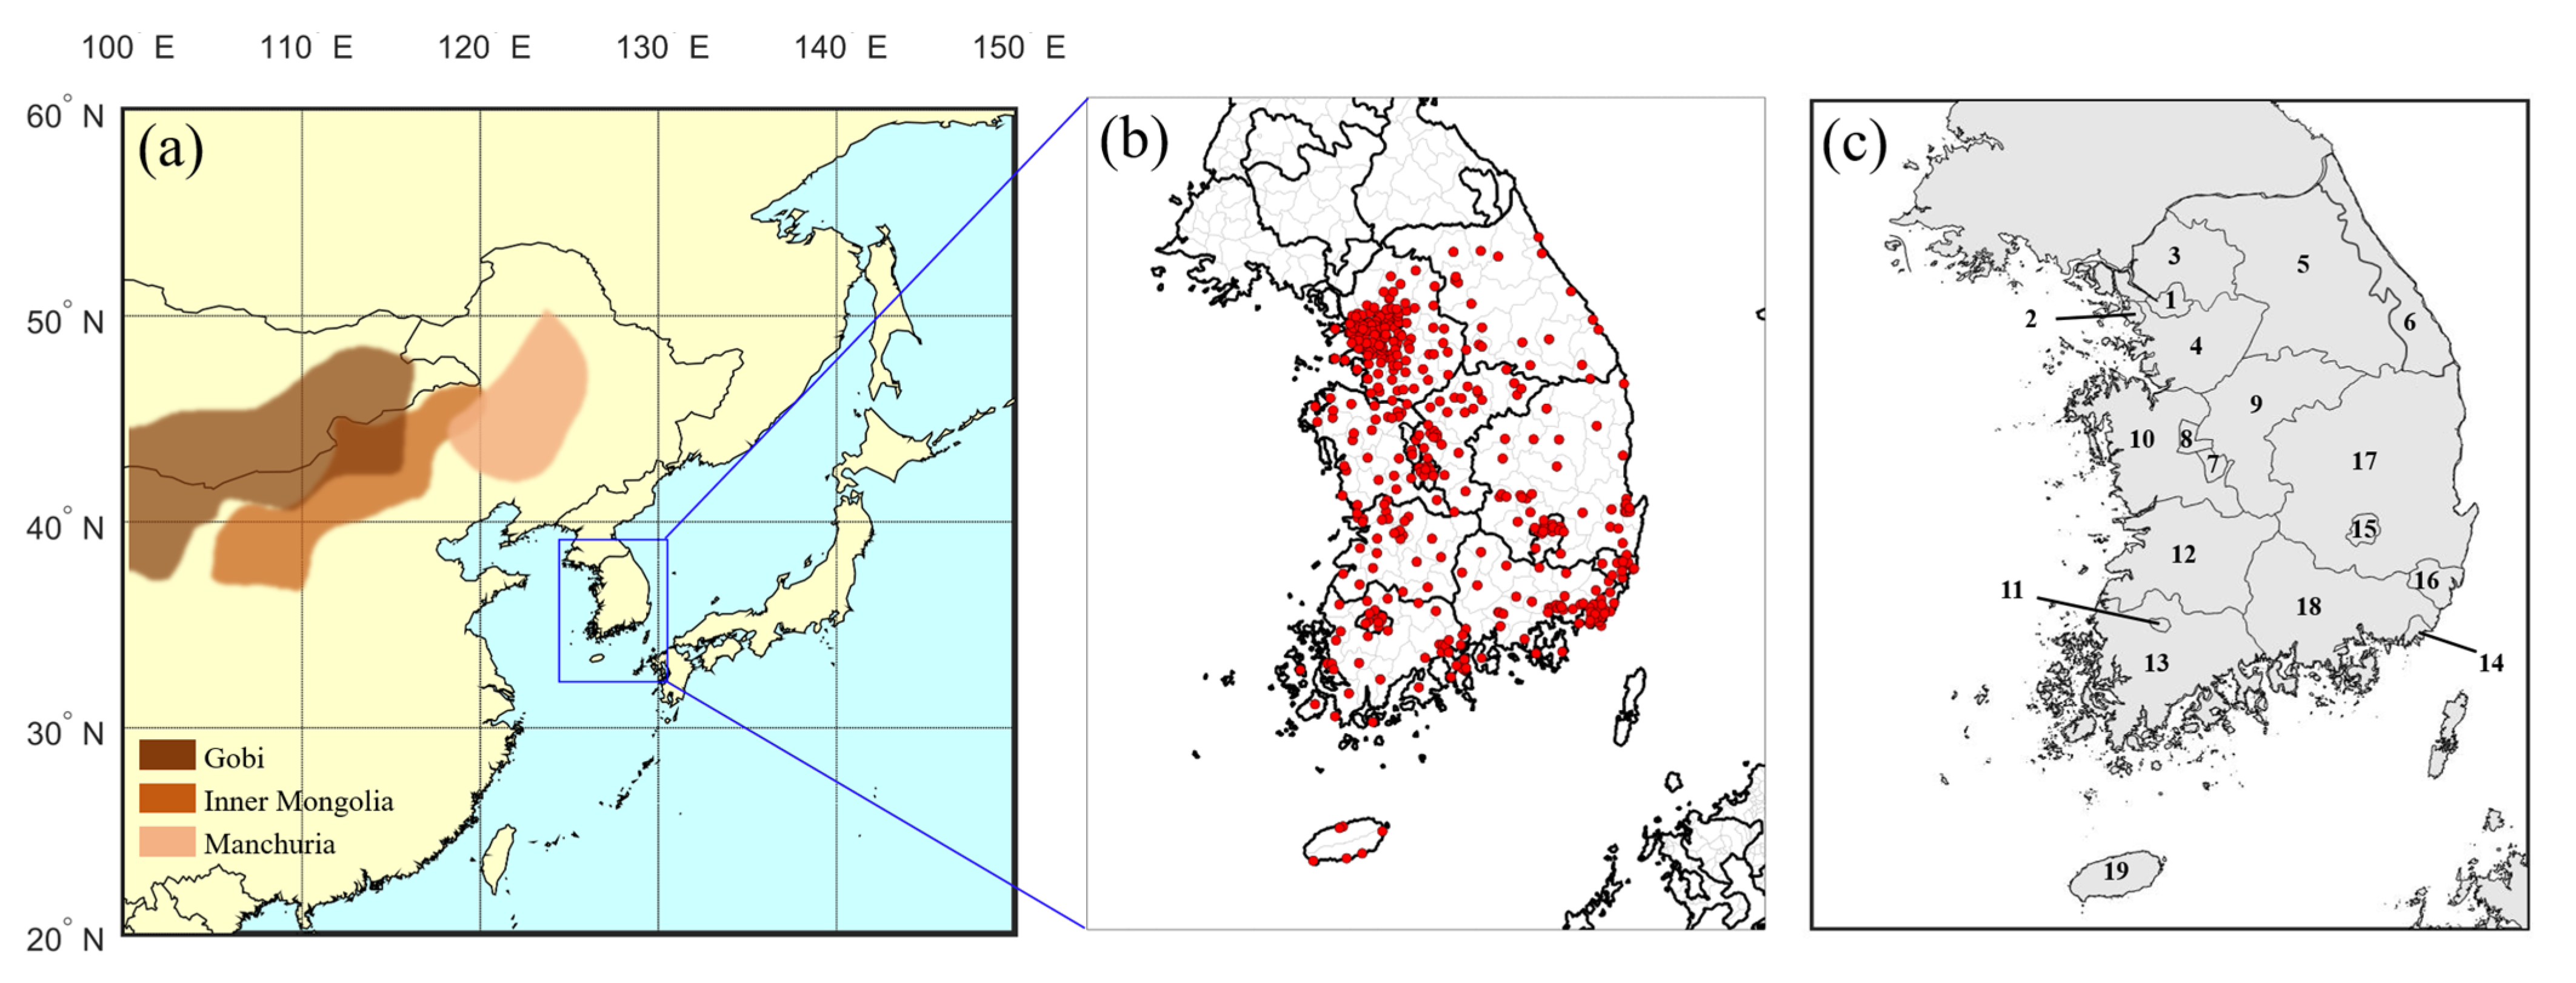
Figure 1. (a) Geographic domain (20–60° N, 100–150° E) used for meteorological analysis with ERA5/NCEP data. The blue boxes indicate the regions zoomed in for panels (b,c). Major desert source areas are approximate representative regions identified from previous literature and observational records, with dark brown representing the Gobi Desert, medium brown indicating Inner Mongolia, and light brown denoting Manchuria. (b) Distribution of PM10 monitoring stations across South Korea (531 stations as of February 2025, shown as red dots), forming the basis for regional concentration analysis. (c) Definition of 19 forecast regions used for spatial aggregation of PM10 concentrations and classification by cluster. The regions, numbered sequentially from 1 to 19, are listed as follows: Seoul (SEL), Incheon (INC), North Gyeonggi (NGG), South Gyeonggi (SGG), West Gangwon (WGW), East Gangwon (EGW), Daejeon (DJ), Sejong (SJ), Chungbuk (CB), Chungnam (CN), Gwangju (GJ), Jeonbuk (JB), Jeonnam (JN), Busan (BS), Daegu (DG), Ulsan (US), Gyeongbuk (GB), Gyeongnam (GN), and Jeju (JJ).
Atmosphere 16 01116 g001
Figure 2. Evaluation of SOM clustering performance for different grid configurations. (a) Explained Cluster Variance (ECV) as a function of the number of clusters. (b) Slope of ECV, showing the point at which the marginal gain decreases, indicating optimal cluster selection. (c) Topographic Error (TE) across cluster configurations. The blue dashed lines mark the chosen point where ECV gain plateaus and TE remains low, justifying the selection of four clusters.
Atmosphere 16 01116 g002
Figure 3. Composite synoptic patterns of mean sea level pressure (SLP, shaded; hPa) and 850 hPa wind vectors (arrows) for each SOM-based cluster (2 × 2 grid). Each panel represents the averaged circulation features of classified dust events. Case counts per cluster are indicated in parentheses.
Atmosphere 16 01116 g003
Figure 4. (a) Heatmap of mean PM10 concentrations (µg m−3) by region and cluster, derived from SOM classification. The numbers at the top of each column indicate the mean dust duration (DD, in hours) for each cluster. (b) Spatial map of mean PM10 concentrations across Korea, grouped by cluster. The visualization highlights spatial variability in dust impacts under different synoptic types.
Atmosphere 16 01116 g004
Figure 5. Monthly frequency of Asian dust events by SOM cluster during 2019–2024. Most events occurred in spring (March–May), with Cluster 1 showing the highest occurrence during March and April.
Atmosphere 16 01116 g005
Figure 6. Diurnal variation of PM10 concentrations for all 53 dust events (1:00–24:00, local time). Box plots show the 25th to 75th percentile range, red lines indicate medians, and plus signs (+) denote mean values. The results highlight a general increase in PM10 during daytime hours (09:00–18:00). The x-axis shows local time (KST) from 1:00 to 24:00. In addition, green circles indicate the background mean PM10 concentrations (36 µg m−3) calculated from all monitoring data across the 19 forecast regions during January 2019–June 2024.
Atmosphere 16 01116 g006
Figure 7. Diurnal PM10 concentration profiles by SOM cluster. Format as shown in Figure 6. Each box plot represents the hourly distribution (1:00–24:00) for dust events within a cluster. Differences in mean levels, variability, and peak timing reflect distinct temporal characteristics among the four synoptic types.
Atmosphere 16 01116 g007
Table 1. Summary of Asian dust events in Korea from 2019 to 2024. The table includes the number of events per year, cluster assignments based on SOM classification, the total number of PM10 advisories and warnings issued, and the annual mean of hourly maximum PM10 concentrations (µg m−3). A detailed description of each event by date is provided in Appendix A.
YearTotal EventsEvents by ClusterPM10Mean
Hourly Max
(µg m−3)
No.1No.2No.3No.4AdvisoriesWarnings
2019921331850195
20201143-4942181
2021115312318134382
20225-21214712233
202310213334398278
20247311216624275
Total5316119171244270261(Mean)
Disclaimer/Publisher’s Note: The statements, opinions and data contained in all publications are solely those of the individual author(s) and contributor(s) and not of MDPI and/or the editor(s). MDPI and/or the editor(s) disclaim responsibility for any injury to people or property resulting from any ideas, methods, instructions or products referred to in the content.