Article

Concentration Distribution and Physicochemical Properties of 10 nm–10 μm Coal Dust Generated by Drum Cutting Different Rank Coals: A Physical Simulation Experiment

1
School of Safety Engineering, China University of Mining and Technology, Xuzhou 221116, China
2
Shandong Energy Group Luxi Mining Company Limited, Heze 274000, China
3
State Key Laboratory for Safe Mining of Deep Coal Resources and Environment Protection, Huainan 232000, China
*
Authors to whom correspondence should be addressed.
Atmosphere 2025, 16(10), 1114; https://doi.org/10.3390/atmos16101114
Submission received: 17 August 2025 / Revised: 18 September 2025 / Accepted: 20 September 2025 / Published: 23 September 2025
(This article belongs to the Section Air Quality)

Abstract

Shearer drum cutting of coal seams generates over half of the coal dust in coal mines, while relevant studies focus more on micron-sized dust and much less on nano- to sub-micron-sized coal dust. Based on the self-developed experimental system for simulating dust generation from drum cutting of coal bodies, this study investigated the concentration distribution characteristics and physicochemical properties of 10 nm–10 μm coal dust generated from drum cutting of different rank coals with different cutting parameters. Results showed that the coal dust mass and number concentrations were concentrated in 2–10 μm and 10–200 nm, respectively, accounting for 90% of the total 10 nm–10 μm coal dust; the mass percentages of PM1/PM10 (PM1/PM10 = PM1 particles relative to PM10 particles, similarly hereinafter), PM1/PM2.5, and PM2.5/PM10 were 3.25–4.87%, 19.35–26.73%, and 14.82–18.81%, respectively, whereas over 99% of the total number of particles in the PM10 fraction are within the PM1 fraction (i.e., N-PM1/N-PM10 > 99%), that is, both N-PM1/N-PM2.5 and N-PM2.5/N-PM10 exceeded 99%. Lower-rank coal generates less 10 nm–10 μm coal dust, and either higher moisture content, firmness coefficient, or lower fixed carbon content of the coal can effectively reduce the 10 nm–10 μm coal dust generation. Either reduction in the tooth tip cone angle, the rotary speed, or increase in the mounting angle or the cutting depth can effectively inhibit the 10 nm–10 μm coal dust generation. Higher-rank coal dust shows fewer surface pores, smoother surfaces, larger contact angles, more hydrophobic groups, and fewer hydrophilic groups. The research results have filled the knowledge gap in the pollution characteristics of nano- to submicron-sized dust generated from shearer drum cutting of coal bodies, and can serve as an important reference for the development of dust reduction and suppression technologies in coal mining faces as well as the prevention of coal worker’s pneumoconiosis.

Graphical Abstract

1. Introduction

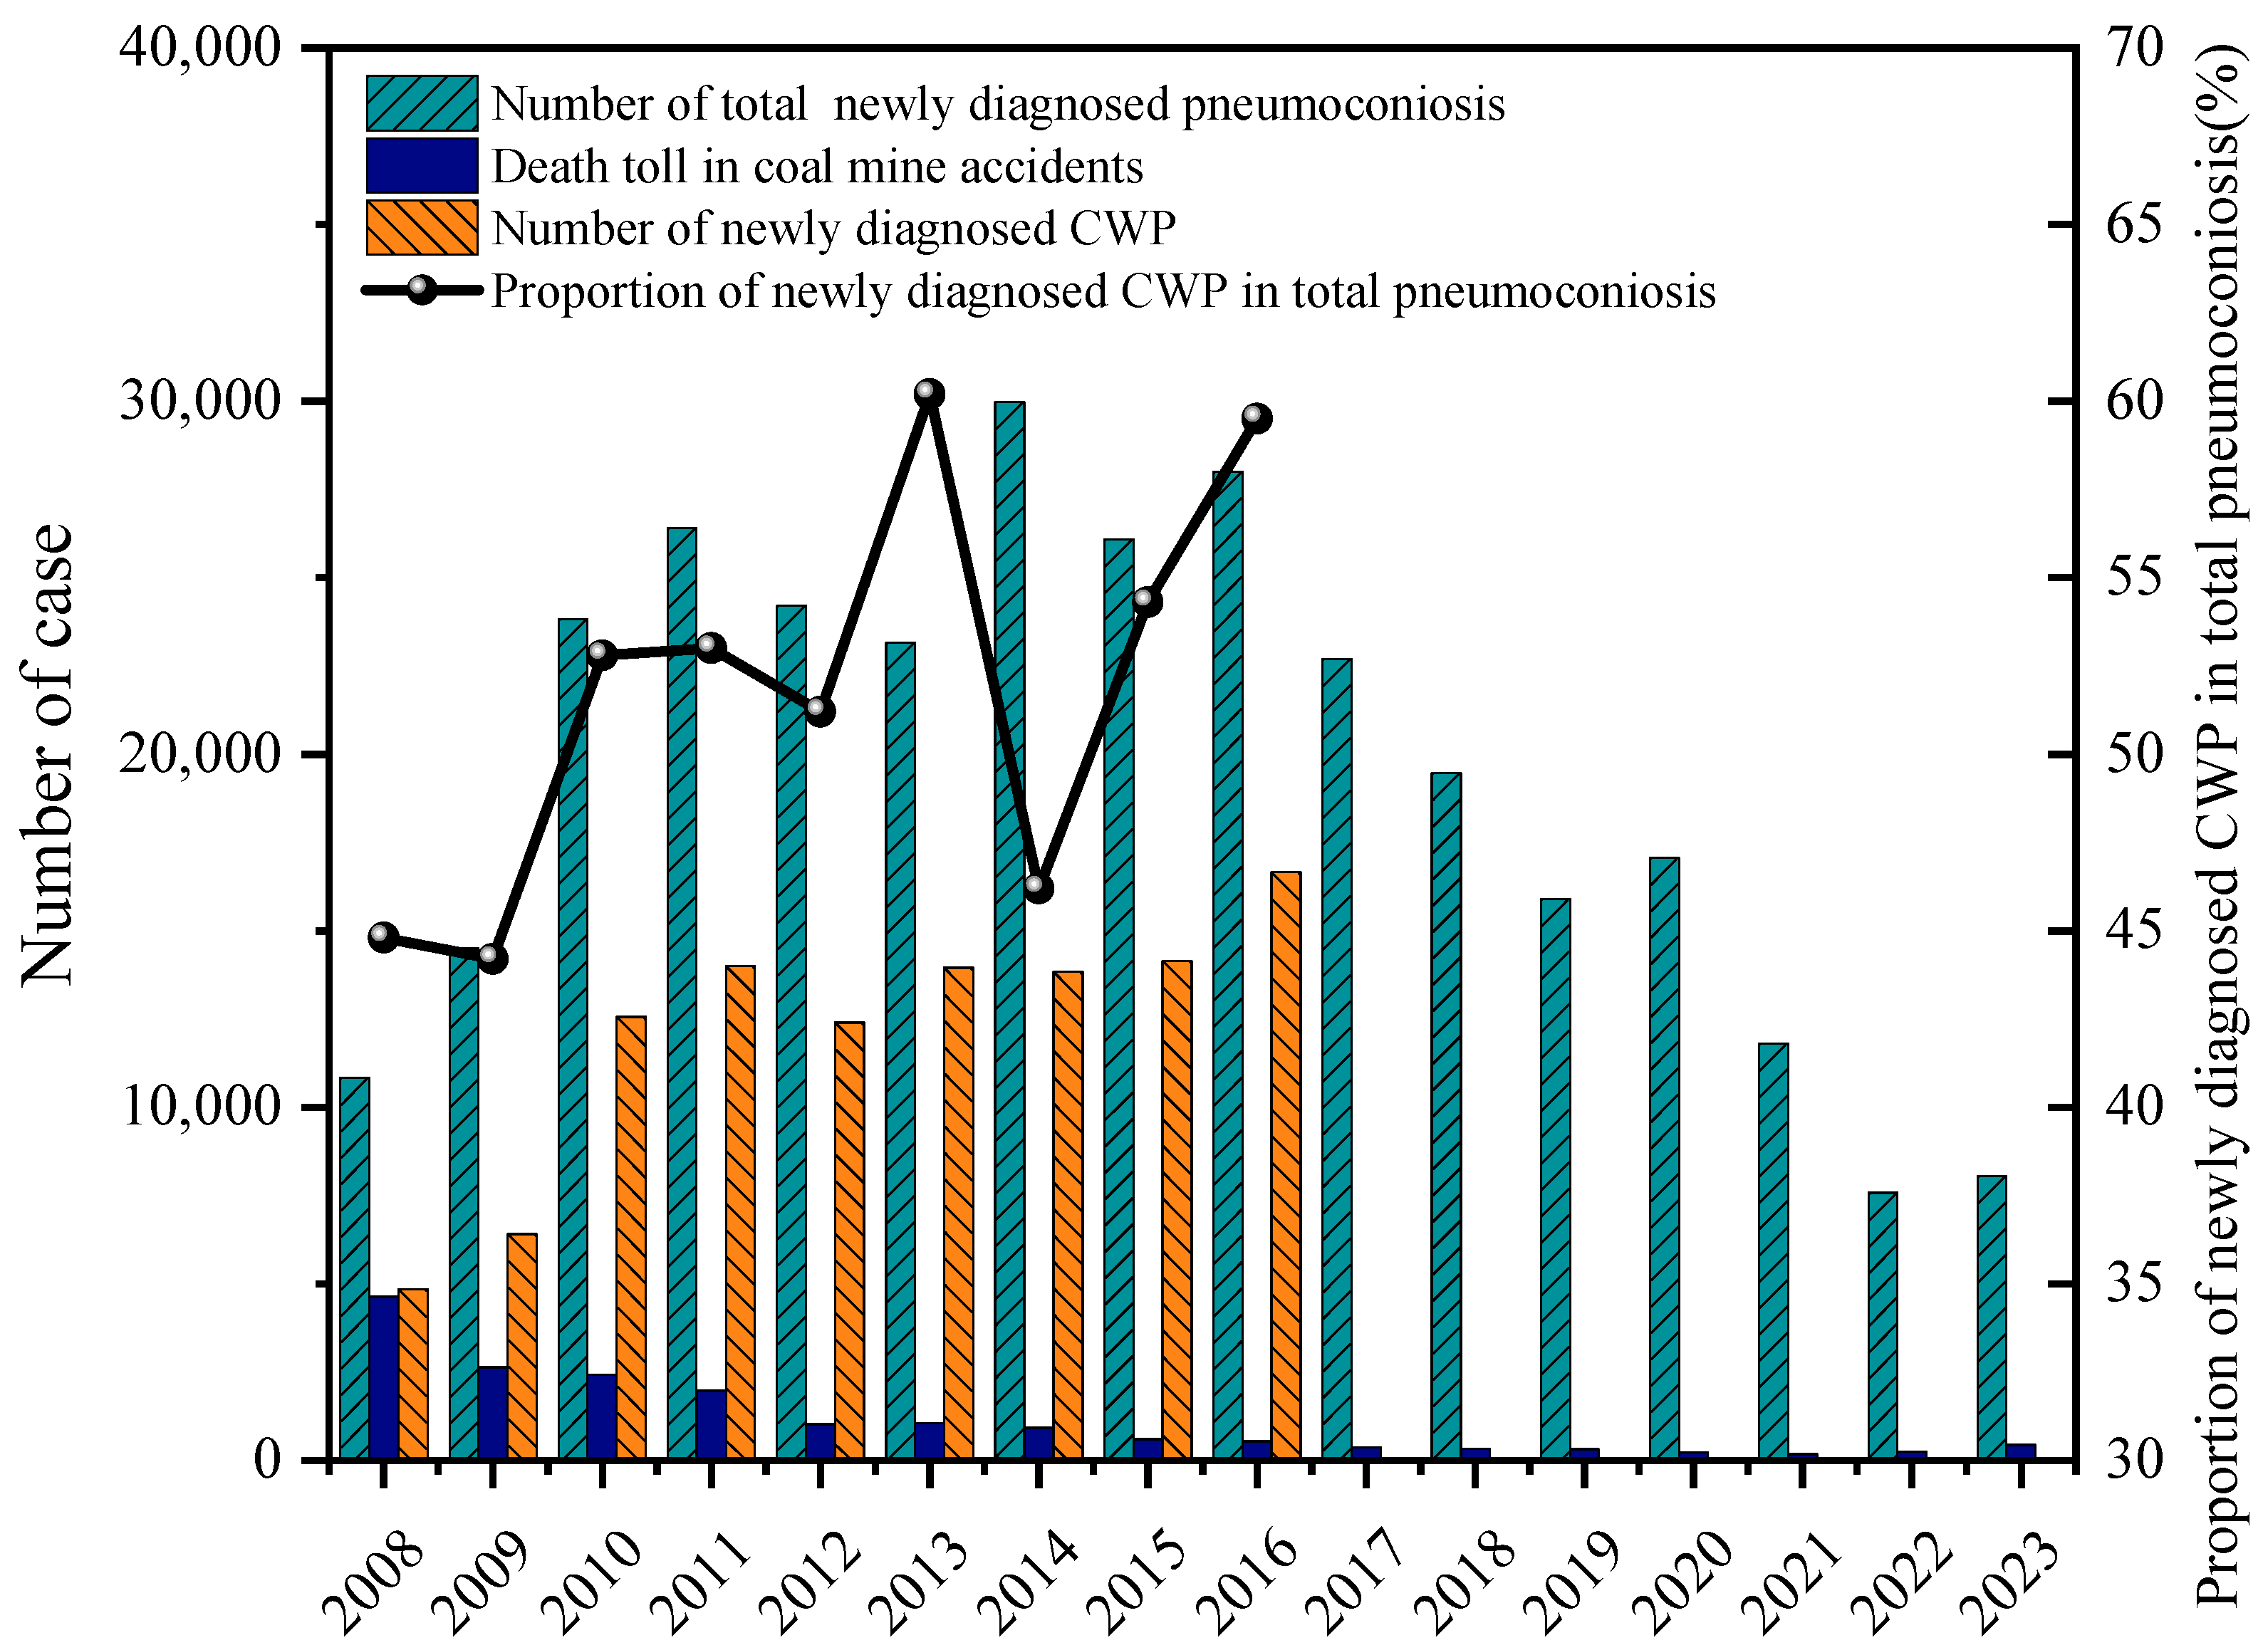
With the continuous development of underground coal mining technology and the increase in coal production, the fully mechanized mining face has become the most seriously polluted area and the amount of coal dust it generates accounts for over 65% of the total amount of coal dust in underground coal mines [1]. Long-term inhalation of coal dust can cause serious occupational hazards to the respiratory system of miners, including coal workers’ pneumoconiosis (CWP), progressive massive fibrosis, mixed-dust pneumoconiosis with coexisting silica exposure, chronic bronchitis, emphysema, and dust-related fibrosis [2]. According to the statistics of the National Health Commission of the People’s Republic of China, by the end of 2023 (2024 official data has not yet been released), China had cumulatively reported 1,049,950 cases of occupational diseases, and 931,117 cases were occupational pneumoconiosis, accounting for 88.7% of the total, of which CWP is the main type of occupational pneumoconiosis (see Figure 1) [3]. To reduce the risk of coal dust exposure in the fully mechanized mining face, scholars have proposed a series of engineering dust control measures, such as coal seam water injection [4,5], high-pressure water spraying [6,7], water curtain [8,9], ventilation [10,11], and dust filtration [12,13], etc., which achieve significant effects in suppressing the dust concentration in the fully mechanized mining face [14]. However, due to the hydrophobicity of the coal dust [15], it is still difficult to reduce the floating coal dust to below the occupational exposure limit set by relevant standards with the wet de-dusting measures (coal seams water injection, high-pressure water spraying, and water curtains, etc.). In view of this, more and more scholars have begun to pay attention to the research of coal dust control in the fully mechanized mining face from the perspective of coal dust generation reduction during the coal cutting process, in which both the drum cutting parameters and the coal properties would have a significant impact on the coal dust generation.
The adoption of different cutting parameters during the coal cutting process has a significant effect on coal dust generation, such as the shape of the cutting teeth, the mounting angle, the rotary speed, and the cutting depth [16]. Various current studies have focused on the effect of different cutting parameters on micron-sized dust generation. Achanti et al. [17] investigated the effect of drum cutting depth and cutting head rotary speed on the generation rate of PM10 coal dust. Fowell et al. [18] explored the effects of the cutting depth and cutting speed on the 0.5–5 μm coal dust generation. Li et al. [19] reported the relationship between the rotary speed and the 1.5–10 μm coal dust mass concentration. Zhou et al. [20] discussed the effects of tooth tip cone angle, invasion angle, and cutting speed on the cumulative percentages of PM2.5 and <7.07 μm coal dust.
The physicochemical properties of the coal body also have a direct influence on coal dust generation. Srikanth et al. [21] investigated the relationship between coal fixed carbon content, moisture content, volatile matter, ash, and the generation rate of PM2.5, <7 μm, and <15 μm coal dust. Organiscak et al. [22] explored the relationship between the coal proximate compositions and the generation rate of <250 μm coal dust. Zheng et al. [23] investigate the effect of moisture content on the cumulative mass distribution of 1–200 μm coal dust. Zhou et al. [24,25] summarized the effects of moisture content, fixed carbon content, ash, volatile matter, and porosity on the cumulative mass distribution of 2.5–100 μm coal dust.
Figure 1. Statistics on the occupational pneumoconiosis in 2008–2023 in China (Modified from [26]).
Atmosphere 16 01114 g001
The physicochemical properties of generated coal dust, such as free SiO2 percentage, sphericity, contact angle, chemical composition, etc., have a significant effect on both the respiratory hazard level and the engineering dust removal efficiency [27,28,29]. Among those physicochemical properties, free SiO2 percentage is one of the most important properties of coal dust, and the research on the etiology of pneumoconiosis concluded that free SiO2 is the key contributing factor constituting the pathogenic ability of coal dust and causing the development of CWP [30]. In addition, it was found that free SiO2 in coal dust was positively correlated with hydrophilicity, and the higher the free SiO2 percentage, the stronger the hydrophilicity of the coal dust, which would affect the efficiency of wet de-dusting measures [31]. Van et al. [32] reported the free SiO2 percentages of <125 μm coal dust generated during the anthracite cutting process.
The closer the sphericity of coal dust is to 1, the closer the particles are to spheres. Although a sphere has the smallest surface area for a given volume (as per the isoperimetric principle), its aerodynamic properties lead to greater health risks. Spherical particles exhibit reduced capture efficiency by high pressure water spraying and filtration fibers due to their lower tendency to deviate from air streamlines via inertial impaction and interception [33,34,35]. Consequently, they are more likely to bypass the upper respiratory defenses and penetrate deeper into the alveolar region of the lungs [36]. The deposition of particles in the alveoli is associated with more serious respiratory hazards. Doroodchi et al. [37] measured the sphericity of the <100 μm coal dust. However, few studies have focused on the sphericity of the nano- to micron-sized coal dust generated by coal cutting. Currently, wet dust removal is a more economical and effective way for dust control [38], while the hydrophilicity of coal dust is one of the key factors affecting the wet-dedusting efficiency [39], and the contact angle of the coal dust is the most intuitive expression of the hydrophilicity, but statistics show that it is difficult to wet the coal dust in more than 65% of the coal seams in China [40,41]. To address this challenge, various studies on the research and development of surfactants and the wetting mechanisms have been carried out [42,43,44,45], devoted to improving wet-dedusting efficiency. Most of the current studies focus on the contact angle of in situ deposited PM10 coal dust [46].
At present, Fourier transform infrared (FTIR) spectroscopy has become the most commonly used method for qualitative analysis or quantitative calculation of coal structural parameters [47], and FTIR spectroscopy has been widely used to analyze the chemical composition of coal [48,49] so as to investigate the oxygen-containing functional groups of different rank coals [50], as well as the relationship between the physical properties of the coals and their chemical composition [51]. However, few studies have focused on the chemical composition of coal dust generated during the cutting process of different rank coals so as to provide a reference for dust reduction.
In summary, existing studies mainly focused on the micron-sized coal dust, such as total dust, inhalable dust, and respirable dust, generated by coal cutting, and few studies have paid attention to the concentration distribution of nano- to sub-micron-sized coal dust, which is smaller, more penetrating, and more toxic than the micron-sized coal dust. Studies have shown that coal dust larger than 1 μm can be easily deposited in the large airways and nasal mucosa, and these deposits can be eliminated through the movement of mucous cilia [52], while nanoscale coal dust particles can easily deposit in the alveoli and even pass through the blood vessel wall and enter the blood circulation [53], causing great harm to human body health [54]. In addition, nanoparticles are more toxic than micron-sized particles due to their much larger specific surface area [55,56]. It has been reported that carbon nanotubes can directly kill macrophages [57]. It was also found that for nanoscale particles, the number concentration was more closely associated with human respiratory diseases than the mass concentration [58].
In view of the current research gaps, based on the self-developed experimental system for simulating dust generation from drum cutting of coal bodies, this study investigated the concentration distribution characteristics (mass concentration distribution, number concentration distribution, PM1, PM2.5, PM5, and PM10) and physicochemical properties (free SiO2 percentage, sphericity, contact angle, FTIR spectroscopy) of 10 nm–10 μm coal dust generated by cutting different rank coals (moisture content, fixed carbon content, firmness coefficient, porosity) with different drum cutting parameters (tooth tip cone angle, mounting angle, rotary speed, cutting depth). The research results can serve as a reference for the reduction of nano- to micron-sized coal dust pollution in coal mining face and the prevention of CWP.

2. Materials and Methods

2.1. Self-Developed Experimental System for Simulating Dust Generation from Drum Cutting of Coal Bodies

The self-developed experimental system for simulating dust generation from drum cutting of coal bodies is shown in Figure 2. The system mainly consists of a hydraulic support, a cutting simulation unit, a dust concentration monitoring unit, a sealed box, a ventilation simulation unit, and a Mining Dust Sampler (MDS, CCZ20, Suzhou Yilian Electromechanical Technology Co., Suzhou, China). The hydraulic support is used to fix the raw coal block to avoid its shifting during the cutting process. The cutting simulation unit consists of a cutting drum, a motor, and an operation control system, which allows the drum cutting parameters to be set in advance. The operation control system is responsible for presetting, storing cutting parameters, and sending instructions; the motor adjusts the rotational speed and torque according to the instructions to convert electrical energy into kinetic energy; and the cutting drum is in direct contact with the coal to perform the cutting action. The operation control system and the motor are bidirectionally connected via shielded cables, which can not only transmit parameter instructions but also feedback the real-time operating status of the motor; the motor and the cutting drum are rigidly connected through a flexible coupling to achieve power transmission. Overall, cutting parameters are preset through the operation control system, and instructions are sent to the motor system via PLC control technology. The motor drives the cutting drum to cut the coal bodies, while the real-time status of the motor is fed back to the PLC to ensure the accurate execution of parameters, thereby realizing the function of simulating dust generation during on-site drum cutting. The dust concentration monitoring unit is composed of a Scanning Mobility Particle Sizer (SMPS, Model 3910, TSI Inc., Shoreview, MN, USA), an Optical Particle Sizer (OPS, Model 3330, TSI Inc., USA), and a DustTrak Environmental Monitor (Model 8540, TSI Inc., USA). This combination fully covers the particle size range of 10 nm–10 μm, ensuring the capture of nano-to-micron-sized coal dust particles that pose risks to the respiratory system of coal miners. To achieve continuous and accurate particle size distribution characterization of 10 nm–10 μm coal dust, the raw data from SMPS and OPS were further processed using TSI’s MIM software (version two), an official data fusion tool designed for multi-instrument integration. This software automatically calibrates the overlapping detection range (0.3–0.42 μm) of SMPS and OPS to eliminate systematic errors, then merges the nano-scale (10–420 nm) and submicron-to-micron-scale (0.3–10 μm) data into a continuous dataset covering 10 nm–10 μm. The integrated dataset includes both number concentration distribution and mass concentration distribution, which were exported as Excel files for subsequent plotting with Origin software (2020 version). Additionally, the mass concentrations of PM1, PM2.5, PM5, and PM10 were directly monitored using a DustTrak Environmental Monitor (Model 8540, TSI Inc.) to cross-validate the integrated results, ensuring data accuracy. In addition, a Mining Dust Sampler was used to collect PM10 coal dust samples for subsequent physicochemical property analysis, such as scanning electron microscopy (SEM) analysis, contact angle measurement, and Fourier transform infrared (FTIR) spectroscopy. Before each experiment, the entire sealed box and all related equipment were thoroughly cleaned to eliminate the interference of deposited dust. During the experiment, the cutting simulation unit, operated according to preset parameters, and the dust concentration was continuously monitored by dust concentration monitoring unit. Pre-experiment verification showed that the dust concentration in the sealed box tended to stabilize 2 min after the start of cutting; therefore, data recording began at the 2nd minute and lasted for 3 min to ensure the stability and reliability of the measurement results. The combined use of the Scanning Mobility Particle Sizer (SMPS), Optical Particle Sizer (OPS), and DustTrak Environmental Monitor achieves complete coverage of the entire target particle size range (10 nm–10 μm), thereby avoiding the problem of underestimated nanoparticle concentrations caused by agglomeration effects, which is common in traditional laser particle size analyzers. The sealed box not only prevents coal dust from escaping, but also avoids the influence of dust in the external environment on the experimental results. The ventilation simulation unit consists of a fan and a ventilation pipeline, which is sealed and connected to the sealed box to simulate underground ventilation in coal mines, so as to continuously remove the coal dust generated in the coal cutting process, thus preventing the coal dust from accumulating and guaranteeing the accuracy of the experimental results. According to the requirements of the 2022 version of the China Coal Safety Regulations for wind speed in fully mechanized mining faces, the fan has been adjusted to form a stable 0.3 m/s airflow.

2.2. Experimental Coal Samples

The raw coal blocks for cutting were four different rank coals taken from four underground coal mines, respectively (see Table 1). During the sampling process, the raw coal blocks were collected with shovels and pickaxes in the flat area of the fully mechanized mining face, and to avoid the oxidation reaction on the surface of the raw coal blocks in the air affecting the experimental results, the raw coal blocks were sealed with plastic film and brought back to the laboratory immediately after the sampling. Due to the irregular shape of in situ collected raw coal blocks, the raw coal blocks were further processed into rectangular shapes of about 30 cm × 20 cm × 20 cm in the laboratory.
Based on the China national standard GB/T 212-2008 “Proximate Analysis of Coal” [59], a proximate analyzer (PA, 5E-MAG6600, Changsha Kaiyuan HOCENT Technology Co., Changsha, China) was used to measure the moisture and fixed carbon content of four different rank coals. The firmness coefficients of the experimental coal samples were tested in accordance with the China national standard GB/T 23561.12-2010 “Methods for Determining the Physical and Mechanical Properties of Coal and Rock—Part 12: Method for Determining Coal Hardiness Coefficient” [60]. The porosity of the coal samples was obtained according to the China national standard GB/T 23561.4-2009 “Methods for Determining the Physical and Mechanical Properties of Coal and Rock—Part 4: Methods for Calculating the Porosity of Coal and Rock” [61]. The Above measurement results are summarized in Table 2.

2.3. Drum Cutting Parameters

Firstly, to investigate the influence of drum cutting parameters on the 10 nm–10 μm coal dust generation, the tooth tip cone angle, mounting angle, rotary speed, and cutting depth were selected as the cutting variables when cutting the DLT long-flame coal; relevant cutting parameters are illustrated in Figure 2. Cutting teeth are arranged radially along the drum, with their tooth bodies distributed radially relative to the drum axis. During cutting, they rotate around the drum center to cut into the coal, which meets the cutting requirements of medium and low hardness coals such as DLT long-flame coal used in the experiment. By cooperating with the cutting parameters in Table 3, this setup simulates the on-site shearer drum operation. The control variable method is then used to explore the influence of a single parameter on the mass/number concentration distribution of 10 nm–10 μm coal dust.
The cutting parameter ranges in Table 3 for cutting DLT long-flame coal are rationally determined based on its physical properties and real-world operating conditions: the tooth tip cone angle (80–100°) and mounting angle (45–90°) refer to the conclusions of Zhou et al. [20], which verified via linear cutting experiments that these ranges can balance the suppression of 10 nm–10 μm coal dust and the prevention of pick wear for medium-low hardness coal; the rotary speed (40–130 r/min) covers the on-site common adjustable range of MG-series shearers and is consistent with real-world shearer operations; and the cutting depth (30–50 mm) is derived from the optimal dust reduction interval (25–30 mm) of single-pick cutting tests by Li et al. [62], and extended to 50 mm to adapt to the actual conditions of medium-thick coal seams. All these ranges align with the conventional operation of drum shearers in coal mines, ensuring the practicality of the study conclusions. Secondly, to explore the effect of coal properties on coal dust generation, the four different rank coal samples were cut under the same cutting parameters set as tooth tip cone angle 80°, mounting angle 45°, rotary speed 40 r/min, and cutting depth 30 mm.

2.4. Experimental Procedure

Before each cutting test, the interior of the sealed box, the surface of the raw coal block, and the hydraulic support were carefully wiped with alcohol gauze to reduce the influence of residual dust inside the instrument on the measurement results. Then, the raw coal block was placed inside the sealed box, the coal block was fixed with the hydraulic support, the cutting drum was installed at the motor with the cutting teeth close to the edge of the coal block, the fan of the ventilation simulation unit was turned, and the cutting parameters of the drum were preset to cut the coal block. In the pilot study, it was found that the coal dust concentration in the sealed box stabilized after 5 min of coal cutting. This stabilization was confirmed by continuously monitoring the mass and number concentrations of 10 nm–10 μm coal dust in real time (using the dust concentration monitoring unit described in Section 2.1) until the concentration values no longer showed significant fluctuations and maintained a stable plateau for 2 consecutive minutes. Therefore, the time to start recording the 10 nm–10 μm coal dust concentration by the dust concentration monitoring unit was set at 5 min after the cutting. The Mining Dust Sampler was set inside the sealed box to collect the PM10 floating coal dust during the cutting process, and the sphericity, contact angle, and surface functional groups of the collected PM10 coal dust were measured using a scanning electron microscope (SEM, SU8200, HITACHI Inc., Tokyo, Japan), a Dynamic Contact Angle Measuring (DCAM, SCI4000B, Beijing INTERFACE-SCI Inc., Beijing, China), and an FTIR (TENSOR27, BRKR Inc., Billerica, MA, USA), respectively. The free SiO2 percentages of PM10 coal dust were measured using the pyrophosphate mass method.

3. Results

3.1. Mass Concentration Distribution of 10 nm–10 μm Coal Dust at Different Cutting Parameters

3.1.1. Mass Concentration Distribution of 10 nm–10 μm Coal Dust at Different Tooth Tip Cone Angles

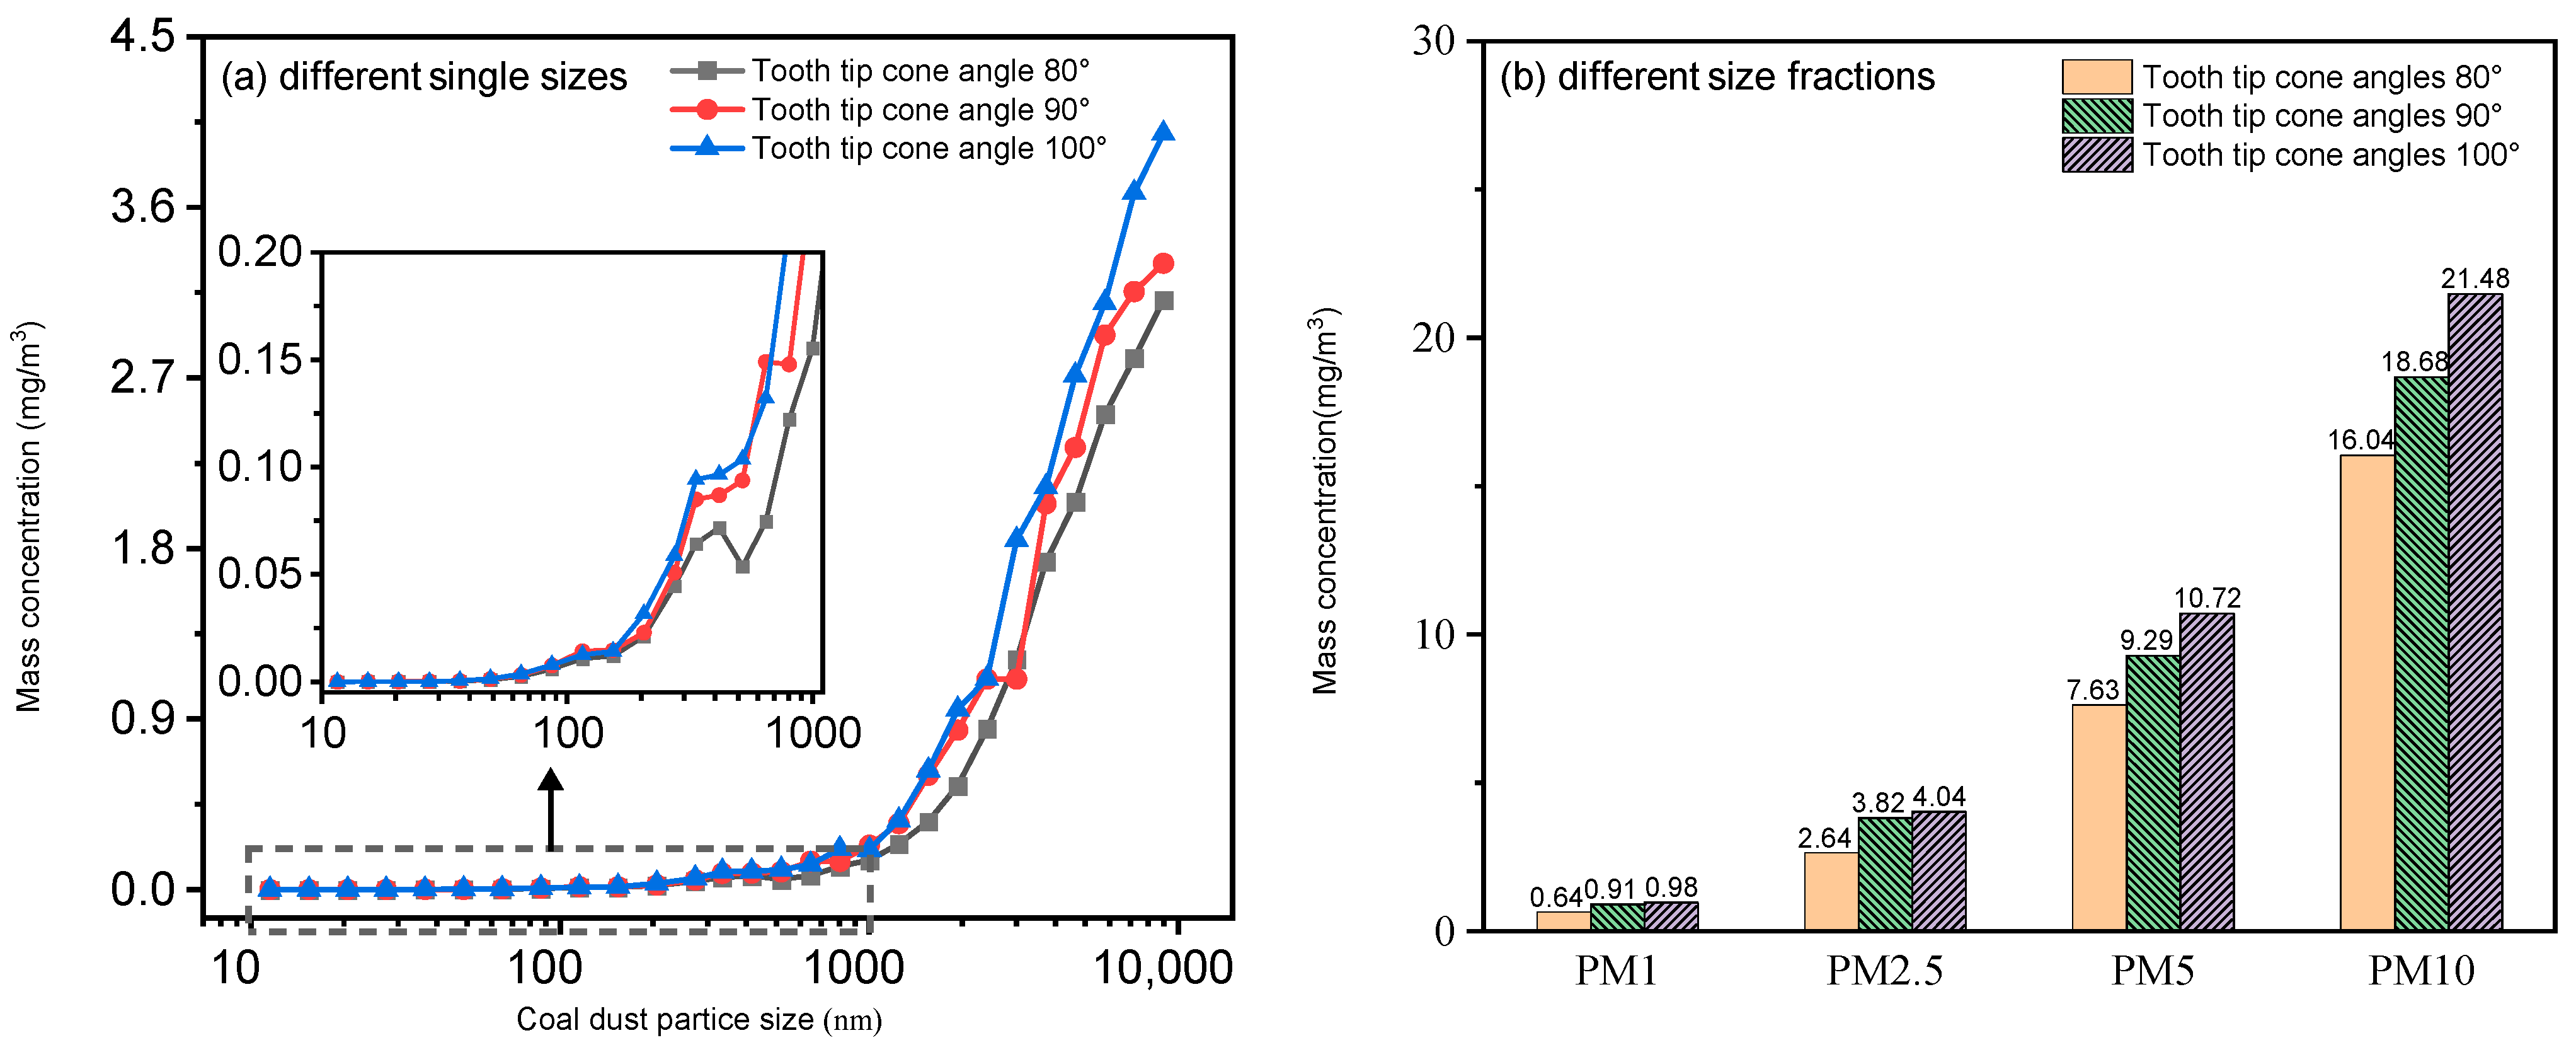
As can be seen from Figure 3a, a larger tooth tip cone angle can generate a higher mass concentration of 10 nm–10 μm coal dust, and the mass concentration continuously increases with the increase in particle size. In the particle size range of 10–50 nm, the mass concentration is extremely low and nearly zero; above 50 nm, the mass concentration starts to increase significantly. Figure 3b shows that the mass concentrations of PM1, PM2.5, PM5, and PM10 increased with the increase in the tooth tip cone angle, and it was found that with the tooth tip cone angle increased from 80° to 100°, the mass concentrations of PM1, PM2.5, PM5, and PM10 increased by 53.1%, 53.0%, 40.5%, and 33.9%, respectively.

3.1.2. Mass Concentration Distribution of 10 nm–10 μm at Different Mounting Angles

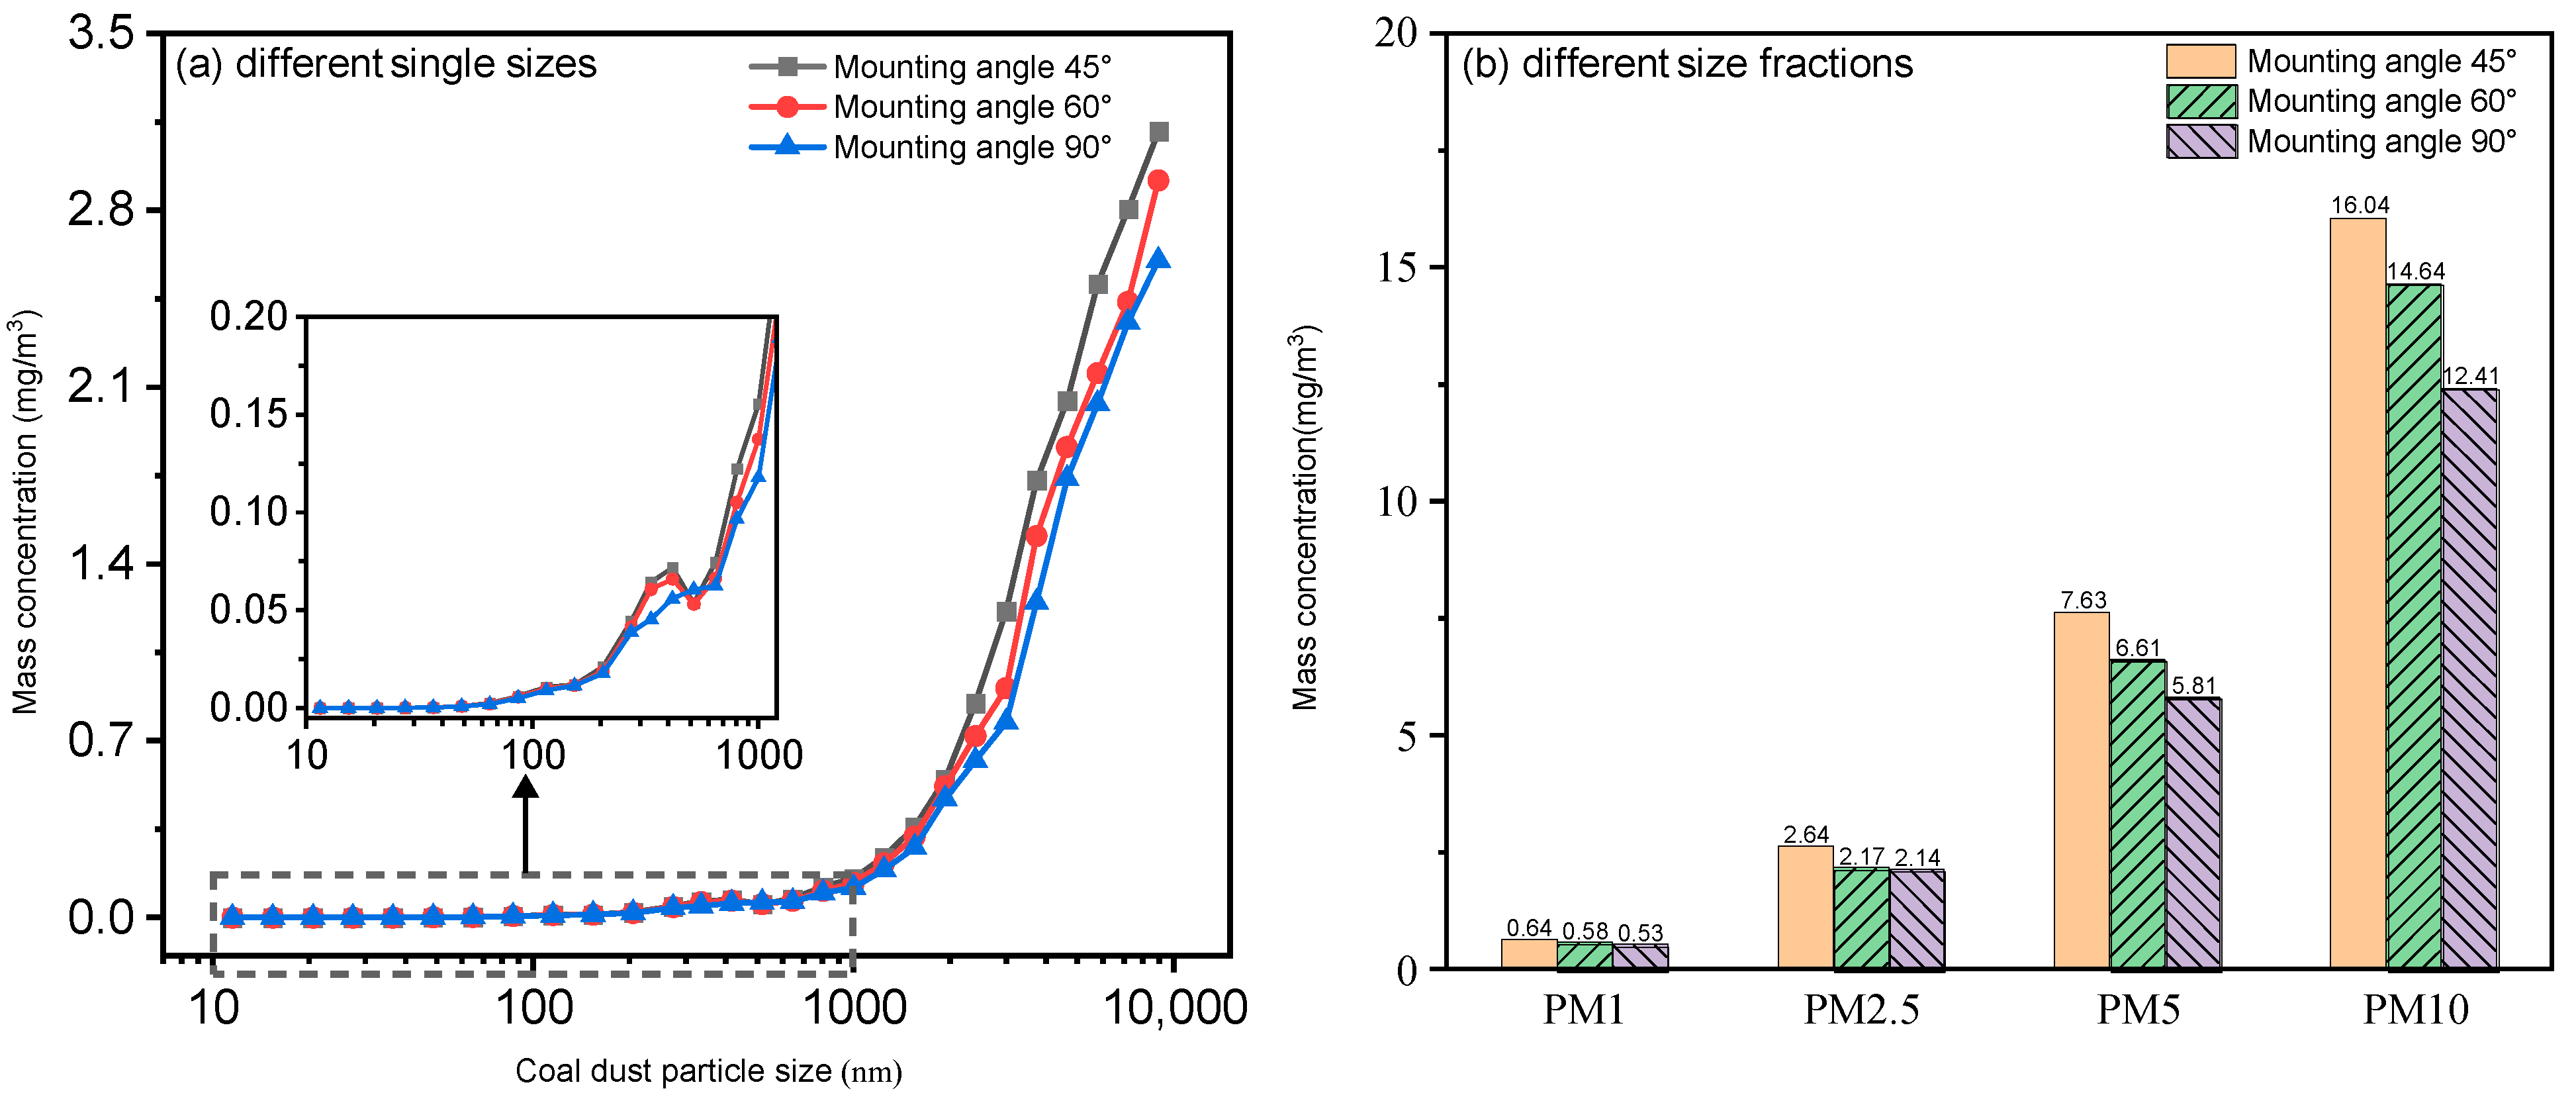
From Figure 4a, it can be seen that the mass concentrations of 10 nm–10 μm coal dust generated at different mounting angles were relatively close to each other, but the mass concentration was slightly higher at smaller angles, i.e., the mounting angle has a weak inverse relationship with the mass concentration of the 10 nm–10 μm coal dust. In addition, it was also found that the mass concentration continuously increased with the increase in the particle size. Figure 4b showed that larger mounting angle can suppress the generation of coal dust particles to a certain extent, and when the mounting angle was increased from 45° to 90°, the mass concentrations of PM1, PM2.5, PM5, and PM10 were reduced by 17.2%, 18.9%, 23.9%, and 22.6%, respectively.

3.1.3. Mass Concentration Distribution of 10 nm–10 μm Coal Dust at Different Rotary Speeds

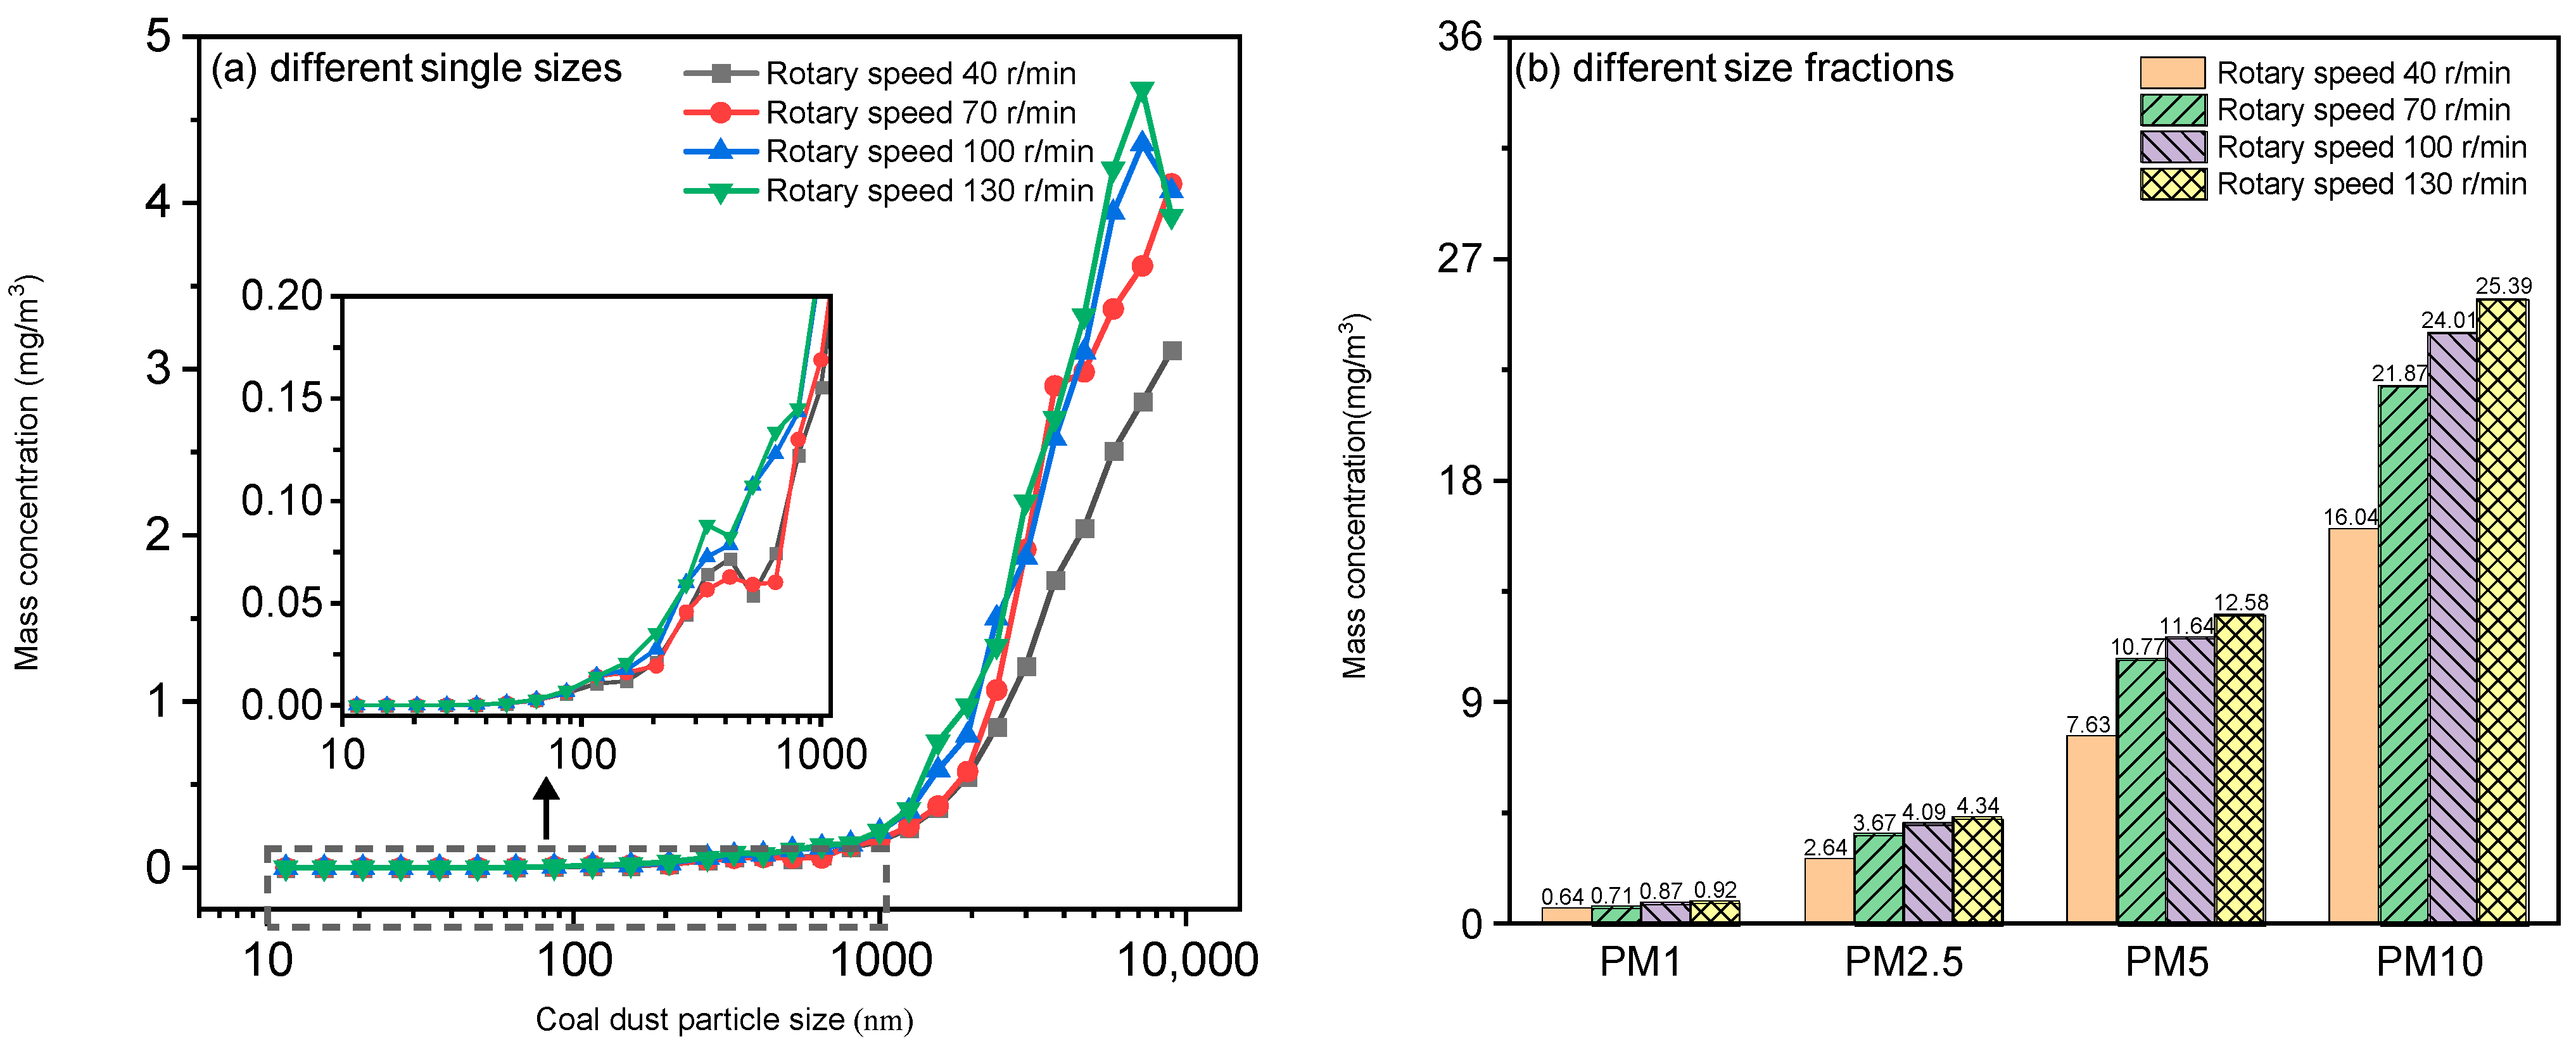
From Figure 5a, it can be seen that the mass concentration of 10 nm–10 μm coal dust showed an increasing trend with the increase in rotary speed, and the mass concentration continuously increased with the increase in particle size excluding the range 7–10 μm for rotary speed 100 and 130 rpm. This can be attributed to two aspects: (1) high-speed rotational cutting favors the generation of particles < 7 μm while relatively reducing 7–10 μm particle production; (2) 7–10 μm particles ejected by high-speed rotation exhibit a short airborne residence time. These factors collectively result in the lower measured mass concentration of 7–10 μm coal dust at 100 and 130 rpm. Figure 5b showed that the mass concentrations of PM1, PM2.5, PM5, and PM10 all showed different degrees of increase with the increase in rotary speed. To be specific, the mass concentrations of PM1, PM2.5, PM5, and PM10 at 130 r/min rotary speed were 1.44, 1.64, 1.65, and 1.59 times that of 40 r/min, respectively.

3.1.4. Mass Concentration Distribution of 10 nm–10 μm Coal Dust at Different Cutting Depths

Figure 6a showed that with the increase in the drum cutting depth, the mass concentration of 10 nm–10 μm coal dust kept decreasing, while the mass concentration continuously increased with the increase in the particle size at different drum cutting depths. Figure 6b showed that there was a significant negative correlation between the cutting depth and the generated sub-micron- to micron-sized coal dust. To be specific, as the cutting depth increased from 30 mm to 50 mm, the mass concentrations of PM1, PM2.5, PM5, and PM10 decreased by 26.6%, 22.0%, 31.7%, and 30.0%, respectively.

3.2. Number Concentration Distribution of 10 nm–10 μm Coal Dust at Different Cutting Parameters

3.2.1. Number Concentration Distribution of 10 nm–10 μm Coal Dust at Different Tooth Tip Cone Angles

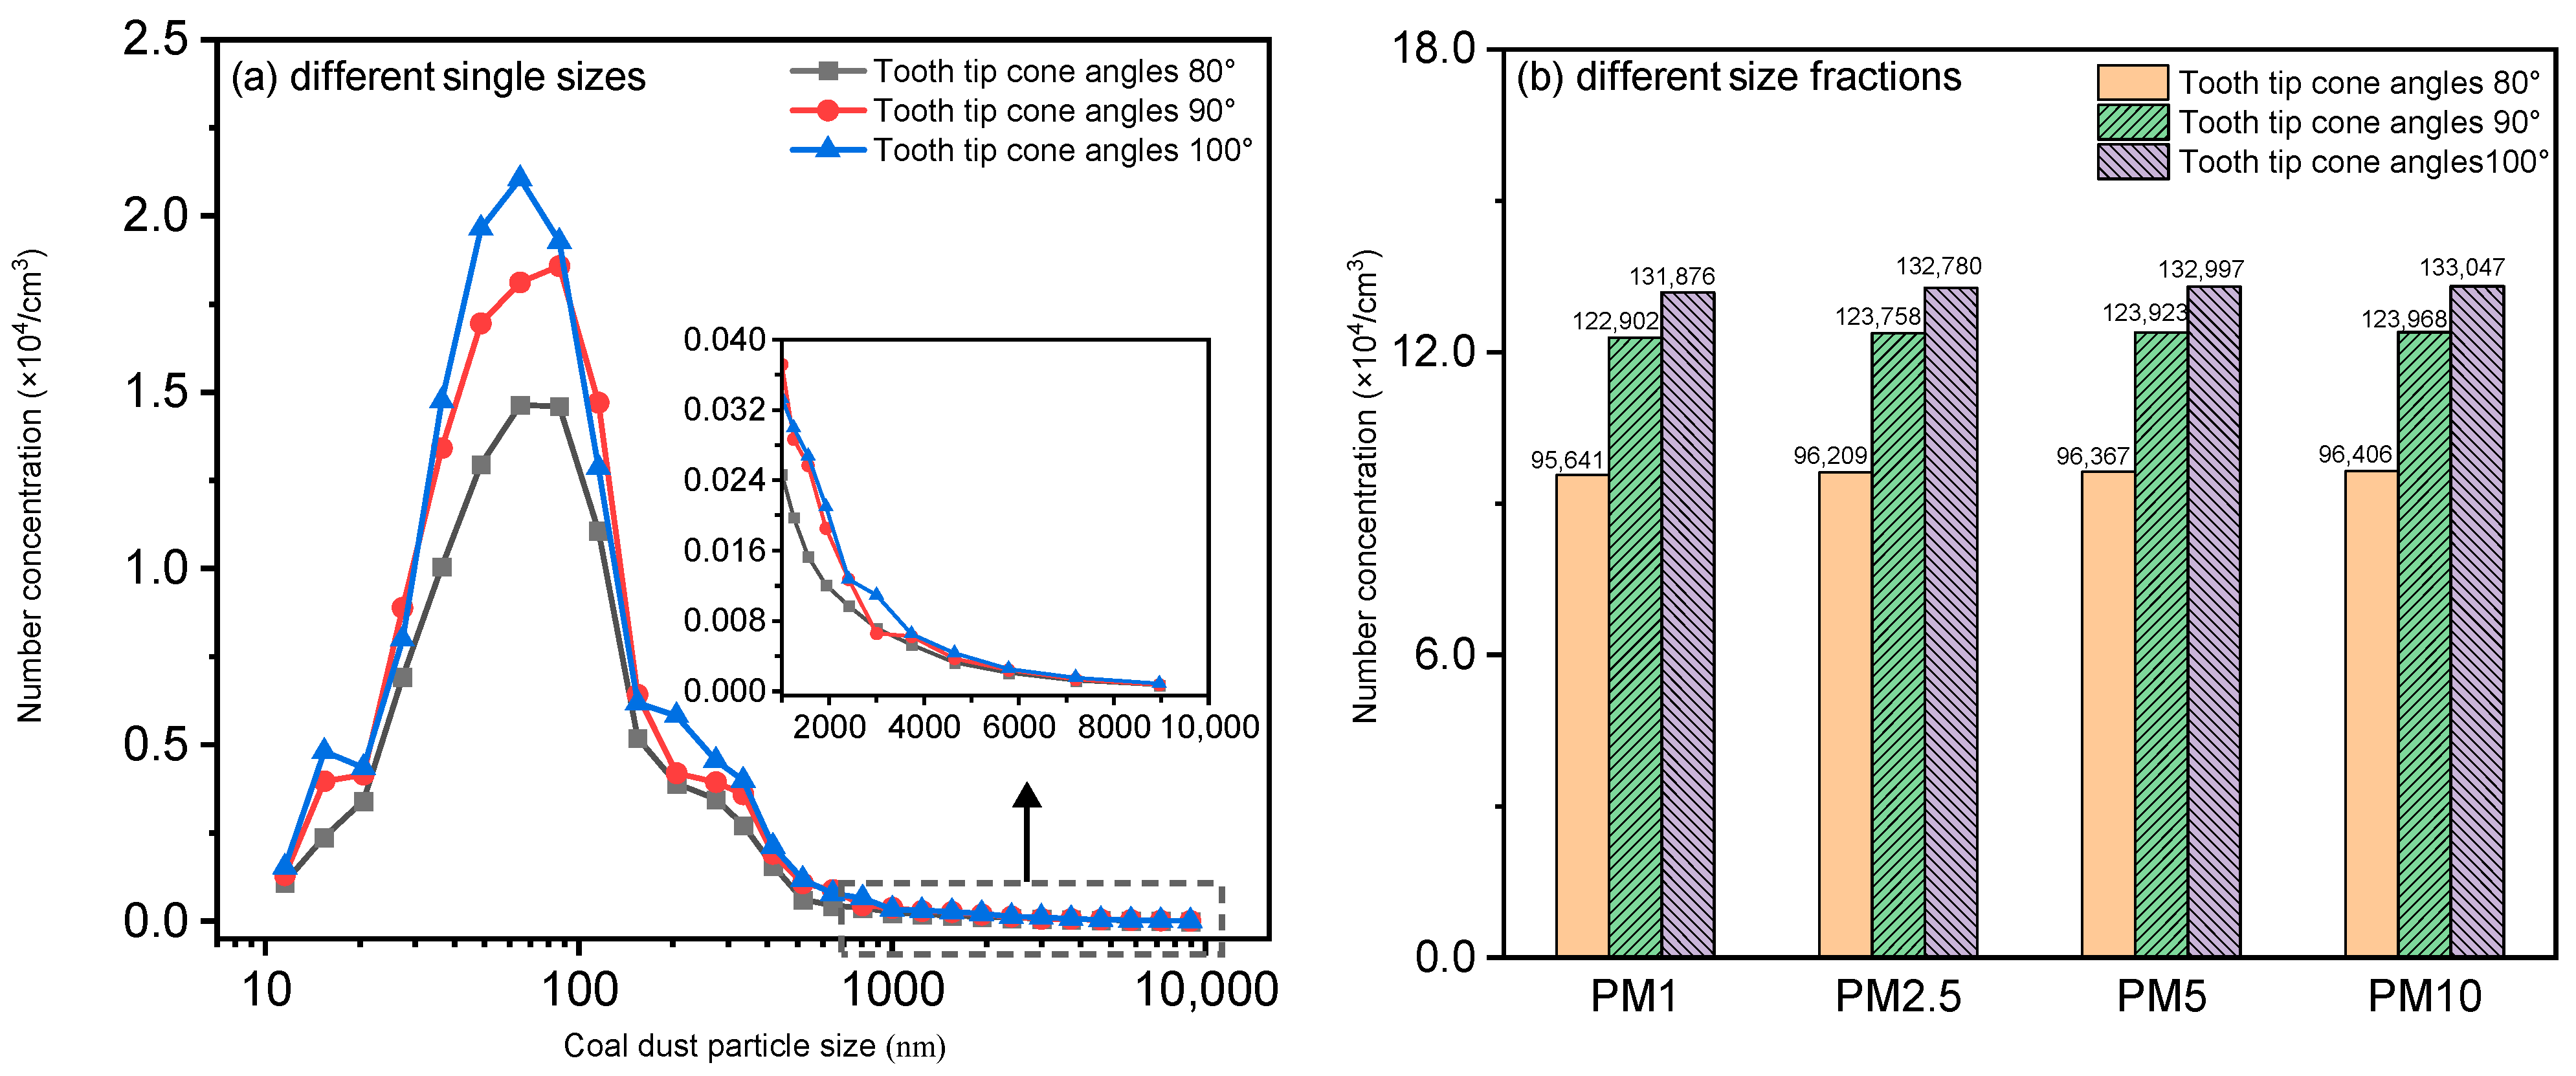
Figure 7a presents that a larger tooth tip cone angle can generate a higher number concentration of 10 nm–10 μm coal dust, and the number concentration showed a single-peak distribution with the peaks located in the coal particle size range of 60–90 nm. Figure 7b showed that a larger tooth tip cone angle significantly increased the number concentrations of PM1, PM2.5, PM5, and PM10, and it was found that when the tooth tip cone angle was increased from 80° to 100°, the number concentrations of PM1, PM2.5, PM5, and PM10 all increased by 38%.

3.2.2. Number Concentration Distribution of 10 nm–10 μm Coal Dust at Different Mounting Angles

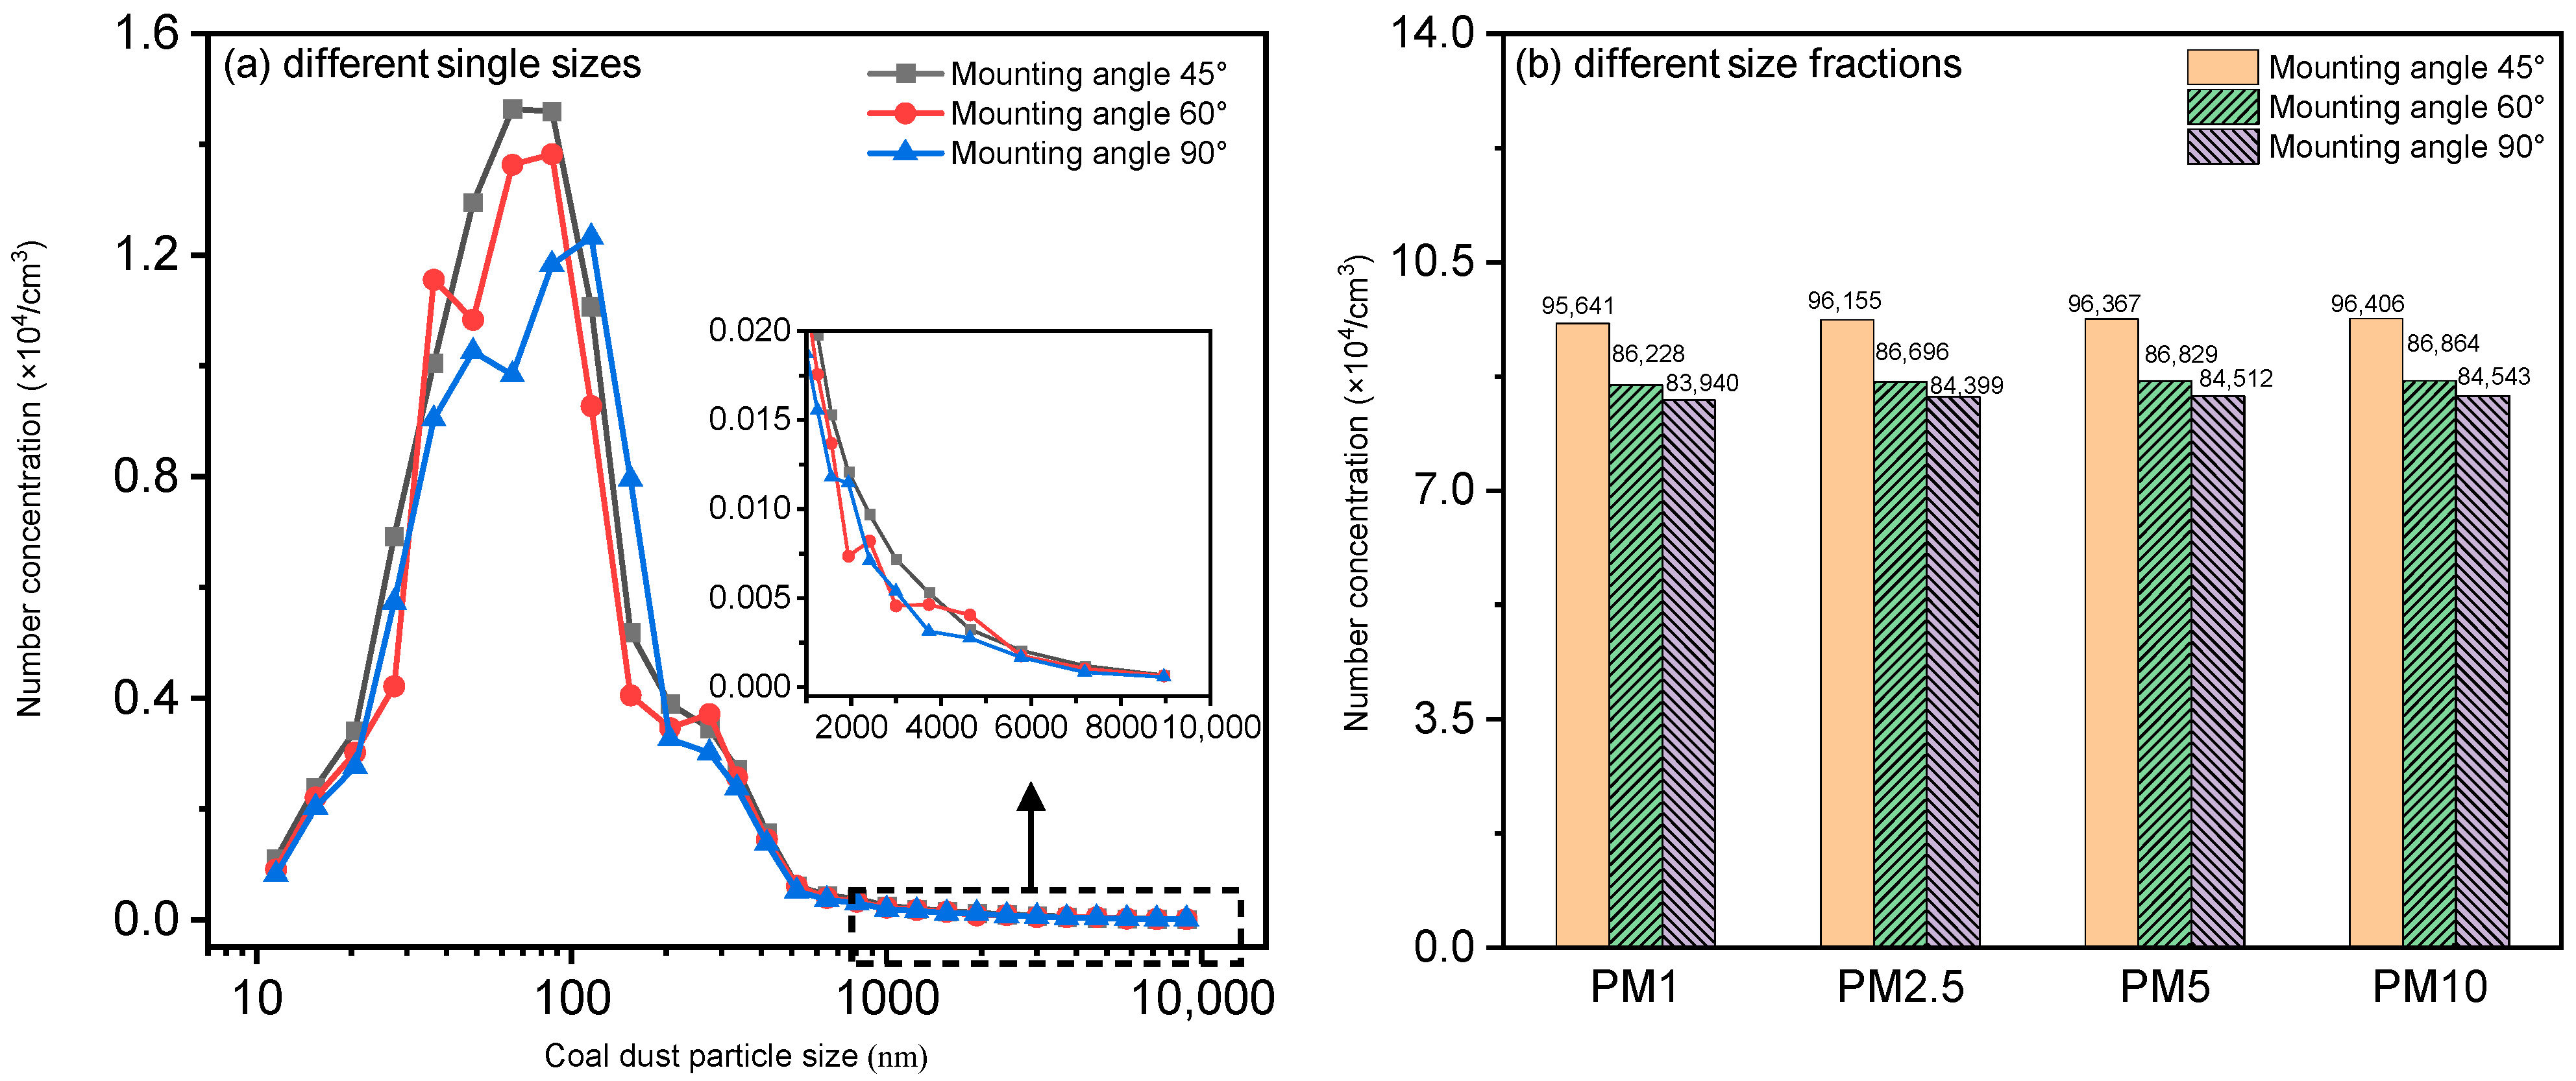
From Figure 8a, it can be seen that a smaller mounting angle can generate higher a number concentration of 10 nm–10 μm coal dust, and the number concentration showed a single-peak distribution, with the peaks appearing in the coal particle size range of 65 nm–116 nm. Figure 8b showed that there was an inverse relationship between the mounting angle and the number concentration of coal dust, and it was found that when the mounting angle was increased from 45° to 90°, the number concentrations of PM1, PM2.5, PM5, and PM10 were all reduced by 12.3%.

3.2.3. Number Concentration Distribution of 10 nm–10 μm Coal Dust at Different Rotary Speeds

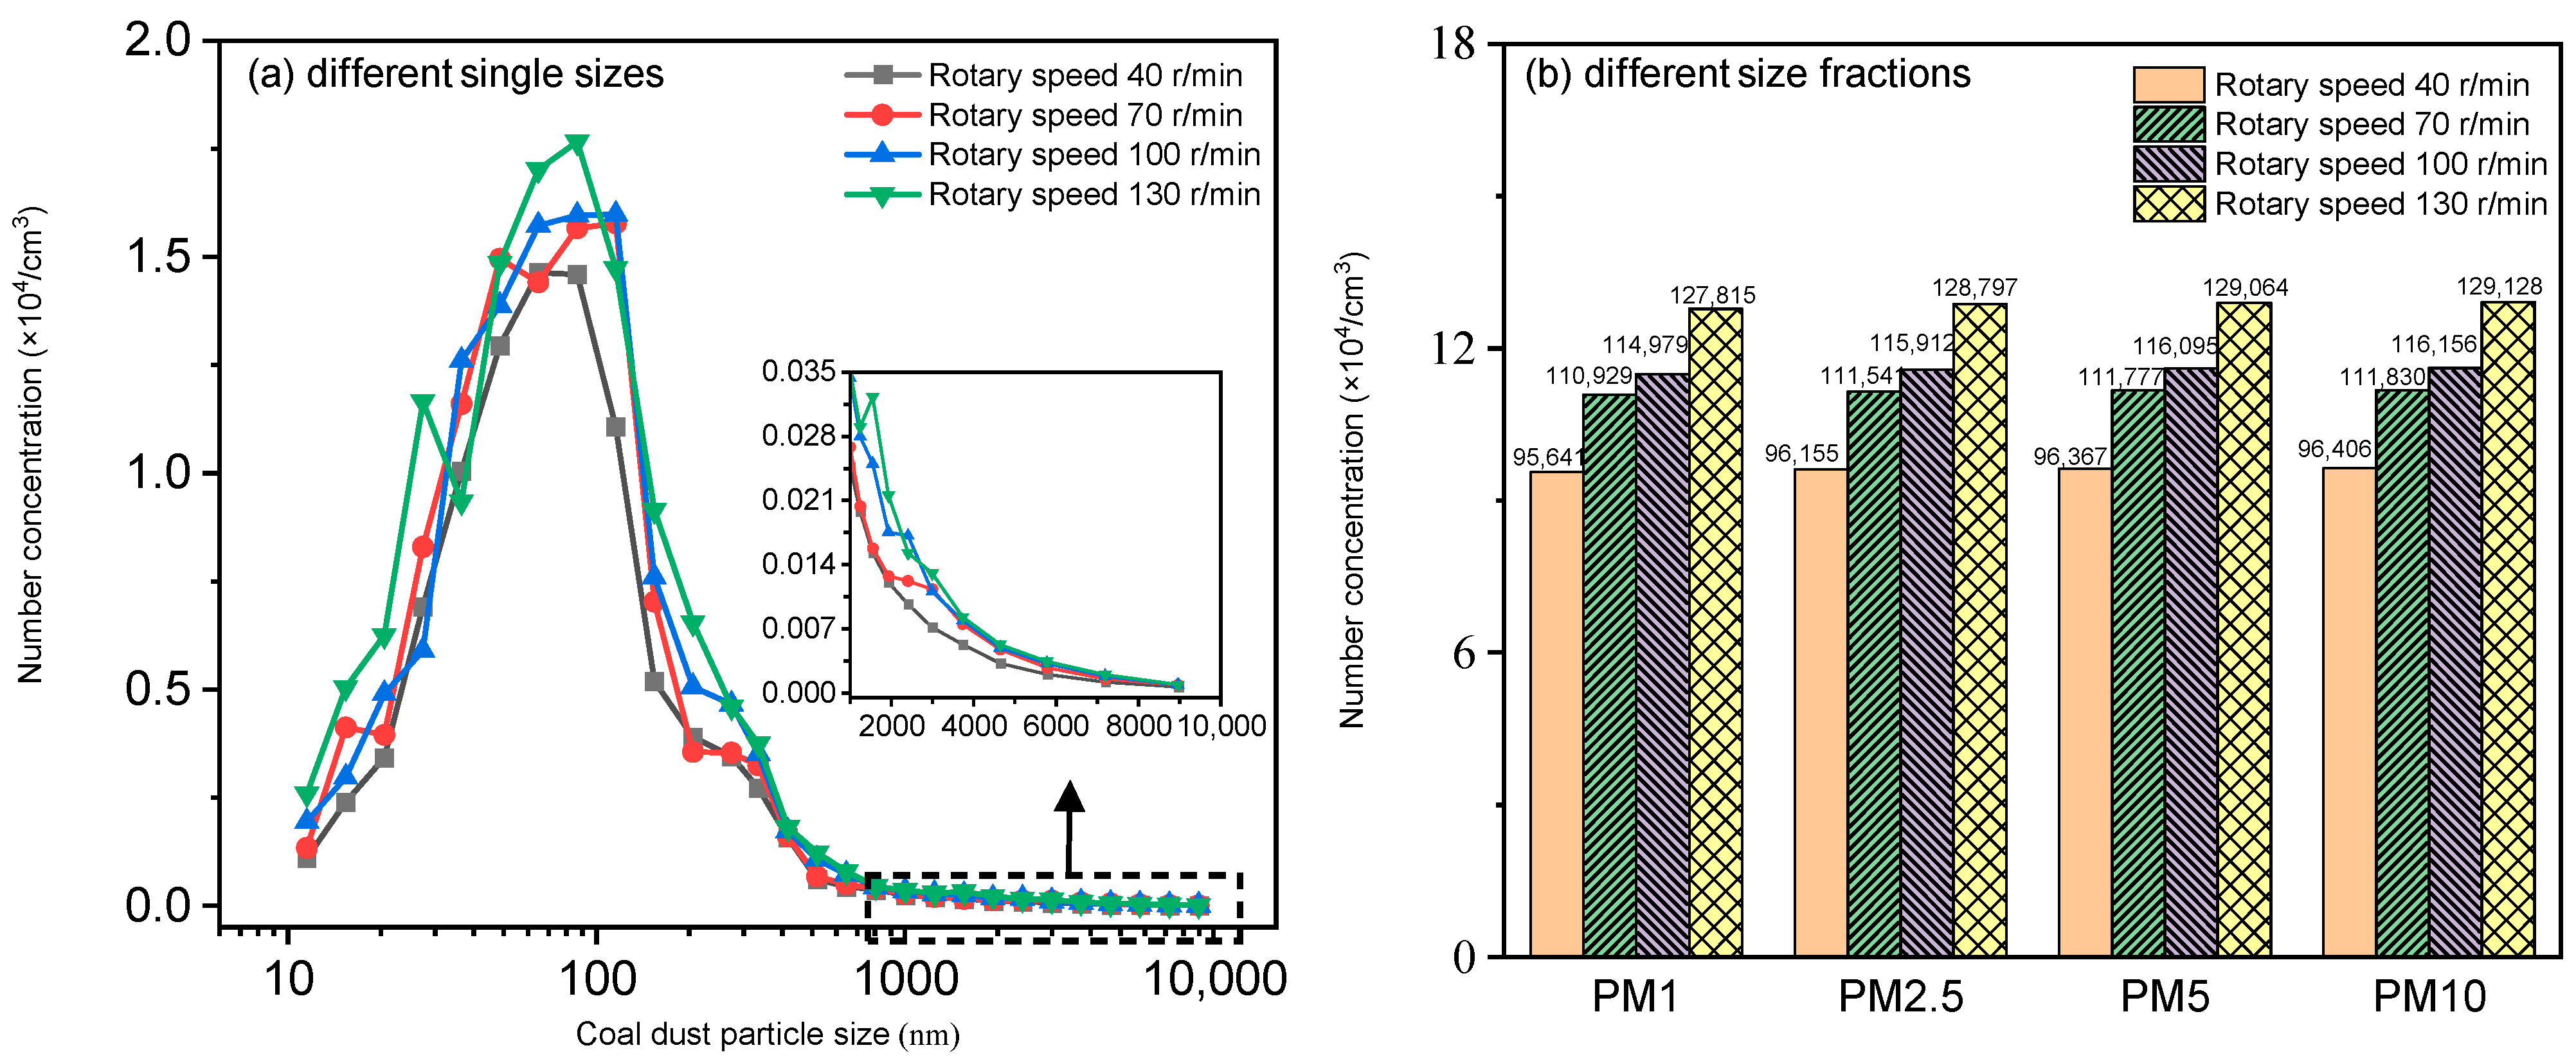
Figure 9a showed that higher rotary speed can generate a higher number concentration of 10 nm–10 μm coal dust, and the number concentration presented a single-peak distribution with the peaks located in the coal particle size range of 80–120 nm. From Figure 9b, it was found that the number concentrations of PM1, PM2.5, PM5, and PM10 all increased with the increase in rotary speed, and when the rotary speed was increased from 40 r/min to 130 r/min, the number concentrations of PM1, PM2.5, PM5, and PM10 all increased by 33.9%.

3.2.4. Number Concentration Distribution of 10 nm–10 μm Coal Dust at Different Cutting Depths

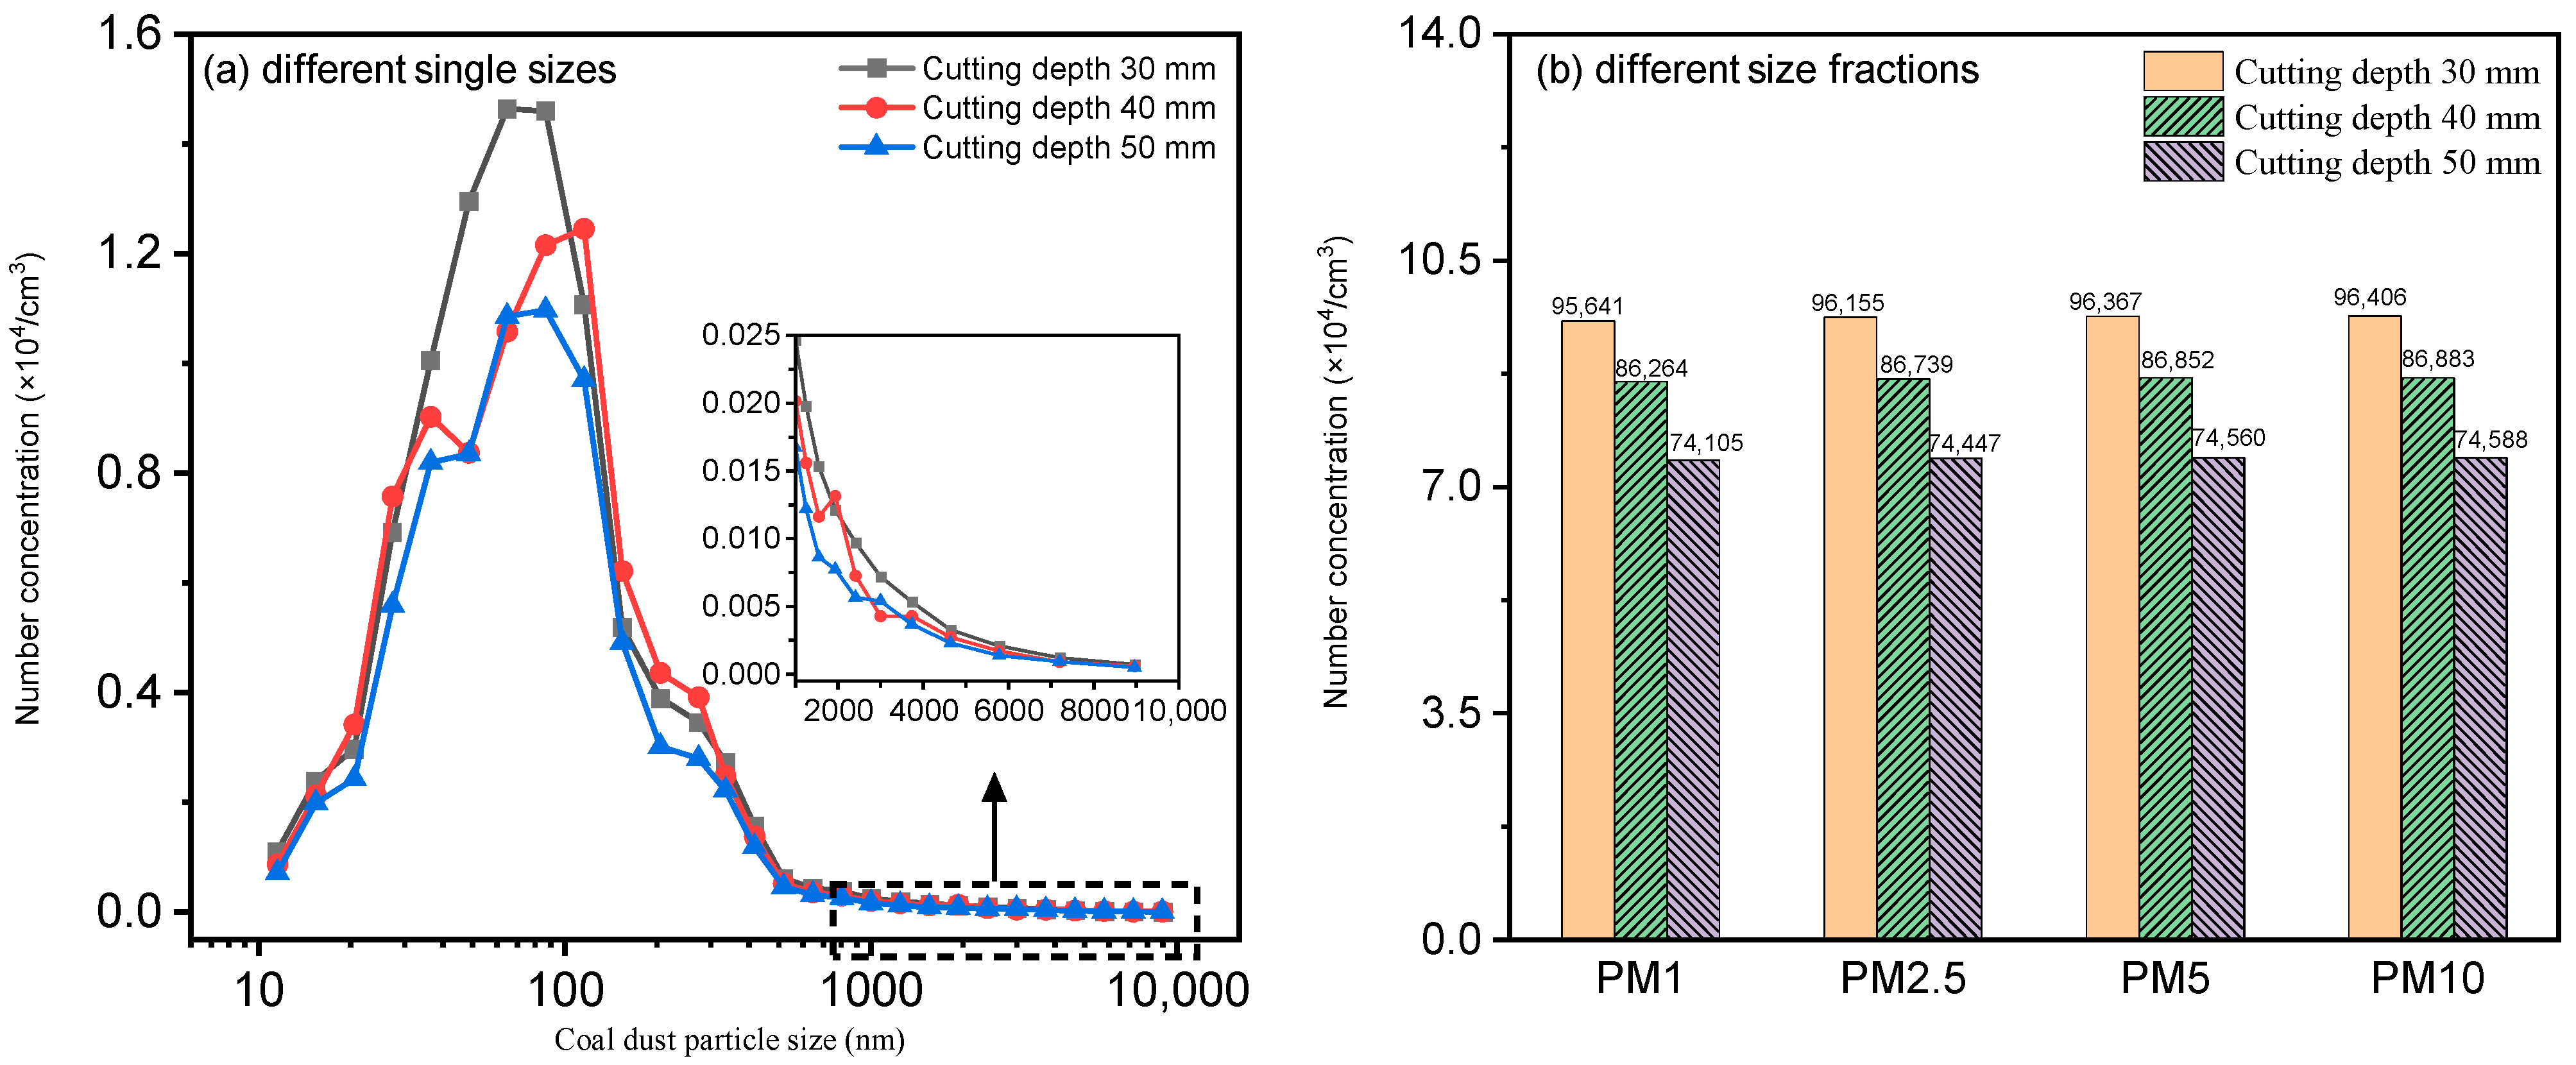
From Figure 10a, it can be seen that a larger cutting depth can generate a lower number concentration of 10 nm–10 μm coal dust, and the coal dust number concentration showed a single-peak distribution with the peaks located in the coal particle size range of 65–115 nm. Figure 10b also verified that the larger the drum cutting depth, the lower the sub-micron- to micron-sized coal dust number concentration, and as the cutting depth was increased from 30 mm to 50 mm, the number concentrations of PM1, PM2.5, PM5, and PM10 were all reduced by 22.6%.

3.3. Mass and Number Percentages of Coal Dust in Different Particle Size Ranges (PM1/PM2.5, PM1/PM10, and PM2.5/PM10) at Different Cutting Parameters

Figure 11A showed that the relatively stable mass percentages (24.24–26.30% for PM1/PM2.5, 3.99–4.87% for PM1/PM10, and 16.46–18.81% for PM2.5/PM10) across different tooth tip cone angles indicate that the tooth tip cone angle mainly influences the total generation amount of 10 nm–10 μm coal dust (as discussed in Section 3.1.1 and Section 3.2.1) rather than the proportional distribution of particle size fractions [63]. In contrast, the consistently high number percentages (99.31–99.41% for N-PM1/N-PM2.5, 99.12–99.21% for N-PM1/N-PM10, and 99.80–99.83% for N-PM2.5/N-PM10) confirm that nano-to-submicron-sized coal dust (10 nm–1 μm) dominates the total particle count in the 10 nm–10 μm range. This is because a larger tooth tip cone angle increases the contact area between the cutting tooth and coal (Section 4.1.1), enhancing crushing intensity but maintaining a consistent size ratio distribution.
Figure 11B showed that the slight increase in PM1/PM2.5 mass percentage (from 24.24% to 26.73%) with increasing mounting angle (45–90°) suggests that a larger mounting angle weakens the crushing intensity of the cutting tooth on coal (by reducing contact length, Section 4.1.2). This inhibition affects larger particles (2.5 nm–10 μm) more significantly than smaller ones (10 nm–1 μm), thus slightly raising the proportion of PM1 in PM2.5. Meanwhile, the number percentages (all above 99.7%) remain high, indicating the mounting angle does not alter the dominance of nano- to submicron-sized coal dust in particle count.
Figure 11C showed that the decrease in PM1/PM2.5 mass percentage (from 24.24% to 19.35%) with increasing rotary speed (40–130 r/min) occurs because higher speeds enhance friction and secondary crushing (Section 4.1.3), promoting the generation of larger particles (2.5 nm–10 μm) and reducing the proportion of smaller particles (10 nm–1 μm) in mass distribution. However, number percentages (still over 98.98%) remain high, demonstrating that nano- to submicron-sized coal dust is still the main component in particle count even at high speeds.
Figure 11D showed that the minor variations in mass percentages (22.82–24.89% for PM1/PM2.5, 3.99–4.38% for PM1/PM10, and 16.46–18.26% for PM2.5/PM10) with increasing cutting depth (30–50 mm) imply that a larger cutting depth reduces total dust generation (by increasing chip section and decreasing crushing degree, Section 4.1.4) without changing the proportional relationship between particle size fractions. The sustained high number percentages (above 99.21%) further verify that cutting depth has no significant impact on the number-based size distribution of 10 nm–10 μm coal dust.

3.4. Mass and Number Concentration Distributions of 10 nm–10 μm Coal Dust When Cutting Different Rank Coals

3.4.1. Mass Concentration Distribution of 10 nm–10 μm Coal Dust When Cutting Different Rank Coals

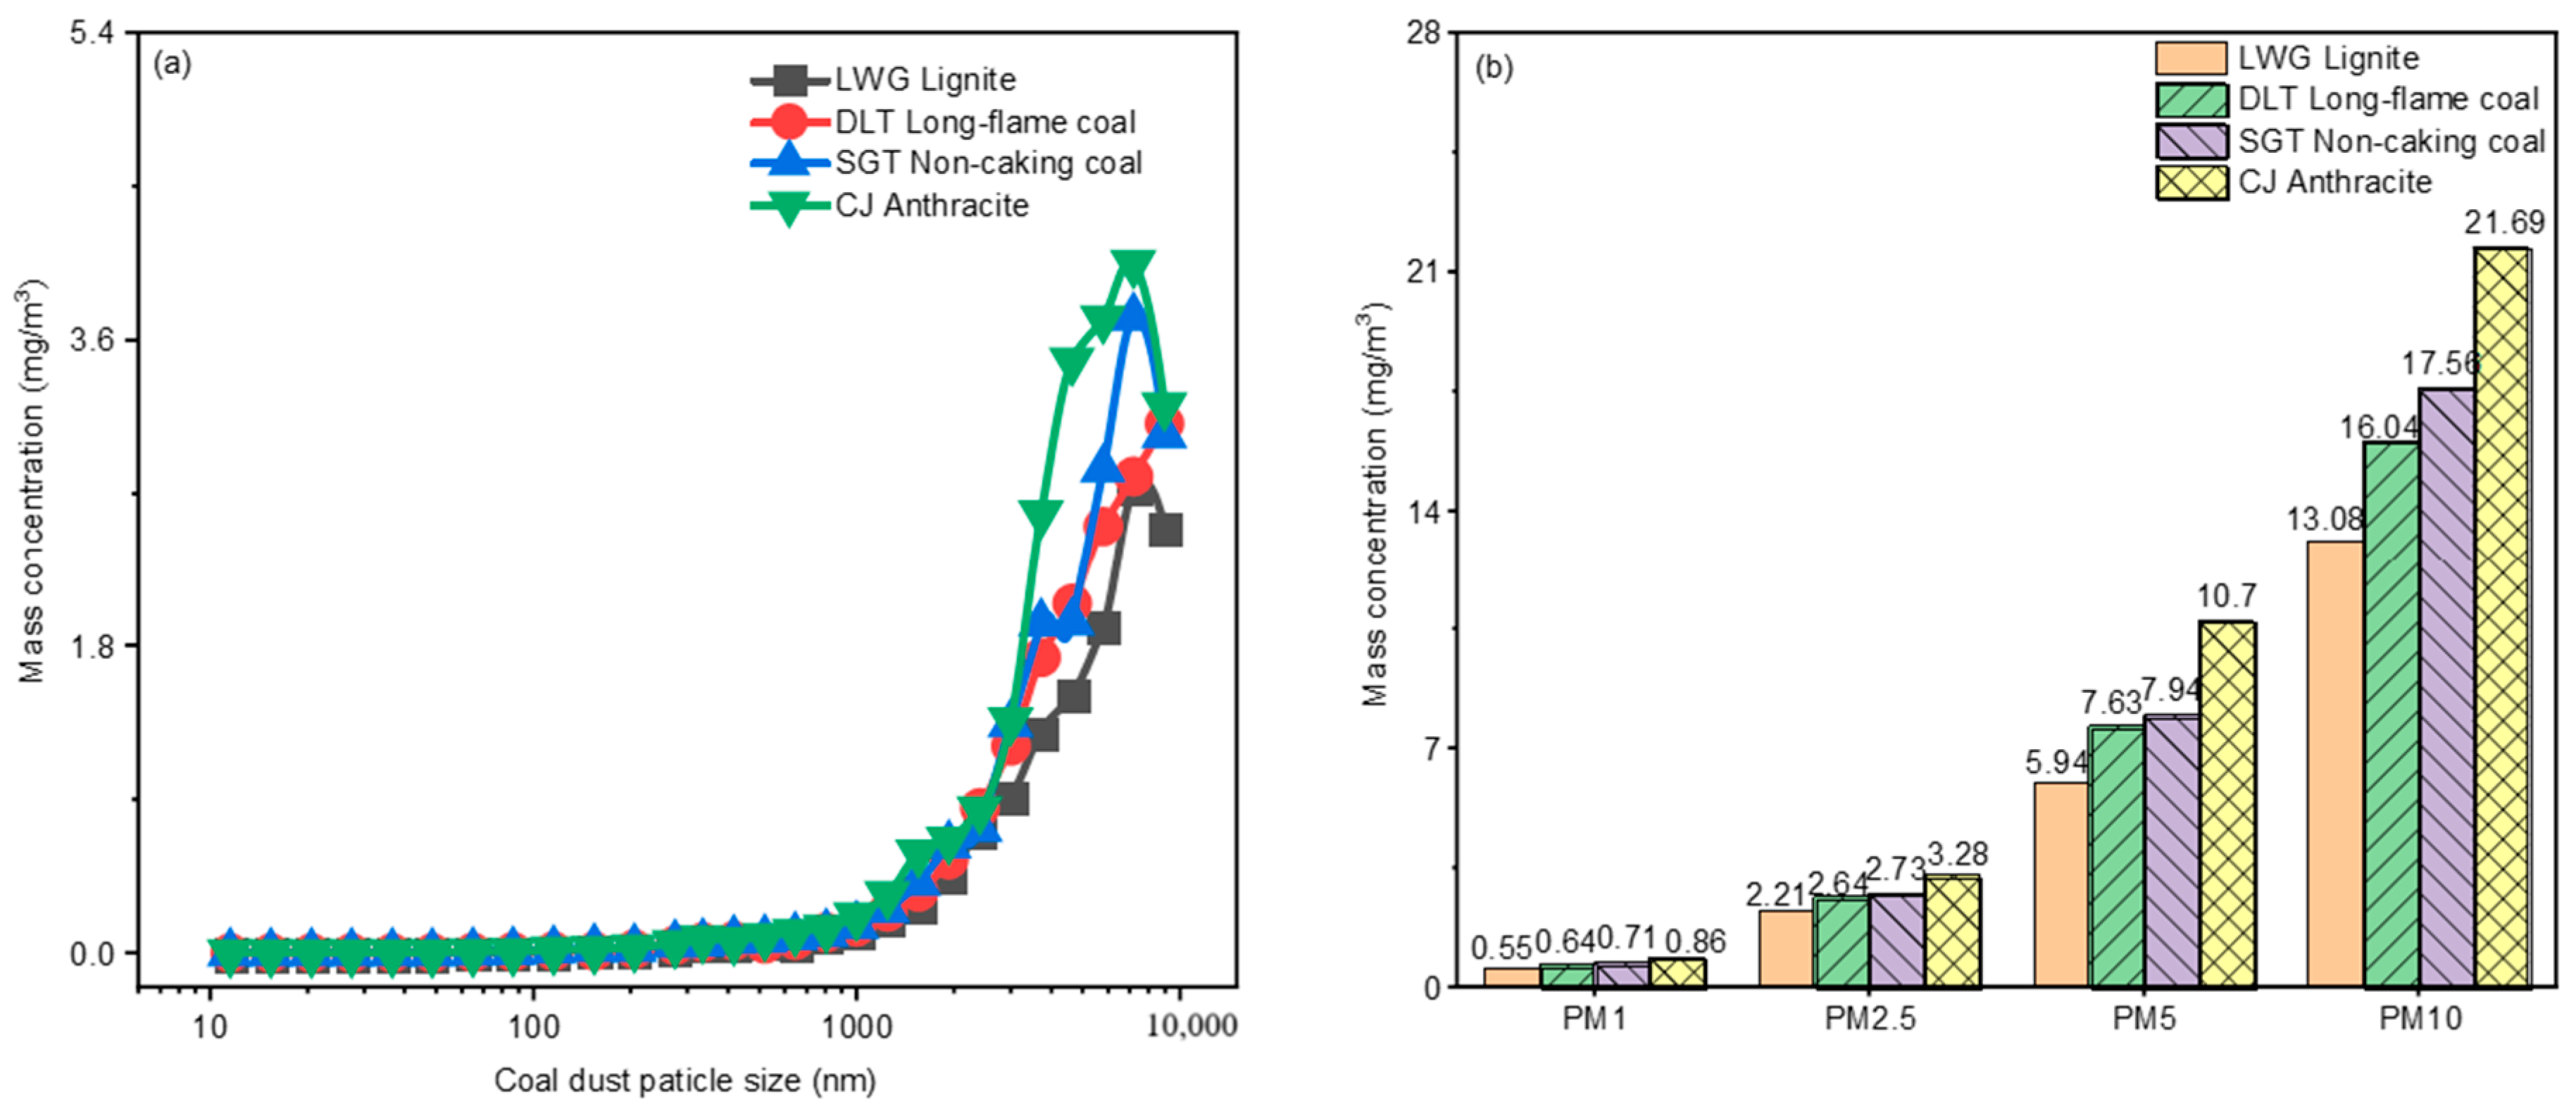
As can be seen from Figure 12a, the mass concentration of 10 nm–10 μm coal dust generated by cutting CJ anthracite was the highest, followed by SGT non-caking coal and DLT long-flame coal, and LWG lignite was the lowest. It was also found that with the increase in particle size, the mass concentrations of coal dust generated by the four different rank coals all increased. As shown in Figure 12b, the mass concentrations of PM1, PM2.5, PM5, and PM10 of CJ anthracite were 1.56, 1.48, 1.80, and 1.66 times those of LWG lignite, respectively.

3.4.2. Number Concentration Distribution of 10 nm–10 μm Coal Dust When Cutting Different Rank Coals

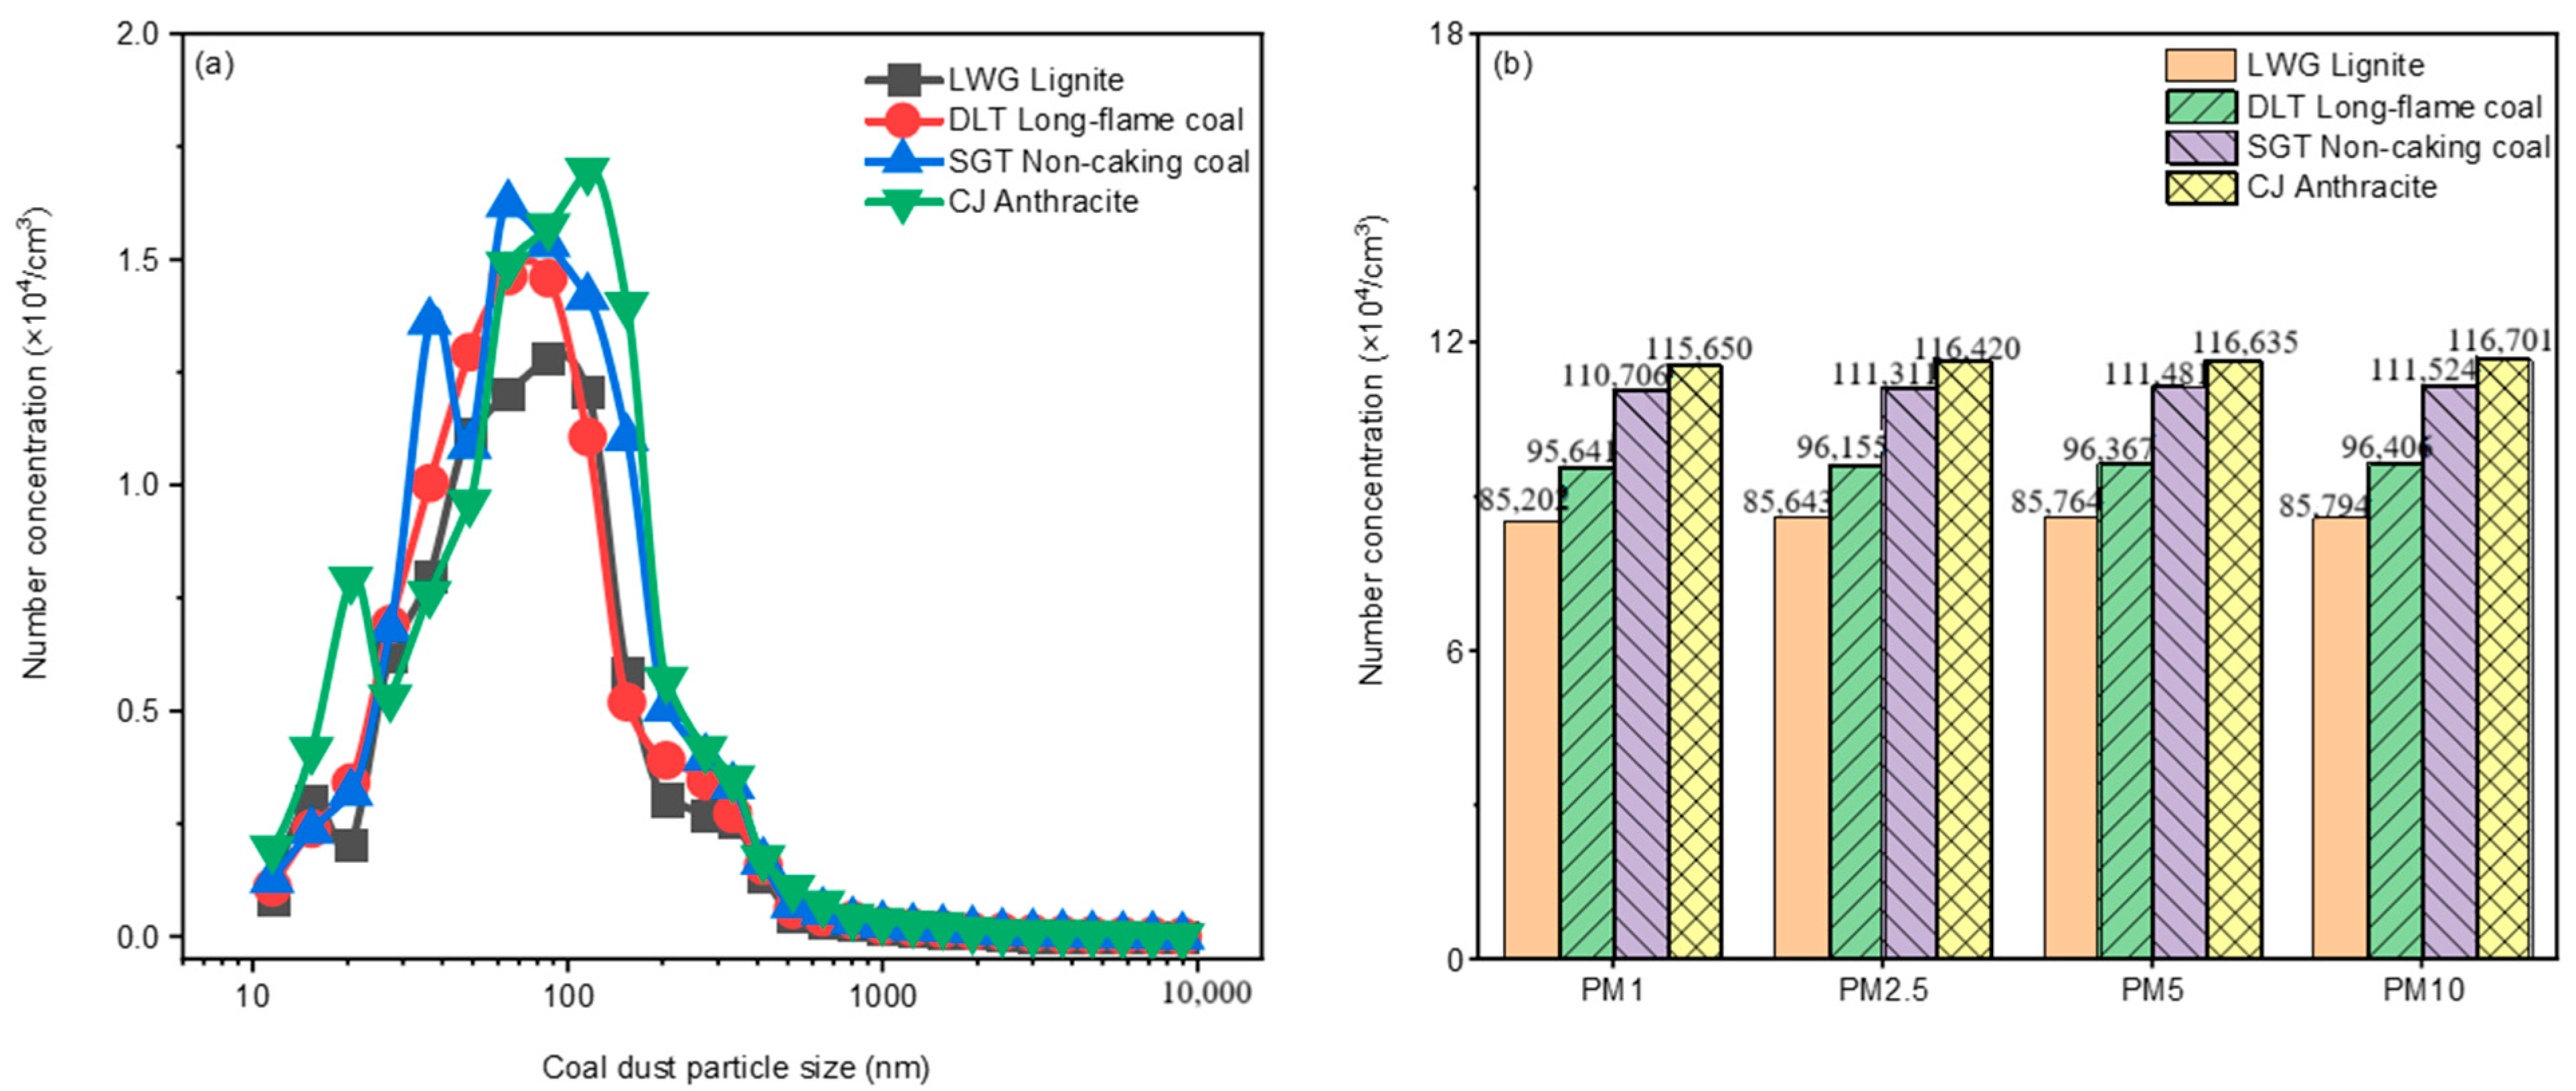
Figure 13a showed that when cutting the four different rank coals, the number concentrations of 10 nm–10 μm coal dust all presented an overall single-peak distribution, and the peaks were located in the coal particle size range of 65–115 nm. Figure 13b revealed that the number concentration of coal dust generated by CJ anthracite was generally the highest, and the number concentrations of PM1, PM2.5, PM5, and PM10 of CJ anthracite were all 1.36 times those of LWG lignite.

3.4.3. Mass and Number Percentages of PM1/PM10, PM1/PM2.5, and PM2.5/PM10 When Cutting Different Rank Coals

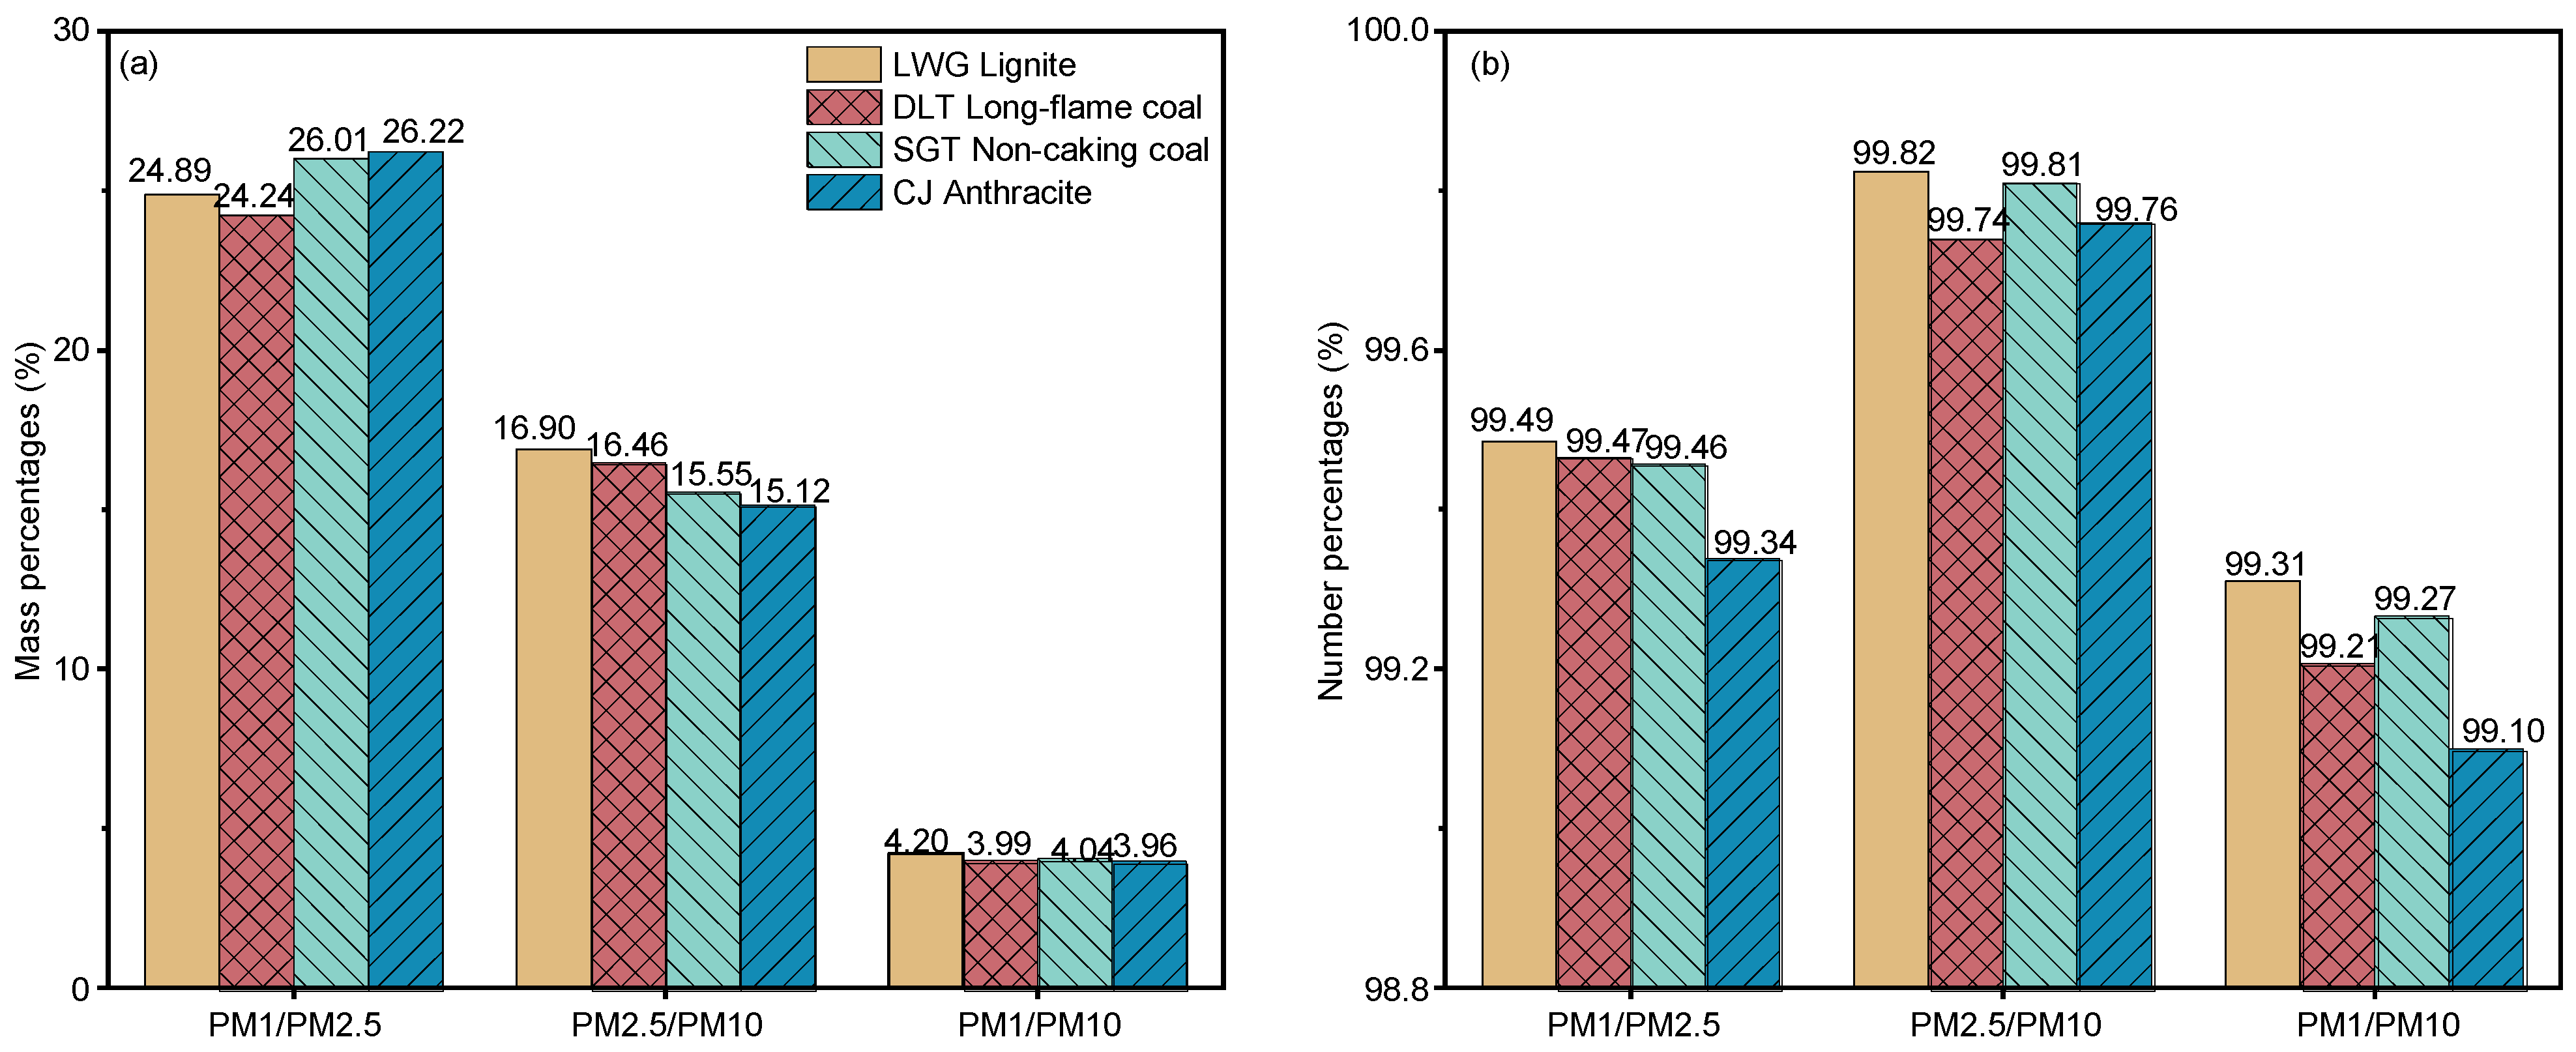
Figure 14a showed that the mass percentages of PM1/PM10, PM1/PM2.5, and PM2.5/PM10 when cutting the four different rank coals were 3.96–4.2%, 24.24–26.22%, and 15.12–16.9%, respectively.
Figure 14b presented that the number percentages of N-PM1/N-PM10, N-PM1/PM2.5, and N-PM2.5/N-PM10 when cutting the four different rank coals were 99.10–99.31%, 99.34–99.49%, and 99.74–99.82%, respectively.

3.5. Physicochemical Properties of PM10 Coal Dust Generated by Cutting Different Rank Coals

3.5.1. Free SiO2 Percentage of PM10 Coal Dust Generated by Cutting the Four Different Rank Coals

With reference to the China national standard GBZ/T 192.4-2007 “Measurement of Airborne Dust in Workplaces Part 4: Free Silicon Dioxide Content” [64], the free SiO2 percentages of PM10 coal dust generated by cutting different rank coals were measured using the pyrophosphate mass method. It was found that the coal dust generated by cutting CJ anthracite presented the highest free SiO2 percentage of 3.54% (with the parent ash content of the raw coal sample being 10.89%), followed by LWG lignite and SGT non-caking coal with 2.46% (parent ash content of the raw coal sample: 13.49%) and 1.89% (parent ash content of the raw coal sample: 7.55%), respectively, and DLT long-flame coal showed the lowest free SiO2 percentage of 1.39% (parent ash content of the raw coal sample: 14.12%).

3.5.2. Microscopic Morphology of PM10 Coal Dust Generated by Cutting the Four Different Rank Coals

According to the China national standard GB/T 39251-2020 “Additive manufacturing—Methods to characterize performance of metal powders” [65] and the industry standard YS/T 1297 “Measuring method for sphericity radio of titanium and titanium alloy powers” [66], the SEM together with the image analysis software ImageJ (J2 version) were adopted to analyze the microscopic morphology and measure the sphericity of the PM10 coal dust generated by cutting the four different rank coals.
The results showed that the highest sphericity of the coal dust was 0.83 for DLT long-flame coal, followed by SGT non-caking coal and LWG lignite with 0.81 and 0.76, respectively, and the lowest sphericity was 0.72 for CJ anthracite.
As presented in Figure 15, there are obvious differences between the shapes and sizes of the four ranks of coal dust particles, with LWG lignite, DLT long-flame coal, and SGT non-caking coal having spherical structures of different sizes, while CJ anthracite has an irregular flaker structure. In addition, the pore structure and roughness of the surface of different rank coal dust particles were significantly different—with the surface of LWG lignite coal dust particles being relatively rougher and having visible larger pores, which further reflects that the pore structure characteristics of coal dust change with coal rank.

3.5.3. Contact Angle of PM10 Coal Dust Generated by Cutting the Four Different Rank Coals

According to the China national standard GB/T 30447-2013 “Measurement method for contact angle of nano-film surface” [67], the contact angles of the PM10 coal dust generated by cutting the four different rank coals were measured using the DCAM.
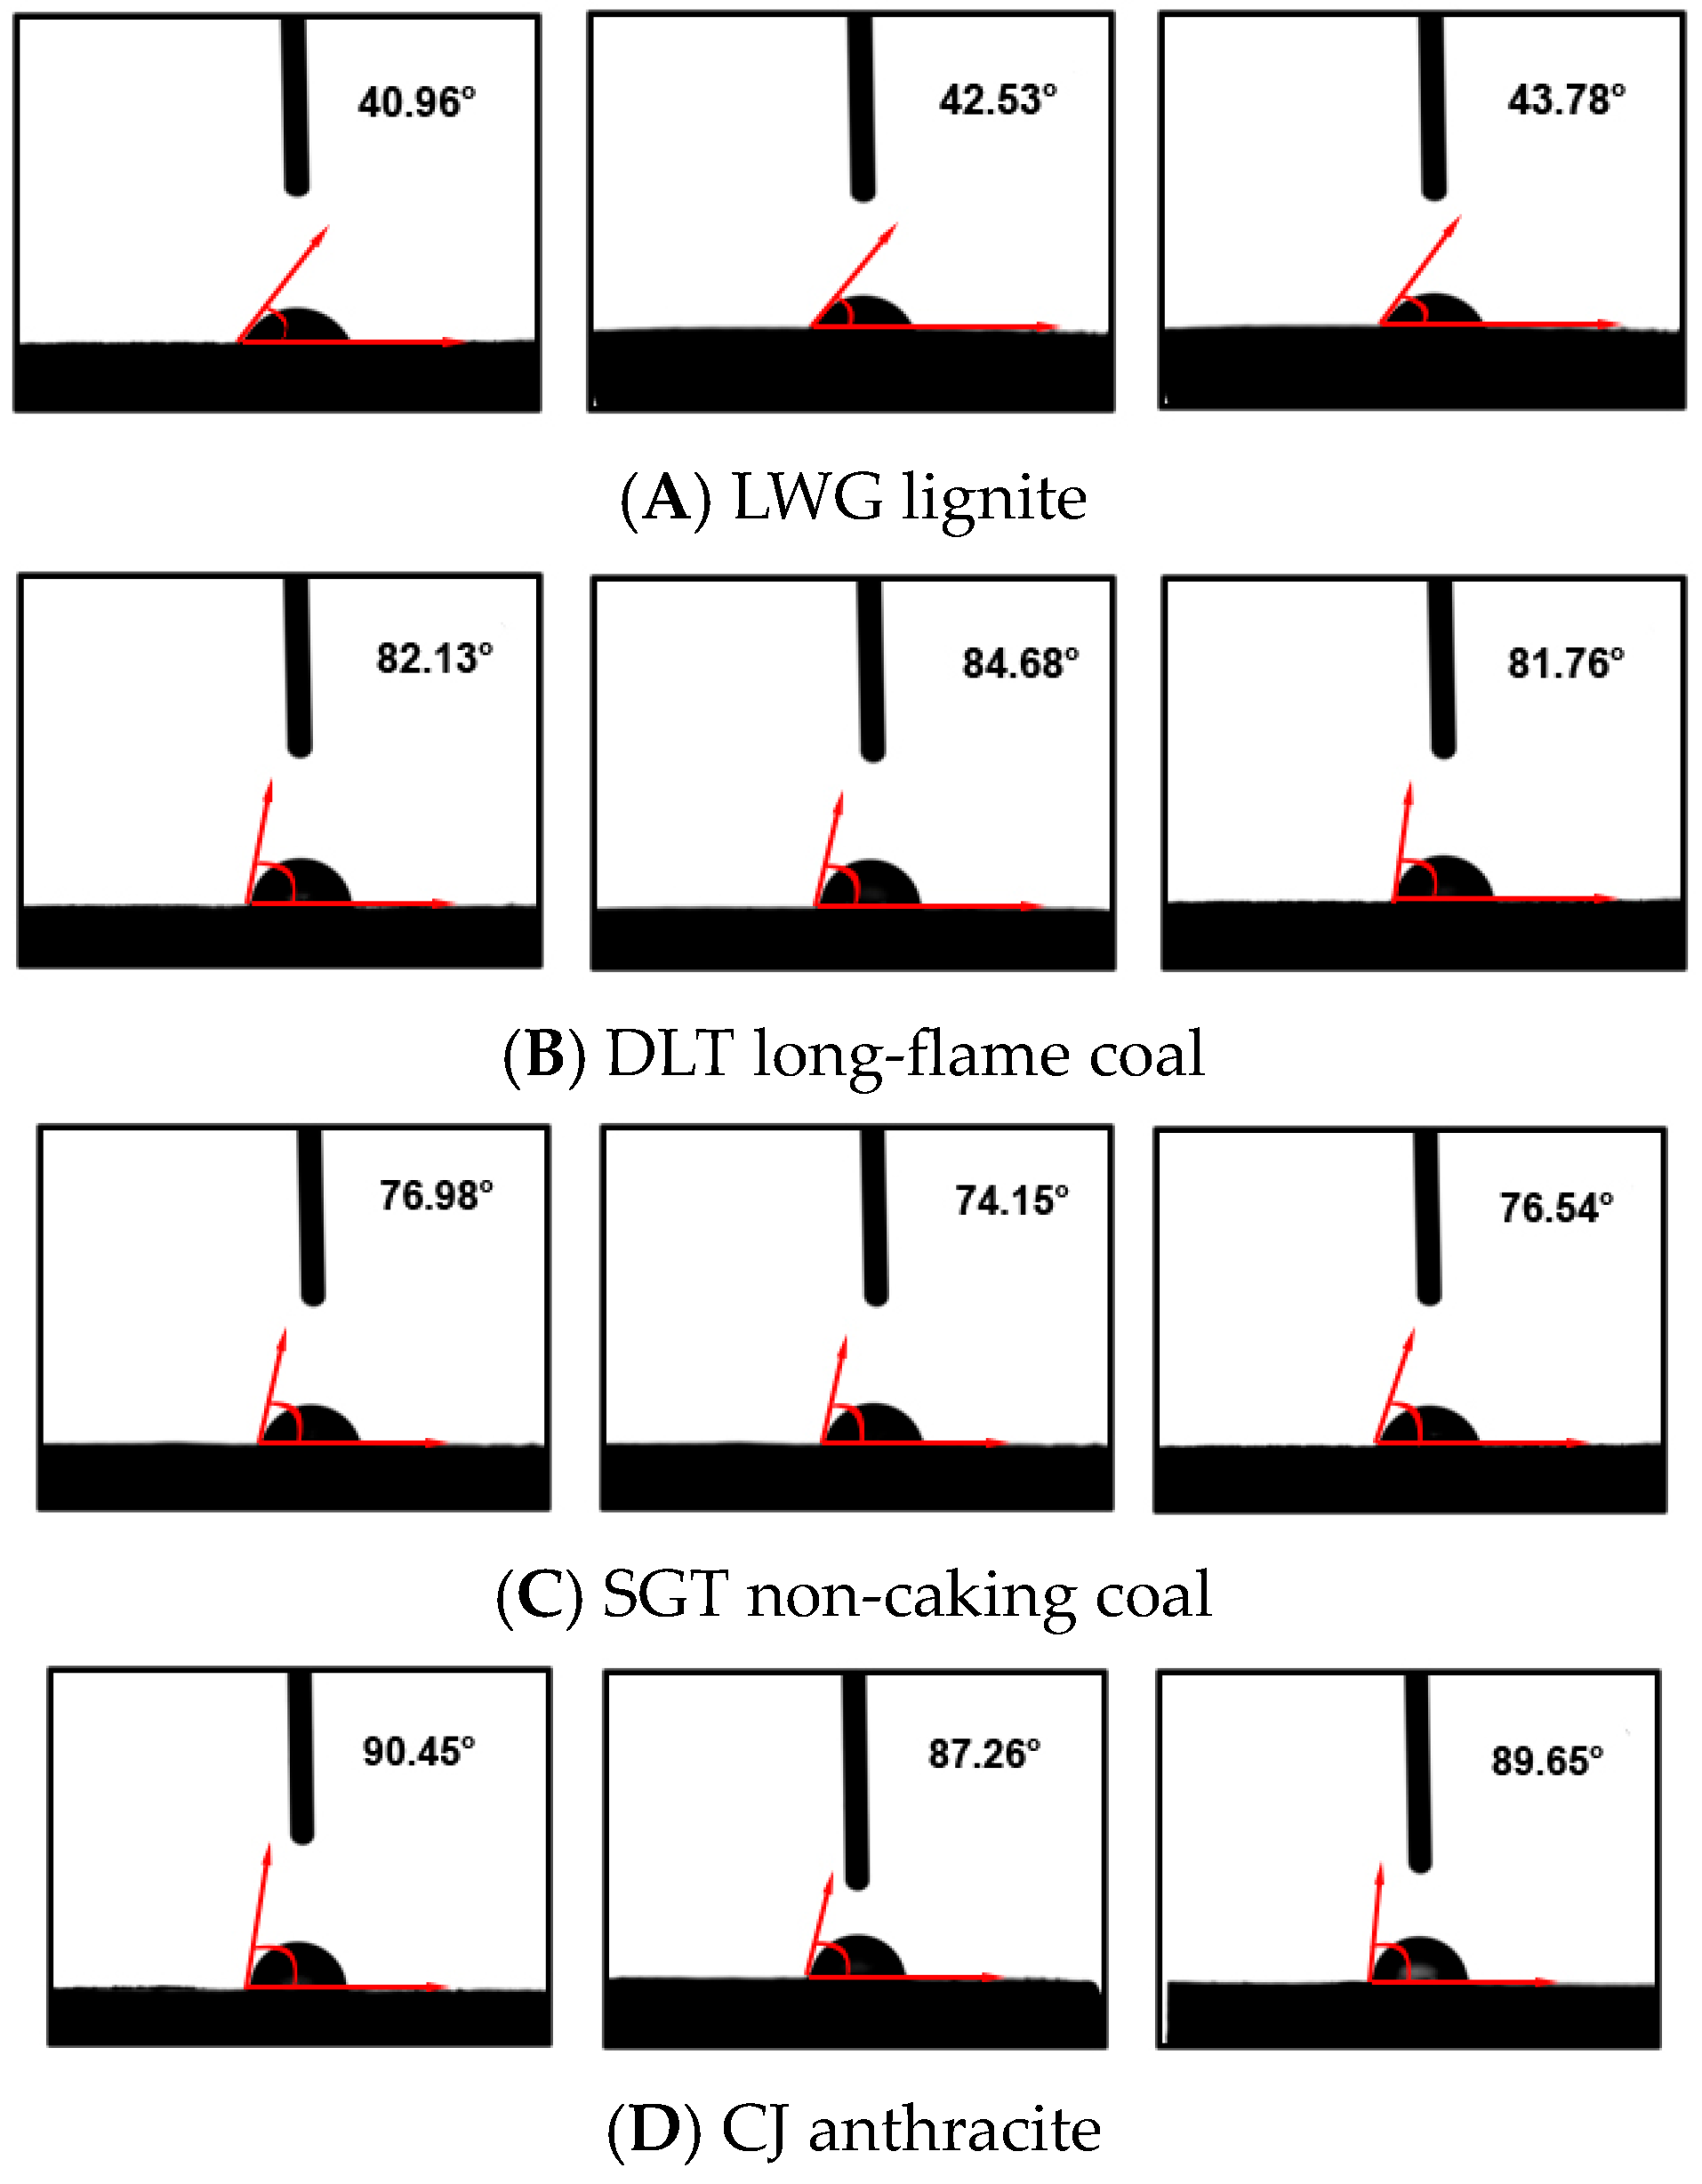
From Figure 16, it can be found that there was a significant difference in the contact angle of the four different ranks of coal dust. Among them, the contact angle of LWG lignite coal dust was the smallest, with an average value of 42.42°, showing the strongest hydrophilicity. The CJ anthracite coal dust presented the largest contact angle, with an average value of 89.12°, showing the poorest hydrophilicity. The average contact angles of DLT long-flame coal and SGT non-caking coal dust were 82.85° and 75.89°, respectively.

3.5.4. FTIR Spectra of PM10 Coal Dust Generated by Cutting the Four Different Rank Coals

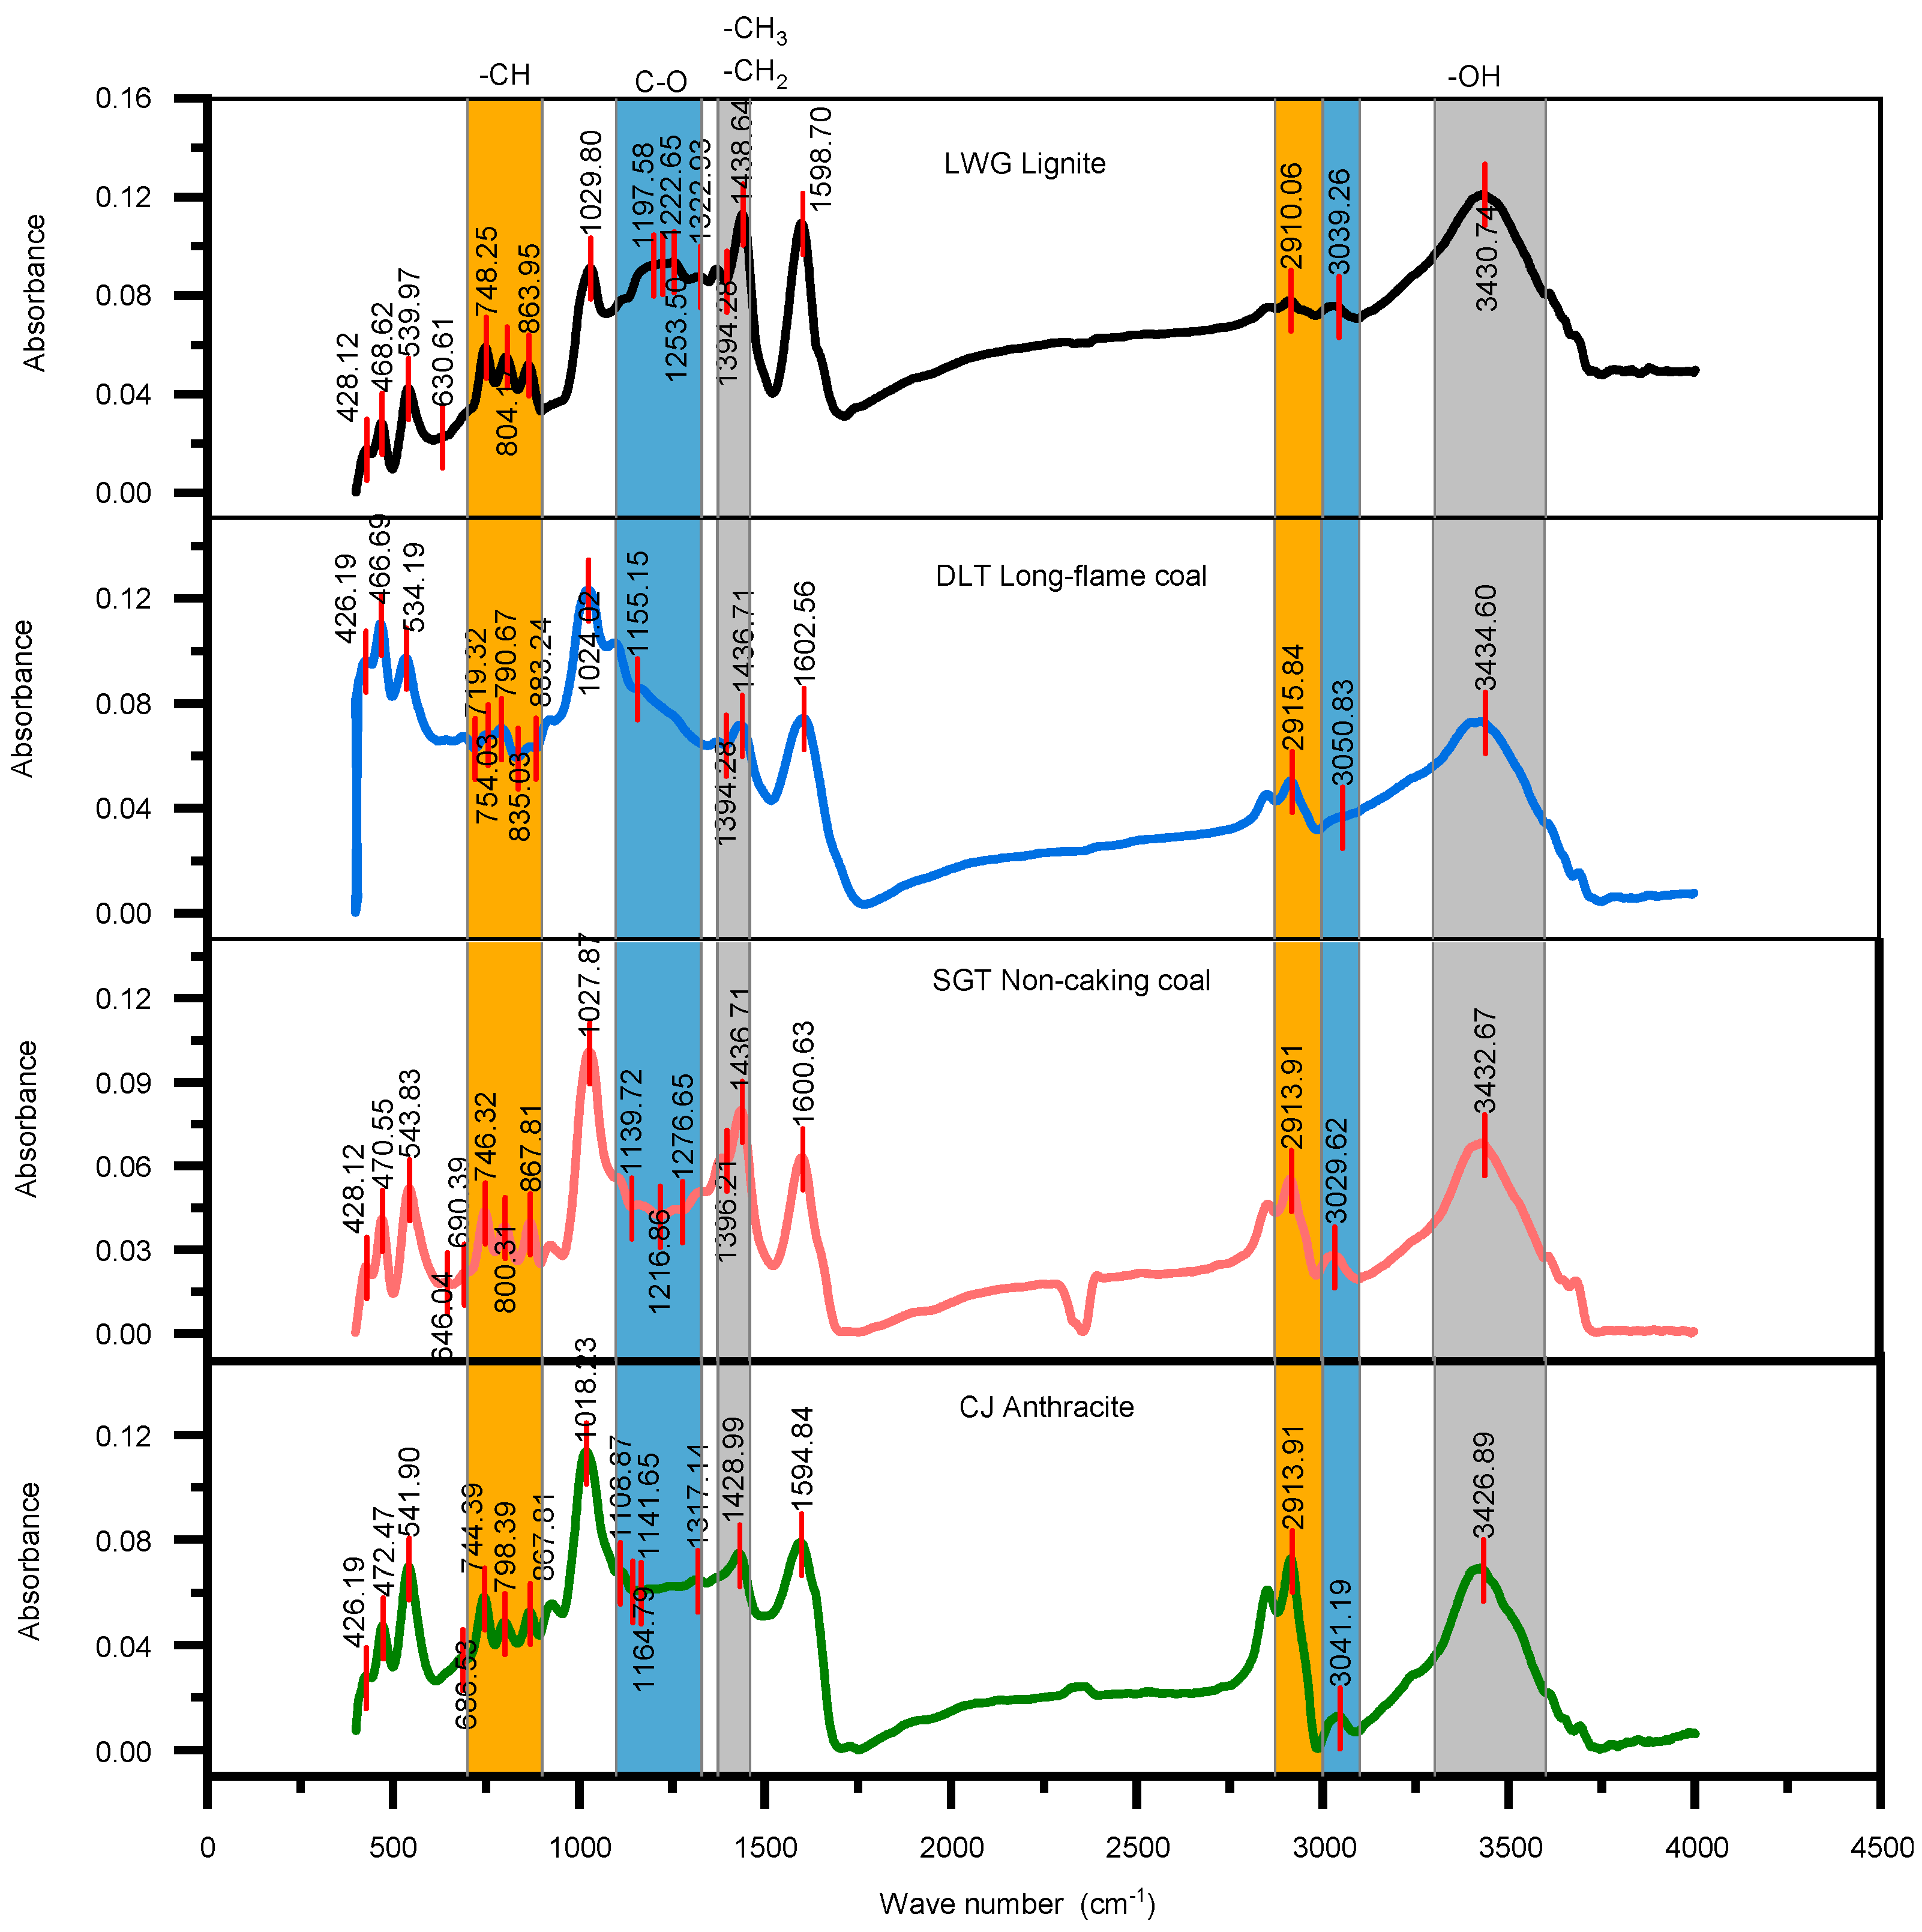
According to the China national standard GB/T 6040-2019 “General rules for infrared analysis” [68], FTIR spectra of PM10 coal dust generated by cutting the four different ranks of coal were analyzed using the TENSOR 27 infrared spectrometer, as presented in Figure 17.
The absorption peaks in the wave number range of 1330–1100 cm−1 are generated by the C-O stretching vibration in alcohols, phenols, ethers, and esters. Figure 17 showed that in the range of 1330–1100 cm−1, the area and intensity of the characteristic peaks of LWG lignite were relatively larger, while the area and intensity of the characteristic peaks of CJ anthracite were relatively smaller, indicating that there was an inverse relationship between the oxygen-containing functional groups in the coal dust and the coal ranks.
The functional groups corresponding to the characteristic peaks at the wave number range of 1460–1373 cm−1 were mainly methyl (-CH3) and methylene (-CH2). From Figure 17, it can be seen that LWG lignite coal dust showed obvious characteristic peaks at 1460–1373 cm−1, and the area and intensity of the characteristic peaks decreased with the increase in coal rank.
The absorption peaks in the wave number range of 1605–1595 cm−1 are generated by the C=C stretching vibration in the aromatic ring. From Figure 17, it was found that all four ranks of coal dust particles presented absorption peaks in the range of 1605–1595 cm−1 and the intensity of the absorption peaks was generally large.
The absorption peaks at the wave number range of 2999–2872 cm−1 are the characteristic peaks of cycloalkanes or aliphatic hydrocarbons. As can be seen in Figure 17, the characteristic peak at 2999–2872 cm−1 of LWG lignite was not obvious, while the DLT long-flame coal, SGT non-caking coal, and CJ anthracite all showed obvious characteristic peaks at 2999–2872 cm−1, and the intensity of the characteristic peaks kept increasing with the increase in the coal ranks.
The absorption peaks at the wave number range of 3100–3000 cm−1 are the characteristic peaks of aromatics, and it can be seen from Figure 17 that the characteristic peaks of LWG lignite and DLT long-flame coal at 3100–3000 cm−1 were not obvious, whereas both SGT non-caking coal and CJ anthracite showed obvious characteristic peaks at 3100–3000 cm−1, indicating that with the increase in the coal ranks, the intensity of the aromatic characteristic peaks increased.
The functional groups corresponding to the characteristic peaks at the wave number range of 3600–3300 cm−1 are the free hydroxyl group (-OH) and the hydroxyl group (-OH) bonded with hydrogen. From Figure 17, it was found that the intensity of the characteristic peaks at 3600–3300 cm−1 kept decreasing from LWG lignite to CJ anthracite, suggesting that the content of hydroxyl group (-OH) in coal dust was inversely proportional to the coal ranks.

4. Discussion

4.1. Influence of Different Drum Cutting Parameters on the 10 nm–10 μm Coal Dust Generation

4.1.1. Influence of Tooth Tip Cone Angle on 10 nm–10 μm Coal Dust Generation

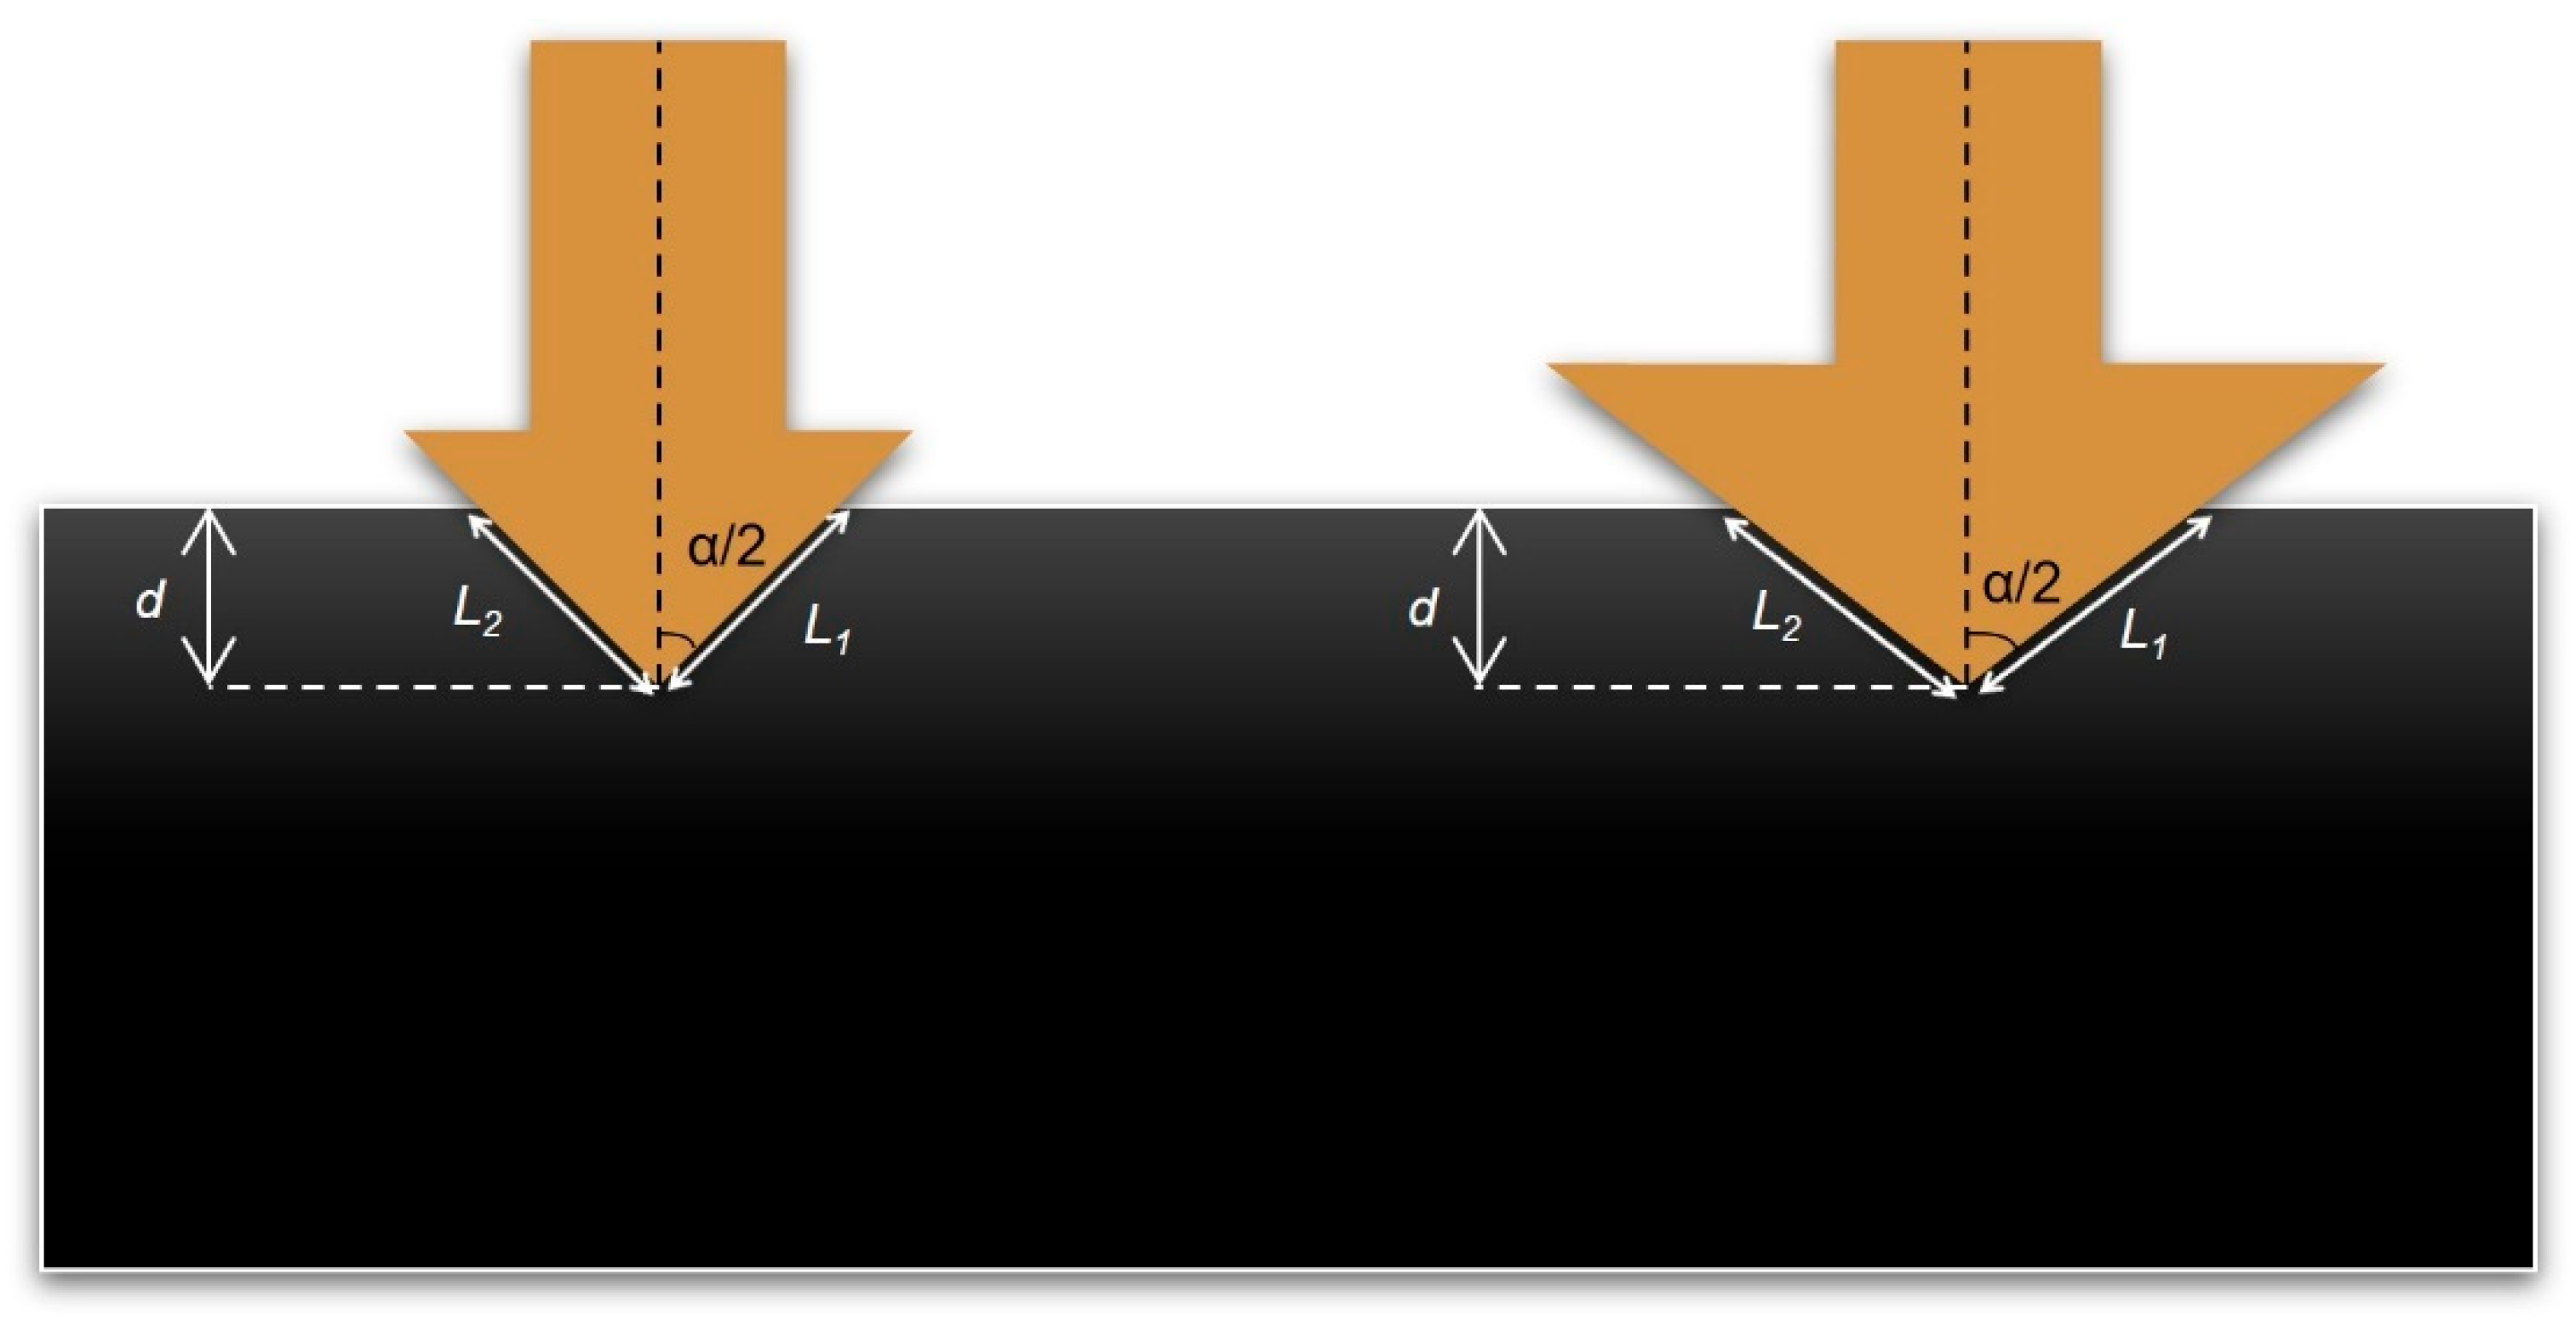
A larger tooth tip cone angle can generate higher mass and number concentrations of 10 nm–10 μm coal dust, and the reasons are analyzed as follows: in the dust generation process by coal cutting, most of the energy is consumed in the crushing of coal by the cutting teeth, and the area of the compacted nucleus determines the amount of the coal dust generated. According to the calculation Formula (1) of the cutting force in the process of cutting coal and rock proposed by Evans [69] and the cutting experiments with different tooth tip cone angles performed by Roepke et al. [70], it was concluded that the cutting force of the cutting teeth significantly increases with the increase in the tooth tip cone angle. Furthermore, it can be deduced from Figure 18 and Equation (2) that both the contact length and the contact area between the tooth tip and the coal body significantly increase with the increase in the tooth tip cone angle. In summary, the larger cutting force exerted by the larger tooth tip cone angle will lead to more energy being applied to the coal body by the cutting teeth, and the larger contact area between the larger tooth tip cone angle and the coal body will lead to an increase in the volume of the compaction nucleus, above two aspects will result in more coal dust being generated in the coal cutting process.
F = 16 π σ t 2 d 2 cos 2 ( α / 2 ) σ c
L 1 = L 2 = d cos ( α / 2 )
where F is the cutting force, N; σ t is the tensile strength, MPa; σ c is the compressive strength, MPa; α is the tooth tip cone angle, °; d is the cutting depth, cm; and L1 and L2 represent the contact lengths between the right and left sides of the tooth tip and the coal body (see Figure 18), respectively.

4.1.2. Influence of Mounting Angle on 10 nm–10 μm Coal Dust Generation

Larger mounting angles can effectively inhibit the generation of nano- to micron-sized coal dust. According to the schematic diagram of the coal body intrusion at the mounting angle α (see Figure 19) and Equation (2), the calculation formula for the contact length between the tooth tip and the coal body can be deduced as Formula (3). It can be seen that the larger the mounting angle, the smaller the contact length, which makes the contact area between the cutting teeth and the coal body decrease, leading to a reduction in the cutting force exerted by the teeth on the coal body, and correspondingly lower level of coal dust generation. Through coal and rock-cutting experiments, Park et al. [71] also reported that with the increase in the mounting angle, the contact area between the teeth and the coal body significantly decreased.
L = L 1 + L 2 = [ d cos 40 + d sin 40 tan ( α 40 ) ] + [ d cos 40 d sin 40 tan ( α + 40 ) ]
where L 1 and L 2 represent the contact length between the right and left sides of the tooth tip and the coal body (see Figure 19), respectively, m; and α is the mounting angle of the cutting teeth, °.

4.1.3. Influence of Rotary Speed on 10 nm–10 μm Coal Dust Generation

The reasons why both the number and mass concentrations of 10 nm–10 μm coal dust increase with the increase in rotary speed can be attributed to the following three aspects: (1) the faster the rotary speed of the drum, the more cutting teeth are involved in the process of cutting the coal body per unit of time, which leads to an increase in the amount of coal dust generated; (2) the faster the rotary speed, the stronger the friction and crushing effect of the drum on the coal body, which results in an increase in the amount of coal dust; and (3) at a higher rotary speed, part of the crushed coal pieces are difficult to be removed from the drum in time, which increases the number of collisions between the cutting teeth and the coal pieces, and between the coal pieces themselves, leading to the aggravation of the secondary crushing, resulting in a higher level of coal dust generation. Tan et al. [72] and Bakhtavar et al. [73] also reported that the generation of micron-sized coal dust can be significantly increased when increasing the rotary speed.

4.1.4. Influence of Cutting Depth on 10 nm–10 μm Coal Dust Generation

Both mass and number concentrations of 10 nm–10 μm coal dust decreased with the increase in cutting depth. This phenomenon can be attributed to the fact that with the increase in cutting depth, the chip section increases, while the crushing degree of the coal body decreases, thus the cracks inside the coal body sprout less during the cutting process, resulting in an increase in the production of the lump coal and a decrease in the generation of coal dust. Above explanation was also supported by Li et al. [62] and Liu et al. [74].

4.2. Influence of the Physicochemical Properties of the Cut Coal Body on the Generated 10 nm–10 μm Coal Dust

4.2.1. Relationship Between Moisture Content of the Cut Coal Body and the Generated 10 nm–10 μm Coal Dust

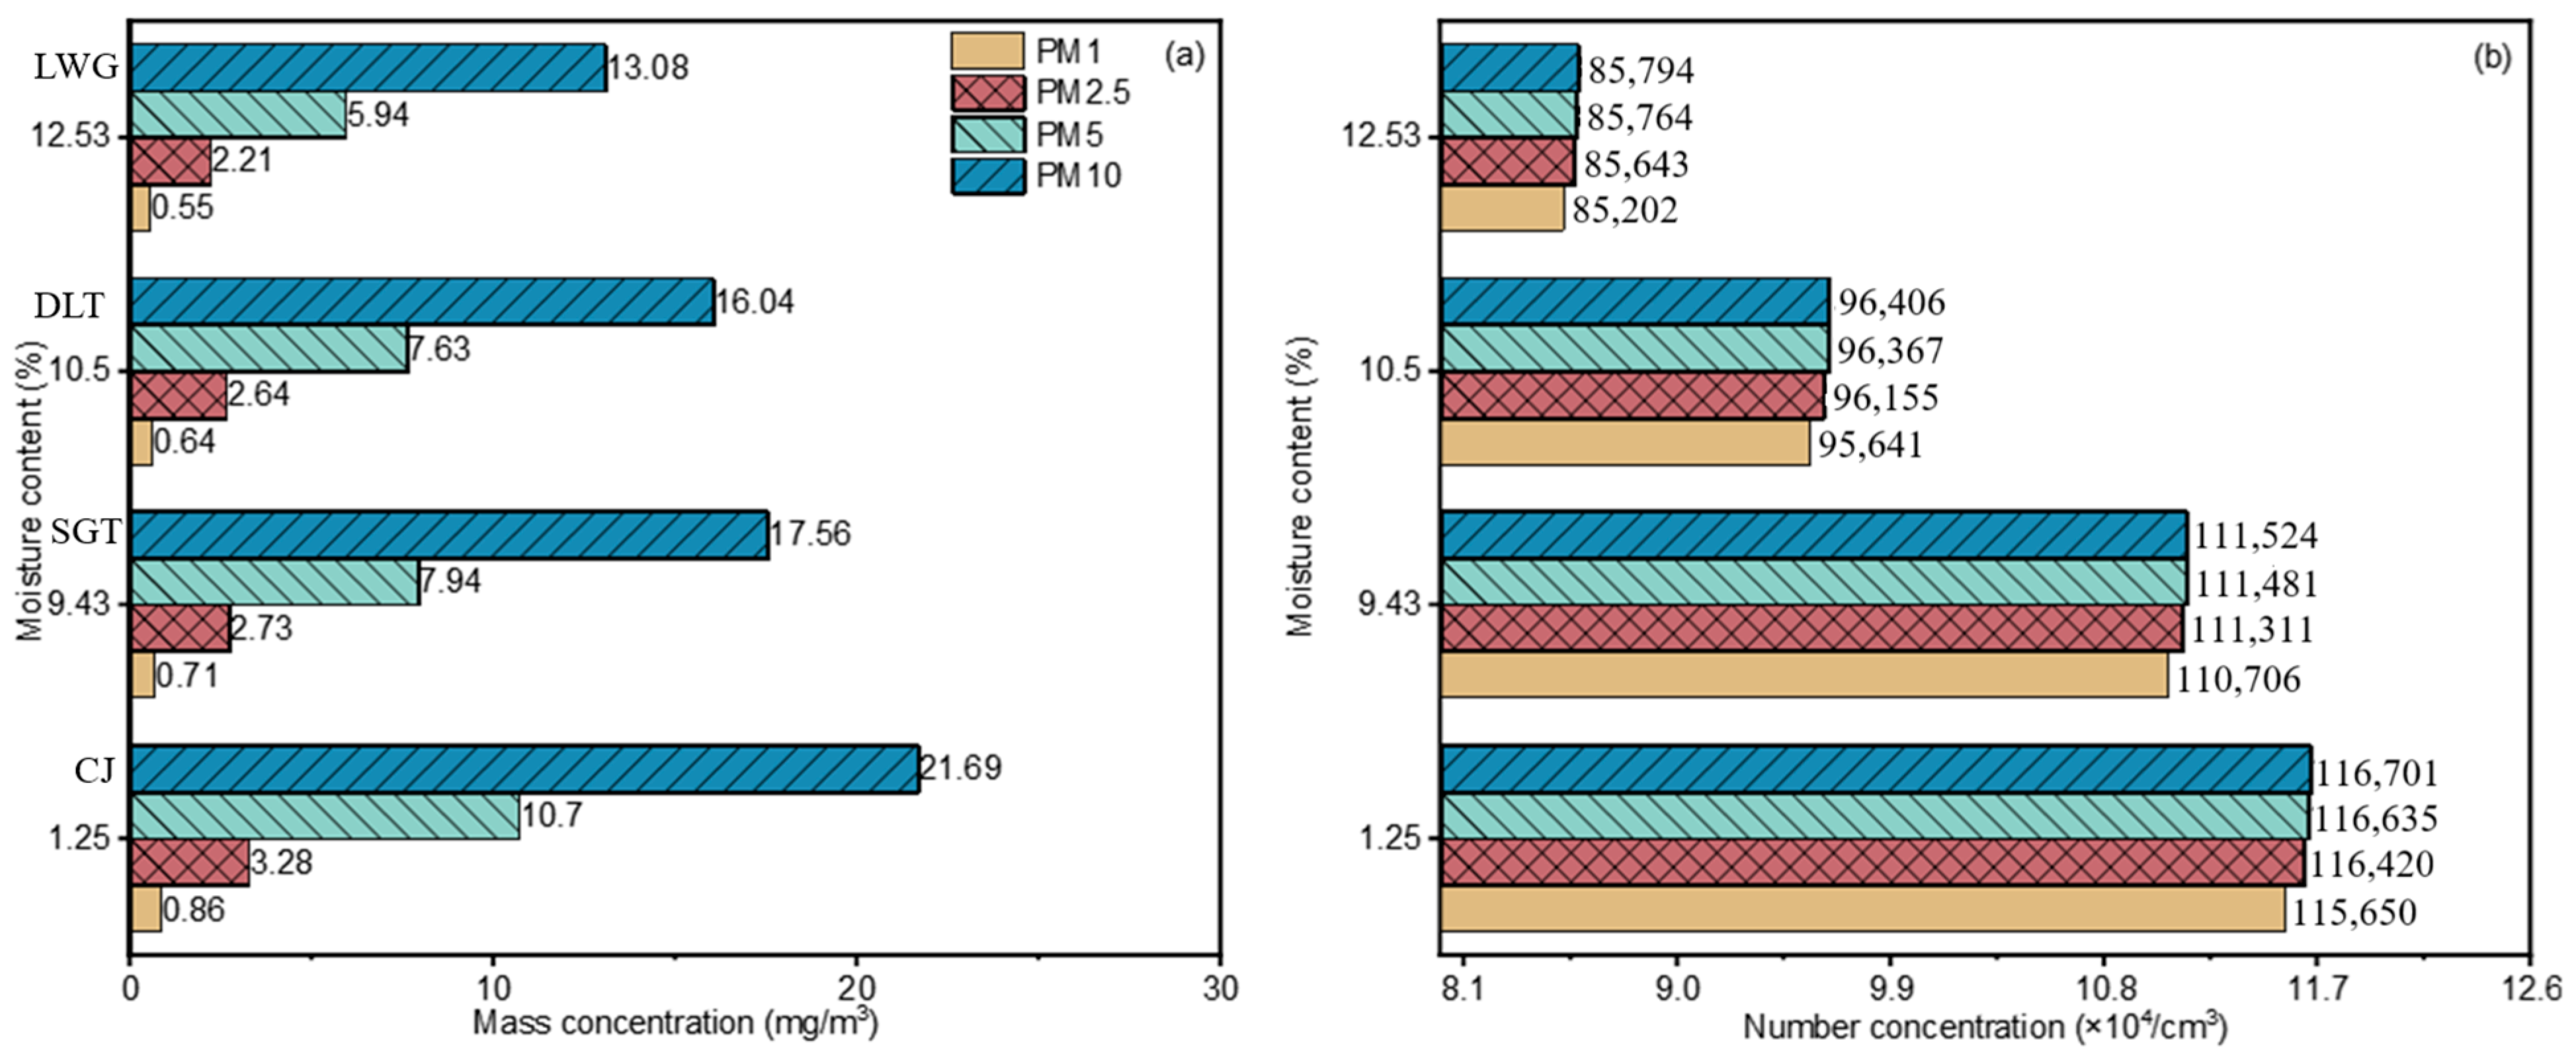
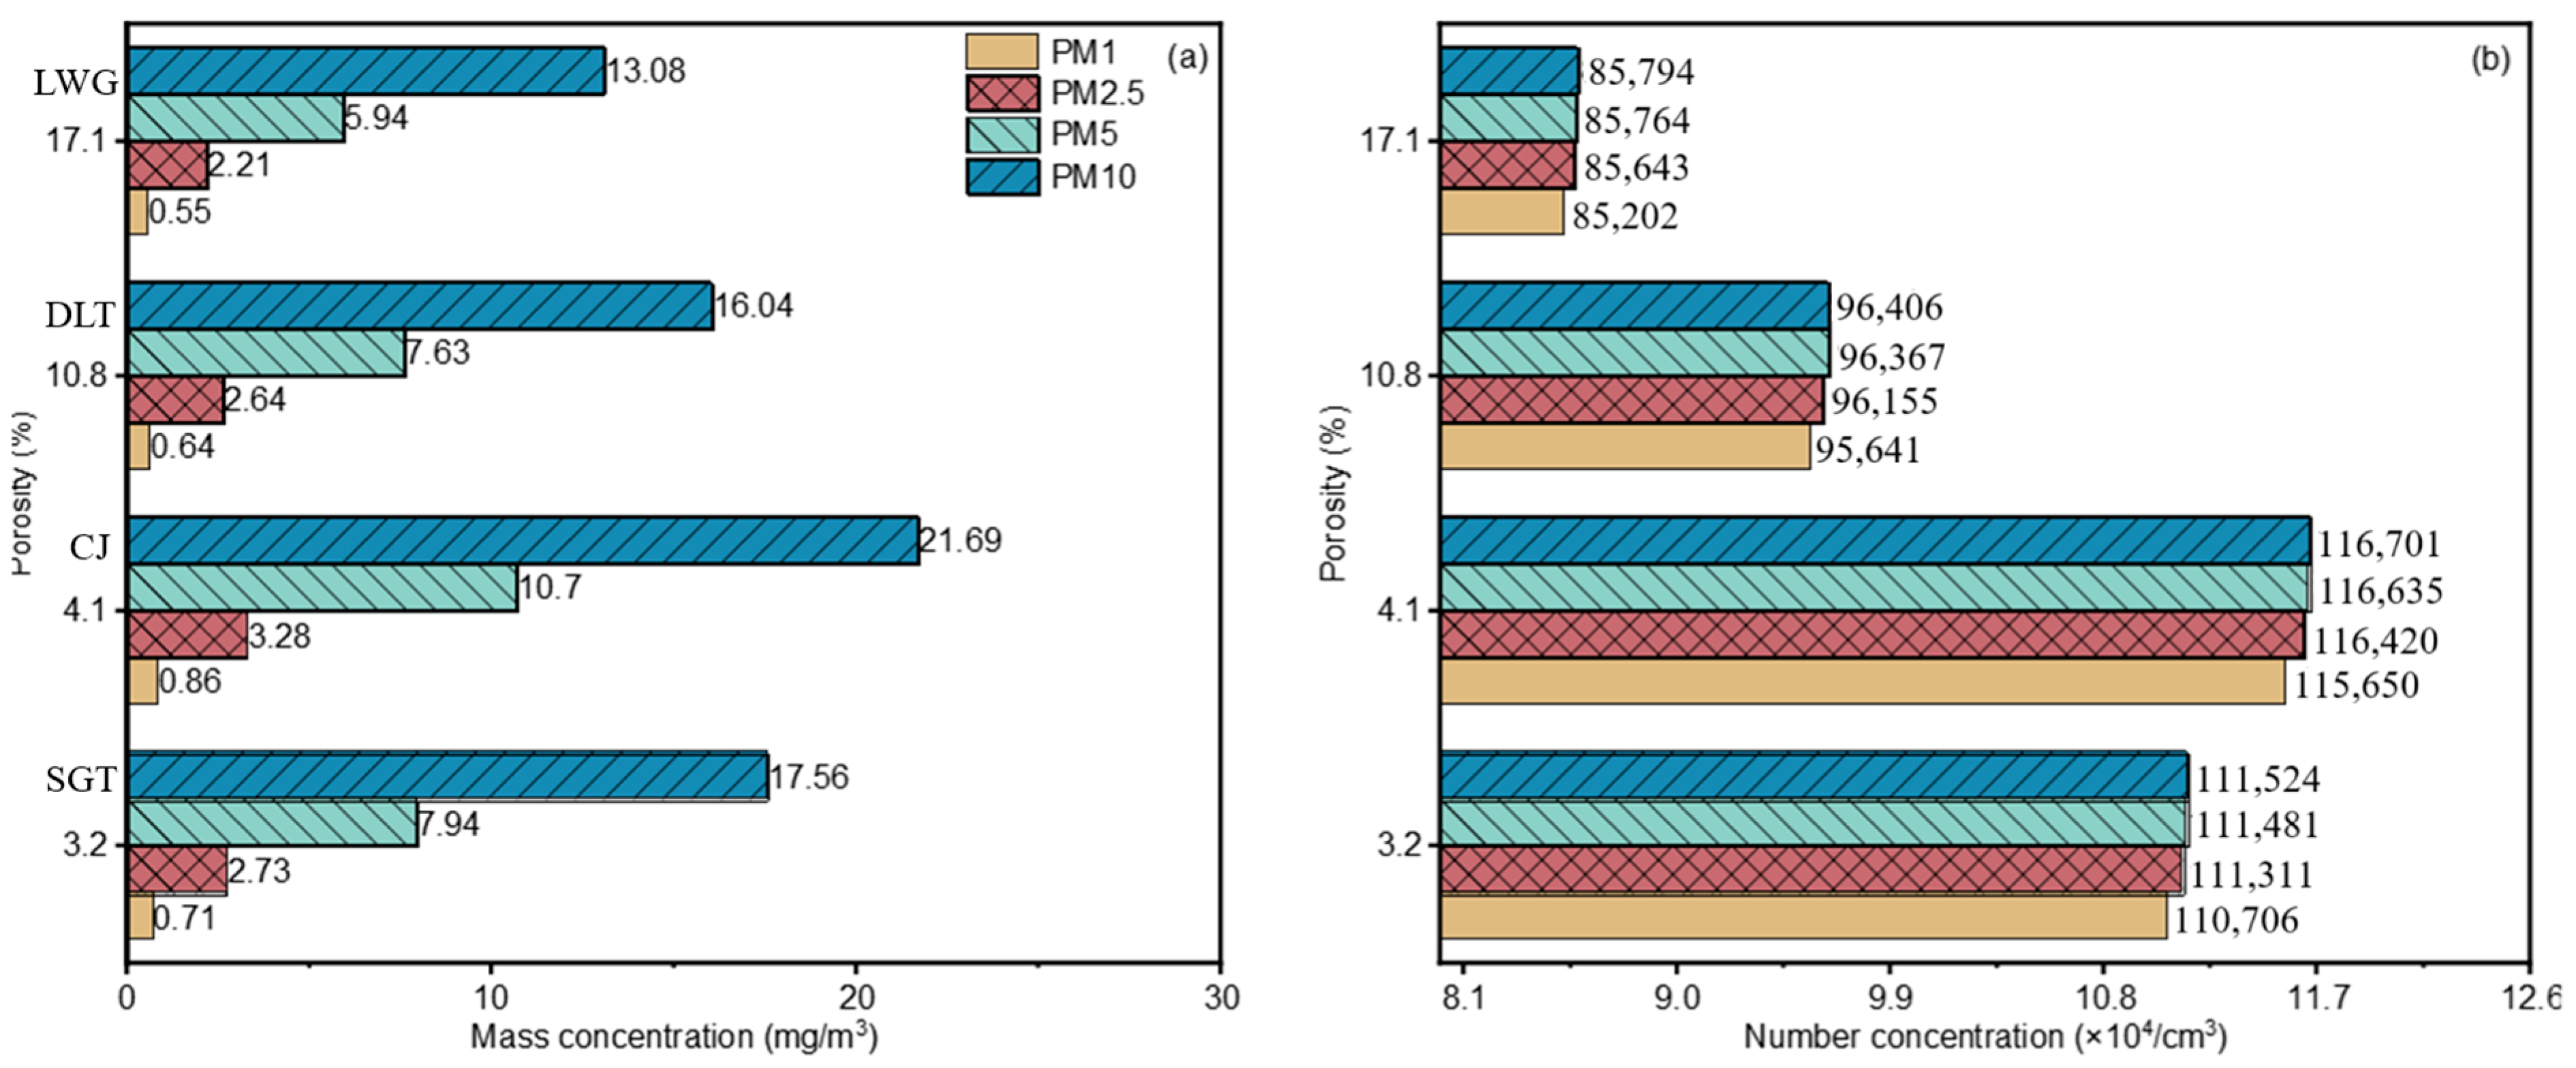
As presented in Figure 20, with the moisture content increasing from 1.54% of CJ anthracite to 12.53% of LWG lignite, the mass concentrations of PM1, PM2.5, PM5, and PM10 were reduced by 56.4%, 48.4%, 80%, and 65.8%, respectively, and the corresponding number concentrations were all reduced by about 36%.
The moisture content mainly inhibits the generation of 10 nm–10 μm coal dust from four aspects: (1) The free water in the coal matrix measured by the proximate analyzer is adsorbed or adhered to the surface or pore space of the coal, so that the primary coal dust is pre-wetted and bonded, leading to a reduction in primary coal dust generated in the process of coal cutting. (2) The free water also has a wetting effect on the coal body; the higher the moisture content, the stronger the wetting and bonding effect of the secondary dust generated from the coal cutting, so that small coal particles can be bonded into large particles and settled, resulting in the reduction of secondary dust. (3) Moisture content can change the physical and mechanical properties of the coal body; water molecules will weaken the coal crystal intergranular connection [75,76,77] and reduce the crystal particle strength and the adhesion between the crystal particles, resulting in a reduction in the strength of the coal body as well as the storage capacity of the applied energy, thus the volume of the compacted nucleus is reduced, and the amount of coal dust generated is lowered down. (4) According to the energy density theory [78]—which posits that the energy dynamics involved in coal particle breakage are closely intertwined with moisture content, whereby higher moisture content enhances the coal’s capacity to absorb energy, consequently suppressing the generation of fine dust—the formation of particles ≤ 10 μm is predicated on the generation of microcracks with a sufficiently high density of lengths ≤ 10 μm, and with the decrease in the storage capacity of the coal body for the externally applied energy, the density of the number of microcracks generated decreases. That is, the coal body with a higher moisture content is more inclined to develop fissures along the primary cracks, thus the amount of generated 10 nm–10 μm coal dust decreases.

4.2.2. Relationship Between Fixed Carbon Content of the Cut Coal Body and the Generated 10 nm–10 μm Coal Dust

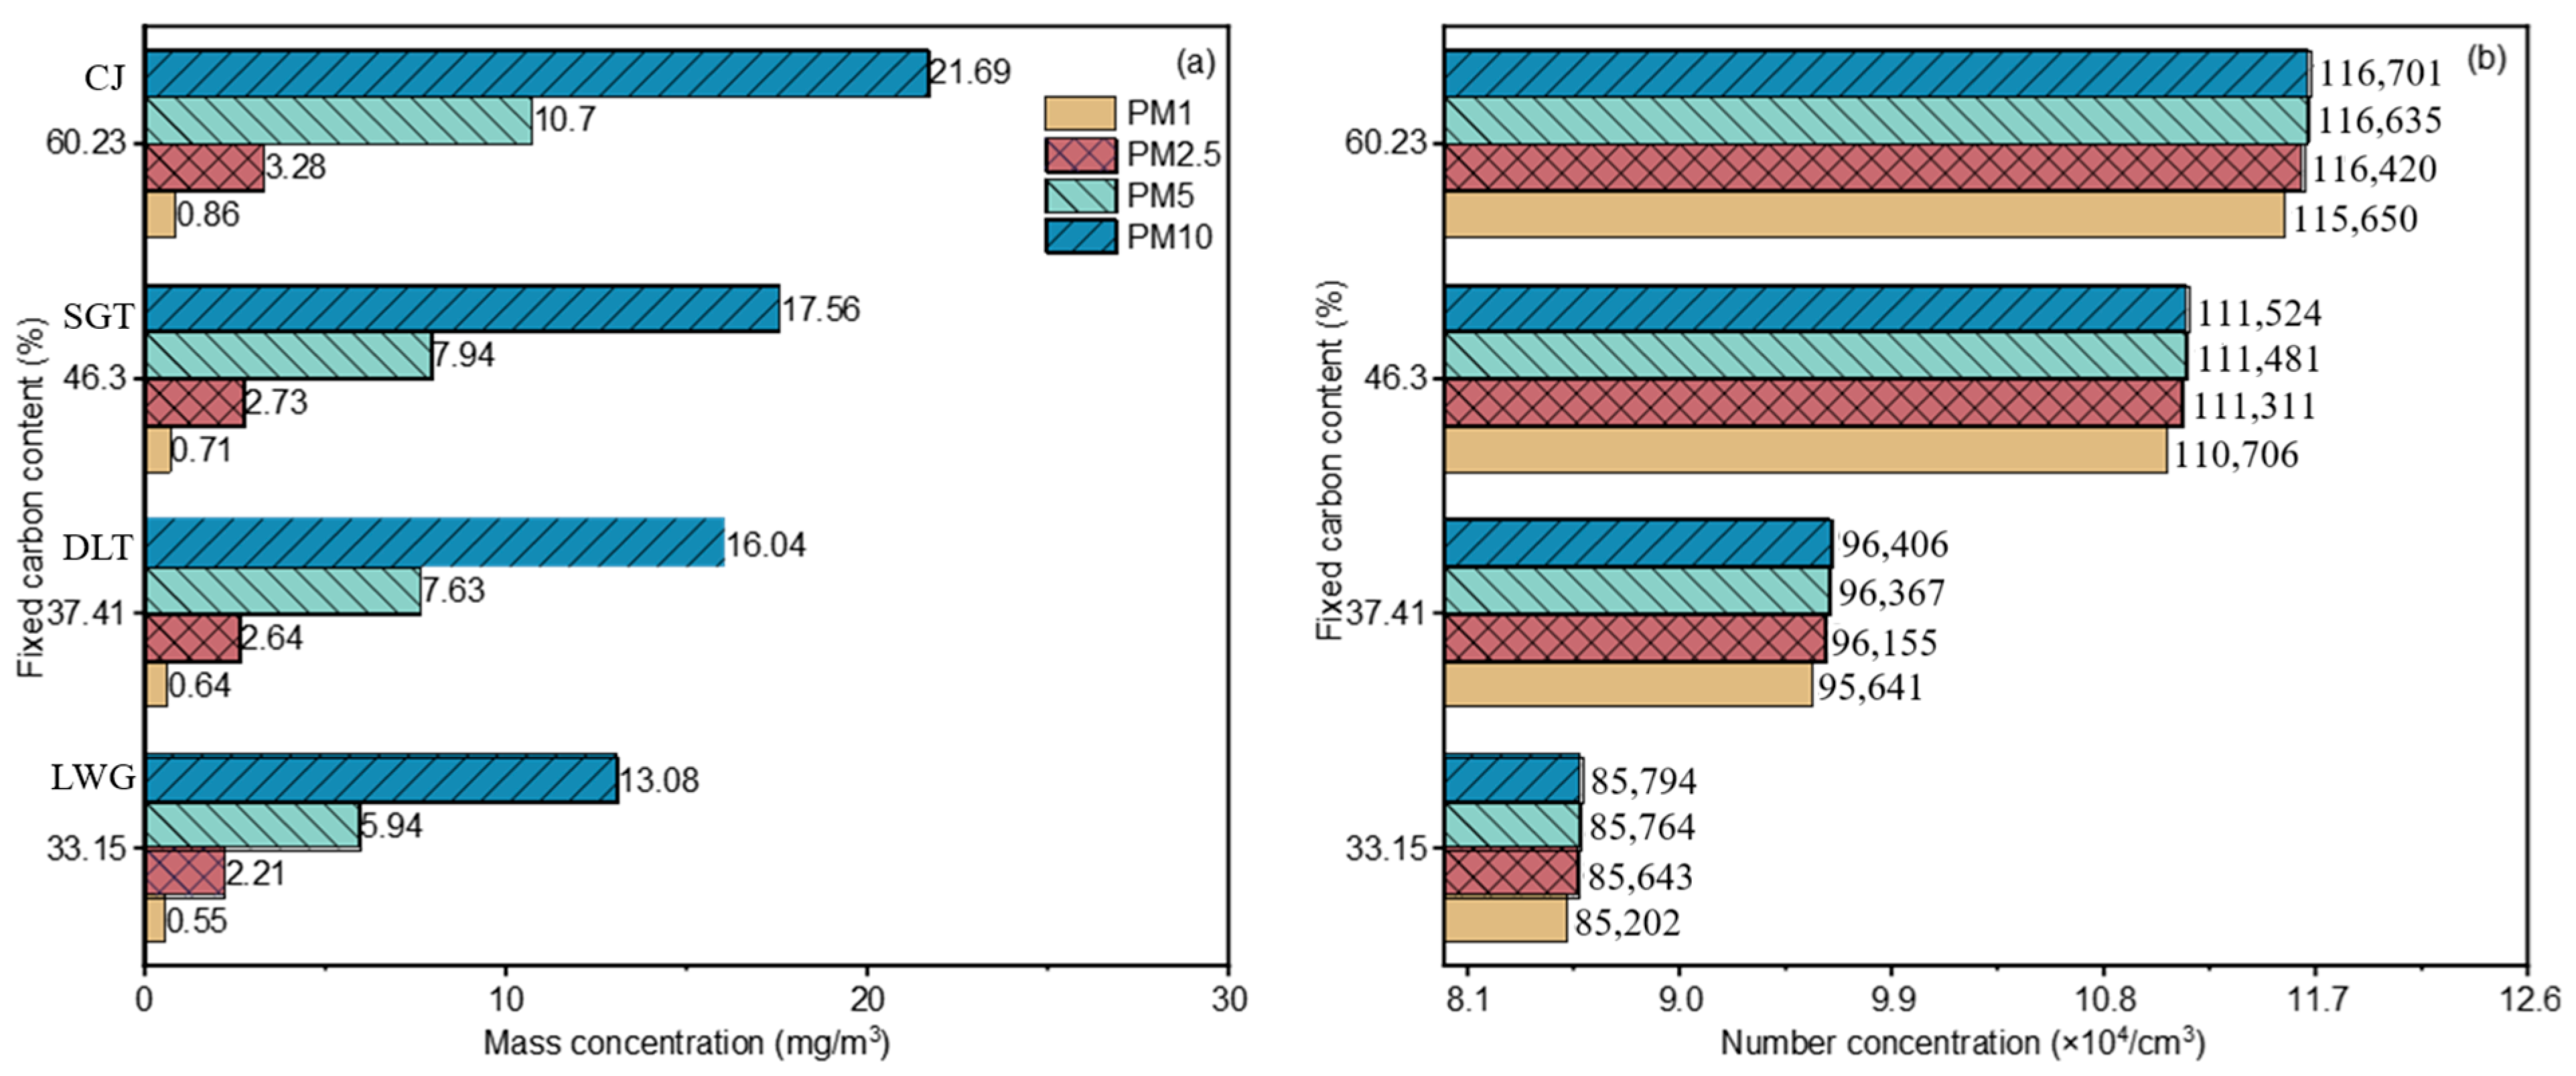
As can be seen in Figure 21, with an increase in fixed carbon content from 33.15% of LWG lignite to 60.23% of CJ anthracite, the mass concentrations of PM1, PM2.5, PM5, and PM10 increased by 36%, 32.6%, 44.5%, and 39.7%, respectively, and the number concentrations all increased by around 26.5%.
In general, the compressive strength of coal is much greater than the tensile strength, so it is usually considered that the crushing of coal is caused by tensile damage [79]. The fixed carbon content of coal increases with the rise of coal rank, and the higher the fixed carbon content of the coal body, the higher its tensile strength [80], and the more difficult to break. Thus, the process of cutting the coal body requires the cutting teeth to invade deeper and exert a greater force, resulting in an increase in the volume of the compaction nucleus, which generates more coal dust. McCunney et al. [81] reported that with the increase in fixed carbon content, the incidence of pneumoconiosis in coal miners tends to increase.

4.2.3. Relationship Between Firmness Coefficient of the Cut Coal Body and the Generated 10 nm–10 μm Coal Dust

From Figure 22, it was found that the mass concentrations of PM1, PM2.5, PM5, and PM10 for LWG lignite, which has the lowest firmness coefficient, were 1.56, 1.48, 1.8, and 1.66 times those of CJ anthracite, which has the highest firmness coefficient, and the corresponding number concentrations were all 1.35 times those of CJ anthracite.
The firmness coefficient of coal reflects the ability of coal to resist external damage. The larger the firmness coefficient, the higher the ability to resist external damage, and the higher the energy required to break the coal block [82], thus under the same cutting conditions, the coal block with a larger firmness coefficient is more difficult to break, resulting in a shallower depth of cut, a smaller volume of compacted nucleus, and a reduction in the amount of coal dust generated. Furthermore, it was reported that with the increase in the firmness coefficient, the hydrophilicity of coal becomes worse [83].

4.2.4. Relationship Between Porosity of the Cut Coal Body and the Generated 10 nm–10 μm Coal Dust

As presented in Figure 23, with the increase in the porosity of the cut coal body, the mass and number concentrations of PM1, PM2.5, PM5, and PM10 first increased then decreased. Coal is a porous medium with complex pore and fracture structure [84], and the pore structure is an important factor affecting the physical and mechanical properties of the coal body. It was reported that higher porosity would reduce the mechanical strength of the coal body [85], thus lowering the coal damage limit, which is more likely to trigger the instability and fragmentation of the coal body [86]. Therefore, under the same cutting conditions, the coal blocks with high porosity are more likely to be broken along the primary cracks under the action of the cutting teeth thus reduce the coal dust generation. Meantime, the weak ability of high porosity coals to store external energy leads to higher energy accumulation in the tip region of the cutting teeth, which is mainly used to form new microcracks, leading to an increase in the amount of coal dust generated. Overall, the effect of coal porosity on the generation of 10 nm–10 μm coal dust is complicated.

4.3. Number Percentages of 10 nm–1 μm in 10 nm–10 μm Coal Dust Generated by Coal Cutting

The Results Section showed that under different cutting conditions, the number percentages of 10 nm–1 μm coal particles accounted for over 99% of the 10 nm–10 μm coal dust; this ratio is much higher than the current reported data. The main reasons for the huge difference are as follows: At present, coal dust is mainly collected by dust samplers in mines, and then sealed and brought to the laboratory to measure the particle size distribution by laser particle size analyzer, and due to the large specific surface area of nanoscale coal particles and the high surface energy, the phenomenon of adhesion and agglomeration is easy to occur [87]. Moreover, restricted by the particle size detection limit and/or the requirement for the explosion protection of the particulate matter detection instruments, the existing studies have paid less attention to the nano-sized coal dust particles, while the detection instrument selected in this study can complete the real-time detection of the number concentration of the coal dust particles suspended in the air in the range of 10–420 nm particle size, which can effectively avoid the phenomenon of agglomeration of the nanoscale coal dust and guarantee the accuracy of the measurements.

4.4. Physicochemical Properties of Coal Dust Generated by Cutting Different Rank Coals

4.4.1. Free SiO2 Percentage of PM10 Coal Dust Generated by Cutting Different Rank Coals

As can be seen from the results section, there was no strong correlation between the free SiO2 percentage of PM10 coal dust and the coal ranks. Current medical research reported that the incidence of CWP was significantly correlated with the coal ranks [88]. In this study, it can be seen that although the free SiO2 percentage of LWG lignite was higher than that of DLT long-flame coal and SGT non-caking coal, the absolute contents of free SiO2 in coal dust of DLT long-flame coal and SGT non-caking coal were higher because the amount of coal dust generated under the same cutting conditions significantly increased with the increase in coal ranks, thus the prevention of CWP should pay more attention to the high-ranking coal mines.

4.4.2. The Microscopic Morphology of PM10 Coal Dust Generated by Cutting Different Rank Coals

The results section showed that there is no correlation between the sphericity of coal dust and the coal ranks. DLT long-flame coal and SGT non-caking coal have higher sphericity, and the coal dust is more toxic. The sphericity of coal dust in this study was in accordance with the values obtained in current research [89]. It has been reported [90] that coal dust surface roughness was positively related to the hydrophilicity, and the rougher the coal dust surface, the better the hydrophilicity and the smaller the contact angle. From the results section, it can be seen that LWG lignite coal showed the smallest contact angle and the best hydrophilicity. Furthermore, compared with CJ anthracite, LWG lignite has a higher proportion of macropores and mesopores—this difference in pore size distribution, together with the earlier observation that anthracite is dominated by micropores [91], fully reflects that the pore structure characteristics of coal dust (e.g., size distribution, morphology) change with coal rank.

4.4.3. Contact Angle of PM10 Coal Dust Generated by Cutting Different Rank Coals

Existing studies have confirmed that the surface pore characteristics and proximate analyzer components of coal dust were the main factors affecting its hydrophilicity [92], and the coal dust hydrophilicity was negatively correlated with the fixed carbon content, and positively correlated with the ash content and moisture content [93]. Coal dust is mainly composed of organic matter and inorganic minerals, and the higher the coal rank, the higher the content of organic matter in the coal. The organic matter has a certain degree of hydrophobicity, so the hydrophilicity of the high-rank coal dust is poor. The contact angle of coal dust was positively correlated with its porosity [94], and the low-rank coal has a higher porosity and larger internal surface area, contributing to a higher ability to adsorb liquids and a better hydrophilicity. As can be seen in the results section, the contact angle has a positive correlation with the coal rank, with the lowest-rank LWG lignite having the smallest contact angle and the strongest hydrophilicity, and the highest rank CJ anthracite having the largest contact angle and the poorest hydrophilicity. Therefore, dry de-dusting measure is more effective in suppressing the high-rank coal dust, while wet de-dusting can be more effective in suppressing the low-rank coal dust.

4.4.4. FTIR Spectra of PM10 Coal Dust Generated by Cutting Different Rank Coals

Aliphatic and aromatic hydrocarbons are hydrophobic functional groups, and coal dust with a high content has poor hydrophilicity. The results section showed that with increasing the coal ranks from LWG lignite to CJ anthracite, the intensity of the absorption peaks corresponding to aliphatic and aromatic hydrocarbons of coal dust raised, and coal dust hydrophobicity increased.
Hydroxyl groups and C=O in alcohols, phenols, and ethers are polar hydrophilic oxygen-containing functional groups that can significantly enhance coal dust hydrophilicity [95]. The results section showed that with the increase in coal rank, the absorption peaks corresponding to the oxygen-containing functional groups of coal dust raised, thus the hydrophilicity of coal dust was improved. Therefore, wet de-dusting is more effective in low coal rank mines, and dry de-dusting or adding surfactants to the water spray can be considered in high coal rank mines.
The limitations of this study are as follows:
(1)
First, we did not consider the significant changes in cone angle caused by its wear during prolonged coal cutting; second, we failed to quantitatively provide the optimal values for cutting parameter selection; and last but not least, we only considered the perspective of dust reduction and did not conduct in-depth research on coal hardness, nor on the increase in cone angle caused by teeth wear during prolonged coal cutting.
(2)
Prior to the formal experiments, we conducted pilot studies (pre-experiments) under representative experimental conditions to test result reproducibility. The outcomes demonstrated excellent repeatability—data variations (e.g., dust concentration, particle size distribution) were minimal, confirming the stability of our self-developed simulated drum cutting system. Based on this verification, we did not perform full replication for all experimental conditions. In the meantime, a key practical constraint that limited comprehensive replication was the challenge associated with large raw coal blocks. Specifically, the sampling, sample preparation, and intact transportation of large raw coal blocks are highly difficult, as these processes require avoiding structural damage to preserve the coal’s natural physical properties. Consequently, the quantity of available intact large coal blocks was limited, which prevented us from conducting systematic replication for every combination of experimental conditions.
(3)
This study only adopts a similar simulation approach. Moreover, it examines the impact of different cutting parameters of the shearer drum on dust generation solely from the perspective of source dust reduction, without taking mining intensity into account. Therefore, the somewhat regular results we obtained—specifically regarding the influence of different cutting parameters on the generated 10 nm~10 μm floating coal dust—cannot be the sole basis for determining the cutting parameters of the shearer drum in actual production processes.
(4)
This study has several limitations regarding result scalability. First, the cutting parameter optimization was only conducted on DLT long-flame coal, and while parameters align with on-site ranges, their applicability to other ranks (e.g., CJ anthracite) requires further verification. Second, as a physical simulation, this study focuses on cutting-dust generation mechanisms but neglects mining intensity, coal seam inhomogeneity, and multi-equipment interference, so the results cannot directly quantify on-site dust concentrations. Third, similarity criteria were partially simplified: Reynolds number matching was omitted due to the focus on source mechanisms, and while Stokes number consistency was ensured for target particles via 0.3 m/s airflow, it was not systematically calibrated across all size fractions.

5. Conclusions

This study employed a self-developed experimental system for simulating dust generation from drum cutting of coal bodies to systematically investigate the concentration distribution characteristics (mass concentration, number concentration, and percentage of different particle size fractions) and physicochemical properties (free SiO2 content, sphericity, contact angle, and surface functional groups) of 10 nm–10 μm coal dust generated by cutting different rank coals under varying drum cutting parameters. The main conclusions are as follows:
(1)
When drum cutting different rank coals, the generated 10 nm–10 μm coal dust showed a monotonously increasing in mass concentration with coal particle size and a single-peak distribution in number concentration with peaks located in the coal particle size range of 60–120 nm.
(2)
The mass and number concentrations of the 10 nm–10 μm coal dust generated by the cutting process were mainly concentrated in 2–10 μm and 10–200 nm, respectively, which, respectively, accounted for about 90% of the total.
(3)
Under different coal cutting conditions, the mass concentration percentages of PM1/PM10, PM1/PM2.5, and PM2.5/PM10 were 3.25–4.87%, 19.35–26.73%, and 14.82–18.81%, respectively, whereas the number concentration rations of N-PM1/N-PM10, N-PM1/N-PM2.5, and N-PM2.5/N-PM10 all exceeded 99%.
(4)
Either the reduction in the tooth tip cone angle, the rotary speed, or the increase in the mounting angle or the cutting depth can effectively inhibit the generation of 10 nm–10 μm coal dust.
(5)
Lower rank coal cutting generates lower mass and number concentrations of 10 nm–10 μm coal dust, and either higher moisture content or firmness coefficient, or lower fixed carbon content of the cut coal body can effectively reduce the 10 nm–10 μm coal dust generation.
(6)
The pore structure characteristics of coal dust (e.g., size distribution, morphology) change with coal rank, with higher-rank coal dust exhibiting fewer surface pores; additionally, higher-rank coal dust particles have smoother surfaces, larger contact angles, more hydrophobic groups such as aliphatic hydrocarbons and aromatic hydrocarbons, and fewer hydrophilic oxygen-containing functional groups such as hydroxyls, carbonyls, and ether bonds, showing poorer hydrophilicity.

Author Contributions

Conceptualization, J.Z. and L.W.; Methodology, H.L.; Software, R.J.; Validation, Q.T., J.Z. and L.W.; Formal Analysis, W.L., Y.L. and C.A.; Investigation, N.B.O. and Y.L.; Resources, J.Z. and L.W.; Data Curation, J.T. and Q.T.; Writing—Original Draft Preparation, H.L., R.J. and J.T.; Writing—Review and Editing, H.L., Q.T., N.B.O. and W.L.; Visualization, J.T. and C.A.; Supervision, J.Z. and L.W.; Project Administration, J.Z. and L.W.; Funding Acquisition, J.Z. All authors have read and agreed to the published version of the manuscript.

Funding

This research was funded by the National Natural Science Foundation of China (Nos. 51904291 and 51674252, the China Postdoctoral Science Foundation (Nos. 2025T180511 and 2023M742938), and the Open Fund of State Key Laboratory for Safe Mining of Deep Coal Resources and Environment Protection.

Institutional Review Board Statement

Not applicable.

Informed Consent Statement

Not applicable.

Data Availability Statement

The original contributions presented in this study are included in the article. Further inquiries can be directed to the corresponding authors.

Conflicts of Interest

The authors declare no conflicts of interest. Mr. Liu is an employee of Shandong Energy Group Luxi Mining Company Limited. This paper reflects the views of the scientists and not the company.

References

  1. Zhang, L.; Zhou, G.; Ma, Y.; Jing, B.; Sun, B.; Han, F.; He, M.; Chen, X. Numerical analysis on spatial distribution for concentration and particle size of particulate pollutants in dust environment at fully mechanized coal mining face. Powder Technol. 2021, 383, 143–158. [Google Scholar] [CrossRef]
  2. Petsonk, E.L.; Rose, C.; Cohen, R. Coal Mine Dust Lung Disease. New Lessons from an Old Exposure. Am. J. Respir. Crit. Care Med. 2013, 187, 1178–1185. [Google Scholar] [CrossRef]
  3. National Health Commission of the People’s Republic of China. Statistical Bulletin on the Development of Health Care in China. 2023. Available online: https://www.gov.cn/lianbo/bumen/202408/content_6971241.htm (accessed on 1 August 2025).
  4. Hu, Y.; Duan, K.; Zhao, Y.; Ma, G. Study on Suppressing the Dust Concentration at Fully Mechanized Coal Face Using Water Injection. China Saf. Sci. J. 1998, 8, 50–53. [Google Scholar] [CrossRef]
  5. Yang, H.; Liu, Z.; Zhao, D.; Lv, J.; Yang, W. Insights into the fluid wetting law and fractal characteristics of coal particles during water injection based on nuclear magnetic resonance. Chaos Solitons Fractals 2022, 159, 112109. [Google Scholar] [CrossRef]
  6. Zhang, C.; Yuan, S.; Zhang, N.; Li, C.; Li, H.; Yang, W. Dust-suppression and cooling effects of spray system installed between hydraulic supports in fully mechanized coal-mining face. Build. Environ. 2021, 204, 108106. [Google Scholar] [CrossRef]
  7. Wang, P.; Tan, X.; Cheng, W.; Guo, G.; Liu, R. Dust removal efficiency of high pressure atomization in underground coal mine. Int. J. Min. Sci. Technol. 2018, 28, 685–690. [Google Scholar] [CrossRef]
  8. Seaman, C.E.; Shahan, M.R.; Beck, T.W.; Mischler, S.E. Design of a water curtain to reduce accumulations of float coal dust in longwall returns. Int. J. Min. Sci. Technol. 2020, 30, 443–447. [Google Scholar] [CrossRef]
  9. Peng, H.; Nie, W.; Zhang, S.; Cheng, W.; Liu, Q.; Guo, C.; Ma, Q.; Zhou, Z.; Xu, C.; Hua, Y.; et al. Research on negative pressure jet dust-removal water curtain technology for coal mine cleaner production. Fuel 2022, 310, 122378. [Google Scholar] [CrossRef]
  10. Sjöström, S.; Klintenäs, E.; Johansson, P.; Nyqvist, J. Optimized model-based control of main mine ventilation air flows with minimized energy consumption. Int. J. Min. Sci. Technol. 2020, 30, 533–539. [Google Scholar] [CrossRef]
  11. Saki, S.A.; Brune, J.F.; Khan, M.U. Optimization of gob ventilation boreholes design in longwall mining. Int. J. Min. Sci. Technol. 2020, 30, 811–817. [Google Scholar] [CrossRef]
  12. Jin, H.; Li, S.; Yu, H.; Yuan, L.; Zhou, F.; Tan, Z. Filtration of dust particles in underground coal mines. Powder Technol. 2023, 423, 118506. [Google Scholar] [CrossRef]
  13. Li, S.; Xie, B.; Hu, S.; Jin, H.; Liu, H.; Tan, X.; Zhou, F. Removal of dust produced in the roadway of coal mine using a mining dust filtration system. Adv. Powder Technol. 2019, 30, 911–919. [Google Scholar] [CrossRef]
  14. Wang, P.; Tan, X.; Zhang, L.; Li, Y.; Liu, R. Influence of particle diameter on the wettability of coal dust and the dust suppression efficiency via spraying. Process Saf. Environ. Prot. 2019, 132, 189–199. [Google Scholar] [CrossRef]
  15. Ji, B.; Jiang, B.; Yuan, L.; Yu, C.; Zhou, G.; Zhao, Y.; Wang, S.; Wang, X. Experimental and molecular dynamics simulation study on the influence of SDS and JFC composite ratios on bituminous coal wettability. Process Saf. Environ. Prot. 2023, 174, 473–484. [Google Scholar] [CrossRef]
  16. Zhou, W.; Wang, H.; Zhang, J.; He, F.; Liu, J.; Wang, D. A novel method for reducing the amount of dust produced by roadheaders based on the numerical simulation of coal breakage. Fuel 2023, 343, 127978. [Google Scholar] [CrossRef]
  17. Achanti, V.B.; Khair, A.W. Cutting efficiency through optimised bit configuration—An experimental study using a simulated continuous miner. Miner. Resour. Eng. 2001, 10, 427–434. [Google Scholar] [CrossRef]
  18. Fowell, R.J.; Ochei, N.N. A comparison of dust make and energy requirements for rock cutting tools. Int. J. Min. Eng. 1984, 2, 73–83. [Google Scholar] [CrossRef]
  19. Li, X.H.; Liu, S.M.; Huang, Z.L.; Du, W. Study of the Effects of Shearer’ Kinematic Parameters on on-Way Distribution of Dust on Coal Face. Appl. Mech. Mater. 2012, 127, 400–405. [Google Scholar] [CrossRef]
  20. Zhou, W.; Wang, H.; Wang, D.; Zhang, K.; Du, Y.; Yang, H. The effect of geometries and cutting parameters of conical pick on the characteristics of dust generation: Experimental investigation and theoretical exploration. Fuel Process. Technol. 2020, 198, 106243. [Google Scholar] [CrossRef]
  21. Srikanth, R.; Ramani, R. Single-breakage studies to determine the relationships between respirable dust generation and coal seam characteristics. Appl. Occup. Environ. Hyg. 1996, 11, 662–668. [Google Scholar] [CrossRef]
  22. Organiscak, J.A.; Page, S.J. Airborne Dust Liberation During Coal Crushing. Coal Prep. 2000, 21, 423–453. [Google Scholar] [CrossRef]
  23. Zheng, L.; Li, D.; Xu, S. Analysis on the impact crushing dust generation test method and its influencing factors. Powder Technol. 2021, 388, 100–109. [Google Scholar] [CrossRef]
  24. Zhou, W.; Wang, H.; Wang, D.; Du, Y.; Zhang, K.; Kang, W. The effect of coal proximate compositions on the characteristics of dust generation using a conical pick cutting system. Powder Technol. 2019, 355, 573–581. [Google Scholar] [CrossRef]
  25. Zhou, W.; Wang, H.; Wang, D.; Du, Y.; Zhang, K.; Zhang, J. The influence of pore structure of coal on characteristics of dust generation during the process of conical pick cutting. Powder Technol. 2020, 363, 559–568. [Google Scholar] [CrossRef]
  26. Zhu, J.; He, X.; Wang, L.; Liao, X.; Teng, G.; Jing, P. Performance of N95 elastomeric respirators in high humidity and high coal dust concentration environment. Int. J. Min. Sci. Technol. 2022, 32, 215–224. [Google Scholar] [CrossRef]
  27. Hall, N.B.; Blackley, D.J.; Halldin, C.N.; Laney, A.S. Current Review of Pneumoconiosis Among US Coal Miners. Curr. Environ. Health Rep. 2019, 6, 137–147. [Google Scholar] [CrossRef]
  28. Wang, Q.; Geng, X.; Li, Y.; Zhang, F.; Tuo, L.; Zhang, Y. Effect of nanoparticles and silicone surfactants on the foam properties and wettability of dust removal foam. Chem. Eng. Sci. 2023, 281, 119147. [Google Scholar] [CrossRef]
  29. Cheng, W.; Zhou, G.; Chen, L.; Wang, G.; Nie, W.; Zhang, Q. Research progress and prospect of dust control theory and technology in China’s coal mines in the past 20 years. Coal Sci. Technol. 2020, 48, 1–20. [Google Scholar] [CrossRef]
  30. Wu, L.; Sun, Y. Cytotoxicity of mixed coal-silica dust. J. Toxicol. 2003, 4, 243–244. [Google Scholar] [CrossRef]
  31. Zhang, J.; Li, H.; Liu, Y.; Li, X.; Xie, J.; Dai, Z.; Ye, S.; Li, L.; Zhou, W.; Zhao, Y.; et al. Micro-wetting characteristics of coal dust and preliminary study on the development of dust suppressant in Pingdingshan mining area. J. China Coal Soc. 2021, 46, 812–825. [Google Scholar] [CrossRef]
  32. Phan Quang, V. The determination of coal dust emission and percentage of quartz in coal dust emission during the cutting anthracite coal by shearing and bottom blade of the plow. Procedia Earth Planet. Sci. 2009, 1, 250–256. [Google Scholar] [CrossRef]
  33. Liu, M.; Chen, S.; Liu, Y.; Su, L.; Shi, R.; Qi, X.; Li, B.; Zhang, Z. Characterization of sphericity and wall thickness uniformity of thick-walled hollow microspheres. High Power Laser Part. Beams 2014, 26, 159–163. [Google Scholar] [CrossRef]
  34. Saikia, B.K.; Saikia, J.; Rabha, S.; Silva, L.F.O.; Finkelman, R. Ambient nanoparticles/nanominerals and hazardous elements from coal combustion activity: Implications on energy challenges and health hazards. Geosci. Front. 2018, 9, 863–875. [Google Scholar] [CrossRef]
  35. Jing, Q.; Liu, Q.; Wang, D.; Shen, Y.; Wang, Z. Calculation model for drag coefficient and multi-phase flow characteristics in dust removal process: Comparison between flake aluminum powder and spherical aluminum powder. Powder Technol. 2022, 405, 117550. [Google Scholar] [CrossRef]
  36. Mischler, S.E.; Cauda, E.G.; Di Giuseppe, M.; McWilliams, L.J.; Croix, C.S.; Sun, M.; Franks, J.; Ortiz, L.A. Differential activation of RAW 264.7 macrophages by size-segregated crystalline silica. J. Occup. Med. Toxicol. 2016, 11, 57. [Google Scholar] [CrossRef]
  37. Doroodchi, E.; Zulfiqar, H.; Moghtaderi, B. A combined experimental and theoretical study on laboratory-scale comminution of coal and biomass blends. Powder Technol. 2013, 235, 412–421. [Google Scholar] [CrossRef]
  38. Zhao, Z.; Yang, C.; Sun, C.; Shu, X. Experimental study of coal dust wettability. J. China Coal Soc. 2011, 36, 442–446. [Google Scholar] [CrossRef]
  39. Wang, C.; Lin, B.; Li, Q.; Dai, H. Effects of Oxygen Containing Functional Groups on Coal Dust Wettability. Saf. Coal Mines 2014, 45, 173–176. [Google Scholar] [CrossRef]
  40. Cheng, W.; Liu, W.; Nie, W.; Zhou, G.; Cui, X.; Sun, X. The Prevention and Control Technology of Dusts in Heading and Winning Faces and Its Development Tendency. J. Shandong Univ. Sci. Technol. 2010, 29, 77–82. [Google Scholar] [CrossRef]
  41. Wang, W. Appliation Present Status and Outlook of Seam Water Injection Dust Control Technology. Coal Sci. Technol. 2011, 39, 57–60. [Google Scholar] [CrossRef]
  42. Yang, J.; Tan, Y.; Wang, Z.; Shang, Y.; Zhao, W. Study on the coal dust surface characteristics and wetting mechanism. J. China Coal Soc. 2007, 32, 737–740. [Google Scholar] [CrossRef]
  43. An, W.; Wang, L. Mechanical properties and modification of coal under the action of surfactant. J. China Coal Soc. 2020, 45, 4074–4086. [Google Scholar] [CrossRef]
  44. Liu, S.; Ge, S.; Wang, J.; Sun, L.; Chen, X.; Jing, D.; Kang, J. Influence of surfactants on wettability mechanism of different coals based on quantum chemistry analysis. J. Saf. Sci. Technol. 2021, 17, 105–111. [Google Scholar]
  45. Zhang, J.; Liu, Y.; Wang, M.; Wang, Y.; Li, H.; Xie, J.; Zhao, Y.; Zhou, W.; Ye, S.; Li, L.; et al. Influence Mechanism of Nonionic Surfactant on Coal Wettability Based on Molecular Dynamics Simulation. Adv. Eng. Sci. 2022, 54, 191–202. [Google Scholar] [CrossRef]
  46. Wang, H.; Zhang, L.; Wang, D.; He, X. Experimental investigation on the wettability of respirable coal dust based on infrared spectroscopy and contact angle analysis. Adv. Powder Technol. 2017, 28, 3130–3139. [Google Scholar] [CrossRef]
  47. Liang, C.; Liang, W.; Li, W. Functional groups of different coal ranks based on infrared spectroscopy. Coal Sci. Technol. 2020, 48, 182–186. [Google Scholar]
  48. Baysal, M.; Yürüm, A.; Yıldız, B.; Yürüm, Y. Structure of some western Anatolia coals investigated by FTIR, Raman, 13C solid state NMR spectroscopy and X-ray diffraction. Int. J. Coal Geol. 2016, 163, 166–176. [Google Scholar] [CrossRef]
  49. Jiang, J.; Yang, W.; Cheng, Y.; Liu, Z.; Zhang, Q.; Zhao, K. Molecular structure characterization of middle-high rank coal via XRD, Raman and FTIR spectroscopy: Implications for coalification. Fuel 2019, 239, 559–572. [Google Scholar] [CrossRef]
  50. Wang, H.; Fan, S.; Yao, H. FTIR Analysis on Surface Chemical Structure of Two Different Degrees of Metamorphic Coal. Saf. Coal Mines 2018, 49, 194–197. [Google Scholar] [CrossRef]
  51. Cheng, W.; Xue, J.; Zhou, G.; Nie, W.; Liu, L. Study of coal dust wettability based on FTIR. J. China Coal Soc. 2014, 39, 2256–2262. [Google Scholar] [CrossRef]
  52. Kampa, M.; Castanas, E. Human health effects of air pollution. Environ. Pollut. 2008, 151, 362–367. [Google Scholar] [CrossRef]
  53. Nemmar, A.; Hoet, P.M.; Vanquickenborne, B.; Dinsdale, D.; Thomeer, M.; Hoylaerts, M.; Vanbilloen, H.; Mortelmans, L.; Nemery, B. Passage of inhaled particles into the blood circulation in humans. Circulation 2002, 105, 411–414. [Google Scholar] [CrossRef]
  54. Liu, T.; Liu, S. The impacts of coal dust on miners’ health: A review. Environ. Res. 2020, 190, 109849. [Google Scholar] [CrossRef] [PubMed]
  55. Maynard, A.D.; Kuempel, E.D. Airborne Nanostructured Particles and Occupational Health. J. Nanopart. Res. 2005, 7, 587–614. [Google Scholar] [CrossRef]
  56. Oberdörster, G.; Oberdörster, E.; Oberdörster, J. Nanotoxicology: An Emerging Discipline Evolving from Studies of Ultrafine Particles. Environ. Health Perspect. 2005, 113, 823–839. [Google Scholar] [CrossRef] [PubMed]
  57. Magrez, A.; Kasas, S.; Salicio, V.; Pasquier, N.; Seo, J.W.; Celio, M.; Catsicas, S.; Schwaller, B.; Forró, L. Cellular Toxicity of Carbon-Based Nanomaterials. Nano Lett. 2006, 6, 1121–1125. [Google Scholar] [CrossRef] [PubMed]
  58. Zhang, R.; Liu, S.; Zheng, S. Characterization of nano-to-micron sized respirable coal dust: Particle surface alteration and the health impact. J. Hazard. Mater. 2021, 413, 125447. [Google Scholar] [CrossRef]
  59. GB/T 212-2008; Proximate Analysis of Coal. Standardization Administration of the People’s Republic of China: Beijing, China, 2008. Available online: https://std.samr.gov.cn/gb/search/gbDetailed?id=71F772D77AA5D3A7E05397BE0A0AB82A (accessed on 1 September 2025).
  60. GB/T 23561.12-2010; Methods for Determining the Physical and Mechanical Properties of Coal and Rock—Part 12: Method for Determining Coal Hardiness Coefficient. Standardization Administration of the People’s Republic of China: Beijing, China, 2010.
  61. GB/T 23561.4-2009; Methods for Determining the Physical and Mechanical Properties of Coal and Rock—Part 4: Methods for Calculating the Porosity of Coal and Rock. Standardization Administration of the People’s Republic of China: Beijing, China, 2009.
  62. Li, X.H.; Li, G.X.; Zheng, L.H. Experimental Research of Cutting Performance. J. Fuxin Min. Inst. (Nat. Sci.) 1995, 3, 78–83. Available online: https://kns.cnki.net/kcms2/article/abstract?v=Ut-mckhA-RtRewJ_jqkFRXgV57viZSN3p4_AoF0B59IX8XQ4Fub9AZ_cJzxciUM1GieZPgsZV5cuGMp_vM7mFPwqVm3DuZk6ldiLeXT1sqwaVa311ChJKxm_mNIVc7WsDjXNY15TEtqgvjel2rKwztzAt1ZdwbyS&uniplatform=NZKPT (accessed on 1 September 2025).
  63. Wang, G.; Zhou, W.; Wang, Z.; Lu, X.; Zhang, Y. Characterization and Concentration Prediction of Dust Pollution in Open-Pit Coal Mines. Atmosphere 2024, 15, 1408. [Google Scholar] [CrossRef]
  64. GBZ/T 192.4-2007; Method for Determination of Dust in the Air of Workplace Part 4: Content of Free Silica in Dust. Standardization Administration of the People’s Republic of China: Beijing, China, 2007.
  65. GB/T 39251-2020; Additive Manufacturing—Methods to Characterize Performance of Metal Powders. Standardization Administration of the People’s Republic of China: Beijing, China, 2020.
  66. YS/T 1297-2019; Measuring Method for Sphericity Ratio of Titanium and Titanium Alloy Powders. Standardization Administration of the People’s Republic of China: Beijing, China, 2019. Available online: https://std.samr.gov.cn/hb/search/stdHBDetailed?id=A35FFACCACC23A35E05397BE0A0A44D5 (accessed on 1 September 2025).
  67. GB/T 30447-2013; Measurement Method for Contact Angle of Nano-Film Surface. Standardization Administration of the People’s Republic of China: Beijing, China, 2013.
  68. GB/T 6040-2019; General Rules for Infrared Analysis. Standardization Administration of the People’s Republic of China: Beijing, China, 2019.
  69. Evans, I. A theory of the cutting force for point-attack picks. Int. J. Min. Eng. 1984, 2, 63–71. [Google Scholar] [CrossRef]
  70. Roepke, W.W.; Voltz, J.I. Coal Cutting Forces and Primary Dust Generation Using Radial Gage Cutters; U.S. Department of Energy: Washington, DC, USA, 1983. [Google Scholar]
  71. Park, J.-Y.; Kang, H.; Lee, J.-W.; Kim, J.-H.; Oh, J.-Y.; Cho, J.-W.; Rostami, J.; Kim, H.D. A study on rock cutting efficiency and structural stability of a point attack pick cutter by lab-scale linear cutting machine testing and finite element analysis. Int. J. Rock Mech. Min. Sci. 2018, 103, 215–229. [Google Scholar] [CrossRef]
  72. Wang, H.; Tan, C.; Jiang, Z.; Zhang, Y.; Wang, M. Numerical simulation and field measurement of dust distribution for multi-source dust at fully mechanized caving face. J. Harbin Inst. Technol. 2015, 47, 106–112. [Google Scholar]
  73. Bakhtavar, E.; Shahriar, K. Selection of a practicable shearer loader based on mechanical properties of coal for Parvadeh 1 mine. Arch. Min. Sci. 2013, 58, 145–157. [Google Scholar] [CrossRef]
  74. Liu, S.; Du, C.; Cui, X. Experimental research on picks arrangement of shearer drum. J. Cent. South Univ. (Sci. Technol.) 2009, 40, 1281–1287. [Google Scholar]
  75. Yao, Q.; Li, X.; Zhou, J.; Ju, M.; Chong, Z.; Zhao, B. Experimental study of strength characteristics of coal specimens after water intrusion. Arab. J. Geosci. 2015, 8, 6779–6789. [Google Scholar] [CrossRef]
  76. Liu, J.; Qiao, L.; Li, P. Experimental studies and constitutive model of elastoplastic mechanical behaviors of sandstone with hydro-physicochemical influencing effects. Chin. J. Rock Mech. Eng. 2009, 28, 20–29. [Google Scholar] [CrossRef]
  77. Qiao, L.; Liu, J.; Feng, X. Study on damage mechanism of sandstone under hydro-physico-chemical effects. Chin. J. Rock Mech. Eng. 2007, 10, 2117–2124. [Google Scholar] [CrossRef]
  78. Zipf, R.K.; Bieniawski, Z.T. Estimating the crush zone size under a cutting tool in coal. Int. J. Min. Geol. Eng. 1988, 6, 279–295. [Google Scholar] [CrossRef]
  79. Dacombe, P.; Pourkashanian, M.; Williams, A.; Yap, L. Combustion-induced fragmentation behavior of isolated coal particles. Fuel 1999, 78, 1847–1857. [Google Scholar] [CrossRef]
  80. Zhong, S.; Baitalow, F.; Reinmöller, M.; Meyer, B. Relationship between the tensile strength of irregularly shaped coal particles and various fuel properties. Fuel 2019, 236, 92–99. [Google Scholar] [CrossRef]
  81. McCunney, R.J.; Morfeld, P.; Payne, S. What Component of Coal Causes Coal Workers’ Pneumoconiosis? J. Occup. Environ. Med. 2009, 51, 462–471. [Google Scholar] [CrossRef] [PubMed]
  82. Zhao, Y.; Li, Q.; Hu, Q.; Cao, J.; Sun, X. Experimental study on particle size distribution characteristics of coal with different hardness under impact crushing. Min. Saf. Environ. Prot. 2020, 47, 1–6. [Google Scholar] [CrossRef]
  83. Wang, L.; Liao, X.; Zha, M.; Zhang, R.; Pei, X.; Pan, R. Study on wetting characteristics of coal dust in soft coal based on principal component analysis. Coal Sci. Technol. 2020, 48, 104–109. [Google Scholar] [CrossRef]
  84. Dang, G.; Wu, C.; Zhao, K.; Liang, C.; Jiang, W. Pore property and its impact on the coalbed methane adsorption of anthracite from Zhu-Zang syncline, Guizhou Province. Coal Geol. Explor. 2017, 45, 72–78. [Google Scholar]
  85. Zhu, C.; Xei, G.; Wang, L.; Wang, C.; Hou, J. Experimental study on the influence of moisture content and porosity on soft coal strength characteristics. J. Min. Saf. Eng. 2017, 34, 601–607. [Google Scholar] [CrossRef]
  86. Peng, R.; Zhang, Y.; Yang, Y.; Liu, Z. Numerical simulation of porous rock damage and failure. J. China Coal Soc. 2014, 39, 1039–1048. [Google Scholar] [CrossRef]
  87. Zare, Y. Study of nanoparticles aggregation/agglomeration in polymer particulate nanocomposites by mechanical properties. Compos. Part A Appl. Sci. Manuf. 2016, 84, 158–164. [Google Scholar] [CrossRef]
  88. Attfield, M.; Castranova, V.; Hale, J.M.; Suarthana, E.; Thomas, K.C.; Wang, M.L. Coal Mine Dust Exposures and Associated Health Outcomes—A Review of Information Published Since 1995; U.S. Department of Health & Human Services, Public Health Service, Centers for Disease Control and Prevention, National Institute for Occupational Safety and Health: Washington, DC, USA, 2011. [Google Scholar]
  89. Mathews, J.P.; Eser, S.; Hatcher, P.G.; Scaroni, A.W. The Shape of Pulverized Bituminous Vitrinite Coal Particles. KONA Powder Part. J. 2007, 25, 145–152. [Google Scholar] [CrossRef]
  90. Zhang, J.; Xu, B.; Zhang, P.; Cai, M.; Li, B. Effects of surface roughness on wettability and surface energy of coal. Front. Earth Sci. 2023, 10, 1054896. [Google Scholar] [CrossRef]
  91. Li, Z.; Ren, T.; Li, X.; Qiao, M.; Yang, X.; Tan, L.; Nie, B. Multi-scale pore fractal characteristics of differently ranked coal and its impact on gas adsorption. Int. J. Min. Sci. Technol. 2023, 33, 389–401. [Google Scholar] [CrossRef]
  92. Wang, Y.; Song, E.; Zhang, Q. Dem analysis of the aggregate shape effect onmechanical properties of rockfill. Eng. Mech. 2022, 39, 137–146. [Google Scholar]
  93. Qin, T.; Jiang, S.; Zhang, W. Research Progress on Coal Wettability. Saf. Coal Mines 2017, 48, 163–166. [Google Scholar] [CrossRef]
  94. Yan, J.; Xie, J.; Shu, X.; Zhang, J.; Ma, X. Study on wetting ability of coal dust pore structure. Appl. Chem. Ind. 2019, 48, 748–751. [Google Scholar] [CrossRef]
  95. Li, J.; Li, K. Influence factors of coal surface wettability. J. China Coal Soc. 2016, 41, 448–453. [Google Scholar] [CrossRef]
Figure 2. Schematic diagram of the self-developed experimental system for simulating dust generation from drum cutting of coal bodies.
Atmosphere 16 01114 g002
Figure 3. Mass concentration distribution of 10 nm–10 μm coal dust at different tooth tip cone angles.
Atmosphere 16 01114 g003
Figure 4. Mass concentration distribution of 10 nm–10 μm coal dust at different mounting angles.
Atmosphere 16 01114 g004
Figure 5. Mass concentration distribution of 10 nm–10 μm coal dust at different rotary speeds.
Atmosphere 16 01114 g005
Figure 6. Mass concentration distribution of 10 nm–10 μm coal dust at different cutting depths.
Atmosphere 16 01114 g006
Figure 7. Number concentration distribution of 10 nm–10 μm coal dust at different tooth tip cone angles.
Atmosphere 16 01114 g007
Figure 8. Number concentration distribution of 10 nm–10 μm coal dust at different mounting angles.
Atmosphere 16 01114 g008
Figure 9. Number concentration distribution of 10 nm–10 μm coal dust at different rotary speeds.
Atmosphere 16 01114 g009
Figure 10. Number concentration distribution of 10 nm–10 μm coal dust at different cutting depths.
Atmosphere 16 01114 g010
Figure 11. Mass and number percentages of PM1/PM2.5, PM1/PM10, and PM2.5/PM10 of coal dust generated at different cutting parameters.
Atmosphere 16 01114 g011aAtmosphere 16 01114 g011b
Figure 12. Mass concentration distribution of 10 nm–10 μm coal dust when cutting the four different rank coals. (a) Different single sizes; (b) Different size fractions.
Atmosphere 16 01114 g012
Figure 13. Number concentration distribution of 10 nm–10 μm coal dust when cutting the four different rank coals. (a) Different single sizes; (b) Different size fractions.
Atmosphere 16 01114 g013
Figure 14. Mass (a) and number (b) percentages of PM1/PM2.5, PM1/PM10, and PM2.5/PM10 of coal dust when cutting the four different rank coals.
Atmosphere 16 01114 g014
Figure 15. Scanning electron micrographs of PM10 coal dust generated by cutting the four different rank coals.
Atmosphere 16 01114 g015
Figure 16. Contact angles of PM10 coal dust generated by cutting the four different ranks of coal.
Atmosphere 16 01114 g016
Figure 17. FTIR spectra of PM10 coal dust generated by cutting the four different rank coals.
Atmosphere 16 01114 g017
Figure 18. Schematic diagram of the cutting teeth intruding into the coal body.
Atmosphere 16 01114 g018
Figure 19. Schematic diagram of the coal body intrusion at the mounting angle α.
Atmosphere 16 01114 g019
Figure 20. Relationship between moisture content of the four different rank coals and the mass and number concentrations of PM1, PM2.5, PM5, and PM10 of the generated coal dust. (a) Mass concentrations vs. moisture content; (b) Number concentrations vs. moisture content.
Atmosphere 16 01114 g020
Figure 21. Relationship between fixed carbon content of the four different rank coals and the mass and number concentrations of PM1, PM2.5, PM5, and PM10 of the generated coal dust. (a) Mass concentrations vs. fixed carbon content; (b) Number concentrations vs. fixed carbon content.
Atmosphere 16 01114 g021
Figure 22. Relationship between firmness coefficient of the four different rank coals and the mass and number concentrations of PM1, PM2.5, PM5, and PM10 of the generated coal dust. (a) Mass concentrations vs. firmness coefficient; (b) Number concentrations vs. firmness coefficient.
Atmosphere 16 01114 g022
Figure 23. Relationship between porosity of the four different rank coals and the mass and number concentrations of PM1, PM2.5, PM5, and PM10 of the generated coal dust. (a) Mass concentrations vs. porosity; (b) Number concentrations vs. porosity.
Atmosphere 16 01114 g023
Table 1. Ranks and locations of coal samples.
Coal MineCoal RankLocation
Longwanggou (LWG)LigniteInner Mongolia, China
Daliuta (DLT)Long-flame coalInner Mongolia, China
Shigetai (SGT)Non-caking coalInner Mongolia, China
Chengjiao (CJ)AnthraciteHenan, China
Table 2. Proximate analysis of the four different rank coal samples.
Coal SampleMoisture Content/%Fixed Carbon Content/%Firmness CoefficientPorosity/%
LWG Lignite12.5333.150.6517.1
DLT Long-flame coal10.537.410.9210.8
SGT Non-caking coal9.3246.31.173.2
CJ Anthracite1.5460.231.324.1
Table 3. Summary of drum cutting parameters when cutting the DLT long-flame coal.
Cutting ParametersTooth Tip Cone Angle (°)Mounting Angle (°)Rotary Speed (r/min)Cutting Depth (mm)
Tooth tip cone angle80454030
90
100
Mounting angle80454030
60
90
Rotary speed80454030
70
100
130
Cutting depth80454030
40
50
Disclaimer/Publisher’s Note: The statements, opinions and data contained in all publications are solely those of the individual author(s) and contributor(s) and not of MDPI and/or the editor(s). MDPI and/or the editor(s) disclaim responsibility for any injury to people or property resulting from any ideas, methods, instructions or products referred to in the content.