Article

Electrostatic Particle Ionization for Reduction in Livestock and Potash Dust

1
Department of Chemical and Biological Engineering, University of Saskatchewan, Saskatoon, SK S7N 5A9, Canada
2
Canadian Centre for Rural and Agricultural Health, University of Saskatchewan, Saskatoon, SK S7N 2Z4, Canada
3
Department of Medicine, University of Saskatchewan, Saskatoon, SK S7N 0X8, Canada
4
Electrical Safety Research Group, National Institute of Occupational Safety and Health, Umezono Kiyose, Tokyo 204-0024, Japan
5
Department of Mechanical Engineering, University of Saskatchewan, Saskatoon, SK S7N 5A9, Canada
*
Author to whom correspondence should be addressed.
Atmosphere 2025, 16(1), 87; https://doi.org/10.3390/atmos16010087
Submission received: 22 December 2024 / Revised: 9 January 2025 / Accepted: 13 January 2025 / Published: 15 January 2025
(This article belongs to the Special Issue Electrostatics of Atmospheric Aerosols (2nd Edition))

Abstract

:
Airborne dust is an important contaminant affecting the health and the environment, and a crucial concern in many workplaces such as animal facilities and potash mines. One of the techniques used for dust control is electrostatic particle ionization (EPI). This technology has been proven effective in reducing airborne dust; however, it has downsides, such as the generation of ozone and corrosion of electrodes. Thus, this study tested a corrosion-resistant carbon-fiber discharge electrode and compared it with electrodes commonly used in EPI systems, that is, stainless-steel and tungsten electrodes, in terms of collection efficiency for potash dust and wheat flour (representative of livestock dust), ozone production, and power consumption. The carbon-fiber electrode performed comparably to stainless-steel electrodes, particularly for potash dust, and performed better than the tungsten electrode in terms of dust collection efficiency. Moreover, it had the lowest energy consumption and generated the least amount of ozone. However, because of the limitations of this study (e.g., fewer samples, low air velocity, controlled conditions, and the use of wheat flour instead of livestock dust), tests under real barn or mining conditions are necessary to confirm the results.

1. Introduction

Airborne dust is an important issue in many workplaces such as livestock facilities and potash mines. In animal buildings, dust mainly originates from animal skin/feathers, feed, manure, and litter and contains approximately 85% organic material [1]. Dust in potash mines is generated during blasting, drilling, crushing, grinding, drying, loading, and transportation [2,3] and consists of approximately 90–95% potassium chloride and 3–10% sodium chloride [2]. Air exhausted from potash mines is normally acidic [2].
Total dust concentrations measured in swine barns in eastern Canada ranged from 0.3 to 9.6 mg m−3 [4], whereas the average total dust concentration measured in floor-based poultry houses in the Canadian Prairies was 9.6 mg m−3 [5]. In Saskatchewan potash mines, the average total dust concentrations in exhaust air ranged from 10 to 20 mg m−3; however, in processes such as drying, levels can reach as high as 10,000 mg m−3 [2]. These values exceed the exposure limits set in these workplaces. In eastern Canada, specifically Ontario, the occupational exposure limit for total poultry dust is set at 5 mg m−3 [6]. The 8-h time-weighted average (TWA) exposure limit recommended by the Occupational Safety and Health Administration (OSHA) for total dust is 15 mg m−3 [7]. Several studies have indicated high occurrences of respiratory problems (e.g., chronic cough, bronchitis, and shortness of breath) among workers in animal barns and potash mines [5,8,9,10,11]. Thus, reducing the airborne dust concentrations is crucial to the health of those who work in these environments as well as to the productivity and sustainability of these industries.
The commonly used method for controlling airborne dust in animal-rearing facilities and potash mines is water spraying. This technique has been found to be effective in reducing dust in livestock facilities; however, it can increase ammonia and odor concentrations [12] as well as humidity [13]. High moisture levels in livestock facilities can potentially increase microbial concentrations and the risk of infectious diseases [14]. Although pure water is primarily used as the spray liquid, a mixture of water and oil is also used to enhance dust suppression [15,16]; however, the addition of oil may cause floors to become slippery and difficult to clean [17]. The use of air–water spraying systems and the addition of wetting or active/foaming agents to water have been found more effective in controlling dust emission in underground mines [18]. However, the effectiveness of the spraying technique can be easily affected by the atomization of the spray solution, and the chemicals used as dust suppressants can threaten workers’ health as they may contain toxic or carcinogenic ingredients [18].
Recently, electrostatic particle ionization (EPI) has been tested for the removal of airborne dust from animal spaces [19,20,21,22]. Electrostatic particle ionizers work similarly to air ionizers, which are used as air purifiers for indoor environments (e.g., classrooms and offices) [23,24,25]. These systems consist of a high-voltage power supply and discharge electrodes or corona points (e.g., metallic wires or needles). The discharge electrodes are connected to the power supply to generate corona discharge that ionizes air molecules. The ions generated subsequently attach to airborne particles (e.g., dust and soot), thereby imparting a net charge on the surfaces of the particles. The charged particles attach to walls and other surfaces (normally, electrically grounded) and are subsequently removed by scraping or wiping down [20]. The charged particles also attach to neutral particles, which make them larger and easier to settle [20]. The collection efficiency of the EPI systems is affected by factors such as applied voltage, air flow rate, electrode design/geometry, relative humidity, and particle size, distribution, composition, and concentration [26,27].
Previous studies [19,20,21,22,28] have achieved up to 50% reduction in total dust from animal buildings using EPI systems. However, although the EPI systems have been found to be effective in removing dust, they generate ozone as a byproduct of air ionization. Ambient ozone can irritate airways and cause respiratory symptoms, such as cough, shortness of breath, and bronchitis [29]. Cambra-Lopez et al. [22] smelled ozone generated from an EPI system operating in a poultry house when ventilation rates were low. In addition, the high moisture levels and the acidic gases produced from manure decomposition (e.g., hydrogen sulfide) in animal buildings can corrode the electrodes over time [30]. Thus, the objective of this study was to test a discharge electrode that is corrosion-resistant and generates low ozone. Shin et al. [31] compared four types of discharge electrodes: a 50 µm tungsten wire, a 100 µm tungsten wire, a 16 µm aluminum foil, and 5–10 µm carbon fibers, which are corrosion-resistant materials. The authors achieved the highest particle collection efficiency and measured the least amount of ozone using the carbon-fiber electrodes. Kim et al. [32] used carbon-fiber discharge electrodes for the removal of particles from corrosive gases produced in a semiconductor plant. Thus, based on the aforementioned related studies, this study tested a carbon-fiber electrode and compared it with stainless-steel and tungsten electrodes, the electrodes commonly used in EPI systems [19,20,21,22,33,34,35,36], in terms of collection efficiency, ozone production, and power consumption, using wheat flour as a representative of livestock dust. Based on a literature review, EPI systems with carbon-fiber discharge electrodes have not yet been tested in livestock facilities. In addition, because EPI systems have not yet been tested in potash mines, the tests we performed on wheat flour were also conducted on potash dust. Katz [37] indicated that the performance of EPI systems may differ on different types of dust, as properties such as resistivity, dust chemical composition, and particle size distribution can affect the effectiveness of the technology. The results of this study can provide insights into the potential application of EPI systems with carbon-fiber electrodes in livestock facilities and potash mines.
The remainder of this paper is organized as follows: Section 2 describes the materials and methods, Section 3 and Section 4 present and discuss the results of the study, respectively, and Section 5 concludes this paper.

2. Materials and Methods

2.1. Electrostatic Particle Ionization System

The EPI system used in this study consisted of a discharge electrode, collection surfaces, and a high-voltage power supply (Figure 1). The discharge electrode was connected to a high-voltage DC power supply (APM 30KIPNX; Kasuga Denki, Inc., Kanagawa, Japan), which had a maximum output voltage of ±30 kV and an output current of <2 mA, whereas the collection surfaces were electrically grounded by connecting them to the ground port of the power supply. The discharge electrode and two collection surfaces were housed in an acrylic chamber with dimensions of 0.45 m × 0.30 m × 0.30 m (L × W × H). The discharge electrode consisted of 0.025 m long, sharp-pointed pins equally placed at 0.01 m distance on a 0.36 m long and 0.025 m wide brass rod (Figure 2), and was suspended at the middle of the chamber, along the direction of the air flow. The two collection surfaces, which were made of stainless-steel plates (gauge 14, 0.43 m long, and 0.25 m wide), were placed 0.05 m away from either side of the discharge electrode (Figure 1). All the metal parts of the setup were electrically grounded for safety purposes.
Four types of discharge electrodes were tested: carbon fiber (round pins), stainless steel (round and square pins), and tungsten (round pins). As mentioned in the Introduction section, this study tested a carbon-fiber electrode because of its low ozone generation, chemical resistance, and suitability for corrosive environments, based on the reports of other studies [31,32]. The carbon-fiber electrode was compared with stainless-steel and tungsten electrodes, the discharge electrodes commonly used in EPI systems [19,20,21,22,33,34,35,36]. The electrodes were compared in terms of collection efficiency, ozone generation, and power consumption. Pins with round and square cross-sections were also tested to observe the effects of electrode geometry/shape (e.g., sharp edges) on dust collection efficiency. Lagarias [38] pointed out that sharp-edged electrodes produce more corona discharge. The pins with round cross-sections had a diameter of 1.6 mm, whereas those with square cross-sections had a side length of 1.4 mm; thus, both round and square pins had similar cross-sectional areas.

2.2. Experimental Dust

As mentioned earlier, the different discharge electrodes were compared using two types of dust: wheat flour and potash dust.
Wheat flour, which is derived from wheat, a common animal feed ingredient [39], was selected as the representative for livestock dust. Animal feed is one of the sources of dust in animal houses [1]. Chai et al. [40] used cornstarch to simulate poultry dust; however, cornstarch was not used in this study due to an issue encountered in using cornstarch with the dust disperser. In this study, a commercially available wheat flour was sieved using a mechanical sieve to collect and use only the smaller-size fractions to obtain a particle size distribution similar to that of the dust found in livestock facilities. As shown in Table 1, the particle size distribution (PSD) and mass median diameter (MMD) of the sieved wheat flour, which were measured using a particle analyzer (Malvern Mastersizer S; Malvern Instruments Ltd., Malvern, UK; accuracy: ±2% on volume median diameter), were within the reported PSD and MMD of airborne dust in livestock facilities.
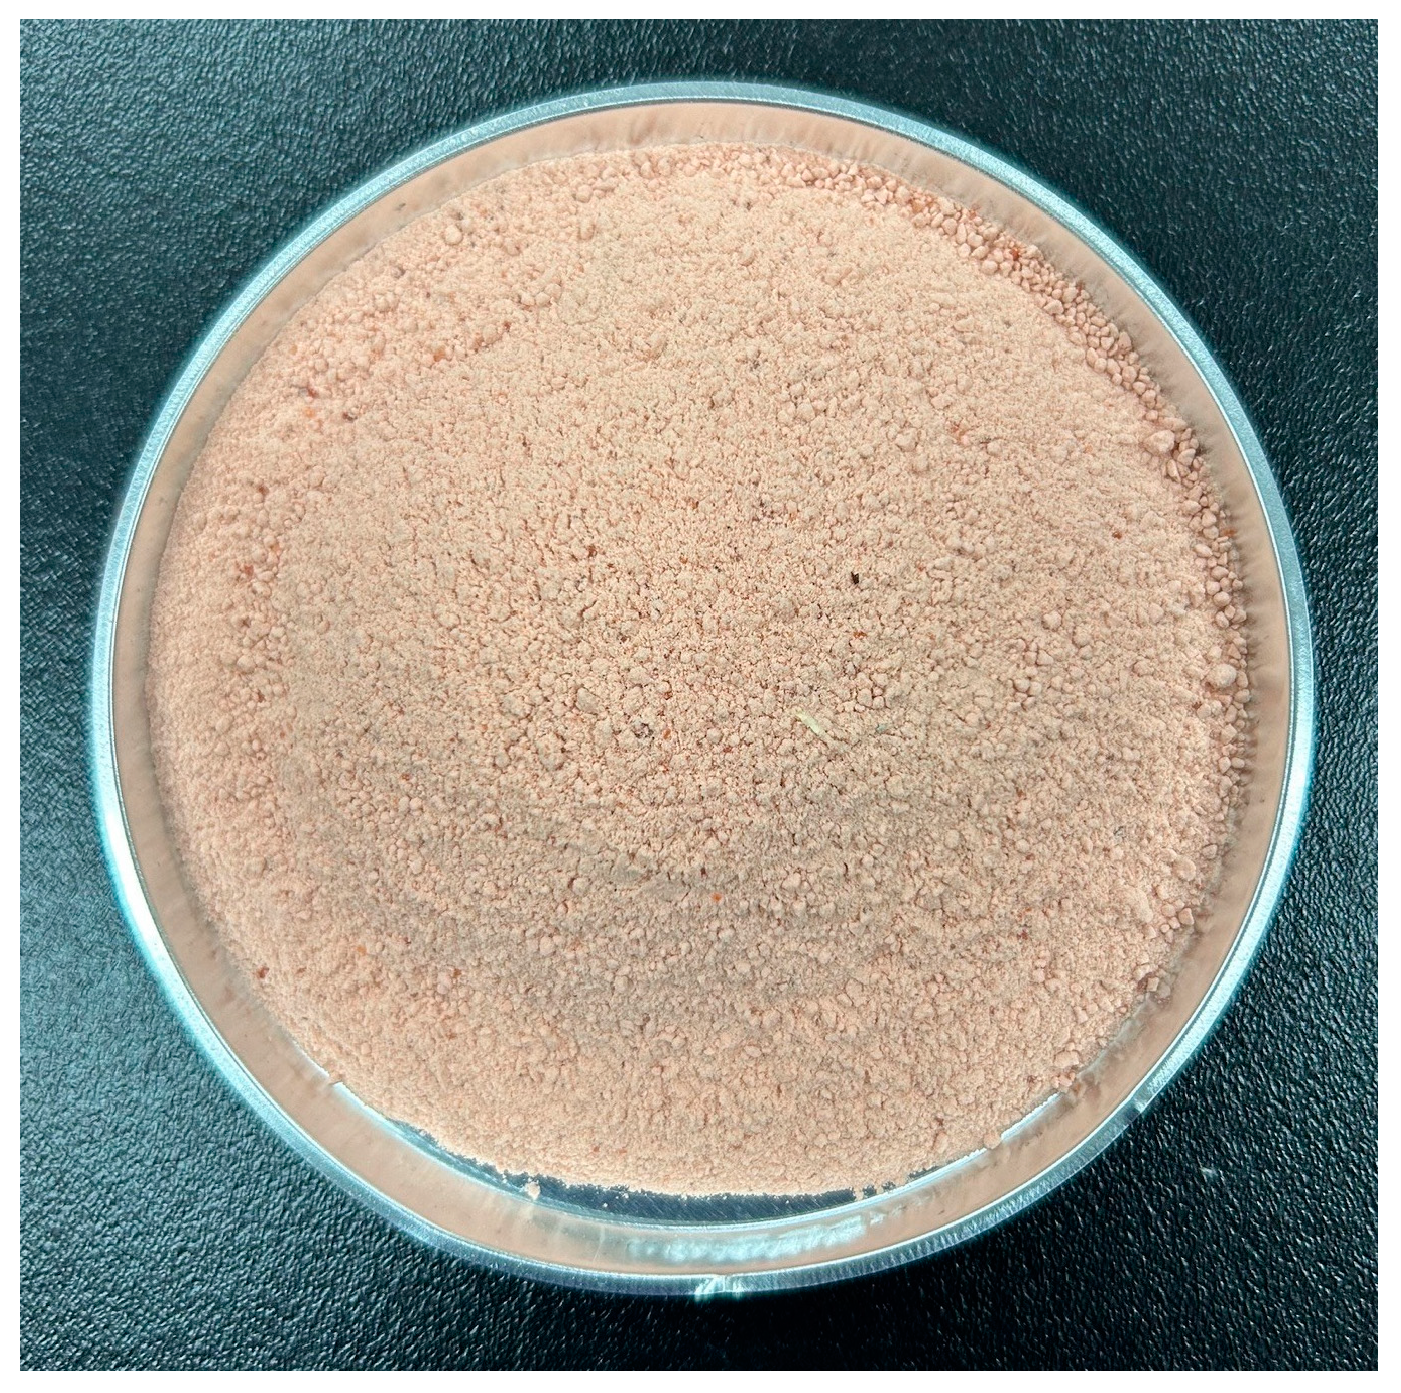
The potash dust (Figure 3) used in this study was collected from a local mine in Saskatchewan, Canada. Similar to wheat flour, the potash dust was also sieved using a mechanical sieve to collect and use only the smaller size fractions to obtain a particle size distribution similar to that of the dust found in potash mines. Results of a PSD analysis conducted on the sieved potash dust showed that 10% of the sieved sample (by mass) had diameters < 10 µm, and its MMD was 23.3 µm.

2.3. Aerosolization of Dust Samples

The sieved dust samples were loaded into the solid material reservoir of an RBG 1000i dust disperser (Palas GmbH, Karlsruhe, Germany). Subsequently, the dust particles were aerosolized inside the acrylic chamber described in Section 2.1 by passing air from a compressor through the dispersing head of the dust disperser (Figure 1). The exhaust of the dust disperser was connected to the inlet port of the chamber using a stainless-steel tube, which was electrically grounded to eliminate the electrostatic charges generated during dispersion. In addition, the air used in the experiments passed through an air filter (Filtered Air Supply 3074B; TSI Inc., Shoreview, MN, USA) to supply clean and dry air to the dust disperser. The airflow to the dust disperser was maintained at 60 kPa using the built-in flow regulator in the air filter to satisfy the 50 kPa minimum pre-pressure requirement of the dust disperser. This resulted in a total flow rate of 2 m3 h−1; however, only a portion of this was sent to the chamber to achieve 25 air changes per hour (ACH) in the chamber. This value was within the ranges of ACH recommended for livestock and mining operations [45,46]. The concentrations of wheat flour and potash dust inside the chamber were maintained at approximately 8 mg m−3 (total dust) by adjusting the feed rate in the dust disperser. This concentration was within the range of airborne dust concentrations measured in animal buildings [4,5]. Although 8 mg m−3 is lower than the concentrations generally observed in potash mines, the same value was used for both wheat flour and potash dust to eliminate the influence of dust concentration on the collection efficiencies of the EPI system when comparing the two types of dust, as efficiency generally decreases with increasing concentration [47]. The dusty air from the chamber was sent to a fume hood through rubber tubing.

2.4. Measurements

The dust concentrations were measured continuously at the exhaust of the chamber (see Figure 1) using a DustTrak monitor (DustTrak DRX Aerosol Monitor 8533; TSI Inc., Shoreview, MN, USA; resolution: 0.001 mg m−3). The DustTrak monitor measured PM1, PM2.5, PM4, PM10, and total dust concentrations at a sampling rate of 3 L min−1 (flow accuracy: ±5%) and averaged and logged data every 15 s. The air exhausted from the DustTrak was directed to the fume hood. The power consumption was measured using a digital power meter (Watts Up? Pro; Vernier Software and Technology, Beaverton, OR, USA; accuracy: ±1.5%; resolution: 0.1 W; minimum detection limit: 0.5 W). Ozone was measured at the exhaust of the chamber using a digital ozone sensor (SPEC sensors, Fremont, CA, USA; accuracy: ±15%; resolution: 20 ppb) under voltage levels of ±10 kV.

2.5. Evaluation of EPI Performance

As mentioned in Section 2.1, four types of discharge electrodes were tested: carbon fiber (round pins), stainless steel (round and square pins), and tungsten (round pins). The performance of the EPI system was also evaluated at various applied voltage levels: ±5.0, ±10.0, ±12.5, ±15.0, ±17.5, and ±20.0 kV for the wheat flour and ±10.0, ±15.0, and ±20.0 kV for the potash dust. The potash dust experiment was conducted at fewer voltage levels as it generally exhibited trends similar to those of the wheat flour, based on preliminary trials, suggesting that a more detailed evaluation might not be necessary. Table 2 presents the various operating and design conditions used in this study.
In each trial, the dust was dispersed inside the chamber for 15 min, initially, with the power supply turned off to allow the concentration inside the chamber to stabilize. After the 15 min initial stabilization period, the power supply was then turned on, starting at the lowest voltage (i.e., ±5 kV), for 3 min, then turned off again for 3 min to allow the concentration to return to the initial concentration (recovery period), and then turned on again for 3 min for the next voltage level (i.e., ±10 kV). This alternating off/on operation was repeated until the EPI system was tested at ±20 kV. The trials under negative and positive charging were run separately. The collection surfaces and chamber were manually cleaned after each run. Each trial was performed three times (three replicates).

2.6. Data and Statistical Analyses

The performance of the EPI system was evaluated by calculating its dust collection efficiency (CE) at each voltage level using Equation (1):
C E = C O F F     C O N   C O F F × 100 ,
where COFF is the average dust concentration (mg m−3) over the last 2 min of the stabilization or recovery period (power supply turned off) and CON is the average dust concentration (mg m−3) over the last 2 min of the period during which the power supply was operating at a certain voltage level. The off/on concentrations used in calculating the CE were the concentrations measured during consecutive off/on operations. For instance, for calculating the CE at 5 kV, COFF was the average concentration over the last 2 min of the stabilization period (the period immediately before turning on the power supply at 5 kV) and CON was the average concentration over the last 2 min of the period during which the power supply was operating at 5 kV. For calculating the CE at 10 kV, COFF was the average concentration over the last 2 min of the recovery period (the period immediately before turning on the power supply at 10 kV) and CON was the average concentration over the last 2 min of the period during which the ESP was operating at 10 kV.
The collection efficiencies of the EPI system under various conditions were compared using non-parametric tests, which are suitable for small size samples and non-normally distributed data. The Mann–Whitney test was used when comparing two means, such as between a positive and a negative voltage of same level, and the Kruskal–Wallis test was used when comparing more than two means, such as among the four types of electrodes [20]. The analyses were performed using SPSS (IBM SPSS Statistics 28.0.0.0). Differences between the control and treatment with p values < 0.05 were considered statistically significant.

3. Results

3.1. Collection Efficiency

Figure 4 shows how the concentrations increased or decreased as the power supply was turned off or on, respectively. The figure shows that the higher the applied voltage (either positive or negative), the lower the dust concentration measured at the exhaust of the chamber.
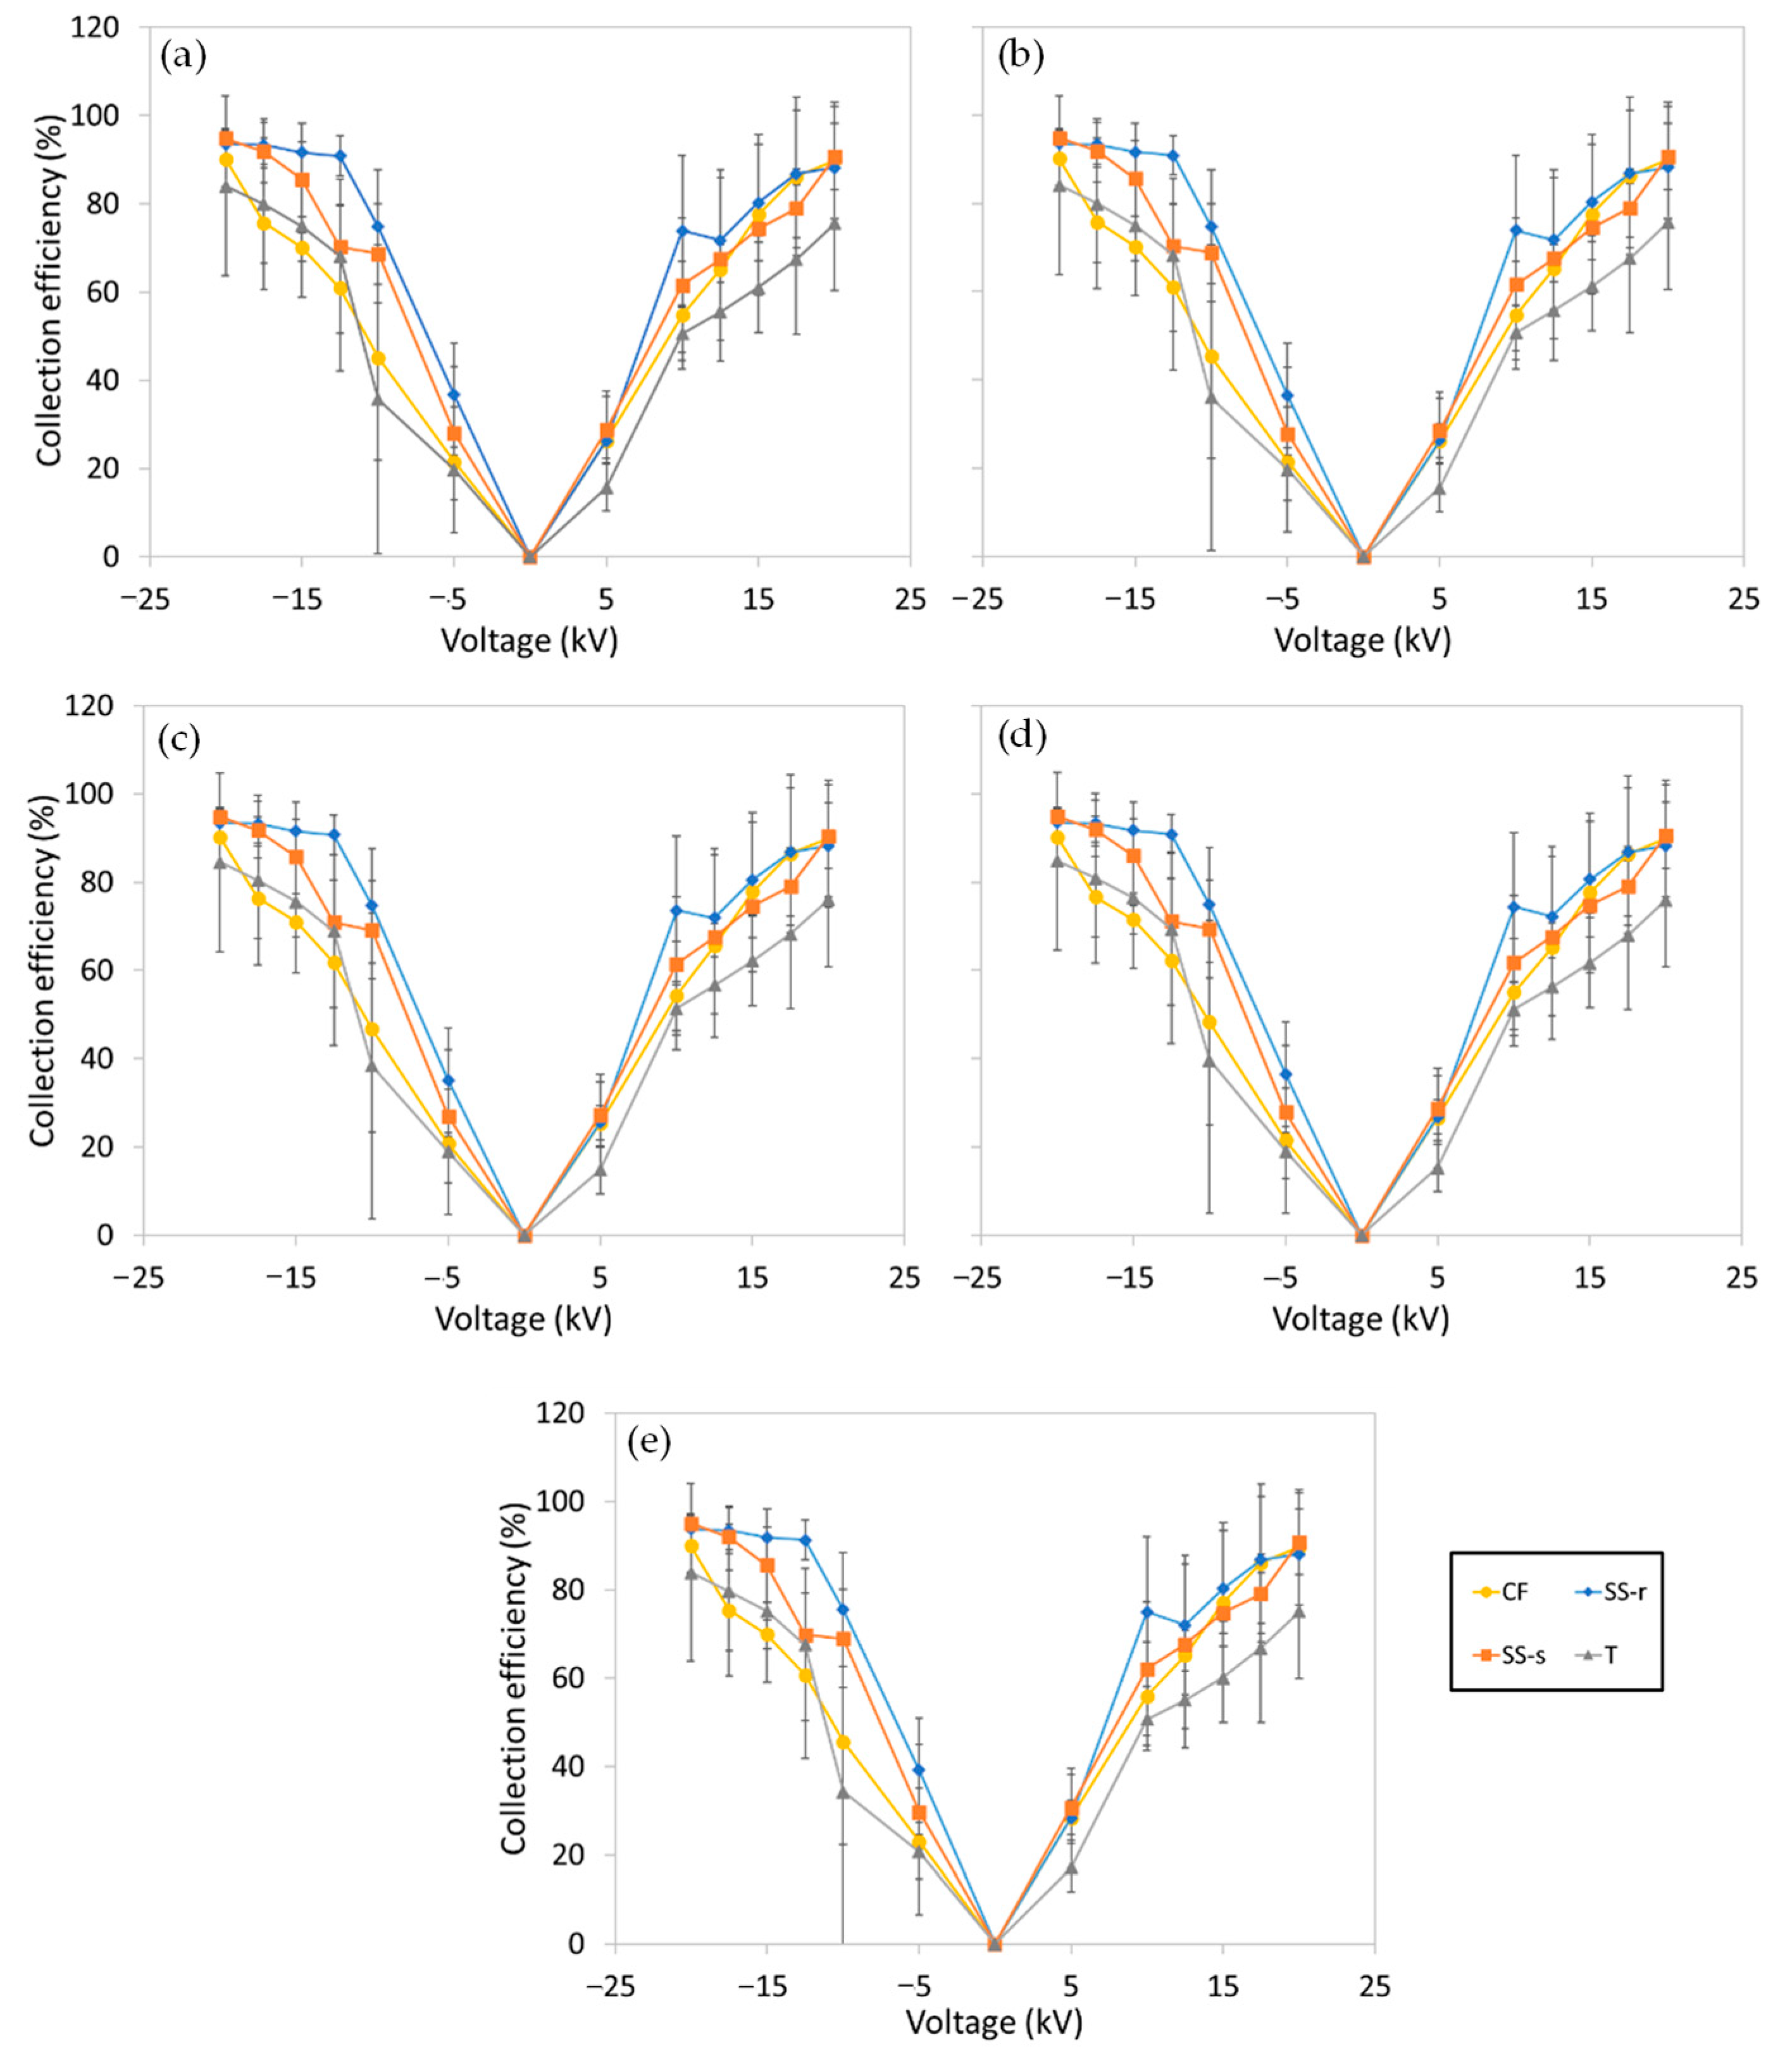
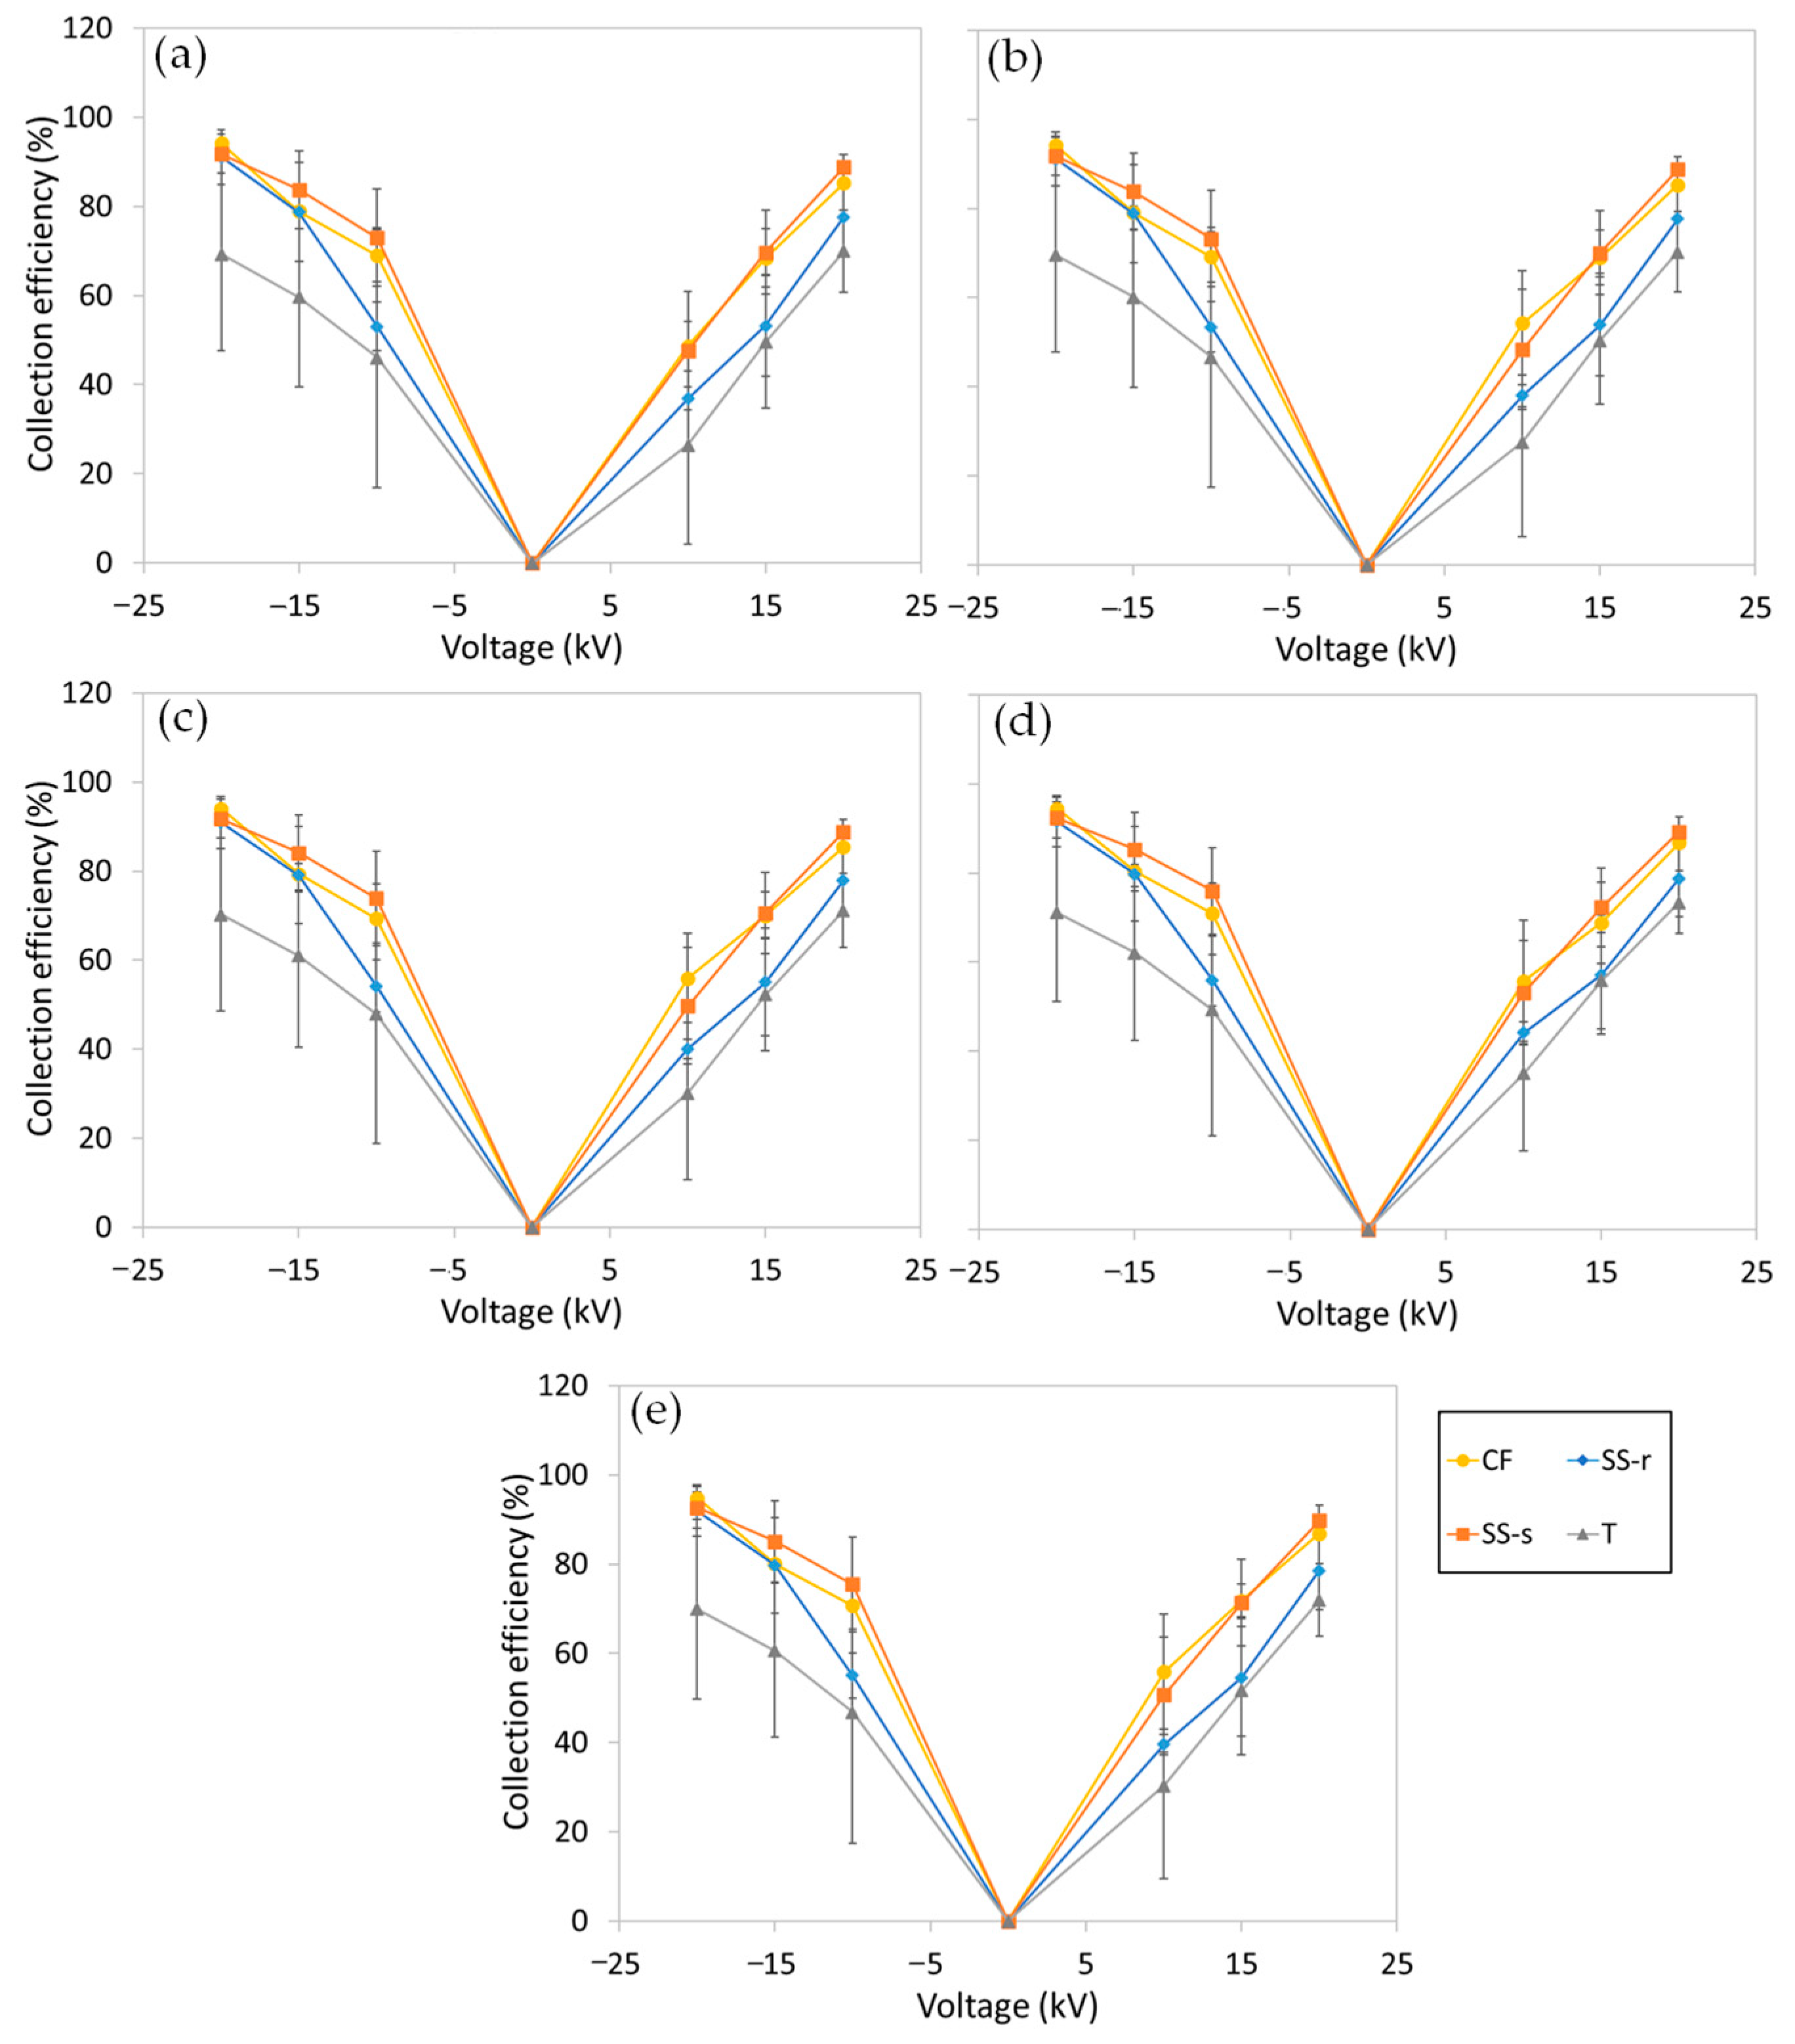
The collection efficiencies of the EPI system with the different discharge electrodes increased as the applied voltage was increased for both wheat flour (Figure 5) and potash dust (Figure 6). However, at higher voltage levels, the rate of increase decreased, particularly under negative charging. This can be clearly seen in tests using the round stainless-steel electrode under negative charging for wheat flour, in which the efficiency started to level off at −12.5 kV (Figure 5). Although the average collection efficiencies of the EPI system for both wheat flour and potash dust were slightly higher under negative charging than positive charging across all electrode types, the differences were not significant (p > 0.05). Interestingly, the collection efficiencies were similar for the various size fractions of wheat flour and potash dust.
For wheat flour, the total dust collection efficiencies of the EPI system with the carbon-fiber, round stainless-steel, square stainless-steel, and tungsten electrodes ranged from 23% to 90%, 39% to 94%, 30% to 95%, and 21% to 84%, respectively, as the applied voltage was increased from −5 to −20 kV, and from 28% to 90%, 28% to 88%, 31% to 91%, and 17% to 74%, respectively, as the applied voltage was increased from +5 to +20 kV. The efficiency of the EPI system with the round stainless-steel electrode was significantly higher (p < 0.05) than those with the carbon-fiber and tungsten electrodes but not significantly different (p > 0.05) from that with the square stainless-steel electrode. The system with the tungsten electrode exhibited the lowest efficiency; however, it was not significantly different (p > 0.05) from that with the carbon-fiber electrode. Under positive charging, the round stainless-steel electrode exhibited the highest efficiency, whereas the tungsten electrode exhibited the lowest efficiency; however, the differences in the efficiencies were not statistically significant (p > 0.05) across all types of electrodes.
For potash dust, the total dust collection efficiencies of the EPI system with the carbon-fiber, round stainless-steel, square stainless-steel, and tungsten electrodes ranged from 71% to 95%, 55% to 92%, 76% to 93%, and 47% to 70%, respectively, as the applied voltage was increased from −10 to −20 kV, and from 56% to 87%, 40% to 79%, 51% to 90%, and 30% to 72%, respectively, as the applied voltage was increased from +10 to +20 kV. Under negative charging, the efficiencies using the square stainless-steel, round stainless-steel, and carbon-fiber electrodes were not significantly different (p > 0.05); however, the efficiency of the system with the tungsten electrode was significantly lower (p < 0.05) than those with the other three electrodes. Under positive charging, the efficiencies of the EPI system with square stainless-steel and carbon-fiber electrodes were comparable. In addition, those for round stainless-steel and tungsten electrodes were also comparable, but slightly lower than those for the other two electrodes. However, the efficiencies of the EPI system were not statistically different (p > 0.05) across all types of electrodes.
Moreover, the collection efficiencies of the EPI system between wheat flour and potash dust at a total dust concentration of 8 mg m−3 were not significantly different (p > 0.05) for each electrode type.

3.2. Power Consumption

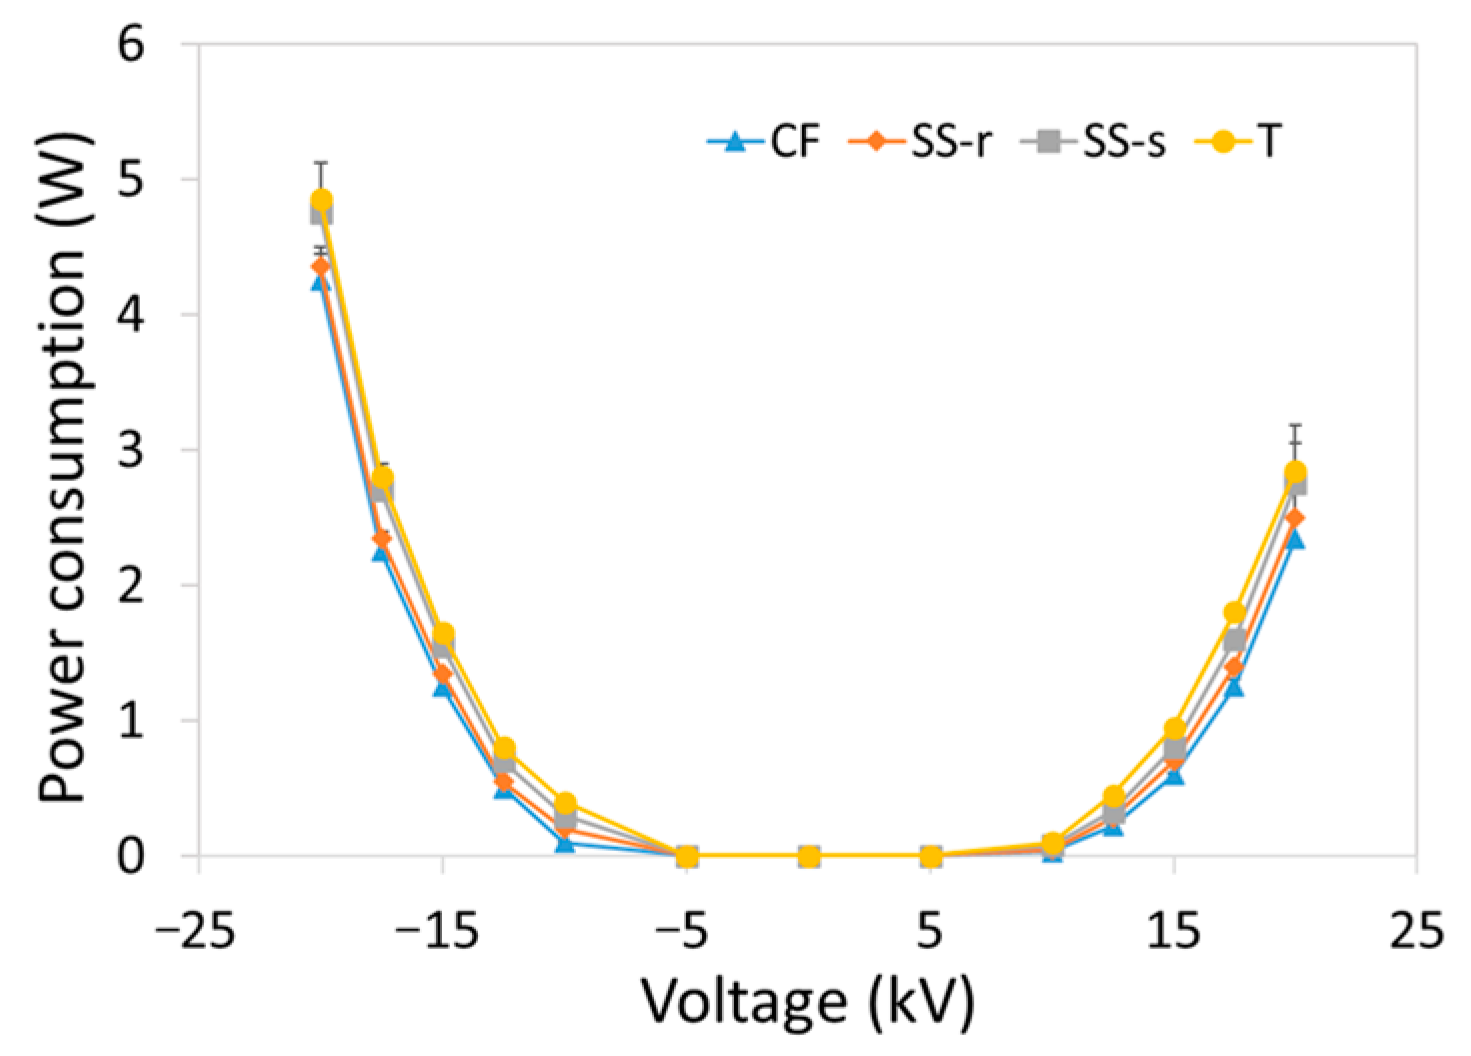
Power consumption increased with the applied voltage (Figure 7). In all electrode types, the power consumption was relatively higher under negative voltages than positive voltages. Although the tungsten electrode had the highest power consumption (4.85 W at −20 kV) and the carbon electrode had the smallest power consumption (4.25 W at −20 kV), no significant differences were observed among all electrode types under both positive and negative voltages (p > 0.05).

3.3. Ozone Production

Negative charging generated relatively higher amounts of ozone (Figure 8). An applied voltage of +10 kV generated 25 to 288 ppb of ozone, whereas a −10 kV voltage produced 63 to 481 ppb of ozone. The tungsten electrode produced the largest amount of ozone under both positive and negative voltages; however, the values were not significantly different (p > 0.05) than those generated by the square stainless-steel electrode. The carbon-fiber electrode generated the lowest amount of ozone at both positive and negative voltages; however, the amount it produced at +10 kV was not significantly different (p > 0.05) than that of the round stainless-steel electrode at the same voltage.

3.4. Comparison of the Different Electrodes Based on the Various Metrics

Table 3 presents the average collection efficiency, power consumption, and amount of ozone generated by the EPI system with the different discharge electrodes. These values are the average of the values obtained under various positive and negative voltages. Table 3 clearly shows that the carbon-fiber electrode had the smallest power consumption and generated the least amount of ozone, whereas the tungsten electrode had the highest power consumption, generated the largest amount of ozone, and had the lowest collection efficiency for both types of dust. The round stainless-steel electrode (although not significantly different from the square stainless-steel electrode; Section 3.1) achieved the highest collection efficiency for wheat flour, whereas the square stainless-steel electrode (although not significantly different from the carbon-fiber electrode; Section 3.1) obtained the highest collection efficiency for potash dust.

4. Discussion

In all electrode types and in both wheat flour and potash dust, the collection efficiencies were higher at higher voltage levels and negative polarities. This is because increasing the voltage increases the field strength, ion formation, and particle migration velocity, which increases the collection efficiency [48,49]. However, although the removal efficiency increased with applied voltage, it tended to plateau as the voltage was further increased; this is clearly exhibited by the round stainless-steel electrode under negative charging with wheat flour (Figure 5). This phenomenon was also reported by Jedrusik and Swierczok [50]. The saturation charge might have already been attained at the voltage level at which the collection efficiency started to level off [51]. The saturation charge is the maximum particle charge at which no additional charging occurs on the particle. This implies that operating beyond this optimum voltage may be considered futile and a waste of energy. Chai et al. [40] observed an increase in the collection efficiency when the applied voltage was increased from ±10 to ±30 kV; however, when the voltage was further increased to ±60 kV, the efficiency tended to decrease. The authors pointed out that the decrease in efficiency at higher voltages was probably due to the re-entrainment of the captured dust particles back to the air stream, which was caused by the corona wind produced at elevated voltages. The relatively higher removal efficiencies under negative charging could be caused by the higher ionic mobility of negative ions, which leads to higher collection efficiency [52]. However, negative charging and higher voltages resulted in higher power consumption (Figure 7) and ozone formation (Figure 8) due to higher corona formation [53,54], consistent with the findings of other studies [40,55].
The average collection efficiencies obtained in this study were relatively higher than those obtained by Chai et al. [40] (i.e., 48–62% and 37–79% for voltages ranging from +10 to +60 kV and −10 to −60 kV, respectively) using cornstarch at comparable concentrations, probably because of the lower air speed employed in this study. The similar collection efficiencies for all particle sizes indicates that both field charging, which is dominant for larger particles (≥2 µm), and diffusion charging, which is dominant for smaller particles (≤2 µm) [46], were significant mechanisms in the EPI system. Other studies [20,56,57] also made the same observation.
Both the round and square stainless-steel electrodes exhibited superior performances for wheat flour, whereas the square stainless-steel and carbon-fiber electrodes exhibited superior performances for potash dust. The tungsten electrode performed poorly for both types of dust and had the highest power consumption and ozone production. Shin et al. [31] explained that a low collection efficiency can be caused by several factors, including onset voltage, which is dependent on electrode material, as suggested by the Townsend mechanism [58]; however, results of some studies disagree with this dependence [59]. In addition, the consistently high performance of the square stainless-steel electrode could be due to its sharp edges, which probably produced more corona discharge [38,60].
The carbon-fiber electrode generated the least amount of ozone and had the lowest power consumption. At voltage levels of ±10 kV, it produced less than 50 ppb of ozone, which is lower than the 100 ppb 8-h TWA exposure limit set by OSHA for workplaces [61]. All the other electrodes tested exceeded this limit, except round stainless-steel at +10 kV. Kim et al. [55] measured 20 ppb of ozone from carbon-fiber electrodes at a voltage of −7 kV. Cardello et al. [62] measured higher ozone concentrations from stainless-steel electrode wires than from silver wires. The authors explained that ozone formation is related to the enthalpy of oxide formation at the surface of the discharge electrode, which can be different between material types.

5. Conclusions

A carbon-fiber electrode was compared with discharge electrodes commonly used in EPI systems (i.e., stainless-steel (with round and square pins) and tungsten electrodes) in terms of collection efficiencies for wheat flour and potash dust, power consumption, and ozone generation. Both the round and square stainless-steel electrodes exhibited superior performances for wheat flour, whereas the square stainless-steel and carbon-fiber electrodes exhibited superior performances for potash dust. The tungsten electrode performed poorly for both types of dust. In addition, the carbon-fiber electrode had the lowest power consumption and generated the least amount of ozone, whereas the tungsten electrode had the highest power consumption and generated the largest amount of ozone. These results indicate that the EPI system with the carbon-fiber electrode performed comparably with those with stainless-steel electrodes, in terms of collection efficiency, particularly for potash dust. The carbon-fiber electrode may not be as effective as the stainless-steel electrodes for the removal of wheat flour (or livestock dust); however, its low energy consumption, low ozone production, and high resistance to corrosion are excellent trade-offs. Therefore, the results of this study can provide insights into the potential application of EPI systems with carbon-fiber electrodes in livestock facilities and potash mines. However, because of the limitations of this study (e.g., fewer samples, low air velocity, controlled conditions, and the use of wheat flour instead of livestock dust), tests under real barn or mining conditions (where particle size distribution and composition may be different than those considered in this study and conditions such as air flowrate, relative humidity, and concentrations may vary) are necessary to confirm the results.

Author Contributions

Conceptualization, L.Z. and M.M.; methodology, L.Z. and M.M.; validation, M.M; formal analysis, M.M.; investigation, M.M. and M.T.; resources, S.K. and K.C.; data curation, M.M; writing—original draft preparation, M.M.; writing—review and editing, S.K., L.Z., K.C., H.G. and M.T.; visualization, M.M.; supervision, L.Z.; project administration, L.Z.; funding acquisition, L.Z. All authors have read and agreed to the published version of the manuscript.

Funding

This research was funded by Collaborative Innovation Development Grant from the Saskatchewan Health Research Foundation (SHRF) and Agriculture Development Fund from Saskatchewan Ministry of Agriculture (Project #20170018).

Institutional Review Board Statement

Not applicable.

Informed Consent Statement

Not applicable.

Data Availability Statement

The data presented in this study are available on request from the corresponding author, the data are not publicly available due to privacy.

Conflicts of Interest

The authors declare no conflicts of interest.

References

  1. Hartung, J.; Saleh, M. Composition of dust and effects on animals. Landbauforsch Volk 2007, 308, 111–116. [Google Scholar]
  2. Klein, M.O.; Reid, K.W.; Goldsmith, E.L. Air emissions at KCl facilities. In Pollution Control in Fertilizer Production; Hodge, C.A., Popovici, N.N., Eds.; Marcel Dekker, Inc.: New York, NY, USA, 1994. [Google Scholar]
  3. Isaevich, A.; Semin, M.; Levin, L.; Ivantsov, A.; Lyubimova, T. Study on the dust content in dead-end drifts in the potash mines for various ventilation modes. Sustainability 2022, 14, 3030. [Google Scholar] [CrossRef]
  4. Pilote, J.; Létourneau, V.; Girard, M.; Duchaine, C. Quantification of airborne dust, endotoxins, human pathogens and antibiotic and metal resistance genes in Eastern Canadian swine confinement buildings. Aerobiologia 2019, 35, 283–296. [Google Scholar] [CrossRef]
  5. Kirychuk, S.P.; Dosman, J.A.; Reynolds, S.J.; Willson, P.; Senthilselvan, A.; Feddes, J.J.; Classen, H.L.; Guenter, W. Total dust and endotoxin in poultry operations: Comparison between cage and floor housing and respiratory effects in workers. J. Occup. Environ. Med. 2006, 48, 741–748. [Google Scholar] [CrossRef] [PubMed]
  6. Government of Ontario. Current Occupational Exposure Limits for Ontario Workplaces Under Regulation 833. 2022. Available online: https://www.ontario.ca/page/current-occupational-exposure-limits-ontario-workplaces-under-regulation-833 (accessed on 13 December 2024).
  7. Occupational Safety and Health Administration (OSHA). Particulates Not Otherwise Regulated, Total and Respirable Dust (PNOR). 2023. Available online: https://www.osha.gov/chemicaldata/801 (accessed on 13 December 2024).
  8. Markham, J.W.; Tan, L.K. Concentrations and health effects of potash dust. Am. Ind. Hyg. Assoc. J. 1981, 42, 671–674. [Google Scholar] [CrossRef]
  9. Graham, B.L.; Dosman, J.A.; Cotton, D.J.; Weisstock, S.R.; Lappi, V.G.; Froh, F. Pulmonary function and respiratory symptoms in potash workers. J. Occup. Med. 1984, 26, 209–214. [Google Scholar]
  10. Rimac, D.; Macan, J.; Varnai, V.M.; Vucemilo, M.; Matković, K.; Prester, L.; Orct, T.; Trosić, I.; Pavicić, I. Exposure to poultry dust and health effects in poultry workers: Impact of mould and mite allergens. Int. Arch. Occup. Environ. Health 2010, 83, 9–19. [Google Scholar] [CrossRef]
  11. Viegas, S.; Faísca, V.M.; Dias, H.; Clérigo, A.; Carolino, E.; Viegas, C. Occupational exposure to poultry dust and effects on the respiratory system in workers. J. Toxicol. Environ. Health Part A 2013, 76, 230–239. [Google Scholar] [CrossRef]
  12. Ogink, N.; van Harn, J.; van Emous, R.; Ellen, H. Top layer humidification of bedding material of laying hen houses to mitigate dust emissions: Effects of water spraying on dust, ammonia and odor emissions. In Proceedings of the 2012 IX International Livestock Environment Symposium (ILES IX), Valencia, Spain, 8–12 July 2012; Available online: https://elibrary.asabe.org/abstract.asp?aid=41632 (accessed on 13 December 2024).
  13. Urso, P.M.; Turgeon, A.; Ribeiro, F.R.B.; Smith, Z.K.; Johnson, B.J. Review: The effects of dust on feedlot health and production of beef cattle. J. Appl. Anim. Res. 2021, 49, 133–138. [Google Scholar] [CrossRef]
  14. Xiong, Y.; Meng, Q.; Gao, J.; Tang, X.; Zhang, H. Effects of relative humidity on animal health and welfare. J. Integr. Agric. 2017, 16, 1653–1658. [Google Scholar] [CrossRef]
  15. Banhazi, T.M.; Saunders, C.; Nieuwe, N.; Lu, V.; Banhazi, A. Oil spraying as an air quality improvement technique in livestock buildings: Development and utilisation of a testing device. Aust. J. Mech. Eng. 2011, 8, 169–180. [Google Scholar] [CrossRef]
  16. Mehdizadeh, S.A.; Banhazi, T.M. Evaluating droplet distribution of spray-nozzles for dust reduction in livestock buildings using machine vision. Int. J. Agric. & Biol. Eng. 2015, 8, 58–64. [Google Scholar]
  17. Tan, Z.; Zhang, Y. A review of effects and control methods of particulate matter in animal indoor environments. J. Air Waste Manag. Assoc. 2004, 54, 845–854. [Google Scholar] [CrossRef] [PubMed]
  18. Huang, R.; Tao, Y.; Chen, J.; Li, S.; Wang, S. Review on dust control technologies in coal mines of China. Sustainability 2024, 16, 4038. [Google Scholar] [CrossRef]
  19. Jerez, S.B.; Mukhtar, S.; Faulkner, W.; Casey, K.D.; Borhan, M.S.; Smith, R.A. Evaluation of electrostatic particle ionization and biocurtain™ technologies to reduce air pollutants from broiler houses. Appl. Eng. Agric. 2013, 29, 975–984. [Google Scholar]
  20. Martel, M.; Kirychuk, S.; Predicala, B.; Bolo, R.; Yang, Y.; Thompson, B.; Guo, H.; Zhang, L. Improving air quality in broiler rooms using an electrostatic particle ionization system. J. ASABE 2023, 66, 887–896. [Google Scholar] [CrossRef]
  21. Bist, R.B.; Yang, X.; Subedi, S.; Ritz, C.W.; Kim, W.K.; Chai, L. Electrostatic particle ionization for suppressing air pollutants in cage-free layer facilities. Poult. Sci. 2024, 1034, 103494. [Google Scholar] [CrossRef]
  22. Cambra-López, M.; Winkel, A.; van Harn, J.; Ogink, N.W.; Aarnink, A.J. Ionization for reducing particulate matter emissions from poultry houses. Trans. ASABE 2009, 52, 17571771. [Google Scholar] [CrossRef]
  23. Pushpawela, B.; Jayaratne, R.; Nguy, A.; Morawska, L. Efficiency of ionizers in removing airborne particles in indoor environments. J. Electrostat. 2017, 90, 79–84. [Google Scholar] [CrossRef]
  24. Ren, C.; Haghighat, F.; Feng, Z.; Kumar, P.; Cao, S.J. Impact of ionizers on prevention of airborne infection in classroom. Build. Simul. 2023, 16, 749–764. [Google Scholar] [CrossRef]
  25. Romay, F.J.; Ou, Q.; Pui, D.Y.H. Effect of ionizers on indoor air quality and performance of air cleaning systems. Aerosol Air Qual. Res. 2024, 24, 230240. [Google Scholar] [CrossRef]
  26. Chen, Y.-T.; Lu, C.-L.; Lu, S.-J.; Lee, D.-S. Electrostatic precipitator design optimization for the removal of aerosol and airborne viruses. Sustainability 2023, 15, 8432. [Google Scholar] [CrossRef]
  27. Harmon, J.D.; Hoff, S.J.; Rieck-Hinz, A.M. Animal Housing—Electrostatic Precipitation Overview. Agriculture and Environment Extension Publications. 2014. Available online: http://lib.dr.iastate.edu/extension_ag_pubs/212 (accessed on 6 January 2025).
  28. Bist, R.B.; Yang, X.; Subedi, S.; Paneru, B.; Chai, L. Enhancing dust control for cage-free hens with electrostatic particle charging systems at varying installation heights and operation durations. AgriEngineering 2024, 6, 1747–1759. [Google Scholar] [CrossRef]
  29. Lippmann, M. Health effects of ozone: A critical review. JAPCA 1989, 39, 672–695. [Google Scholar] [CrossRef] [PubMed]
  30. Rosentrater, K. Laboratory analysis of an electrostatic dust collection system. Agric. Eng. Int. CIGR J. 2004. Manuscript BC 03 008. Available online: https://ecommons.cornell.edu/server/api/core/bitstreams/e9b836d9-17c8-42ee-91d5-ead9227fe5d9/content (accessed on 6 January 2025).
  31. Shin, D.H.; Woo, C.G.; Kim, H.J.; Kim, Y.J.; Han, B. Comparison of discharging electrodes for the electrostatic precipitator as an air filtration system in air handling units. Aerosol Air Qual. Res. 2019, 19, 671–676. [Google Scholar] [CrossRef]
  32. Kim, H.-J.; Han, B.; Kim, Y.-J.; Yoa, S.-J.; Oda, T. Integration of a nonmetallic electrostatic precipitator and a wet scrubber for improved removal of particles and corrosive gas cleaning in semiconductor manufacturing industries. J. Air Waste Manag. Assoc. 2012, 62, 905–915. [Google Scholar] [CrossRef]
  33. Rosentrater, K. Performance of an Electrostatic Dust Collection System In Swine Facilities. Agric. Eng. Int. CIGR J. 2003. Manuscript BC 03 003. Available online: https://pdfs.semanticscholar.org/44f9/7a41de9d0cf0d766bca5f4e75c38d963375c.pdf?_ga=2.261349773.1207055507.1569004420-713621346.1569004420 (accessed on 13 December 2024).
  34. Remaoun, S.-M.; Tilmatine, A.; Hammadi, N.; Miloua, F.; Medles, K. Optimisation of one stage electrostatic precipitator for welding fume filtration. Sci. Iran. 2012, 19, 1861–1864. [Google Scholar] [CrossRef]
  35. Chen, T.-M.; Tsai, C.J.; Yan, S.-Y.; Li, S.-N. An efficient wet electrostatic precipitator for removing nanoparticles, submicron and micron-sized particles. Sep. Purif. Technol. 2014, 136, 27–35. [Google Scholar] [CrossRef]
  36. Alonso, C.; Raynor, P.C.; Davies, P.R.; Morrison, R.B.; Torremorell, M. Evaluation of an electrostatic particle ionization technology for decreasing airborne pathogens in pigs. Aerobiologia 2016, 32, 405–419. [Google Scholar] [CrossRef]
  37. Katz, J. Factors affecting resistivity in electrostatic precipitation. J. Air Pollut. Control Assoc. 1980, 30, 195–201. [Google Scholar] [CrossRef]
  38. Lagarias, J.S. Discharge electrodes and electrostatic precipitators. J. Air Pollut. Control Assoc. 1960, 10, 271–274. [Google Scholar] [CrossRef]
  39. Babatunde, O.O.; Park, C.S.; Adeola, O. Nutritional potentials of atypical feed ingredients for broiler chickens and pigs. Animals 2021, 11, 1196. [Google Scholar] [CrossRef] [PubMed]
  40. Chai, M.; Lu, M.; Keener, T.; Khang, S.-J.; Chaiwatpongsakorn, C.; Tisch, J. Using an improved electrostatic precipitator for poultry dust removal. J. Electrostat. 2009, 67, 870–875. [Google Scholar] [CrossRef]
  41. Kirychuk, S.P.; Reynolds, S.J.; Koehncke, N.K.; Lawson, J.; Willson, P.; Senthilselvan, A.; Marciniuk, D.; Classen, H.L.; Crowe, T.; Just, N.; et al. Endotoxin and dust at respirable and nonrespirable particle sizes are not consistent between cage- and floor-housed poultry operations. Ann. Occup. Hyg. 2010, 54, 824–832. [Google Scholar]
  42. Wang-Li, L.; Cao, Z.; Li, Q.; Liu, Z.; Beasley, D.B. Concentration and particle size distribution of particulate matter inside tunnel-ventilated high-rise layer operation houses. Atmos. Environ. 2013, 66, 8–16. [Google Scholar] [CrossRef]
  43. Lai, H.T.L.; Aarnink, A.J.A.; Cambra-López, M.; Huynh, T.T.T.; Parmentier, H.K.; Groot Koerkamp, P.W.G. Size distribution of airborne particles in animal houses. Agric. Eng. Int. CIGR J. 2014, 16, 28–42. [Google Scholar]
  44. Jerez, S.B.; Zhang, Y.; Wang, X. Measurement of particle size distribution in a swine building. Trans. ASABE 2011, 54, 1103–1117. [Google Scholar] [CrossRef]
  45. Jones, D.D.; Friday, W.H.; DeForest, S.S. Environmental Control for Confinement Livestock Housing. Historical Documents of the Purdue Cooperative Extension Service. Paper 1083. 2015. Available online: https://docs.lib.purdue.edu/agext/1083 (accessed on 13 December 2024).
  46. National Institute for Occupational Safety and Health (NIOSH). Best Practices for Dust Control in Metal/Nonmetal Mining—Mineral Processing Operations—Total Mill Ventilation Systems. 2018. Available online: https://www.cdc.gov/niosh/engcontrols/ecd/detail194.html (accessed on 13 December 2024).
  47. Xu, J.; Chen, P.; Gu, Z.; Xi, J.; Cai, J. Performances of a new type high-temperature tubular electrostatic precipitator with rare-earth tungsten cathode. Sep. Purif. Technol. 2022, 280, 119820. [Google Scholar] [CrossRef]
  48. Turner, J.H.; Lawless, P.A.; Yamamoto, T.; Coy, D.W.; McKenna, J.D.; Mycock, J.C.; Nunn, A.B.; Greiner, G.P.; Vatavuk, W.M. Chapter 3—Electrostatic Precipitator, Section 6—Particulate Matter Controls, EPA/452/B-02-001. 1999. Available online: https://www3.epa.gov/ttncatc1/cica/files/cs6ch3.pdf (accessed on 13 December 2024).
  49. Mizuno, A. Electrostatic precipitation. IEEE Trans. Dielectr. Electr. Insul. 2000, 7, 615–624. [Google Scholar] [CrossRef]
  50. Jedrusik, M.; Swierczok, A. Design efficiency of ESP. In Air Pollution: Monitoring, Modelling, Health and Control; Khare, M., Ed.; IntechOpen: London, UK, 2012; pp. 197–220. [Google Scholar]
  51. Sudrajada, A.; Yusof, A.F. Review of electrostatic precipitator device for reduce of diesel engine particulate matter. Energy Procedia 2015, 68, 370–380. [Google Scholar] [CrossRef]
  52. Grigoriu, C.; Wang, W.-N.; Martin, D.; Biswas, P. Capture of particles from an iron and steel smelter with a pulse-energized electrostatic precipitator. Aerosol Air Qual. Res. 2012, 12, 673–682. [Google Scholar] [CrossRef]
  53. Boelter, K.J.; Davidson, J.H. Ozone generation by indoor, electrostatic air cleaners. Aerosol Sci. Technol. 1997, 27, 689–708. [Google Scholar] [CrossRef]
  54. Yehia, A.; Mizuno, A. Suppression of the ozone generation in the positive and negative DC corona discharges. Int. J. Plasma Environ. Sci. Technol. 2008, 2, 44–49. [Google Scholar]
  55. Kim, H.J.; Han, B.; Kim, Y.J.; Oda, T.; Won, H. Submicrometer particle removal indoors by a novel electrostatic precipitator with high clean air delivery rate, low ozone emissions, and carbon fiber ionizer. Indoor Air 2013, 23, 369–378. [Google Scholar] [CrossRef]
  56. Manuzon, R.; Zhao, L.; Gecik, C. An optimized electrostatic precipitator for air cleaning of particulate emissions from poultry facilities. ASHRAE Trans. 2014, 120, 490–503. [Google Scholar]
  57. Zhao, Y.; Chai, L.; Richardson, B.; Xin, H. Field evaluation of an electrostatic air filtration system for reducing incoming particulate matter of a hen house. Trans. ASABE 2018, 61, 295–304. [Google Scholar] [CrossRef]
  58. Aponte, I.A.; Esser, B.; Dickens, J.C.; Mankowski, J.J.; Neuber, A.A. Fundamental investigation of unipolar and RF corona in atmospheric air. Phys. Plasmas 2021, 28, 123502. [Google Scholar] [CrossRef]
  59. Lowke, J.J.; D’Alessandro, F. Onset corona fields and electrical breakdown criteria. J. Phys. D Appl. Phys 2003, 36, 2673–2682. [Google Scholar] [CrossRef]
  60. Altamimi, G.; Illias, H.A.; Mokhtar, N.; Mokhlis, H.; Bakar, A.H.A. Corona discharges under various types of electrodes. In Proceedings of the 2014 IEEE International Conference on Power and Energy (PECon), Kuching, Malaysia, 1–3 December 2014; pp. 5–8. [Google Scholar]
  61. Occupational Safety and Health Administration (OSHA). Ozone. 2021. Available online: https://www.osha.gov/chemicaldata/9 (accessed on 13 December 2024).
  62. Cardello, N.; Volckens, J.; Tolocka, M.P.; Wiener, R.; Buckley, T.J. Technical note: Performance of a personal electrostatic precipitator particle sampler. Aerosol Sci. Technol. 2002, 36, 162–165. [Google Scholar] [CrossRef]
Figure 1. Schematic of the experimental setup: (1) air compressor, (2) air filtration system equipped with a pressure gauge, (3) dust disperser, (4) dust disperser controller, (5) acrylic chamber (a—charging electrode and b—collection surface), (6) DustTrak monitor, (7) fume hood, and (8) high-voltage power supply.
Atmosphere 16 00087 g001
Figure 2. Photo of the carbon-fiber discharge electrode.
Atmosphere 16 00087 g002
Figure 3. Photo of original potash dust sample.
Atmosphere 16 00087 g003
Figure 4. Trend in the dust concentrations measured at the exhaust of the chamber as the power supply was turned off and on: (a) wheat flour and (b) potash dust.
Atmosphere 16 00087 g004
Figure 5. Collection efficiencies of the electrostatic particle ionization system with the different discharge electrodes under various applied voltage levels for the various particle size fractions of wheat flour: (a) PM1, (b) PM2.5, (c) PM4, (d) PM10, and (e) total dust. CF, SS-r, SS-s, and T represent carbon-fiber, stainless-steel (round), stainless-steel (square), and tungsten electrodes, respectively. The error bar indicates standard deviation.
Atmosphere 16 00087 g005
Figure 6. Collection efficiencies of the electrostatic particle ionization system with the different discharge electrodes under various applied voltage levels for the various particle size fractions of potash dust: (a) PM1, (b) PM2.5, (c) PM4, (d) PM10, and (e) total dust. CF, SS-r, SS-s, and T represent carbon-fiber, stainless-steel (round), stainless-steel (square), and tungsten electrodes, respectively. The error bar indicates standard deviation.
Atmosphere 16 00087 g006
Figure 7. Power consumption of the electrostatic particle ionization system with different types of discharge electrodes under various negative and positive voltage levels. CF, SS-r, SS-s, and T represent carbon-fiber, stainless-steel (round), stainless-steel (square), and tungsten electrodes, respectively. The error bar indicates standard deviation.
Atmosphere 16 00087 g007
Figure 8. Amount of ozone produced by the electrostatic particle ionization system with the different types of discharge electrodes at voltage levels of ±10 kV. CF, SS-r, SS-s, and T represent carbon-fiber, stainless-steel (round), stainless-steel (square), and tungsten electrodes, respectively. The error bar indicates standard deviation.
Atmosphere 16 00087 g008
Table 1. Particle size distribution (PSD) and mass median diameter (MMD) of the sieved wheat flour used in this study and airborne dust in animal facilities.
DustPSD (%)MMD
(µm)
Reference
<10 µm>10 µm
Sieved wheat flour138721.8This study
Poultry dust23–6040–777.3–26.1[41,42,43]
Swine dust89031.6[44]
Table 2. Operating designs and conditions employed in the study.
Operating and Design ConditionsLevels/Types Evaluated
Shape and material type of discharge electrodeStainless steel, round pins
Stainless steel, square pins
Tungsten, round pins
Carbon fiber, round pins
Distance between discharge electrode and collection surfaces (m)0.05
Voltage level (kV) and polarity±5.0, ±10.0, ±12.5, ±15.0, ±17.5, and ±20.0 a
Dust concentration (mg m−3)~8
Air changes per hour25
a Only ±10, ±15, and ±20 kV were tested in the potash dust trials.
Table 3. Comparison of the different electrode types based on the various metrics.
Electrode TypeCollection Efficiency (%)Power Consumption (W)Ozone Generation
(ppb)
Wheat FlourPotash Dust
Carbon fiber64771.0744
Stainless steel (round)76671.1493
Stainless steel (square)71781.30364
Tungsten57551.39385
Disclaimer/Publisher’s Note: The statements, opinions and data contained in all publications are solely those of the individual author(s) and contributor(s) and not of MDPI and/or the editor(s). MDPI and/or the editor(s) disclaim responsibility for any injury to people or property resulting from any ideas, methods, instructions or products referred to in the content.