Abstract
Peatlands in OKI Regency are highly flammable during extreme dry seasons and experience flooding during extreme rainy seasons. Research related to peatlands is important to be carried out in disaster mitigation efforts on peatlands. In this study, we aimed to examine the impact of climate anomalies occurring between 2019 and 2022 on the Rainfall (RF), Groundwater Level (GWL), and Soil Moisture (SM) in this region. We analyzed data collected at the CJ2 station to understand the dynamics of these parameters throughout the occurrence of the ENSO and IOD phenomena in 2019–2022. The findings of this study indicate a positive correlation between RF and GWL. Specifically, a higher amount of RF resulted in a stronger correlation. Moreover, the rate of the GWL decline was 0.24 mm/d, while the rate of the SM decline was 0.06%/day. Furthermore, the soil moisture in CJ2 OKI must be maintained at a minimum of 20% to prevent fires. In addition, an empirical equation was derived to express the relationship between GWL (m) and SM (%) as SM = 49,044 GWL + 59,142. The findings of this study provide valuable in-sights for all stakeholders involved in efforts to mitigate the impact of natural disasters on peatlands.
1. Introduction
Indonesian tropical peatland, which constitutes 50% of equatorial tropical peatland, represents a highly fragile ecosystem. This vulnerability is significantly heightened by human activities, particularly the conversion of land for agriculture and plantations. Such practices often result in canalization, which reduces the groundwater level—the most crucial parameter for the health of tropical peat. Consequently, this leads to the decomposition of the peat that releases carbon and makes it drier and more prone to burning [1,2]. One of Indonesia’s largest peatlands is located in the eastern part of Sumatra and has undergone considerable land use changes, resulting in the loss of 65% of its original area. The Ogan Komering Ilir (OKI) Regency encompasses approximately 50% of the total peatland in South Sumatra, covering around 2 million hectares. This region has experienced significant changes in land use and has been affected by more frequent fires than other areas in South Sumatra [3,4].
Peatlands in Indonesia are generally highly susceptible to fires, especially during extreme dry seasons, and prone to flooding during extreme rainy seasons. These extreme dry and rainy seasons are a result of climate anomalies, which arise from the interplay between the ocean and atmosphere in the Pacific Ocean and Indian Ocean. Indonesia is situated between these two oceans, which implies that any natural phenomena arising from the interaction of the sea and atmosphere in both oceans directly affect the climate conditions within the country [5,6,7]. The natural phenomena related to climate anomalies in the Pacific and Indian Oceans are called the El Niño Southern Oscillation (ENSO) and Indian Ocean Dipole (IOD), respectively. ENSO consists of El Niño and La Niña, while IOD consists of IOD+ and IOD−. From 2019 to 2022, both ENSO and IOD phenomena occurred, thereby affecting the climate conditions in Indonesia [8,9,10].
Peatlands, especially their unsaturated zone, are influenced by various climate parameters, specifically the rainfall (RF), groundwater level (GWL), and surface soil moisture (SM). When El Niño and/or IOD+ occur, RF becomes very minimal, resulting in a low GWL and low SM. As a result, peatlands become easily flammable. Conversely, if La Niña and/or IOD- occur, RF becomes excessive, resulting in peatlands being flooded [8].
Several studies have been conducted on the dynamics of climate parameters in peatlands. Previous research results have stated that there is an influence of climate change on the dynamics of hydro-climatology parameters [11,12,13]. However, no specific research has been conducted on the dynamics of the rainfall, GWL, and SM in peatlands in the OKI Regency for 2019–2022, specifically in relation to ENSO and IOD. In this study, we aimed to investigate the impact of climate anomalies, specifically ENSO and IOD, on the RF, GWL, and SM of peatlands in the OKI regency, Indonesia, for 2019–2022. We analyzed data collected at the CJ2 station, consisting of hourly data on RF, GWL, and SM. An analysis was conducted to elucidate the dynamics of these parameters throughout the occurrence of the ENSO and IOD phenomena in 2019–2022. The analysis was conducted using statistical methods of linear regression and linear correlation that are commonly used in international research. The novelty of this study includes obtaining the average speed of decline in the groundwater level and soil moisture during the 2019 dry season, and empirical equations between the groundwater level and soil moisture. It is anticipated that the results of this research can provide valuable information for all stakeholders involved in efforts to mitigate the impact of natural disasters on peatlands in the OKI Regency.
2. Materials and Methods
2.1. Method
In this study, we analyzed the dynamics of RF, GWL, and SM parameters in peatlands in the OKI Regency for 2019–2022. The selection of this location was based on the presence of extensive peatland areas in the OKI Regency. The 2019–2022 period was selected because of the occurrences of the ENSO and IOD phenomena during that period.
In collaboration with JICA, the Indonesian government developed the Sensory Data Transmission Service Assisted by Midori Engineering Laboratory (SESAME) station to measure theses parameters. This instrument is specifically designed to be deployed directly on peatlands. SESAME stations are situated on the islands of Sumatra and Kalimantan. One of the SESAME stations installed in the OKI Regency is called the Cinta Jaya 2 (CJ2) station [14].
The CJ2 measuring station can measure various climatological parameters in situ, including rainfall, GWL, and SM. The field measurement data are transmitted online for processing at laboratories in Japan. The data processing results are published on the SESAME website (https://web.sesame-system.com accessed on 10 April 2023). In this measurement system, several sensors are employed to measure climatological parameters. It also contains batteries that utilize sunlight (solar cells) for energy storage purposes. Figure 1 depicts a photograph of the SESAME equipment system installed in the field. The rainfall sensor is placed on the top of the equipment system. The groundwater level and soil moisture measuring sensors are placed about 5 cm below the ground surface. It also contains batteries that utilize sunlight (solar cells) for energy storage purposes [15,16,17].
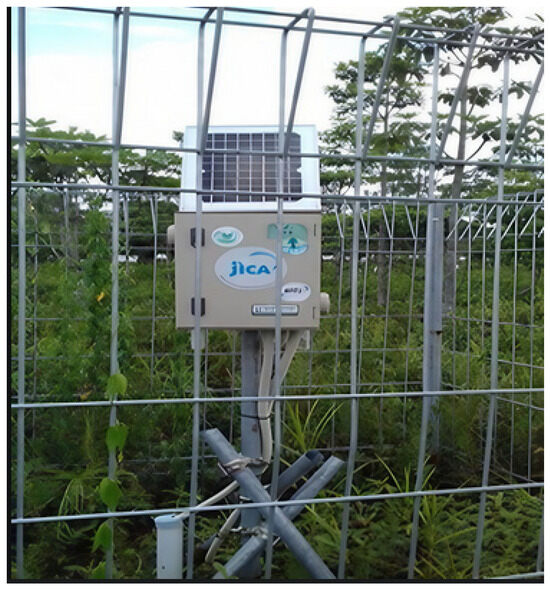
Figure 1.
SESAME equipment system installed in the field in OKI Regency, South Sumatra, Indonesia.
The impact of the ENSO and IOD phenomena in Indonesia is usually felt most strongly during the peak of the dry season, which usually occurs in August (A), September (S), and October (O). El Niño and the IOD+ result in very minimal rainfall at the peak of the dry season. In contrast, La Niña and the IOD− cause high rainfall in the dry season. Therefore, the analysis was only carried out during the August, September, and October periods [17].
Peatlands are influenced by various climate parameters, specifically rainfall (RF), groundwater level (GWL), and soil moisture (SM). The dynamics of these parameters are investigated in order to mitigate the effects of fires and floods on peatlands. Peatlands are vulnerable to fire and flood disasters. These three parameters play a major role in these disasters. If rainfall is minimal, groundwater will drop very low so that the surface of the peatland becomes very dry or its humidity is very low. As a result, peatlands are very flammable, causing fire disasters. Conversely, if rainfall is excessive, peatlands will experience flooding.
The analysis was conducted on time series graphs of RF, GWL, and SM. A statistical analysis was also conducted using linear regression to examine the correlation between these parameters. We attempted to identify empirical correlations and equations that accurately represent the relationship between these parameters. Specifically, in 2019, we conducted measurements to determine the rates at which the GWL and SM decreased as RF approached zero.
2.2. Study Area
The South Sumatra Province consists of five districts, encompassing a total peatland area of approximately 2.09 million ha. The largest peatland is located in the OKI Regency, accounting for approximately 49.28% of the total peatland area in South Sumatra Province or 1.03 million ha of the total area. This study was carried out in the OKI Regency, specifically at the SESAME CJ2 station with coordinates (−3472; 104,965). Figure 2 depicts a map of the study area, namely station CJ2, situated in the peatlands of the OKI Regency. Figure 2 also illustrates the considerable extent of peatlands in this region.
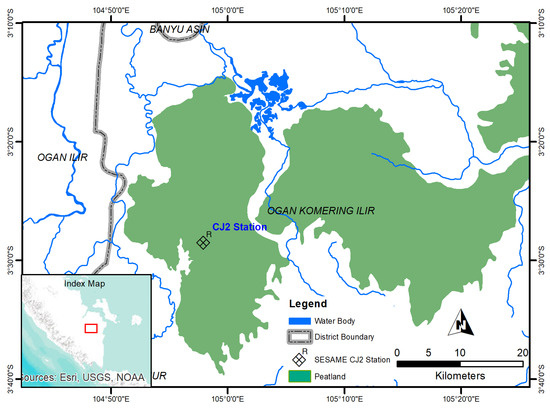
Figure 2.
Location of the CJ2 station within the Ogan Komering Ilir (OKI) Regency, South Sumatra, Indonesia.
Peat thickness in the South Sumatra region (including the OKI Regency) is divided into three classes: 50–100 cm, 100–200 cm, and 200–300 cm. The most prevalent peat thickness class is the 50–100 cm class, covering an area of 702,000 ha or 55.03% of the total peat area. The majority of peat soil found in the OKI Regency and South Sumatra is predominantly shallow peat [18,19,20].
The peat ecosystem is characterized by its continual inundation with water every year, creating a swamp forest environment if left undisturbed. Peat swamp forests have multiple functions, including acting as a water storage system (aquifer), providing an environmental buffer, serving as agricultural land, functioning as a habitat for flora and fauna, supplying raw material for charcoal briquettes, and acting as a plant-growth medium with the capability of storing and absorbing considerable amounts of carbon. This capacity of plants to store and absorb carbon is crucial because it has the potential to limit the release of carbon, one of the primary greenhouse gases, into the atmosphere, thereby mitigating the rate of global warming [21,22,23].
Figure 3 indicates the general state of land cover in the OKI Regency and its surrounding areas. Based on the 2017 land cover map, the peat ecosystem of South Sumatra Province has 24 distinct types of land cover. The most dominant land cover type is industrial wood plantations, with an area of 0.407 million ha or 19.46% of the total peat area. The dominance of industrial wood plantation land cover in the South Sumatra peat ecosystem is primarily concentrated in the OKI Regency and Musi Banyuasin Regency. Apart from industrial wood plantations, shrubs are also a dominant land cover type in the South Sumatra peat ecosystem, with an area of 345,000 ha or 16.50% of the total peat area.
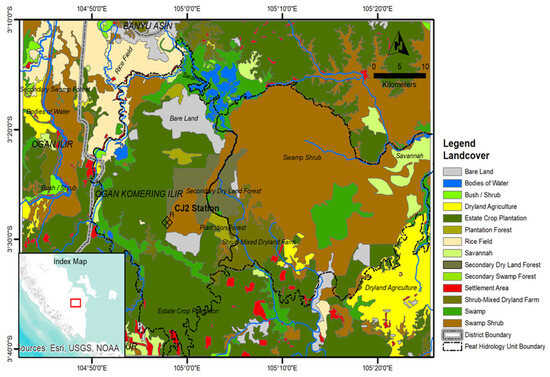
Figure 3.
Land cover in the OKI Regency, South Sumatra, Indonesia and its surrounding areas.
2.3. El Niño Southern Oscillation and Indian Ocean Dipole
The ENSO is a climatic phenomenon that comprises two distinct phases: El Niño and La Niña. Similarly, the IOD consists of two phases: IOD+ and IOD−. The occurrence of El Niño and IOD+ leads to a substantial decrease in rainfall in most regions of Indonesia, including the OKI Regency. Conversely, La Niña and IOD− result in high rainfall in most parts of Indonesia, including the OKI Regency. The level of rainfall anomalies that occur depends on the ENSO and IOD categories. If rainfall is low due to EL Niño and/or IOD+, then the groundwater level will drop very low, resulting in the moisture of the peatland surface soil decreasing so that it is easily burned. On the other hand, if rainfall is very high due to La Niña and/or IOD− then the groundwater level will be high resulting in flooding [24].
There are four categories: weak, moderate, strong, and very strong. The very strong category leads to very large rainfall anomalies and vice versa. Similarly, this applies to other categories as well. The categorization is based on the magnitude of the anomaly in sea surface temperature (SST) in the Pacific and Indian Oceans. The measurement of the SST anomaly in the Pacific Ocean is called the Niño3.4 Index, whereas in the Indian Ocean, it is referred to as the Dipole Mode Index (DMI) [25,26,27]. Table 1 displays the categorization of ENSO and IOD using the Niño3.4 Index and DMI. Table 2 displays the specific ENSO and IOD occurrences for 2019–2022. In 2019, there was a strong IOD+, resulting in very minimal rainfall. In 2022, there were moderate La Niña and IOD− events, resulting in increased rainfall compared to the rainfall observed in 2019–2021 [28,29,30].

Table 1.
Categories of ENSO and IOD phenomena.
Table 2.
Types of ENSO) and IOD in 2019–2022.
Figure 4a displays a graph illustrating the Niño3.4 values for 2019–2022. The graph shows that in 2019, the maximum recorded value was 0.7 °C, which occurred in March; therefore, it was categorized as a weak El Niño. In 2020, the peak value was −1.3 °C, which occurred in October; it was categorized as a moderate La Niña event. In 2021, the peak occurred in December with a value of −1 °C, which was categorized as moderate La Niña. In 2022, the peak occurred in March with a value of −1.1 °C, which was also categorized as moderate La Niña. Figure 4b presents a DMI graph for 2019–2022, which can be used to determine the category of IOD that occurs. In 2019, the peak DMI value was 1.78 °C, which occurred in October and November; therefore, it was categorized as a strong IOD+ event.
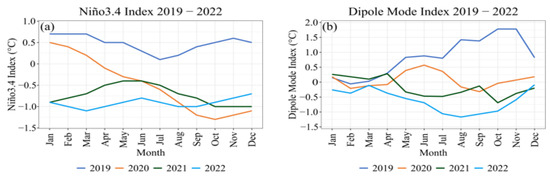
Figure 4.
Graphic of Niño3.4 (a) and Dipole Mode Index (DMI) (b) for 2019–2022.
3. Results
3.1. Rainfall Dynamics
Figure 5 presents a rainfall and groundwater level time series graph for the August–October periods of 2019–2022. Figure 5a illustrates extremely low rainfall, particularly in August 2019, when there was almost no rainfall. In the August–October period of 2019, the amount of rainfall that occurred was only 130.4 mm. In 2020–2022, the La Niña and IOD+/IOD− phenomena occurred, resulting in more rainfall during the dry season of August–October than that observed in 2019. This is illustrated in Figure 5b–d. The rainfall amounts during the dry seasons of 2020, 2021, and 2022 were 294 mm, 317 mm, and 371.6 mm, respectively. In 2022, the amount of rainfall was the highest due to the occurrence of moderate La Niña and moderate IOD phenomena. In 2020, a moderate La Niña and weak IOD+ occurred, whereas in 2021, a moderate La Niña and weak IOD− phenomenon occurred. The types of natural phenomena that occurred during 2019–2022 can be observed in Table 2.
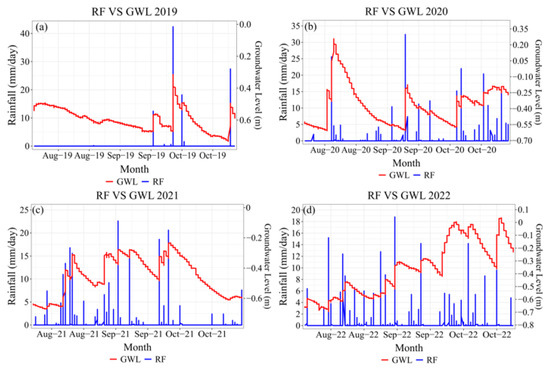
Figure 5.
Dynamic of rainfall and groundwater levels in the August–October periods of 2019–2022. (a) is a dynamic of rainfall and groundwater levels in 2019, (b) in 2020, (c) in 2021, and (d) in 2022.
3.2. Groundwater Level Dynamics
Figure 5a also shows that the graph depicting the decrease in GWLs between August and September closely approximates a straight line. This can be attributed to the minimal rainfall during this period. The graph exhibits an irregularity in October because of the onset of rainfall. The lowest GWL reached was −0.748 m on 29 October 2019. In Figure 5b–d, the irregular graphic shape of the decrease in the GWL can be attributed to the rain caused by La Niña and IOD+/IOD− during that period. In general, the groundwater level was still below ground level throughout 2019–2022, except on 26 October 2022. On that specific date, the GWL was 0.012 m higher than the ground level. This can be attributed to the higher amount of rainfall in 2022 compared to that in 2019–2021.
3.3. Relationship Between Rainfall and Groundwater Level
In Figure 5 we can also see the relationship between the rainfall and GWLs in the August–October periods of 2019–2022. In general, the four graphs suggest a relationship between the rainfall and GWL, indicating that higher rainfall is associated with higher GWLs and vice versa. Therefore, in the next section, we determined the magnitude of the correlation between these two parameters.
3.4. Rate of Groundwater Level Decline in 2019
There was only one rain event for the period 1 August to 24 September 2019, namely on 29 August 2019, with only 0.2 mm of RF (Figure 6). Due to the minimal RF (close to 0), the GWL reduction graph appears almost linear. Statistical analysis was used to produce a linear regression graph, depicted in Figure 6, with the line represented in green. Figure 6 displays the linear line equation for the decreasing GWL:
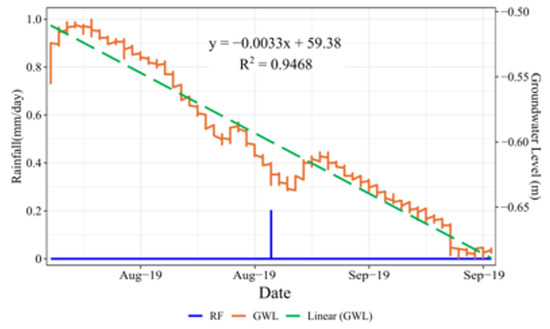
Figure 6.
Decreasing groundwater levels in August–October 2019.
This equation can be used to determine the rate of decrease in the GWL. The period of the decreasing GWL (∆X) spanned from 1 August to 24 September 2019, totaling 55 d. In this equation, if X = 1, then
If X = 55, then
The decrease in the GWL during this period was
Therefore, the rate of the GWL decline is
Research on calculating the rate at which GWLs decline has been carried out at another location, namely at Kedaton OKI. This study found that the rate of GWL decline was VGWL = 0.71 cm/d. The rate of GWL decline in CJ2 is lower compared to that in Kedaton. The difference in this value can be attributed to the greater tree density found at the CJ2 location compared to Kedaton. Consequently, the roots of the trees in CJ2 exhibited increased resilience despite the decreasing GWLs.
3.5. Soil Moisture Dynamics
Figure 7 displays an SM time series graph for the August–October periods of 2019–2022. In Figure 7a, the SM value in the August–September 2019 period was below 20%. This condition was caused by low GWLs due to minimal rainfall during that period and resulted in the peatlands on the surface becoming extremely dry, rendering them highly susceptible to catching fire. Figure 7b–d shows that SM was generally above 20% during the same periods in 2020–2022. Based on this graph, it can be concluded that in order to prevent catching fire easily, the surface SM of peatlands should be maintained at a minimum of 20%. Previous research at the OKI-1 location in 2019 reported a low SM value of 10% with a maximum GWL depth of −1.14 m. At the CJ2 location, the minimum SM was 20%, and the GWL reached a maximum depth of −0.748 cm. This indicates that the minimum SM value is different for each location based on the maximum depth of the GWL. In general, as the GWL increases in depth, the soil surface becomes drier.
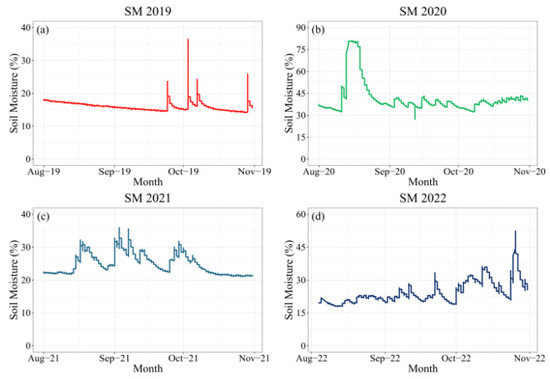
Figure 7.
Time series graph of soil moisture in the August–October periods of 2019–2022. (a) is SM in 2019, (b) is SM in 2020, (c) is SM in 2021, and (d) is SM in 2022.
3.6. The Rate of Soil Moisture Decline in 2019
Figure 8 displays a time series graph illustrating the Soil Moisture reduction from 1 August to 24 September 2019, spanning a total of 55 d. The X-axis represents time, and the Y-axis denotes the SM values (%). When X = 1, then
When X = 55, then
and ∆X = 55 d. Therefore, the rate of the decrease in the SM was
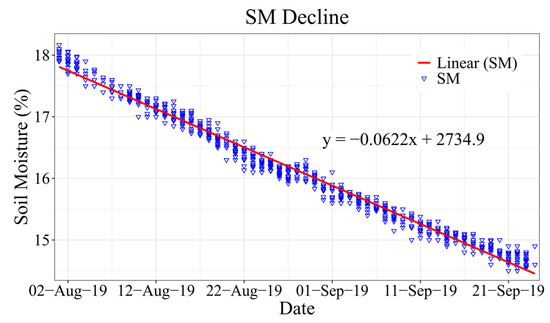
Figure 8.
Graph of soil moisture decreasing from 1 August to 24 September 2019.
3.7. Correlation Between Rainfall and Groundwater Level
Figure 9 depicts a graph illustrating the correlation between rainfall and GWLs in the August–October periods of 2019 and 2020. Figure 9a displays the correlation between these two parameters in 2019 when a strong IOD+ event occurred, which caused an extremely dry season. The correlation coefficient (r) was only 0.37, indicating a weak correlation. Figure 9b displays the correlation between rainfall and GWLs in 2020, when a moderate La Niña event occurred, where there was a higher amount of rainfall compared to 2019. The correlation between these two parameters was quite strong, as indicated by r = 0.68. This demonstrates that the higher the rainfall, the better the correlation between the rainfall and GWLs, and vice versa.
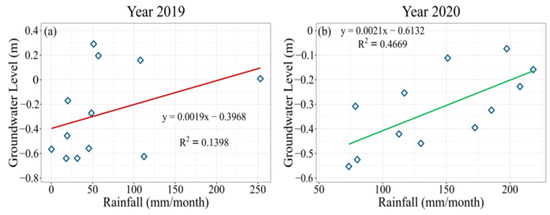
Figure 9.
Correlation graph between RF and GWL in the August–October periods of 2019–2020. (a) is a correlation graph between RF and GWL in 2019, (b) in 2020.
3.8. Correlation Between Groundwater Level and Soil Moisture
Figure 10 shows the correlation graph between the GWLs and SM. Based on the four images, the correlation between the GWLs and SM was relatively strong because of correlation coefficient values of r > 0.8. The r values for 2019, 2020, 2021, and 2022 were 0.822, 0.834, 0.830, and 0.814. Based on this r value, we can use the empirical equation between the GWL and SM that has been generated to determine the SM value based on the GWL value. Previous research on four peatland locations in Sungai Lumpur 1, Sungai Lumpur 2, Sungai Saleh 1, and Sungai Saleh 2 produced r values > 0.8 [17]. These results indicate a strong correlation between these two parameters. Based on the four empirical equations that were obtained, we selected the empirical equation for 2020 because it had the highest r value. The empirical equation is
where Y is the SM (%) and X is the GWL or
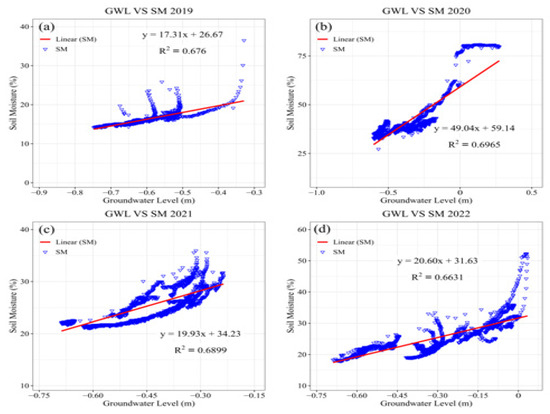
Figure 10.
Correlation graph between groundwater levels and soil moisture in the August–October periods of 2019–2020. (a) is a correlation graph between GWL and SM in 2019, (b) in 2020, (c) in 2021, and (d) in 2022.
3.9. Hotspot Analysis
Hotspot is a satellite image pixel with high infrared intensity, indicating a heat source. This parameter has been widely used in various countries to monitor forest and land fires using satellite data. Hotspots can be detected by the National Oceanic and Atmospheric Administration (NOAA) satellite equipped with the Advanced Very Highly Resolution Radiometer (AVHRR) sensor [31,32].
In Figure 5a, it can be observed that in the August–October period of 2019, the GWL position consistently remained below −0.4 m. The lowest GWL position occurred on 29 October 2019, reaching a depth of −0.748 m. According to previous research, the GWL should be at a level above −0.4 m to prevent hotspots from appearing. During this period, many hotspots emerged, leading to extensive fires in the OKI peatlands. During the 2020–2022 period, the GWL did not consistently remain below −0.4 m; therefore, the occurrence of hotspots was relatively limited. The National Research and Innovation Agency of Indonesia (BRIN) provides information on the number of hotspots in Indonesia on its website (https://hotspot.brin.go.id/, accessed on 12 January 2023). These data are obtained from several satellites. The hotspot data for the August–October periods of 2019–2022 in the OKI Regency based on MODIS satellite data from the website (downloaded on 20 April 2024) were illustrated in Figure 11. Figure 11 shows that the highest number of hotspots occurred in 2019, which can be attributed to the strong IOD+ phenomenon. The lowest number of hotspots occurred in 2022 as a result of the moderate La Niña and moderate IOD− phenomena.
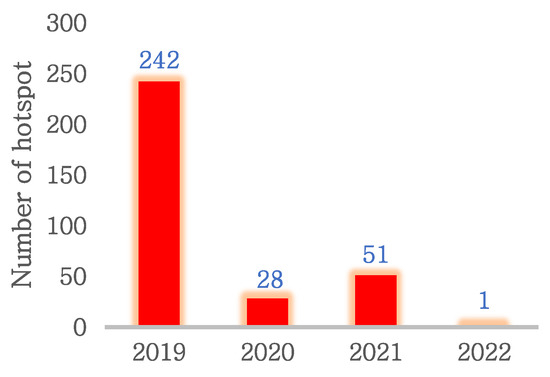
Figure 11.
Number of hotspots in the OKI Regency in the August–October periods of 2019–2022.
4. Discussion
The data used in this research only come from one measurement station. In the future, it is hoped that the Indonesian Government can add several more measuring stations spread across several locations in the OKI Regency peatlands, even though the costs are very expensive. By having several measurement stations, it is hoped that the data will be more representative of the actual conditions for peatlands in OKI Regency.
Previous studies have found that there is a relationship between climate change and the dynamics of hydro-climatological parameters in peatlands on Kalimantan Island [17]. The results of this study show something similar that climate change has a significant impact on the dynamics of hydro-climatological parameters in tropical peatlands. The difference between this study and previous studies is that this study has successfully calculated the average rate of decline in the groundwater level and soil moisture in peatlands in OKI Regency, especially in the area around CJ2 station. This has not been obtained in previous studies. This study also succeeded in obtaining an empirical equation that connects the groundwater level parameter with the soil moisture. This equation can be used if one of the sensors measuring the parameter in the field is damaged shortly before being repaired. By knowing the value of one of the parameters, the value of the other parameters can be calculated using this equation.
The Indonesian maritime continent, where this research is located, is a vital driver of the world’s climate, serving as a significant source of water vapor. Notably, the daily hydrological cycle exhibits a dominant spectral pattern that arises from the temperature contrasts between land and sea during the day and night, influenced by sunlight. Within the Indonesian archipelago, regions such as the east coast of Sumatra and the south coast of Kalimantan are characterized by extensive peat swamp forests, which contribute to the hydrological cycle by providing water vapor. In the western part of Sumatra, where numerous mountains exist, rainfall is frequent. Conversely, the eastern region, rich in peat swamp forests, experiences more intense rainfall, with the majority of rain cloud formation originating from the land and moving toward the coast [33,34].
The presence of abundant water vapor means that groundwater levels (GWL) reach their minimum conditions earlier compared to the peak of El Niño. However, changes in land use indicate that these groundwater levels are trending deeper towards the future [35,36,37]. This raises an important question: will this impact te rainfall intensity in the years to come? If so, it could pose a significant risk to peat swamp forests, as rainfall serves as their primary water source [38,39]. Consequently, the sustainable management of peat swamp forests must be prioritized within the framework of sustainable development.
5. Conclusions
Based on the results of this study, it was found that the ENSO and IOD natural phenomena that occurred in 2019–2022 impacted the dynamics of the rainfall, GWL, and SM parameters in the CJ2 OKI peatlands. The strong IOD+ phenomenon in 2019 resulted in very minimal rainfall, especially at the peak of the dry season during August–October 2019. This caused the GWL to drop below −0.4 m and the SM to fall below 20%. The GWL should be maintained at no more than −0.4 m to prevent the emergence of hotspots [9]. During the 2020–2022 period, the La Niña and IOD−/IOD+ phenomena occurred, resulting in an increased amount of rainfall compared to 2019. GWLs were generally above 0.4 m, and the SM exceeded 20% during this period.
This study presents several novel findings:
- A positive correlation between rainfall and GWLs was established, with a stronger correlation observed with higher rainfall.
- The rate of GWL decline on peatlands in CJ2 OKI was 0.24 mm/d.
- The rate of SM decline on peatlands in CJ2 OKI was 0.06%/d, which prevented fires from occurring on peatlands in CJ2 OKI as long as the SM was maintained at a minimum of 20%.
- The empirical equation that connects the GWL (m) with the SM (%) on peatlands in CJ2 OKI was . This equation can be used to determine the soil moisture if the groundwater level is known for peatlands, especially in OKI Regency.
The research results are expected to be used as a reference for various interested parties in mitigating fire and flood disasters on peatlands. Research related to the impact of IOD and ENSO on disasters in peatlands is expected to continue in the following years because it is estimated that the ENSO and IOD phenomena will continue as an impact of global warming. It is also expected that more hydroclimate parameter measurement stations will be established on peatlands in OKI Regency so that the research results are more representative of the OKI Regency area.
Author Contributions
Conceptualization, M.I. and I.I.; methodology, M.I., M.Y.N.K. and H.Y.; software, W.M. and N.K.; validation, M.I., E.C. and I.I.; formal analysis, M.I., M.Y.N.K. and E.C.; investigation, M.I. and A.S.; resources, A.; data curation, M.I.; writing—original draft preparation, M.I., H.Y. and E.C.; writing—review and editing, M.I., A.S., H.Y. and E.C.; visualization, M.I. and N.K.; supervision, R.A.S. and E.C.; project administration, W.M. and N.K.; funding acquisition, R.A.S. and E.C. All authors have read and agreed to the published version of the manuscript.
Funding
This study and the APC was funded by the National Institute of Forest Science (NIFoS), South Korea; Grant No. FM0800-2021-03-2025.
Data Availability Statement
The raw data used in this study come from the National Research and Innovation Agency of Indonesia (BRIN).
Conflicts of Interest
The authors declare no conflicts of interest.
References
- Hayasaka, H. Fire Weather Conditions in Plantation Areas in Northern Sumatra, Indonesia. Atmosphere 2023, 14, 1480. [Google Scholar] [CrossRef]
- Rossita, A.; Boer, R.; Hein, L.; Nurrochmat, D.R.; Riqqi, A. Peatland fire regime across Riau peat hydrological unit, Indonesia. For. Soc. 2023, 7, 76–94. [Google Scholar] [CrossRef]
- Laura; Graham, L.B.; Applegate, G.B.; Thomas, A.; Ryan, K.C.; Saharjo, B.H.; Cochrane, M.A. A Field Study of Tropical Peat Fire Behaviour and Associated Carbon Emissions. Fire 2022, 5, 62. [Google Scholar] [CrossRef]
- Nurhayati, A.D.; Saharjo, B.H.; Sundawati, L.; Syartinilia, S.; Cochrane, M.A. Forest and peatland fire dynamics in South Sumatra Province. For. Soc. 2021, 5, 591–603. [Google Scholar] [CrossRef]
- Minardi, A.; Taufik; Astuti, D.; Pamungkas, M.I. Singapore Country Assistance to Help Extinguish Forest Fire in South Sumatera. Sriwij. J. Environ. 2020, 5, 53–59. [Google Scholar] [CrossRef]
- Terzano, D.; Trezza, F.R.; Rezende, M.; Malatesta, L. Prioritization of peatland restoration and conservation interventions in Sumatra, Kalimantan and Papua. J. Nat. Conserv. 2023, 73, 126388. [Google Scholar] [CrossRef]
- Wicaksono, A.; Zainal. Peatlands Restoration Policies in Indonesia: Success or Failure? In IOP Conference Series: Earth and Environmental Science, Proceedings of the Sriwijaya Conference on Sustainable Environment, Agriculture and Farming System, Palembang, Indonesia, 29 September 2021; IOP Publishing: Bristol, UK, 2022; Volume 995, p. 012068. [Google Scholar] [CrossRef]
- Putra, R.; Nufutomo, T.K.; Lisa, F.Y. Rapid Land Cover Change in The South Sumatera Peat Area Associated with 2015 Peat Fires. J. Geosci. Eng. Environ. Technol. 2022, 7, 34–38. [Google Scholar] [CrossRef]
- Irfan, M.; Koriyanti, E.; Saleh, K. Dynamics of Peatland Fires in South Sumatra in 2019: Role of Groundwater Levels. Land 2024, 13, 373. [Google Scholar] [CrossRef]
- Zhang, Y.; Zhou, W.; Wang, X.; Chen, S.J. Indian Ocean Dipole and ENSO’s mechanistic importance in modulating the ensuing-summer precipitation over Eastern China. npj Clim. Atmos. Sci. 2022, 5, 48. [Google Scholar] [CrossRef]
- An, S.I.; Park, H.J.; Kim, S.K. Intensity changes of Indian Ocean dipole mode in a carbon dioxide removal scenario. npj Clim. Atmos. Sci. 2022, 5, 20. [Google Scholar] [CrossRef]
- Suryadi, Y.; Soekarno, I.; Humam, I.A. Effectiveness analysis of canal blocking in sub-peatland hydrological unit 5 and 6 kahayan sebangau, central kalimantan, indonesia. J. Eng. Technol. Sci. 2021, 53, 210205. [Google Scholar] [CrossRef]
- Jannah, M.; Ismail1, N.; Asyqari, A.; Indahsari, F.N.; Abdullah, F. Identifying the influence of El Nino Southern Oscillation (ENSO) and Indian Ocean Dipole (IOD) Phenomena on Rainfall in TheAceh Region. Indones. J. Geosci. Eng. Environ. Technol. Sustain. 2024, 9, 582–590. [Google Scholar] [CrossRef]
- Davamani, V.; John, J.E.; Poornachandhra, C.; Gopalakrishnan, B. A Critical Review of Climate Change Impacts on Groundwater Resources: A Focus on the Current Status, Future Possibilities, and Role of Simulation. Atmosphere 2024, 15, 122. [Google Scholar] [CrossRef]
- Irfan, M.; Satya, O.C.; Virgo, F.; Sutopo. Is there a correlation between rainfall and soil moisture on peatlands in South Sumatra? In Journal of Physics: Conference Series, Proceedings of the 9th International Conference on Theoretical and Applied Physics (ICTAP), Bandar Lampung, Indonesia, 26–28 September 2019; IOP Publishing: Bristol, UK, 2020; Volume 1572, p. 012040. [Google Scholar] [CrossRef]
- Putra1, E.I.; Syakbandani, M.U.E.; Pramono, S.; Saad, A. Estimating groundwater level in peatlands by using submersible sensor. J. Trop. Silvic. 2024, 15, 65–69. [Google Scholar] [CrossRef]
- Irfan, M.; Iskandar, I. The Impact of Positive IOD and La Niña on the Dynamics of Hydro-Climatological Parameters on Peatland. Int. J. GEOMATE 2022, 23, 115–122. [Google Scholar] [CrossRef]
- Reddy, P.J.; Perkins-Kirkpatrick, S.E.; Sharples, J.J. Interactive influence of ENSO and IOD on contiguous heatwaves in Australia. Environ. Res. Lett. 2022, 17, 014004. [Google Scholar] [CrossRef]
- Putra, R.; Zurfi, A.; Nufutomo, T.K.; Lisafitri, Y.; Sari, N.K. Spatial Analysis of 2019 Peat Fire in South Sumatra Conservation Area. In IOP Conference Series: Earth and Environmental Science, Proceedings of the International Conference on Science, Infrastructure Technology and Regional Development, South Lampung, Indonesia, 23–25 October 2020; IOP Publishing: Bristol, UK, 2021; Volume 830, p. 012038. [Google Scholar] [CrossRef]
- Widyastuti, K.; Imron, M.A.; Pradopo, S.T. PeatFire: An agent-based model to simulate fire ignition and spreading in a tropical peatland ecosystem. Int. J. Wildland Fire 2021, 30, 71–89. [Google Scholar] [CrossRef]
- Rumbang, N.; Asi, E.R.; Jaya, A.; Winarti, S. Estimation of Carbon pool in various agricultural crops in peatlands of West and Central Kalimantan, Indonesia. J. Exp. Biol. Agric. Sci. 2023, 11, 199–208. [Google Scholar] [CrossRef]
- Wulandari, C.; Novriyanti, N.; Iswandaru, D. Integrating ecological, social and policy aspects to develop peatland restoration strategies in orang kayo hitam forest park, jambi, indonesia. Biodiversitas 2021, 22, 4158–4168. [Google Scholar] [CrossRef]
- Syahza, A.; Suwondo; Bakce, D.; Nasrul, B. Utilization of peatlands based on local wisdom and community welfare in Riau Province, Indonesia. Int. J. Sustain. Dev. Plan. 2020, 15, 1119–1126. [Google Scholar] [CrossRef]
- Puryajati, A.D.; Wirastria, A.; Maslukah, L. The Effect of ENSO and IOD on the Variability of Sea Surface Temperature and Rainfall in the Natuna Sea. In IOP Conference Series: Earth and Environmental Science, Proceedings of the 6th International Conference on Tropical Coastal Region Eco-Development 2020, Semarang, Indonesia, 27–28 October 2020; IOP Publishing: Bristol, UK, 2021; Volume 750, p. 012020. [Google Scholar] [CrossRef]
- Cao, T.; Zheng, F.; Fang, X. Key Processes on Triggering the Moderate 2020/21 La Niña Event as Depicted by the Clustering Approach. Front. Earth Sci. 2022, 10, 822854. [Google Scholar] [CrossRef]
- Polonsky, A.; Torbinsky, A. The iod–enso interaction: The role of the Indian Ocean current’s system. Atmosphere 2021, 12, 1662. [Google Scholar] [CrossRef]
- Sambah, A.B.; Noor’izzah, A.; Intyas, C.A.; Widhiyanuriyawan, D. Analysis of the effect of ENSO and IOD on the productivity of yellowfin tuna (Thunnus albacares) in the South Indian Ocean, East Java, Indonesia. Biodiversitas 2023, 24, 2689–2700. [Google Scholar] [CrossRef]
- Ratna, S.B.; Cherchi, A.; Osborn, T.J.; Joshi, M. The Extreme Positive Indian Ocean Dipole of 2019 and Associated Indian Summer Monsoon Rainfall Response. Geophys. Res. Lett. 2021, 48, e2020GL091497. [Google Scholar] [CrossRef]
- Kurniadi, A.; Weller, E.; Min, S.K.; Seong, M.G. Independent ENSO and IOD impacts on rainfall extremes over Indonesia. Int. J. Climatol. 2021, 41, 3640–3656. [Google Scholar] [CrossRef]
- Puspasari, R.; Rahmawati, P.F.; Prianto, E. The Effect of ENSO (El Nino Southern Oscillation) phenomenon on Fishing Season of Small Pelagic Fishes in Indonesia Waters. In IOP Conference Series: Earth and Environmental Science, Proceedings of the 10th International and National Seminar on Fisheries and Marine Science (ISFM X 2021), Pekanbaru, Indonesia, 15–16 September 2021; IOP Publishing: Bristol, UK, 2021; Volume 934, p. 012018. [Google Scholar] [CrossRef]
- Shi, C.; Liew, S.C. Vegetation fires in the peatlands of sumatra in 2019. In Proceedings of the ACRS 2020—41st Asian Conference on Remote Sensing, Huzhou, China, 9–11 November 2020; Available online: https://scholarbank.nus.edu.sg/handle/10635/243421 (accessed on 12 June 2023).
- Uda, S.K.; Hein, L.; Atmoko, D. Assessing the health impacts of peatland fires: A case study for Central Kalimantan, Indonesia. Environ. Sci. Pollut. Res. 2019, 26, 31315–31327. [Google Scholar] [CrossRef]
- Yuwati, T.W.; Rahmanadi, D.; Pratiwi. Restoration of degraded tropical peatland in indonesia: A review. Land 2021, 10, 1170. [Google Scholar] [CrossRef]
- Budiningsih, K.; Putra, P.B.; Nurlia, A.; Ulya, N.A. Peatland restoration research: A global overview with insights from Indonesia. J. Ecol. Environ. 2024, 48, 263–276. [Google Scholar] [CrossRef]
- Sulaiman, A.; Osaki, M.; Takashi, H. Peatland groundwater level in the Indonesian maritime continent as an alert for El Niño and moderate positive Indian Ocean dipole events. Sci. Rep. 2023, 13, 939. [Google Scholar] [CrossRef]
- Hund, S.V.; Grossmann, I.; Steyn, D.G.; Allen, D.M.; Johnson, M.S. Changing Water Resources Under El Niño, Climate Change, and Growing Water Demands in Seasonally Dry Tropical Watersheds. Water Resour. Res. 2021, 57, e2020WR028535. [Google Scholar] [CrossRef]
- Kolusu, S.R.; Shamsudduha, M.; Todd, M.C.; Taylor, R.G.; Seddon, D.; Kashaigili, J.J. The El Niño event of 2015–2016: Climate anomalies and their impact on groundwater resources in East and Southern Africa. Hydrol. Earth Syst. Sci. 2019, 23, 1751–1762. [Google Scholar] [CrossRef]
- Nurdiati, S.; Bukhari, F.; Julianto, M.T.; Sopaheluwakan, A.; Aprilia, M.; Fajar, I.; Septiawan, P.; Najib, M.K. The impact of El Niño southern oscillation and Indian Ocean Dipole on the burned area in Indonesia. Terr. Atmos. Ocean. Sci. 2022, 33, 16. [Google Scholar] [CrossRef]
- Ricky Anak Kemarau, R.A.; Booa, W.H.; Sakawia, Z.; Dambulb, R.; Suabc, S.A.; Jaafara, W.S.W.M.; Eboyd, O.V.; Norzina, M.A.F. Impact of El Niño, Indian Ocean dipole, and Madden–Julian oscillation on land surface temperature in Kuching City Sarawak, during the periods of 1997/1998 and 2015/2016: A pilot study. J. Water Clim. Change 2024, 33, 3702–3723. [Google Scholar] [CrossRef]
Disclaimer/Publisher’s Note: The statements, opinions and data contained in all publications are solely those of the individual author(s) and contributor(s) and not of MDPI and/or the editor(s). MDPI and/or the editor(s) disclaim responsibility for any injury to people or property resulting from any ideas, methods, instructions or products referred to in the content. |
© 2025 by the authors. Licensee MDPI, Basel, Switzerland. This article is an open access article distributed under the terms and conditions of the Creative Commons Attribution (CC BY) license (https://creativecommons.org/licenses/by/4.0/).