Abstract
Greenhouse gas emissions are primary drivers of climate change, and the intensification of extreme heat and urban heat island effects poses serious threats to urban ecosystems, public health, and energy consumption. This study systematically evaluated the carbon reduction potential of 369 urban parks in Jinan during extreme heat events using land surface temperature (LST) retrieval, combined with CatBoost + SHAP machine learning methods. Results indicate that the LST in Jinan ranged from 1.77 °C to 59.44 °C, and 278 parks exhibited significant cooling effects, collectively saving 2943 tons of CO2 per day—offsetting 11.28% of the city’s fossil fuel emissions. Small parks, such as community parks, demonstrated higher carbon-saving efficiency (CSE), while large ecological parks showed greater carbon-saving intensity (CSI). CSE was strongly correlated with vegetation coverage and surrounding population density, with efficiency increasing when the vegetation index was within 0.3–0.7 and population density ranged 0–5000 or 15,000–22,500 people. CSI was influenced by evapotranspiration and park geometric form, increasing significantly when the park area exceeded 250 hectares or evapotranspiration ranged 2.5–6.0. However, elevation and albedo negatively impacted both metrics, with the lowest CSI observed when elevation exceeded 150 m or albedo surpassed 18%.
1. Introduction
The intensification of global climate change, particularly the rise in greenhouse gas emissions, has exacerbated the urban heat island (UHI) effect, which has profound implications for urban living conditions [1,2]. UHI not only leads to significantly higher temperatures in urban areas compared to surrounding rural regions but also intensifies energy consumption, particularly during the summer when increased air conditioning use further escalates carbon emissions [3,4]. Therefore, mitigating the UHI effect has become a critical priority for improving urban environmental quality, reducing energy demand, and enhancing thermal comfort for residents [5,6]. Numerous studies have shown that urban parks and green spaces, as essential components of urban ecological infrastructure, play a crucial role in reducing urban temperatures through mechanisms such as plant transpiration and shading, which help mitigate the UHI effect [7,8]. Furthermore, urban parks contribute significantly to reducing air conditioning energy consumption, thereby lowering carbon emissions and demonstrating notable carbon mitigation potential [9,10]. In light of these findings, investigating the cooling and carbon reduction effects of urban parks is of both theoretical and practical importance.
Urban parks and green spaces are pivotal in reducing temperatures and, consequently, lowering carbon emissions. A growing body of research has examined the carbon-saving potential of urban parks at various scales. For example, during extreme heat events in Xi’an, urban parks were found to offset approximately 3.6% of fossil fuel carbon emissions [11]. Similarly, Chen et al. (2023) highlighted that the Yangtze River Economic Belt (YREB) has significant potential to mitigate climate change, capable of offsetting 5.37% of fossil fuel emissions [12]. These studies underscore the critical role urban parks play in mitigating urban heat effects and addressing climate change. However, research on the carbon reduction capacity of urban parks during extreme heat events remains relatively sparse, particularly studies that assess this potential from a cumulative perspective. By further exploring the cooling effects of urban parks under different climate conditions and their impact on carbon emissions, a more comprehensive understanding of their role in urban sustainability can be developed. This study aims to fill this research gap by systematically evaluating the carbon reduction potential of urban parks during extreme heat events, thereby providing scientific evidence to inform urban planning and management strategies.
A significant body of research suggests that the type of urban park and the landscape composition within individual parks strongly influence their carbon reduction potential [13,14]. For instance, variations in landscape features, such as the proportion of water bodies and vegetation cover, directly affect the park’s carbon reduction capacity [15]. Compared to green spaces in natural ecosystems, urban green spaces are more complex, and their carbon reduction potential is highly influenced by the surrounding environment [16]. Additionally, socioeconomic development and growing urban populations place indirect pressure on the capacity of urban forest ecosystems [17]. The density of the urban road network, reflecting the complexity of the transportation system, contributes to the intensification of the UHI effect [18]. Albedo and evapotranspiration rates of vegetation in urban parks also play a role in determining how different plant species affect local climate and carbon reduction efficiency [19]. Thus, the cooling effect of urban parks not only directly influences local climate conditions but also indirectly enhances carbon reduction by regulating the carbon cycle.
Regarding the factors influencing carbon reduction outcomes, previous studies have demonstrated the powerful predictive capabilities of machine learning methods in capturing the nonlinear relationships between morphological indicators and carbon reduction. Machine learning techniques, owing to their flexibility and strong adaptability in solving nonlinear regression problems, have become widely adopted. Lundberg and Lee’s introduction of the Shapley Additive Explanations (SHAP) algorithm [20] has proven valuable in explaining the relative contributions of various factors. Traditional linear models often struggle to characterize the complex interactions between urban morphological features—such as building density, green space coverage, and landscape shape index—and carbon reduction efficiency. In contrast, machine learning models can identify nonlinear patterns and interaction effects, offering valuable insights for optimizing carbon reduction strategies. Furthermore, decision tree-based models, including Random Forests and Gradient Boosting Trees, along with deep learning methods, have been shown to effectively uncover the nonlinear associations between multidimensional morphological features and carbon emissions. For instance, Qi et al. (2019) employed XGBoost and ANN models to simulate and analyze the Net Ecosystem Exchange (NEE) of urban green spaces, accurately determining the influence of environmental factors on NEE. The interpretability of these complex models has become a key research focus, with algorithms like SHAP widely used to identify the specific impact pathways and the relative importance of key morphological features on carbon reduction efficiency [21,22]. The application of these methods not only improves prediction accuracy but also provides practical insights for optimizing urban design.
In light of these considerations, Jinan was chosen as the study area to explore the cooling and carbon reduction potential of urban parks. The specific objectives of this research are as follows: (1) to quantify the carbon-saving effects of urban parks in Jinan, Shandong Province; (2) to examine the mechanisms through which various factors influence carbon reduction; and (3) to propose carbon-saving strategies, offering recommendations and guidance for urban planning and design. The study aims to more accurately present the CSE and CSI characteristics of different types of parks using CatBoost + SHAP, in order to better explore carbon reduction potential.
2. Materials and Methods
2.1. Research Area and Data Collection
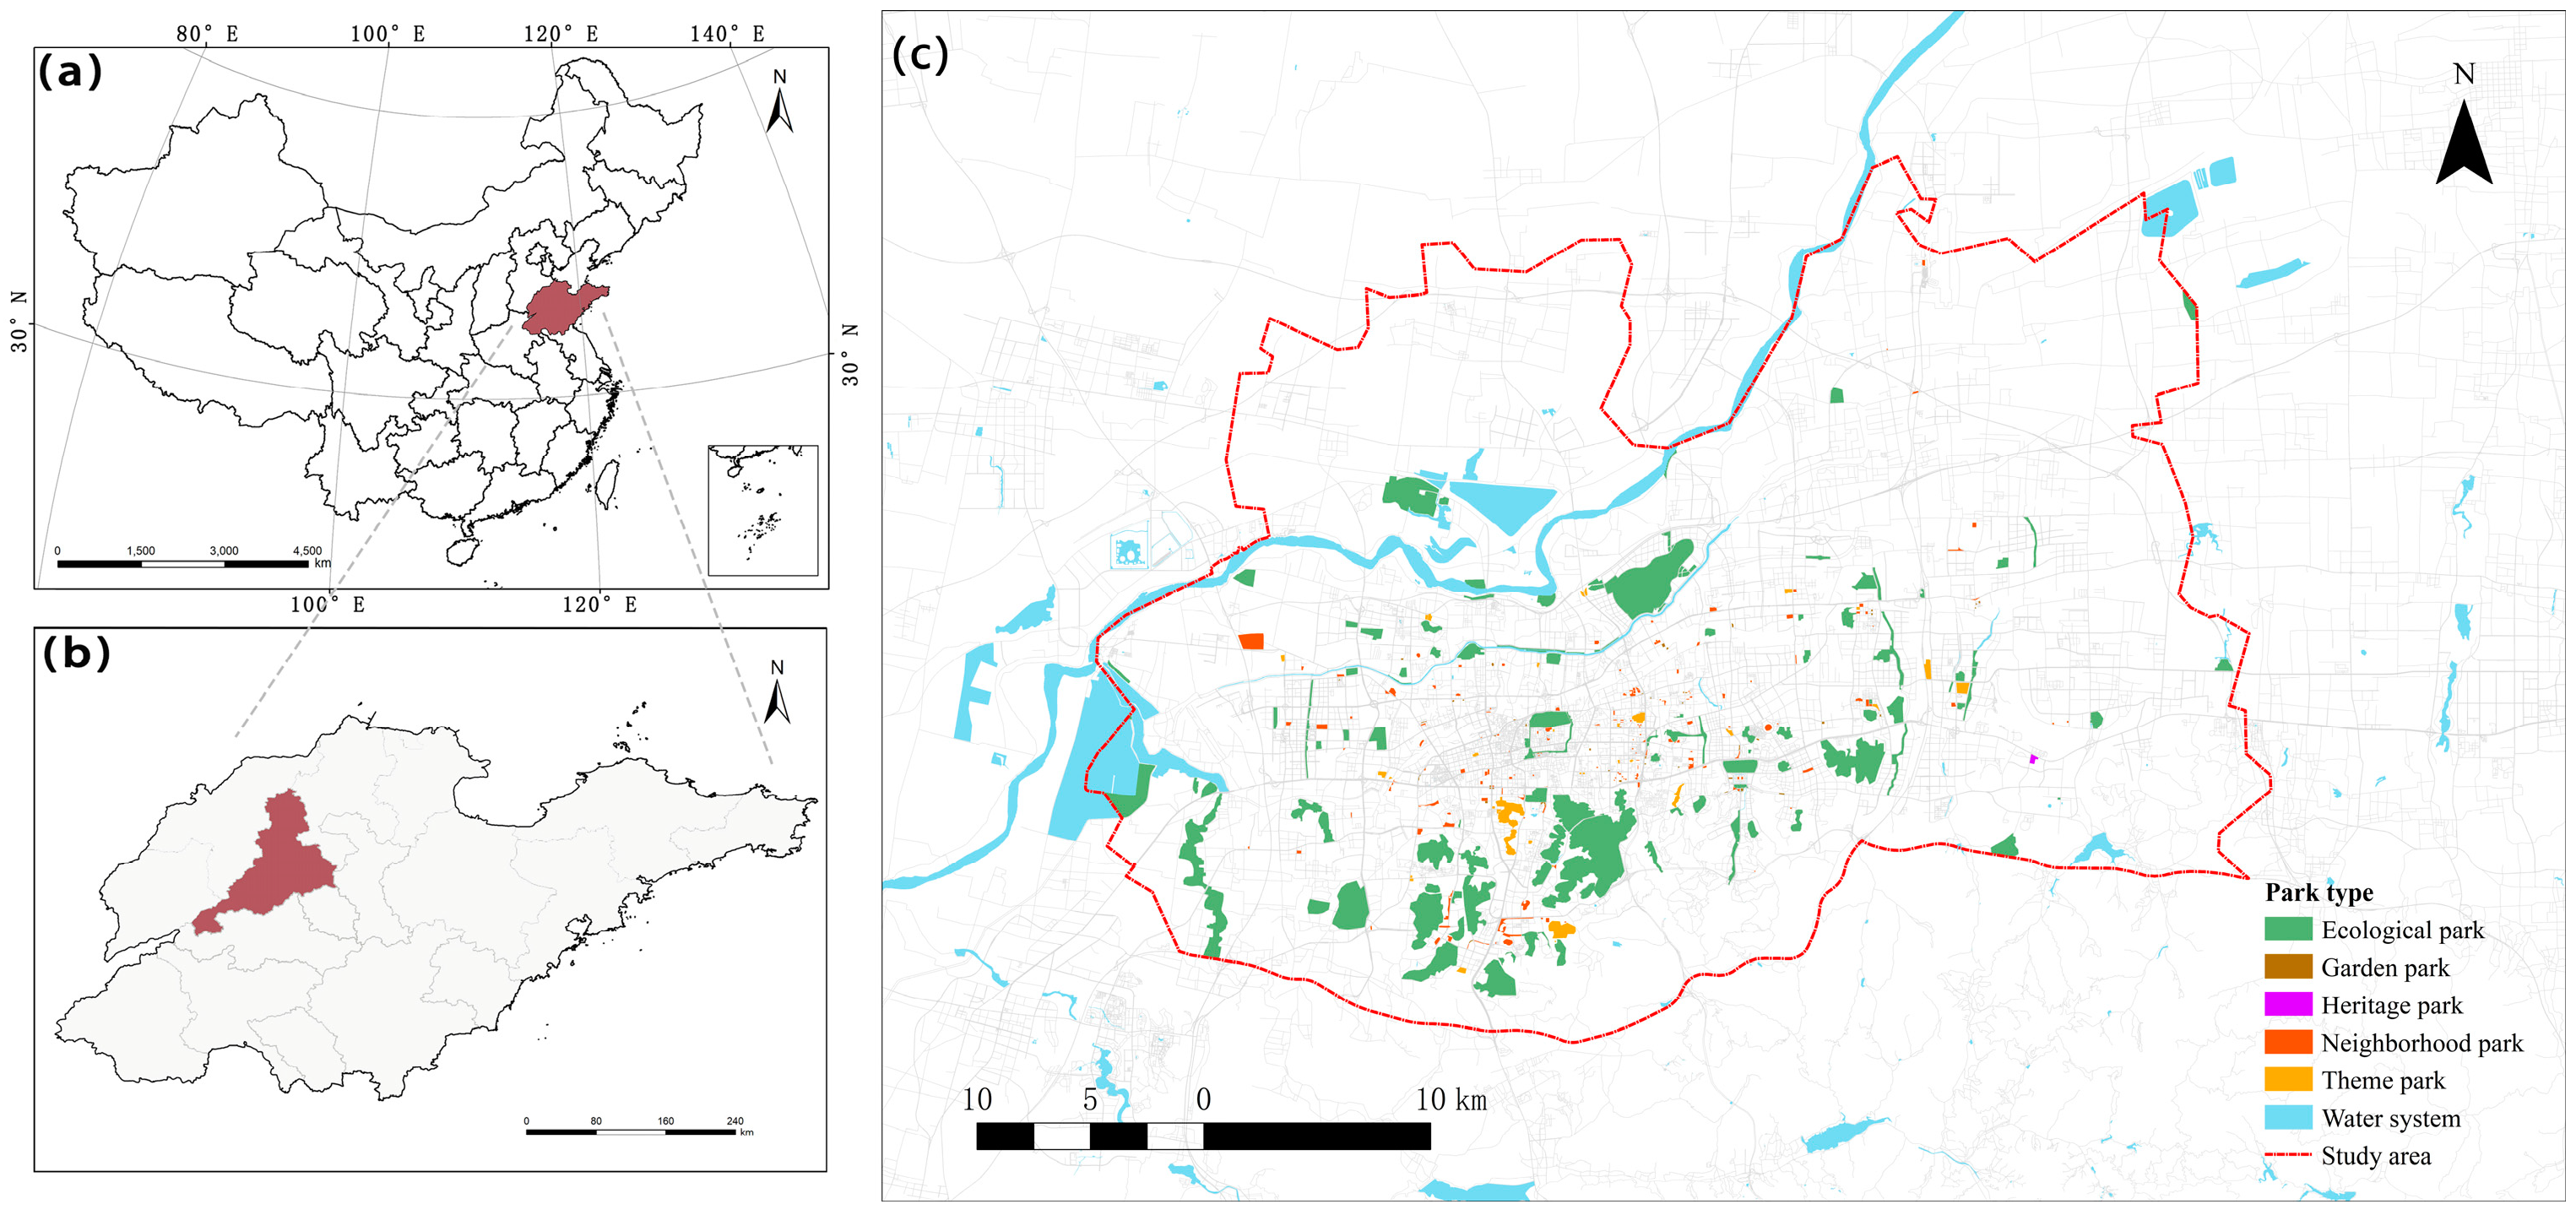
This study selects Jinan (36°40′ N, 117°00′ E), a typical temperate monsoon climate city, as the research site. Jinan experiences hot and humid summers and cold and dry winters. During the hottest months, the average temperature can reach 27 °C, while the coldest month has an average temperature of only −1 °C. The annual precipitation is approximately 685 mm, with over 60% of it concentrated in the summer months (https://weather.cma.cn) accessed on 10 June 2023. These climate characteristics make the urban heat island effect in Jinan particularly pronounced, and the demand for cooling and carbon reduction functions in urban parks is urgent under extreme heat conditions. Urban green spaces can effectively lower the surrounding environmental temperature and improve the urban microclimate [3,7,23]. Therefore, the study focuses on 369 urban parks in Jinan, with park sizes ranging from 0.18 hectares to 848.2 hectares. Based on the latest urban green space classification standards, the parks are categorized into the following types: theme parks, heritage parks, ecological parks, community parks, and small recreational parks (Figure 1). These parks not only provide recreational spaces for residents but also play a significant role in improving the urban environment and enhancing ecological quality [24]. The study date was chosen as 10 June 2023, which is a typical summer period with the best data source and a typical day for extreme heat events. The data used in this study are provided in Table 1.
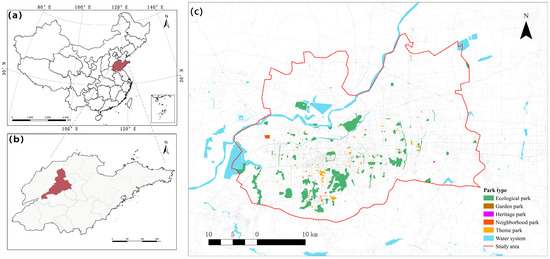
Figure 1.
(a–c) Study area and distribution of urban park types.

Table 1.
Data source and description.
2.2. Methods
2.2.1. Research Framework
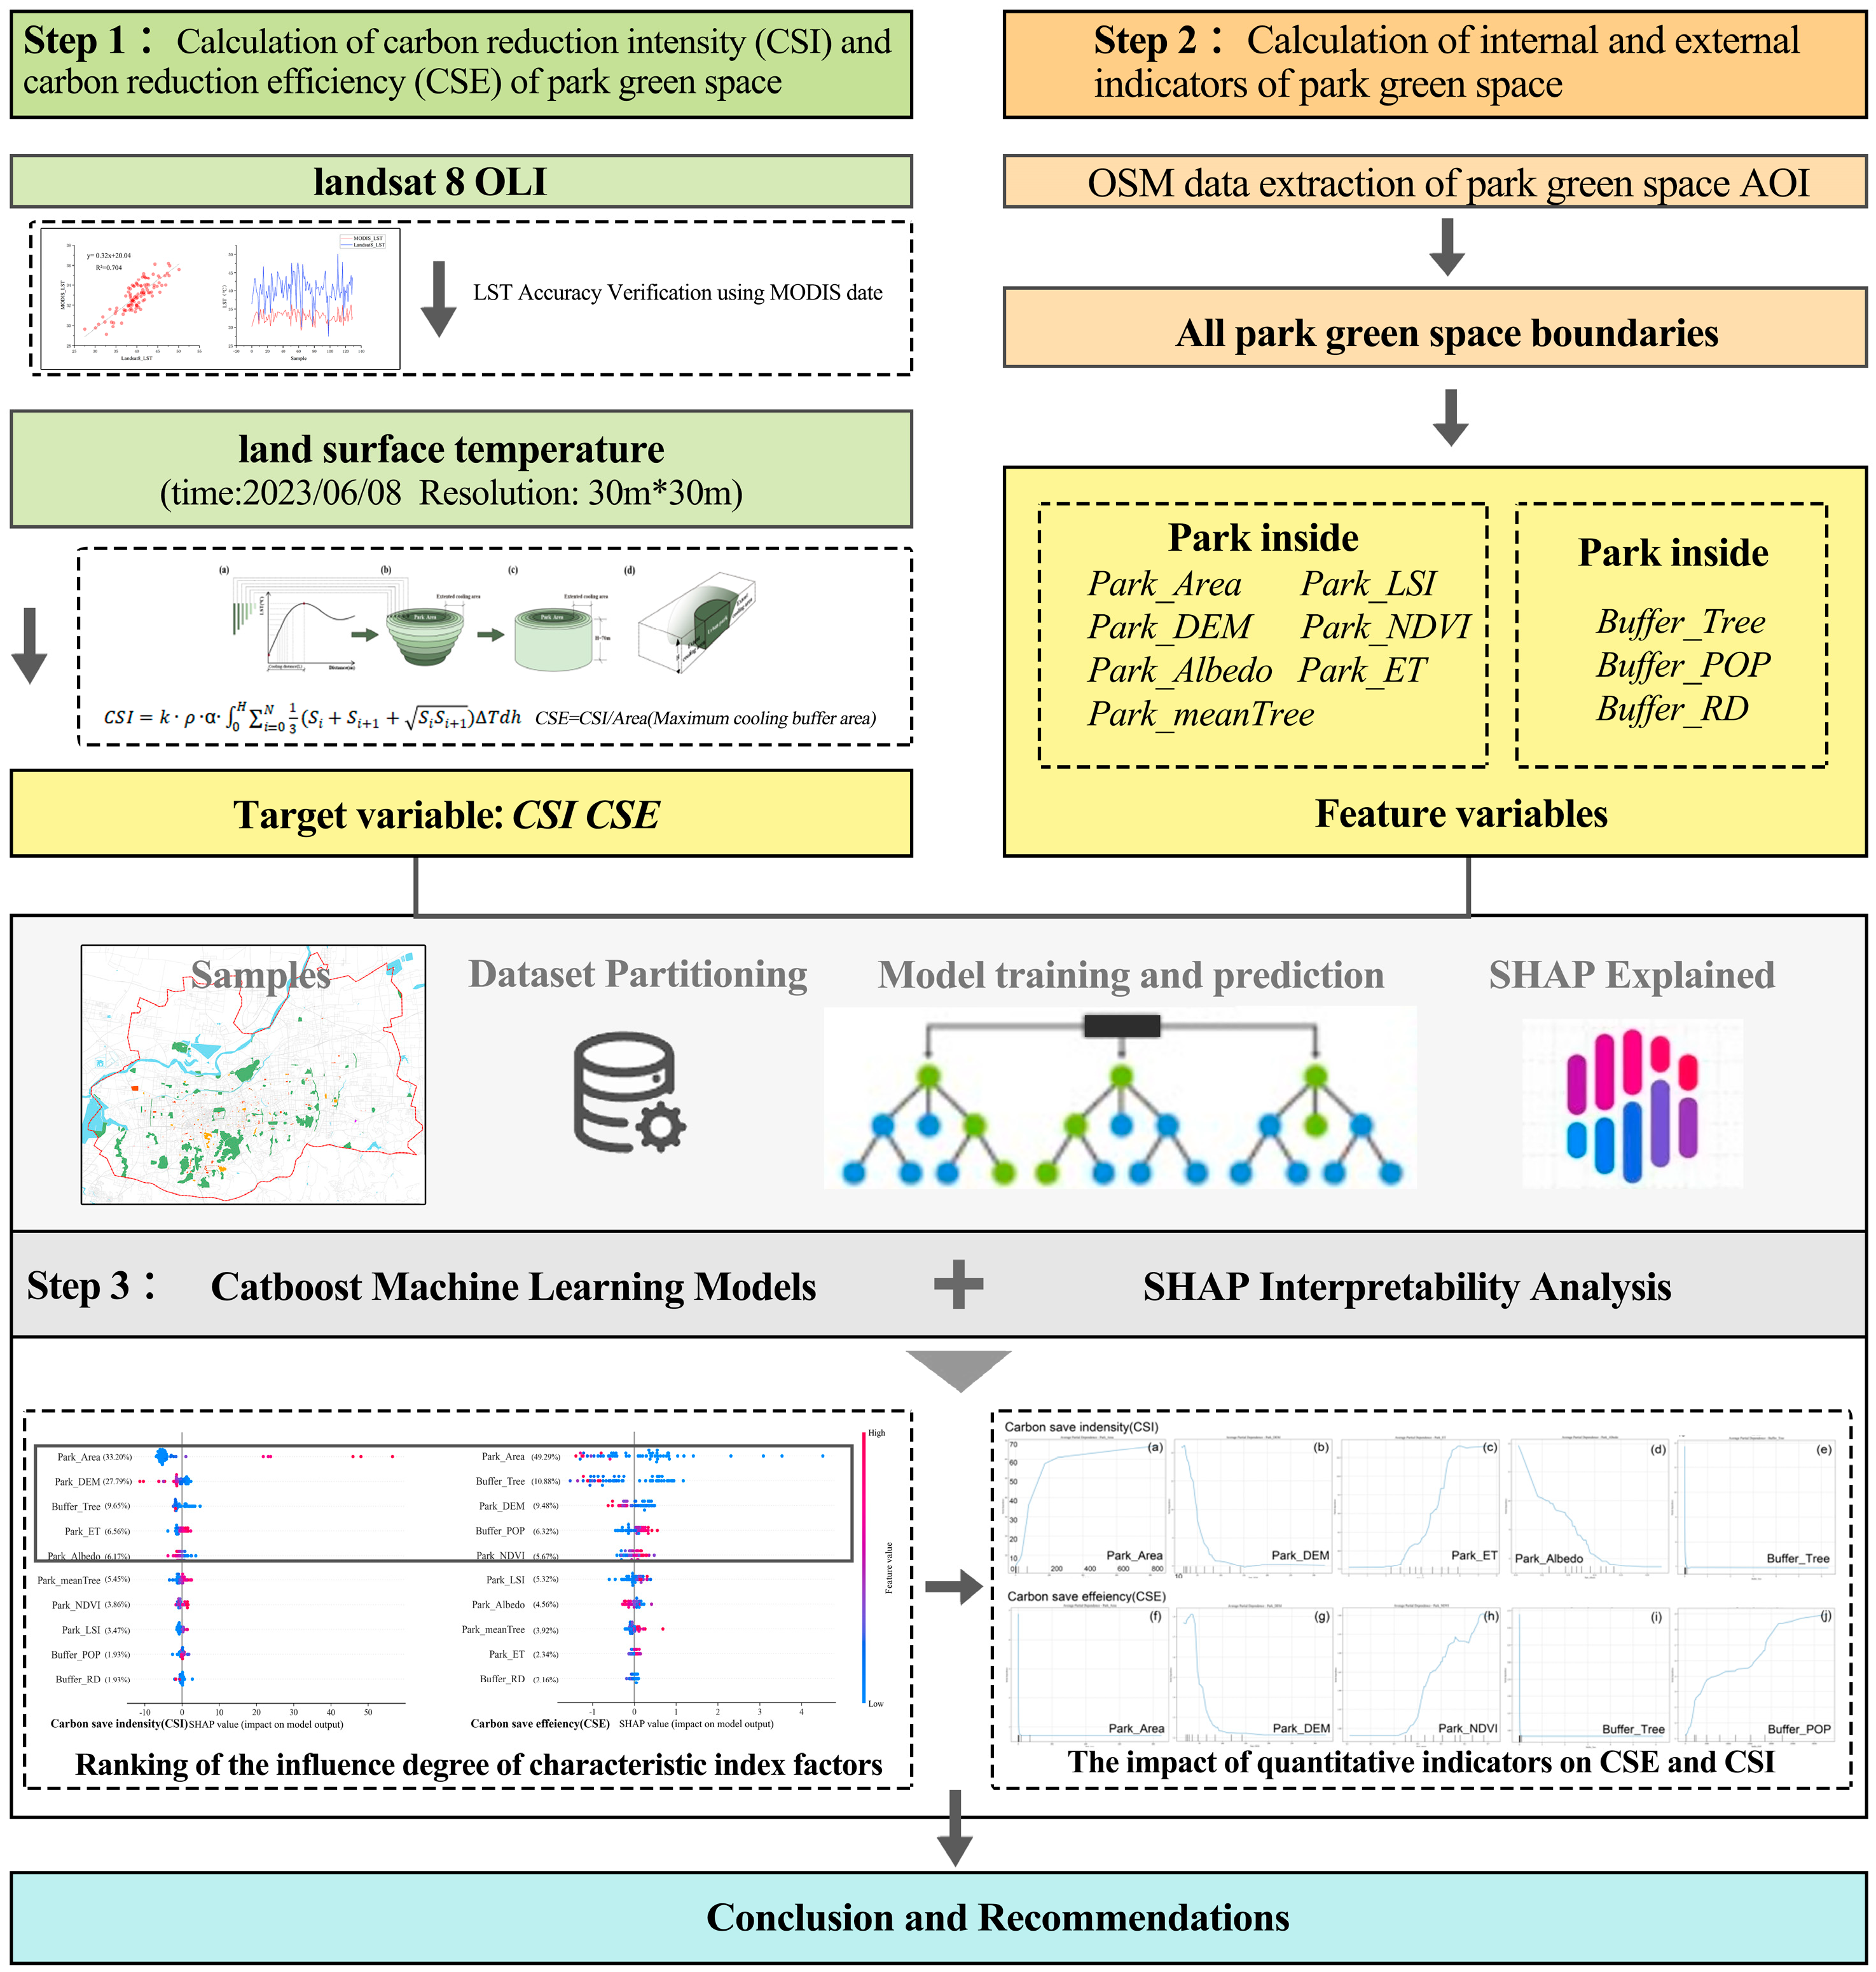
This research utilizes a three-dimensional cumulative model to quantify the carbon reduction capacity of urban park green spaces. The model offers an in-depth evaluation of the spatial distribution of carbon reduction resulting from cooling effects and establishes a comprehensive carbon reduction indicator framework. Furthermore, interpretable machine learning methods, including CatBoost and Shapley Additive Explanations (SHAP), are applied to investigate the spatial mechanisms driving carbon reduction in urban park green spaces. The research methodology proceeds as follows (see Figure 2): Initially, the Radiative Transfer Equation (RTE) algorithm is employed to extract land surface temperature (LST) from Landsat 8 OLI data. MODIS data are then used to assess the accuracy of the LST. By merging these datasets, an integrated evaluation system is developed. Subsequently, a visual interpretation of the parks within the study area is performed to calculate the relevant impact indices. Lastly, interpretable machine learning techniques are applied to quantitatively analyze the relative contributions and mechanisms of the factors influencing the carbon reduction potential of urban green spaces.
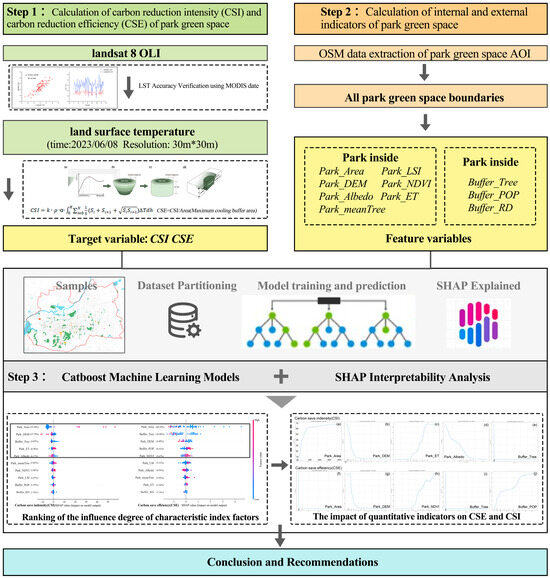
Figure 2.
Research flowchart.
2.2.2. LST Retrieval
This study utilizes Landsat 8 OLI-TIR Collection 2 Level 2 products to download remote sensing imagery for land surface temperature (LST) retrieval. A high-quality image with cloud contamination below 5% was selected for analysis. Meteorological data for the image capture date were obtained from the China National Meteorological Center (https://weather.cma.cn (accessed on 24 September 2023)), with clear, rain-free weather conditions in Jinan on that day, ensuring stable climatic conditions conducive to clear image data acquisition. The study employs the Radiative Transfer Equation (RTE) (Equation (1)) to model the process of surface radiation influenced by the atmosphere.
In the equation, Lλ represents the thermal infrared radiation brightness received by the satellite sensor. ε is the land surface emissivity (LSE), L↑ is the upward radiation brightness emitted by the atmosphere, and L↓ is the downward radiation reflected back to the ground by the atmosphere, which corresponds to the surface physical temperature. All data can be accessed through NASA’s website (http://latmcor.gsfc.nasa.gov/ (accessed on 24 September 2023)). B(Ts) and Ts represent the surface radiation and surface temperature, respectively, which can be calculated based on Planck’s law. The corresponding formulae are as follows (Equations (2) and (3)):
In the equation, K1 = 774.89 W/m2·Sr·μm, and K2 = 1321.08 km.
The surface emissivity represents the ratio of surface thermal radiation to blackbody thermal radiation. In this study, the modified NDVI conversion is used, and the emissivity of water bodies is defined as shown in Equation (4).
In the equation, represents the vegetation emissivity and represents the soil emissivity, with values for Landsat 8 TIRS Band 10 being 0.982 and 0.971, respectively. represents the reflectance for OLI Band j, and the represents the corresponding band coefficients obtained from Li and Jiang [25].
Due to the lack of ground-based actual measurements of LST, this study performs cross-validation by comparing the LST calculated using the Radiative Transfer Equation (RTE) with the MODIS land surface temperature product [26]. The accuracy of the LST image derived from the RTE calculation is further validated using the coefficient of determination (R2), root mean square error (RMSE), and mean absolute error (MAE), as shown in Equations (5)–(8).
In the equation, and are the validated and the actual values, and are the mean values of the validated and the actual values, and n is the number of samples validated.
2.2.3. Quantifying the Carbon Reduction Potential and Offset Value of Urban Parks
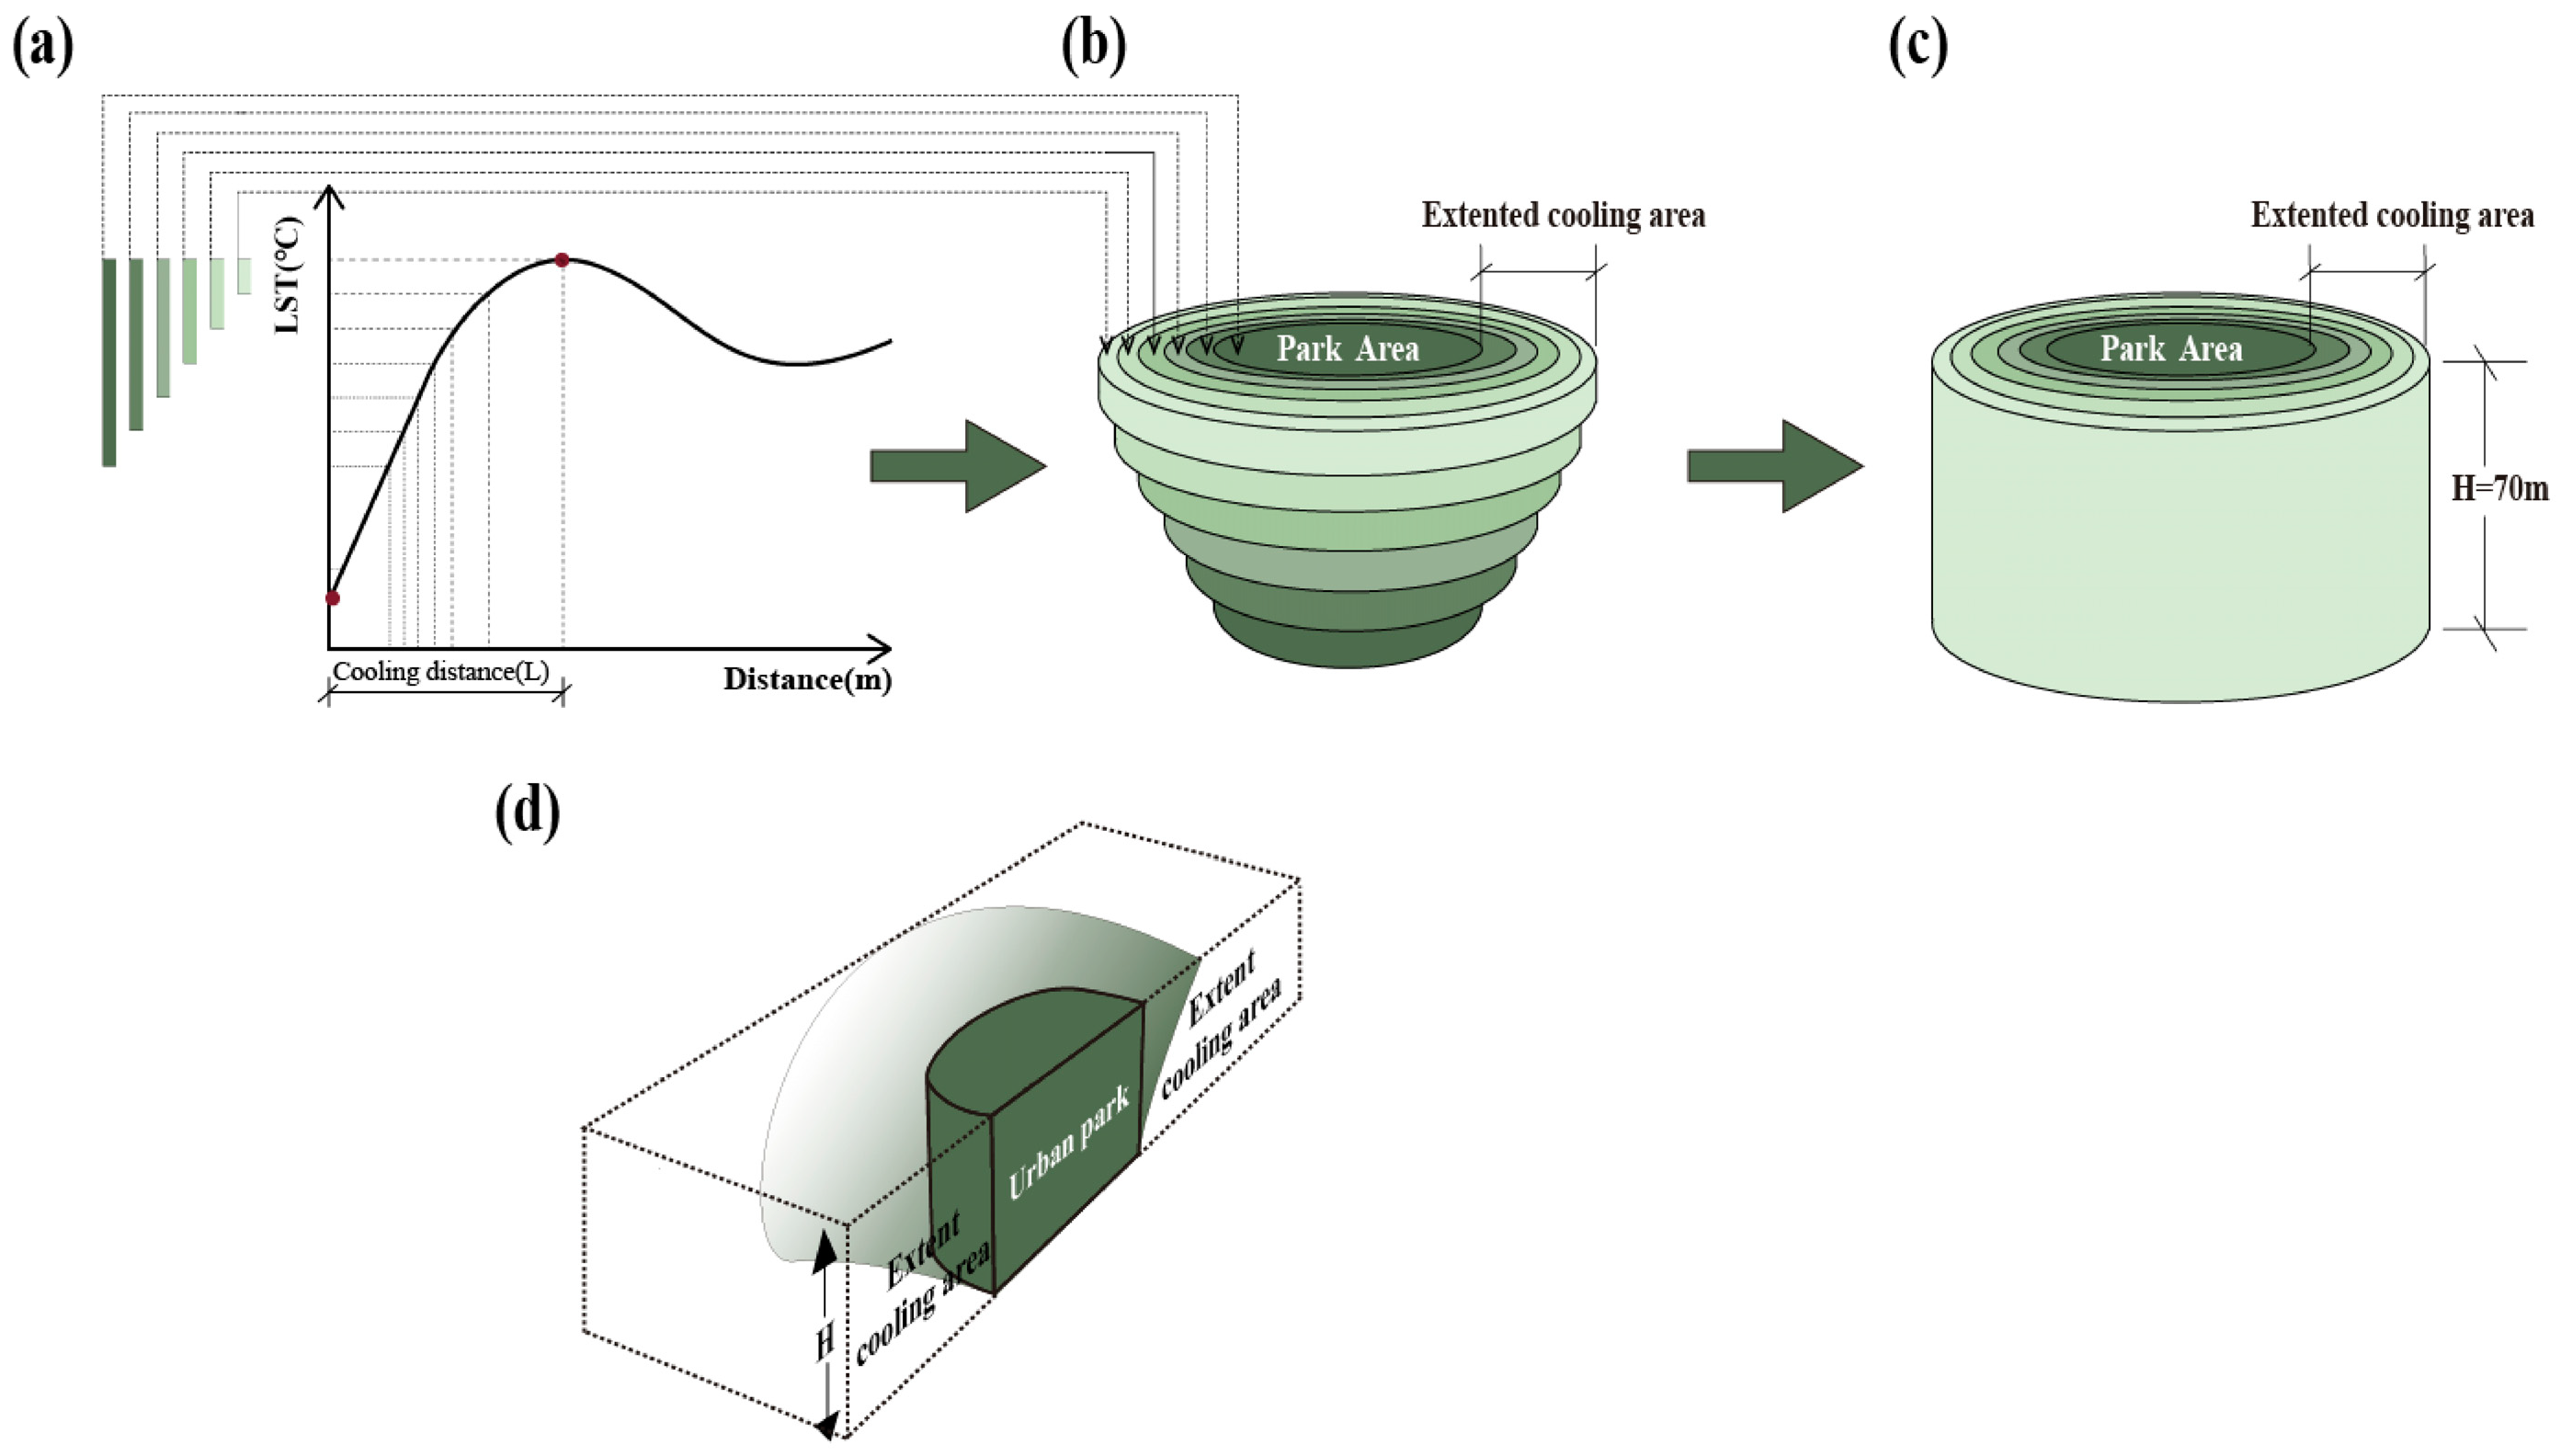
This study quantifies the Carbon reduction effect of urban parks using two key indicators: carbon-saving intensity (CSI) and carbon-saving efficiency (CSE). First, the maximum cooling distance of the park is determined for subsequent analysis. Figure 3a shows the analysis of the cooling curves which indicates that the land surface temperature increases as the distance from the park’s edge grows, though the temperature difference diminishes once a critical threshold distance is reached. Typically, the cooling effect is limited to a radius of 900 m. Given the spatial resolution of 30 m for land surface temperature, this study defines a continuous buffer zone at 30 m intervals. Polynomial fitting is applied to model the cooling curves for park distances within buffer zones of 300 m, 600 m, and 900 m, allowing for the identification of the most accurate correlation (Figure 3a). The corresponding polynomial equation is presented in Equation (9).
The independent variable L represents the distance between the urban park boundary and the buffer zone, while the dependent variable T(L) is the average land surface temperature at a distance of L from the park boundary. By analyzing the average temperature within each buffer zone, the first point of temperature decrease can be visually identified, marking the point at which the surface temperature begins to drop as the distance from the park increases.
T (L) = aL3 + bL2 + cL + d
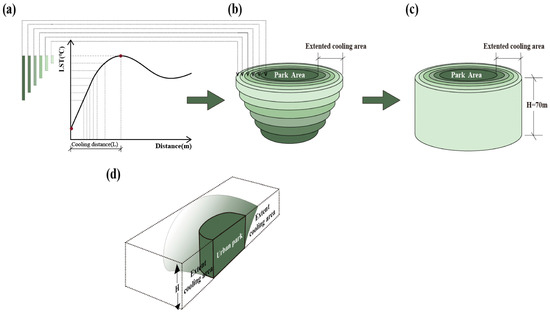
Figure 3.
(a) Cooling curves for the park. (b–d) Carbon-saving modeling for the outdoors.
The carbon reduction potential is quantified in terms of carbon emissions, and a cumulative carbon emission model based on the park’s cooling curve is used, as shown in Figure 3b–d. The LST increases from the center of the park outward, along with greater cumulative carbon reduction. The formula for cumulative carbon reduction is provided in Equation (10).
In the equation, k is the specific heat capacity of air under constant pressure, with a value of 1004.68 J/kg·°C. ρ represents air density, with a value of 1.2923 kg/m3, and α is the conversion coefficient that translates energy consumption (such as electricity or heat) into equivalent CO2 emissions, with data referenced from the National Development and Reform Commission [27]. Assuming the cooling effect is represented by a vertical sphere with a height H of 70 m, the cooling space of the park is divided into 100 sections for improved calculation accuracy, as indicated by the value of N in the equation. Si represents the bottom area of the ii-th truncated cone. ΔT denotes the temperature difference between adjacent buffer layers, and “d” is the buffer zone interval. Furthermore, based on the CSI, the CSE is the CSI divided by the area of the buffer zone of the maximum cooling distance.
Additionally, the study obtained carbon emission data for Jinan from the Anthropogenic CO2 Open Inventory [28]. Using these data, the carbon emission offset value was calculated based on the carbon reduction potential of urban parks in Jinan.
2.2.4. Selection of Influencing Factors
The study selects 10 potential indicators that may influence the cooling effect and carbon reduction in urban parks, including 7 internal indicators and 3 external indicators. The detailed description of these indicators is provided in Table 2.
Table 2.
Description of factors.
The internal indicators of the park include park area, shape index, average tree height, elevation, vegetation coverage, albedo, and evapotranspiration. The study uses the park area and shape index to represent the park’s geometric form, while average tree height, elevation, and vegetation coverage are employed to describe the overall park landscape from both three-dimensional and two-dimensional perspectives. Albedo and evapotranspiration are used to reflect variations in vegetation materials, which help explore their relationship with the park’s cooling effect and carbon reduction potential.
The external indicators include the surrounding canopy area, population density, and road network density. The study selects the surrounding canopy area to examine the influence of the surrounding landscape environment on the park’s cooling and carbon reduction effects. Additionally, population density and road network density, which reflect socioeconomic development, are chosen to further investigate their impact on the park’s cooling effect and carbon reduction capacity.
2.2.5. CatBoost-Based Interpretable Machine Learning Model
Numerous studies have highlighted the effectiveness of machine learning techniques in predicting nonlinear relationships between morphological indicators and carbon reduction [29,30]. CatBoost, a gradient boosting decision tree (GBDT) algorithm developed by Prokhorenkova et al. [31], is recognized for its strong performance in modeling complex, nonlinear relationships. Similarly to other GBDT methods such as XGBoost and LightGBM, CatBoost excels at capturing intricate patterns in data.
The CatBoost regression algorithm involves several key hyperparameters: the number of trees, which determines the number of iterations during training; the learning rate, which adjusts the contribution of each tree’s residual prediction; and the tree depth and L2 regularization coefficient, which help control overfitting. These parameters are fine-tuned through iterative testing. The dataset is divided into two sets—80% for training and 20% for testing—with features fed into the learning algorithm. The model is developed using the scikit-learn module alongside the CatBoost library in Python.
To better understand the impact of specific features on the model’s predictions, this study integrates CatBoost with SHAP (Shapley Additive Explanations), a technique that sheds light on the contribution and relative importance of key morphological features in carbon reduction efficiency. Model performance is assessed using three error metrics: mean absolute error (MAE), root mean square error (RMSE), and the coefficient of determination (R2) [32].
SHAP, introduced by Lundberg and Lee, is based on cooperative game theory and calculates the average marginal contribution of each feature to the model’s output. This method identifies the most influential features by evaluating Shapley values across various feature combinations, providing insights that are crucial for decision-making [20,33,34].
3. Results
3.1. MODIS and RTE-Based LST Cross-Validation Results
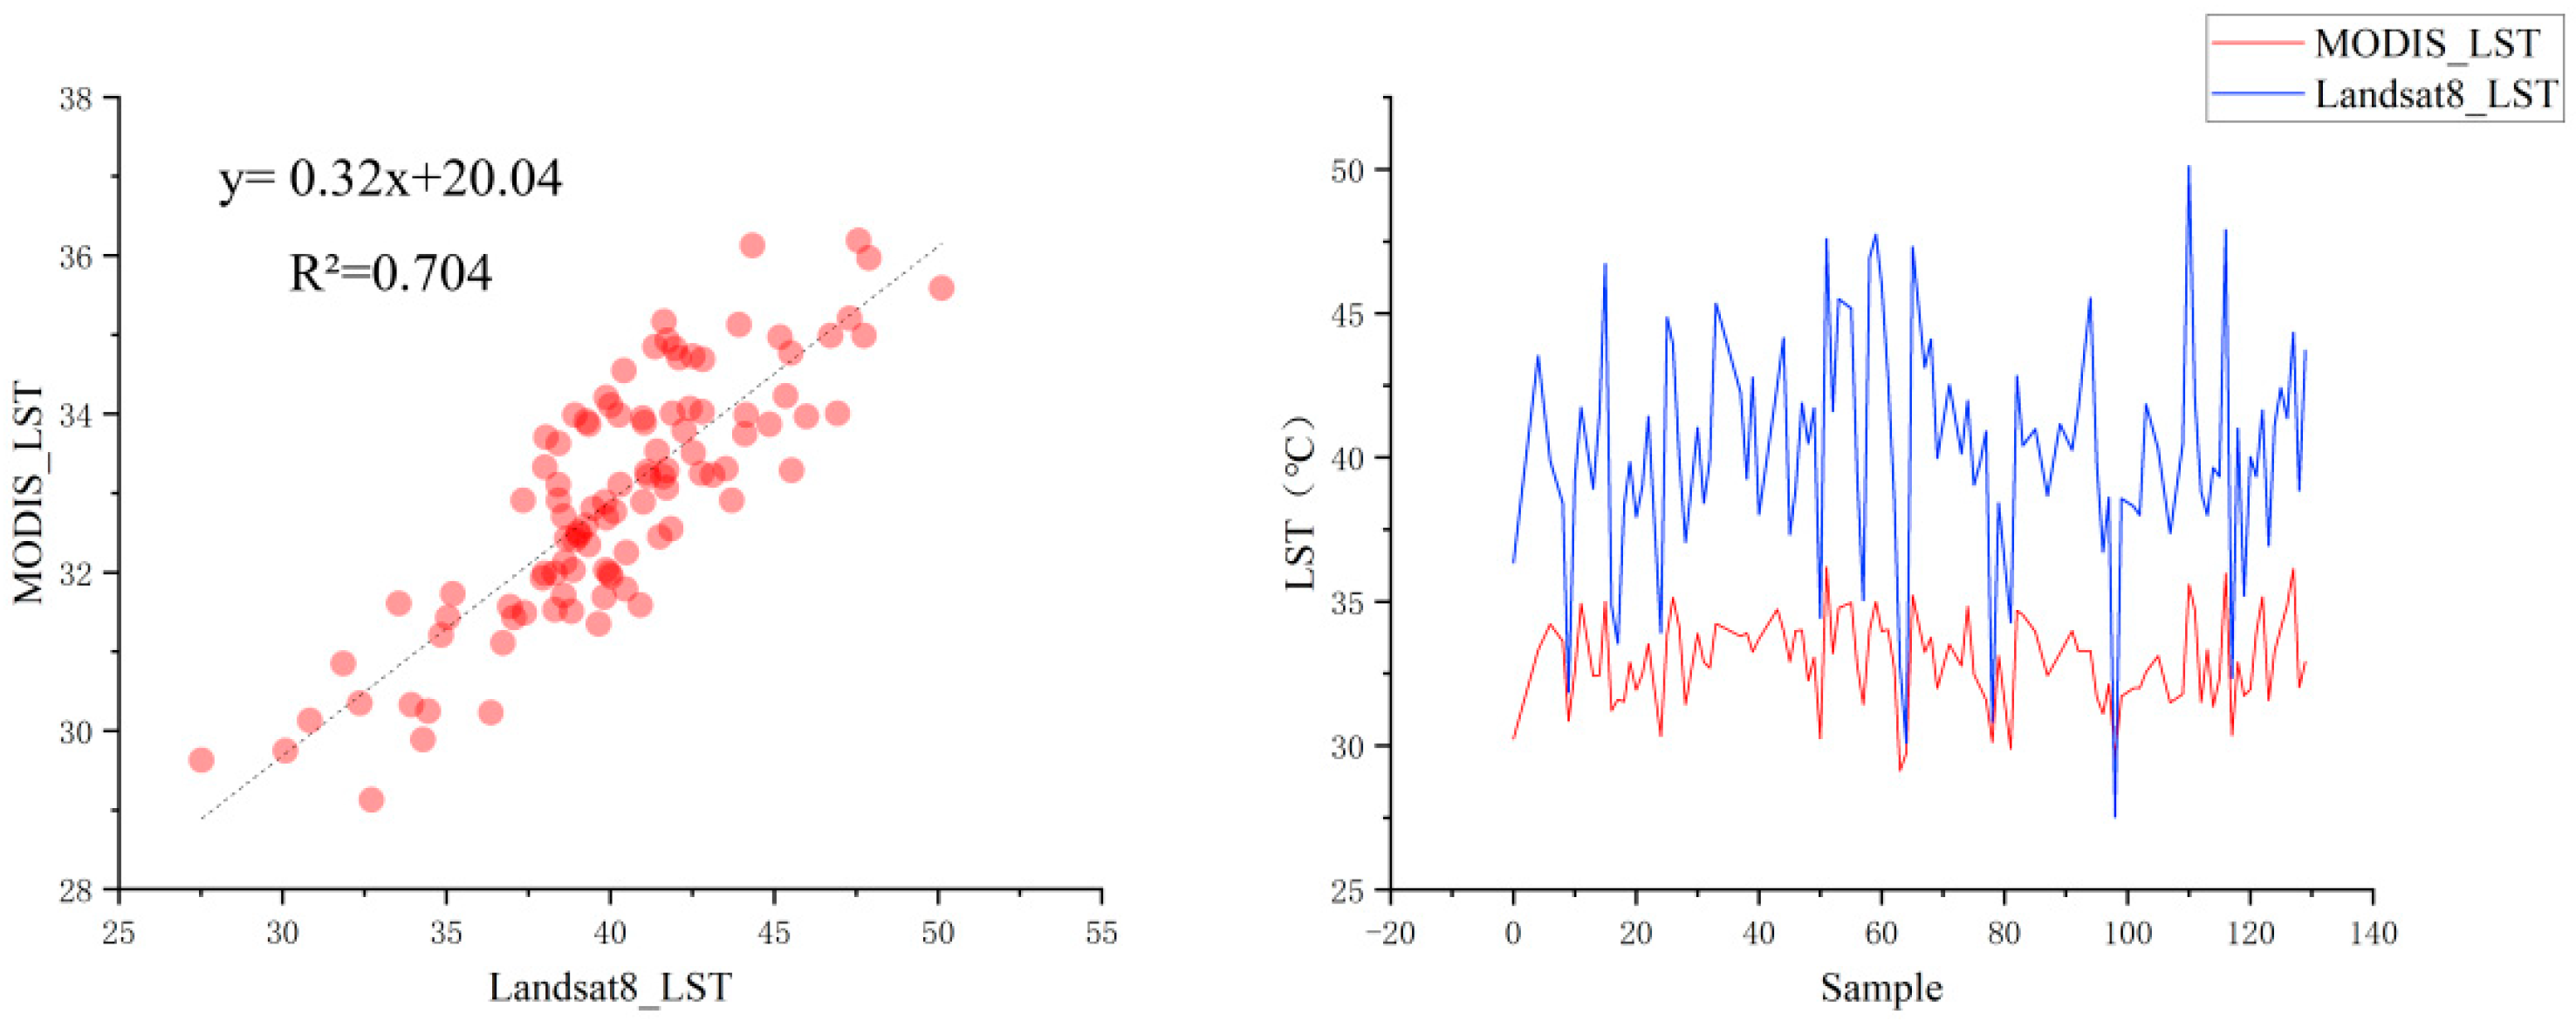
To improve the reliability of the surface temperature results, we cross-validated the surface temperature results inverted from Landsat-8 TIRS data by using MODIS surface temperature products. In ArcGIS, 100 random points were generated, and the LST retrieval results for each urban point were compared to assess their relationship, as shown in Figure 4. The LST retrieval results from the random points were consistent and highly correlated (R2 = 0.704), with a root mean square error (RMSE) of 7.7410, a mean absolute error (MAE) of 7.2480, and a bias of 7.2071. These metrics indicate that the interpolation method provides reliable accuracy. Although the spatial resolution of MODIS data is lower, after reasonable interpolation, high-resolution data can still be used for accurate LST comparisons. Overall, we conclude that the LST retrieval results employed in this study are valid and can be applied to LST-based cooling and carbon reduction research.

Figure 4.
Cross-verification of RTE-based LST.
3.2. Carbon Reduction Patterns in Urban Parks
As shown in Figure 5, the spatial distribution patterns of carbon saving intensity (CSI), carbon saving efficiency (CSE), and land surface temperature (LST) vary across the city center. It can be observed from Figure 5a that urban parks are predominantly concentrated in the central and southern parts of the city, with fewer parks located in the southwest, north, and northeast. The LST ranges from 1.77 °C to 59.44 °C, exhibiting a significant temperature variation. Areas with a higher number of parks tend to have lower LSTs, indicating a strong correlation between the number of green spaces and surface temperature. The cooling curve analysis reveals that 278 out of the 369 urban parks have a cooling effect, and these 278 parks are analyzed further. From Figure 5b,c, it is evident that parks with higher CSI tend to be larger in size, with only 40% of the parks exceeding the average CSI level. In contrast, parks with higher CSE are generally smaller, with 60% of the parks surpassing the average CSE level. In terms of park types, ecological parks exhibit higher CSI, while parks with higher CSE are typically small parks, such as recreational parks, theme parks, and community parks. Interestingly, heritage parks show negligible carbon reduction capacities in both CSI and CSE. Another notable finding is that the presence of water bodies in or around parks does not significantly affect either the CSI or CSE.
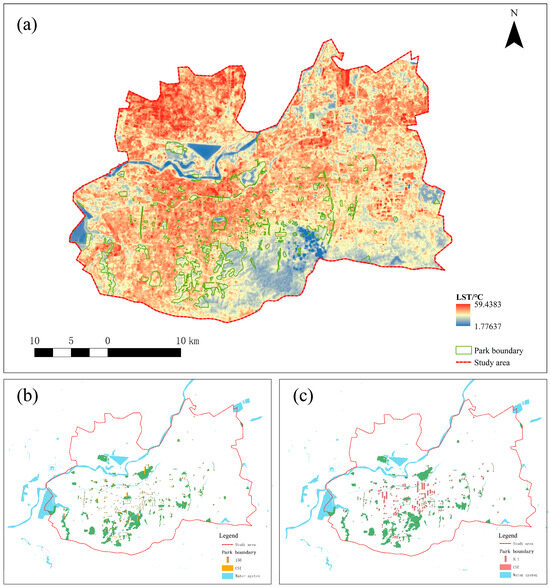
Figure 5.
(a) Land surface temperature spatial distribution; (b) CSI distribution; (c) CSE distribution.
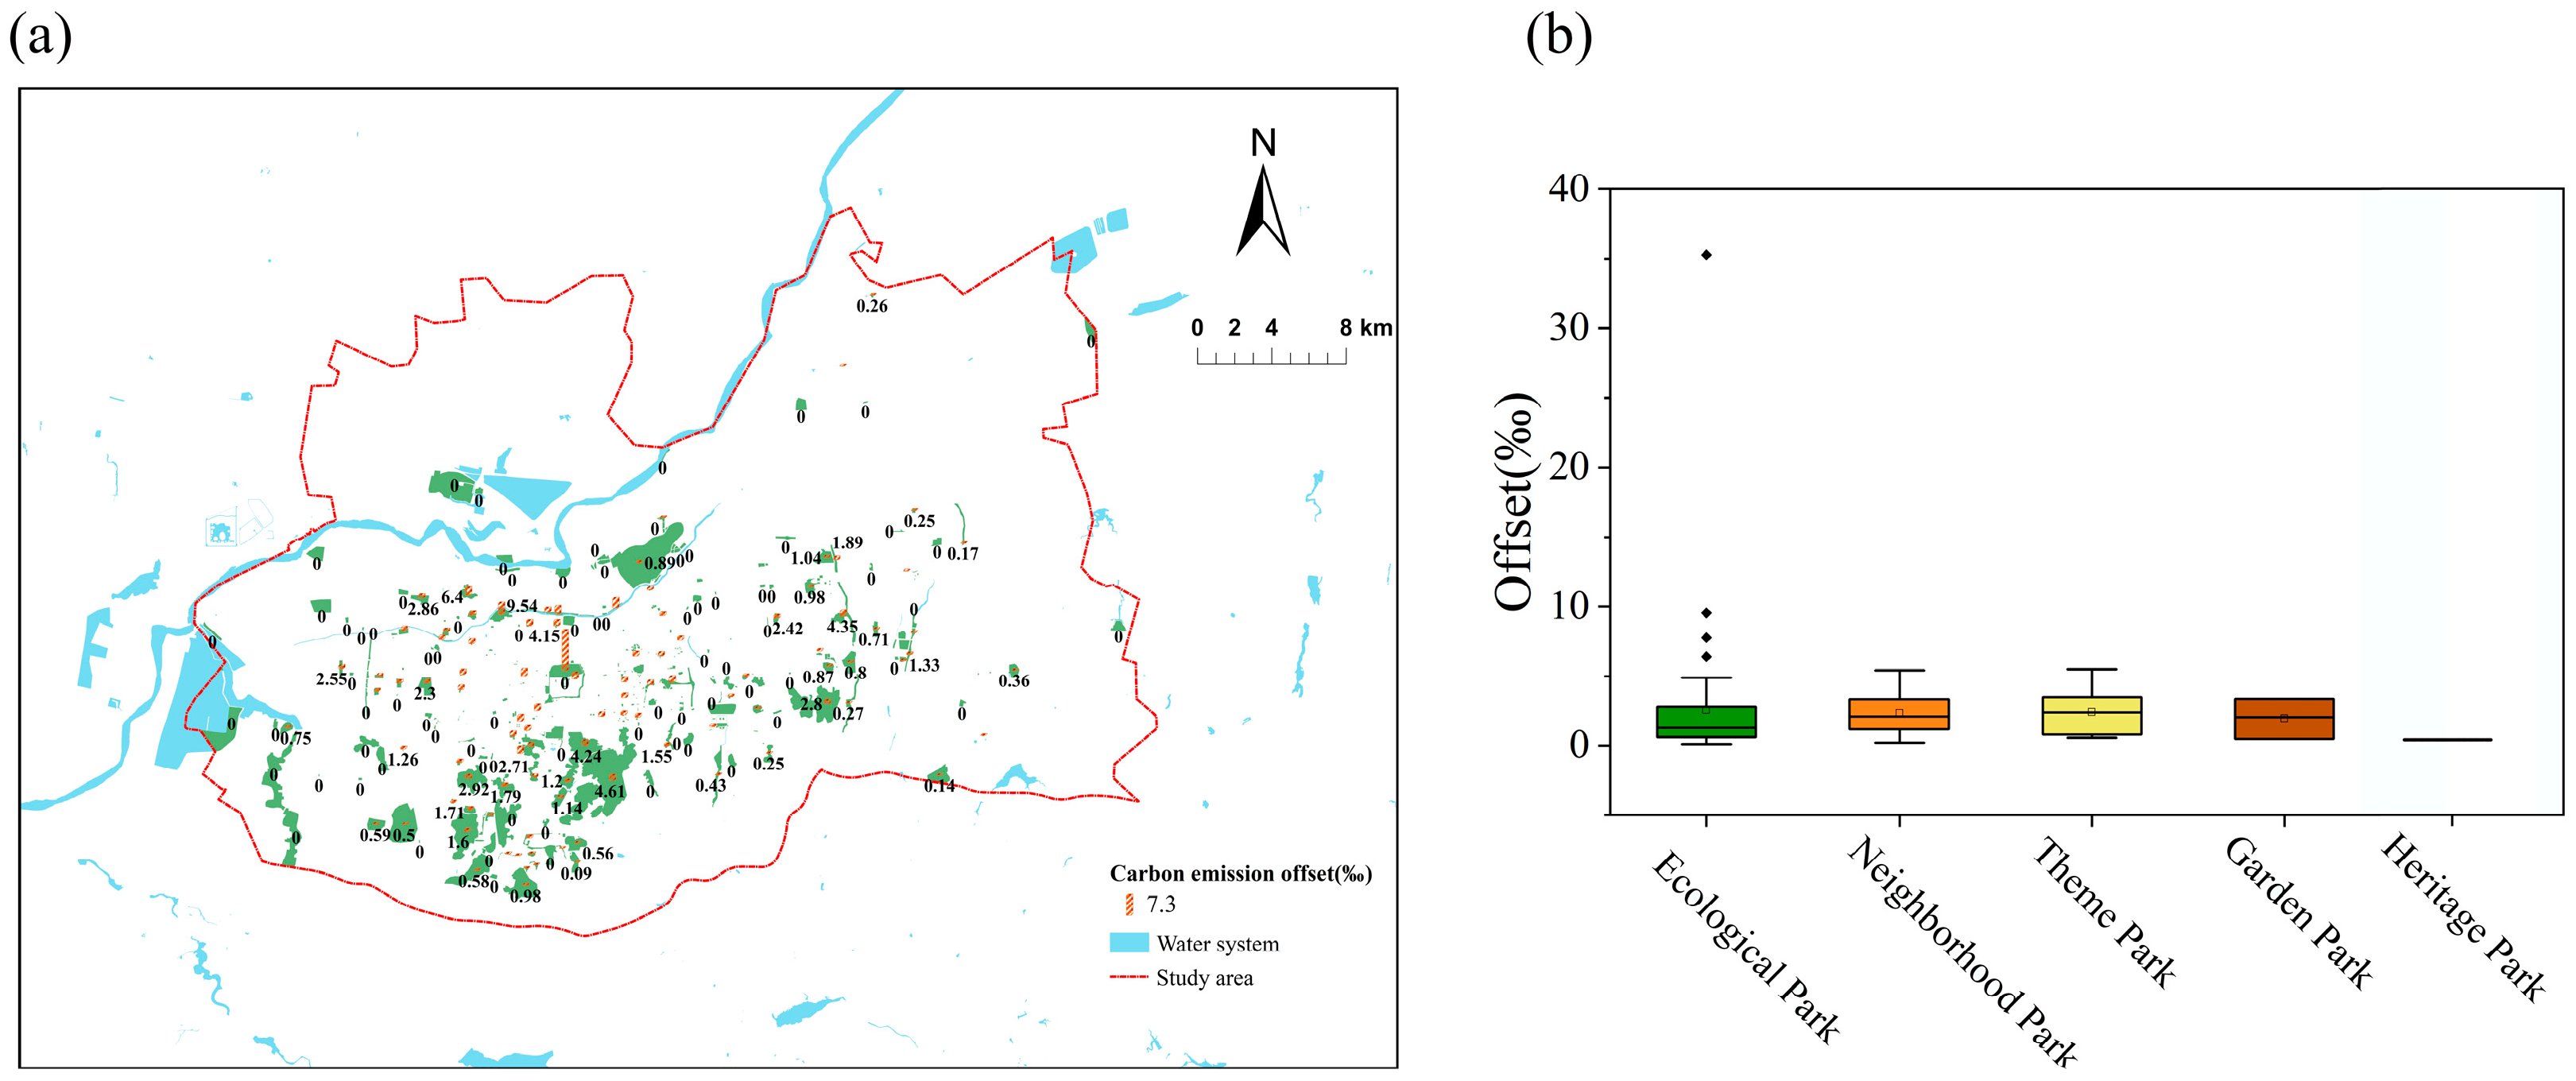
3.3. Contribution of Urban Parks in Jinan to Carbon Neutrality
The average daily carbon dioxide emissions in June of 2023 amounted to 26,082 tons of CO2. The study found that urban parks saved a total of 2943 tons of CO2 per day, offsetting 11.28% of Jinan’s fossil fuel carbon emissions (Figure 6a). On average, each park offset 0.04% of carbon emissions. The study also revealed that among the different types of urban parks, theme parks had the highest average carbon offset, while ecological parks displayed more data points exceeding the normal range, which may be associated with their larger sizes (Figure 6b).
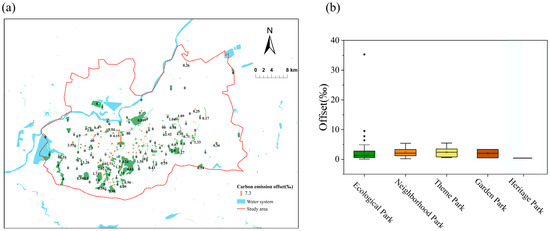
Figure 6.
(a) Contribution to carbon neutrality; (b) carbon offset by park type.
3.4. Correlation Analysis of Factors Influencing Carbon Reduction in Urban Parks
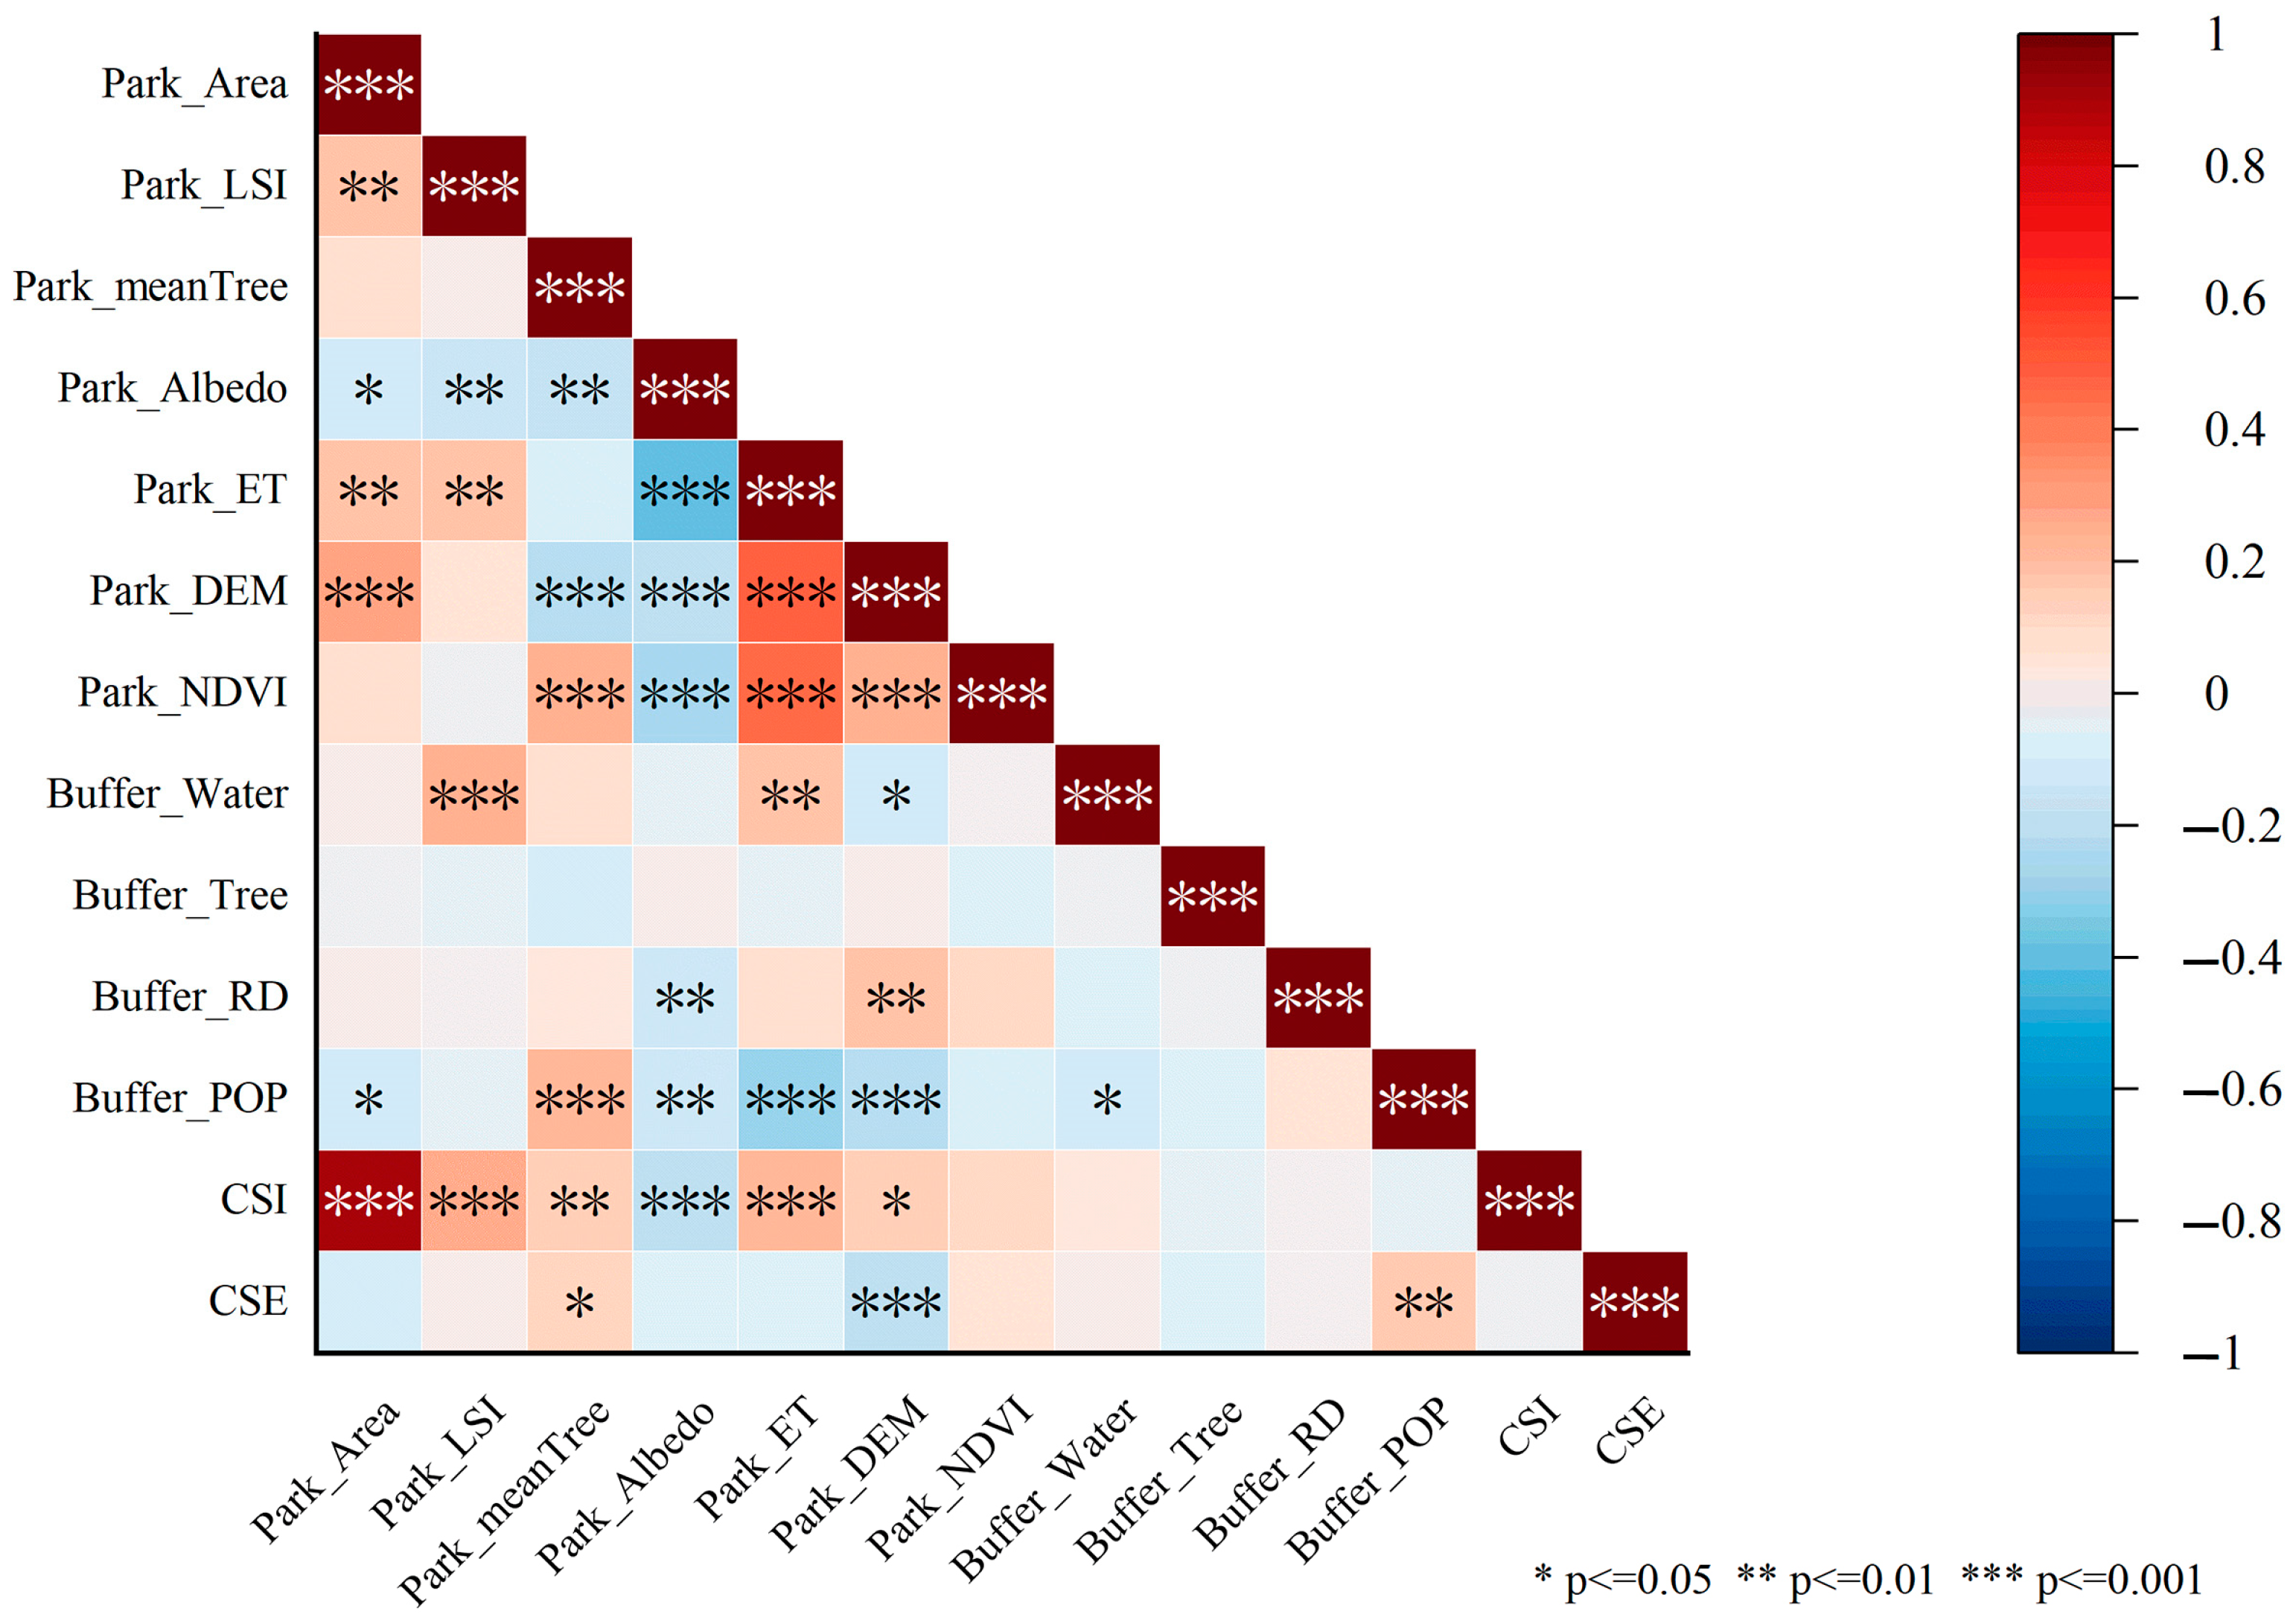
Figure 7 illustrates the Pearson correlation coefficients between various internal and external indicators of parks and carbon reduction intensity and efficiency. From the figure, it is evident that for park carbon-saving intensity (CSI), park albedo exhibits a significant negative correlation, while green space area, park perimeter area, and vegetation evapotranspiration show significant positive correlations. The average tree height within the park demonstrates a moderate correlation, while the elevation of the park’s green space exhibits a weak correlation. For park carbon-saving efficiency (CSE), only the elevation of the park green space shows a significant negative correlation. The surrounding park green space population displays a moderate positive correlation, while the average tree height within the park has a weak positive correlation. Overall, the average tree height within the park green space, park albedo, normalized vegetation index, and external indicators such as surrounding water body coverage, tree canopy coverage, and road network density exhibit consistent trends in their impact. However, other indicators, such as park green space area, park perimeter area, park vegetation evapotranspiration, park elevation, and surrounding park population, show opposite effects. Additionally, for the same indicator, there are considerable differences in the strength of correlation, with internal park indicators demonstrating significant correlations.

Figure 7.
Correlation coefficients between carbon reduction indicators of urban parks and internal and external factors (*** indicates a significance level of 0.001, ** indicates a significance level of 0.01, * indicates a significance level of 0.05).
3.5. Analysis of Factors Affecting Carbon Emission Reduction
3.5.1. Contribution and Direction of Carbon Emission Reduction Impact Factors
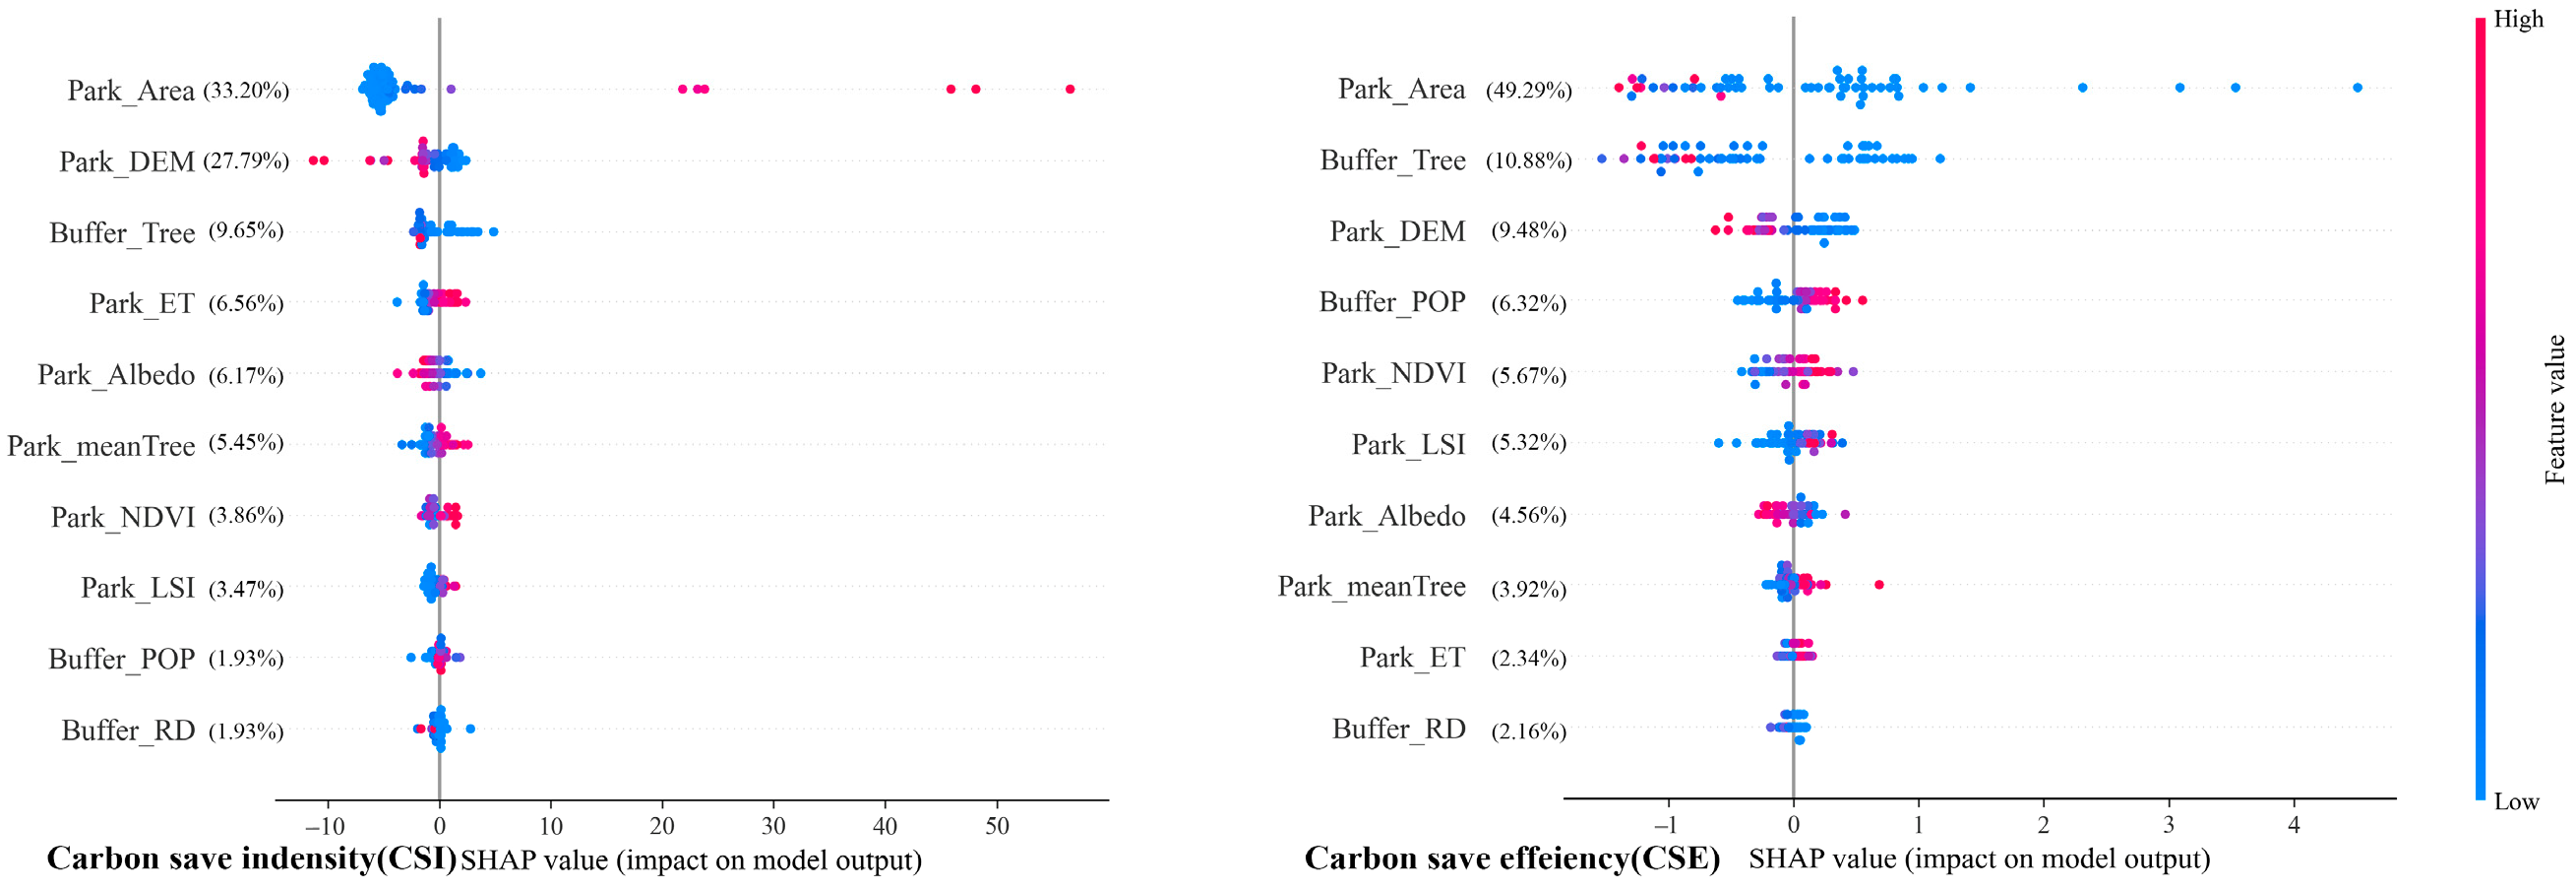
Using the CatBoost model and SHAP-generated feature summary plots, the relative importance and direction of various factors influencing carbon reduction in park green spaces are illustrated (Figure 8). In these plots, the horizontal axis represents the SHAP values, and the vertical axis ranks the factors by their explanatory importance. The relative importance of each factor is indicated as a percentage in parentheses. The color of each data point corresponds to the magnitude of the predicted value, with red indicating higher feature values and blue representing lower feature values.
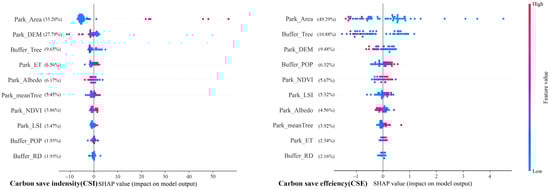
Figure 8.
Summary map of factors affecting carbon reduction in park green spaces.
Park_Area emerges as the most influential factor for both carbon reduction intensity (CSI) and carbon-saving efficiency (CSE) in park green spaces, with relative importance values of 42.29% and 33.20%, respectively. The next most important factor is Park_DEM, with values of 9.48% for CSI and 27.79% for CSE, followed by Buffer_Tree, with 10.88% for CSI and 9.65% for CSE. These three factors are related to the spatial structure of green spaces, including their terrain and vegetation conditions.
Other significant factors influencing carbon-saving efficiency (CSE) include external indicators like Buffer_POP and internal factors such as Park_NDVI and Park_LSI, with relative importance values of 6.32%, 5.67%, and 5.32%, respectively. This suggests that carbon reduction intensity in urban park green spaces is largely determined by internal spatial factors, with the top six internal indicators contributing 69.76% of the explanatory power, compared to 17.20% from external factors. For carbon-saving intensity (CSI), the additional important factors are Park_ET, Park_Albedo, and Park_meanTree, contributing 6.56%, 6.17%, and 5.45%, respectively. This indicates that the carbon reduction efficiency is mainly driven by internal spatial features, with the top six internal factors accounting for 79.17%, while external factors contribute only 9.65%. Moreover, the influence of surrounding external environmental factors on CSE is more pronounced than on CSI, consistent with the findings presented in Section 3.2.
The SHAP values and the corresponding color of sample points further reveal that higher Park_Area values (represented by red) correlate with positive SHAP values, indicating a positive relationship with CSI. On the other hand, lower values of FVC (represented by blue) are associated with negative SHAP values, suggesting that an increase in Park_Area improves carbon reduction intensity (CSI) but decreases carbon-saving efficiency (CSE) in park green spaces. A similar pattern is observed for Buffer_Tree.
In summary, among the six most influential factors, Park_DEM, Buffer_Tree, and Park_Albedo negatively affect CSI, while Park_ET and Park_meanTree positively influence CSE. For CSE, Park_Area, Buffer_Tree, and Park_DEM have negative impacts, whereas Buffer_POP and Park_NDVI contribute positively. These insights emphasize the importance of carefully considering both internal and external factors when planning urban parks to optimize their carbon reduction potential.
3.5.2. Marginal Effects of Factors on Carbon Reduction in Parks
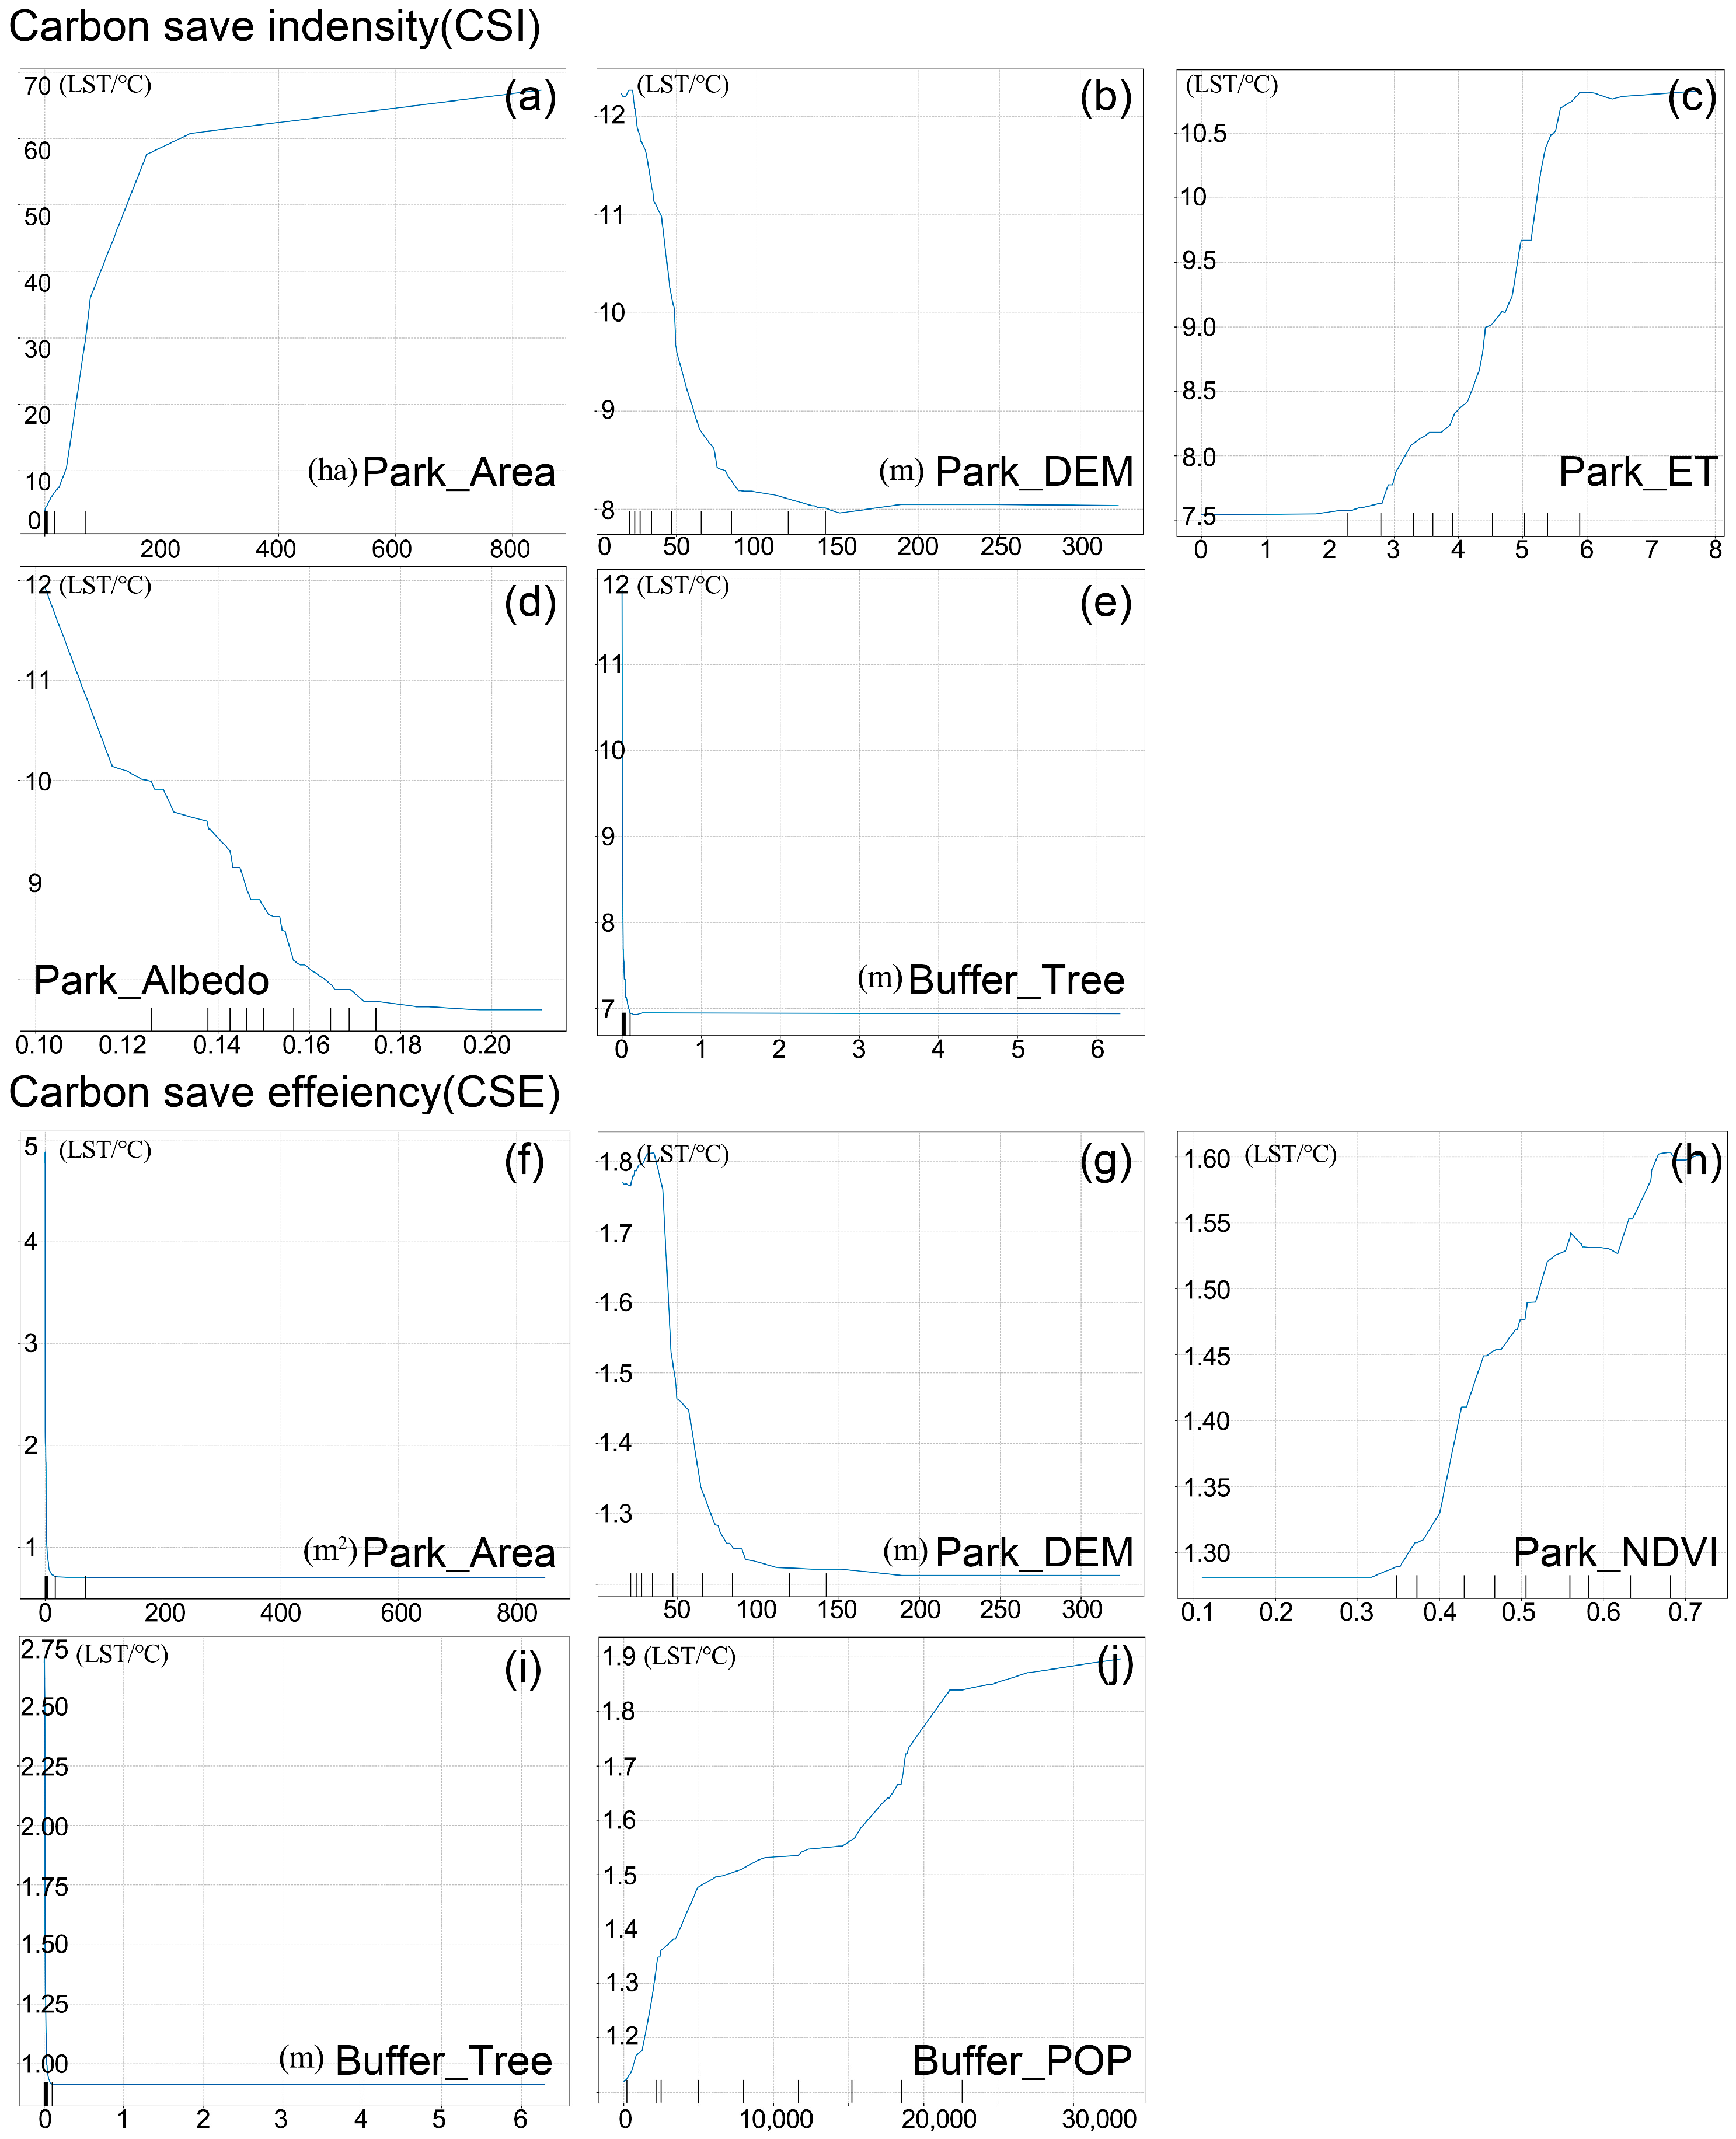
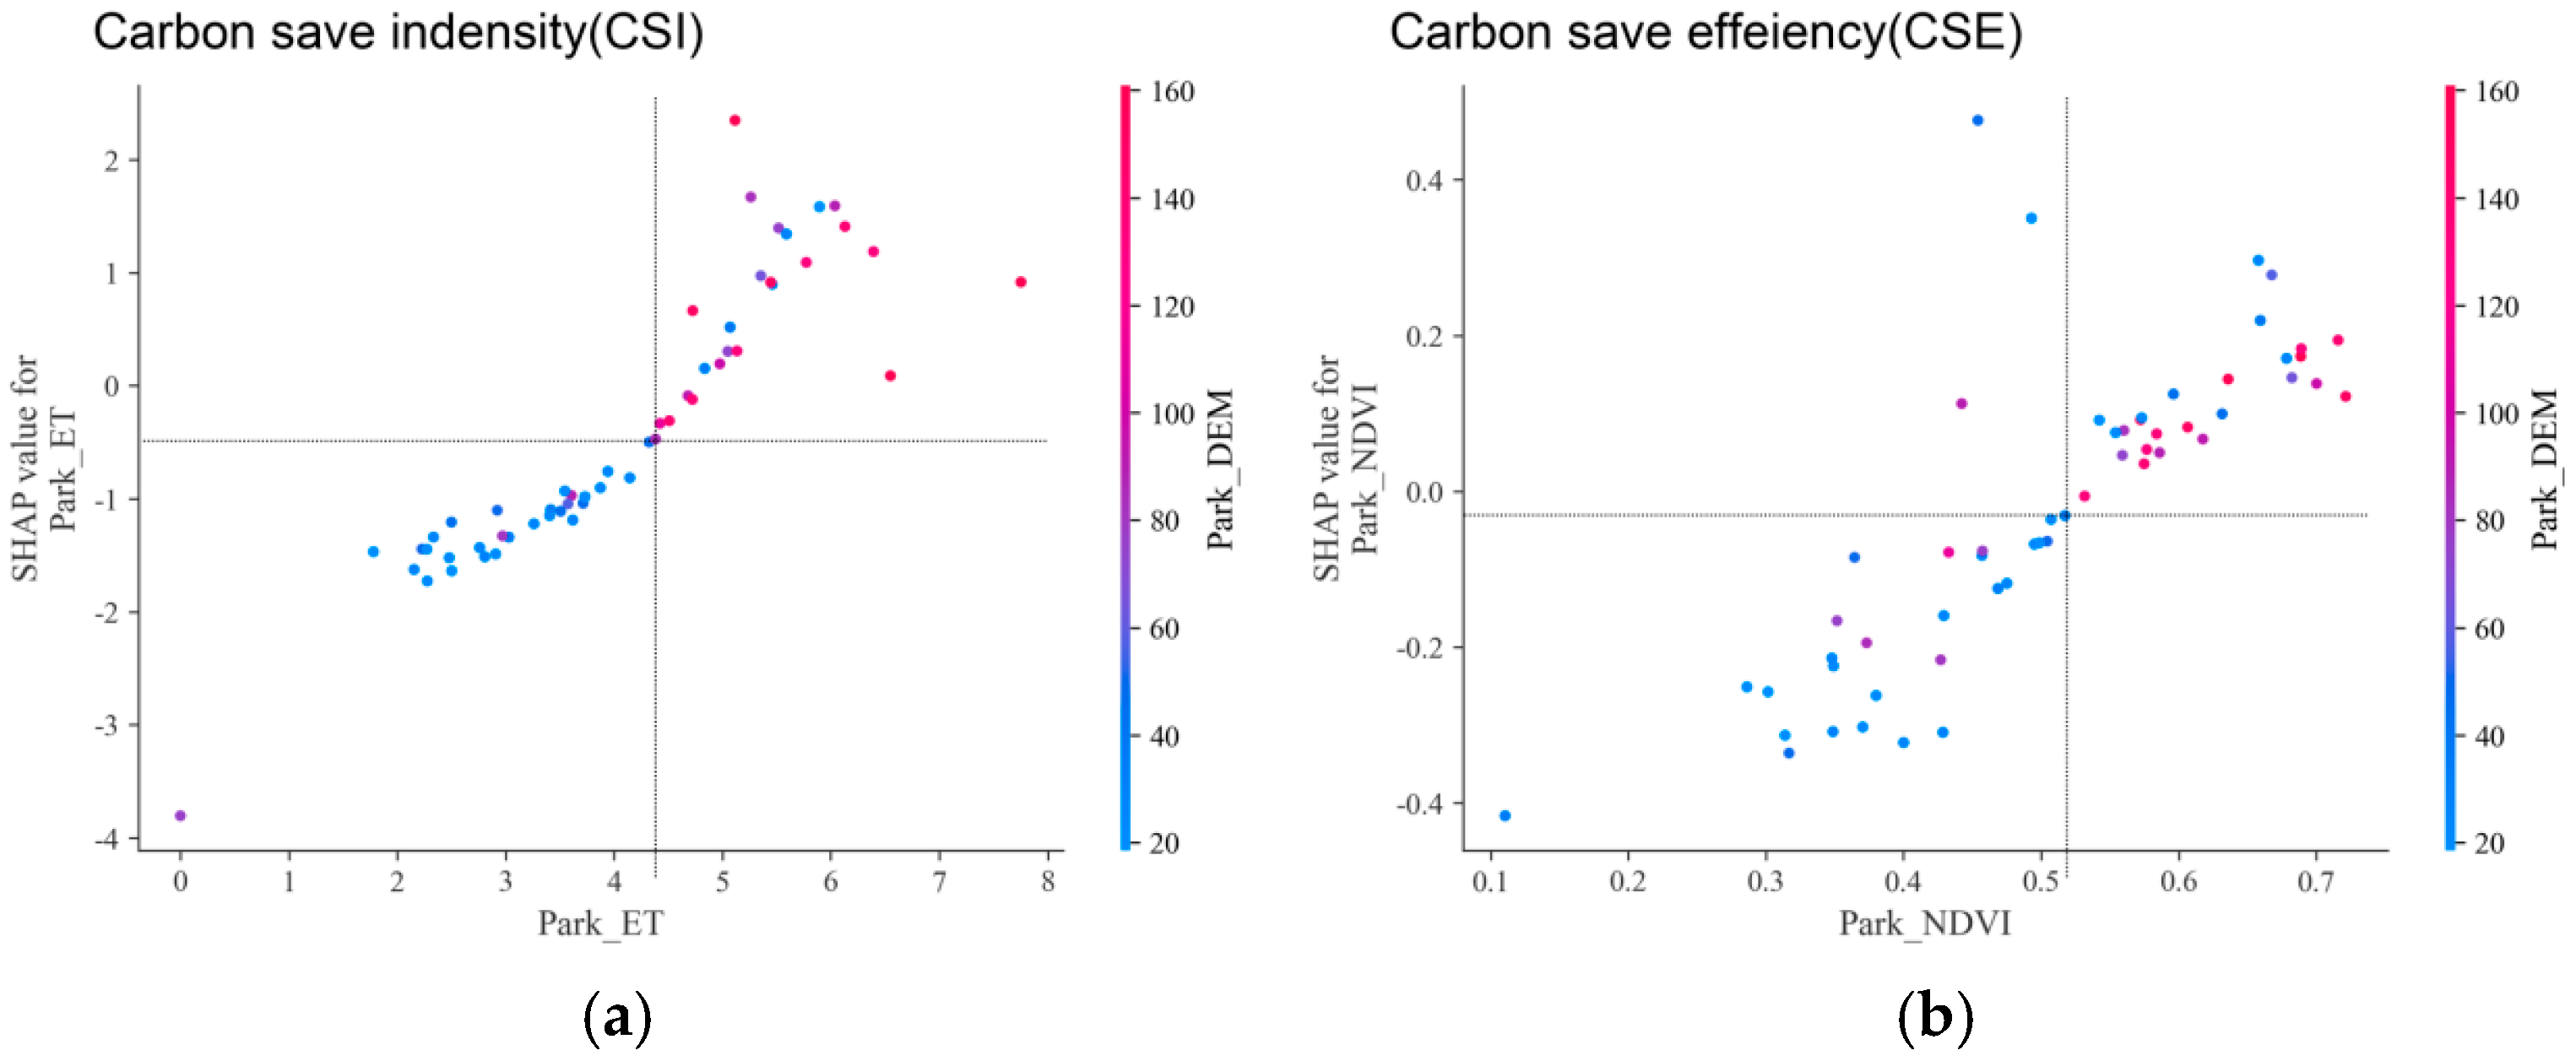
To further explore the nonlinear relationships and threshold effects between carbon reduction and both internal park green space indicators and surrounding environmental factors, partial dependence plots were generated (Figure 9). In these plots, the x-axis represents the environmental factors, while the y-axis represents the predicted carbon reduction intensity or efficiency, as estimated by the CatBoost model. Each subplot illustrates the specific contribution of an individual green space environmental variable to carbon reduction intensity or efficiency, while controlling for the influence of other factors. These plots also help to identify whether the relationship between the target variable and the features is linear, monotonic, or more complex.
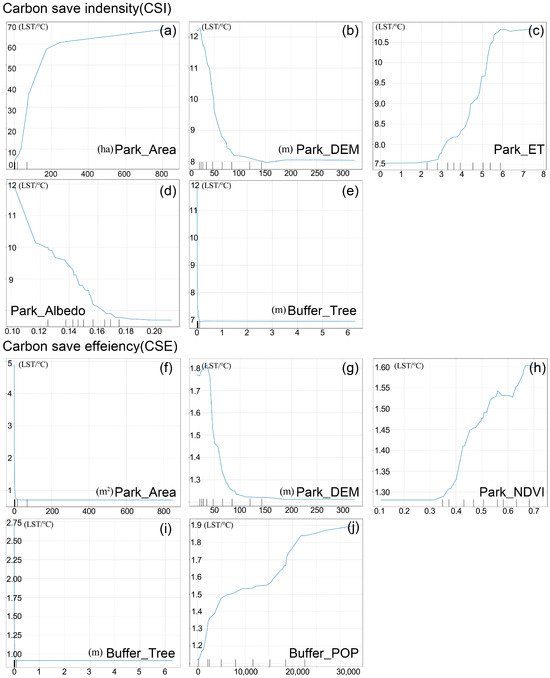
Figure 9.
Single-factor feature dependency plot. (a) Park_Area; (b) Park_DEM; (c) Park_ET; (d) Park_Albedo; (e) Buffer_Tree; (f) Park_Area(CSE); (g) Park_DEM(CSE); (h) Park_NDVI(CSE); (i) Buffer_Tree(CSE); (j) Buffer_POP(CSE).
For carbon reduction intensity (CSI), the marginal effect curves for internal park structural factors, such as Park_Area and Park_ET, show an upward trend, indicating a positive correlation with carbon reduction intensity. However, a clear threshold effect is observed, consistent with previous studies [35]. In contrast, Park_DEM and Park_Albedo exhibit negative correlations with carbon reduction intensity. As shown in Figure 9a, when Park_Area exceeds 250 ha, the rate of increase in carbon reduction intensity slows down, and the increase becomes progressively smaller. Similarly, Park_ET shows a sharp rise in carbon reduction intensity when it is within the range of 2.5 to 6 (Figure 9c), but the positive correlation weakens as Park_ET exceeds 6. Figure 9b shows that when park elevation (Park_DEM) exceeds 150 m, carbon reduction intensity reaches its lowest point, with the optimal range for park elevation being between 25 m and 50 m. Likewise, when park albedo (Park_Albedo) exceeds 18% (0.18), carbon reduction intensity reaches its lowest level.
For the surrounding environmental factor, Buffer_Tree, the high concentration of data samples within a narrow range makes it difficult to identify a clear trend in its impact on carbon reduction intensity (CSI).
For carbon-saving efficiency (CSE), as shown in Figure 9g, the trend of Park_DEM (CSE) mirrors that of CSI (Figure 9b). Park_NDVI has a positive impact on park carbon reduction efficiency, with efficiency continuously increasing when NDVI values range from 0.3 to 0.7. Additionally, the external population density indicator (Buffer_POP) also positively influences carbon-saving efficiency, with the most significant improvements occurring when population density is between 0 and 5000 and between 15,000 and 22,500.
4. Discussion
4.1. Carbon Reduction Potential of Urban Parks
The marginal effect curves reveal that albedo is a key factor influencing carbon saving intensity (CSI). Albedo refers to the ability of elements in the surrounding environment, such as soil and vegetation, to reflect sunlight. A higher albedo increases the amount of sunlight reflected away from the green space, reducing the light energy available for photosynthesis. This in turn diminishes the carbon absorption capacity of the park. Conversely, a lower albedo allows more sunlight to be absorbed, enhancing the plants’ ability to absorb energy and thus improving the carbon sequestration potential of the green space.
In addition to albedo, the size of the green space also plays a crucial role. Larger parks typically support more vegetation, which leads to higher levels of evapotranspiration. Evapotranspiration, the process by which plants release moisture into the atmosphere, not only helps to cool the environment but also contributes to regulating the local microclimate, making it more favorable for carbon sequestration. Studies have shown that for each additional hectare of park green space, evapotranspiration can increase by approximately 15%, highlighting the relationship between park size and its environmental impact [36,37,38,39].
These findings, illustrated in Figure 9a,c, suggest a positive, nonlinear relationship between green space area and carbon reduction. As the area of a green space expands, it typically results in an increase in vegetation biomass and the Leaf Area Index (LAI), which further enhances the intensity of evapotranspiration. This emphasizes the importance of strategic urban planning that considers the scale and layout of parks to maximize their ecological functions and contribute to climate mitigation efforts. By optimizing the size and distribution of urban parks, cities can significantly improve local climate conditions, mitigate the urban heat island effect, and enhance overall carbon reduction potential.
4.2. Interactions and Effects of Landscape Factors
Although some research has been conducted on the factors influencing the carbon reduction potential of urban park green spaces, the SHAP multi-factor interaction plots reveal that carbon reduction intensity and efficiency are often influenced by the interaction of multiple factors. Figure 10 illustrates the bivariate dependency plots for the top five factors in terms of relative importance. The horizontal axis represents the values of the primary features, while the vertical axis displays the corresponding SHAP values. The color of the points indicates the magnitude of the second factor’s values. Due to limitations in the number of plots, only the most significant ones are analyzed.
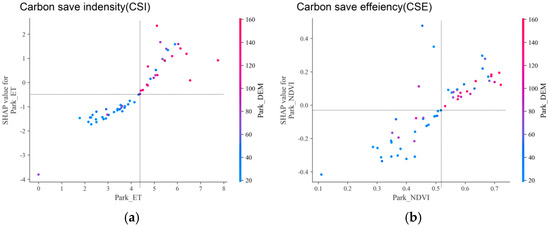
Figure 10.
Partial factor bivariate dependency plot. (a) Carbon reduction intensity. (b) Carbon reduction efficiency.
4.3. How to Realize the Carbon Reduction Potential of Urban Parks
The carbon reduction potential of urban parks is influenced by a range of internal and external factors. Given the scarcity of urban land and the varying types of parks, it is recommended to construct large parks in conjunction with blue–green infrastructure to maximize carbon reduction. If the goal is to enhance carbon reduction efficiency, the construction of smaller parks is advised. This approach requires planners to consider the specific circumstances and adjust the layout of urban parks accordingly. Additionally, planners can focus on optimizing internal park factors, adjusting them to further enhance the carbon reduction capacity of parks. It is noteworthy that the current carbon reduction levels of urban parks in Jinan are relatively low on average, as shown in Figure 5b,c, where there is significant variation in carbon reduction across different parks. Planners should account for the comfort needs of urban residents during extreme heat events and incorporate both cooling and carbon reduction capabilities, as well as equity considerations when prioritizing park locations and optimizing park designs.
4.4. Limitations of the Study
This study validated the accuracy of Landsat 8 land surface temperature data using MODIS and quantitatively assessed the impact and contribution of park green space structural factors and surrounding socio-economic factors on the carbon reduction potential of urban parks through interpretable machine learning methods. While the results demonstrate relatively good performance to some extent, there are still several limitations. First, this study did not explore the issue in depth from the perspective of thermal comfort. Second, a simplified cumulative carbon reduction model was used. Future research should incorporate more detailed structural models and consider evaluating cooling and carbon reduction variations at different times of the day. Finally, more indicators need to be included in future research, such as vegetation type, soil type, and other relevant indicators that affect the carbon emission reduction intensity of park green spaces.
5. Conclusions
This study evaluated the carbon reduction potential of urban parks in Jinan during extreme heat events. The land surface temperature (LST) in Jinan ranged from 1.77 °C to 59.44 °C, with a significant negative correlation between green space coverage and surface temperature. Among the 369 parks, 278 exhibited a cooling effect, collectively saving 2943 tons of CO2 per day, offsetting 11.28% of the city’s fossil fuel emission.
Carbon-saving efficiency (CSE) and carbon-saving intensity (CSI) were significantly influenced by internal park factors. CSE was most affected by park area, surrounding population density, and tree height, while CSI was influenced by park geometry, evapotranspiration, and elevation. The study found that CSE was more influenced by internal factors (79.17%) than CSI (69.76%). Park area and tree density were key factors in maximizing carbon reduction, while elevation and albedo had a negative impact
Partial dependence plots revealed that CSE was most efficient when the vegetation index was between 0.3 and 0.7, and population density ranged 0–5000 or 15,000–22,500. For CSI, carbon reduction intensity significantly increased with park area exceeding 250 hectares and evapotranspiration between 2.5 and 6.0. The relationship between park area and evapotranspiration showed a nonlinear increase in carbon reduction intensity, which gradually slowed after reaching a certain threshold. Additionally, CSE and CSI were negatively correlated with elevation and albedo, with the lowest carbon reduction intensity observed when elevation exceeded 150 m or albedo surpassed 18%.
This study provides valuable scientific evidence for urban green space planning and ecosystem management, particularly in mitigating the urban heat island effect, enhancing cooling efficiency, and contributing to carbon neutrality. To maximize the carbon reduction potential of urban parks, it is recommended to increase vegetation coverage, optimize park size and layout, and consider factors such as surrounding population and tree density. Additionally, considering elevation and topography when planning future park development, while also taking into account the albedo within the park and prioritizing ecological parks, can further enhance cooling effects and help mitigate the urban heat island effect, ultimately supporting carbon neutrality goals.
Author Contributions
Conceptualization, L.Y., W.L. and C.Z.; methodology, L.Y. and C.Z.; formal analysis, L.Y.; data curation, L.Y.; writing—original draft preparation, W.L. and X.L.; writing—review and editing, L.Y. and W.L.; visualization, L.Y. and X.L.; supervision L.Y. and W.L.; project administration, L.Y. All authors have read and agreed to the published version of the manuscript.
Funding
This research received no external funding.
Institutional Review Board Statement
Not applicable.
Informed Consent Statement
Not applicable.
Data Availability Statement
Data are available from the corresponding author and can be shared upon reasonable request.
Conflicts of Interest
The authors declare no conflicts of interest.
References
- Oke, T.R. The energetic basis of the urban heat island. Q. J. R. Meteorol. Soc. 1982, 108, 1–24. [Google Scholar] [CrossRef]
- Santamouris, M. Heat islands: A review of the impact of urban heat islands on the energy consumption of buildings. Energy Build. 2015, 94, 119–124. [Google Scholar] [CrossRef]
- Akbari, H.; Pomerantz, M.; Taha, H. Cool surfaces and shade trees to reduce energy use and improve air quality in urban areas. Sol. Energy 2001, 70, 295–310. [Google Scholar] [CrossRef]
- Zhou, D.; Wang, X.; Zhang, Y.; Li, Q.; Liu, Z.; Li, X. Urban heat island effect and its impact on energy consumption in cities. Environ. Res. Lett. 2018, 13, 124002. [Google Scholar]
- Matzarakis, A.; Mayer, H.; Iziomon, M. The role of urban green spaces in mitigating the urban heat island effect. Int. J. Biometeorol. 2010, 54, 1–9. [Google Scholar]
- Yang, J.; Li, L.; Zhang, X.; Zhao, Y. The impact of urban green space on urban heat island effect: A case study of Beijing. Sustain. Cities Soc. 2015, 14, 1–10. [Google Scholar] [CrossRef]
- Bowler, D.E.; Buyung-Ali, L.; Knight, T.M.; Pullin, A.S.; Knight, T.M.; Pullin, A.S. Urban greening to cool towns and cities: A systematic review of the empirical evidence. Landsc. Urban Plan. 2010, 97, 147–155. [Google Scholar] [CrossRef]
- Lee, J.H.; Choi, J.; Lee, S.; Park, C.; Kim, H.; Lee, J. The role of urban green spaces in mitigating urban heat island effects: A review. Sustain. Cities Soc. 2018, 39, 1–10. [Google Scholar]
- Davis, A.J.; Nowak, D.J.; Endreny, T.A.; Green, J.L.; Heisler, G.M.; Mize, S.V. The role of urban trees in reducing energy consumption: A case study of the city of Atlanta. Urban For. Urban Green 2011, 10, 109–116. [Google Scholar]
- Li, D.; Zhou, Y.; Xu, Y.; Zhang, X.; Li, X.; Lin, Y. The cooling effect of urban green spaces on urban heat islands: A case study of Beijing. Urban For. Urban Green 2020, 48, 126563. [Google Scholar]
- Du, C.; Jia, W.; Wang, K. Valuing carbon saving potential of urban parks in thermal mitigation: Linking accumulative and accessibility perspectives. Urban Clim. 2023, 51, 101645. [Google Scholar] [CrossRef]
- Chen, M.; Jia, W.; Du, C.; Shi, M.; Henebry, G.M.; Wang, K. Carbon saving potential of urban parks due to heat mitigation in Yangtze River Economic Belt. J. Clean. Prod. 2023, 385, 135713. [Google Scholar] [CrossRef]
- Zhao, Y.; Liu, Y.; Li, W.; Zhang, Z.; Wang, X. The impact of park types on carbon sequestration in urban areas. Urban For. Urban Green 2019, 38, 123–130. [Google Scholar]
- Li, X.; Wang, J.; Zhang, T.; Li, D.; Zhang, Y. Landscape structure and its influence on carbon sequestration in urban parks. Ecol. Indic. 2021, 121, 107–115. [Google Scholar]
- Wang, J.; Li, X.; Zhang, T.; Li, D.; Zhang, Y. Effects of landscape features on carbon reduction potential in urban parks. Landsc. Urban Plan. 2022, 214, 104–112. [Google Scholar]
- Tran, M.; Nguyen, T.; Le, T.; Nguyen, P.; Pham, H. The role of urban green spaces in mitigating climate change: A review. Environ. Sci. Policy 2020, 112, 1–10. [Google Scholar]
- Chen, L.; Zhang, X.; Liu, Y.; Li, J.; Wang, L. Socioeconomic factors influencing urban forest ecosystem services. For. Ecol. Manag. 2020, 458, 117–125. [Google Scholar]
- Zhou, Q.; Liu, Y.; Zhang, Z.; Li, Y.; Wang, X. Urban heat island effect and its relationship with road network density. Sustain. Cities Soc. 2021, 65, 102–110. [Google Scholar]
- Zhang, H.; Liu, X.; Wang, J.; Li, Z.; Zhang, Y. The role of vegetation types in carbon reduction efficiency in urban parks. J. Environ. Manag. 2023, 310, 114–123. [Google Scholar]
- Lundberg, S.M.; Lee, S.I. A Unified Approach to Interpreting Model Predictions. arXiv 2017, arXiv:1705.07874. [Google Scholar]
- Qi, J.D.; Huang, J.Z.; Jia, X. Simulation and feature response of urban green space net carbon exchange based on XGBoost-ANN. Trans. Chin. Soc. Agric. Mach. 2019, 50, 269–278. [Google Scholar]
- Li, Z.; Rolston, N.; Flick, A.C.; Colburn, T.W.; Ren, Z.; Dauskardt, R.H.; Buonassisi, T. Machine learning with knowledge constraints for process optimization of open-air perovskite solar cell manufacturing. Joule 2022, 6, 834–849. [Google Scholar] [CrossRef]
- Zhang, H.; Li, Y.; Wang, X. Green infrastructure planning and implementation in Jinan, China: Challenges and opportunities. Landsc. Urban Plan. 2020, 195, 103711. [Google Scholar]
- Tzoulas, K.; Korpela, K.; Venn, S.; Ylenik, M.; Frith, M. Promoting ecosystem and human health in urban areas using green infrastructure: A literature review. Landsc. Urban Plan. 2007, 81, 167–178. [Google Scholar] [CrossRef]
- Li, S.; Jiang, G.-M. Land surface temperature retrieval from Landsat-8 data with the generalized split-window algorithm. IEEE Access 2018, 6, 18149–18162. [Google Scholar] [CrossRef]
- Feng, M.; Huang, C.; Channan, S.; Vermote, E.F.; Masek, J.G.; Townshend, J.R. Quality assessment of Landsat surface reflectance products using MODIS data. Comput. Geosci. 2012, 38, 9–22. [Google Scholar] [CrossRef]
- National Development and Reform Commission. China’s Oil and Gas Production Corporate Greenhouse Gas Emissions Accounting Methods and Reporting Guidelines (Trial); National Development and Reform Commission: Beijing, China, 2014. [Google Scholar]
- Oda, T.; Maksyutov, S.; Andres, R.J. The Open-source Data Inventory for Anthropogenic CO2, version 2016 (ODIAC2016): A global monthly fossil fuel CO2 gridded emissions data product for tracer transport simulations and surface flux inversions. Earth Syst. Sci. Data 2018, 10, 87–107. [Google Scholar] [CrossRef]
- Yuan, Y.; Guo, W.; Tang, S.; Zhang, J. Effects of patterns of urban green-blue landscape on carbon sequestration using XGBoost-SHAP model. J. Clean. Prod. 2024, 476, 143640. [Google Scholar] [CrossRef]
- Manesh, M.T.; Dehnavi, A.N.; Tahsildoost, M.; Alambeigi, P. Acoustic design evaluation in educational buildings using artificial intelligence. Build. Environ. 2024, 261, 111695. [Google Scholar] [CrossRef]
- Prokhorenkova, L.; Gusev, G.; Vorobev, A.; Dorogush, A.V.; Gulin, A. CatBoost: Unbiased boosting with categorical features. Adv. Neural Inf. Process. Syst. 2018, 2018, 6638–6648. [Google Scholar]
- Steurer, M.; Hill, R.J.; Pfeifer, N. Metrics for evaluating the performance of machine learning-based automated valuation models. J. Prop. Res. 2021, 38, 99–129. [Google Scholar] [CrossRef]
- Guo, R.; Yang, B.; Guo, Y.; Li, H.; Li, Z.; Zhou, B.; Hong, B.; Wang, F. Machine learning-based prediction of outdoor thermal comfort: Combining Bayesian optimization and the SHAP model. Build. Environ. 2024, 254, 111301. [Google Scholar] [CrossRef]
- Ekanayake, I.U.; Meddage, D.P.P.; Rathnayake, U. A novel approach to explain the black-box nature of machine learning in compressive strength predictions of concrete using Shapley additive explanations (SHAP). Case Stud. Constr. Mater. 2022, 16, e01059. [Google Scholar] [CrossRef]
- Ren, Z.; He, X.; Zheng, H.; Zhang, D.; Yu, X.; Shen, G.; Guo, R. Estimation of the relationship between urban park characteristics and park cool island intensity by remote sensing data and field measurement. Forests 2013, 4, 868–886. [Google Scholar] [CrossRef]
- Zhang, X.; Song, P. Estimating urban evapotranspiration at 10m resolution using vegetation information from Sentinel-2: A case study for the Beijing Sponge City. Remote Sens. 2021, 13, 2048. [Google Scholar] [CrossRef]
- Yan, L.; Jia, W.; Zhao, S. The cooling effect of urban green spaces in metacities: A case study of Beijing, China’s capital. Remote Sens. 2021, 13, 4601. [Google Scholar] [CrossRef]
- Feng, X.; Yu, J.; Xin, C.; Ye, T.; Wang, T.; Chen, H.; Zhang, X.; Zhang, L. Quantifying and comparing the cooling effects of three different morphologies of urban parks in Chengdu. Land 2023, 12, 451. [Google Scholar] [CrossRef]
- Yang, C.; He, X.; Yu, L.; Yang, J.; Yan, F.; Bu, K.; Chang, L.; Zhang, S. The cooling effect of urban parks and its monthly variations in a snow climate city. Remote Sens. 2017, 9, 1066. [Google Scholar] [CrossRef]

Disclaimer/Publisher’s Note: The statements, opinions and data contained in all publications are solely those of the individual author(s) and contributor(s) and not of MDPI and/or the editor(s). MDPI and/or the editor(s) disclaim responsibility for any injury to people or property resulting from any ideas, methods, instructions or products referred to in the content. |
© 2025 by the authors. Licensee MDPI, Basel, Switzerland. This article is an open access article distributed under the terms and conditions of the Creative Commons Attribution (CC BY) license (https://creativecommons.org/licenses/by/4.0/).