Article

Composite Study of Relationships Between the Characteristics of Atlantic Cold Tongue: Onset, Duration, and Maximum Extent

by
Dianikoura Ibrahim Koné
1,*,
Adama Diawara
1,
Benjamin Komenan Kouassi
1,
Fidele Yoroba
1,
Kouakou Kouadio
1,
Assi Louis Martial Yapo
2,
Touré Dro Tiemoko
3,
Mamadou Diarrassouba
1,
Foungnigué Silué
1 and
Arona Diedhioune
1,4,5,*
1
Laboratoire des Sciences de la Matière de l’Environnement et de l’Energie Solaire, Université Felix Houphouet-Boigny (UFHB), Abidjan BP 582, Côte d’Ivoire
2
Department of Sciences and Technology, University Alassane Ouattara, Bouaké 01 BPV 108, Côte d’Ivoire
3
Laboratory of Fundamental and Applied Physics, University Nangui Abrogoua, Abidjan BP 31, Côte d’Ivoire
4
African Centre of Excellence on Climate Change, Biodiversity and Sustainable Agriculture (ACE-CCBAD), University Felix Houphouet-Boigny (UFHB), Abidjan BP 582, Côte d’Ivoire
5
Institute of Environmental Geosciences, Université Grenoble Alpes, IRD, CNRS, Grenoble INP, IGE, 38000 Grenoble, France
*
Authors to whom correspondence should be addressed.
Atmosphere 2025, 16(1), 47; https://doi.org/10.3390/atmos16010047
Submission received: 1 December 2024 / Revised: 26 December 2024 / Accepted: 27 December 2024 / Published: 5 January 2025
(This article belongs to the Section Climatology)

Abstract

:
This study analyzes the relationships between the onset, the duration, and the maximum extent of the Atlantic Cold Tongue (ACT) using ERA5 reanalysis data from the European Centre for Medium-Range Weather Forecasts (ECMWF) over the period 1979–2019. After calculating the start and end dates of the ACT each year, this study investigates potential relationships between early or late onset that may be linked to the maximum duration and extent of the ACT, which is known to influence weather patterns and precipitation in surrounding regions and the West African Monsoon System. Results show that 68% of years with a short ACT duration are associated with a late-onset ACT, while 70% of years with a long ACT duration are associated with early ACT onset years. In addition, 63% of years with a short duration of ACT have a cold tongue with a low maximum extent, while 83% of years with a long duration of ACT have a cold tongue with a greater maximum extent. Finally, 78% of early ACT onset years are associated with the coldest SST tongue in the eastern equatorial Atlantic Ocean. A comparison of the last 20 years (1999–2019) with the previous 20 years (1979–1998) shows a cooling trend in SST, with ACT occurring and ending earlier in recent years than in the past. However, as the changes in the end date are greater than those in the onset date, the duration of the ACT has been 5–12 days shorter in the last 20 years than in the previous 20 years. Knowledge of these ACT characteristics and their interrelations and drivers is crucial for understanding the West African Monsoon System and for improving climate models and seasonal forecasts.

1. Introduction

One of the characteristics of tropical Atlantic variability is the appearance of the Atlantic Cold Tongue (ACT). ACT occurs in the eastern equatorial Atlantic and is an important seasonal feature in the tropical Atlantic. It is a seasonal phenomenon where a band of cold water forms in the eastern equatorial Atlantic Ocean, usually from April–May to August. This phenomenon plays a crucial role in tropical Atlantic climate variability, influencing weather patterns and precipitation in surrounding regions such as the West Africa Monsoon.
Rainfall in West Africa is mainly due to the West African Monsoon (WAM) system [1]. Monsoonal rainfall supports agricultural production and replenishes soil and groundwater reserves, which are vital to the region’s food security and economy. The dynamic of the WAM involves a complex set of interactions between different factors such as sea surface temperature (SST) patterns and particularly the ACT.
Understanding the mechanisms driving the ACT is critical for accurate climate models, especially in the context of global climate change [2]. The ACT is primarily driven by zonal (east-to-west) trade winds, which intensify during the boreal spring and summer. These winds, blowing from east to west along the equator, induce the Ekman transport mechanism, which leads to the upwelling of cooler, nutrient-rich water from deeper layers to the surface in the eastern equatorial Atlantic [3,4,5,6].
Indeed, this seasonal strengthening of the trade winds (from April–May to June–July) enhances the westward surface current (South Equatorial Current). This further supports the upwelling of colder subsurface waters in the eastern equatorial Atlantic, contributing to the formation of the cold tongue. In addition, these trade winds increase the surface heat fluxes and turbulent mixing, leading to shallower mixed layers, particularly in the eastern equatorial Atlantic. As the mixed layer shallows, it becomes more sensitive to cooling effects from the subsurface, further amplifying the cold tongue [3]. As the cold tongue develops, reduced net surface heat flux (with less solar heating and increased evaporation) helps maintain the cool SSTs [7].
Several feedback mechanisms enhance the cold tongue, with the Bjerknes feedback being one of the most important [8,9]. As SSTs drop due to upwelling, the cold surface reinforces the east–west temperature gradient. This strengthens the trade winds, leading to more upwelling and cooling, creating a positive feedback loop. The trade winds are influenced by the Intertropical Convergence Zone (ITCZ), which shifts northward during these months, enhancing the surface wind stress along the equator [5]. The zonal wind stress also modulates the depth of the thermocline (the boundary between warmer surface waters and cooler deep waters), which influences the intensity of upwelling [10]. During the boreal spring and early summer, the thermocline in the equatorial Atlantic shoals becomes shallower. Equatorial Kelvin waves traveling eastward cause the thermocline to uplift in the eastern Atlantic, bringing colder subsurface water closer to the surface and contributing to the cold tongue formation maintenance and enhancement [11,12]. Conversely, westward-propagating Rossby waves can modulate the SST patterns and affect the cold tongue by deepening the thermocline in the west [6,13].
Over the land [14] showed that regional dynamics, characterized by the Sahelian Heat Low (SHL) and Atlantic SST over the south, control the pre- and post-event phases of the WAM rainfall in the Sahel. The analysis of [15], based on the displacement of precipitating cloud masses, showed that the annual evolution of moisture fluxes associated with convergence and precipitation is strongly influenced by ACT and SHL. These authors suggested that ACT strongly regulates the intensity of coastal precipitation in West Africa during spring. Ref. [16] showed that an early onset of the Atlantic Cold Tongue (ACT) in 2005 (and a late onset in 2006) is associated with an early (and late) onset of the monsoon in the same year. Furthermore, the work of [3], based on statistical analysis, showed a good correlation between the onset of WAM and the onset of ACT, showing a strong coupling between these two phenomena. In contrast, other studies [17] using a modeling approach emphasized that the timing of major rainfall events and the onset of the WAM in the Sahel are not sensitive to the presence of the ACT. As well, using in situ rainfall data over Benin in the Guinea Coast (southern coastal region), ref. [18] reported that the roles of SST in Guinea Gulf and the ACT in the increase in precipitation indices between 1991 and 2010 compared to the period 1971–1990 were not clearly identified.
The ACT is a key oceanographic and climatic feature in the tropical Atlantic and the surrounding regions. Its onset, duration, maximum extent area, and SST values are influenced by seasonal and interannual variations in wind patterns, ocean upwelling, and large-scale climate systems. Knowledge of these characteristics and their interrelations and drivers is crucial not only for understanding regional climate variability in the tropical Atlantic and the West African Monsoon System but also for improving climate models and seasonal forecasts. After calculating the start and end dates of ACT each year using ERA5 reanalysis data from the European Centre for Medium-Range Weather Forecasts (ECMWF) over the period 1979–2019, the aim of this paper is to investigate potential relationships between early or late onset and the maximum duration and extent of the ACT, which are known to influence weather patterns and precipitation in surrounding regions and the West African Monsoon System. After the introduction in Section 1, the paper is structured as follows: Section 2 provides a brief description of the data and methodology; Section 3 presents the results of how early and late onset of ACT are linked to the maximum duration and extent of ACT at interannual time scales. The conclusion and perspectives are provided in Section 4.

2. Data and Methodology

In this study, we used the European Centre for Medium-Range Weather Forecasts (ECMWF) ERA5 reanalysis data over the period 1979–2019 [19]. The ERA5 reanalysis fields provide gridded climate, weather, and ocean parameters at a spatial resolution of 0.25° (approx. 31 km) and over 37 vertical levels from the surface (1000 hPa) to the upper level (1 hPa). In this study, the sea surface temperature (SST) derived from the surface-level ERA5 dataset is used. The study region is the rectangular box (5° S–1° N, 20° W–10° E) delimiting the area of the ACT as the grid points where SSTs are below 25 °C. This threshold is a fundamental criterion for determining the onset and end dates of ACT in this region.
The thresholds and criteria used to delimit the ACT zone and to determine its onset and end dates are those of [20] based on 27 years (1982–2008) of SST observations [21] derived from interpolation of a combination of satellite and in situ data. First, the monthly mean SSTs along the equator are mapped, and for each year, the monthly series are plotted and analyzed (Figure 1). From May onwards, a persistent cold band appears along the equator, lasting several months. This band reaches its maximum extension in August and begins to shrink in September. At the daily time scale, ref. [20] have defined the onset date of the ACT as the day when the area of cold water (SST < 25 °C) in the study area increases and reaches a minimum extent of 0.4 × 10⁶ km2. After reaching its maximum extent, the end date is considered to be the day when the SST < 25 °C area shrinks until it reaches the threshold of 0.4 × 10⁶ km2.
The maximum extent of the ACT is considered to be the maximum coverage that the zone of SST below 25 °C reaches after the date of onset and before it begins to recede. The duration is calculated by counting the number of days between the start and end dates. The relationships between the onset, the average SST, the duration, and the maximum extent of the ACT are investigated through scatter plots over the 1979–2019 period. These scatter plots (also called correlation diagrams) allow us to analyze the existence of a correlation or relationship between quantitative variables using the standard deviation computed as follows:
σ = 1 N   i = 1 N ( X i X ¯ )
where N is the length of our study period, which is 41 years, X is the considered ACT characteristic (onset or end date in Julian days, duration in days, extent in 105 km2), and X ¯ is its average.

3. Results and Discussion

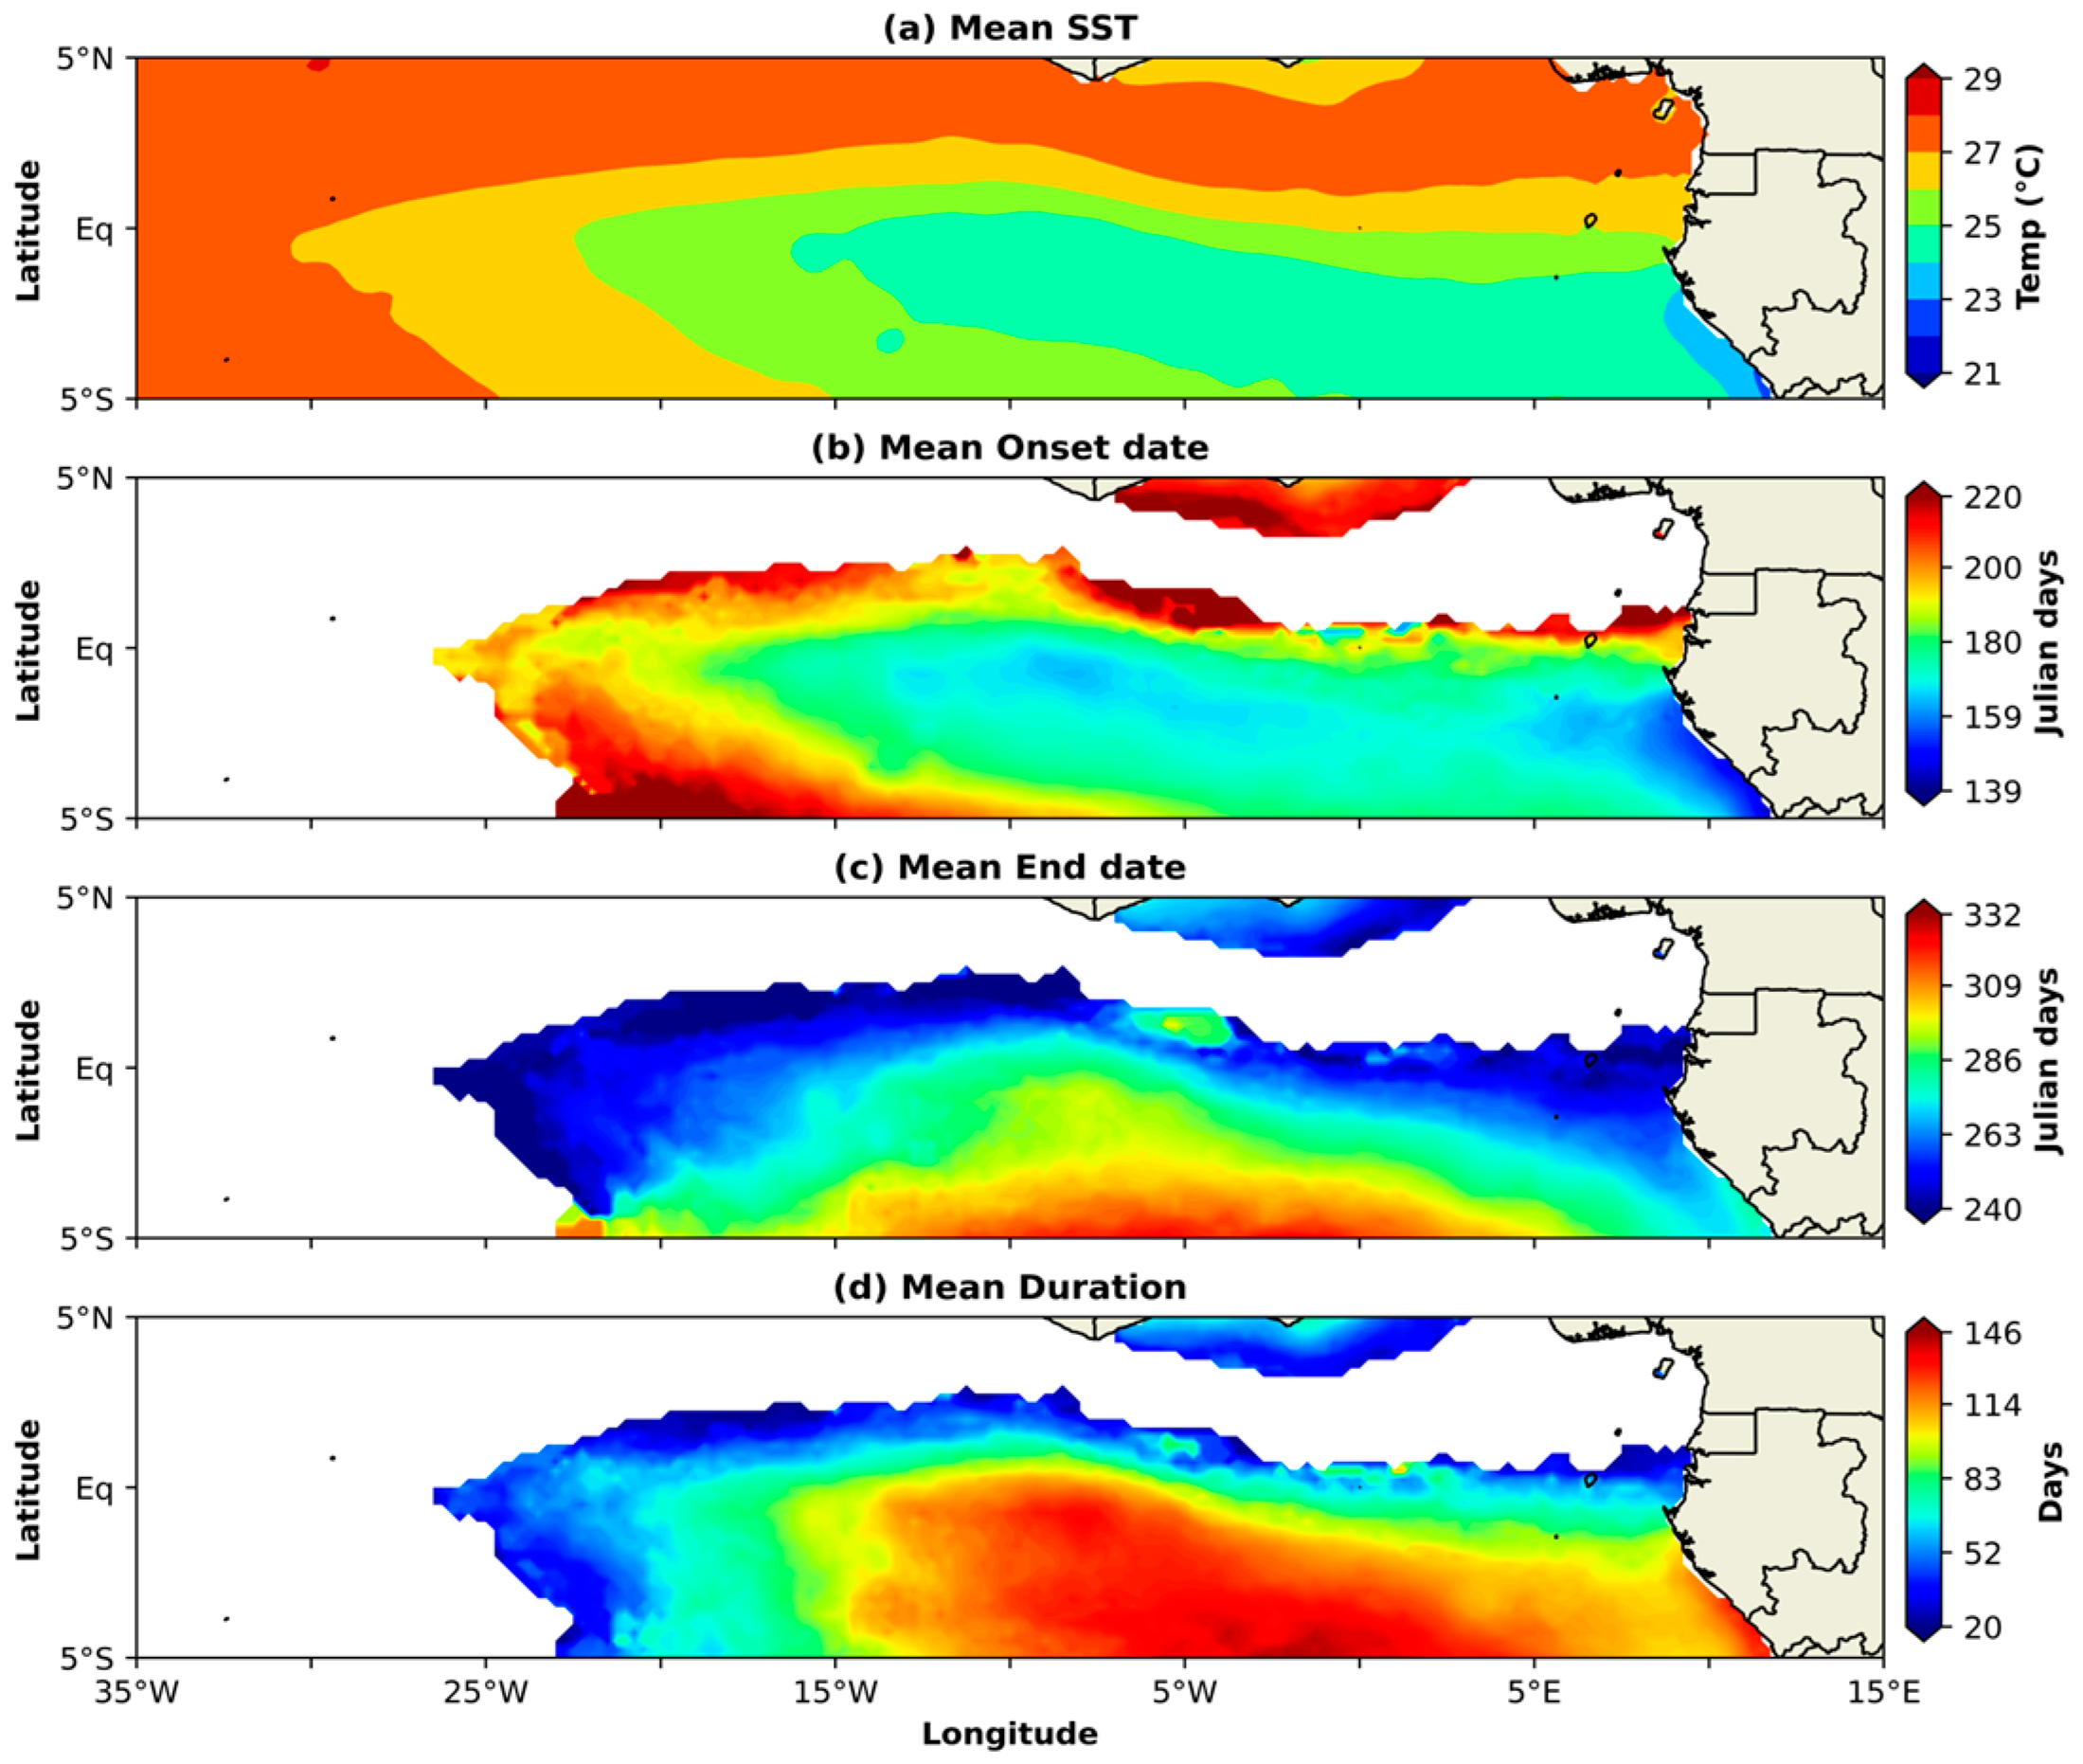
3.1. Mean Seasonal Cycle of the Atlantic Cold Tongue

Figure 2 shows the mean seasonal cycle of SST in the ACT region. In Figure 2, the upper panel shows that surface water cooling in the equatorial Atlantic begins around April–May. SSTs in this region decrease due to the upwelling of water caused by the trade winds along the equator, which in turn leads to an increasing temperature gradient between the colder waters of the ACT and the warmer surrounding waters in the Gulf of Guinea [6]. During this period, SSTs in the ACT can range from 27 °C to 29 °C (bottom panel), which is relatively cooler than the surrounding waters in the Gulf of Guinea (northern region). SSTs in the ACT are lowest in June and July. This cold tongue reaches its maximum spatial extent and intensity from August to September. During this period, SSTs are characterized by a broad band of cold water in the central part of the ACT (between 23 °C to 26 °C, bottom panel). This period is characterized by strong trade winds and an upwelling of colder water from the deep ocean, which keeps the tongue cold [6,22]. From August onwards, the ACT SST begins to warm slightly, especially in the western parts. This is associated with a slight weakening of the summer boreal winds, which reduces upwelling and leads to warmer surface waters. SSTs gradually rise to around 27 °C to 28 °C (bottom panel) in the western parts of the ACT, but the cold tongue is still noticeable in the eastern part compared to the warmer surrounding tropical waters. During the boreal winter (November–January), the ACT experiences its highest SSTs, with temperatures approaching 28–29 °C in the equatorial region. This is generally a transitional phase, with the ACT weakening as upwelling decreases and stronger winds return [6,23]. In February–March, ACT SSTs are the warmest of the year, marking the end of the annual cold tongue cycle.

3.2. Mean Characteristics of the Atlantic Cold Tongue

Figure 3a–d show the mean climatology of SST from May to September, ACT onset date, ACT dissipation date, and ACT duration for the period 1979–2019, respectively. The ACT is characterized by water temperatures below 25 °C (Figure 3a). It is the dominant seasonal feature in the eastern equatorial Atlantic, extending westward from the Angolan coast to 15° W longitude (Figure 3a). In general, the ACT begins on 7 June. This date is close to the date obtained by [3], which is 11 June. The difference between this date and ours could be explained by the different data sources and also by the study period, which is much longer in our case. The ACT lasts about 160 days (Figure 3c), with a maximum extension reaching about 10 August, i.e., about 64 days after its appearance (Figure 3d). The mean characteristics of ACT are presented below with the standard deviation across the 41 years:
  • Date of the ACT onset: 7th June ± 11 days;
  • Date of the ACT end: 13th November ± 26 days;
  • Duration of ACT (days): 160 ± 28 days;
  • Largest area covered by the ACT (105 km2): 30.7 ± 3.7;
  • Date of the largest area covered by the ACT: 10th August ± 13 days.

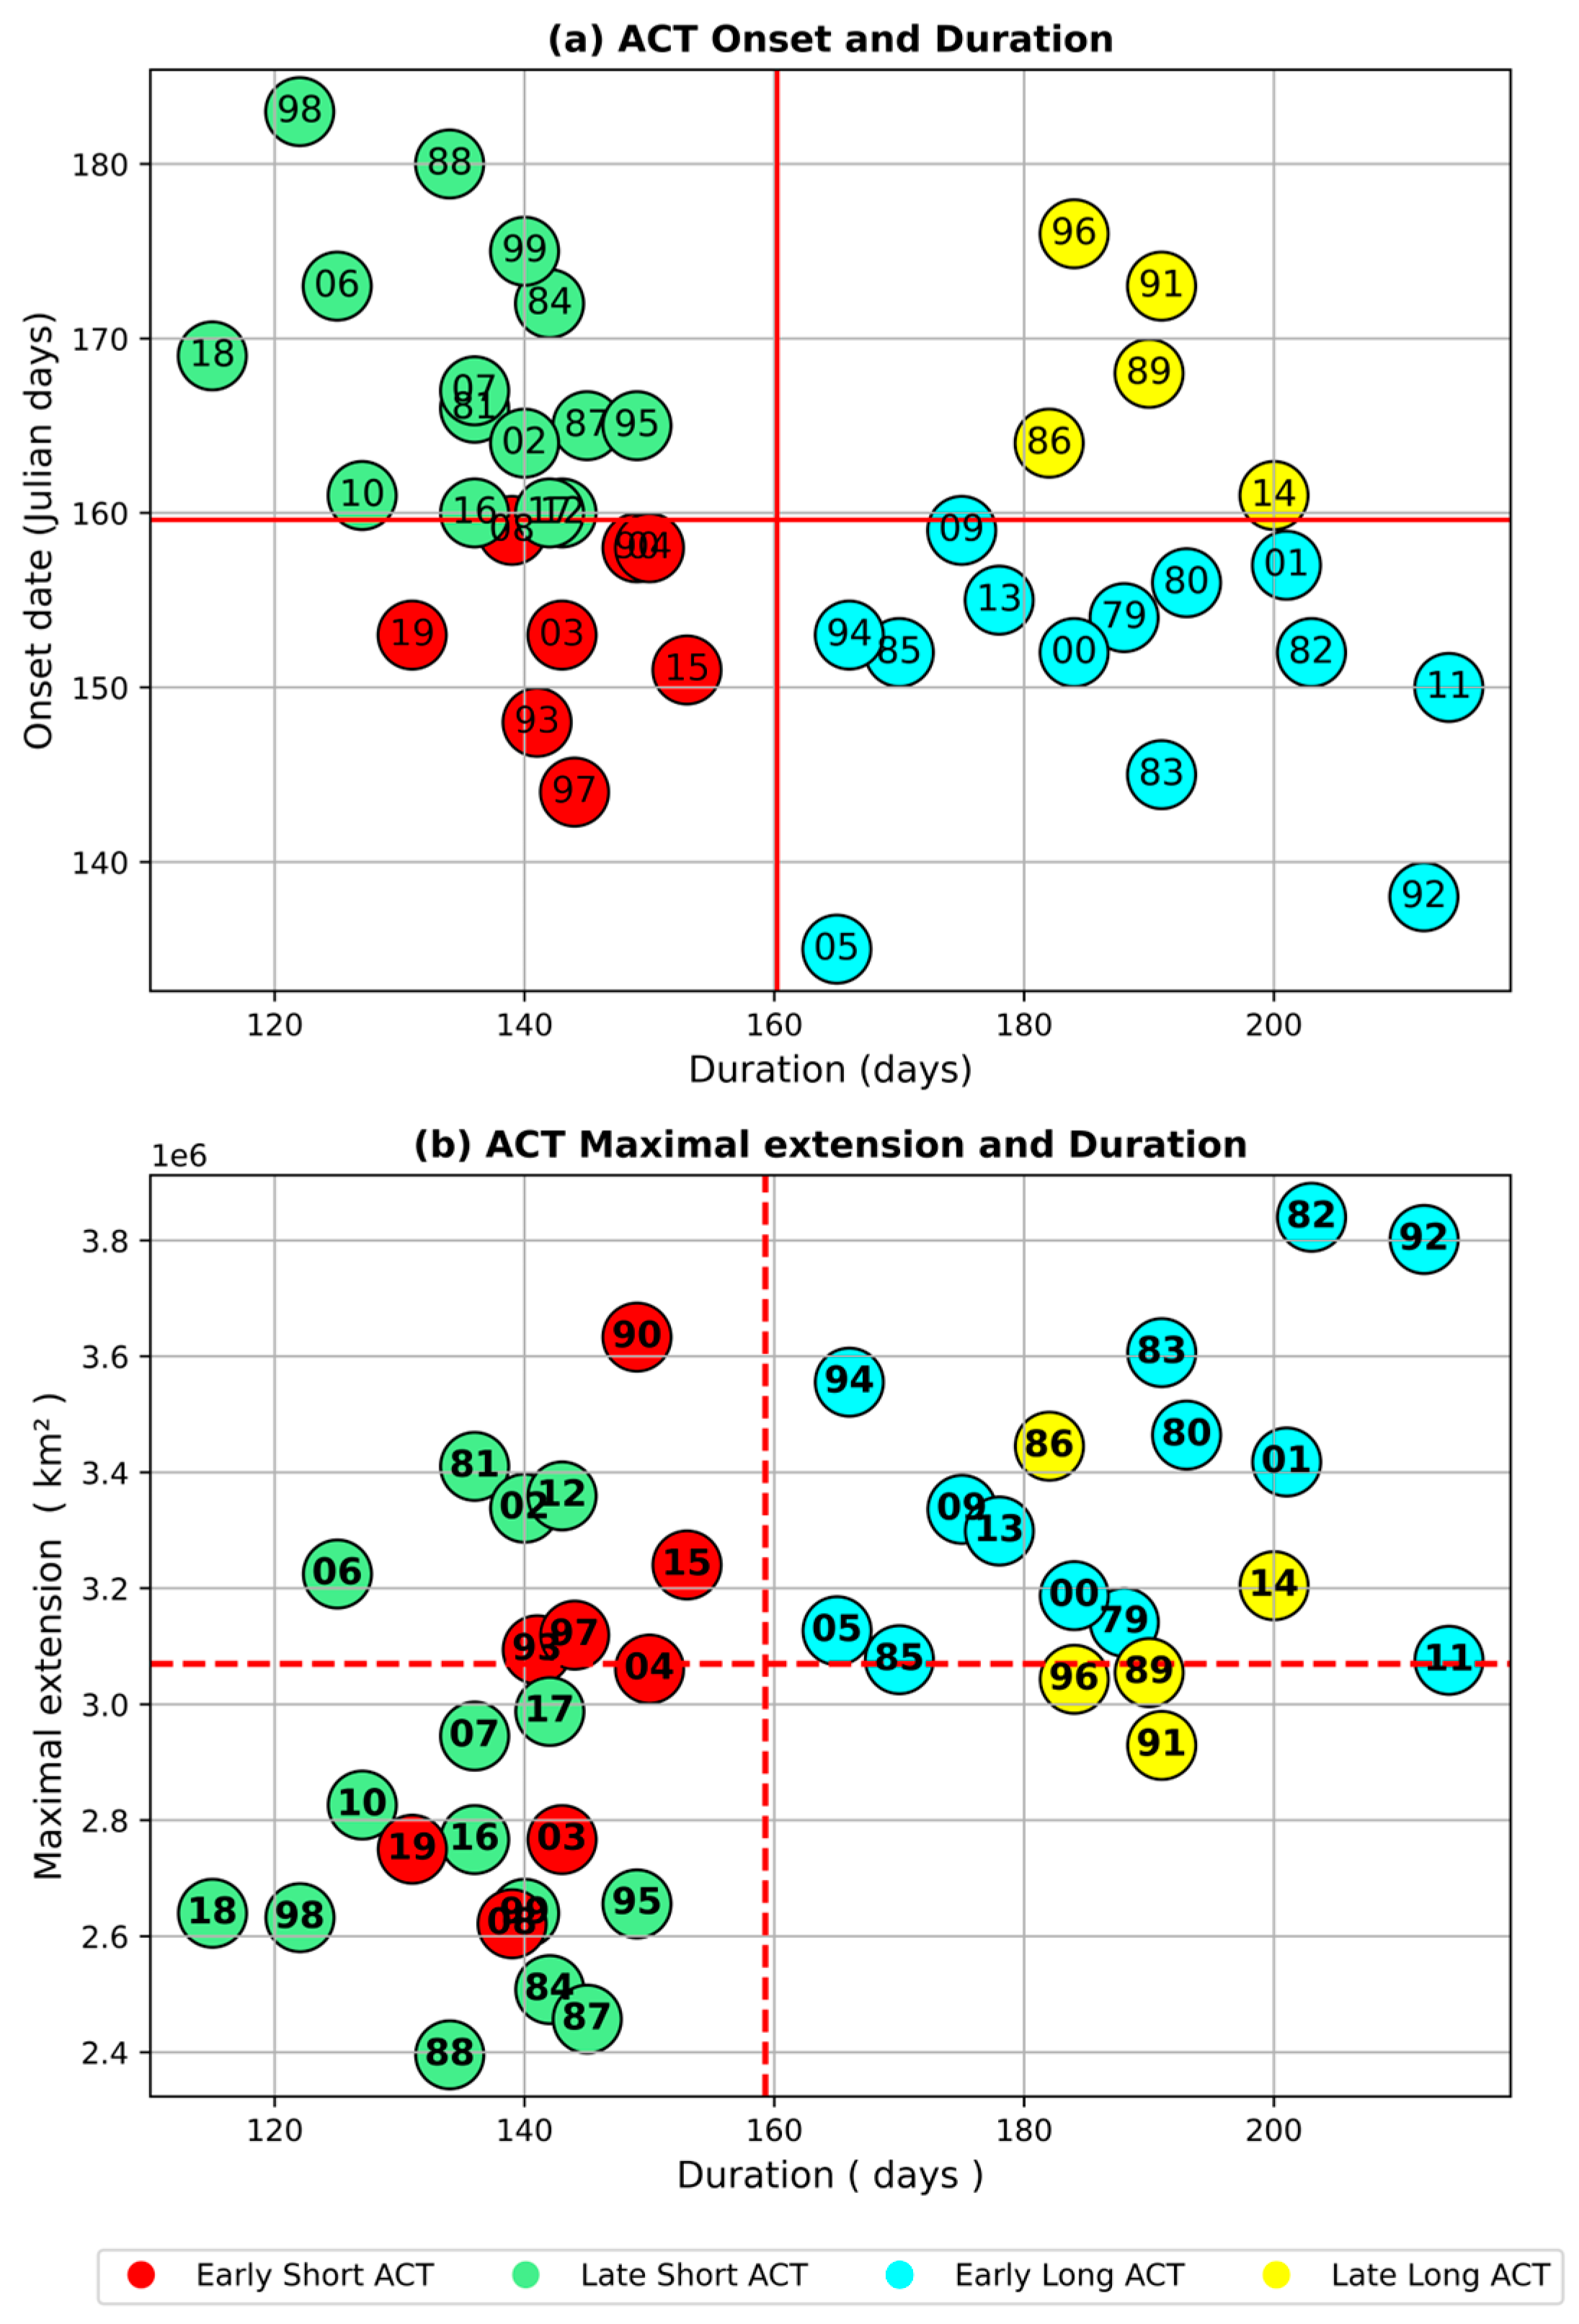
3.3. Relationships Between Mean Characteristics of the Atlantic Cold Tongue

Figure 4 shows the distribution of years according to ACT duration and onset (upper panel) and ACT duration and maximal extension of the cold tongue (lower panel) over the period 1979–2019. Figure 4a shows that years with long ACT durations are predominantly years of early onset of ACT, while those with short ACT durations are generally associated with late onset of ACT. Figure 4b shows that most years of greater cold tongue expansion correspond to years of early onset and long duration of ACT, except for 1986 and 2014, which were years of late onset and long duration of ACT. Years of weaker cold tongue expansion are years of late onset and short duration of ACT, except for 2003 and 2019, which were years of an early and short duration of ACT. Results show that 68% of years with a short ACT duration are associated with a late-onset ACT, while 70% of years with a long ACT duration are associated with early ACT onset years. In addition, 63% of years with a short duration of ACT have a cold tongue with a low maximum extent, while 83% of years with a long duration of ACT have a cold tongue with a greater maximum extent.
Figure 5 shows the distribution of years according to ACT onset date and maximal extension of the cold tongue (upper panel) and to ACT onset and mean temperature of the cold tongue (lower panel) over the period 1979–2019. Early onset years are those with larger maximum extension, while late-onset years are generally associated with a smaller maximum extension of the ACT (Figure 4a). The SSTs in the ACT are generally colder in early onset years and warmer in late-onset years. In summary, 78% of early ACT onset years are associated with the coldest SST tongue in the eastern equatorial Atlantic Ocean.

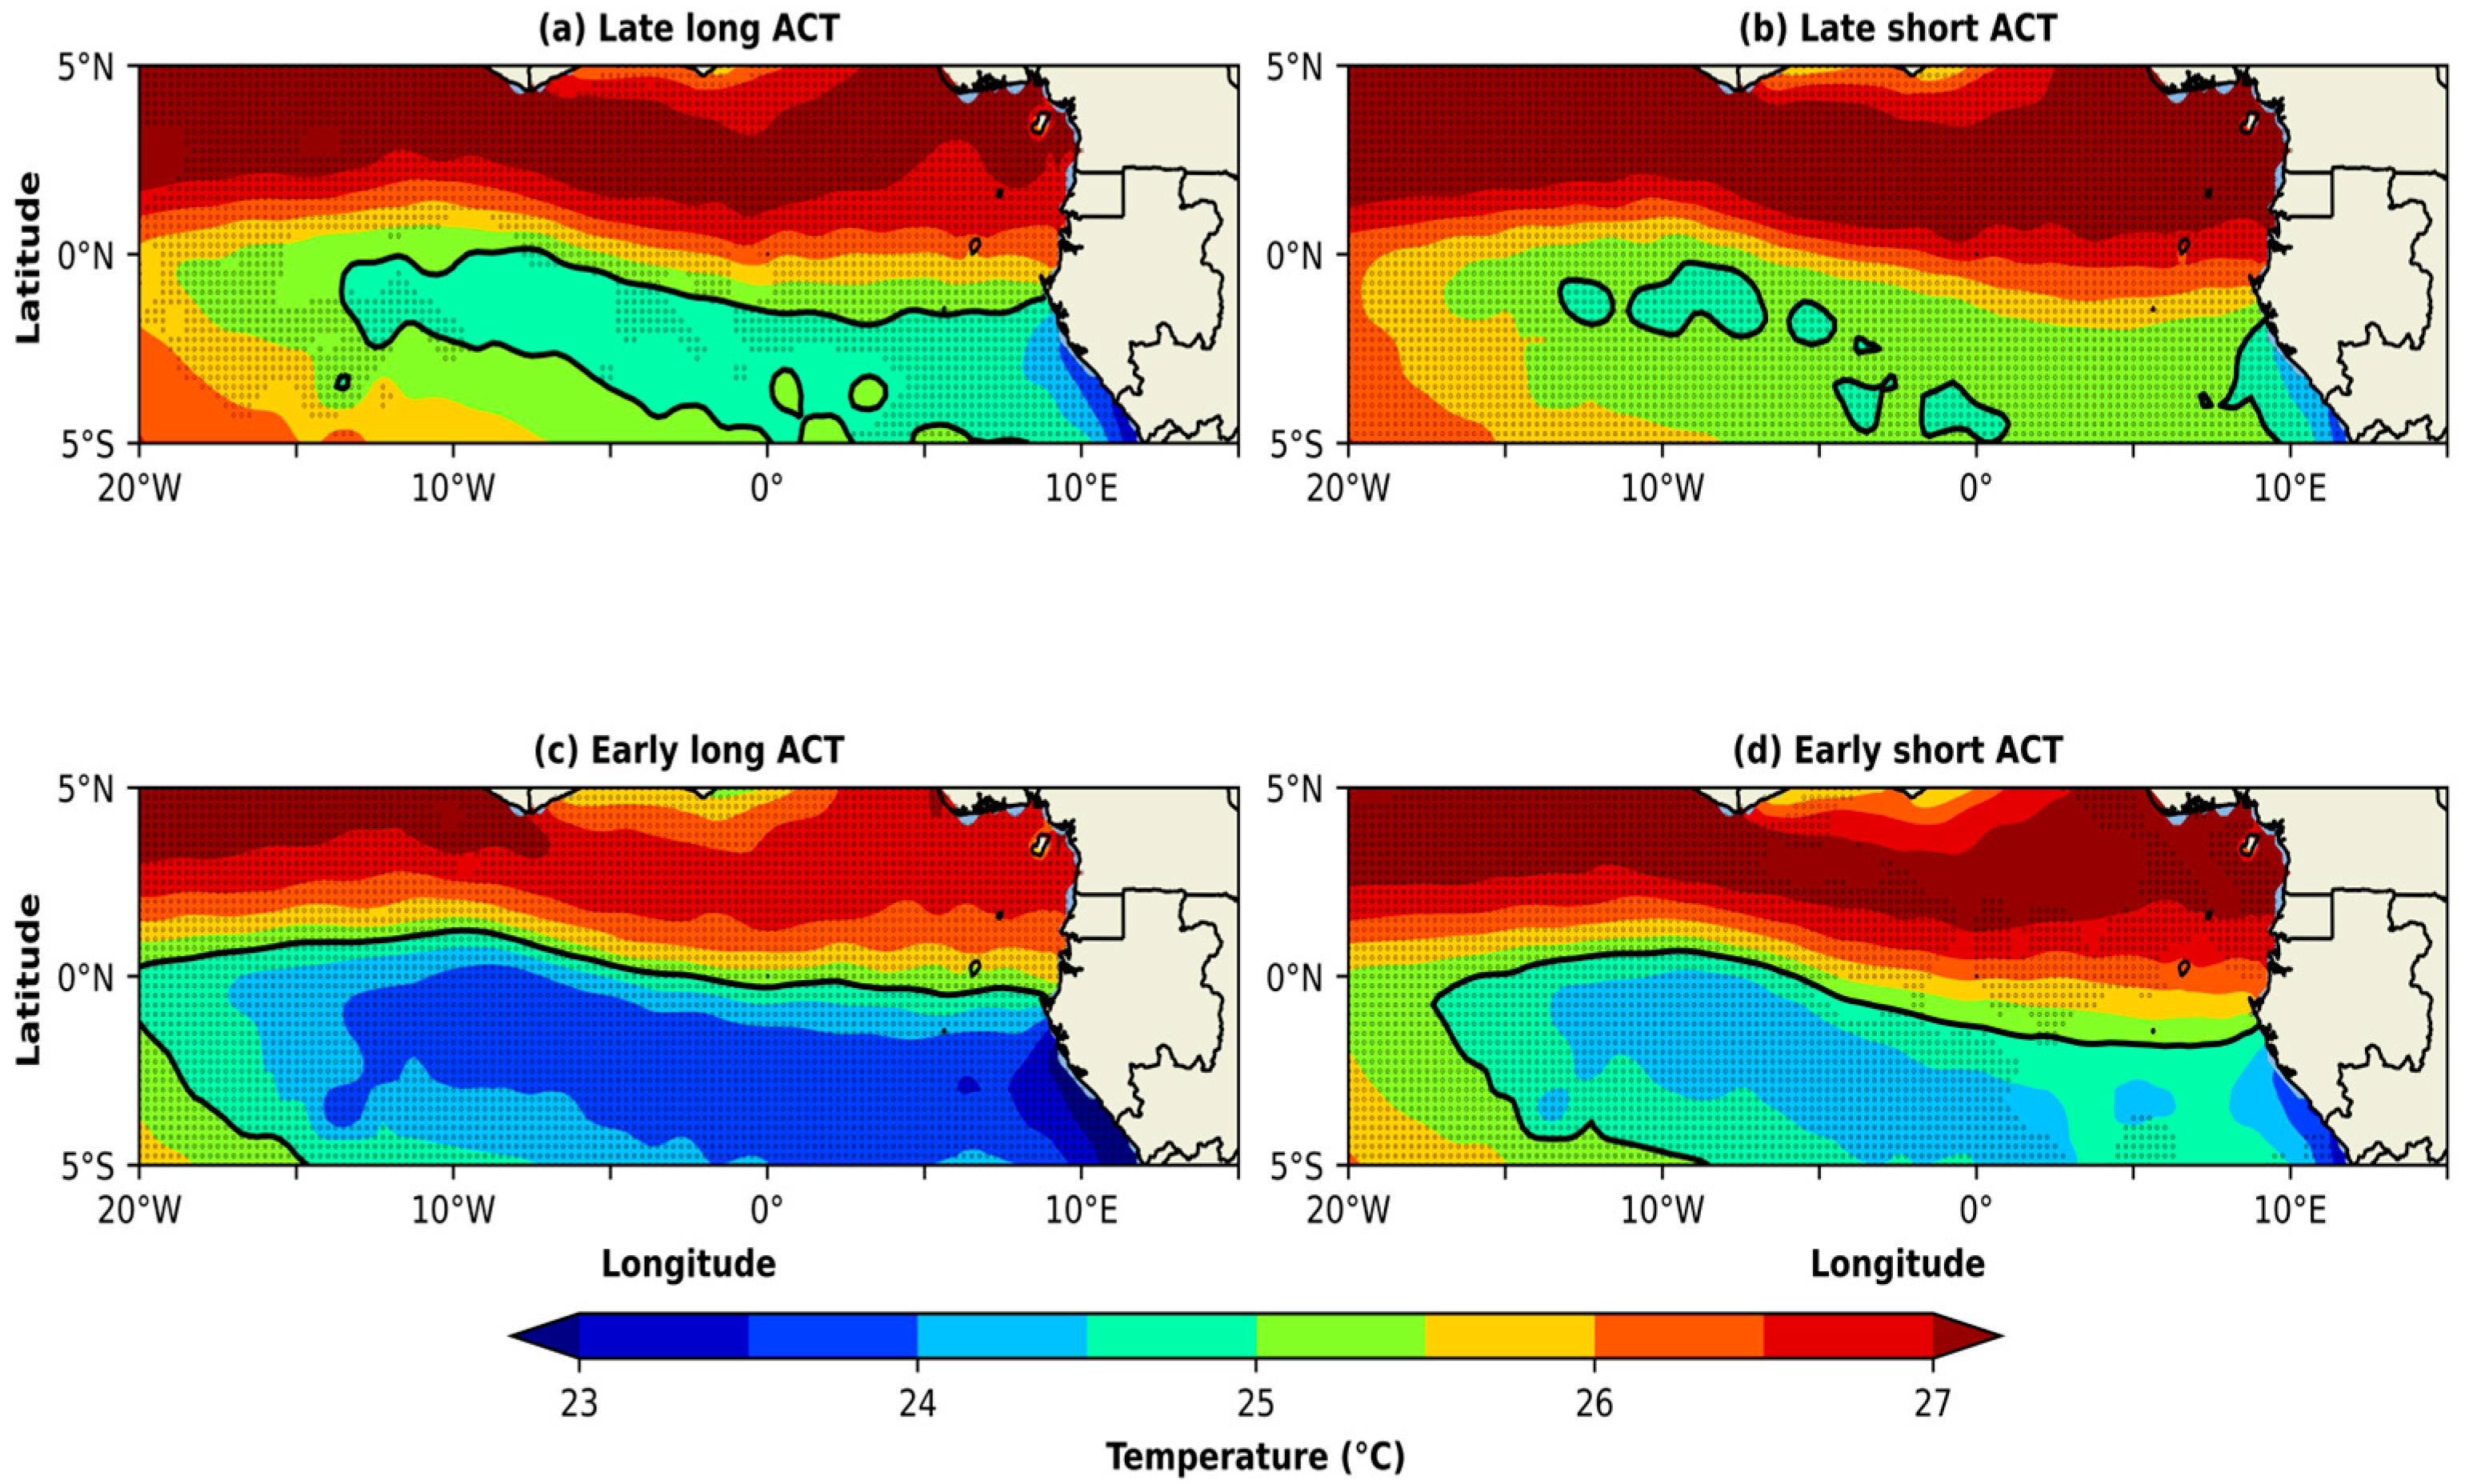
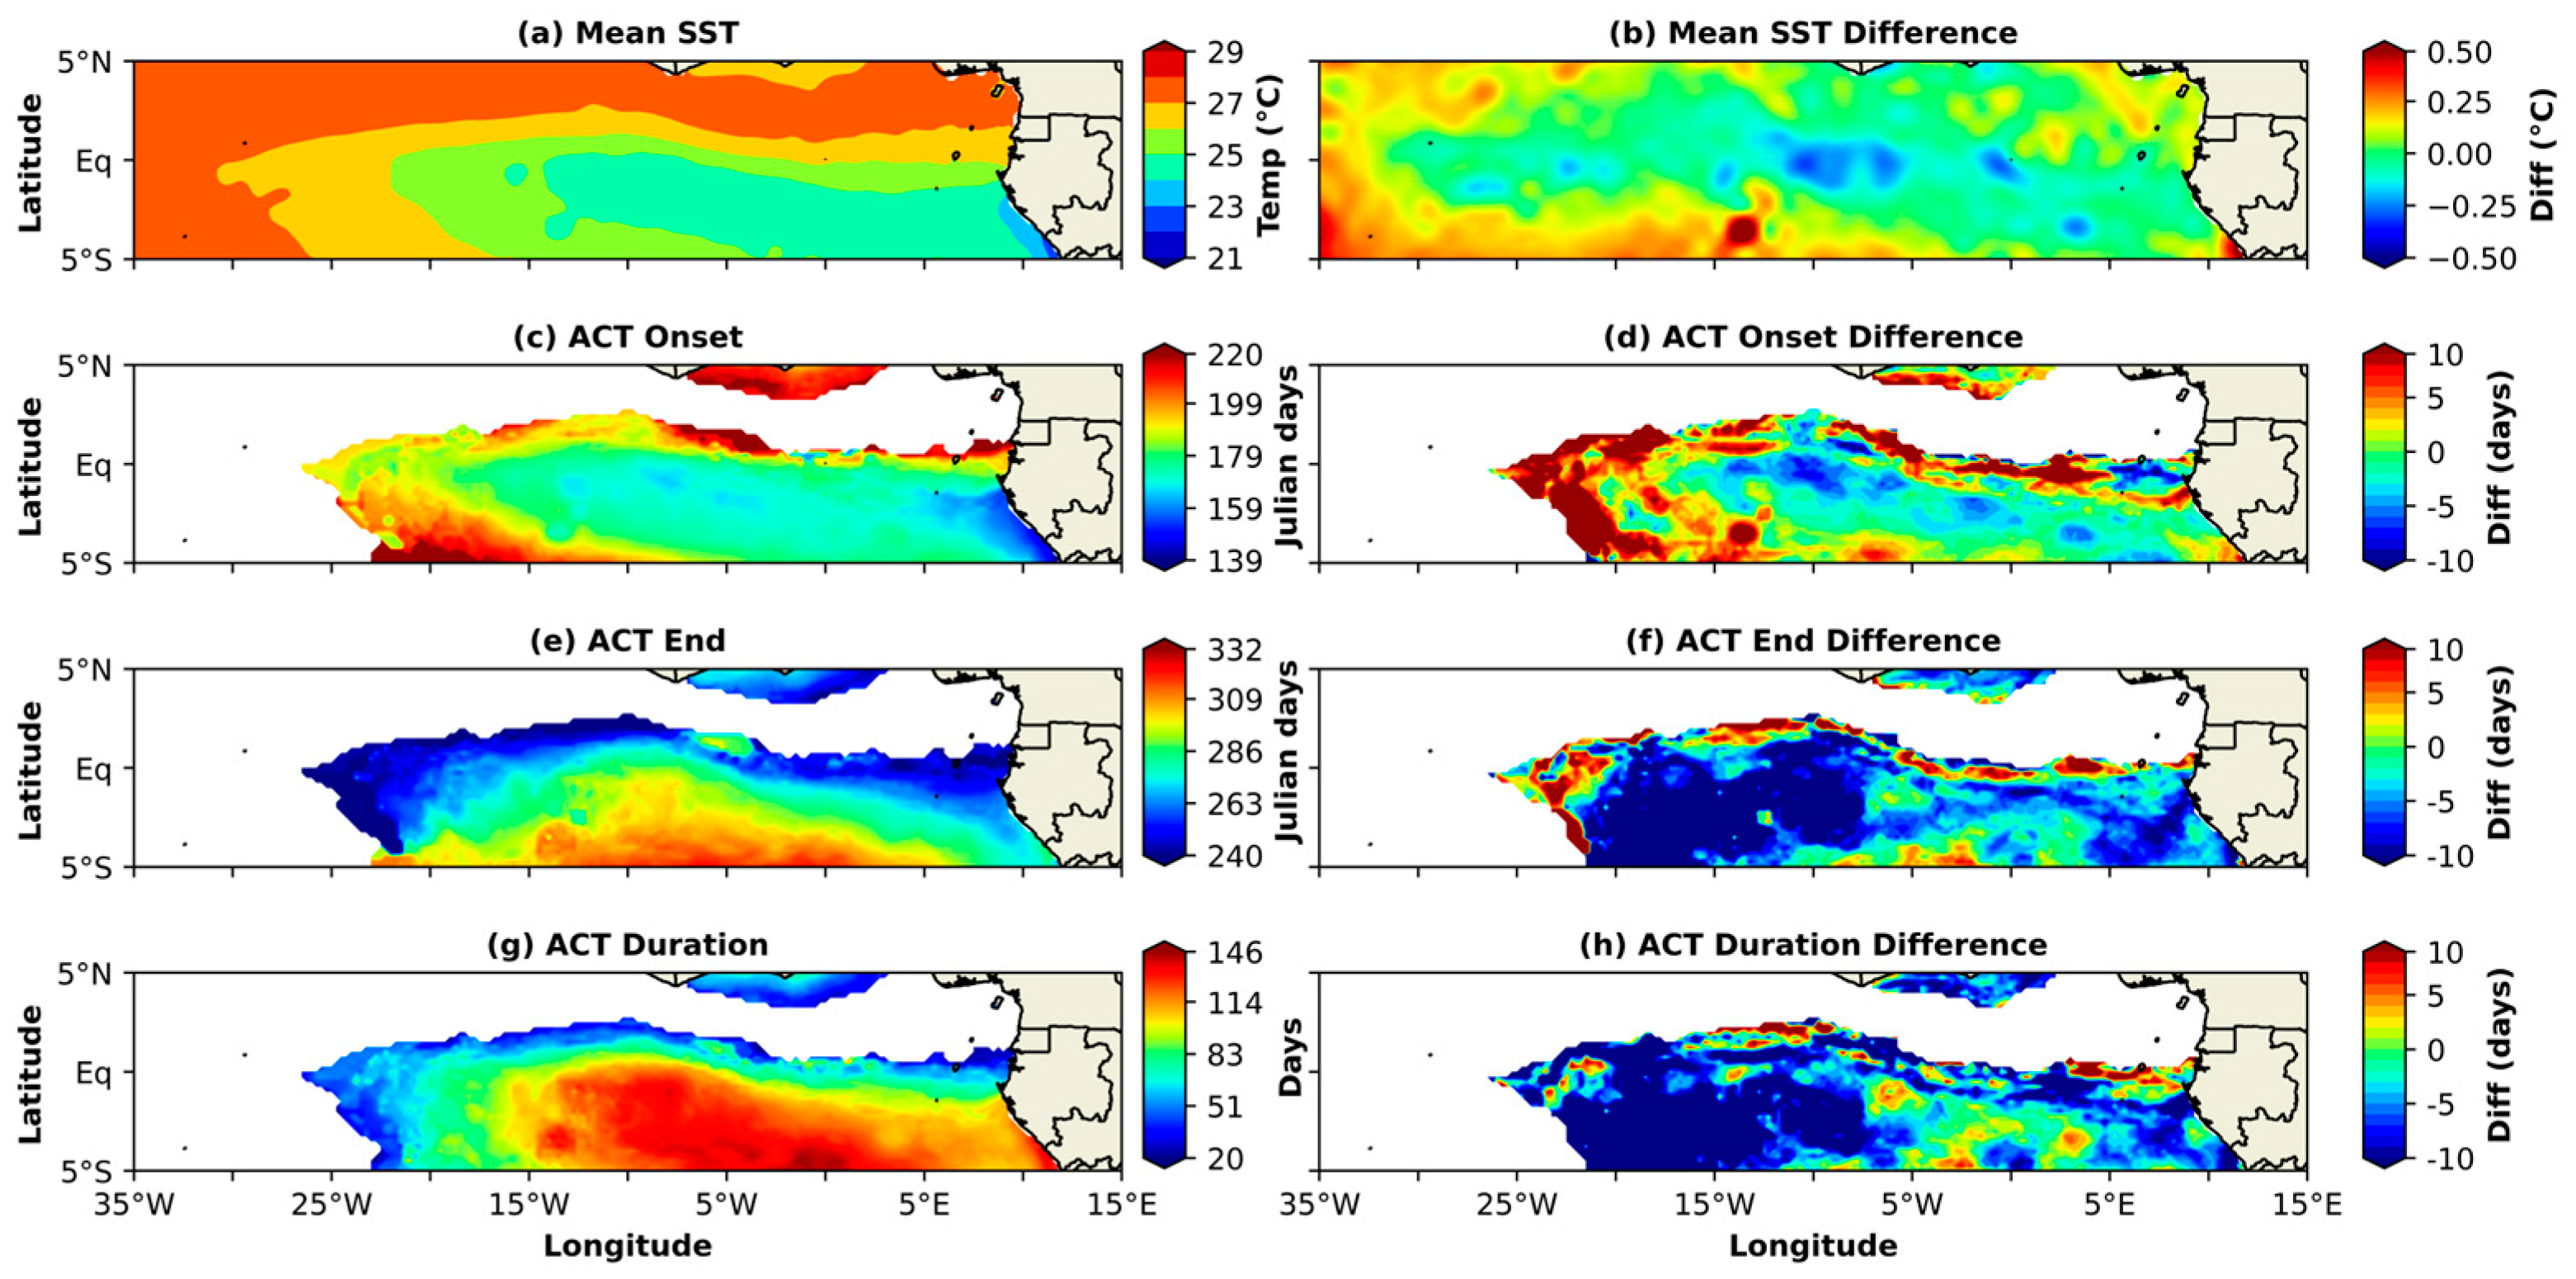
3.4. Composite Study of Observed Changes in ACT Characteristics

Based on the start and end dates and duration presented above, we defined four types of composite extreme years: Early-Long ACT, Late-Long ACT, Early-Short ACT, and Late-Short ACT (Table 1).
Figure 6 shows the maps of SST associated with the four composites defined above. The coldest SSTs over a large area occur during Early-Long years. As shown above, years with late onset and short duration of ACT are those with warmer temperatures in the region and weaker extension of the ACT. The pattern of cold tongue in Late-Long years is narrower with warmer SST than during Early-Short ACT years.
These results complete those of [24], who analyzed the interaction between SST and atmospheric conditions in the Atlantic, illustrating how changes in SST influence the cold tongue’s extent and onset. They also showed that feedbacks between oceanic cooling and atmospheric circulation reinforce the persistence of the cold tongue. These composites are also coherent with the study of [25] on the interconnected nature of the ACT’s characteristics, linking changes in SST to the timing and duration. They find that the cold tongue is most extensive when upwelling is strongest, which correlates with SSTs falling below the critical threshold. In summary, the onset of the ACT is directly linked to the drop in SSTs below a critical threshold (here 25 °C) driven by enhanced trade winds, increased upwelling, and weakened solar heating [26]. As the cold tongue begins to develop in early spring, the SSTs in the region decrease, signaling the onset of the ACT. The duration of the ACT is closely associated with how long the SSTs remain below 25 °C. As SSTs decrease due to enhanced upwelling, the spatial extent of the cold tongue expands. However, the cold tongue’s persistence is largely determined by atmospheric and oceanic conditions, including the intensity of upwelling and wind stress. The authors of [27,28] suggested that the cold tongue’s duration and extent are tightly coupled to seasonal atmospheric and oceanic conditions and feedback mechanisms such as the role of sea surface temperatures in modulating the atmospheric convection patterns, which in turn influence the solar heating and the cold tongue’s characteristics.
Figure 7 shows the mean ACT characteristics during the previous 20 years (1979–1998, left column) and their changes (anomalies, right column) in the recent 20 years (1999–2019). Figure 7a,b show a cooling of SST in recent years along the equator between 0.15 °C and 0.4 °C. This cooling is also found in the northern part of the ACT usually very warm), suggesting a decrease in the meridional gradient between the ACT and the surrounding waters. Figure 7c,d show that the ACT is triggered between 3 and 7 days earlier in recent years than in the past 20 years. The western part of ACT (west of 10° W) presents positive values of onset in recent years, suggesting late ACT occurrence in this region and meaning also that the ACT has weaker westward propagation in recent years. It will be worth investigating how this shift is associated with changes in trade winds. Figure 7e,f show that the ACT ends between 6 and 12 days earlier in recent years than in the past 20 years. This shift in the end dates is stronger on the western side in an area where it has noted a late onset in recent years (Figure 7c,d), confirming that the maximum extent of ACT is weaker these last years than in the past. Figure 7g,h show a decrease in the ACT duration in recent years, particularly in the western and central parts. This overall decrease in ACT duration is coherent with shifts in onset and end dates. Moreover, as the changes in the ACT end dates are larger than those in the onset dates, the decrease in ACT duration is between 5 and 12 days in recent years.
In summary, the analysis of changes in the ACT characteristics shows a cooling trend in SST, with ACT occurring and ending earlier these recent years than in the past, a weaker maximum extent, and a duration that is 5 to 12 days shorter in the last 20 years than in the previous 20 years. However, the onset, duration, SST values, and maximum extent of the ACT are interlinked, while in this study, SST values are used as indicators for the cold tongue’s development [24,25]. Changes in trade wind strength, atmospheric circulation, and ocean upwelling are all influential in shaping the timing, persistence, and spatial characteristics of the ACT [22,29]. Variability in these factors can cause significant fluctuations in the ACT’s behavior, both within individual seasons and across different interannual periods [3,22,24,30].

4. Conclusions

The aim of this work was to investigate potential relationships between the onset, the duration, and the maximum extent of the ACT using ERA5 reanalysis over the period 1979–2019. These ACT characteristics are known to influence weather patterns and precipitation in surrounding regions and the West African Monsoon System. Indeed, the onset of the ACT generates an SST gradient (SST colder along the equator in the cold tongue and warmer in the Guinea Gulf) that accelerates the trade winds over the cold tongue and the westerly winds over the Guinea Gulf, transporting moisture from the ocean and enhancing enabling conditions for the rainy season over the continent.
Results show that years with a short ACT duration are generally years with a late-onset ACT, while most years with a long ACT duration are associated with an early ACT onset. Years with a short duration of ACT have a cold tongue with a low maximum extent, while most years with a long duration of ACT have a cold tongue of greater maximum extent. Finally, early ACT onset years are associated with the coldest SST tongue in the eastern equatorial Atlantic Ocean. A comparison of the last 20 years (1999–2019) with the previous 20 years (1979–1998) shows a cooling trend in SST, with ACT occurring and ending earlier in recent years than in the past. However, as the shifts in the end date are greater than those in the onset date, the duration of the ACT has been 5–12 days shorter in the last 20 years than in the previous 20 years.
In perspective, there is a need to better understand the interactions between the Atlantic Cold Tongue and phenomena such as the Atlantic Niño and its counterpart, the Atlantic cold events, as well as their respective influence on precipitation and convection over West Africa. Indeed, the development of warm or cold anomalies in SSTs can alter the intensity and timing of the cold tongue [10]. In addition, the role of remote forcing from other ocean basins, particularly from the Pacific Ocean and during El Niño Southern Oscillation (ENSO) events, needs to be investigated to better describe how changes in atmospheric circulation patterns can affect wind and ocean dynamics in the Atlantic, modulating the strength of the cold tongue [31]. Finally, a comparative study between the ACT variability and the other large-scale SST forcings needs to be investigated to fully capture the role of synoptic and large-scale forcing in the intraseasonal and interannual variability of precipitation in West Africa [32,33].

Author Contributions

Conceptualization, D.I.K., A.D. (Adama Diawara) and A.D. (Arona Diedhiou); methodology, A.D. (Adama Diawara), A.L.M.Y. and A.D (Arona Diedhiou); software, D.I.K.; validation, F.S.; formal analysis, B.K.K., F.Y., A.L.M.Y. and M.D.; investigation, D.I.K. and F.S.; resources, B.K.K., F.Y., K.K., T.D.T. and A.D. (Arona Diedhiou); data curation, D.I.K., A.L.M.Y. and T.D.T.; writing—original draft preparation, D.I.K., A.D. (Adama Diawara) and A.D. (Arona Diedhiou); writing—review and editing, B.K.K., F.Y., K.K., A.L.M.Y., T.D.T., M.D. and F.S.; visualization, D.I.K.; supervision, A.D. (Adama Diawara) and A.D. (Arona Diedhiou); project administration, A.D. (Adama Diawara).; funding acquisition, A.D. (Adama Diawara) and A.D. (Arona Diedhiou). All authors have read and agreed to the published version of the manuscript.

Funding

The research leading to this publication is co-funded by the Ministry of Higher Education and Scientific Research and IRD (Institut de Recherche pour le Développement; France) grant number “UMR IGE Imputation 252RA5”.

Institutional Review Board Statement

Not applicable.

Informed Consent Statement

Not applicable.

Data Availability Statement

The data presented in this study are openly available from the European Centre for Medium-Range Weather Forecasts (ECMWF) as part of the ERA5 reanalysis dataset. These data can be accessed at https://cds.climate.copernicus.eu/ under the conditions of the Copernicus Climate Data Store (CDS).

Acknowledgments

The authors would like to thank Lamto Research Station and the Centre national de calcul de haute performance de Côte d’Ivoire for providing the facilities and equipment required for this study.

Conflicts of Interest

The authors declare no potential conflicts of interest.

References

  1. Sultan, B.; Janicot, S.; Diedhiou, A. The West African Monsoon Dynamics. Part I: Documentation of Intraseasonal Variability. J. Clim. 2003, 16, 3389–3406. [Google Scholar] [CrossRef]
  2. Steinig, S.; Harlaß, J.; Park, W.; Latif, M. Sahel rainfall strength and onset improvements due to more realistic Atlantic cold tongue development in a climate model. Sci. Rep. 2018, 8, 2569. [Google Scholar] [CrossRef]
  3. Caniaux, G.; Giordani, H.; Redelsperger, J.-L.; Guichard, F.; Key, E.; Wade, M. Coupling between the Atlantic cold tongue and the West African monsoon in boreal spring and summer. J. Geophys. Res. 2011, 116, C04003. [Google Scholar] [CrossRef]
  4. Nobre, P.; Srukla, J. Variations of Sea Surface Temperature, Wind Stress, and Rainfall over the Tropical Atlantic and South America. J. Clim. 1996, 9, 2464–2479. [Google Scholar] [CrossRef]
  5. Philander, S.G.H.; Pacanowski, R.C. The mass and heat budget in a model of the tropical Atlantic Ocean. J. Geophys. Res. Ocean. 1986, 91, 14212–14220. [Google Scholar] [CrossRef]
  6. Planton, Y.; Voldoire, A.; Giordani, H.; Caniaux, G. Main processes of the Atlantic cold tongue interannual variability. Clim. Dyn. 2018, 50, 1495–1512. [Google Scholar] [CrossRef]
  7. Wang, C.; Enfield, D.B. The Tropical Western Hemisphere Warm Pool. Geophys. Res. Lett. 2001, 28, 1635–1638. [Google Scholar] [CrossRef]
  8. Bjerknes, J. Atlantic Air-Sea Interaction. In Advances in Geophysics; Elsevier: Amsterdam, The Netherlands, 1964; pp. 1–82. [Google Scholar]
  9. Prodhomme, C.; Voldoire, A.; Exarchou, E.; Deppenmeier, A.L.; García-Serrano, J.; Guemas, V. How Does the Seasonal Cycle Control Equatorial Atlantic Interannual Variability? Geophys. Res. Lett. 2019, 46, 916–922. [Google Scholar] [CrossRef]
  10. Keenlyside, N.S.; Latif, M. Understanding Equatorial Atlantic Interannual Variability. J. Clim. 2007, 20, 131–142. [Google Scholar] [CrossRef]
  11. Brandt, P.; Schott, F.A.; Provost, C.; Kartavtseff, A.; Hormann, V.; Bourlès, B.; Fischer, J. Circulation in the central equatorial Atlantic: Mean and intraseasonal to seasonal variability. Geophys. Res. Lett. 2006, 33, 2005GL025498. [Google Scholar] [CrossRef]
  12. Carton, J.A.; Chepurin, G.; Cao, X.; Giese, B. A Simple Ocean Data Assimilation Analysis of the Global Upper Ocean 1950–95. Part I: Methodology. J. Phys. Oceanogr. 2000, 30, 294–309. [Google Scholar] [CrossRef]
  13. Jouanno, J.; Marin, F.; Du Penhoat, Y.; Sheinbaum, J.; Molines, J.M. Seasonal heat balance in the upper 100 m of the equatorial Atlantic Ocean. J. Geophys. Res. 2011, 116, C09003. [Google Scholar] [CrossRef]
  14. Flaounas, E.; Bastin, S.; Janicot, S. Regional climate modelling of the 2006 West African monsoon: Sensitivity to convection and planetary boundary layer parameterisation using WRF. Clim. Dyn. 2011, 36, 1083–1105. [Google Scholar] [CrossRef]
  15. Nguyen, H.; Thorncroft, C.D.; Zhang, C. Guinean coastal rainfall of the West African Monsoon. Q. J. R. Meteorol. Soc. 2011, 137, 1828–1840. [Google Scholar] [CrossRef]
  16. Janicot, S.; Thorncroft, C.D.; Ali, A.; Asencio, N.; Berry, G.; Bock, O.; Bourles, B.; Caniaux, G.; Chauvin, F.; Deme, A.; et al. Large-scale overview of the summer monsoon over West Africa during the AMMA field experiment in 2006. Ann. Geophys. 2008, 26, 2569–2595. [Google Scholar] [CrossRef]
  17. Druyan, L.M.; Fulakeza, M. The impact of the Atlantic cold tongue on West African monsoon onset in regional model simulations for 1998–2002. Int. J. Climatol. 2015, 35, 275–287. [Google Scholar] [CrossRef]
  18. Obada, E.; Alamou, E.A.; Biao, E.I.; Zandagba, E.B.J. Interannual Variability and Trends of Extreme Rainfall Indices over Benin. Climate 2021, 9, 160. [Google Scholar] [CrossRef]
  19. Hersbach, H.; Bell, B.; Berrisford, P.; Hirahara, S.; Horányi, A.; Muñoz-Sabater, J.; Nicolas, J.; Peubey, C.; Radu, R.; Schepers, D.; et al. The ERA5 global reanalysis. Q. J. R. Meteorol. Soc. 2020, 146, 1999–2049. [Google Scholar] [CrossRef]
  20. Brandt, P.; Caniaux, G.; Bourlès, B.; Lazar, A.; Dengler, M.; Funk, A.; Hormann, V.; Giordani, H.; Marin, F. Equatorial upper-ocean dynamics and their interaction with the West African monsoon. Atmos. Sci. Lett. 2011, 12, 24–30. [Google Scholar] [CrossRef]
  21. Reynolds, R.W.; Smith, T.M.; Liu, C.; Chelton, D.B.; Casey, K.S.; Schlax, M.G. Daily High-Resolution-Blended Analyses for Sea Surface Temperature. J. Clim. 2007, 20, 5473–5496. [Google Scholar] [CrossRef]
  22. Zebiak, S.E. Air–Sea Interaction in the Equatorial Atlantic Region. J. Clim. 1993, 6, 1567–1586. [Google Scholar] [CrossRef]
  23. Xie, S.P.; Annamalai, H.; Schott, F.A.; McCreary, J.P. Structure and Mechanisms of South Indian Ocean Climate Variability*. J. Clim. 2002, 15, 864–878. [Google Scholar] [CrossRef]
  24. Xie, S.-P.; Carton, J.A. Tropical Atlantic Variability: Patterns, Mechanisms, and Impacts. In Geophysical Monograph Series; Wang, C., Xie, S.P., Carton, J.A., Eds.; American Geophysical Union: Washington, DC, USA, 2004; pp. 121–142. [Google Scholar]
  25. Richter, I.; Behera, S.K.; Masumoto, Y.; Taguchi, B.; Sasaki, H.; Yamagata, T. Multiple causes of interannual sea surface temperature variability in the equatorial Atlantic Ocean. Nat. Geosci. 2013, 6, 43–47. [Google Scholar] [CrossRef]
  26. Servain, J.; Wainer, I.; McCreary, J.P.; Dessier, A. Relationship between the equatorial and meridional modes of climatic variability in the tropical Atlantic. Geophys. Res. Lett. 1999, 26, 485–488. [Google Scholar] [CrossRef]
  27. Zebiak, S.E.; Cane, M.A. A Model El Ni&ntilde–Southern Oscillation. Mon. Weather. Rev. 1987, 115, 2262–2278. [Google Scholar]
  28. Barton, E.D. Eastern boundary of the North Atlantic: Northwest Africa and Iberia. In The Sea; John Wiley & Sons Inc.: New York, NY, USA, 1998; pp. 633–657. [Google Scholar]
  29. Meynadier, R.; de Coëtlogon, G.; Leduc-Leballeur, M.; Eymard, L.; Janicot, S. Seasonal influence of the sea surface temperature on the low atmospheric circulation and precipitation in the eastern equatorial Atlantic. Clim. Dyn. 2016, 47, 1127–1142. [Google Scholar] [CrossRef]
  30. McPhaden, M.J.; Zhang, D. Slowdown of the meridional overturning circulation in the upper Pacific Ocean. Nature 2002, 415, 603–608. [Google Scholar] [CrossRef]
  31. Lübbecke, J.F.; McPhaden, M.J. On the Inconsistent Relationship between Pacific and Atlantic Niños*. J. Clim. 2012, 25, 4294–4303. [Google Scholar] [CrossRef]
  32. Diakhaté, M.; Rodríguez-Fonseca, B.; Gómara, I.; Mohino, E.; Dieng, A.L.; Gaye, A.T. Oceanic Forcing on Interannual Variability of Sahel Heavy and Moderate Daily Rainfall. J. Hydrometeorol. 2019, 20, 397–410. [Google Scholar] [CrossRef]
  33. Didi, S.R.; Diakhaté, M.; Diedhiou, A. Changes in the West Africa Monsoon Precipitation Extremes during ENSO developing Phases. Atmos. Ocean 2023, 61, 293–305. [Google Scholar] [CrossRef]
Figure 1. Map of mean SST from May to October (1979–2019) in the tropical Atlantic. The rectangular box represents the area from which the characteristics of the ACT were computed. The color scale represents the mean SST values.
Atmosphere 16 00047 g001
Figure 2. Average seasonal cycle of SST in the ACT region. The top panel shows monthly SST maps for the study area. The bold line is the 25 °C SST contour delineating the ACT (in blue). The lower panel shows the monthly change in SST averaged over the entire study area, while the boxplots show the dispersion of SST for each month over the 40 years (1979–2019).
Atmosphere 16 00047 g002
Figure 3. (a) SST climatology from May to September for the period 1979–2019. (b) ACT onset climatology over the period 1979–2019; (c) ACT dissipation climatology over the period 1979–2019; (d) ACT duration climatology over the period 1979–2019. Color scales indicate (a) sea surface temperature (°C), (b,c) Julian days, and (d) number of days of sea surface cooling in the region.
Atmosphere 16 00047 g003
Figure 4. Distribution of years according to (a) ACT duration and onset and (b) ACT duration and maximal extension of the cold tongue over the period 1979–2019. Numbers in circles indicate the last two digits of the corresponding year. The vertical red line represents the mean ACT duration, which is 160 days. In the upper panel, the horizontal red line represents the mean date of ACT onset, which is 7th June, expressed in Julian days. In the lower panel, the horizontal red line represents the mean of the maximal extension of ACT, which is 3.07 × 10⁶ km2.
Atmosphere 16 00047 g004
Figure 5. Distribution of years according to (a) ACT onset date and maximal extension of the cold tongue and (b) ACT onset and mean temperature of the cold tongue over the period 1979–2019. Numbers in circles indicate the last two digits of the corresponding year. The vertical red line represents the mean ACT onset, which is 160 days. In the upper panel, the horizontal red line represents the mean date of ACT onset, which is 7th June, expressed in Julian days. In the lower panel, the horizontal red line represents the mean of the maximal extension of ACT, which is 3.07 × 10⁶ km2.
Atmosphere 16 00047 g005
Figure 6. Composite maps of mean SST from May to September. Dotted areas correspond to regions with significant values (considering the 95% confidence interval of the Monte Carlo test with 1000 random permutations). The black line contour indicates 25 °C isotherm lines.
Atmosphere 16 00047 g006
Figure 7. Composite maps of ACT characteristics during the period 1979–1998 (left column) and their mean changes (anomalies) in the recent period 1999–2019 (right column), respectively, for mean SST in the ACT region (a,b), the ACT onset date (c,d), the ACT end (e,f), and the ACT duration (g,h).
Atmosphere 16 00047 g007
Table 1. Summary of years used to compute composite fields.
Early-Long ACTLate-Long ACTEarly-Short ACTLate-Short ACT
1982198619931988
1983198919971998
1992199120031999
2011199620192006
Disclaimer/Publisher’s Note: The statements, opinions and data contained in all publications are solely those of the individual author(s) and contributor(s) and not of MDPI and/or the editor(s). MDPI and/or the editor(s) disclaim responsibility for any injury to people or property resulting from any ideas, methods, instructions or products referred to in the content.

