Abstract
Mounting evidence suggests an increasing heatwave risk in the Chinese mainland, posing notable threats to public health and the socioeconomic landscape. In a comprehensive analysis, considering both climate and socioeconomic factors, including Gross Domestic Product (GDP) and population dynamics, we systematically evaluated the spatiotemporal distribution of heatwave socioeconomic exposure in the Chinese mainland from 2000 to 2019, utilizing a more comprehensive heatwave hazard index (HHI) that synthesizes heatwave intensity, frequency, and duration as climate factor for the first time. Results show that (1) Heatwave exposure is pronounced in eastern China, particularly in Southeast (SE), North China (NC), and Southwest (SW) regions. From 2000 to 2019, heatwave exposure showed an overall upward trend, with the most rapid escalation observed in the SE, NC, and SW regions. Population exposure manifests as a clustered expansion pattern, while GDP exposure demonstrates a more centralized distribution. (2) Climatic factors exert the most notable influence on population exposure, while GDP predominantly impacts economic exposure. The combination of climate and socioeconomic factors contributes less to exposure rates, except in the Northeast (NE) and Southwest (SW) regions where it impacts GDP exposure most. (3) High-risk hotspot cities include Shanghai, Beijing, Chongqing, Guangzhou, Wuhan, Zhengzhou, Hangzhou, Xi’an, Tianjin, and Nanjing. These findings underscore the urgent need for targeted interventions and mitigation strategies in these vulnerable areas.
1. Introduction
In the context of global warming, the population across the globe has been suffering from extreme weather events in recent years [1,2]. As one of the most harmful extreme weather events [1,3], heatwave events have increased in frequency, intensity, and duration and their impact on human health and the economy has also increased since the 1950s [4,5]. For example, heatwaves that occurred in western North America in 2021 resulted in more than 1400 deaths [6,7], which evidenced that even regions with advanced administrative and medical experience cannot avoid the catastrophic consequences of heatwaves. Indeed, the changes in exposure to heat stress will be critical to heat-related morbidity and mortality [1,8,9]. Therefore, assessment of the spatiotemporal distribution of heatwave exposure is meaningful for residents and policy makers.
Heatwaves, typically defined as prolonged periods of excessive heat lasting more than three days [10], lack a universally accepted definition [11]. Various thermophysiological and heat exchange theories have led to indicators like wet-bulb globe temperature (WBGT) [12] and heat index (HI) [13] that consider factors such as wind speed and relative humidity to evaluate thermal comfort. The thresholds for defining heatwaves include absolute, relative, and combined criteria. Recent studies have shown that combining absolute and relative thresholds enhances the accuracy of defining heatwaves: absolute thresholds provide intuitive clarity, while relative thresholds accommodate spatial climatic heterogeneity effectively [14,15,16].
Heatwave exposure, measured by the impact on populations and gross domestic product (GDP), has profound implications for health and economies [8]. There is clear evidence that heatwave exposure has far-reaching consequences for human health and the economy [4,17]. Recent research has focused on historical detection and future prediction of heatwave impacts [4,18,19], using tools like Global Heatwave and Warm-Spell Record (GHMR) [20] and scenarios like Shared Socioeconomic Pathways (SSPs) proposed by the Intergovernmental Panel on Climate Change (IPCC) [21]. While the duration of heatwaves is commonly considered in exposure analysis, neglecting frequency and intensity can limit understanding. The HWI (Heatwave Index) is a HI-based definition of the intensity of a heatwave with a minimum duration, while the HHI (heatwave hazard index) is a composite index that takes into account all three of the above heatwave metrics after extracting the heatwave, not just the duration [22], which may give the HHI some advantages as a means of conducting exposure analyses. Therefore, it is crucial to comprehensively analyze the spatial distributions and temporal variations in heatwave exposure, along with the contributions of climate and socioeconomic factors.
Research in the Chinese mainland has advanced in assessing heatwave exposure, such as spatiotemporal assessments by Li and Zha [23] and forecasting studies by Sun et al. [24]. However, existing studies often suffer from small study areas, outdated timeframes, low spatial resolutions, or single-factor analyses. Despite a steady increase in heatwave hazards in China from 2000 to 2019—coinciding with significant economic development and population mobility, especially after joining the World Trade Organization in 2001 and hosting the Beijing Olympics in 2008 [25,26]—a comprehensive national-scale investigation into socioeconomic exposure to heatwaves during the summer months is currently lacking.
This study defined heatwave by the HWI, and then analyzed spatiotemporal distribution of the heatwave historical exposure in the Chinese mainland (hereafter China) for the period 2000–2019 based on HHI as a climate factor, and total and vulnerable population and GDP as socioeconomic factors. After that, we calculated climate and socioeconomic effects and their interaction on exposure. Finally, we determined the aggregate heatwave population exposure (APE) and the aggregate GDP exposure (AGE) and their trends in built-up areas at the city and county levels.
2. Materials and Methods
2.1. Study Drea and Data
China has a large latitudinal and longitudinal span and complex and diverse terrain and climate types [27]. Nationally, the extremely high temperature is concentrated in summer. Due to the combined influence of human activities and natural factors, climate change has led to a significant increase in the frequency and intensity of heatwaves widely observed in China during summer [28,29,30,31]; even in the Qinghai–Tibet Plateau, the highest terrain and the coolest place in China, an obvious upward trend was observed [32,33,34,35].
Meanwhile, as the largest developing country, China is one of the regions that has suffered most severely from heatwaves due to its large population, rapid urbanization, and population aging [36,37,38,39]. The changes in temperature and populations in different regions of China are different. Therefore, it is divided into six sub-regions, including North China (NC), Southwest (SW), Southeast (SE), Northeast (NE), and Northwest (NW) China and the Tibetan Plateau (TP) according to the social–economic and geo-climatic conditions [40] (Figure 1). To characterize heatwave exposure in China, we utilize the designation “CN” to signify China for subsequent statistical elucidation.
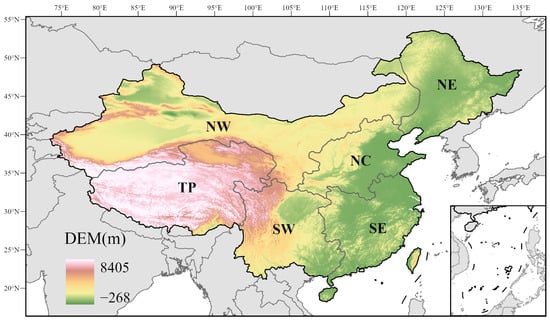
Figure 1.
Study area: sub-regions including North China (NC), Southwest (SW), Southeast (SE), Northeast (NE), Northwest (NW) China and the Tibetan Plateau (TP).
In this study, daily grid meteorological datasets were used to calculate annual heatwave records [22]. Elevation, population, and GDP data are bilinearly resampled to the spatial resolution of 0.01°. The elevation data were used in ANUSPLIN model, a spatial interpolation method for meteorological data based on thin-plate smooth spline function theory developed by the Australian National University, and population and GDP were employed as the source of socioeconomic exposure in the assessment of the heatwave.
This study utilized data from various sources: elevation data were sourced from the Resource and Environmental Science and Data Center (RESDC) of the Chinese Academy of Sciences; Population data covering the period 2000–2019 were obtained from the WorldPop research program [41], employing a top-down unconstrained random forest-based dasymetric redistribution method for calculation. Gridded GDP data [42], also from RESDC, were derived using a multi-factor weight assignment method incorporating national sub-county GDP statistics, land use, nightlight data, and settlement density. The Rising LAB [43] index model categorized 337 cities into six tiers based on factors such as commercial concentration, city hubs, activity levels, lifestyle diversity, and future potential. The China Urban Built-up Areas dataset was accessed from A Big Earth Data Platform for Three Poles [44] to focus on densely populated and economically developed areas.
2.2. Method to Calculate Heatwaves
In this study, we used the HWI to identify heatwave events. HWI is derived from the Torridity Index (TI) and HI, a valid index for predicting heatwave weather [13]. TI, calculated from MT and RH, identifies torridity days when TI meets or exceeds a threshold, TI′. For our analysis, TI′ was determined as the 50th quantile of TI values where MT > 33 °C.
HI incorporates TI and TI′ to quantify the cumulative heat effect, defining a heatwave as a period of 3 or more consecutive torrid days with HWI ≥ 2.8.
Here, represents TI of the i-th torridity day before the current day; represents the number of days from the i-th day before the current day to the current day; represents the i-th day in a heatwave event; N represents the duration of the heatwave event, and the unit is day (d).
Heatwave frequency (HWF), maximum HI of a heatwave (HWMHI), and maximum heatwave duration (HWMD) in a year—representing frequency, intensity, and duration, respectively—were used to calculate HHI [22]. In this study, the unit of HHI is ha, and the range is normalized to 0–1. And HHI was employed to calculate heatwave exposure as a climatic factor.
2.3. Climate and Socioeconomic Effects on Changes in Heatwave Exposure
Heatwave socioeconomic exposure (ESocioeco) contains two aspects: population exposure (EPop) and GDP exposure (EGDP). Heatwave exposure was usually calculated by multiplying population or GDP with heatwave characteristics (usually duration) in each grid cell each year [9,16,18]. To provide a more comprehensive analysis of heatwave socioeconomic exposure, HHI, a comprehensive index was introduced to calculate exposure.
For a given year (y) and a given grid (g), the heatwave exposure is the product of the climate factor (HHI) and the socioeconomic factor (population, GDP). In this study, EPop is expressed in person·ha, and EGDP is expressed in CNY·ha.
The changes in ESocioeco are influenced by changes in climate, socioeconomic, and their interactions (Equation (6)), and the contribution of three aspects (CHHI, CSocioeco, Cboth) is analyzed as in Equation (7) [40,45].
Here, h and s respectively represent the values of HHI and socioeconomic factors at the starting period; “∆h”, “∆s”, and “∆e” are the increases in HHI, socioeconomic factors, and heatwave exposure relative to starting period.
2.4. Other Methods
We conducted temporal trend analysis using least squares linear regression to investigate variations in heatwave exposure and the contributions of climatic and socioeconomic factors. Time points were denoted as “2000–2005”, representing variable changes and factor contributions from 2000 to 2005. Time periods like “for5-lat5” denote averages over the first 5 years (2000–2005) compared to the last 5 years (2015–2019). Logarithmic scales were used due to data distribution characteristics, focusing on areas where heatwaves occurred by excluding non-affected regions.
To analyze heatwave exposures across cities by economic development tiers, cities were classified based on index models and intersected with urban built-up area data to refine spatial extents. Statistical analyses were then conducted to assess socioeconomic exposures. Similarly, counties were analyzed from their original extents to mitigate biases from suburban areas in overall statistics.
3. Results
3.1. Spatial Distribution of Socioeconomic Heatwave Exposures
Figure 2a illustrates the spatiotemporal distribution of heatwaves across China from 2000 to 2019 using a normalized HHI, where one represents a maximum hazard and zero indicates a minimal. To distinguish between the severity of low HHI and the occurrence of heatwaves, areas where no heatwave events occurred within the study region were masked. High-hazard areas are concentrated in eastern and northwestern China (e.g., NC, SE, and western NW), with the southeastern TP showing the highest HHI. Line graphs along longitudinal and latitudinal axes show variability in average HHI, highlighting fluctuations along specific geographic corridors. Figure 2b compares HHI across regions, identifying SE and NC as most affected with higher proportions of heatwave events. SE exhibits both frequent and intense heatwaves, while TP experiences fewer occurrences but significant intensity when heatwaves do occur.
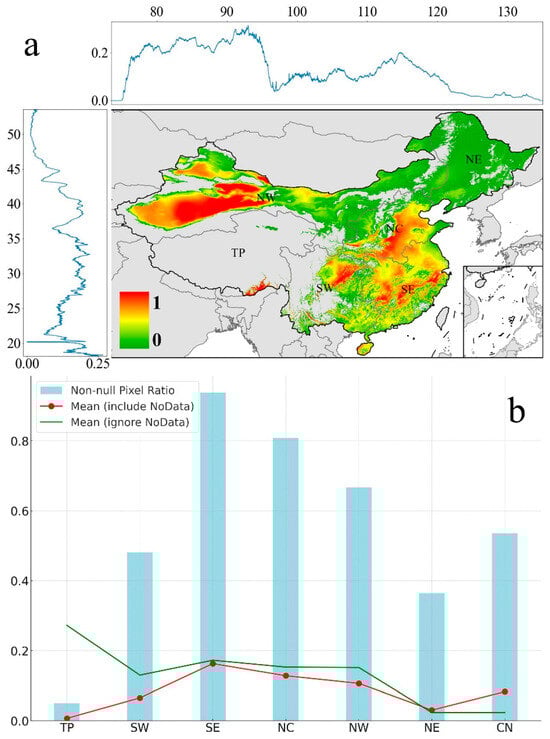
Figure 2.
Average HHI (areas where no heatwave occurred were masked) (a), Zonal HHI, and Non-null pixel ratio (b).
Figure 3 illustrates the spatial patterns of socioeconomic factors and their heatwave exposures from 2000 to 2019. GDP distribution (Figure 3a) shows intense concentration in SE, highlighting it as a major economic hub. Population distribution (Figure 3b) mirrors GDP patterns, indicating demographic hotspots in financial centers. Figure 3c,d quantify GDP and population exposure, respectively, with high values in southeastern China like southern and northeastern SE, NC, and northeastern SW, indicating significant socioeconomic vulnerability. Within these areas, GDP exposure demonstrates a more pronounced spatial clustering effect compared to population exposure, exhibiting a trend of diminishing intensity radiating outward from multiple hotspot regions. Although population exposure also features several hotspots, the disparities between these hotspots and surrounding areas are less distinct, highlighting different patterns in the impacts of heatwave hazards on GDP and population. In contrast, in the NE, NW, and TP regions, high-intensity heatwaves do occur in certain parts of the NW and TP; however, these events are typically situated in areas with limited human activity, thereby reducing the exposure in these regions. Moreover, the NE is among the regions in China with lower heatwave hazard, which correspondingly results in lower levels of heatwave exposure.
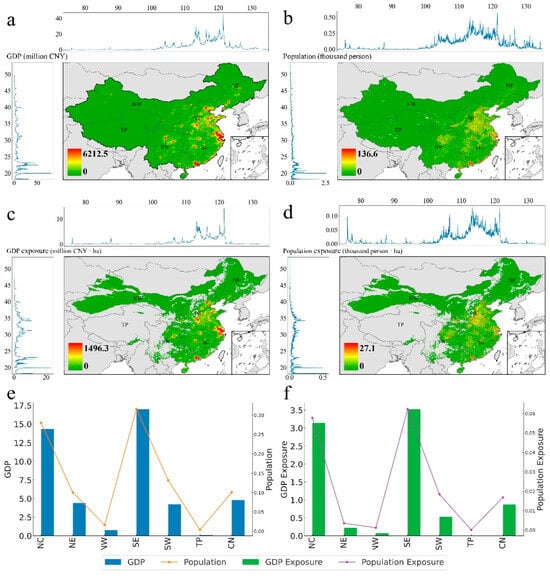
Figure 3.
Spatial distribution of Gross Domestic Product (GDP) (million CNY) (a), population (thousand person) (b), GDP exposure (million CNY·ha) (c), population exposure (thousand person·ha) (d), zonal mean value of GDP and population (e), and zonal mean value of GDP exposure and population exposure (f).
Figure 3e,f depicts regional disparities: SE emerges as a dominant economic powerhouse with dense population, while TP has minimal economic output and lower population density. Despite economic strength, SE and NC face high GDP exposure, suggesting vulnerability to environmental and economic challenges. Despite larger population and GDP, NE shows comparatively lower exposure, likely due to its higher latitude and reduced heatwave risk.
3.2. Observed Increasing Trends of Heatwave Exposures
Regression analysis examined temporal variations in heatwave exposures and driving factors, using year as the independent variable and annual averages of exposure as the dependent variable (Figure 4). Narrow confidence intervals in the figures indicate reliable trend estimates.
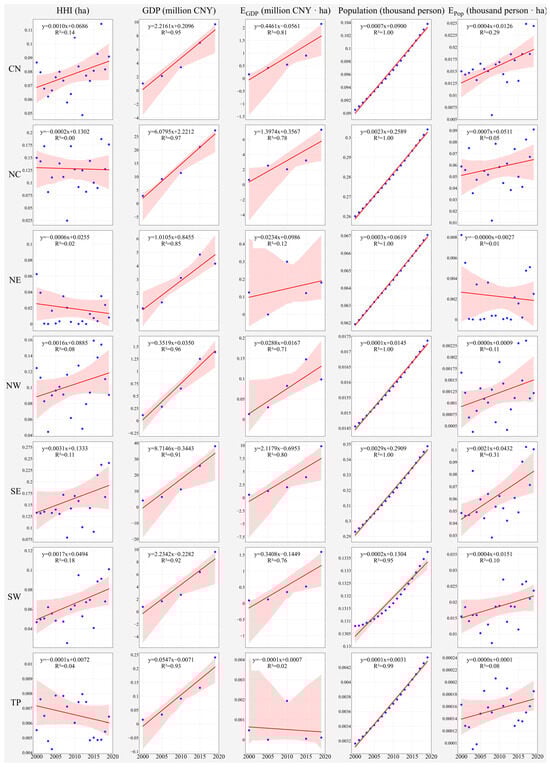
Figure 4.
Temporal variations in annual average HHI (ha), GDP (million CNY), EGDP (million CNY·ha), Population (thousand person), EPop (thousand person·ha) for different regions. EGDP and EPop represent heatwave exposure of GDP and Population. Observed data are depicted as dots, the fitted model is represented by a line, and the confidence interval is illustrated by the shadows.
Nationally, all variables showed increasing trends over the study period. Regionally, disparities in heatwave-related exposures were pronounced. GDP and population trends uniformly rose across all regions, notably in SE, NC, and SW, reflecting robust social development and increased vulnerability to heatwaves. SE, NW, and SW regions also saw rises in HHI, EGDP, and EPop, highlighting the need for enhanced heatwave mitigation strategies. In contrast, TP showed relative stability in heatwave hazard and exposure, likely due to different climatic conditions.
Figure 5 integrates economic, demographic, and climatic trends across China, focusing on heatwave exposure. In Figure 5a, GDP growth slopes show robust growth in NC, SE, and northeast SW regions, contrasting with economic decline or stagnation in TP. Figure 5b highlights discrete population growth nodes in urban and urbanizing areas, accompanied by reduced population density in surrounding regions, reflecting accelerated urbanization impacts.
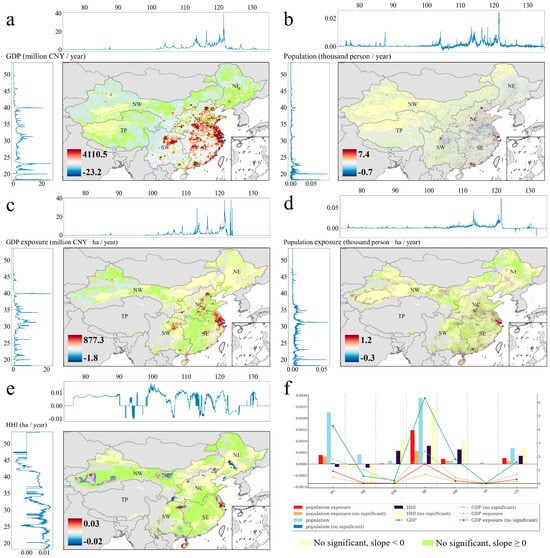
Figure 5.
Slope and significance of Gross Domestic Product (GDP) (million CNY/year) (a), population (thousand person/year) (b), GDP exposure (million CNY·ha/year) (c), population exposure (thousand person·ha/year) (d), HHI (ha/year) (e), and zonal mean value of indices (f).
Figure 5c shows GDP exposure in a million CNY per grid per year, concentrated in three main regions: eastern coastal areas around Shanghai, NC, and northeastern SW (including Chengdu and Chongqing). The Pearl River Delta in southern China has a moderate increase in GDP exposure, while NE shows stable or decreasing trends, possibly due to economic adaptation or lower vulnerability. Figure 5d illustrates population exposure in thousands of persons per grid per year. Driven by urbanization, multi-point concentrated growth is observed in eastern, central, and southern China, with significant increases noted in southern Xinjiang, reflecting both social development and heightened environmental vulnerability in desert regions.
Figure 5e shows a nationwide increase in HHI across China (excluding TP), particularly in eastern, southern, and southwestern regions, growing annually by 0.02 ha. Conversely, northern, northeastern, and northwestern China exhibit decreased HHI, indicating varied heatwave hazards. Lower latitudes generally have higher HHI growth rates. Figure 5f compares variables nationally and regionally. Despite national HHI growth, NC and NE show negative HHI growth. This underscores while some areas show reduced heatwave hazards, social activities sensitive to high temperatures may still face significant risks.
3.3. Contribution Rates of Climate and Socioeconomic Factors to the Exposure
We analyzed changes for different Phase I and Phase II combinations (11 groups in total) separately. We displayed in Figure 6, where we found that from Phase I to Phase II, the magnitude of change in the mean values of different former and latter years is smaller than that of the 2000–2019 period for almost all variables and regions, but in terms of change in the mean values, it can be seen that over different time periods, the regions of heatwave socioeconomic exposure and its impact factor all change positively over time. The maximum values of the changes of all variables occur in the SE region for 2015–2019 (Figure 6a) and 2000–2019 (Figure 6b–e). It is worth mentioning that the SE region, as one of the most economically active regions in China, is highly exposed to the heatwave hazard [46,47,48]. The increase in exposure in SE amounted to at least 8 million CNY·ha, and at least 40 person·ha each grid, respectively.
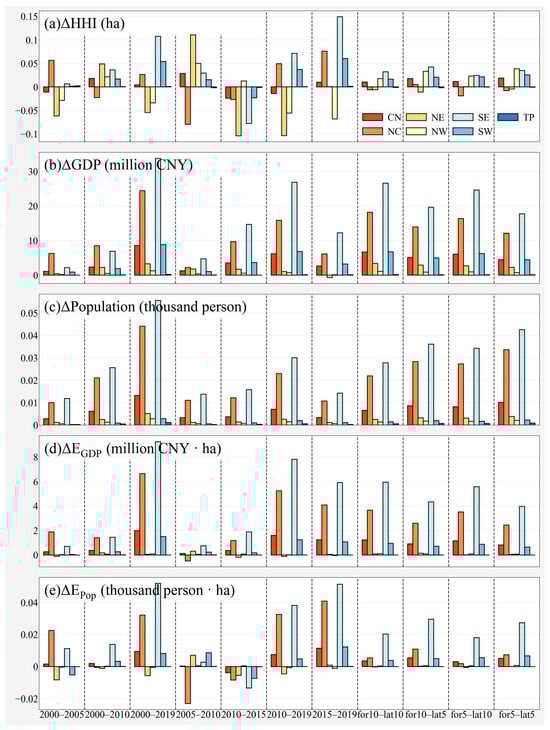
Figure 6.
Changes in HHI (a), GDP (b), Population (c), EGDP (d), EPop (e) from Phase I (time before “–”) to Phase II (time after “–”) during the observed period. Different color means different regions.
Except for the SE region, the socioeconomic exposures of NC, despite experiencing a 2005–2010 decline, showed a strong increasing trend in all other periods, and the opposite was true for NE, where population exposure increased from 2005–2010, but maintained a decline in all other periods, leading to a decline throughout the observation period. In contrast, in the context of minimal population growth (less than 10 people per grid), SW witnessed substantial economic expansion, evidenced by a GDP increase of 10 million CNY. This growth occurred alongside the second-largest variation in HHI, indicating an escalation in socioeconomic exposure. Consequently, apart from SE and NC, the SW area is also increasingly susceptible to heatwave threats. This vulnerability is exacerbated by the region’s ongoing socioeconomic development, which, in turn, impedes progress in both population and economic domains due to escalating heatwave impacts.
In this study, we systematically analyzed climate and socioeconomic contributions to heatwave exposure from 2000 to 2019. Figure 7 presents box plots illustrating variations in contribution rates for GDP exposure (Figure 7a) and population exposure (Figure 7b). Each panel depicts different subsets of factors: climate (Figure 7(a1,b1)), socioeconomic (Figure 7(a2,b2)), and their combined effect (Figure 7(a3,b3)).
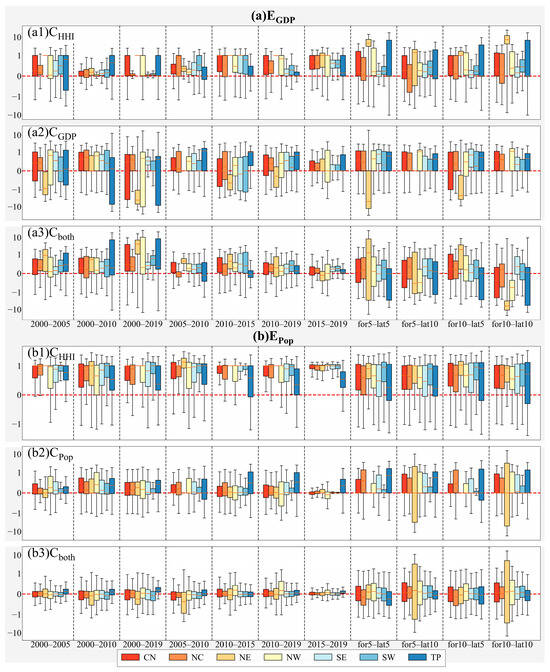
Figure 7.
Contribution rates of climate (a1,b1) and socioeconomic factors (a2,b2) and their interactions (a3,b3) to GDP exposure (a) and population exposure (b).
Climate factor alone (Figure 7(a1)) shows moderate contribution rates with variability across periods for GDP exposure. The influence of GDP alone (Figure 7(a2)) exhibits significant variability, particularly in regions like NE and TP. When considering both climate and GDP factors (Figure 7(a3)), NE and SW show higher median contributions, suggesting a combined impact of climate and economic factors in these regions. Turning to population exposure, the climate factor (Figure 7(b1)) shows minimal median deviation but notable regional variations. The population factor (Figure 7(b2)) highlights increased sensitivity in NC, SE, and NE over the period 2000–2019. The combined effect of climate and population factors (Figure 7(b3)) indicates moderated variability, particularly in NW and SW. Overall, climate factor dominates changes in population exposure (56–70%), followed by population factors alone, with their combined contribution being the lowest from 2000 to 2019 (Figure 7b).
3.4. Ranking Heatwave Socioeconomic Exposure Levels of China
We assessed APE and AGE values at city and county levels, noting their slopes and significance, and the top 10 units with the fastest increase in each table are presented in bold. Shanghai and Beijing led in APE and AGE, respectively (Table A1 and Table A2). Pudong New District in Shanghai showed the highest APE and AGE, indicating significant regional development (Table A3 and Table A4).
The top 10 fastest-growing units consistently ranked among the top 100 in average values across Table A1, Table A2, Table A3 and Table A4, suggesting rapid growth in areas with higher heatwave socioeconomic exposure. Significant units are marked with “*” and “**” for p < 0.05 and p < 0.01, with 70%, 40%, 90%, and 50% showing significant increases in cities and counties for APE and AGE respectively (Table A1, Table A2, Table A3 and Table A4). Notably, highly significant increases accounted for 57% and 67% of significant increases in city and county APE levels (Table A1 and Table A3).
Top first-tier, new first-tier, and second-tier cities by APE include Shanghai, Beijing, Chongqing, Guangzhou, Wuhan, Zhengzhou, Hangzhou, Xi’an, Suzhou, and Tianjin (Table 1). The leading cities for AGE are Shanghai, Beijing, Guangzhou, Shenzhen, Zhengzhou, Wuhan, Suzhou, Foshan, Dongguan, and Hangzhou (Table 2). There is notable overlap with 7 cities appearing in the top 10 for both indicators, expanding to 13 in the top 15 and 17 in the top 20, emphasizing the strong correlation between high population density and economic activity. Among provincial capitals, Shanghai, Beijing, Chongqing, Guangzhou, Wuhan, Zhengzhou, Hangzhou, Xi’an, Tianjin, and Nanjing.

Table 1.
APE ranking of first-tier, new first-tier, and second-tier cities.
Table 2.
AGE ranking of first-tier, new first-tier, and second-tier cities.
4. Discussion
Our study on heatwave exposure in China aligns with global and regional findings [22,49]. Regions like NE and SW show higher exposure due to combined climate and GDP factors, which could be correlated with the economic structure or the concentration of wealth in these areas [50]. Temporally, population exposure rates are declining, emphasizing climatic influences [19,51]. In fact, their coarse resolution (more than 10 km) is not enough to describe the exposure in the build-up regions. By contrast, the present study improves the data to 0.01°, which helps to reflect the finer spatial difference.
In other ways, we differ somewhat from previous studies. Our approach introduced HHI, integrating absolute and relative thresholds to comprehensively define heatwaves. Unlike traditional methods, which rely on heatwave days alone [49,52], HHI considers intensity, frequency, and duration, offering a nuanced portrayal of heatwave characteristics. This methodological advancement is crucial for accurately assessing heatwave impacts on human health and infrastructure resilience.
On a national scale, eastern China faced the highest and rapidly increasing heatwave risks attributed to climate and socioeconomic factors [22], particularly in socioeconomically active regions like SE. The concentration of both economic and human resources in the SE necessitates targeted heatwave preparedness strategies to safeguard against the detrimental impacts of such events [16,40,53]. For example, local governments in the region should pay attention to the construction of places for outdoor workers to avoid the heat in urban planning, and establish appropriate early warning mechanisms for high temperatures, as well as matching work systems and regulations, etc. Individuals should also pay attention to the temperature situation and take effective measures to prevent heatstroke. This regional discrepancy suggests underlying demographic shifts, possibly migration from less urbanized to more urbanized areas. TP shows widespread population growth, likely driven by economic activities or natural increases. Conversely, NE exhibits all statistical measures entrenched in negative values, indicating significant population outflow from this region [54].
Regarding GDP exposure relative to population exposure, NE and NW show no significant changes over time, likely due to stable economic and demographic development [55,56]. TP, characterized by limited low-altitude areas in the southwest, experiences minimal changes in heatwave exposure but faces increasing risks due to global warming trends, threatening environmental stability [57,58,59].
GDP exerts a significant influence on exposure but is moderated by climate factors. In China, climate and combined climate–population factors positively contribute to heatwave exposure, while GDP shows a negative impact (Figure 7a). This suggests that increasing GDP correlates with reduced heatwave exposure, potentially linked to China’s recent efforts towards carbon neutrality [60,61]. The detailed analysis underscores the complex interactions shaping heatwave exposure. The interplay between climate conditions and socioeconomic factors like GDP and population highlights the multifaceted nature of heatwave risks. Different regions show varying susceptibilities to economic and demographic changes, influenced by climate variability [62,63]. This complexity emphasizes the need for tailored strategies that address the diverse dimensions of heatwave risks through effective mitigation and adaptation measures.
There are several study limitations to consider. Introducing the HHI provides a holistic view but raises questions about the optimal method for capturing the diverse nature of heatwaves. Moreover, the presence of null values in calculations introduces ambiguity due to varied computational methods. Excluding regions without recorded heatwave events from the statistical analysis could lead to underestimation or overestimation of regional data compared to other studies, necessitating refined approaches for constructing the Heatwave Hazard Index. Meanwhile, resampling socioeconomic data from 1 km to 0.01° at different latitudes may introduce some loss of precision, which may impose some limitations on the accuracy of the results, and better up-scaling methods should be considered in future relevant studies.
Vulnerable populations, including those with cardiovascular and respiratory conditions, and older adults, face heightened heatwave risks [8,64,65], significantly surpassing global averages [66]. Nighttime heatwave studies are gaining attention [67,68,69]. Global climate change and urbanization compound these risks, with the urban heat island effect amplifying heatwave impacts globally [70,71,72]. Compounded climate extremes such as droughts, floods, and heatwaves pose challenges to agricultural productivity and socio-environmental sustainability [73,74]. Future research should prioritize studying these vulnerable populations and compounded factors.
Overall, the results suggest that the population and GDP of the study region are highly vulnerable to heatwave hazards. As an engine of China’s economic and social development, SE, NC, and SW are facing an increasing threat of heatwaves. Although NE and NW have less change in heatwave exposure under the influence of economic development and population mobility, attention should be paid to the threat of heatwaves in their urbanization process. Based on our results, future research should pay particular attention to the increasing heat island effect due to poor urban planning, as well as to the compound heatwave hazard and the vulnerable population and economic development in these areas. In addition, the combined effects of socioeconomic and climatic factors on heatwave exposure are becoming greater, which highlights the need for sustainable urban development planning, greenhouse gas mitigation, and appropriate measures to minimize human and economic exposure to heatwaves in the Chinese development process.
5. Conclusions
The adoption of HWI and HHI in this study provides a nuanced characterization of heatwaves, with GDP and population as critical socioeconomic factors. This underscores the role of climate and socioeconomic factors in shaping heatwave exposure in China. The main conclusions can be summarized as follows:
(a) Significant spatial heterogeneity exists in socioeconomic exposure across China. Eastern regions, particularly SE, NC, and NE SW, exhibit the highest and fastest-growing heatwave exposure due to vigorous economic activity. Temporally, there is an overall increasing trend in heatwave socioeconomic exposure from 2000 to 2019, with SE, NC, and SW showing the most rapid growth in exposure. Population exposure growth shows a multi-point clustered distribution, contrasting with the concentrated distribution of GDP exposure growth.
(b) Factors contribute differently to changes in GDP and population exposure. Nationally, GDP, climate factors, and their combination are primary drivers of economic exposure. Regionally, combinations dominate in NE and SW. For population exposure, climate factors exert the most influence, followed by population factors alone, with combinations having the least impact. NE and TP show higher contributions from population and combinations.
(c) The top 10 provincial capitals with the highest heatwave socioeconomic exposure include Shanghai, Beijing, Chongqing, Guangzhou, Wuhan, Zhengzhou, Hangzhou, Xi’an, Tianjin, and Nanjing.
There is an urgent need for preventive strategies to reduce greenhouse gas emissions and to implement sustainable urban demographic and social development planning in the above regions, especially hotspots in order to minimize socioeconomic hazards under climate change in the face of heatwave exposure.
Author Contributions
Conceptualization, W.W.; Data curation, W.W. and H.L.; Formal analysis, Q.L. and H.L.; Funding acquisition, Q.L. and W.C.; Investigation, W.W.; Methodology, W.W.; Project administration, Q.L.; Resources, Q.L. and C.H.; Software, W.W.; Supervision, Q.L.; Validation, W.W. and H.L.; Visualization, W.W.; Writing—original draft, W.W.; Writing—review & editing, Q.L., H.L. and C.H. All authors have read and agreed to the published version of the manuscript.
Funding
This research was funded by the Innovation Project of LREIS (Project no. KPI008), the Strategic Priority Research Program of the Chinese Academy of Sciences (Category B, Geographic Intelligence, no. XDB0740300), and the Strategic Priority Research Program of the Chinese Academy of Sciences (Project No. XDA20030302).
Institutional Review Board Statement
Not applicable.
Informed Consent Statement
Not applicable.
Data Availability Statement
The data presented in this study are available on request from the corresponding author. The data are not publicly available due to privacy.
Acknowledgments
Thanks are due to Xin Dai and Xilin Wu for valuable discussion.
Conflicts of Interest
The authors declare that they have no known competing financial interests or personal relationships that could have appeared to influence the work reported in this paper.
Appendix A
Table A1.
APE ranking of cities (thousand person·ha).
Table A1.
APE ranking of cities (thousand person·ha).
| Index | City | Mean | Slope | Index | City | Mean | Slope |
|---|---|---|---|---|---|---|---|
| 1 | ** Shanghai, | 2258.088 | 224.623 | 51 | Zhenjiang, Jiangsu | 199.119 | 7.371 |
| 2 | Beijing, | 2051.135 | 62.409 | 52 | Zhuzhou, Hunan | 196.232 | 3.007 |
| 3 | Chongqing, | 1979.879 | 49.056 | 53 | * Huizhou, Guangdong | 193.569 | 11.382 |
| 4 | * Guangzhou, Guangdong | 1332.409 | 79.198 | 54 | Xuchang, Henan | 188.428 | 2.143 |
| 5 | * Wuhan, Hubei | 1242.755 | 50.731 | 55 | Yangzhou, Jiangsu | 188.339 | 5.754 |
| 6 | ** Zhengzhou, Henan | 1134.124 | 42.675 | 56 | * Nantong, Jiangsu | 186.246 | 13.722 |
| 7 | Hangzhou, Zhejiang | 1098.011 | 28.188 | 57 | Jiaozuo, Henan | 185.441 | 3.276 |
| 8 | * Xi’an, Shaanxi | 1029.313 | 31.811 | 58 | Shantou, Guangdong | 185.136 | 6.304 |
| 9 | ** Suzhou, Jiangsu | 997.072 | 84.431 | 59 | Xianyang, Shaanxi | 183.985 | 3.514 |
| 10 | Tianjin, Tianjin | 940.835 | 33.539 | 60 | Fuyang, Anhui | 183.766 | 1.743 |
| 11 | * Nanjing, Jiangsu | 874.412 | 36.318 | 61 | Wuhu, Anhui | 183.437 | 1.309 |
| 12 | Dongguan, Guangdong | 842.763 | 29.695 | 62 | Kaifeng, Henan | 181.754 | 3.100 |
| 13 | * Foshan, Guangdong | 795.933 | 53.404 | 63 | Baoji, Shaanxi | 179.104 | 1.336 |
| 14 | Changsha, Hunan | 776.707 | 11.842 | 64 | Yichang, Hubei | 174.637 | 2.229 |
| 15 | Shijiazhuang, Hebei | 675.982 | 4.146 | 65 | Xingtai, Hebei | 170.246 | 0.183 |
| 16 | Shenzhen, Guangdong | 661.249 | 36.922 | 66 | Zhumadian, Henan | 168.909 | 2.119 |
| 17 | Chengdu, Sichuan | 652.318 | −2.172 | 67 | Changde, Hunan | 164.962 | 3.075 |
| 18 | Ningbo, Zhejiang | 612.580 | 20.516 | 68 | Huzhou, Zhejiang | 164.597 | 6.302 |
| 19 | Jinhua, Zhejiang | 568.015 | 8.150 | 69 | Liaocheng, Shandong | 164.496 | 1.138 |
| 20 | ** Wuxi, Jiangsu | 559.915 | 40.799 | 70 | Xiangtan, Hunan | 163.202 | 2.249 |
| 21 | Hefei, Anhui | 544.250 | 10.332 | 71 | Jieyang, Guangdong | 162.451 | 4.666 |
| 22 | Nanchang, Jiangxi | 523.819 | 15.210 | 72 | Jiangmen, Guangdong | 160.791 | 7.564 |
| 23 | Fuzhou, Fujian | 522.523 | 11.506 | 73 | Taizhou, Jiangsu | 154.782 | 8.684 |
| 24 | ** Wenzhou, Zhejiang | 461.785 | 30.907 | 74 | ** Haikou, Hainan | 154.486 | 12.615 |
| 25 | Shaoxing, Zhejiang | 458.643 | 5.740 | 75 | Zhoukou, Henan | 152.966 | 2.877 |
| 26 | Jinan, Shandong | 440.830 | −0.205 | 76 | Heze, Shandong | 150.138 | 4.196 |
| 27 | Shenyang, Liaoning | 400.188 | 11.784 | 77 | Xiangyang, Hubei | 147.959 | −0.535 |
| 28 | * Changzhou, Jiangsu | 389.053 | 21.510 | 78 | Taiyuan, Shanxi | 141.580 | 4.037 |
| 29 | Luoyang, Henan | 372.312 | 3.603 | 79 | Taizhou, Zhejiang | 139.186 | 6.977 |
| 30 | Weifang, Shandong | 346.848 | 3.838 | 80 | Maanshan, Anhui | 138.658 | 0.158 |
| 31 | * Ganzhou, Jiangxi | 333.987 | 9.318 | 81 | Binzhou, Shandong | 137.481 | −0.580 |
| 32 | Nanning, Guangxi | 326.584 | 13.932 | 82 | Dongying, Shandong | 135.167 | 2.552 |
| 33 | Handan, Hebei | 325.405 | 4.199 | 83 | Cangzhou, Hebei | 134.394 | −0.963 |
| 34 | Xuzhou, Jiangsu | 323.390 | 4.864 | 84 | Suzhou, Anhui | 130.049 | 1.783 |
| 35 | Anyang, Henan | 302.602 | 4.551 | 85 | Huangshi, Hubei | 129.248 | 2.188 |
| 36 | Zibo, Shandong | 280.687 | 1.825 | 86 | Dezhou, Shandong | 129.092 | −0.341 |
| 37 | ** Jiaxing, Zhejiang | 274.750 | 17.293 | 87 | Xiaogan, Hubei | 127.077 | 1.870 |
| 38 | * Xinxiang, Henan | 266.132 | 6.177 | 88 | Jian, Jiangxi | 125.635 | 2.848 |
| 39 | Baoding, Hebei | 256.170 | −1.095 | 89 | Luohe, Henan | 123.405 | 3.197 |
| 40 | Tangshan, Hebei | 250.187 | −1.857 | 90 | Dazhou, Sichuan | 123.236 | 4.599 |
| 41 | Zhongshan, Guangdong | 248.705 | 9.682 | 91 | Shangrao, Jiangxi | 122.860 | 2.495 |
| 42 | Urumqi, Xinjiang | 247.201 | 14.201 | 92 | * Yueyang, Hunan | 122.071 | 5.167 |
| 43 | Jining, Shandong | 244.407 | 4.846 | 93 | Fuzhou, Jiangxi | 119.190 | 2.432 |
| 44 | Linyi, Shandong | 239.063 | 2.395 | 94 | * Huaian, Jiangsu | 118.684 | 7.886 |
| 45 | Nanchong, Sichuan | 233.189 | 5.817 | 95 | Bengbu, Anhui | 118.301 | −0.138 |
| 46 | Hengyang, Hunan | 233.047 | 3.372 | 96 | Linfen, Shanxi | 117.865 | 0.822 |
| 47 | Nanyang, Henan | 228.271 | 5.674 | 97 | * Huaibei, Anhui | 115.655 | 3.904 |
| 48 | Liuzhou, Guangxi | 218.712 | 4.019 | 98 | Yuncheng, Shanxi | 114.963 | 0.086 |
| 49 | Mianyang, Sichuan | 207.870 | 1.029 | 99 | Puyang, Henan | 113.076 | 2.262 |
| 50 | Pingdingshan, Henan | 206.766 | 2.098 | 100 | Langfang, Hebei | 113.019 | 0.695 |
Note: * means p < 0.05, ** means p < 0.01; the top 10 cities in terms of APE increase are given in bold; unit of Mean, Slope is thousand person·ha, thousand person·ha/year, respectively.
Table A2.
AGE ranking of cities (million CNY·ha).
Table A2.
AGE ranking of cities (million CNY·ha).
| Index | City | Mean | Slope | Index | City | Mean | Slope |
|---|---|---|---|---|---|---|---|
| 1 | * Shanghai, | 2600.355 | 318.023 | 51 | Pingdingshan, Henan | 65.610 | 5.284 |
| 2 | * Beijing, | 2267.727 | 326.328 | 52 | Dongying, Shandong | 63.966 | 1.692 |
| 3 | Guangzhou, Guangdong | 1538.518 | 222.985 | 53 | Wuhu, Anhui | 63.763 | 4.274 |
| 4 | Shenzhen, Guangdong | 912.061 | 149.387 | 54 | ** Taizhou, Jiangsu | 63.233 | 8.439 |
| 5 | Zhengzhou, Henan | 877.589 | 113.516 | 55 | Yichang, Hubei | 60.611 | 8.116 |
| 6 | Wuhan, Hubei | 842.243 | 152.994 | 56 | Zhuzhou, Hunan | 59.228 | 6.856 |
| 7 | ** Suzhou, Jiangsu | 799.626 | 87.783 | 57 | Chengdu, Sichuan | 58.307 | −1.957 |
| 8 | Foshan, Guangdong | 769.993 | 102.483 | 58 | Puyang, Henan | 57.309 | 4.838 |
| 9 | Dongguan, Guangdong | 744.187 | 100.092 | 59 | Jining, Shandong | 55.132 | 5.669 |
| 10 | * Hangzhou, Zhejiang | 732.994 | 75.359 | 60 | Huangshi, Hubei | 55.027 | 7.406 |
| 11 | Tianjin, Tianjin | 723.944 | 84.485 | 61 | ** Xianyang, Shaanxi | 54.892 | 5.803 |
| 12 | * Xi’an, Shaanxi | 637.138 | 91.901 | 62 | Hengyang, Hunan | 54.860 | 7.733 |
| 13 | Chongqing, Chongqing | 543.415 | 79.415 | 63 | Jiangmen, Guangdong | 52.898 | 5.545 |
| 14 | * Wuxi, Jiangsu | 532.493 | 64.775 | 64 | Huizhou, Guangdong | 50.489 | 6.518 |
| 15 | Nanjing, Jiangsu | 498.534 | 68.813 | 65 | * Kaifeng, Henan | 50.319 | 4.926 |
| 16 | Changsha, Hunan | 412.337 | 53.015 | 66 | Cangzhou, Hebei | 50.076 | 3.952 |
| 17 | * Ningbo, Zhejiang | 359.505 | 29.662 | 67 | Xiangtan, Hunan | 50.012 | 6.797 |
| 18 | Shijiazhuang, Hebei | 356.421 | 31.045 | 68 | ** Haikou, Hainan | 49.207 | 5.901 |
| 19 | * Changzhou, Jiangsu | 297.441 | 29.641 | 69 | Yueyang, Hunan | 49.189 | 9.026 |
| 20 | Urumqi, Xinjiang | 280.437 | 37.136 | 70 | Xingtai, Hebei | 48.591 | 3.992 |
| 21 | Jinan, Shandong | 262.957 | 29.111 | 71 | Binzhou, Shandong | 46.738 | 3.027 |
| 22 | Fuzhou, Fujian | 245.380 | 33.105 | 72 | Zhuhai, Guangdong | 44.350 | 7.642 |
| 23 | Hefei, Anhui | 241.732 | 35.281 | 73 | Huaian, Jiangsu | 43.577 | 6.293 |
| 24 | Shenyang, Liaoning | 239.438 | 31.245 | 74 | Zhangzhou, Fujian | 43.123 | 6.962 |
| 25 | Luoyang, Henan | 208.839 | 17.026 | 75 | * Langfang, Hebei | 40.253 | 4.081 |
| 26 | Zhongshan, Guangdong | 185.664 | 22.807 | 76 | * Mianyang, Sichuan | 38.693 | 5.204 |
| 27 | * Nanchang, Jiangxi | 174.530 | 20.684 | 77 | * Jieyang, Guangdong | 38.531 | 4.320 |
| 28 | Xuzhou, Jiangsu | 171.905 | 25.354 | 78 | Maanshan, Anhui | 38.300 | 1.746 |
| 29 | * Zibo, Shandong | 163.281 | 12.440 | 79 | Dezhou, Shandong | 37.969 | 4.228 |
| 30 | * Shaoxing, Zhejiang | 141.812 | 8.434 | 80 | * Panzhihua, Sichuan | 36.940 | 4.984 |
| 31 | * Xinxiang, Henan | 119.803 | 11.913 | 81 | ** Huzhou, Zhejiang | 35.341 | 3.150 |
| 32 | Yangzhou, Jiangsu | 113.172 | 8.588 | 82 | Changde, Hunan | 34.907 | 5.950 |
| 33 | * Nantong, Jiangsu | 108.497 | 16.027 | 83 | * Zhanjiang, Guangdong | 34.674 | 5.319 |
| 34 | ** Jiaxing, Zhejiang | 107.659 | 9.442 | 84 | Zhaoqing, Guangdong | 33.447 | 4.902 |
| 35 | Liuzhou, Guangxi | 106.640 | 14.660 | 85 | * Ganzhou, Jiangxi | 32.461 | 3.767 |
| 36 | Handan, Hebei | 105.442 | 3.895 | 86 | Bengbu, Anhui | 32.111 | 2.746 |
| 37 | Jinhua, Zhejiang | 103.390 | 4.904 | 87 | Guilin, Guangxi | 31.747 | 5.369 |
| 38 | Anyang, Henan | 102.969 | 9.122 | 88 | * Heze, Shandong | 31.022 | 3.525 |
| 39 | Weifang, Shandong | 102.104 | 8.727 | 89 | * Zhoukou, Henan | 30.685 | 2.644 |
| 40 | * Wenzhou, Zhejiang | 101.315 | 12.300 | 90 | Karamay, Xinjiang | 30.651 | 1.822 |
| 41 | * Baoding, Hebei | 92.912 | 5.239 | 91 | Harbin, Heilongjiang | 30.382 | −0.660 |
| 42 | Xiamen, Fujian | 88.966 | 18.304 | 92 | Lanzhou, Gansu | 30.140 | 1.650 |
| 43 | Zhenjiang, Jiangsu | 88.627 | 7.078 | 93 | Huaibei, Anhui | 29.919 | 3.564 |
| 44 | Taiyuan, Shanxi | 88.377 | 7.748 | 94 | Beihai, Guangxi | 28.589 | 5.117 |
| 45 | Tangshan, Hebei | 84.989 | 7.148 | 95 | * Taizhou, Zhejiang | 28.587 | 3.049 |
| 46 | Xuchang, Henan | 83.336 | 8.002 | 96 | Liaoyang, Liaoning | 28.545 | 3.082 |
| 47 | * Shantou, Guangdong | 81.471 | 9.875 | 97 | Liaocheng, Shandong | 28.289 | 1.881 |
| 48 | Linyi, Shandong | 76.239 | 7.904 | 98 | * Chaozhou, Guangdong | 28.127 | 3.248 |
| 49 | * Nanning, Guangxi | 75.720 | 9.455 | 99 | Panjin, Liaoning | 27.762 | 1.020 |
| 50 | Jiaozuo, Henan | 72.136 | 7.227 | 100 | Luohe, Henan | 27.447 | 1.906 |
Note: * means p < 0.05, ** means p < 0.01; the top 10 cities in terms of AGE increase are given in bold; unit of Mean, Slope is million CNY·ha, million CNY·ha/year, respectively.
Table A3.
APE ranking of counties (thousand person·ha).
Table A3.
APE ranking of counties (thousand person·ha).
| Index | County | Mean | Slope | Index | County | Mean | Slope |
|---|---|---|---|---|---|---|---|
| 1 | ** Pudong New District, Shanghai | 473.178 | 52.180 | 51 | * Liwan District, Guangzhou, Guangdong | 136.747 | 8.228 |
| 2 | Chaoyang District, Beijing | 472.633 | 15.341 | 52 | * Qiaokou District, Wuhan, Hubei | 136.134 | 6.133 |
| 3 | ** Jinshui District, Zhengzhou, Henan | 395.140 | 15.137 | 53 | ** Gusu District, Suzhou, Jiangsu | 135.984 | 11.990 |
| 4 | Haidian District, Beijing | 390.696 | 11.270 | 54 | Yanta District, Xi’an, Shaanxi | 135.255 | 3.679 |
| 5 | * Nanhai District, Foshan, Guangdong | 337.868 | 22.894 | 55 | * Zhanggong District, Ganzhou, Jiangxi | 134.542 | 4.029 |
| 6 | Fengtai District, Beijing | 283.885 | 9.020 | 56 | Wucheng District, Jinhua, Zhejiang | 133.943 | 2.781 |
| 7 | * Shunde District, Foshan, Guangdong | 270.315 | 17.302 | 57 | ** Xuhui District, Shanghai | 133.426 | 12.844 |
| 8 | ** Minhang District, Shanghai | 261.311 | 23.018 | 58 | Longgang District, Shenzhen, Guangdong | 132.493 | 7.389 |
| 9 | * Baiyun District, Guangzhou, Guangdong | 245.558 | 14.908 | 59 | Zhangdian District, Zibo, Shandong | 132.252 | 0.716 |
| 10 | Yubei District, Chongqing | 240.110 | 5.993 | 60 | Jianxi District, Luoyang, Henan | 131.552 | 1.020 |
| 11 | Wuchang District, Wuhan, Hubei | 219.999 | 8.663 | 61 | Shushan District, Hefei, Anhui | 131.126 | 3.008 |
| 12 | Hongshan District, Wuhan, Hubei | 215.713 | 8.294 | 62 | Gongshu District, Hangzhou, Zhejiang | 130.567 | 3.242 |
| 13 | Baoan District, Shenzhen, Guangdong | 211.695 | 13.163 | 63 | * Lucheng District, Wenzhou, Zhejiang | 130.271 | 6.865 |
| 14 | ** Baoshan District, Shanghai | 211.427 | 22.510 | 64 | Yaohai District, Hefei, Anhui | 129.220 | 2.100 |
| 15 | Shapingba District, Chongqing | 210.219 | 5.126 | 65 | Donghu District, Nanchang, Jiangxi | 128.363 | 3.686 |
| 16 | Yuhua District, Changsha, Hunan | 208.362 | 2.920 | 66 | Xinhua District, Shijiazhuang, Hebei | 127.687 | 0.555 |
| 17 | ** Wuzhong District, Suzhou, Jiangsu | 206.143 | 18.681 | 67 | Xixiangtang District, Nanning, Guangxi | 127.207 | 5.173 |
| 18 | * Haizhu District, Guangzhou, Guangdong | 203.525 | 12.311 | 68 | * Wujin District, Changzhou, Jiangsu | 126.553 | 7.155 |
| 19 | Jiulongpo District, Chongqing | 201.504 | 4.479 | 69 | * Jiangan District, Wuhan, Hubei | 126.353 | 5.417 |
| 20 | Xiaoshan District, Hangzhou, Zhejiang | 196.696 | 5.289 | 70 | ** Liangxi District, Wuxi, Jiangsu | 126.182 | 9.200 |
| 21 | Binhai New District, Tianjin | 188.376 | 7.920 | 71 | Yuhua District, Shijiazhuang, Hebei | 123.533 | 0.806 |
| 22 | ** Kunshan, Suzhou, Jiangsu | 187.672 | 15.037 | 72 | Qingshanhu District, Nanchang, Jiangxi | 123.425 | 3.336 |
| 23 | Yiwu City, Jinhua, Zhejiang | 187.310 | 1.927 | 73 | Xihu District, Hangzhou, Zhejiang | 122.811 | 3.191 |
| 24 | * Weiyang District, Xi’an, Shaanxi | 178.527 | 5.827 | 74 | Chang’an District, Shijiazhuang, Hebei | 122.096 | 0.778 |
| 25 | ** Putuo District, Shanghai | 173.974 | 17.796 | 75 | * Jianghan District, Wuhan, Hubei | 120.200 | 5.179 |
| 26 | ** Zhongyuan District, Zhengzhou, Henan | 173.749 | 6.259 | 76 | Keqiao District, Shaoxing, Zhejiang | 119.877 | 2.124 |
| 27 | * Beilin District, Xi’an, Shaanxi | 169.248 | 5.561 | 77 | Daxing District, Beijing | 119.503 | 4.110 |
| 28 | Yuecheng District, Shaoxing, Zhejiang | 168.409 | 2.337 | 78 | Fucheng District, Mianyang, Sichuan | 118.388 | 0.652 |
| 29 | Jiangbei District, Chongqing | 167.741 | 3.393 | 79 | Yinzhou District, Ningbo, Zhejiang | 116.801 | 3.870 |
| 30 | * Panyu District, Guangzhou, Guangdong | 165.442 | 9.997 | 80 | * Chancheng District, Foshan, Guangdong | 116.719 | 7.982 |
| 31 | * Gulou District, Nanjing, Jiangsu | 164.786 | 6.890 | 81 | Rencheng District, Jining, Shandong | 116.615 | 2.362 |
| 32 | ** Songjiang District, Shanghai | 164.546 | 13.254 | 82 | Baohu District, Hefei, Anhui | 116.047 | 2.638 |
| 33 | Qiaoxi District, Shijiazhuang, Hebei | 163.595 | 0.899 | 83 | Jinan District, Fuzhou, Fujian | 115.759 | 2.382 |
| 34 | Xicheng District, Beijing | 163.232 | 5.100 | 84 | Dongcheng District, Beijing | 113.668 | 3.763 |
| 35 | Wangcheng District, Changsha, Hunan | 163.165 | 2.750 | 85 | Gulou District, Fuzhou, Fujian | 113.403 | 1.817 |
| 36 | Jianggan District, Hangzhou, Zhejiang | 156.939 | 4.104 | 86 | * Huicheng District, Huizhou, Guangdong | 111.643 | 6.899 |
| 37 | Qinhuai District, Nanjing, Jiangsu | 155.355 | 6.140 | 87 | Banan District, Chongqing | 111.290 | 2.292 |
| 38 | Nanan District, Chongqing | 154.848 | 3.741 | 88 | Kaifu District, Changsha, Hunan | 111.164 | 1.603 |
| 39 | * Yuexiu District, Guangzhou, Guangdong | 154.348 | 9.127 | 89 | ** Changshu District, Suzhou, Jiangsu | 110.487 | 8.662 |
| 40 | Changping District, Beijing | 154.197 | 4.036 | 90 | Haishu District, Ningbo, Zhejiang | 109.749 | 3.350 |
| 41 | Yuzhong District, Chongqing | 152.904 | 3.098 | 91 | Tiexi District, Shenyang, Liaoning | 109.086 | 3.750 |
| 42 | Yuhang District, Hangzhou, Zhejiang | 150.265 | 4.457 | 92 | Shunqing District, Nanchong, Sichuan | 108.939 | 2.951 |
| 43 | * Tianhe District, Guangzhou, Guangdong | 149.996 | 8.691 | 93 | Jiangxia District, Wuhan, Hubei | 108.814 | 3.847 |
| 44 | * Lianhu District, Xi’an, Shaanxi | 149.873 | 5.137 | 94 | ** Jing’an District, Shanghai | 108.615 | 11.327 |
| 45 | * Xincheng District, Xi’an, Shaanxi | 146.671 | 4.824 | 95 | * Hanyang District, Wuhan, Hubei | 108.463 | 4.659 |
| 46 | ** Yangpu District, Shanghai | 146.356 | 15.778 | 96 | ** Jiangyin District, Wuxi, Jiangsu | 106.284 | 9.174 |
| 47 | ** Jiading District, Shanghai | 146.329 | 13.648 | 97 | Xiacheng District, Hangzhou, Zhejiang | 106.085 | 2.972 |
| 48 | Cixi City, Ningbo, Zhejiang | 145.407 | 4.256 | 98 | Cangshan District, Fuzhou, Fujian | 104.500 | 2.056 |
| 49 | ** Guanchenghuizi District, Zhengzhou, Henan | 144.373 | 5.518 | 99 | Weidu, Xuchang, Henan | 103.683 | 1.310 |
| 50 | ** Erqi District, Zhengzhou, Henan | 140.498 | 5.533 | 100 | Lianchi, Baoding, Hebei | 102.900 | −0.369 |
Note: * means p < 0.05, ** means p < 0.01; the top 10 counties in terms of APE increase are given in bold; unit of Mean, Slope is thousand person·ha, thousand person·ha/year, respectively.
Table A4.
AGE ranking of counties (million CNY·ha).
Table A4.
AGE ranking of counties (million CNY·ha).
| Index | County | Mean | Slope | Index | County | Mean | Slope |
|---|---|---|---|---|---|---|---|
| 1 | * Pudong New District, Shanghai | 718.968 | 97.487 | 51 | Yuzhong District, Chongqing | 102.228 | 19.133 |
| 2 | * Chaoyang District, Beijing | 622.394 | 91.499 | 52 | * Zhangdian District, Zibo, Shandong | 99.562 | 9.249 |
| 3 | * Haidian District, Beijing | 462.510 | 69.659 | 53 | Hongshan District, Wuhan, Hubei | 98.984 | 16.433 |
| 4 | * Xicheng District, Beijing | 392.431 | 63.145 | 54 | Liwan District, Guangzhou, Guangdong | 97.207 | 14.085 |
| 5 | * Binhai New District, Tianjin | 346.719 | 46.273 | 55 | ** Songjiang District, Shanghai | 96.976 | 7.538 |
| 6 | Tianhe District, Guangzhou, Guangdong | 339.376 | 56.338 | 56 | Wuzhong District, Suzhou, Jiangsu | 94.562 | 5.958 |
| 7 | Jinshui District, Zhengzhou, Henan | 330.147 | 48.129 | 57 | Shushan District, Hefei, Anhui | 92.099 | 14.524 |
| 8 | Nanhai District, Foshan, Guangdong | 294.239 | 36.169 | 58 | Shangcheng District, Hangzhou, Zhejiang | 87.440 | 11.876 |
| 9 | * Minhang District, Shanghai | 264.734 | 25.472 | 59 | Furong District, Changsha, Hunan | 87.145 | 13.865 |
| 10 | Shunde District, Foshan, Guangdong | 261.456 | 35.519 | 60 | * Yuhang District, Hangzhou, Zhejiang | 86.637 | 8.118 |
| 11 | * Kunshan City, Suzhou, Jiangsu | 259.578 | 29.158 | 61 | Xiacheng District, Hangzhou, Zhejiang | 84.837 | 10.776 |
| 12 | Yuexiu District, Guangzhou, Guangdong | 241.868 | 41.156 | 62 | Jiangbei District, Chongqing | 84.509 | 13.103 |
| 13 | Dongcheng District, Beijing | 232.009 | 38.057 | 63 | * Jianggan District, Hangzhou, Zhejiang | 83.884 | 7.702 |
| 14 | Jing’an District, Shanghai, China | 220.741 | 30.315 | 64 | Lixia District, Jinan, Shandong | 83.346 | 13.077 |
| 15 | * Yanta District, Xi’an, Shaanxi | 209.401 | 31.498 | 65 | Beilin District, Xi’an, Shaanxi | 82.966 | 13.883 |
| 16 | * Jiading District, Shanghai | 204.036 | 19.892 | 66 | Gulou District, Fuzhou, Fujian | 81.949 | 13.050 |
| 17 | Huangpu District, Guangzhou, Guangdong | 195.110 | 28.540 | 67 | Qiaokou District, Wuhan, Hubei | 81.603 | 15.711 |
| 18 | Guancheng Huizu District, Zhengzhou, Henan | 193.564 | 27.165 | 68 | * Huqiu District, Suzhou, Jiangsu | 81.518 | 10.943 |
| 19 | * Fengtai District, Beijing, China | 190.931 | 23.532 | 69 | Hanyang District, Wuhan, Hubei | 80.123 | 13.243 |
| 20 | Haizhu District, Guangzhou, Guangdong | 189.168 | 29.564 | 70 | Qixia District, Nanjing, Jiangsu | 79.643 | 9.148 |
| 21 | Baoshan District, Shanghai | 177.678 | 15.940 | 71 | * Yubei District, Chongqing | 76.062 | 9.527 |
| 22 | Baiyun District, Guangzhou, Guangdong | 174.711 | 18.603 | 72 | Hongkou District, Shanghai | 75.882 | 10.748 |
| 23 | Longgang District, Shenzhen, Guangdong | 174.180 | 25.870 | 73 | ** Cixi City, Ningbo, Zhejiang | 74.841 | 6.248 |
| 24 | Chancheng District, Foshan, Guangdong | 172.088 | 25.488 | 74 | Chang’an District, Shijiazhuang, Hebei | 72.902 | 5.405 |
| 25 | Nanshan District, Shenzhen, Guangdong | 172.045 | 33.033 | 75 | Dongli District, Tianjin | 71.831 | 5.262 |
| 26 | Futian District, Shenzhen, Guangdong | 168.581 | 31.446 | 76 | Yuecheng District, Shaoxing, Zhejiang | 71.339 | 3.348 |
| 27 | * Huangpu District, Shanghai | 165.727 | 26.004 | 77 | Xinhua District, Shijiazhuang, Hebei | 70.158 | 5.225 |
| 28 | Panyu District, Guangzhou, Guangdong | 164.036 | 19.444 | 78 | * Gongshu District, Hangzhou, Zhejiang | 69.477 | 6.462 |
| 29 | * Yangpu District, Shanghai | 162.899 | 23.062 | 79 | * Xihu District, Hangzhou, Zhejiang | 68.700 | 5.964 |
| 30 | * Xuhui District, Shanghai | 160.993 | 22.767 | 80 | ** Wujiang District, Suzhou, Jiangsu | 68.296 | 6.781 |
| 31 | Zhongyuan District, Zhengzhou, Henan | 151.620 | 17.461 | 81 | Nanan District, Chongqing | 68.005 | 9.946 |
| 32 | Wuchang District, Wuhan, Hubei | 146.719 | 27.018 | 82 | * Changshu City, Suzhou, Jiangsu | 67.862 | 7.083 |
| 33 | New Downtown, Urumqi, Xinjiang | 141.533 | 19.474 | 83 | Qinhuai District, Nanjing, Jiangsu | 67.843 | 11.469 |
| 34 | ** Jiangyin City, Wuxi, Jiangsu | 136.917 | 18.306 | 84 | * Lianhu District, Xi’an, Shaanxi | 67.737 | 10.376 |
| 35 | Bao’an District, Shenzhen, Guangdong | 136.839 | 18.738 | 85 | ** Yinzhou District, Ningbo, Zhejiang | 67.608 | 6.450 |
| 36 | * Weiyang District, Xi’an, Shaanxi | 133.598 | 17.374 | 86 | * Qingpu District, Shanghai | 67.512 | 5.072 |
| 37 | Jiangan District, Wuhan, Hubei | 126.465 | 24.392 | 87 | * Zhangjiagang City, Suzhou, Jiangsu | 67.297 | 9.381 |
| 38 | Jianghan District, Wuhan, Hubei | 126.376 | 24.863 | 88 | Huadu District, Guangzhou, Guangdong | 66.779 | 6.616 |
| 39 | ** Xiaoshan District, Hangzhou, Zhejiang | 123.029 | 8.703 | 89 | Kaifu District, Changsha, Hunan | 66.408 | 7.216 |
| 40 | Putuo District, Shanghai, China | 122.009 | 14.675 | 90 | ** Shunyi District, Beijing | 65.801 | 6.710 |
| 41 | * Binjiang District, Hangzhou, Zhejiang | 119.847 | 15.289 | 91 | Luohu District, Shenzhen, Guangdong | 65.140 | 11.940 |
| 42 | * Xinwu District, Wuxi, Jiangsu | 117.225 | 15.207 | 92 | * Xinbei District, Changzhou, Jiangsu | 64.892 | 6.819 |
| 43 | Changning District, Shanghai | 116.156 | 14.799 | 93 | Wangcheng District, Changsha, Hunan | 64.199 | 7.006 |
| 44 | * Liangxi District, Wuxi, Jiangsu | 110.816 | 15.538 | 94 | * Shijingshan District, Beijing | 64.130 | 8.554 |
| 45 | * Daxing District, Beijing, China | 110.582 | 13.950 | 95 | * Gusu District, Suzhou, Jiangsu | 64.094 | 8.035 |
| 46 | Gulou District, Nanjing, Jiangsu | 109.536 | 17.910 | 96 | * Cangshan District, Fuzhou, Fujian | 63.415 | 7.207 |
| 47 | Longhua District, Shenzhen, Guangdong | 108.919 | 16.890 | 97 | Jianxi District, Luoyang, Henan | 62.566 | 6.272 |
| 48 | Qiaoxi District, Shijiazhuang, Hebei | 108.873 | 11.334 | 98 | Erqi District, Zhengzhou, Henan | 62.031 | 7.122 |
| 49 | Yuhua District, Changsha, Hunan | 108.205 | 14.109 | 99 | * Shapingba District, Chongqing | 60.458 | 7.867 |
| 50 | ** Wujin District, Changzhou, Jiangsu | 105.131 | 11.475 | 100 | Gulou District, Xuzhou, Jiangsu | 59.920 | 8.413 |
Note: * means p < 0.05, ** means p < 0.01; the top 10 cities in terms of AGE increase are given in bold; unit of Mean, Slope is million CNY·ha, million CNY·ha/year, respectively.
References
- Kumar, P.; Sharma, A. Assessing the monthly heat stress risk to society using thermal comfort indices in the hot semi-arid climate of India. Mater. Today Proc. 2022, 61, 132–137. [Google Scholar] [CrossRef]
- Nandi, S.; Swain, S. Analysis of heatwave characteristics under climate change over three highly populated cities of South India: A CMIP6-based assessment. Environ. Sci. Pollut. Res. 2022, 30, 99013–99025. [Google Scholar] [CrossRef] [PubMed]
- Russo, E.; Domeisen, D. A global comparison of heatwave magnitude indices using ERA5 reanalysis data (EMS2022-176). EMS2022. Copernic. Meet. 2022, 19, 176. [Google Scholar]
- Ma, F.; Yuan, X. Impact of climate and population changes on the increasing exposure to summertime compound hot extremes. Sci. Total Environ. 2021, 772, 145004. [Google Scholar] [CrossRef]
- Thompson, V.; Kennedy-Asser, A.T.; Vosper, E.; Lo, Y.T.E.; Huntingford, C.; Andrews, O.; Collins, M.; Hegerl, G.C.; Mitchell, D. The 2021 western North America heatwave among the most extreme events ever recorded globally. Sci. Adv. 2022, 8, eabm6860. [Google Scholar] [CrossRef] [PubMed]
- Lin, H.; Mo, R.; Vitart, F. The 2021 Western North American Heatwave and Its Subseasonal Predictions. Geophys. Res. Lett. 2022, 49, e2021GL097036. [Google Scholar] [CrossRef]
- Silberner, J. Heatwave causes hundreds of deaths and hospitalisations in Pacific north west. Br. Med. J. 2021, 374, n1696. [Google Scholar] [CrossRef] [PubMed]
- Campbell, S.; Remenyi, T.A.; White, C.J.; Johnston, F.H. Heatwave and health impact research: A global review. Health Place 2018, 53, 210–218. [Google Scholar] [CrossRef]
- Ullah, S.; You, Q.; Chen, D.; Sachindra, D.A.; AghaKouchak, A.; Kang, S.; Li, M.; Zhai, P.; Ullah, W. Future Population Exposure to Daytime and Nighttime Heatwaves in South Asia. Earth’s Future 2022, 10, e2021EF002511. [Google Scholar] [CrossRef]
- Perkins-Kirkpatrick, S.E.; Gibson, P.B. Changes in regional heatwave characteristics as a function of increasing global temperature. Sci. Rep. 2017, 7, 12256. [Google Scholar] [CrossRef] [PubMed]
- Zhang, Y.; Mao, G.; Chen, C.; Lu, Z.; Luo, Z.; Zhou, W. Population exposure to concurrent daytime and nighttime heatwaves in Huai River Basin, China. Sustain. Cities Soc. 2020, 61, 102309. [Google Scholar] [CrossRef]
- Yaglou, C.P.; Minaed, D. Control of Heat Casualties at Military Training Centers. Arch. Indust. Health 1957, 16, 302–316. [Google Scholar]
- Huang, Z.; Chen, H.; Tian, H. Research on the Heatwave Index. Meteorol. Mon. 2011, 37, 345–351. [Google Scholar]
- Wang, L.; Rohli, R.V.; Lin, Q.; Jin, S.; Yan, X. Impact of Extreme Heatwaves on Population Exposure in China Due to Additional Warming. Sustainability 2022, 14, 11458. [Google Scholar] [CrossRef]
- Yin, C.; Yang, F.; Wang, J.; Ye, Y. Spatiotemporal distribution and risk assessment of heatwaves based on apparent temperature in the One Belt and One Road Region. Remote Sens. 2020, 12, 1174. [Google Scholar] [CrossRef]
- Krummenauer, L.; Costa, L.; Prahl, B.F.; Kropp, J.P. Future heat adaptation and exposure among urban populations and why a prospering economy alone won’t save us. Sci. Rep. 2021, 11, 1–14. [Google Scholar] [CrossRef]
- Mora, C.; Dousset, B.; Caldwell, I.R.; Powell, F.E.; Geronimo, R.C.; Bielecki, C.R.; Counsell, C.W.; Dietrich, B.S.; Johnston, E.T.; Louis, L.V.; et al. Global risk of deadly heat. Nat. Clim. Change 2017, 7, 501–506. [Google Scholar] [CrossRef]
- Nishant, N.; Ji, F.; Guo, Y.; Herold, N.; Green, D.; Virgilio, G.D.; Beyer, K.; Riley, M.L.; Perkins-Kirkpatrick, S. Future population exposure to Australian heatwaves. Environ. Res. Lett. 2022, 17, 064030. [Google Scholar] [CrossRef]
- Ullah, I.; Saleem, F.; Iyakaremye, V.; Yin, J.; Ma, X.; Syed, S.; Hina, S.; Asfaw, T.G.; Omer, A. Projected Changes in Socioeconomic Exposure to Heatwaves in South Asia Under Changing Climate. Earth’s Future 2022, 10, e2021EF002240. [Google Scholar] [CrossRef]
- Raei, E.; Nikoo, M.R.; AghaKouchak, A.; Mazdiyasni, O.; Sadegh, M. GHWR, a multi-method global heatwave and warm-spell record and toolbox. Sci. Data 2018, 5, 180206. [Google Scholar] [CrossRef] [PubMed]
- Moss, R.H.; Edmonds, J.A.; Hibbard, K.A.; Manning, M.R.; Rose, S.K.; van Vuuren, D.P.; Carter, T.R.; Emori, S.; Kainuma, M.; Kram, T.; et al. The next generation of scenarios for climate change research and assessment. Nature 2010, 463, 747–756. [Google Scholar] [CrossRef]
- Wu, W.; Liu, Q.; Li, H.; Huang, C. Spatiotemporal Distribution of Heatwave Hazards in the Chinese Mainland for the Period 1990–2019. Int. J. Environ. Res. Public Health 2023, 20, 1532. [Google Scholar] [CrossRef] [PubMed]
- Li, L.; Zha, Y. Population exposure to extreme heat in China: Frequency, intensity, duration and temporal trends. Sustain. Cities Soc. 2020, 60, 102282. [Google Scholar] [CrossRef]
- Sun, S.; Dai, T.-L.; Wang, Z.-Y.; Chou, J.-M.; Chao, Q.-C.; Shi, P.-J. Projected increases in population exposure of daily climate extremes in eastern China by 2050. Adv. Clim. Change Res. 2021, 12, 804–813. [Google Scholar] [CrossRef]
- Brandt, L.; Lim, K. Opening up in the 21st century: A quantitative accounting of Chinese export growth. J. Int. Econ. 2024, 150, 103895. [Google Scholar] [CrossRef]
- Sang, M.; Jiang, J.; Huang, X.; Zhu, F.; Wang, Q. Spatial and temporal changes in population distribution and population projection at county level in China. Humanit. Soc. Sci. Commun. 2024, 11, 1–15. [Google Scholar] [CrossRef]
- Duan, R.; Huang, G.; Li, Y.; Zheng, R.; Wang, G.; Xin, B.; Tian, C.; Ren, J. Ensemble Temperature and Precipitation Projection for Multi-Factorial Interactive Effects of GCMs and SSPs: Application to China. Front. Environ. Sci. 2021, 9, 742326. [Google Scholar] [CrossRef]
- Ding, T.; Qian, W. Geographical patterns and temporal variations of regional dry and wet heatwave events in China during 1960–2008. Adv. Atmos. Sci. 2011, 28, 322–337. [Google Scholar] [CrossRef]
- Liao, W.; Li, D.; Malyshev, S.; Shevliakova, E.; Zhang, H.; Liu, X. Amplified Increases of Compound Hot Extremes Over Urban Land in China. Geophys. Res. Lett. 2021, 48, e2020GL091252. [Google Scholar] [CrossRef]
- Sun, Y.; Zhang, X.; Zwiers, F.W.; Song, L.; Wan, H.; Hu, T.; Yin, H.; Ren, G. Rapid increase in the risk of extreme summer heat in Eastern China. Nat. Clim. Change 2014, 4, 1082–1085. [Google Scholar] [CrossRef]
- Wang, J.X.L.; Gaffen, D.J. Trends in Extremes of Surface Humidity, Temperature, and Summertime Heat Stress in China. Adv. Atmos. Sci. 2001, 18, 742–751. [Google Scholar] [CrossRef]
- Bibi, S.; Wang, L.; Li, X.; Zhou, J.; Chen, D.; Yao, T. Climatic and associated cryospheric, biospheric, and hydrological changes on the Tibetan Plateau: A review. Int. J. Climatol. 2018, 38, e1–e17. [Google Scholar] [CrossRef]
- Fan, Z.-X.; Bräuning, A.; Thomas, A.; Li, J.-B.; Cao, K.-F. Spatial and temporal temperature trends on the Yunnan Plateau (Southwest China) during 1961–2004. Int. J. Climatol. 2011, 31, 2078–2090. [Google Scholar] [CrossRef]
- Wang, Q.; Zhai, P.-M.; Qin, D.-H. New perspectives on ‘warming–wetting’ trend in Xinjiang, China. Adv. Clim. Change Res. 2020, 11, 252–260. [Google Scholar] [CrossRef]
- Zhang, J.; Yang, Z.; Wu, L.; Yang, K. Summer high temperature extremes over Northeastern China predicted by spring soil moisture. Sci. Rep. 2019, 9, 12577. [Google Scholar] [CrossRef] [PubMed]
- Liu, X.; Tang, Q.; Zhang, X.; Sun, S. Projected Changes in Extreme High Temperature and Heat Stress in China. J. Meteorol. Res. 2018, 32, 351–366. [Google Scholar] [CrossRef]
- Luo, M.; Lau, N.-C. Characteristics of summer heat stress in China during 1979–2014: Climatology and long-term trends. Clim. Dyn. 2019, 53, 5375–5388. [Google Scholar] [CrossRef]
- Russo, S.; Sillmann, J.; Sippel, S.; Barcikowska, M.J.; Ghisetti, C.; Smid, M.; O’Neill, B. Half a degree and rapid socioeconomic development matter for heatwave risk. Nat. Commun. 2019, 10, 136. [Google Scholar] [CrossRef] [PubMed]
- Yang, X.; Tian, Z.; Sun, L.; Chen, B.; Tubiello, F.N.; Xu, Y. The impacts of increased heat stress events on wheat yield under climate change in China. Clim. Change 2017, 140, 605–620. [Google Scholar] [CrossRef]
- Feng, Y.; Sun, F.; Liu, W.; Chen, J.; Wang, H.; Guo, Q.; Wang, Y.; Zhang, Q.; Sang, Y.-F. Changes in compound hot and dry day and population exposure across China under climate change. Int. J. Climatol. 2022, 42, 2935–2949. [Google Scholar] [CrossRef]
- Stevens, F.R.; Gaughan, A.E.; Nieves, J.J.; King, A.; Sorichetta, A.; Linard, C.; Tatem, A.J. Comparisons of two global built area land cover datasets in methods to disaggregate human population in eleven countries from the global South. Int. J. Digit. Earth 2020, 13, 78–100. [Google Scholar] [CrossRef]
- Yi, L.; Xiong, L.; Yang, X. Method of Pixelizing GDP Data Based on the GIS. J. Gansu Sci. 2006, 2, 54–58. [Google Scholar]
- The Rising Lab. Index Model of Cities’ Business Attractiveness in China; The Rising Lab.: Southbank, VIC, Australia, 2021. [Google Scholar]
- He, C.; Liu, Z.; Xu, M.; Lu, W. Dataset of urban built-up area in China (1992–2020) V1.0. In A Big Earth Data Platform for Three Poles; Dataset; A Big Earth Data Platform for Three Poles: Lanzhou, China, 2022. [Google Scholar]
- Chen, Y.; Guo, F.; Wang, J.; Cai, W.; Wang, C.; Wang, K. Provincial and gridded population projection for China under shared socioeconomic pathways from 2010 to 2100. Sci. Data 2020, 7, 83. [Google Scholar] [CrossRef] [PubMed]
- Peng, W.; Zhang, W.; Liu, J.; He, P.; Wang, J.; Huang, L.; Zhang, B. Analysis and intervention of heatwave related economic loss: Comprehensive insights from supply, demand, and public expenditure into the relationship between the influencing factors. J. Environ. Manag. 2023, 326, 116654. [Google Scholar]
- Sun, X.; Ge, F.; Fan, Y.; Zhu, S.; Chen, Q. Will population exposure to heat extremes intensify over Southeast Asia in a warmer world? Environ. Res. Lett. 2022, 17, 044006. [Google Scholar] [CrossRef]
- Xia, Y.; Li, Y.; Guan, D.; Tinoco, D.M.; Xia, J.; Yan, Z.; Yang, J.; Liu, Q.; Huo, H. Assessment of the economic impacts of heatwaves: A case study of Nanjing, China. J. Clean. Prod. 2018, 171, 811–819. [Google Scholar] [CrossRef]
- Chen, H.; Sun, J. Increased population exposure to precipitation extremes in China under global warming scenarios. Atmos. Ocean. Sci. Lett. 2020, 13, 63–70. [Google Scholar] [CrossRef]
- Luo, K.; Li, G.; Fang, C.; Sun, S. PM2.5 mitigation in China: Socioeconomic determinants of concentrations and differential control policies. J. Environ. Manag. 2018, 213, 47–55. [Google Scholar] [CrossRef] [PubMed]
- Chen, J.; Liu, Y.; Pan, T.; Ciais, P.; Ma, T.; Liu, Y.; Yamazaki, D.; Ge, Q.; Peñuelas, J. Global socioeconomic exposure of heat extremes under climate change. J. Clean. Prod. 2020, 277, 123275. [Google Scholar] [CrossRef]
- Yin, C.; Yang, Y.; Chen, X.; Yue, X.; Liu, Y.; Xin, Y. Changes in global heatwaves and its socioeconomic exposure in a warmer future. Clim. Risk Manag. 2022, 38, 100459. [Google Scholar] [CrossRef]
- Xie, W.; Zhou, B.; Han, Z.; Xu, Y. Substantial increase in daytime-nighttime compound heatwaves and associated population exposure in China projected by the CMIP6 multimodel ensemble. Environ. Res. Lett. 2022, 17, 045007. [Google Scholar] [CrossRef]
- You, H.; Yang, J.; Xue, B.; Xiao, X.; Xia, J.; Jin, C.; Li, X. Spatial evolution of population change in Northeast China during 1992–2018. Sci. Total Environ. 2021, 776, 146023. [Google Scholar] [CrossRef]
- Yang, J.; Zhou, M.; Ren, Z.; Li, M.; Wang, B.; Liu, D.L.; Ou, C.-Q.; Yin, P.; Sun, J.; Tong, S.; et al. Projecting heat-related excess mortality under climate change scenarios in China. Nat. Commun. 2021, 12, 1039. [Google Scholar] [CrossRef] [PubMed]
- Zhao, Y.; Sultan, B.; Vautard, R.; Braconnot, P.; Wang, H.J.; Ducharne, A. Potential escalation of heat-related working costs with climate and socioeconomic changes in China. Proc. Natl. Acad. Sci. USA 2016, 113, 4640–4645. [Google Scholar] [CrossRef] [PubMed]
- Gao, J.; Liu, L.; Wu, S. Hazards of extreme events in China under different global warming targets. Big Earth Data 2020, 4, 153–174. [Google Scholar] [CrossRef]
- Wu, D.; Hu, Z. Increasing compound drought and hot event over the Tibetan Plateau and its effects on soil water. Ecol. Indic. 2023, 153, 110413. [Google Scholar] [CrossRef]
- You, Q.; Wu, F.; Shen, L.; Pepin, N.; Jiang, Z.; Kang, S. Tibetan Plateau amplification of climate extremes under global warming of 1.5 °C, 2 °C and 3 °C. Glob. Planet. Change 2020, 192, 103261. [Google Scholar] [CrossRef]
- Gao, C.; Ge, H.; Lu, Y.; Wang, W.; Zhang, Y. Decoupling of provincial energy-related CO2 emissions from economic growth in China and its convergence from 1995 to 2017. J. Clean. Prod. 2021, 297, 126627. [Google Scholar] [CrossRef]
- Wu, Y.; Tam, V.; Shuai, C.; Shen, L.; Zhang, Y.; Liao, S. Decoupling China’s economic growth from carbon emissions: Empirical studies from 30 Chinese provinces (2001–2015). Sci. Total Environ. 2019, 656, 576–588. [Google Scholar] [CrossRef] [PubMed]
- Naumann, G.; Cammalleri, C.; Mentaschi, L.; Feyen, L. Increased economic drought impacts in Europe with anthropogenic warming. Nat. Clim. Change 2021, 11, 485–491. [Google Scholar] [CrossRef]
- Wang, A.; Tao, H.; Wu, Q.; Huang, J.; Zhang, B.; Wang, Y. Increasing urban and rural population exposures to warm-season concurrent hot days and nights on the North China Plain. Int. J. Climatol. 2022, 42, 7938–7950. [Google Scholar] [CrossRef]
- Gasparrini, A.; Guo, Y.; Hashizume, M.; Lavigne, E.; Zanobetti, A.; Schwartz, J.; Tobias, A.; Tong, S.; Rocklöv, J.; Forsberg, B.; et al. Mortality risk attributable to high and low ambient temperature: A multicountry observational study. The Lancet 2015, 386, 369–375. [Google Scholar] [CrossRef] [PubMed]
- Li, M.; Gu, S.; Bi, P.; Yang, J.; Liu, Q. Heatwaves and Morbidity: Current Knowledge and Further Direction-A Comprehensive Literature Review. Int. J. Environ. Res. Public Health 2015, 12, 5256–5283. [Google Scholar] [CrossRef] [PubMed]
- Chambers, J. Global and cross-country analysis of exposure of vulnerable populations to heatwaves from 1980 to 2018. Clim. Change 2020, 163, 539–558. [Google Scholar] [CrossRef]
- Fischer, E.M.; Schär, C. Consistent geographical patterns of changes in high-impact European heatwaves. Nat. Geosci. 2010, 3, 398–403. [Google Scholar] [CrossRef]
- Lin, L.; Ge, E.; Liu, X.; Liao, W.; Luo, M. Urbanization effects on heatwaves in Fujian Province, Southeast China. Atmos. Res. 2018, 210, 123–132. [Google Scholar] [CrossRef]
- Trigo, R.M.; García-Herrera, R.; Díaz, J.; Trigo, I.F.; Valente, M.A. How exceptional was the early August 2003 heatwave in France? Geophys. Res. Lett. 2005, 32, L10701. [Google Scholar] [CrossRef]
- Wang, Y.; Zhao, N.; Wu, C.; Quan, J.; Chen, M. Future population exposure to heatwaves in 83 global megacities. Sci. Total Environ. 2023, 888, 164142. [Google Scholar] [CrossRef] [PubMed]
- Wang, Y.; Zhao, N.; Yin, X.; Wu, C.; Chen, M.; Jiao, Y.; Yue, T. Global future population exposure to heatwaves. Environ. Int. 2023, 178, 108049. [Google Scholar] [CrossRef] [PubMed]
- Yang, Y.; Zhao, N.; Wang, Y.; Chen, M. Variations in summertime compound heat extremes and their connections to urbanization in China during 1980–2020. Environ. Res. Lett. 2022, 17, 064024. [Google Scholar] [CrossRef]
- Wang, A.; Tao, H.; Ding, G.; Zhang, B.; Huang, J.; Wu, Q. Global cropland exposure to extreme compound drought heatwave events under future climate change. Weather. Clim. Extrem. 2023, 40, 100559. [Google Scholar] [CrossRef]
- Wang, J.; Chen, Y.; Tett, S.F.B.; Stone, D.; Nie, J.; Feng, J.; Yan, Z.; Zhai, P.; Ge, Q. Storyline attribution of human influence on a record-breaking spatially compounding flood-heat event. Sci. Adv. 2023, 9, eadi2714. [Google Scholar] [CrossRef] [PubMed]
Disclaimer/Publisher’s Note: The statements, opinions and data contained in all publications are solely those of the individual author(s) and contributor(s) and not of MDPI and/or the editor(s). MDPI and/or the editor(s) disclaim responsibility for any injury to people or property resulting from any ideas, methods, instructions or products referred to in the content. |
© 2024 by the authors. Licensee MDPI, Basel, Switzerland. This article is an open access article distributed under the terms and conditions of the Creative Commons Attribution (CC BY) license (https://creativecommons.org/licenses/by/4.0/).