
The Impact of Fireworks on Selected Ambient Particulate Metal Concentrations Associated with the Independence Day Holiday

 , ,
, ,
Abstract
1. Introduction
2. Materials and Methods
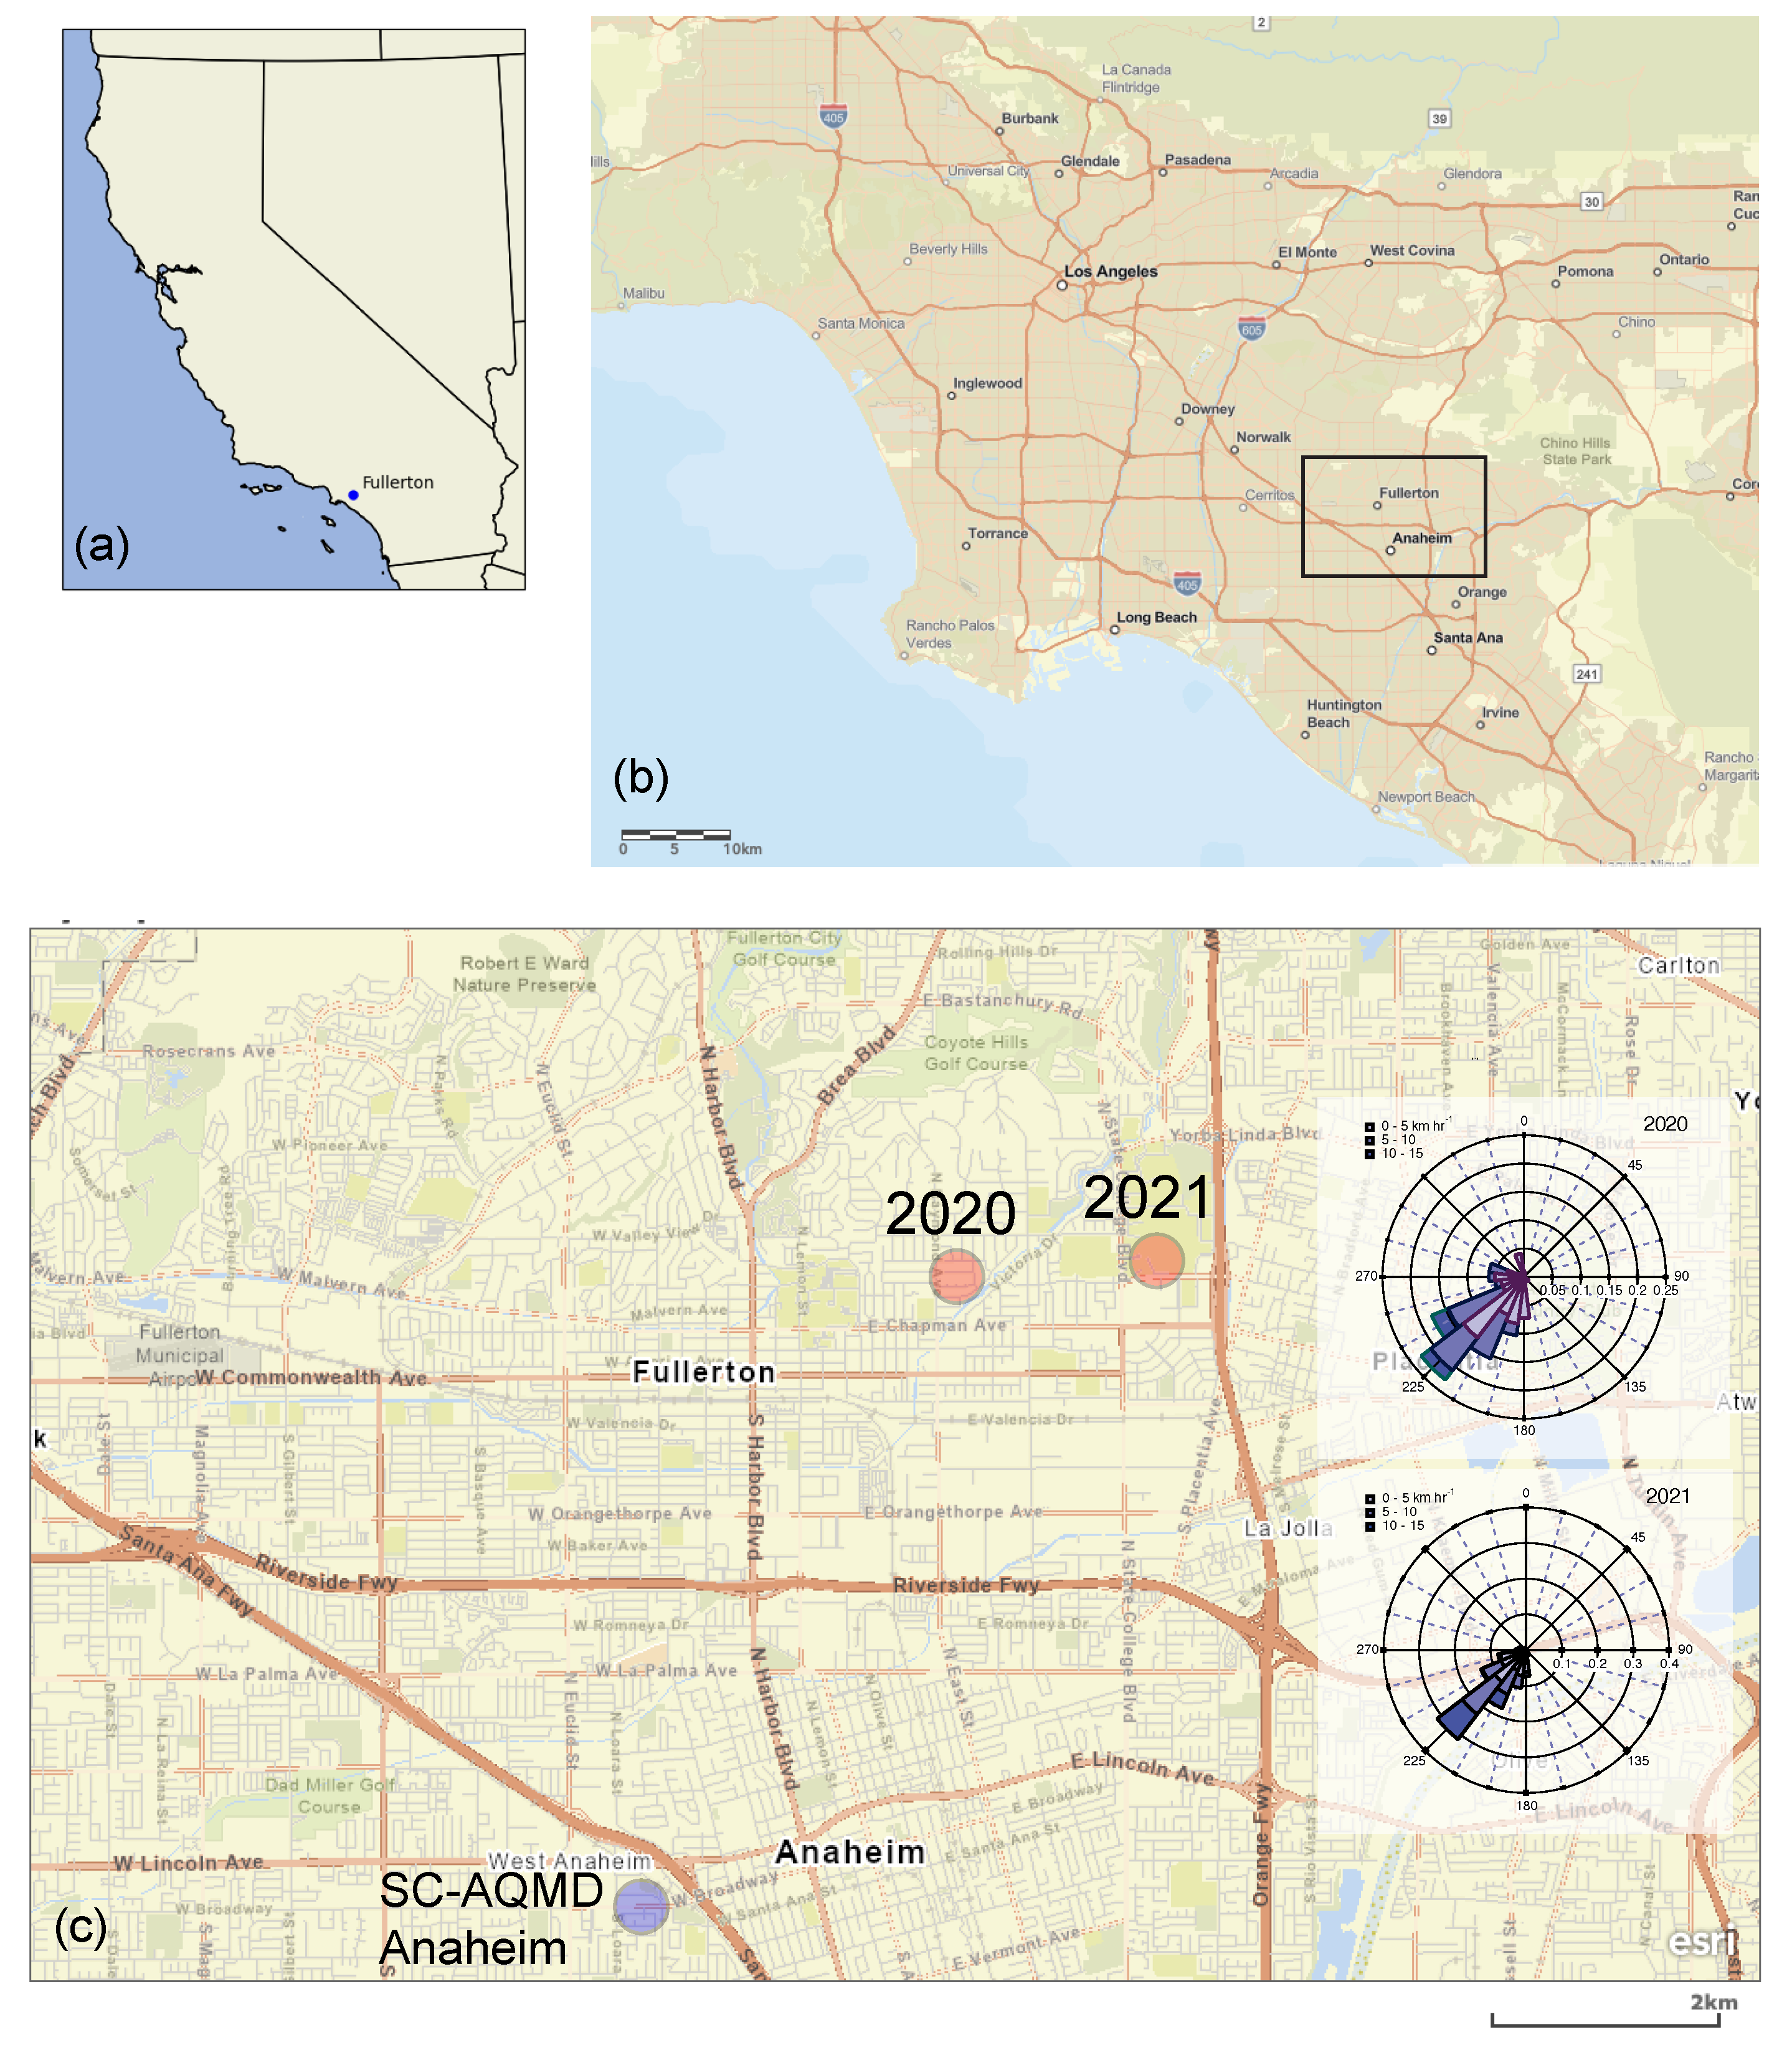
2.1. Sampling Site and Information
2.2. Sample Collection
2.3. Sample Extraction and Chemical Analysis
3. Results and Discussion
4. Conclusions
Author Contributions
Funding
Institutional Review Board Statement
Data Availability Statement
Acknowledgments
Conflicts of Interest
Abbreviations
| GFAAS | Graphite furnace atomic absorption spectrometer |
| PM2.5 | Particulate matter with diameter ≤ 2.5 μm |
| PM10 | Particulate matter with diameter ≤ 10 μm |
| TSP | Total suspended particulates |
| CSUF | California State University, Fullerton |
| SC-AQMD | South Coast Air Quality Management District |
| EPA | United States Environmental Protection Agency |
| PTFE | Polytetrafluoroethylene |
| Ba | Barium |
| Cr | Chromium |
| Cu | Copper |
| Pb | Lead |
| Sr | Strontium |
Appendix A

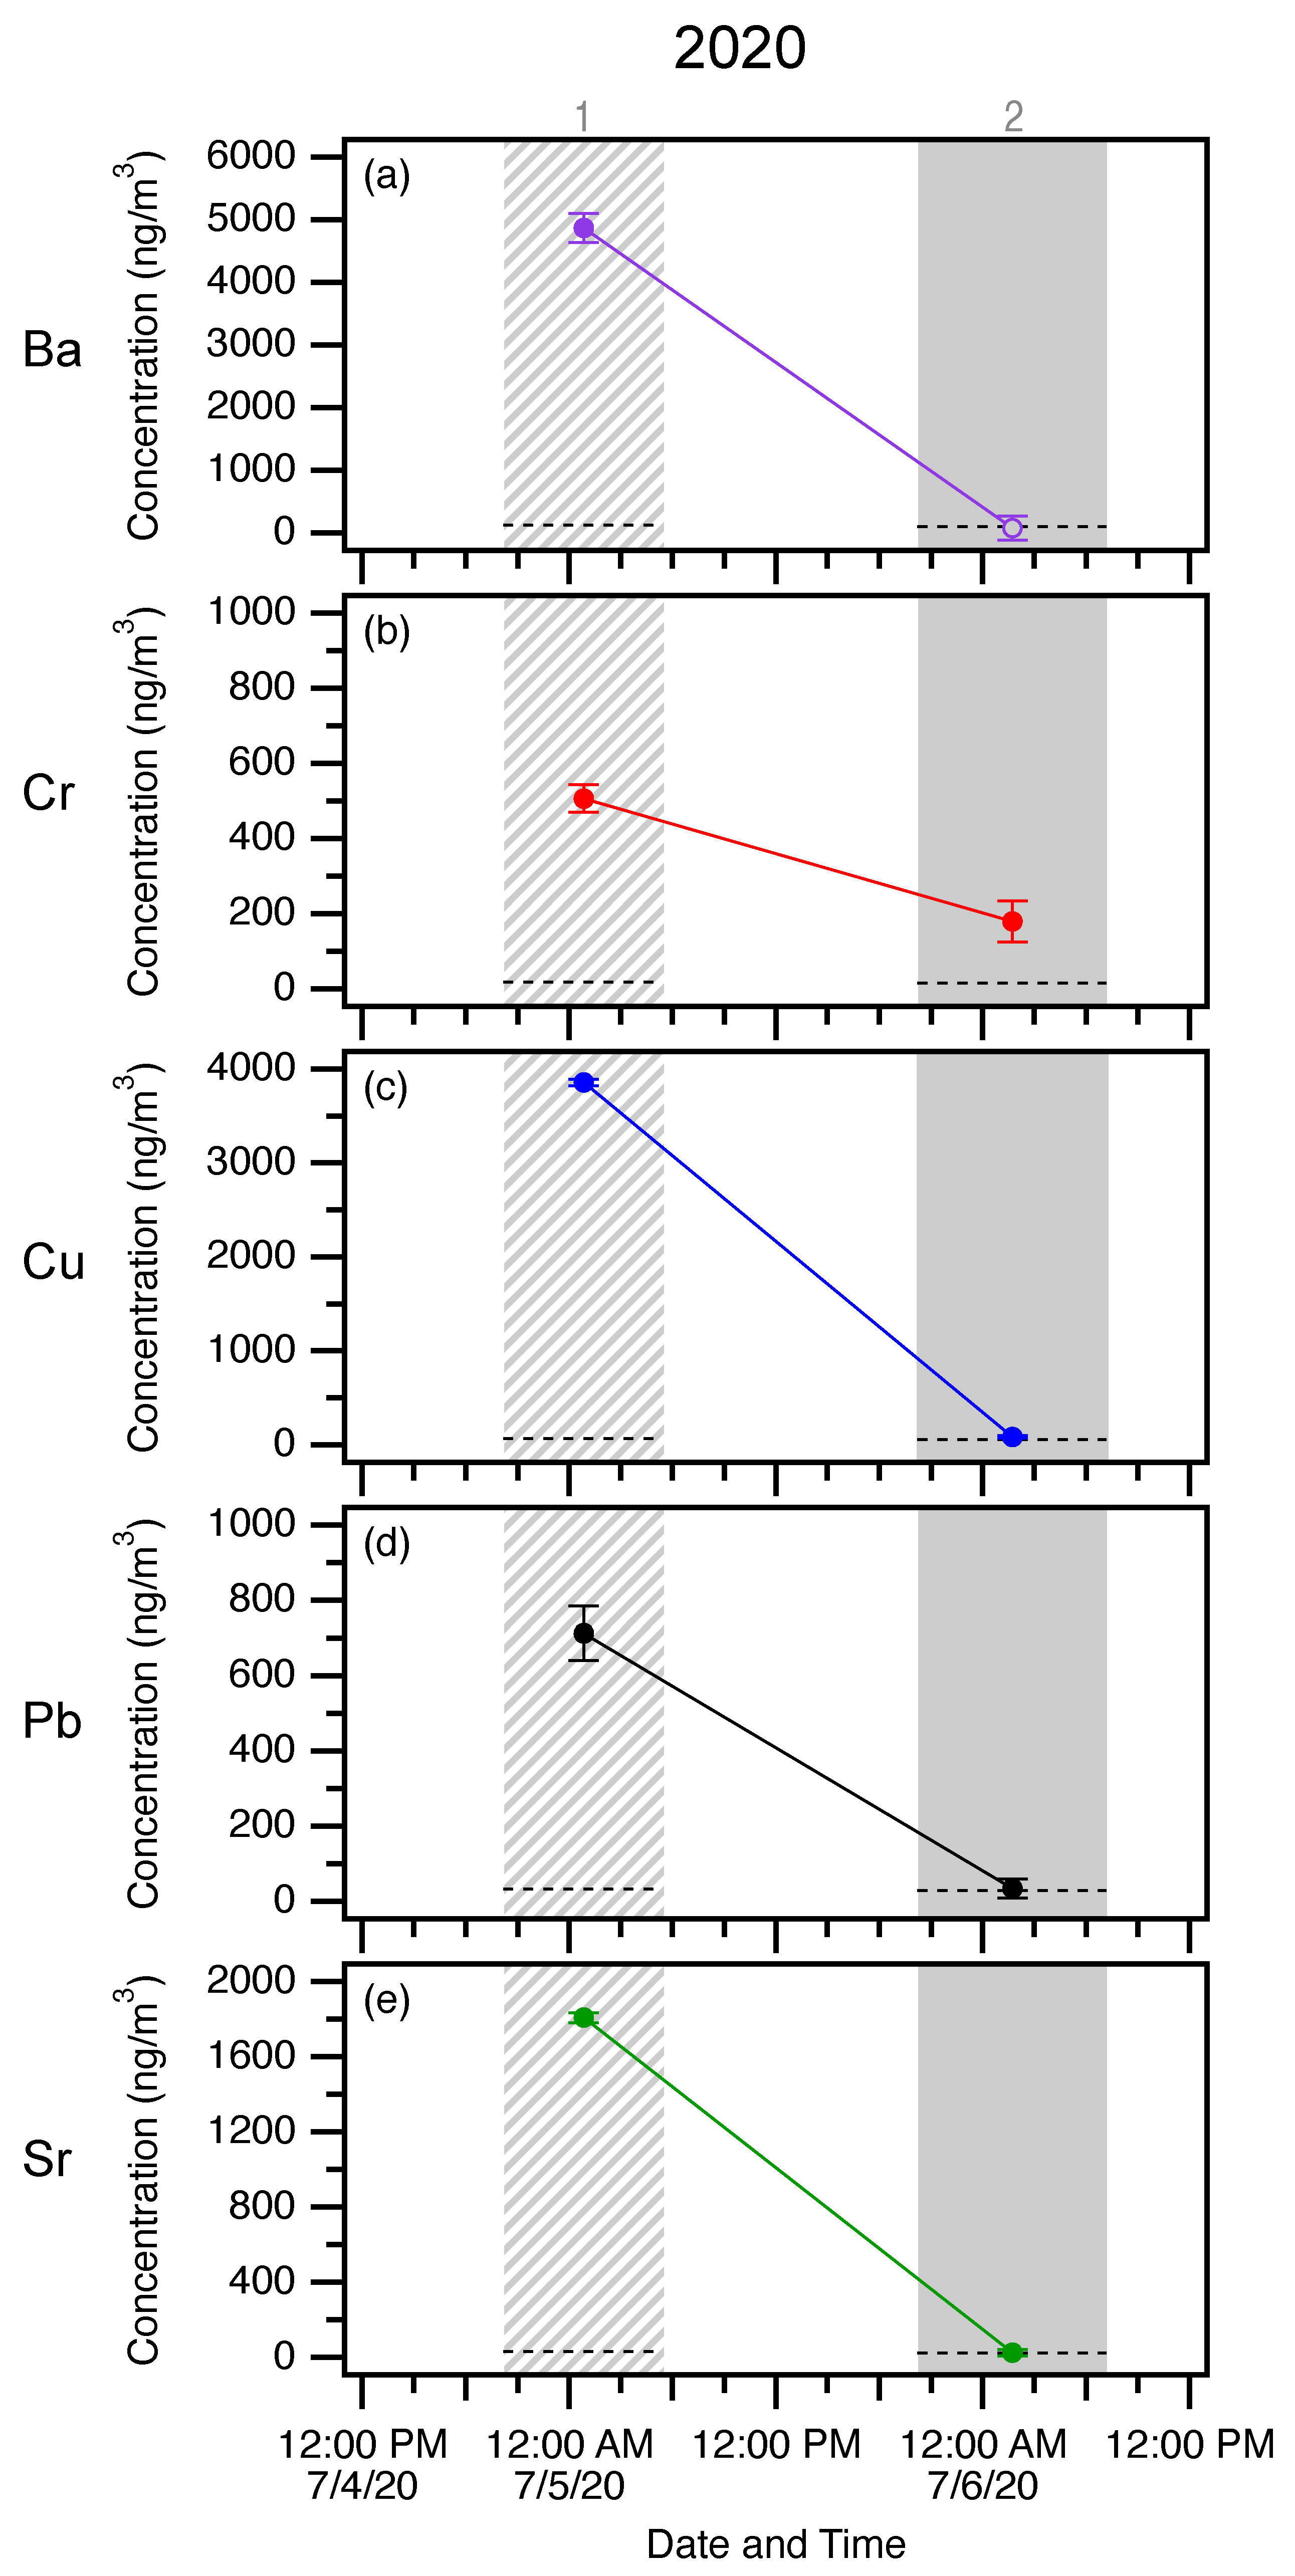
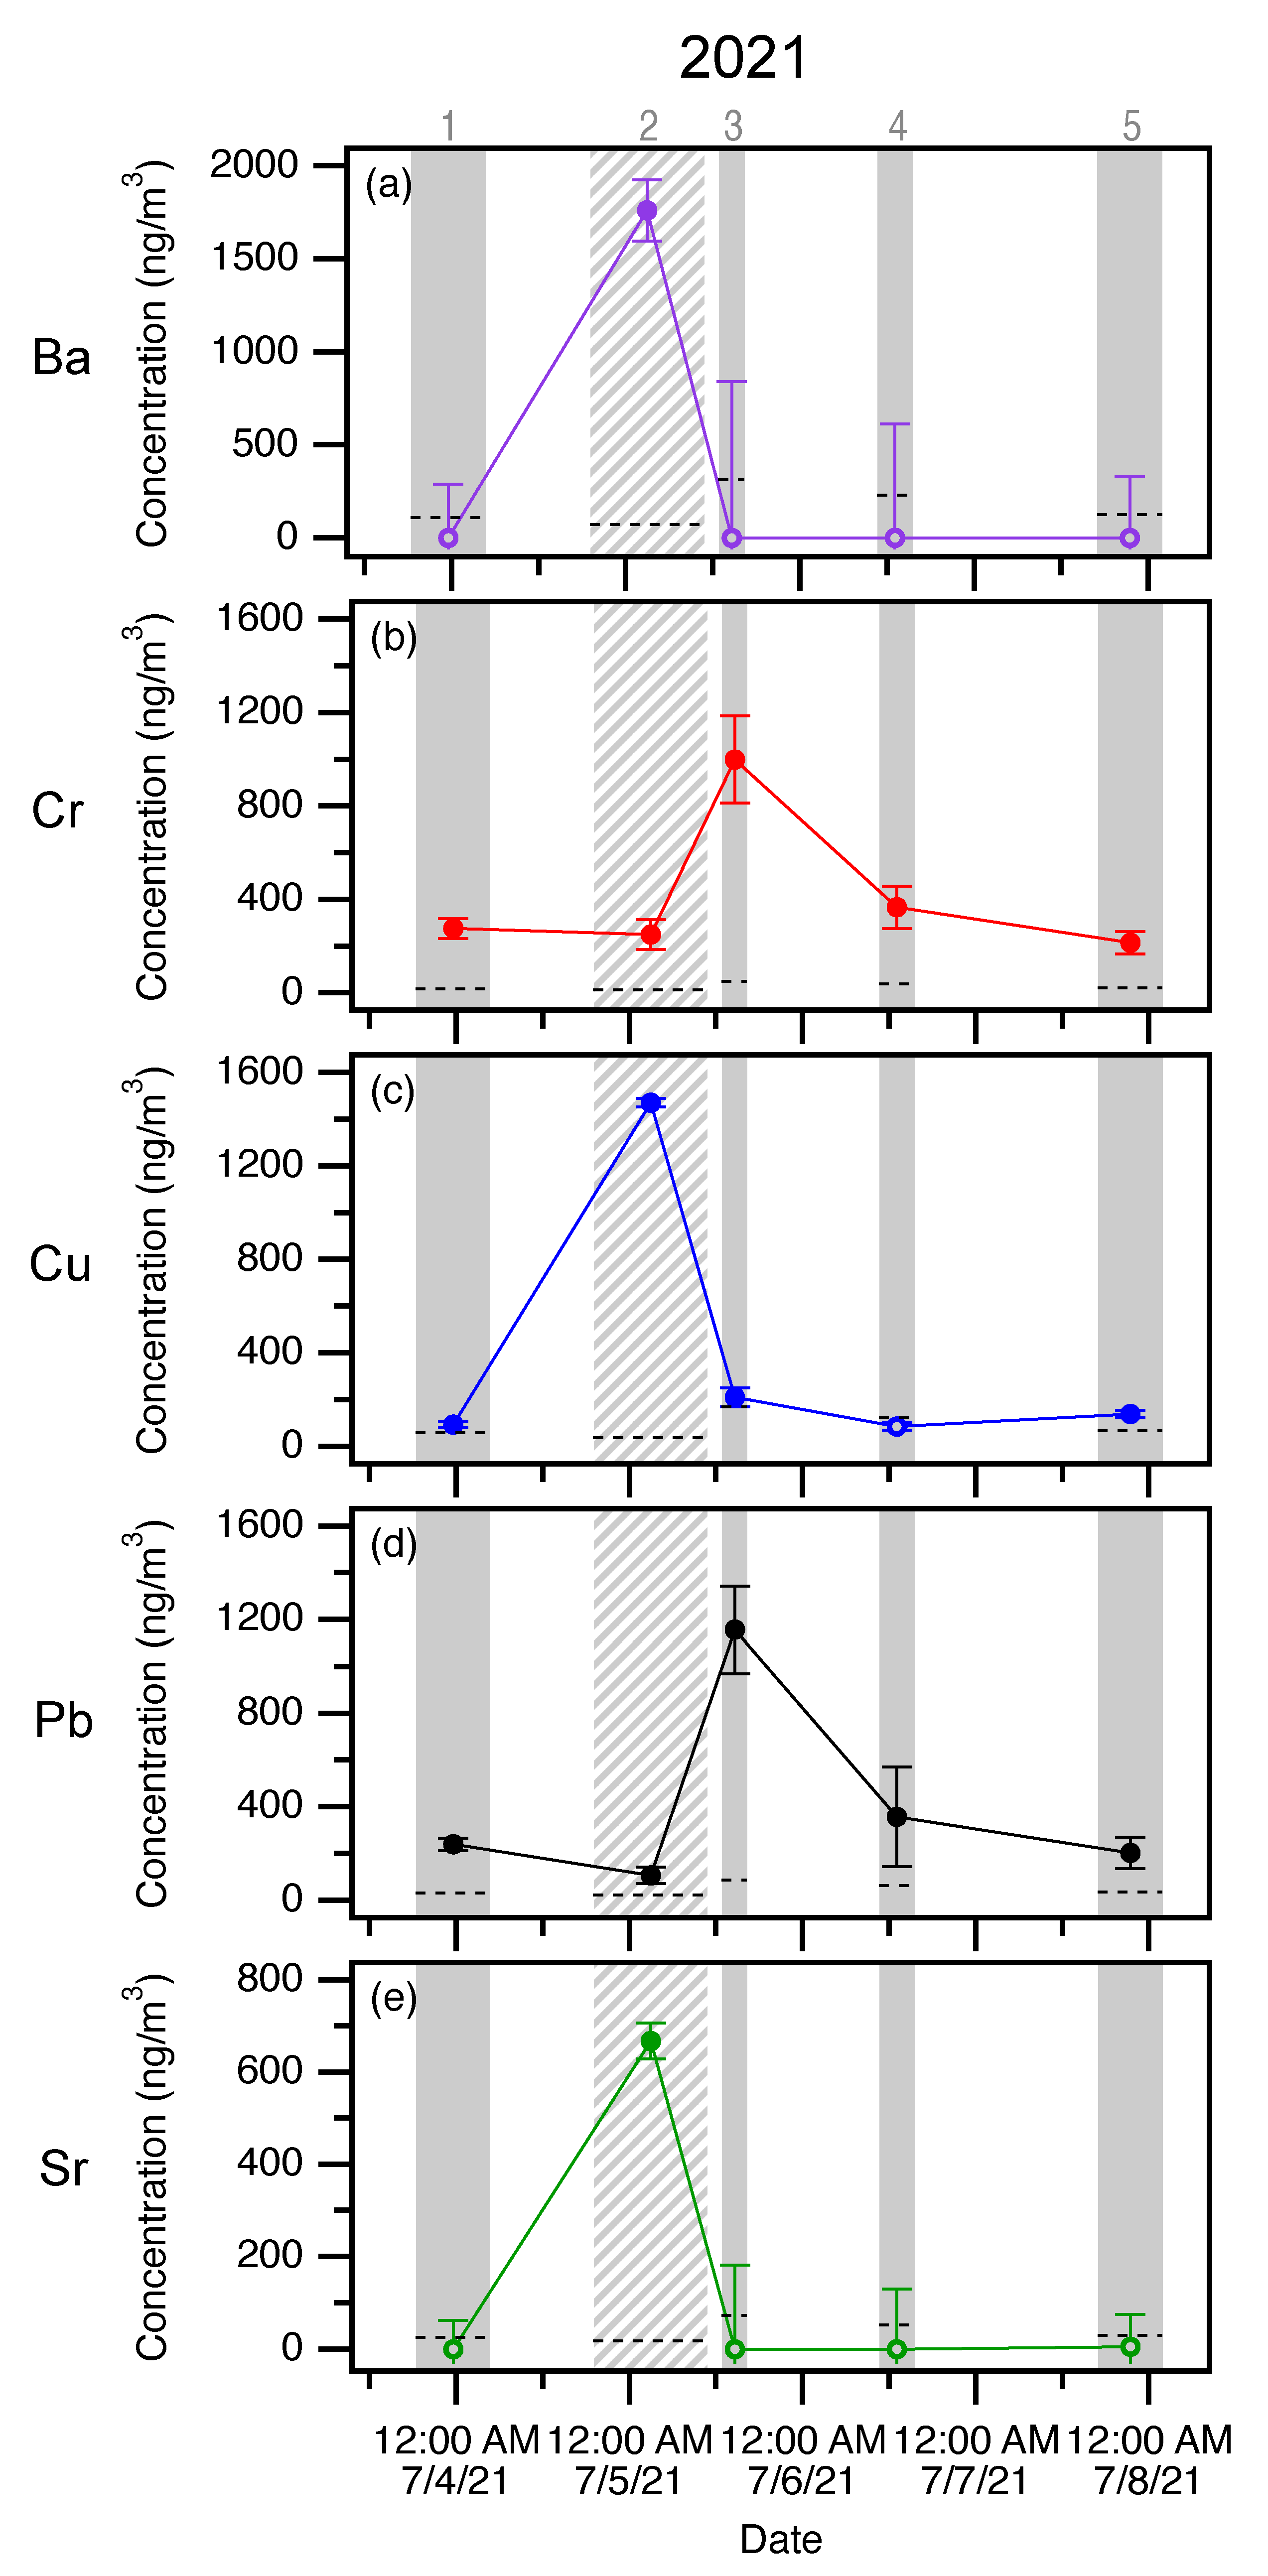
| Year | Sampling Period | Ba | Cr | Cu | Pb | Sr |
|---|---|---|---|---|---|---|
| 2020 | 1 * | |||||
| 2020 | 2 | |||||
| 2021 | 1 | |||||
| 2021 | 2 * | |||||
| 2021 | 3 | |||||
| 2021 | 4 | |||||
| 2021 | 5 |
References
- Apte, J.S.; Brauer, M.; Cohen, A.J.; Ezzati, M.; Pope, C.A. Ambient PM 2.5 Reduces Global and Regional Life Expectancy. Environ. Sci. Technol. Lett. 2018, 5, 546–551. [Google Scholar] [CrossRef]
- Yang, Y.; Ruan, Z.; Wang, X.; Yang, Y.; Mason, T.G.; Lin, H.; Tian, L. Short-Term and Long-Term Exposures to Fine Particulate Matter Constituents and Health: A Systematic Review and Meta-Analysis. Environ. Pollut. 2019, 247, 874–882. [Google Scholar] [CrossRef]
- Anderson, J.O.; Thundiyil, J.G.; Stolbach, A. Clearing the Air: A Review of the Effects of Particulate Matter Air Pollution on Human Health. J. Med. Toxicol. 2012, 8, 166–175. [Google Scholar] [CrossRef] [PubMed]
- Bu, X.; Xie, Z.; Liu, J.; Wei, L.; Wang, X.; Chen, M.; Ren, H. Global PM2.5-Attributable Health Burden from 1990 to 2017: Estimates from the Global Burden of Disease Study 2017. Environ. Res. 2021, 197, 111123. [Google Scholar] [CrossRef] [PubMed]
- Di, Q.; Dai, L.; Wang, Y.; Zanobetti, A.; Choirat, C.; Schwartz, J.D.; Dominici, F. Association of Short-term Exposure to Air Pollution With Mortality in Older Adults. J. Am. Med. Assoc. 2017, 318, 2446. [Google Scholar] [CrossRef] [PubMed]
- Kloog, I.; Ridgway, B.; Koutrakis, P.; Coull, B.A.; Schwartz, J.D. Long- and Short-Term Exposure to PM2.5 and Mortality: Using Novel Exposure Models. Epidemiology 2013, 24, 555–561. [Google Scholar] [CrossRef] [PubMed]
- Pope, C.A.; Dockery, D.W. Health Effects of Fine Particulate Air Pollution: Lines That Connect. J. Air Waste Manag. Assoc. 2006, 56, 709–742. [Google Scholar] [CrossRef]
- Compendium of WHO and Other UN Guidance on Health and Environment 2024 Update; Technical report; World Health Organization: Geneva, Switzerland, 2024.
- Pope, C.A.; Ezzati, M.; Dockery, D.W. Fine-Particulate Air Pollution and Life Expectancy in the United States. N. Engl. J. Med. 2009, 360, 376–386. [Google Scholar] [CrossRef] [PubMed]
- Pope, C.A. Lung Cancer, Cardiopulmonary Mortality, and Long-term Exposure to Fine Particulate Air Pollution. J. Am. Med Assoc. 2002, 287, 1132. [Google Scholar] [CrossRef]
- Hamanaka, R.B.; Mutlu, G.M. Particulate Matter Air Pollution: Effects on the Cardiovascular System. Front. Endocrinol. 2018, 9, 680. [Google Scholar] [CrossRef] [PubMed]
- Malley, C.S.; Kuylenstierna, J.C.; Vallack, H.W.; Henze, D.K.; Blencowe, H.; Ashmore, M.R. Preterm Birth Associated with Maternal Fine Particulate Matter Exposure: A Global, Regional and National Assessment. Environ. Int. 2017, 101, 173–182. [Google Scholar] [CrossRef] [PubMed]
- Ebisu, K.; Malig, B.; Hasheminassab, S.; Sioutas, C.; Basu, R. Cause-Specific Stillbirth and Exposure to Chemical Constituents and Sources of Fine Particulate Matter. Environ. Res. 2018, 160, 358–364. [Google Scholar] [CrossRef]
- DeFranco, E.; Hall, E.; Hossain, M.; Chen, A.; Haynes, E.N.; Jones, D.; Ren, S.; Lu, L.; Muglia, L. Air Pollution and Stillbirth Risk: Exposure to Airborne Particulate Matter during Pregnancy Is Associated with Fetal Death. PLoS ONE 2015, 10, e0120594. [Google Scholar] [CrossRef] [PubMed]
- Ustinaviciene, R.; Venclovienė, J.; Luksiene, D.; Tamosiunas, A.; Jasukaitiene, E.; Augustis, S.; Vaiciulis, V.; Kaliniene, G.; Radisauskas, R. Impact of Ambient Air Pollution with PM2.5 on Stroke Occurrence: Data from Kaunas (Lithuania) Stroke Register (2010–2022). Atmosphere 2024, 15, 1327. [Google Scholar] [CrossRef]
- Hickey, C.; Gordon, C.; Galdanes, K.; Blaustein, M.; Horton, L.; Chillrud, S.; Ross, J.; Yinon, L.; Chen, L.C.; Gordon, T. Toxicity of Particles Emitted by Fireworks. Part. Fibre Toxicol. 2020, 17, 28. [Google Scholar] [CrossRef]
- Jiang, Q.; Sun, Y.L.; Wang, Z.; Yin, Y. Aerosol Composition and Sources during the Chinese Spring Festival: Fireworks, Secondary Aerosol, and Holiday Effects. Atmos. Chem. Phys. 2015, 15, 6023–6034. [Google Scholar] [CrossRef]
- Singh, A.; Pant, P.; Pope, F.D. Air Quality during and after Festivals: Aerosol Concentrations, Composition and Health Effects. Atmos. Res. 2019, 227, 220–232. [Google Scholar] [CrossRef]
- Dutcher, D.D.; Perry, K.D.; Cahill, T.A.; Copeland, S.A. Effects of Indoor Pyrotechnic Displays on the Air Quality in the Houston Astrodome. J. Air Waste Manag. Assoc. 1999, 49, 156–160. [Google Scholar] [CrossRef]
- Seidel, D.J.; Birnbaum, A.N. Effects of Independence Day Fireworks on Atmospheric Concentrations of Fine Particulate Matter in the United States. Atmos. Environ. 2015, 115, 192–198. [Google Scholar] [CrossRef]
- Camilleri, R.; Vella, A.J. Emission Factors for Aerial Pyrotechnics and Use in Assessing Environmental Impact of Firework Displays: Case Study from Malta. Propellants Explos. Pyrotech. 2016, 41, 273–280. [Google Scholar] [CrossRef]
- Lorenzo, G.R.; Bañaga, P.A.; Cambaliza, M.O.; Cruz, M.T.; AzadiAghdam, M.; Arellano, A.; Betito, G.; Braun, R.; Corral, A.F.; Dadashazar, H.; et al. Measurement Report: Firework Impacts on Air Quality in Metro Manila, Philippines, during the 2019 New Year Revelry. Atmos. Chem. Phys. 2021, 21, 6155–6173. [Google Scholar] [CrossRef]
- Tanda, S.; Ličbinský, R.; Hegrová, J.; Goessler, W. Impact of New Year’s Eve Fireworks on the Size Resolved Element Distributions in Airborne Particles. Environ. Int. 2019, 128, 371–378. [Google Scholar] [CrossRef] [PubMed]
- Pongpiachan, S.; Iijima, A.; Cao, J. Hazard Quotients, Hazard Indexes, and Cancer Risks of Toxic Metals in PM10 during Firework Displays. Atmosphere 2018, 9, 144. [Google Scholar] [CrossRef]
- Cao, X.; Zhang, X.; Tong, D.Q.; Chen, W.; Zhang, S.; Zhao, H.; Xiu, A. Review on Physicochemical Properties of Pollutants Released from Fireworks: Environmental and Health Effects and Prevention. Environ. Rev. 2018, 26, 133–155. [Google Scholar] [CrossRef]
- Zhang, J.; Lance, S.; Freedman, J.M.; Sun, Y.; Crandall, B.A.; Wei, X.; Schwab, J.J. Detailed Measurements of Submicron Particles from an Independence Day Fireworks Event in Albany, New York Using HR-ToF-AMS. ACS Earth Space Chem. 2019, 3, 1451–1459. [Google Scholar] [CrossRef]
- Vecchi, R.; Bernardoni, V.; Cricchio, D.; D’Alessandro, A.; Fermo, P.; Lucarelli, F.; Nava, S.; Piazzalunga, A.; Valli, G. The Impact of Fireworks on Airborne Particles. Atmos. Environ. 2008, 42, 1121–1132. [Google Scholar] [CrossRef]
- Wang, W.; Zhou, H.; Gao, Y.; Shao, L.; Zhou, X.; Li, X.; Wei, D.; Xing, J.; Lyu, R. Chemical Composition and Morphology of PM2.5 in a Rural Valley during Chinese New Year’s Eve: Impact of Firework/Firecracker Display. Atmos. Environ. 2024, 318, 120225. [Google Scholar] [CrossRef]
- Greven, F.E.; Vonk, J.M.; Fischer, P.; Duijm, F.; Vink, N.M.; Brunekreef, B. Air Pollution during New Year’s Fireworks and Daily Mortality in the Netherlands. Sci. Rep. 2019, 9, 5735. [Google Scholar] [CrossRef] [PubMed]
- Mandal, P.; Prakash, M.; Bassin, J.K. Impact of Diwali Celebrations on Urban Air and Noise Quality in Delhi City, India. Environ. Monit. Assess. 2012, 184, 209–215. [Google Scholar] [CrossRef] [PubMed]
- Tian, Y.Z.; Wang, J.; Peng, X.; Shi, G.L.; Feng, Y.C. Estimation of the Direct and Indirect Impacts of Fireworks on the Physicochemical Characteristics of Atmospheric PM10 and PM2.5. Atmos. Chem. Phys. 2014, 14, 9469–9479. [Google Scholar] [CrossRef]
- Verma, C.; Deshmukh, D.K. The Ambient Air and Noise Quality in India during Diwali Festival: A Review. Recent Res. Sci. Technol. 2014, 6, 203–210. [Google Scholar]
- Mousavi, A.; Yuan, Y.; Masri, S.; Barta, G.; Wu, J. Impact of 4th of July Fireworks on Spatiotemporal PM2.5 Concentrations in California Based on the PurpleAir Sensor Network: Implications for Policy and Environmental Justice. Int. J. Environ. Res. Public Health 2021, 18, 5735. [Google Scholar] [CrossRef] [PubMed]
- Masri, S.; Flores, L.; Rea, J.; Wu, J. Race and Street-Level Firework Legalization as Primary Determinants of July 4th Air Pollution across Southern California. Atmosphere 2023, 14, 401. [Google Scholar] [CrossRef]
- Buwaniwal, A.; Joshi, M.; Sharma, V.; Gupta, G.; Khan, A.; Kansal, S.; Sapra, B.K. Size-Segregated Aerosol Measurements during Diwali Festival in an Elevated Background Location. Atmos. Environ. 2023, 314, 120078. [Google Scholar] [CrossRef]
- Mishra, M.; Boopathy, R.; Mallik, C.; Das, T. The Diwali Festival: Short-Term High Effect of Fireworks Emissions on Particulates and Their Associated Empirically Calculated Health Risk Assessment at Bhubaneswar City. Environ. Geochem. Health 2024, 46, 21. [Google Scholar] [CrossRef]
- Moreno, T.; Querol, X.; Alastuey, A.; Amato, F.; Pey, J.; Pandolfi, M.; Kuenzli, N.; Bouso, L.; Rivera, M.; Gibbons, W. Effect of Fireworks Events on Urban Background Trace Metal Aerosol Concentrations: Is the Cocktail Worth the Show? J. Hazard. Mater. 2010, 183, 945–949. [Google Scholar] [CrossRef]
- Licudine, J.A.; Yee, H.; Chang, W.L.; Whelen, A.C. Hazardous Metals in Ambient Air Due to New Year Fireworks during 2004–2011 Celebrations in Pearl City, Hawaii. Public Health Rep. 2012, 127, 440–450. [Google Scholar] [CrossRef]
- Steinhauser, G.; Sterba, J.H.; Foster, M.; Grass, F.; Bichler, M. Heavy Metals from Pyrotechnics in New Years Eve Snow. Atmos. Environ. 2008, 42, 8616–8622. [Google Scholar] [CrossRef]
- Croteau, G.; Dills, R.; Beaudreau, M.; Davis, M. Emission Factors and Exposures from Ground-Level Pyrotechnics. Atmos. Environ. 2010, 44, 3295–3303. [Google Scholar] [CrossRef]
- Choi, E.; Yi, S.M.; Lee, Y.S.; Jo, H.; Baek, S.O.; Heo, J.B. Sources of Airborne Particulate Matter-Bound Metals and Spatial-Seasonal Variability of Health Risk Potentials in Four Large Cities, South Korea. Environ. Sci. Pollut. Res. 2022, 29, 28359–28374. [Google Scholar] [CrossRef]
- Kulshrestha, U.; Nageswara Rao, T.; Azhaguvel, S.; Kulshrestha, M. Emissions and Accumulation of Metals in the Atmosphere Due to Crackers and Sparkles during Diwali Festival in India. Atmos. Environ. 2004, 38, 4421–4425. [Google Scholar] [CrossRef]
- Potter, N.A.; Meltzer, G.Y.; Avenbuan, O.N.; Raja, A.; Zelikoff, J.T. Particulate Matter and Associated Metals: A Link with Neurotoxicity and Mental Health. Atmosphere 2021, 12, 425. [Google Scholar] [CrossRef]
- Mason, L.H.; Harp, J.P.; Han, D.Y. Pb Neurotoxicity: Neuropsychological Effects of Lead Toxicity. BioMed Res. Int. 2014, 2014, 1–8. [Google Scholar] [CrossRef]
- Flora, G.; Gupta, D.; Tiwari, A. Toxicity of Lead: A Review with Recent Updates. Interdiscip. Toxicol. 2012, 5, 47–58. [Google Scholar] [CrossRef]
- Sanders, T.; Liu, Y.; Buchner, V.; Tchounwou, P. Neurotoxic Effects and Biomarkers of Lead Exposure: A Review. Rev. Environ. Health 2009, 24, 15–46. [Google Scholar] [CrossRef]
- Schwartz, J. Low-Level Lead Exposure and Children’s IQ: A Metaanalysis and Search for a Threshold. Environ. Res. 1994, 65, 42–55. [Google Scholar] [CrossRef] [PubMed]
- Hou, S.; Yuan, L.; Jin, P.; Ding, B.; Qin, N.; Li, L.; Liu, X.; Wu, Z.; Zhao, G.; Deng, Y. A Clinical Study of the Effects of Lead Poisoning on the Intelligence and Neurobehavioral Abilities of Children. Theor. Biol. Med Model. 2013, 10, 13. [Google Scholar] [CrossRef]
- Jangid, A.P.; John, P.J.; Yadav, D.; Mishra, S.; Sharma, P. Impact of Chronic Lead Exposure on Selected Biological Markers. Indian J. Clin. Biochem. 2012, 27, 83–89. [Google Scholar] [CrossRef]
- Shen, X.M.; Wu, S.H.; Yan, C.H. Impacts of Low-Level Lead Exposure on Development of Children: Recent Studies in China. Clin. Chim. Acta 2001, 313, 217–220. [Google Scholar] [CrossRef]
- Krystek, P.; Ritsema, R. Monitoring of Chromium Species and 11 Selected Metals in Emission and Immission of Airborne Environment. Int. J. Mass Spectrom. 2007, 265, 23–29. [Google Scholar] [CrossRef]
- Alvarez, C.C.; Bravo Gómez, M.E.; Hernández Zavala, A. Hexavalent Chromium: Regulation and Health Effects. J. Trace Elem. Med. Biol. 2021, 65, 126729. [Google Scholar] [CrossRef] [PubMed]
- Deng, Y.; Wang, M.; Tian, T.; Lin, S.; Xu, P.; Zhou, L.; Dai, C.; Hao, Q.; Wu, Y.; Zhai, Z.; et al. The Effect of Hexavalent Chromium on the Incidence and Mortality of Human Cancers: A Meta-Analysis Based on Published Epidemiological Cohort Studies. Front. Oncol. 2019, 9, 24. [Google Scholar] [CrossRef] [PubMed]
- Rahman, Z.; Singh, V.P. The Relative Impact of Toxic Heavy Metals (THMs) (Arsenic (As), Cadmium (Cd), Chromium (Cr)(VI), Mercury (Hg), and Lead (Pb)) on the Total Environment: An Overview. Environ. Monit. Assess. 2019, 191, 419. [Google Scholar] [CrossRef]
- Lee, J.W.; Choi, H.; Hwang, U.K.; Kang, J.C.; Kang, Y.J.; Kim, K.I.; Kim, J.H. Toxic Effects of Lead Exposure on Bioaccumulation, Oxidative Stress, Neurotoxicity, and Immune Responses in Fish: A Review. Environ. Toxicol. Pharmacol. 2019, 68, 101–108. [Google Scholar] [CrossRef]
- Sharma, A.; Kapoor, D.; Wang, J.; Shahzad, B.; Kumar, V.; Bali, A.S.; Jasrotia, S.; Zheng, B.; Yuan, H.; Yan, D. Chromium Bioaccumulation and Its Impacts on Plants: An Overview. Plants 2020, 9, 100. [Google Scholar] [CrossRef] [PubMed]
- Zulfiqar, U.; Farooq, M.; Hussain, S.; Maqsood, M.; Hussain, M.; Ishfaq, M.; Ahmad, M.; Anjum, M.Z. Lead Toxicity in Plants: Impacts and Remediation. J. Environ. Manag. 2019, 250, 109557. [Google Scholar] [CrossRef] [PubMed]
- South Coast Air Quality Management District. 2021 Independence Day Air Quality Assessment. 2021. Available online: http://www.aqmd.gov/home/air-quality/air-quality-studies/special-monitoring/independence-day-fireworks/independence-day-fireworks-2021 (accessed on 24 December 2024).
- United States Environmental Protection Agency. 2024. Available online: https://www.epa.gov/criteria-air-pollutants/naaqs-table (accessed on 24 December 2024).
- Hasheminassab, S.; Sowlat, M.H.; Pakbin, P.; Katzenstein, A.; Low, J.; Polidori, A. High Time-Resolution and Time-Integrated Measurements of Particulate Metals and Elements in an Environmental Justice Community within the Los Angeles Basin: Spatio-temporal Trends and Source Apportionment. Atmos. Environ. X 2020, 7, 100089. [Google Scholar] [CrossRef]
- Adamiec, E.; Jarosz-Krzemińska, E.; Wieszała, R. Heavy Metals from Non-Exhaust Vehicle Emissions in Urban and Motorway Road Dusts. Environ. Monit. Assess. 2016, 188, 369. [Google Scholar] [CrossRef]
- Lough, G.C.; Schauer, J.J.; Park, J.S.; Shafer, M.M.; DeMinter, J.T.; Weinstein, J.P. Emissions of Metals Associated with Motor Vehicle Roadways. Environ. Sci. Technol. 2005, 39, 826–836. [Google Scholar] [CrossRef] [PubMed]
- Wang, J.M.; Jeong, C.H.; Hilker, N.; Healy, R.M.; Sofowote, U.; Debosz, J.; Su, Y.; Munoz, A.; Evans, G.J. Quantifying Metal Emissions from Vehicular Traffic Using Real World Emission Factors. Environ. Pollut. 2021, 268, 115805. [Google Scholar] [CrossRef] [PubMed]
- Oroumiyeh, F.; Jerrett, M.; Del Rosario, I.; Lipsitt, J.; Liu, J.; Paulson, S.E.; Ritz, B.; Schauer, J.J.; Shafer, M.M.; Shen, J.; et al. Elemental composition of fine and coarse particles across the greater Los Angeles area: Spatial variation and contributing sources. Environ. Pollut. 2022, 292, 118356. [Google Scholar] [CrossRef] [PubMed]
- Shen, J.; Taghvaee, S.; La, C.; Oroumiyeh, F.; Liu, J.; Jerrett, M.; Weichenthal, S.; Del Rosario, I.; Shafer, M.M.; Ritz, B.; et al. Aerosol Oxidative Potential in the Greater Los Angeles Area: Source Apportionment and Associations with Socioeconomic Position. Environ. Sci. Technol. 2022, 56, 17795–17804. [Google Scholar] [CrossRef] [PubMed]
- Yang, B.; Zhu, Q.; Wang, W.; Zhu, Q.; Zhang, D.; Jin, Z.; Prasad, P.; Sowlat, M.; Pakbin, P.; Ahangar, F.; et al. Impact of Warehouse Expansion on Ambient PM2.5 and Elemental Carbon Levels in Southern California’s Disadvantaged Communities: A Two-Decade Analysis. GeoHealth 2024, 8, e2024GH001091. [Google Scholar] [CrossRef] [PubMed]
- United States Environmental Protection Agency. Compendium of Methods for the Determination of Inorganic Compounds in Ambient Air; Technical Report EPA/625/R-96/010a; United States Environmental Protection Agency, Office of Research and Development: Washington, DC, USA, 1999.
- Rocco, D. Probing the Sources of Metals in Particulate Matter: Fireworks and Freeways. Master’s Thesis, California State University, Fullerton, CA, USA, 2022. [Google Scholar] [CrossRef]

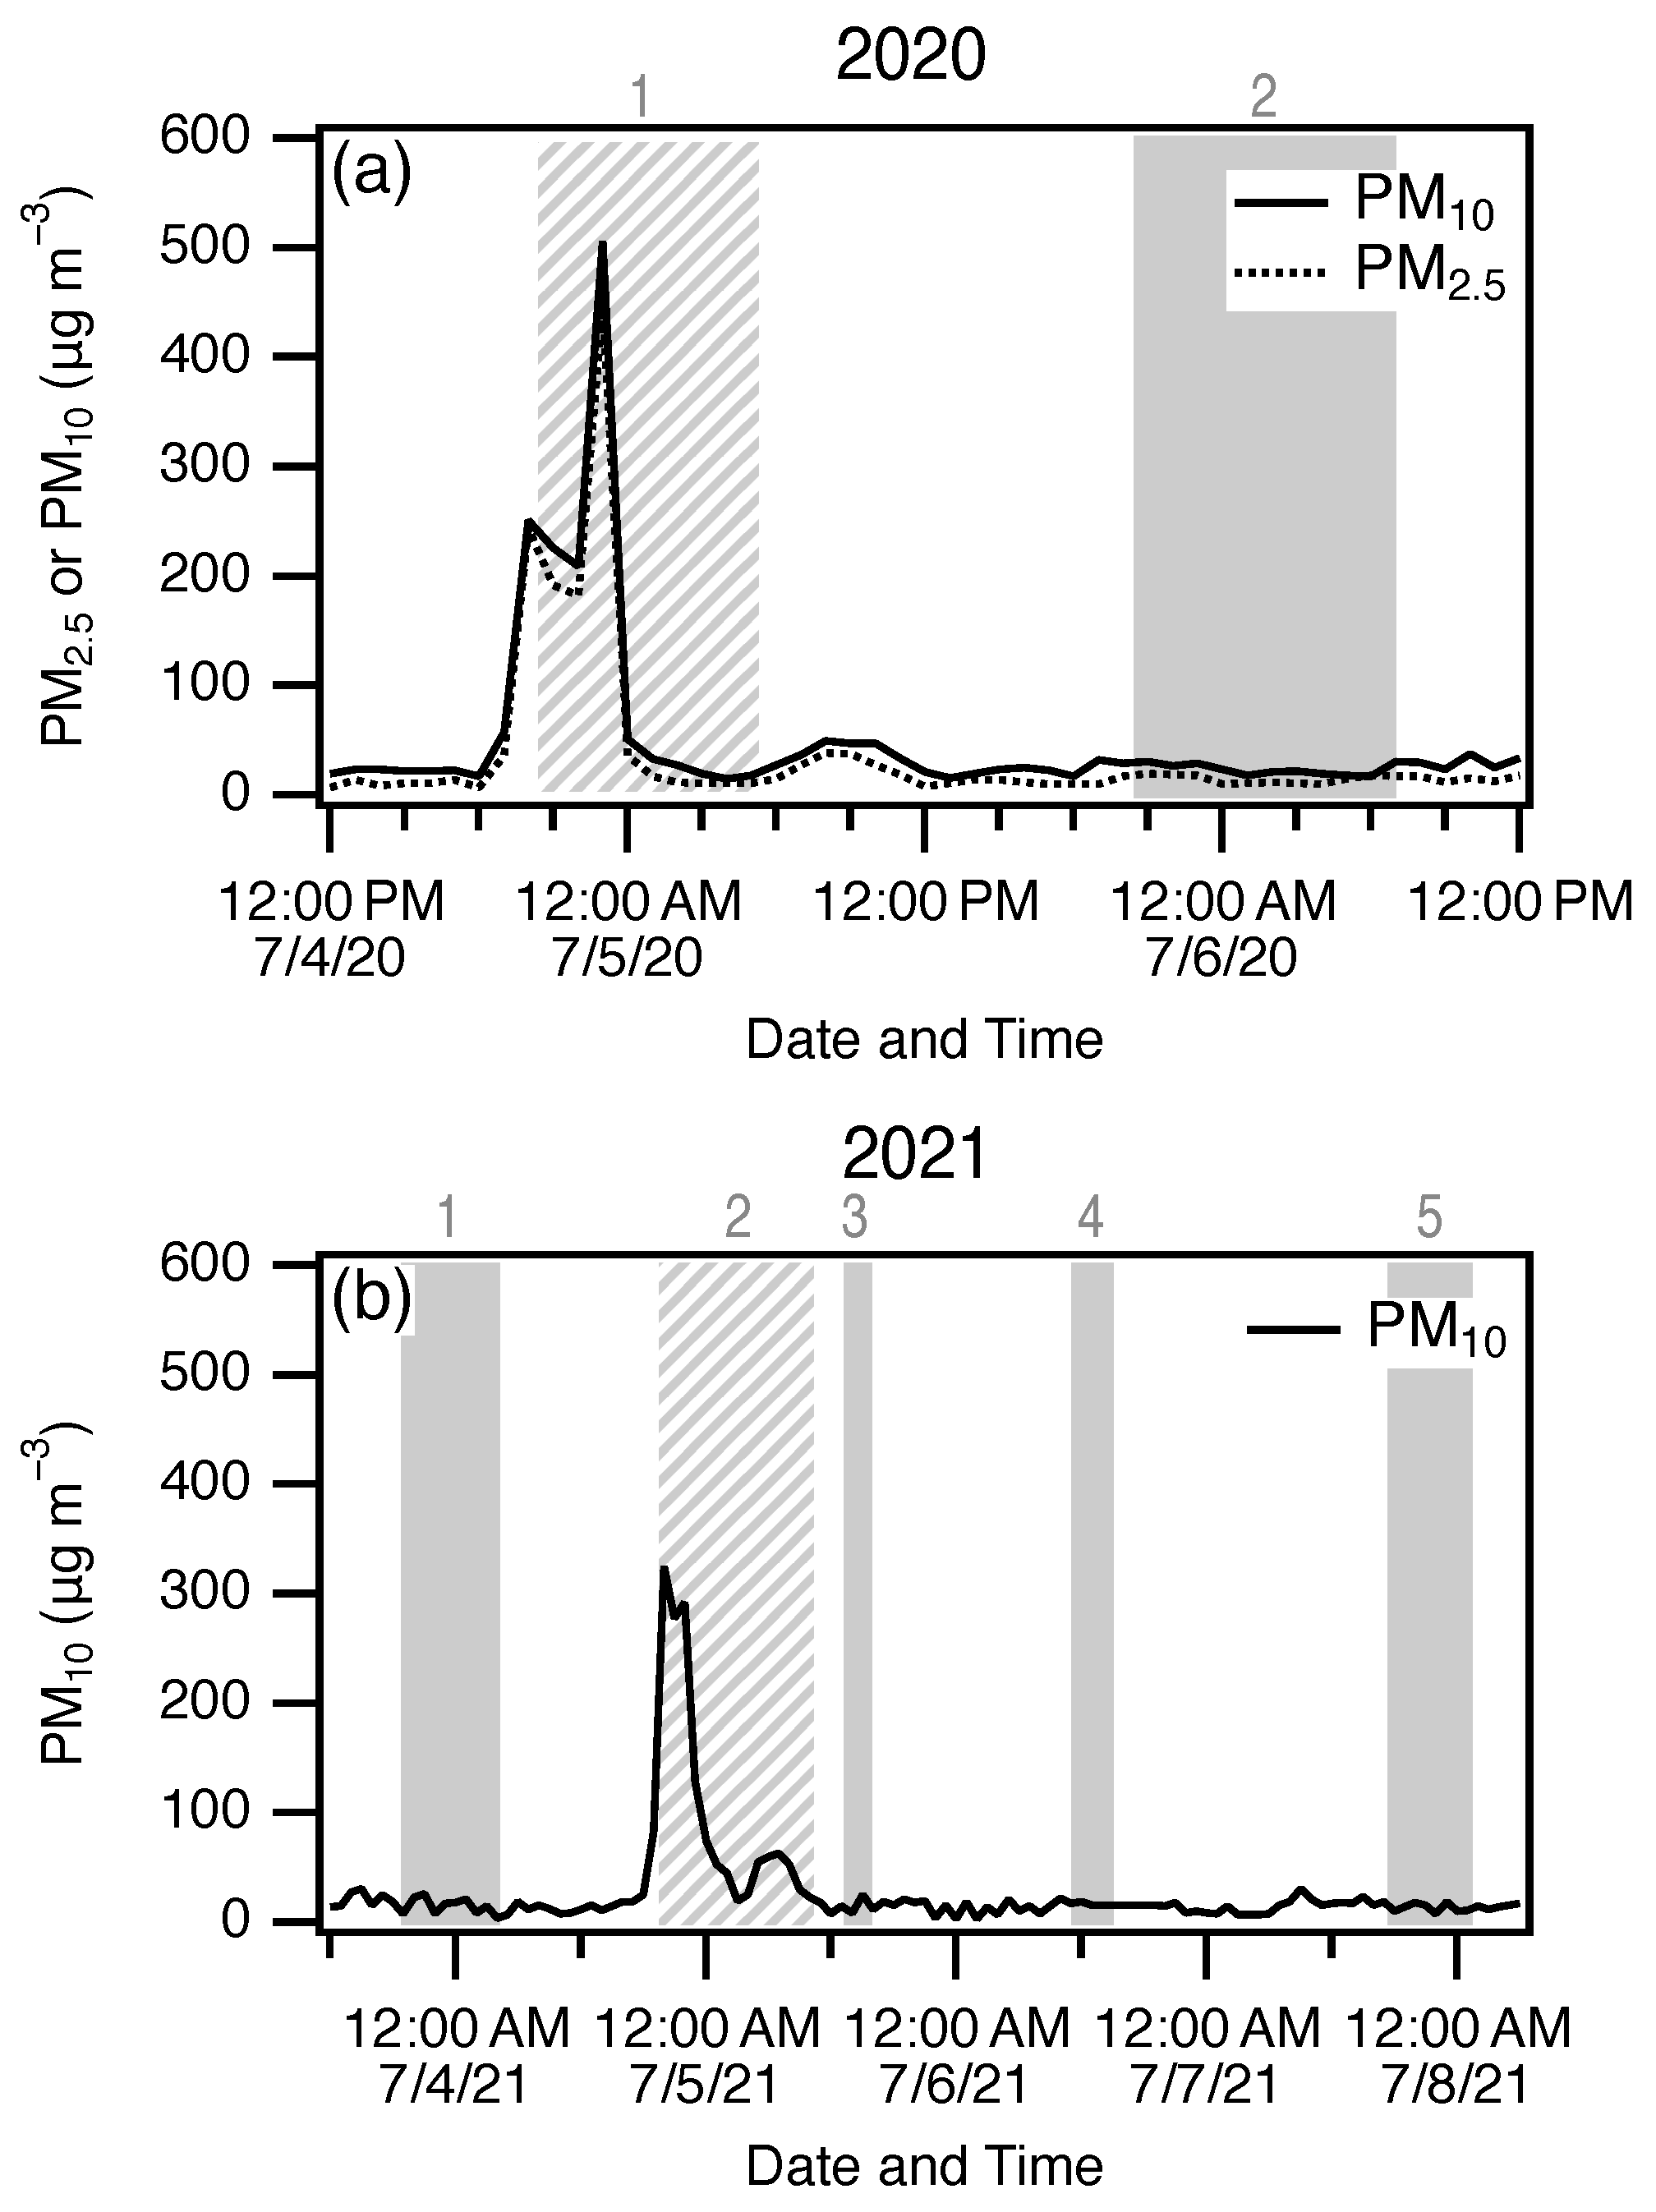
| 2020 | Start Time | End Time | Duration |
| Sampling Period | (min) | ||
| 1 | Sat. 7/4/2020 20:13 | Sun. 7/5/2020 05:28 | 555 |
| 2 | Sun. 7/5/2020 20:15 | Mon. 7/6/2020 07:11 | 656 |
| 2021 | Start Time | End Time | Duration |
| Sampling Period | (min) | ||
| 1 | Sat. 7/3/2021 18:25 | Sun. 7/4/2021 04:39 | 614 |
| 2 | Sun. 7/4/2021 19:05 | Mon. 7/5/2021 02:55 | 941 |
| 3 | Mon. 7/5/2021 12:50 | Mon. 7/5/2021 16:19 | 209 |
| 4 | Tue. 7/6/2021 10:40 | Tue. 7/6/2021 15:39 | 289 |
| 5 | Wed. 7/7/2021 16:58 | Thu. 7/8/2021 01:54 | 536 |
Disclaimer/Publisher’s Note: The statements, opinions and data contained in all publications are solely those of the individual author(s) and contributor(s) and not of MDPI and/or the editor(s). MDPI and/or the editor(s) disclaim responsibility for any injury to people or property resulting from any ideas, methods, instructions or products referred to in the content. |
© 2024 by the authors. Licensee MDPI, Basel, Switzerland. This article is an open access article distributed under the terms and conditions of the Creative Commons Attribution (CC BY) license (https://creativecommons.org/licenses/by/4.0/).
Share and Cite
Rocco, D.; Morales, E.; Deflin, T.; Truong, J.; Ju, J.; Curtis, D.B. The Impact of Fireworks on Selected Ambient Particulate Metal Concentrations Associated with the Independence Day Holiday. Atmosphere 2025, 16, 17. https://doi.org/10.3390/atmos16010017
Rocco D, Morales E, Deflin T, Truong J, Ju J, Curtis DB. The Impact of Fireworks on Selected Ambient Particulate Metal Concentrations Associated with the Independence Day Holiday. Atmosphere. 2025; 16(1):17. https://doi.org/10.3390/atmos16010017
Chicago/Turabian StyleRocco, Danielle, Esther Morales, Tyler Deflin, Jason Truong, Jaebin Ju, and Daniel B. Curtis. 2025. "The Impact of Fireworks on Selected Ambient Particulate Metal Concentrations Associated with the Independence Day Holiday" Atmosphere 16, no. 1: 17. https://doi.org/10.3390/atmos16010017
APA StyleRocco, D., Morales, E., Deflin, T., Truong, J., Ju, J., & Curtis, D. B. (2025). The Impact of Fireworks on Selected Ambient Particulate Metal Concentrations Associated with the Independence Day Holiday. Atmosphere, 16(1), 17. https://doi.org/10.3390/atmos16010017