Article

Evaluation of the Urban Canopy Scheme TERRA-URB in the ICON Model at Hectometric Scale over the Naples Metropolitan Area

by
Davide Cinquegrana
,
Myriam Montesarchio
,
Alessandra Lucia Zollo
and
Edoardo Bucchignani
*
Meteorology and Climatology Lab, Centro Italiano Ricerche Aerospaziali (CIRA), Via Maiorise, 81043 Capua, CE, Italy
*
Author to whom correspondence should be addressed.
Atmosphere 2024, 15(9), 1119; https://doi.org/10.3390/atmos15091119
Submission received: 31 July 2024 / Revised: 4 September 2024 / Accepted: 12 September 2024 / Published: 14 September 2024
(This article belongs to the Section Meteorology)

Abstract

:
The present work is focused on the validation of the urban canopy scheme TERRA-URB, implemented in ICON weather forecast model. TERRA-URB is used to capture the behavior of urbanized areas as sources of heat fluxes, mainly due to anthropogenic activities that can influence temperature, humidity, and other atmospheric variables of the surrounding areas. Heat fluxes occur especially during the nighttime in large urbanized areas, characterized by poor vegetation, and are responsible for the formation of Urban Heat and Dry Island, i.e., higher temperatures and lower humidity compared to rural areas. They can be exacerbated under severe conditions, with dangerous consequences for people living in these urban areas. For these reasons, the need of accurately forecasting these phenomena is particularly felt. The present work represents one of the first attempts of using a very high resolution (about 600 m) in a Numerical Weather Prediction model. Performances of this advanced version of ICON have been investigated over a domain located in southern Italy, including the urban metropolitan area of Naples, considering a week characterized by extremely high temperatures. Results highlight that the activation of TERRA-URB scheme entails a better representation of temperature, relative humidity, and wind speed in urban areas, especially during nighttime, also allowing a proper reproduction of Urban Heat and Dry Island effects. Over rural areas, instead, no significant differences are found in model results when the urban canopy scheme is used.

1. Introduction

Modern cities, the fulcrum of the development of civilization, play a dual role in the fight against climate change: on one side they are a relevant source of anthropogenic emissions, on the other one they can act as a laboratory to mitigate climate change through measures taken by local political decision makers on the basis of local needs, given that the urban fabric determines the response to extreme weather stresses. Since the decision-making chain of local politicians is short compared to central governments, the solutions identified can be applicable in the short term and easily identifiable, and in practice, they can act as incubators of practical solutions to be exported on a large scale and in comparable contexts. The last IPCC report also recognizes the role of urban areas, since urban systems are critical for achieving deep emissions reductions and advancing climate resilient development [1]. In urban areas, climate change causes adverse impacts on human health, livelihoods, and key infrastructure, in particular because extremely hot temperatures have intensified in cities [1].
While cities are growing, land use is changing along with source/sink of greenhouse-gas emissions. From a numerical modeling point of view, this has an effect on the way the heat is exchanged with atmosphere, and should be taken in account, with a representation able to capture the urban physics and associated urban–climatic effects, including urban heat islands.
In Numerical Weather Prediction (NWP) models, Land Surface Schemes are devoted to couple soil and atmosphere energy (with mass and moisture fluxes exchanges) constituting the lower boundary condition of atmospheric models; however, the representation of interactions between land and atmosphere in the models is still challenging [2]. A wide range of studies in recent decades have demonstrated the substantial impact that the land surface has on the quality of NWP in the lower atmosphere. An aspect widely investigated is the urban contribution to the energy exchanges in the land surface coupling [3]: Urban Land Surface Models (ULSM) take in account the impact of cities and urban areas on regional weather and climate models, for example, Urban Heat Island (UHI) and the related heat stress issues on human health, and also urban-induced effects on weather events [4].
Physical phenomena related to UHI, with the first research paper by Howard [5] on the London UHI in 1833. Chandler [6] successively correlated pulsating winds with temperature gradients, though a systematical work with a description of phenomena was found in the research by Oke [7,8], in which an early model based on energy balance was depicted, identifying the main contributors to UHI: a less stable atmosphere due to city structure (i.e., urban canopy); the anthropogenic nature of artificial heat pumped in atmosphere; the water balance difference with respect to rural areas due to different evotranspiration; air pollution; or an urban haze dome, which modifies the radiation component fluxes. Several ULSM schemes are currently available, which model physics and involve parameters that describe land cover, morphology, geometry, radiative, and thermal properties. A review of urban schemes can be found in Campanale et al. [9]. In particular, Trusilova [10] showed the importance of using the urban land parameterization in the model simulations at fine spatial scales and that, due to the increasing resolution of numerical models, it was necessary to update, understand, and integrate natural processes in urban canopy models to correctly capture water storage and thermal and radiative characteristics [11]. In the work of Li et al. [12], the effects of UHI during an heat wave on the urban dwellers were also highlighted.
In the present work, an advanced version of the NWP ICON (ICOsahedral Non-Hydrostatic) model that includes also the TERRA-URB scheme has been employed. TERRA-URB is a bulk parameterization scheme developed through several steps within the COSMO (COnsortium for Small scale MOdeling) model, with the aim of bridging the gap between bulk urban land-surface schemes and 3D explicit canyon schemes [13], preserving computational costs. Relevant developments of this scheme have been carried out within the COSMO PT AEVUS (Analysis and Evaluation of Urban Scheme) and AEVUS2 projects [14]. Successively, within the migration process from the COSMO to ICON model, the TERRA-URB scheme has been implemented in the latter code, following the developments of the project CITTA (City Induced Temperature change Through Advanced modeling) [15].
Due to the rise of computational power in last years, NWP models are able to operate towards hectometric grid spacings, leading to an improved representation of atmospheric processes over complex terrains [16]; in fact, some recent works show results obtained on grids at 500 or 300 m by using the WRF model [17,18]. The novelty of the present research is related to the application of TERRA-URB, still under validation, within ICON model, employing a very high resolution grid over a domain with special features, such as sea, plane lands, and complex orography. In particular, the present work represents, within the framework of ICON simulation over Italy, one of the first attempts of using a hectometric scale (cell size of about 600 m), since generally, resolutions in the order of kilometers are employed. In fact, LSM, and hence ULSM, are applied to large scale modes and validation data are often unavailable at so high resolution [2]. The need of fine grid sizes coupled with a model able to describe complex phenomena was also stressed in a recent article, which verified the difference of thermal zone in the same cities, simply due to different tree ages [19]. The performances of this advanced version of ICON have been investigated in the present work over a domain located in southern Italy including the city of Naples. The urban area of Naples is not limited to the boundaries of the city, but rather, it merges with the neighboring municipalities without interruption and extends far beyond, reaching and exceeding the borders of the neighboring provinces; in fact, it is an area characterized by strong conurbation with Caserta town, along with a very high population density and scarcity of green areas. The Italian Association for the development of industry in southern Italy (SVIMEZ) call properly of the Neapolitan Metropolitan Area, where 4,434,136 people lives on 2300 kmq, and it includes also parts of Caserta and Salerno provinces.
This paper is organized as follows: Section 2 contains a description of the ICON model and related parameterizations, with particular emphasis on TERRA-URB. Section 3 describes the test case considered, while Section 4 describes the data for model evaluation. In Section 5, results related to model evaluation are presented, while in Section 6, a deep investigation of the UHI and UDI (Urban Dry Island) is presented. Finally, Section 7 reports a general discussion of results strengthened by comparison with literature works while the main conclusions are provided in Section 8.

2. ICON Model

In 2018, the COSMO consortium started migrating from COSMO-LM to ICON as the operational model. ICON employs an unstructured grid made up of regular icosahedra (containing 20 triangular faces) and is characterized by exact local mass conservation and mass consistent tracer transport [20]. The computational grid originates from an icosahedron (which wraps the entire Earth’s surface), whose sides were initially divided into n parts, followed by k edge bisections. The dynamical core is formulated on an icosahedral-triangular Arakawa C-grid, while the time integration is performed with a two-time level predictor–corrector fully explicit scheme. Time splitting is applied between the dynamical core and tracer advection, physics parameterization and horizontal diffusion. The physics-dynamic coupling is performed at constant density ( ρ ) rather than pressure, since ρ is a prognostic variable, whereas pressure is only diagnosed for parameterization, hydrostatically integrated. The fast physics parameterizations were inherited from the COSMO model, except for the saturation adjustment. The cloud micro-physics scheme is an extended version of the one used by COSMO over the European domain (COSMO-EU), with modification of cloud–ice sedimentation. The turbulence scheme has undergone some revisions in ICON to improve stability under extreme conditions. In NWP models, Land Surface parameterization schemes are used to describe the interface between the atmosphere, soil, and vegetation, focusing on a proper representation of the energy and mass fluxes exchanges. In ICON specifically, the multi-layer land surface model TERRA-ML [21] is adopted to describe such processes; in fact, for each grid cell, TERRA-ML calculates the energy and water fluxes and soil moisture, by including the most important factors like orography, soil type, and land use All processes are modeled one-dimensionally vertically, so that no lateral interactions between adjacent soil columns are considered. The TERRA-ML scheme has also been extended with a multi-layer snow scheme and tile-based approach accounting for subgrid scale land-cover variability. Slow physics processes schemes were imported from the ECMWF Integrated Forecast System (IFS) [22]. Since simulations are initialized with horizontally interpolated data, a tile “cold-start” approach is employed, where each tile is initialized with the same cell averaged value, and the initial values with a guess from a run without tiles.
The parameterization schemes for non-resolved physics are listed below:
  • Turbulent diffusion: TURBDIFF [23] is the Turbulence closure for subgrid scale processes, based on a second-order statistical moment, which is the main contributor to diurnal variations within the Atmospheric Boundary Layer like daytime heating and mixing, nocturnal cooling. TURBDIFF is related to TURBTRAN [24], the formulation of turbulent Surface-to-Atmosphere Transfer, which integrates the vertical flux gradient between the top of the roughness layer and the lowest atmospheric boundary layer above. This turbulence scheme is the standard one of ICON and describes separated turbulence interacting with non-turbulent circulations, which allows for a consistent application of turbulence closure assumptions, even though other subgrid scale processes may be dominant within the grid cell.
  • Radiation: optical properties parameterizations for each atmospheric component and the surface with a radiation solver based on ecRad scheme [25], which evaluates radiation traveling through optical medium;
  • Cloud Microphysics: describes the formation, growth, and sedimentation of water particles. The single moment scheme is implemented, presented in Lin et al. [26] and Rutlege et al. [27], which predicts the specific mass content of cloud water, rain water, cloud ice, and snow with an additional graupel category;
  • Cumulus Convection: the Tiedtke–Bechtold scheme [28,29] is adopted, which simulates shallow, mid-level, and deep convection. The largest clouds are resolved by model, while the scheme is switched off for deep and mid-level convection, since grid cell size is below 1 km;
  • Non-orographic gravity wave drag: the scheme is based on Orr et al. [30], for the simulation of waves generated by convection, fronts, jet-stream, turbulence;
  • Subgrid scale orographic drag: the scheme is based on Lott and Miller [31] and simulates governing flow pattern around sufficiently high subgrid orography, with low-level flow blocking;
  • Cloud cover: the diagnostic Kohler scheme [32] takes into account the subgrid variability of water and the associated distribution in water vapor, cloud liquid water, and cloud. This cloud information is then passed to the radiation, where additional assumptions are made on the vertical overlap of clouds ice.
ICON model uses specific data from various datasets, which are aggregated into the external parameters file. Specifically, the classification of the Land Use in the region considered is based on the GLOBCOVER 2009 global land cover map, which contains the classification of a time series of global MERIS Full Resolution mosaics for the year 2009. The global land cover map includes 22 classes defined according with the United Nations (UN) Land Cover Classification System (LCCS) [33]. The orography is derived from the highly resolved non-global topography “ASTER” dataset. Anthropogenic Heat Fluxes are derived from Flanner [34]. The Impervious Surface Area (ISA), which defines the sealed fraction within a tile data, is provided by GLC2009 land cover dataset.

The Bulk Urban Canopy Scheme: TERRA-URB

The urban parameterization scheme TERRA-URB (TU in the following) allows an intrinsic representation of urban physics by modifying input data, considering the effects of buildings, streets, and other human-made impervious surfaces. TU implements the Semi-empirical Urban canopy parametrization (SURY) [13], which translates canopy parameters into bulk parameters while preserving the low computational cost. During the COSMO Priority Tasks AEVUS and AEVUS 2 [14], the TU parameterization in the COSMO model was demonstrated to be able to reproduce the key urban meteorological features. For this reason, in the framework of the mentioned transition process to the ICON model, TU has been implemented in ICON too. Figure 1 shows an overview of the physical phenomena modeled in the TU scheme.
The implementation of TU in ICON influences and modifies the energy exchanges between urban surface and atmosphere, due to the implementation of new developments having an impact on different schemes, such as the upgrade in the radiation scheme with new radiative urban albedo and emissivity, the turbulent transfer scheme, where surface drag was updated by the type of bluff-body thermal roughness length parameterization [36], and the enhancement in the land surface scheme ground heat and capacity and thermal transport as by [37]. Moreover, in the TU scheme, new developments have impacts on the type of evaporation from bare soil. Infiltration and evaporation over impervious surface areas are set equal to zero, all precipitation goes into surface runoff and takes in account the formation of puddles on impervious surface areas. Finally, the urban anthropogenic heat flux, i.e., heat source from surface to atmosphere due to human activities, is currently modeled as an additional constant heat flux, based on the work of Flanner [34]. Further enhancements and tests are currently ongoing and will be shown in future works.

3. The Test Case Considered

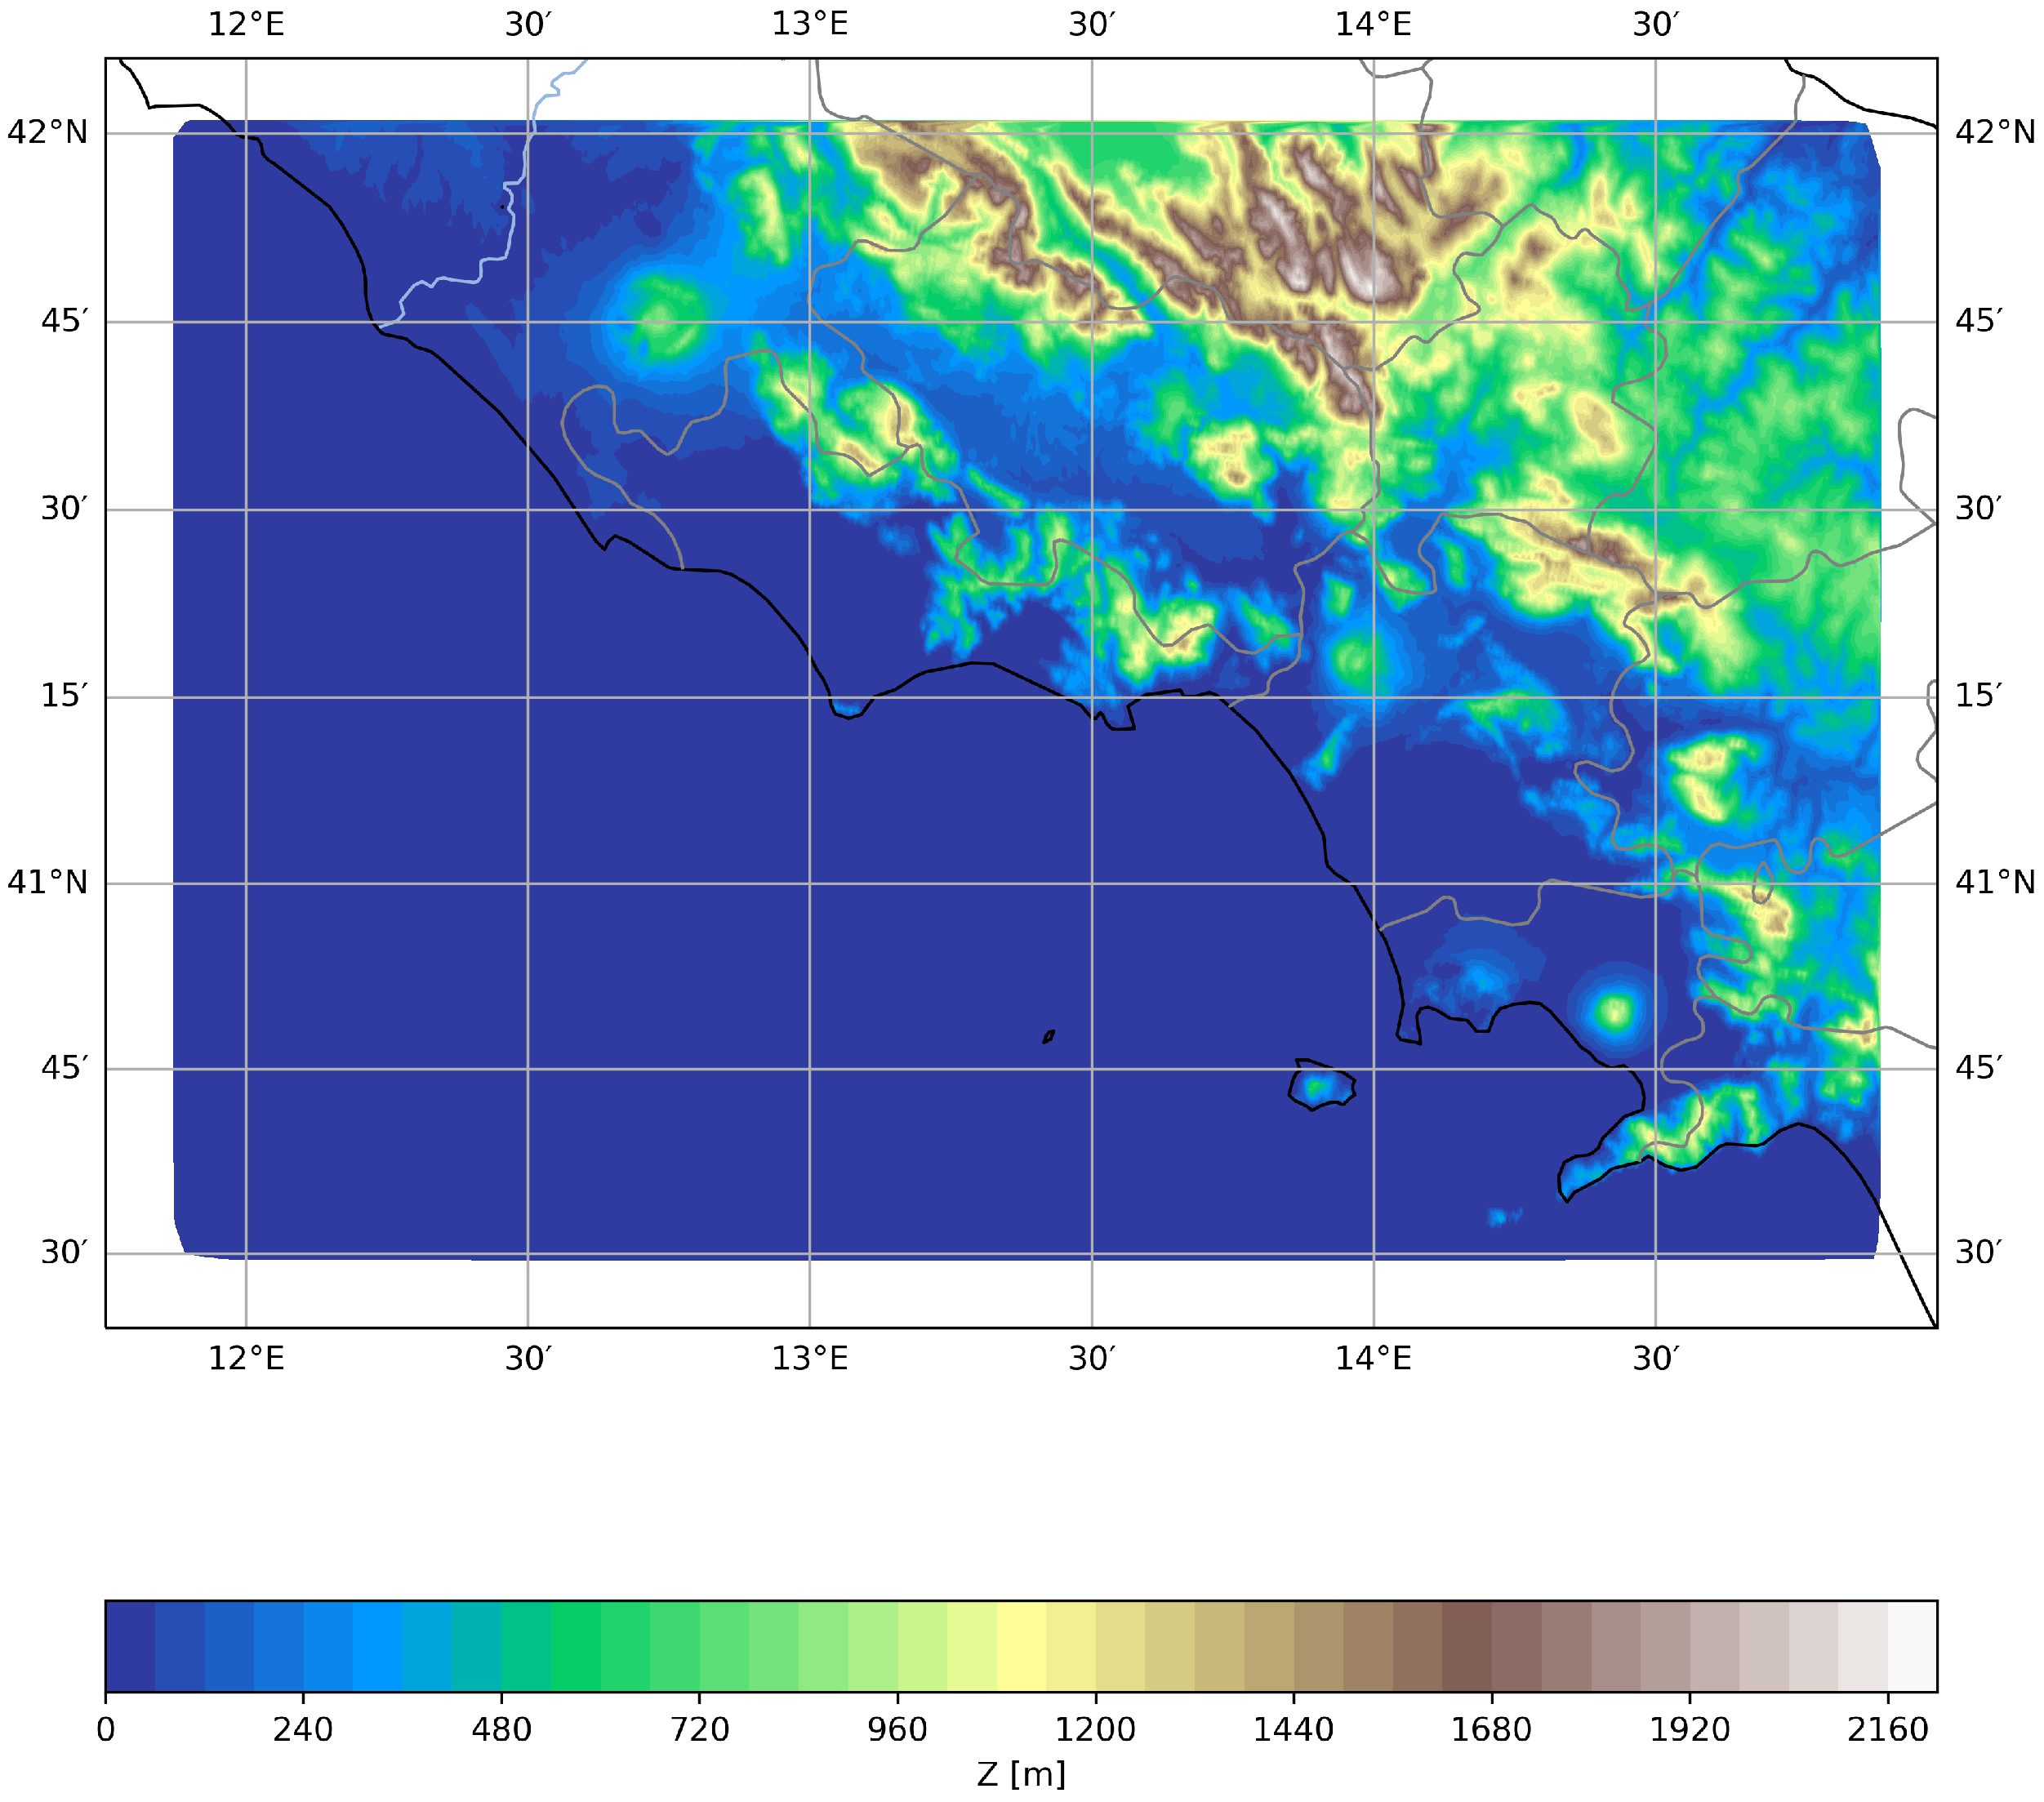
The domain of interest is located in southern Italy and includes the northern part of the Campania region and the southern part of Lazio, with the Tirrenian sea being positioned on the western side of the domain (Figure 2). It is ideally subdivided into two climate areas, a mild zone under the influence of the sea and a colder internal zone characterized by the presence of mountains. The computational grid adopted is characterized by 109,860 cells, with a horizontal resolution of about 600 m (grid R02B12), which originates from a grid at 1200 m applying a further bisection. In the vertical direction, the grid has 65 levels and extends from the soil up to 22 km, with the first level being positioned at 20 m.
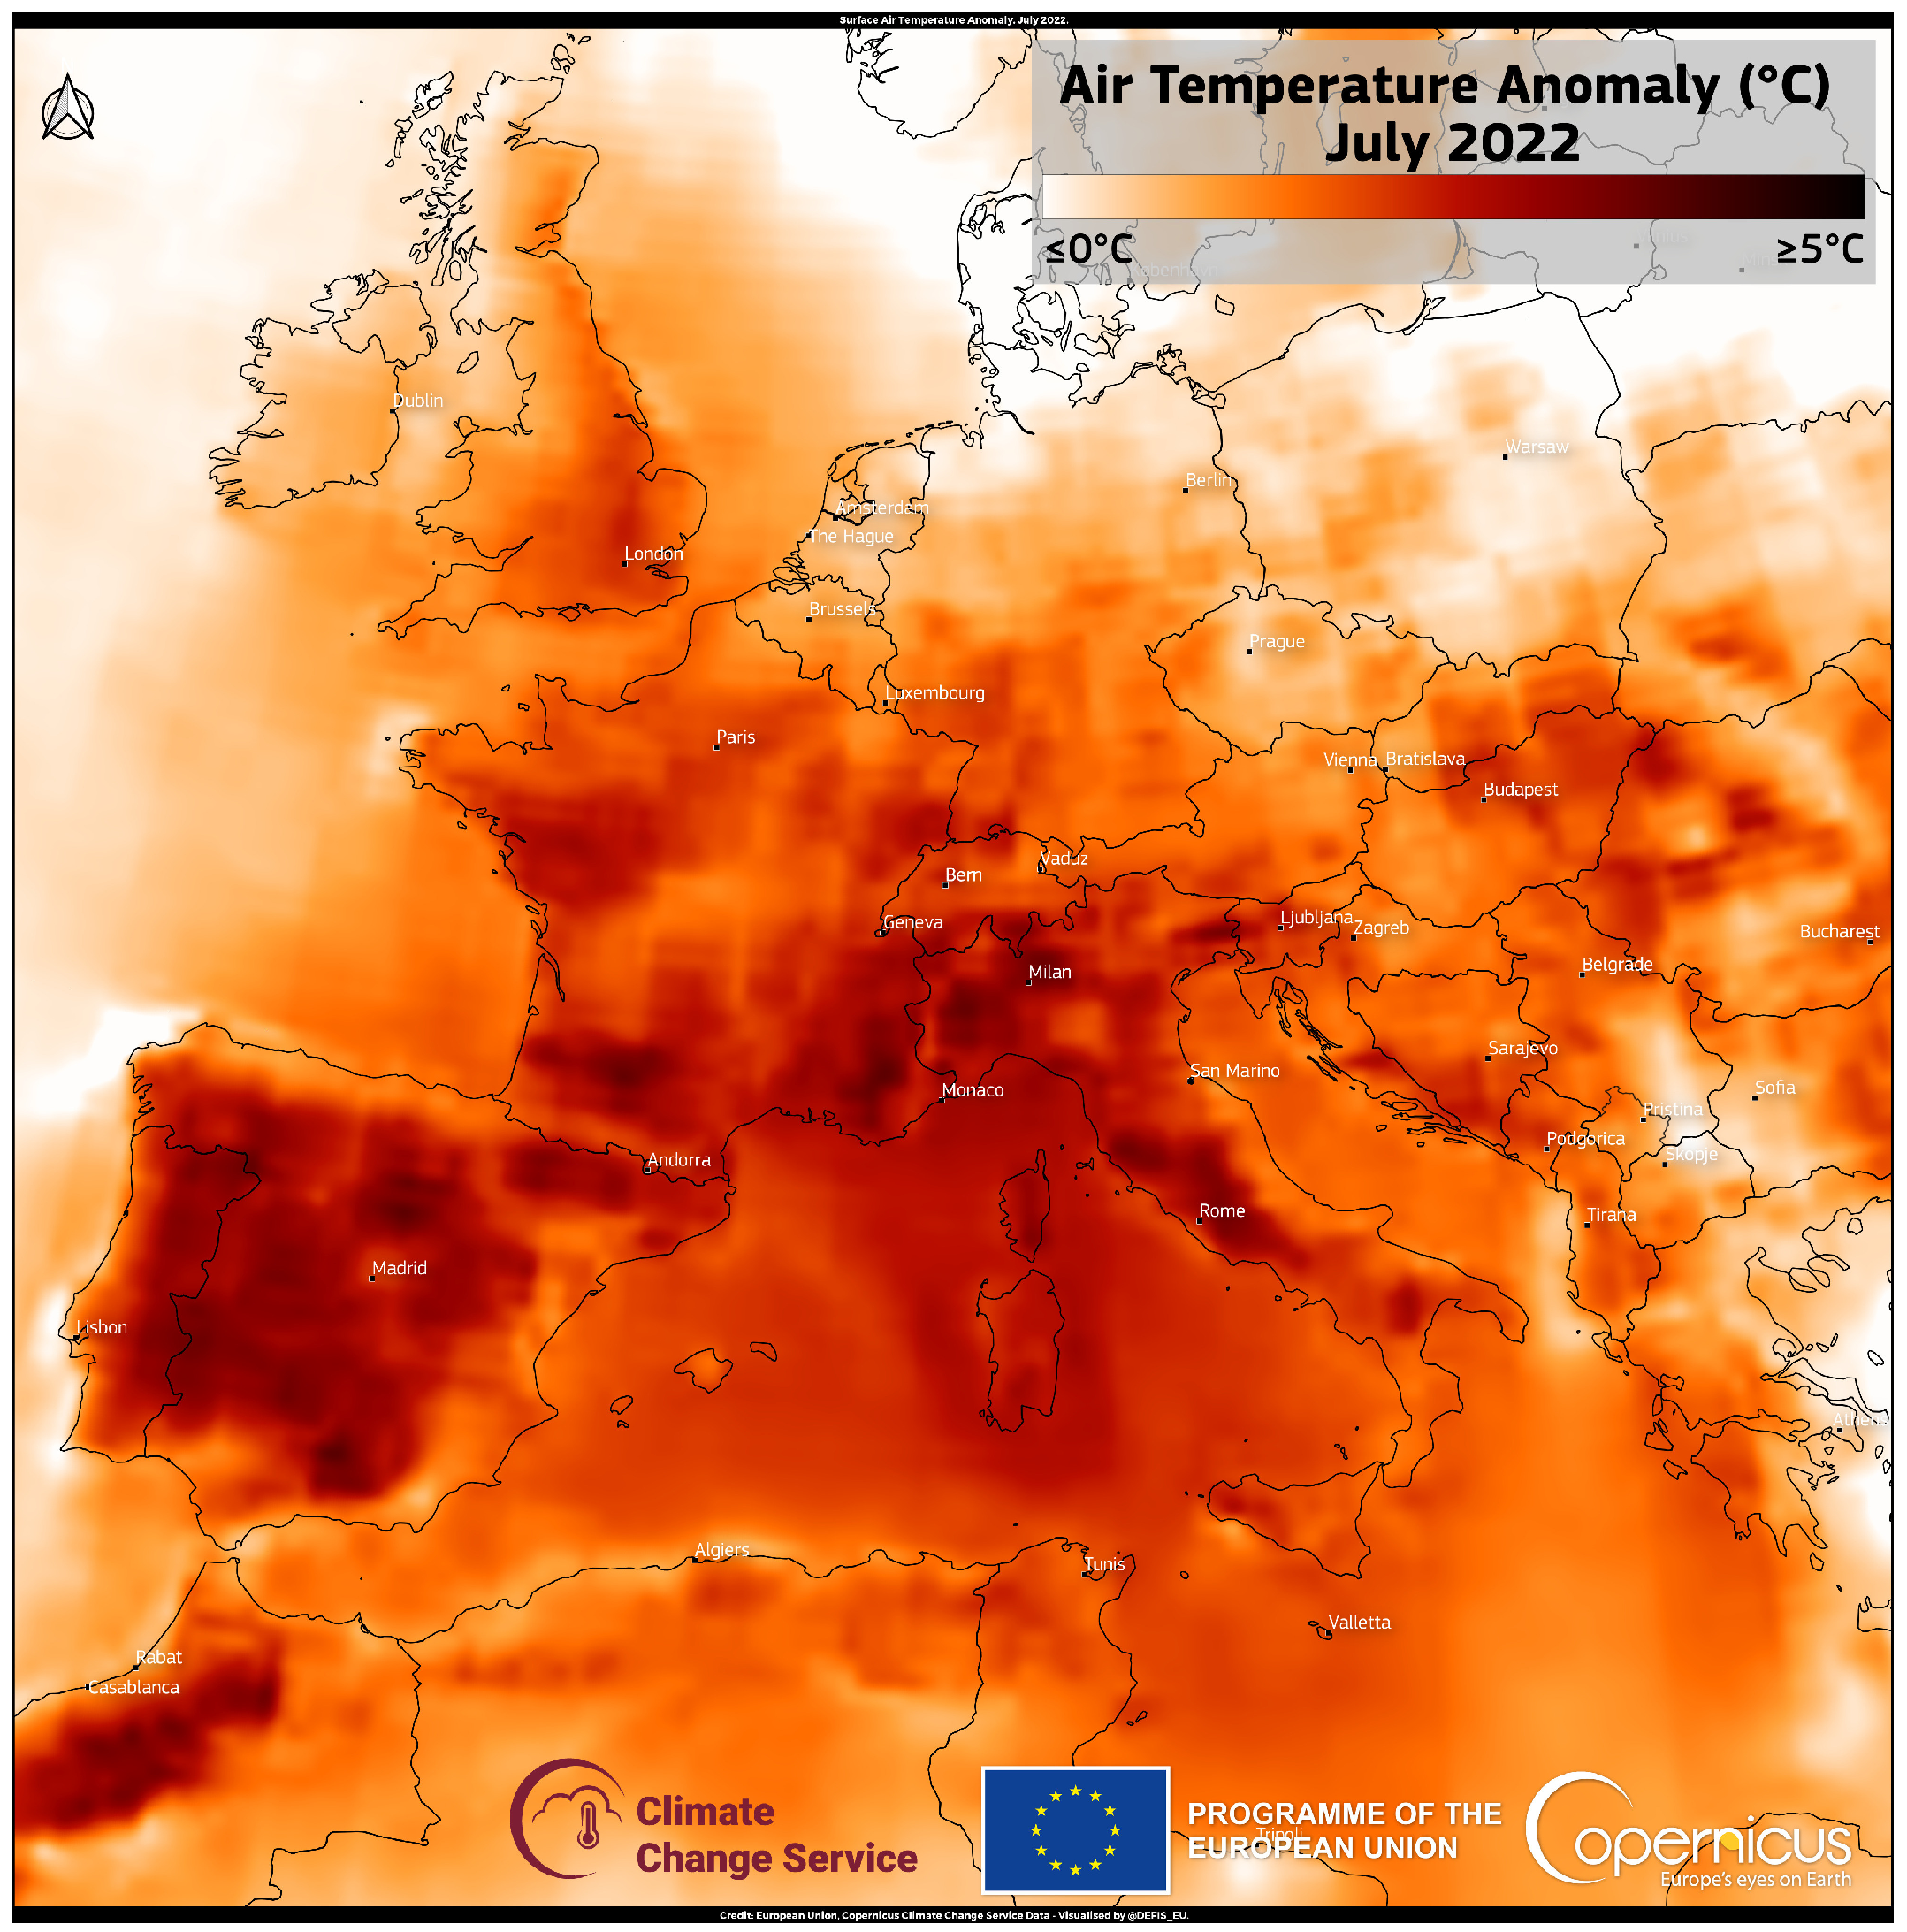
The period considered for the present investigation is the week 18–24 July 2022, characterized by extremely high temperature, calm and dry weather that gave rise to a very pronounced UHI [9]; indeed, several heat waves hit the whole Europe from June to August 2022. As an example, the surface air temperature anomaly of July 2022, month on which this work focuses, is depicted in Figure 3.
A series of daily 30-h forecast analysis has been performed: each simulation starts at 18 UTC of the previous day and ends at 24 UTC of the considered day. It should be noted that, in the post-processing stage, the first 6 hours of forecast are discarded to avoid the influence of the spin-up time on the result statistics. Boundary conditions are obtained from the ECMWF IFS model [22] at a frequency of 3 h, while initial conditions with soil climatology have been read from ICON global model simulations performed at DWD (Germany).
The simulations were performed on the CIRA server ’Turing’, an HPC cluster, based on the RedHat Enterprise Linux v7.3 Operating System, equipped with 40 Intel Xeon E5-2697 nodes, for a total of 1440 cores, interconnected by means of an Intel Omni-Path network at 100 Gbits. The ICON release installed was the 2.6.5, compiled with Intel Parallel Studio 2020 XE update 4 with MPI intel libraries.

4. Data for Model Evaluation

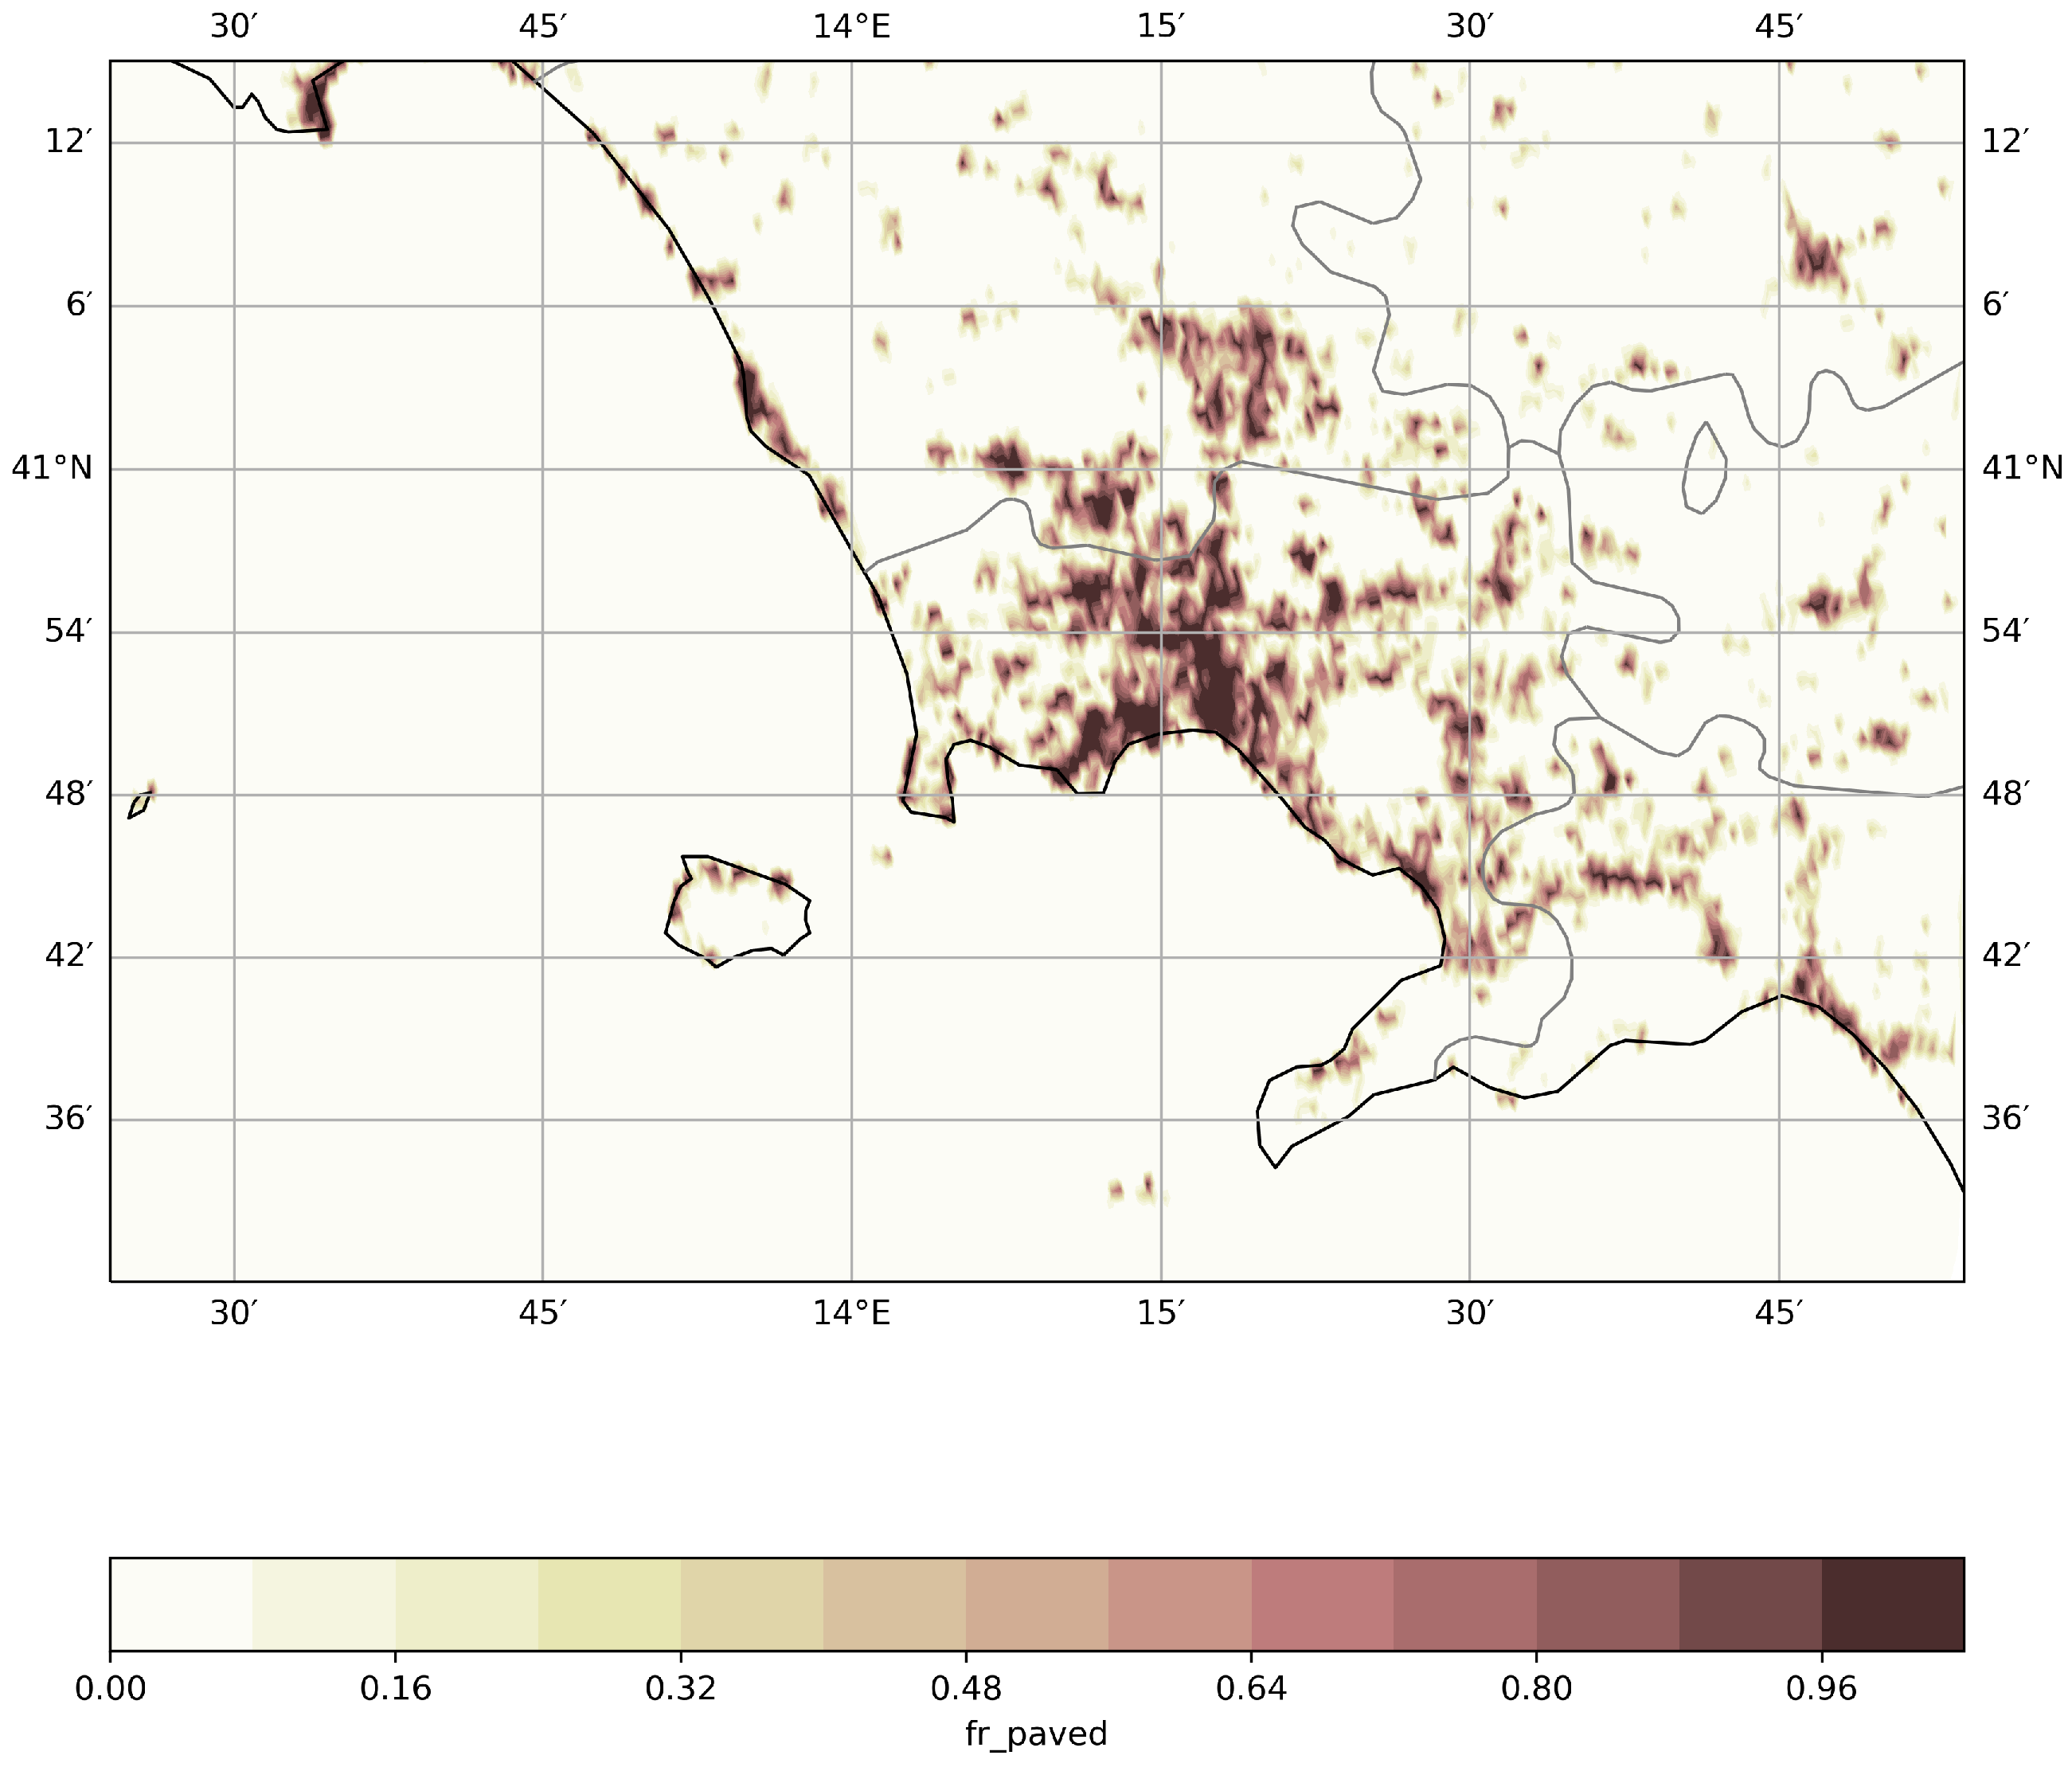
The ground stations data employed to validate the numerical model are made available from the Meteo Italian Supercomputing Portal [38]. These stations are included in the box defined as 12.00–14.75 E, 40.5–41.5 N. The box is shown in Figure 4, along with the ICON urban paved fraction contour.
Data have been pre-processed by applying a spatial filtering to select stations and a quality filtering to check if each station has recorded a meaningful quantity of data for the proposed analyses. Hence, stations have been filtered out when missing data were above 30%:
  • Temperature at 2 m (T2m): 57 of 82 stations passed; final miss data: 1.3%
  • Relative Humidity at 2 m (Rh2m): 25 of 49 stations passed; final miss data: 2.9%
  • Wind speed at 10 m (WS10m): 36 of 48 stations passed; final miss data: 7.3%
  • Wind direction at 10 m (WD10m): 33 of 48 stations passed; final miss data: 5.2%
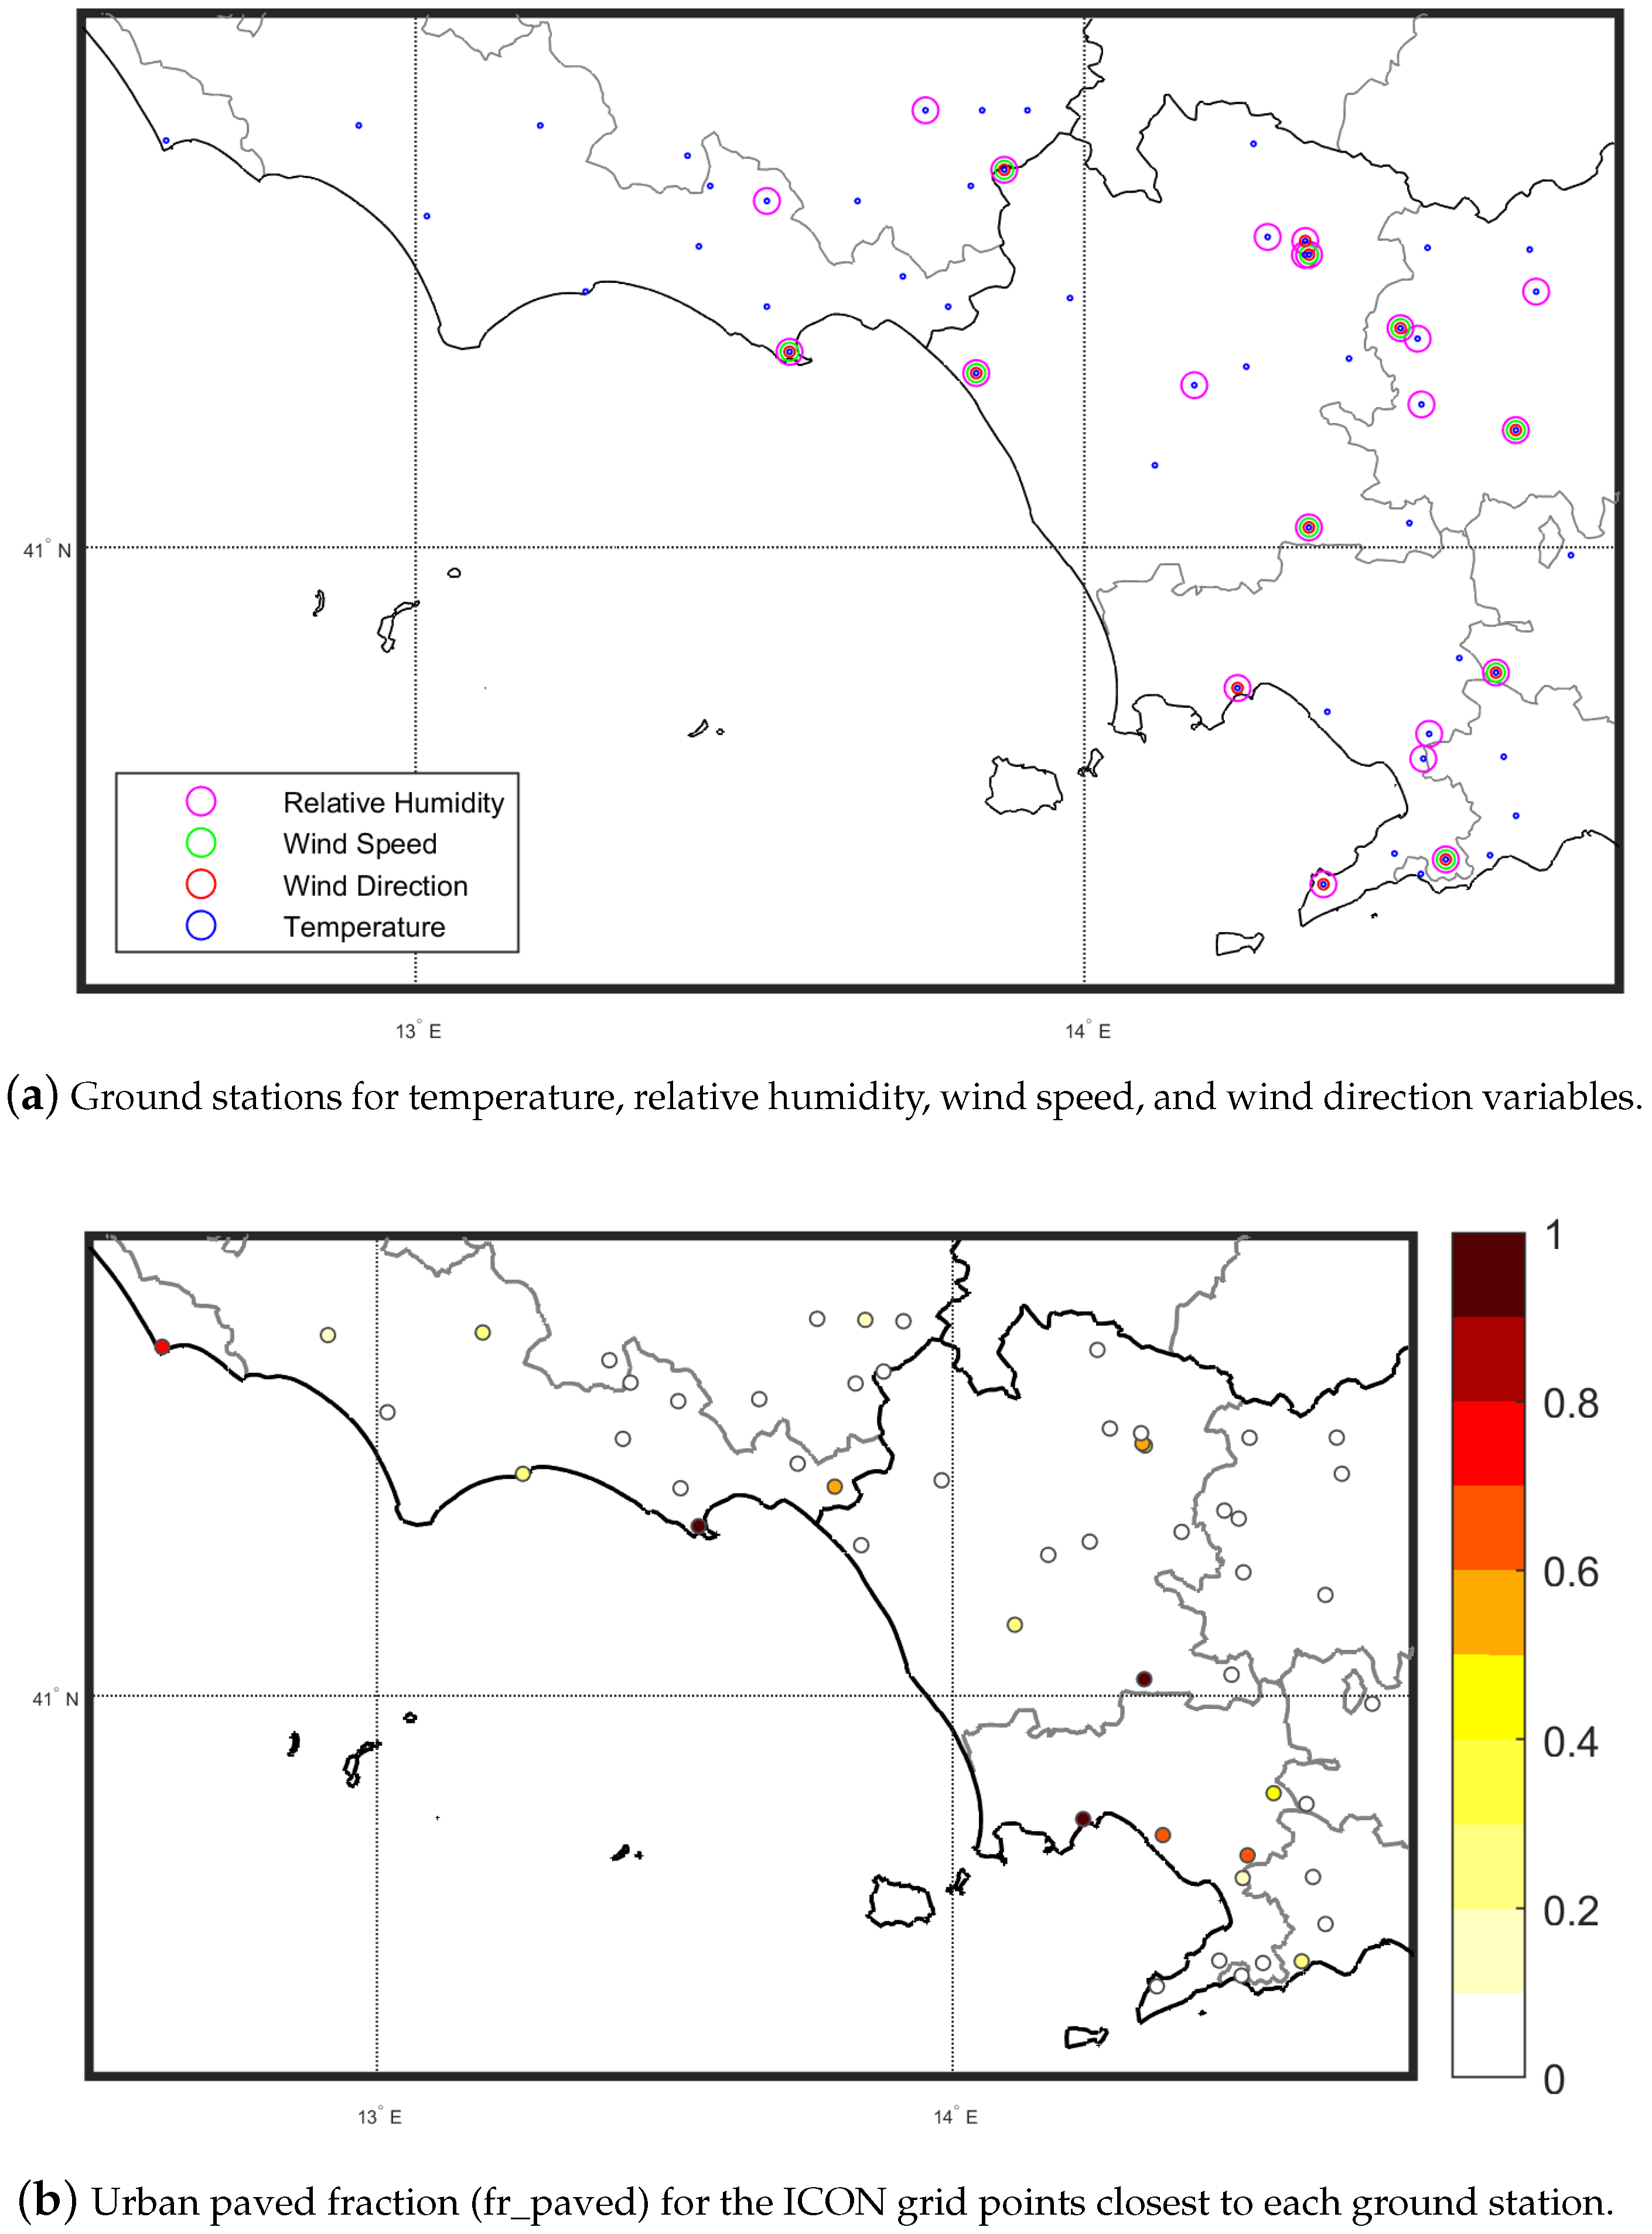
The position of the ground stations inside the validation domain, along with the atmospheric variables provided, i.e., temperature, relative humidity, wind speed, and wind direction, is shown in Figure 5a. Figure 5b shows the urban fraction sampled from the ICON map (see Figure 4) in the cell centers closest to each ground station. Most of the stations are characterized by a fraction lower than 0.25 and can be considered as rural. Conversely, only a few stations fall within a cell with a fraction larger than 0.8, here considered as urban.

5. Validation Results

In this section, a general evaluation of model performances is presented, in order to assess the capabilities of the selected model configuration in reproducing the main atmospheric variables over the considered area. Moreover, the influence of TU scheme has been investigated.

5.1. Score Metrics

The objective quantification metrics adopted have been derived from the statistical terms of the Taylor diagram: correlation value ( ρ ), Centered Root Mean Square Error (CRMSE), standard deviation ratio (STD_RATIO), and mean error (BIAS) defined as follows:
ρ = j ( F j F ¯ ) ( O j O ¯ ) j ( F j F ¯ ) 2 j ( O j O ¯ ) 2
C R M S E = 1 N j ( ( F j F ¯ ) ( O j O ¯ ) ) 2 1 N j | O j O ¯ | 2
S T D _ R A T I O = 1 N j | F j F ¯ | 2 1 N j | O j O ¯ | 2
B I A S = 1 N j ( F j O j )
where F j and O j are, respectively, the model output and corresponding observed value in the generic cell j, F ¯ and O ¯ are, respectively, the average model and observed values, and N is the number of grid cells.

5.2. General Evaluation against Ground Stations

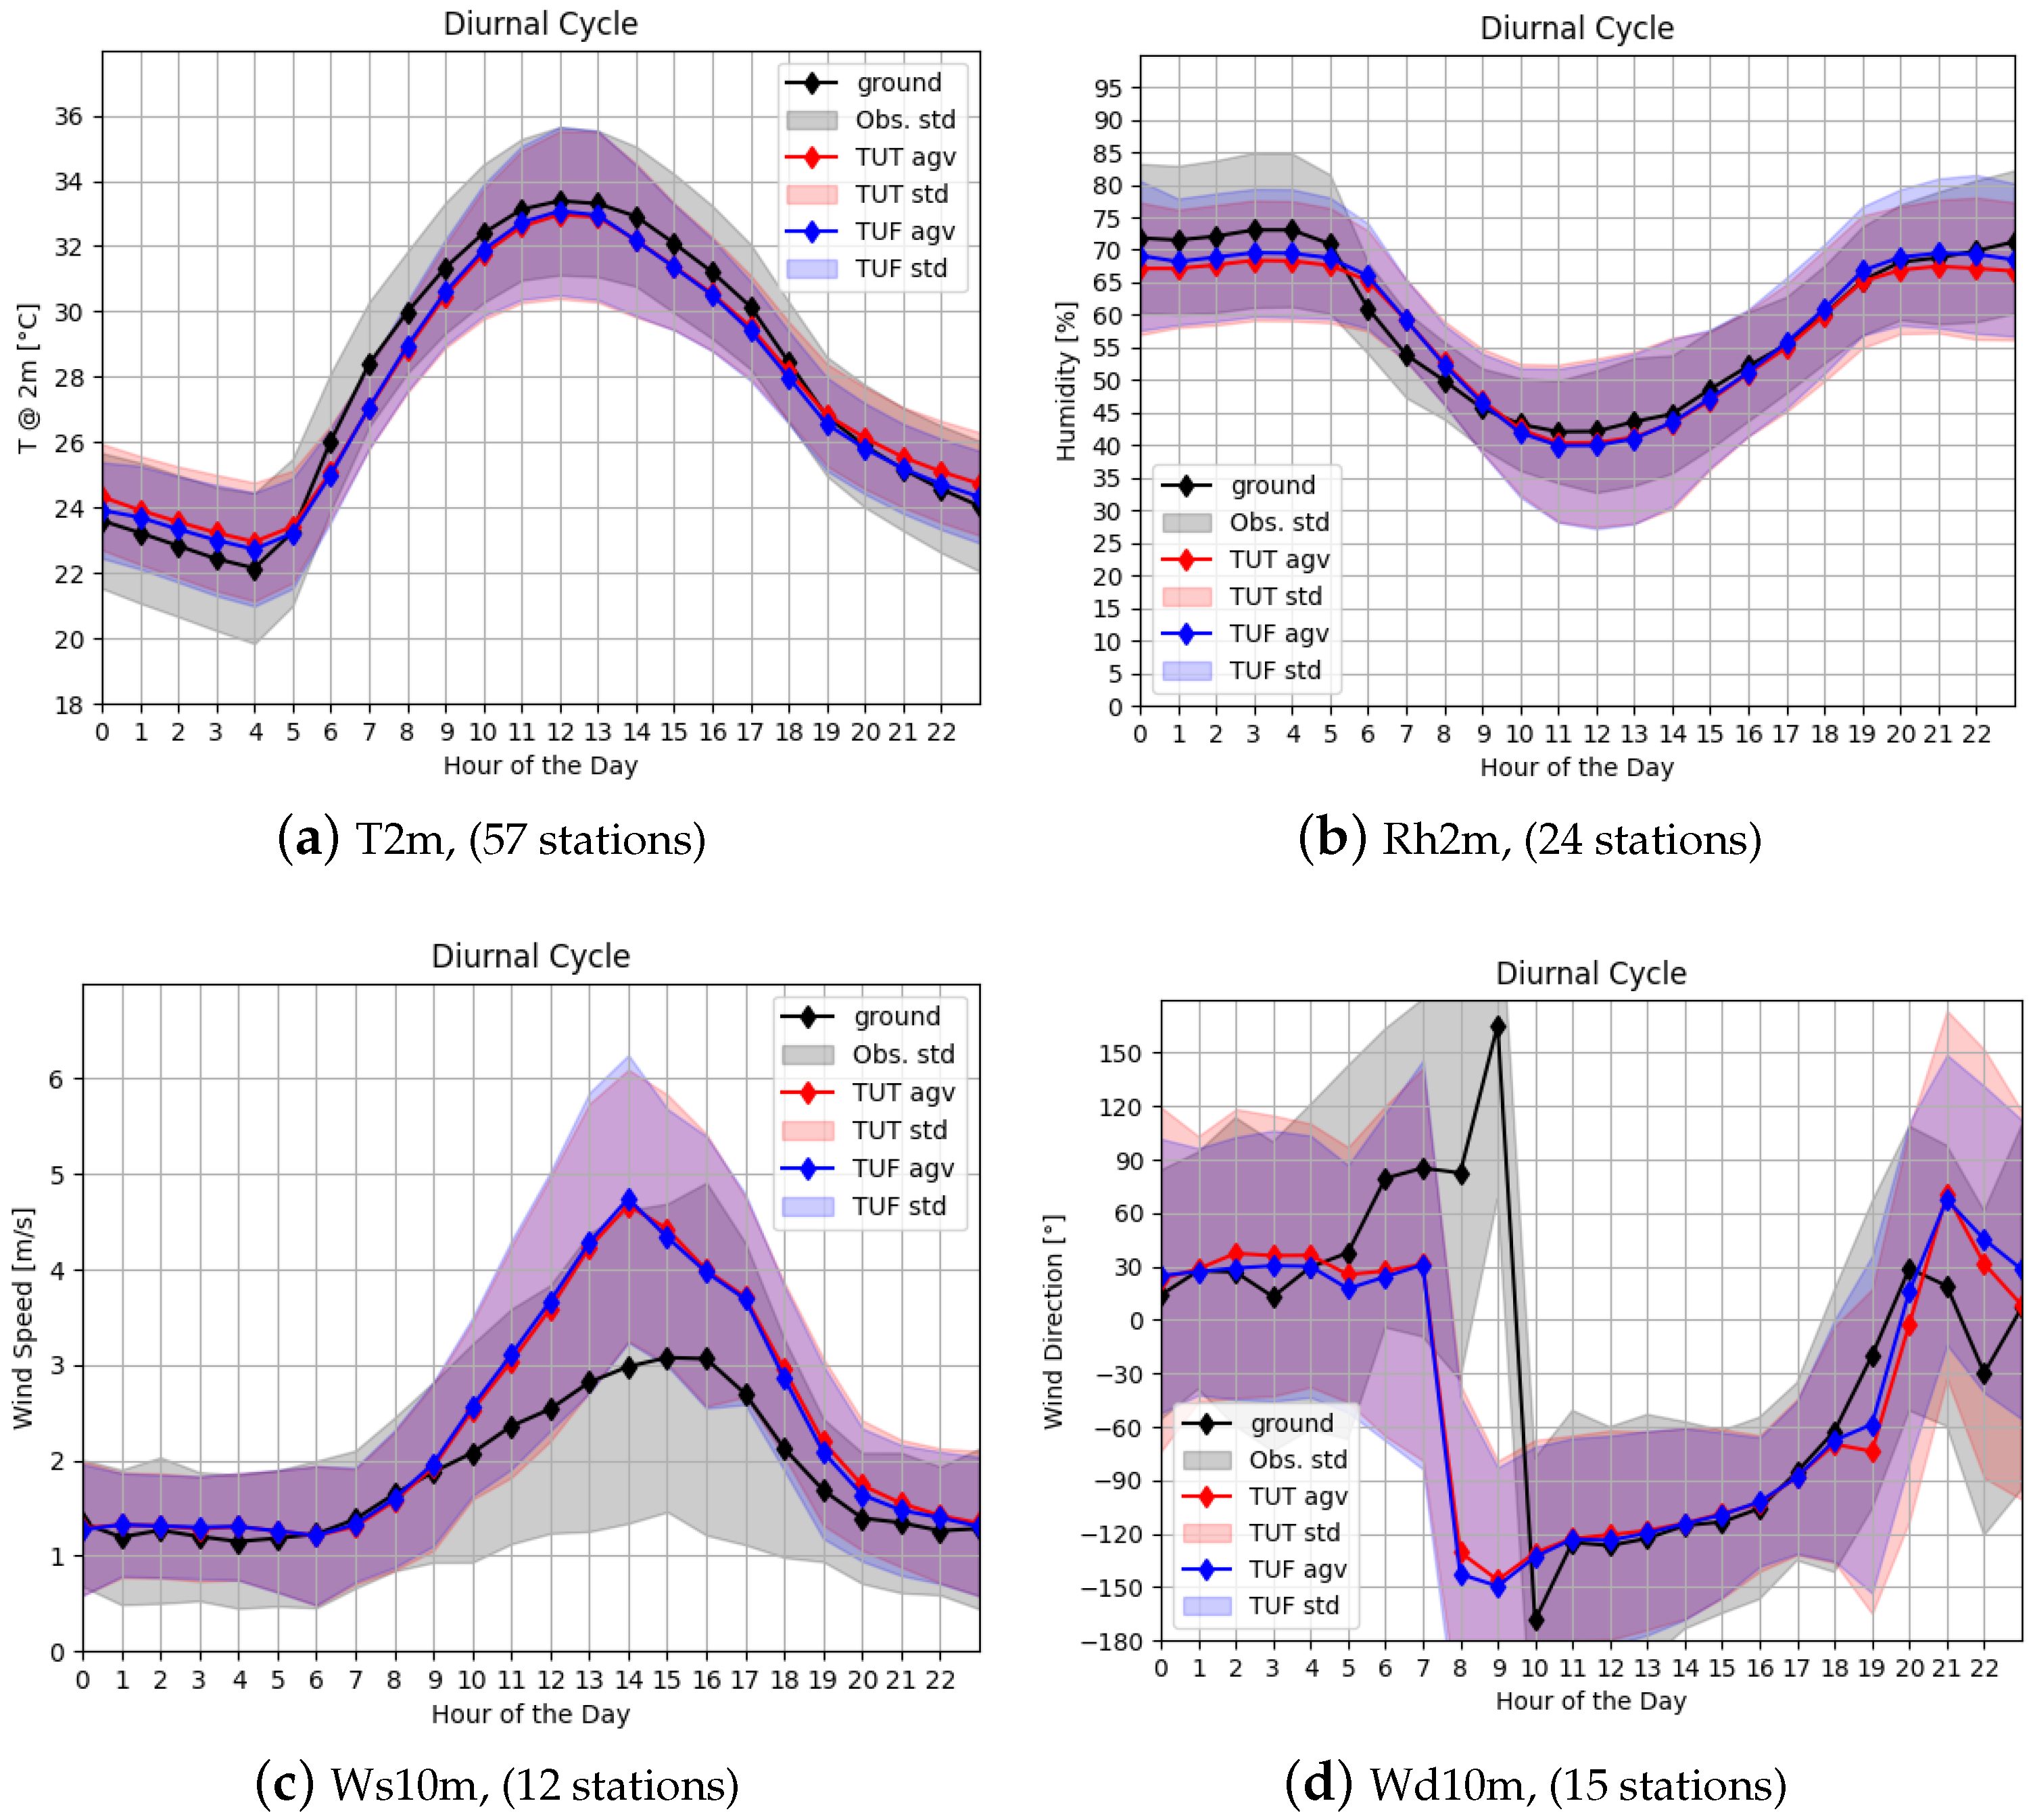
The first evaluation has been performed comparing model output with ground station data for each of the selected variables, considering the nearest grid point. Results have been averaged over all the stations available, regardless of their urban fraction value. Figure 6 shows the diurnal cycles of the variables considered, averaged over the seven days of the proposed week, along with their standard deviations: observational values are represented by black lines, ICON data are represented by red lines (TU scheme on—TUT) and blue lines (TU scheme off—TUF). Standard deviations are highlighted by shaded areas, with the same colors. Furthermore, the number of stations is reported in the captions.
Figure 6a shows the 2-meter temperature (T2m) diurnal cycle, which reveals an excellent agreement between model and observations: in particular, TU on is quite similar to TU off in the central hours of the days, while it is characterized by a warm bias during nighttime. A possible explanation is the difficulty of ICON in proper representing the nocturnal cloud cover, which holds the heat irradiated by the terrestrial surface. The poor vegetation representation of TERRA-ML land scheme results in an underestimation of the amplitude of diurnal cycles, here noticeable during night hours for both TU on and off, as noted also in [39].
Figure 6b shows the 2-meter relative humidity (Rh2m) diurnal cycle; for this variable, both simulations are able to capture the daily variability, with a slight underestimation especially during nighttime, which could be related with inexact soil humidity.
Figure 6c, shows the diurnal cycle of 10-meter wind speed (Ws10m): the model shows a very good agreement during nighttime, but largely overestimates in the central hours of the day. Good model performances are achieved in terms of wind direction (Wd10m) (Figure 6d) for the whole day, with the exception of hours between 5 and 10 a.m., when ICON predicts an earlier wind direction change. No relevant differences between the two schemes are recorded for both wind speed and direction. The representation of wind speed will be enhanced by improving the Planetary Boundary Layer (PBL) parameterization schemes, in particular with reference to a term for the prognostic turbulent kinetic energy and the description of the minimal diffusion coefficient. These modifications will become operational in the near future.

5.3. Urban Scheme Effects

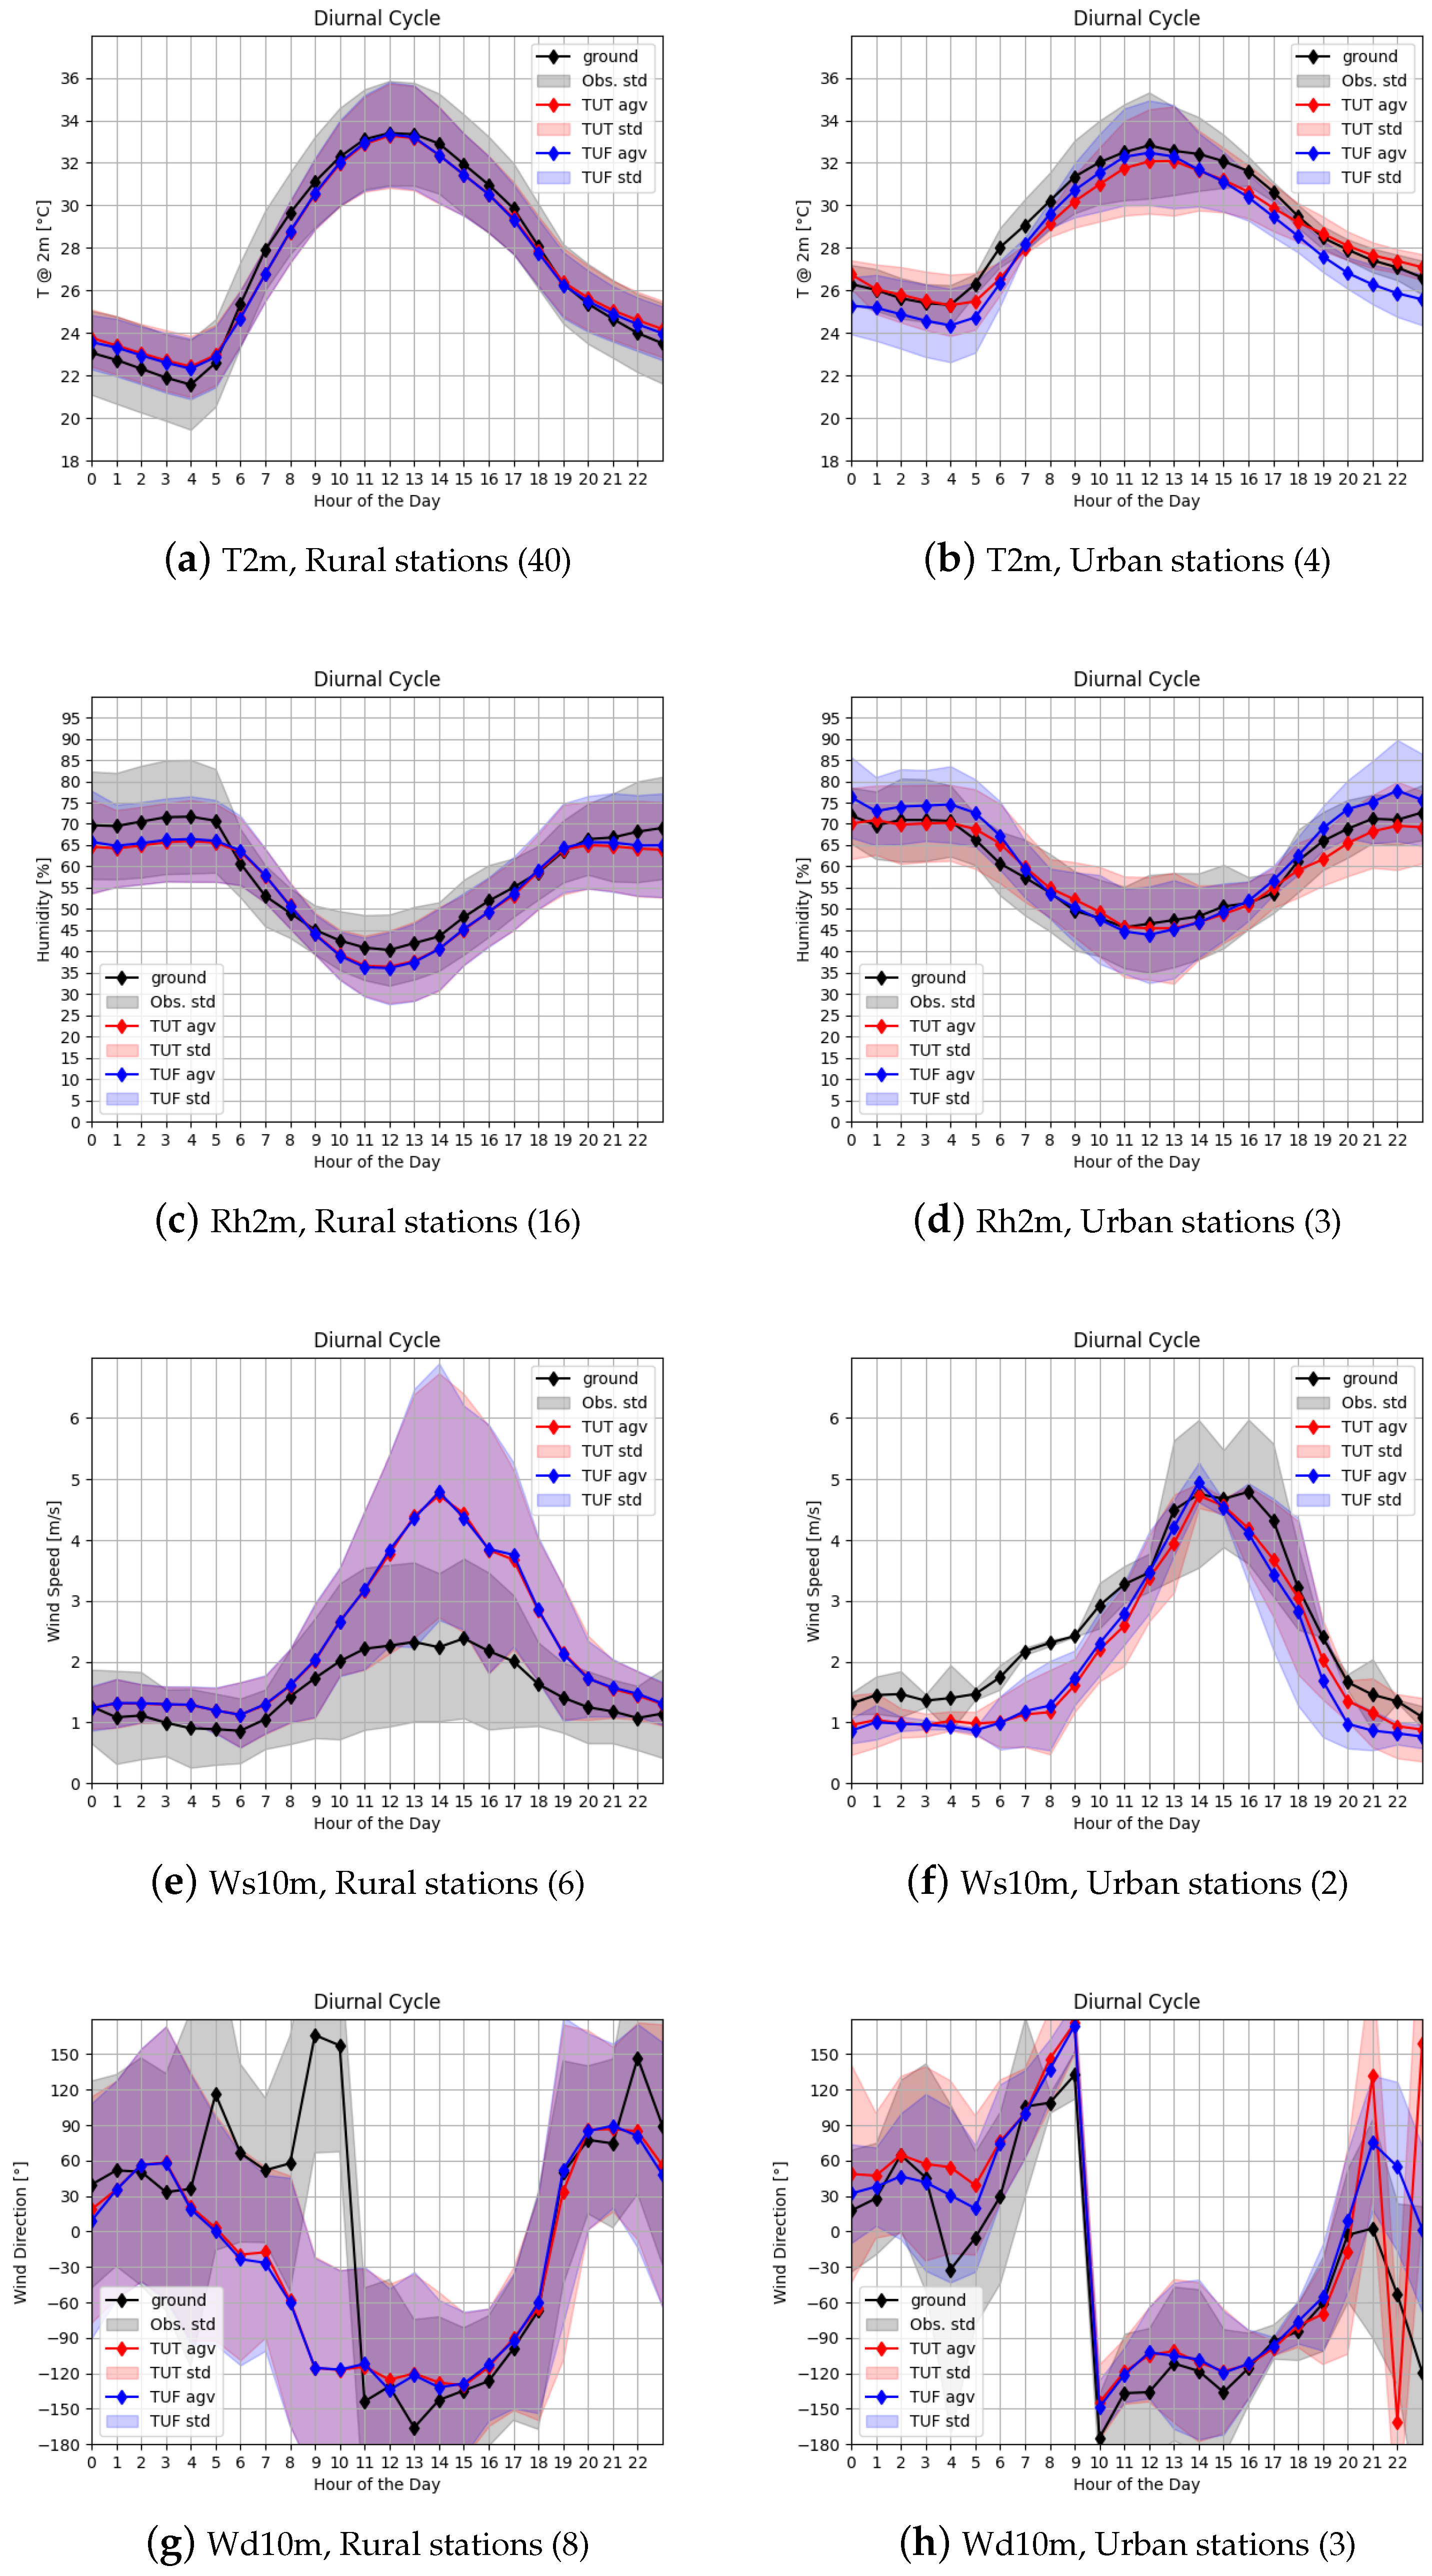
A detailed evaluation has been performed considering urban and rural stations separately, in order to highlight model performances over different pavings. Figure 7a,b shows the diurnal cycle of T2m averaged over the days in the proposed week, respectively, considering (a) rural stations and (b) urban stations. Numerical simulations performed with both TU off and on (blue/red lines) are compared with observations: for rural stations, for both simulations the model overestimates temperature values nighttime, and the activation of TU does not have any effect, as expected. A different behavior is recorded for urban stations, where temperature is generally underestimated when TU is off, but the activation of TU allows a temperature increase that results in optimal agreement nighttime. Similar plots are shown in Figure 7c,d for Rh2m: for rural stations (c), observations are generally underestimated, while for urban stations (d), the activation of TU is able to provide a relevant enhancement, especially during nighttime. It is well known that wind speed plays a key role in urban areas for the generation of UHI and pollution removal [40], for this reason an accurate forecast of wind is challenging. In the literature, several studies that state the evidence of Urban Wind Island effects (UWI) are available [41,42]. The present study aims to investigate the evidence of this phenomena eventually detected numerically by the TU scheme combined to the adopted subkilometer grids. Figure 7e,f shows the Ws10m diurnal cycles: in rural stations (e), observed values are much lower than those predicted by the model, but in urban areas (f), the model is able to accurately follow the diurnal cycle. In both cases, the activation of TU scheme does not provide relevant effects. Finally, Figure 7g,h shows diurnal cycles for Wd10m in rural (g) and urban (h) stations. In both panels, it is evident a sudden change of direction at about 9.00 a.m. which is well captured by the model only in the urban case, while in the rural case, a good agreement is recorded only from 2.00 p.m. onward.
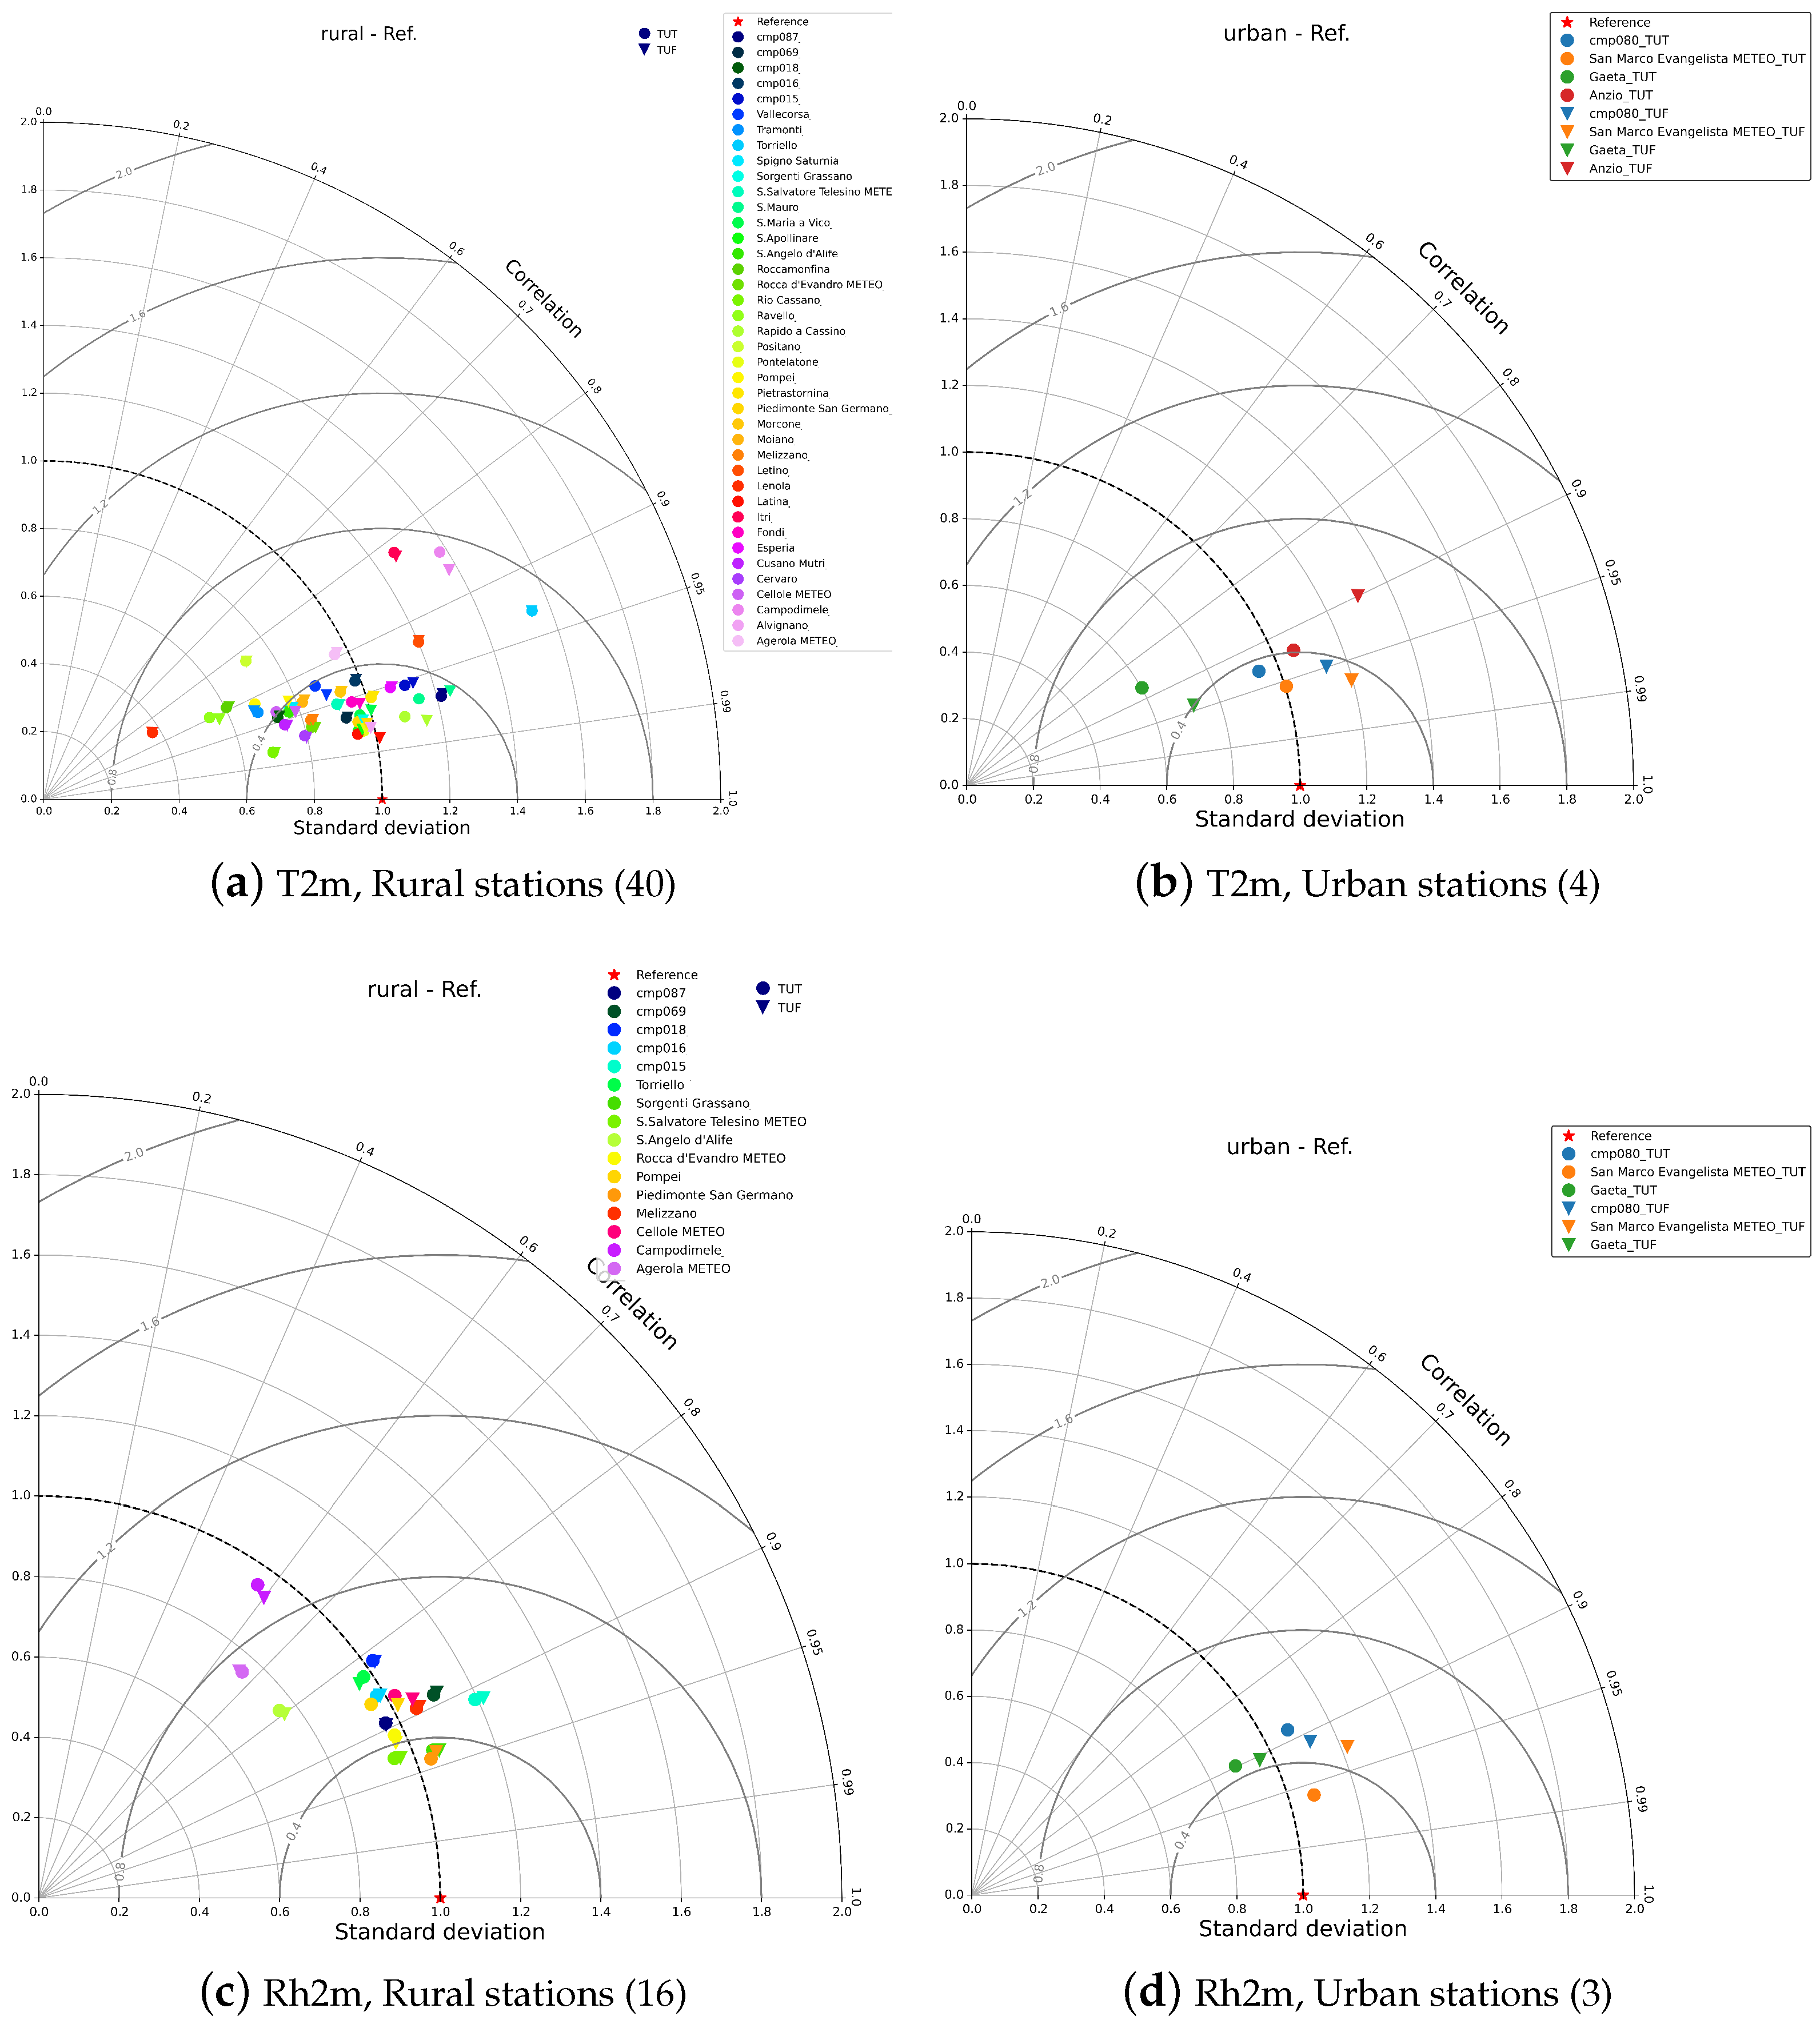
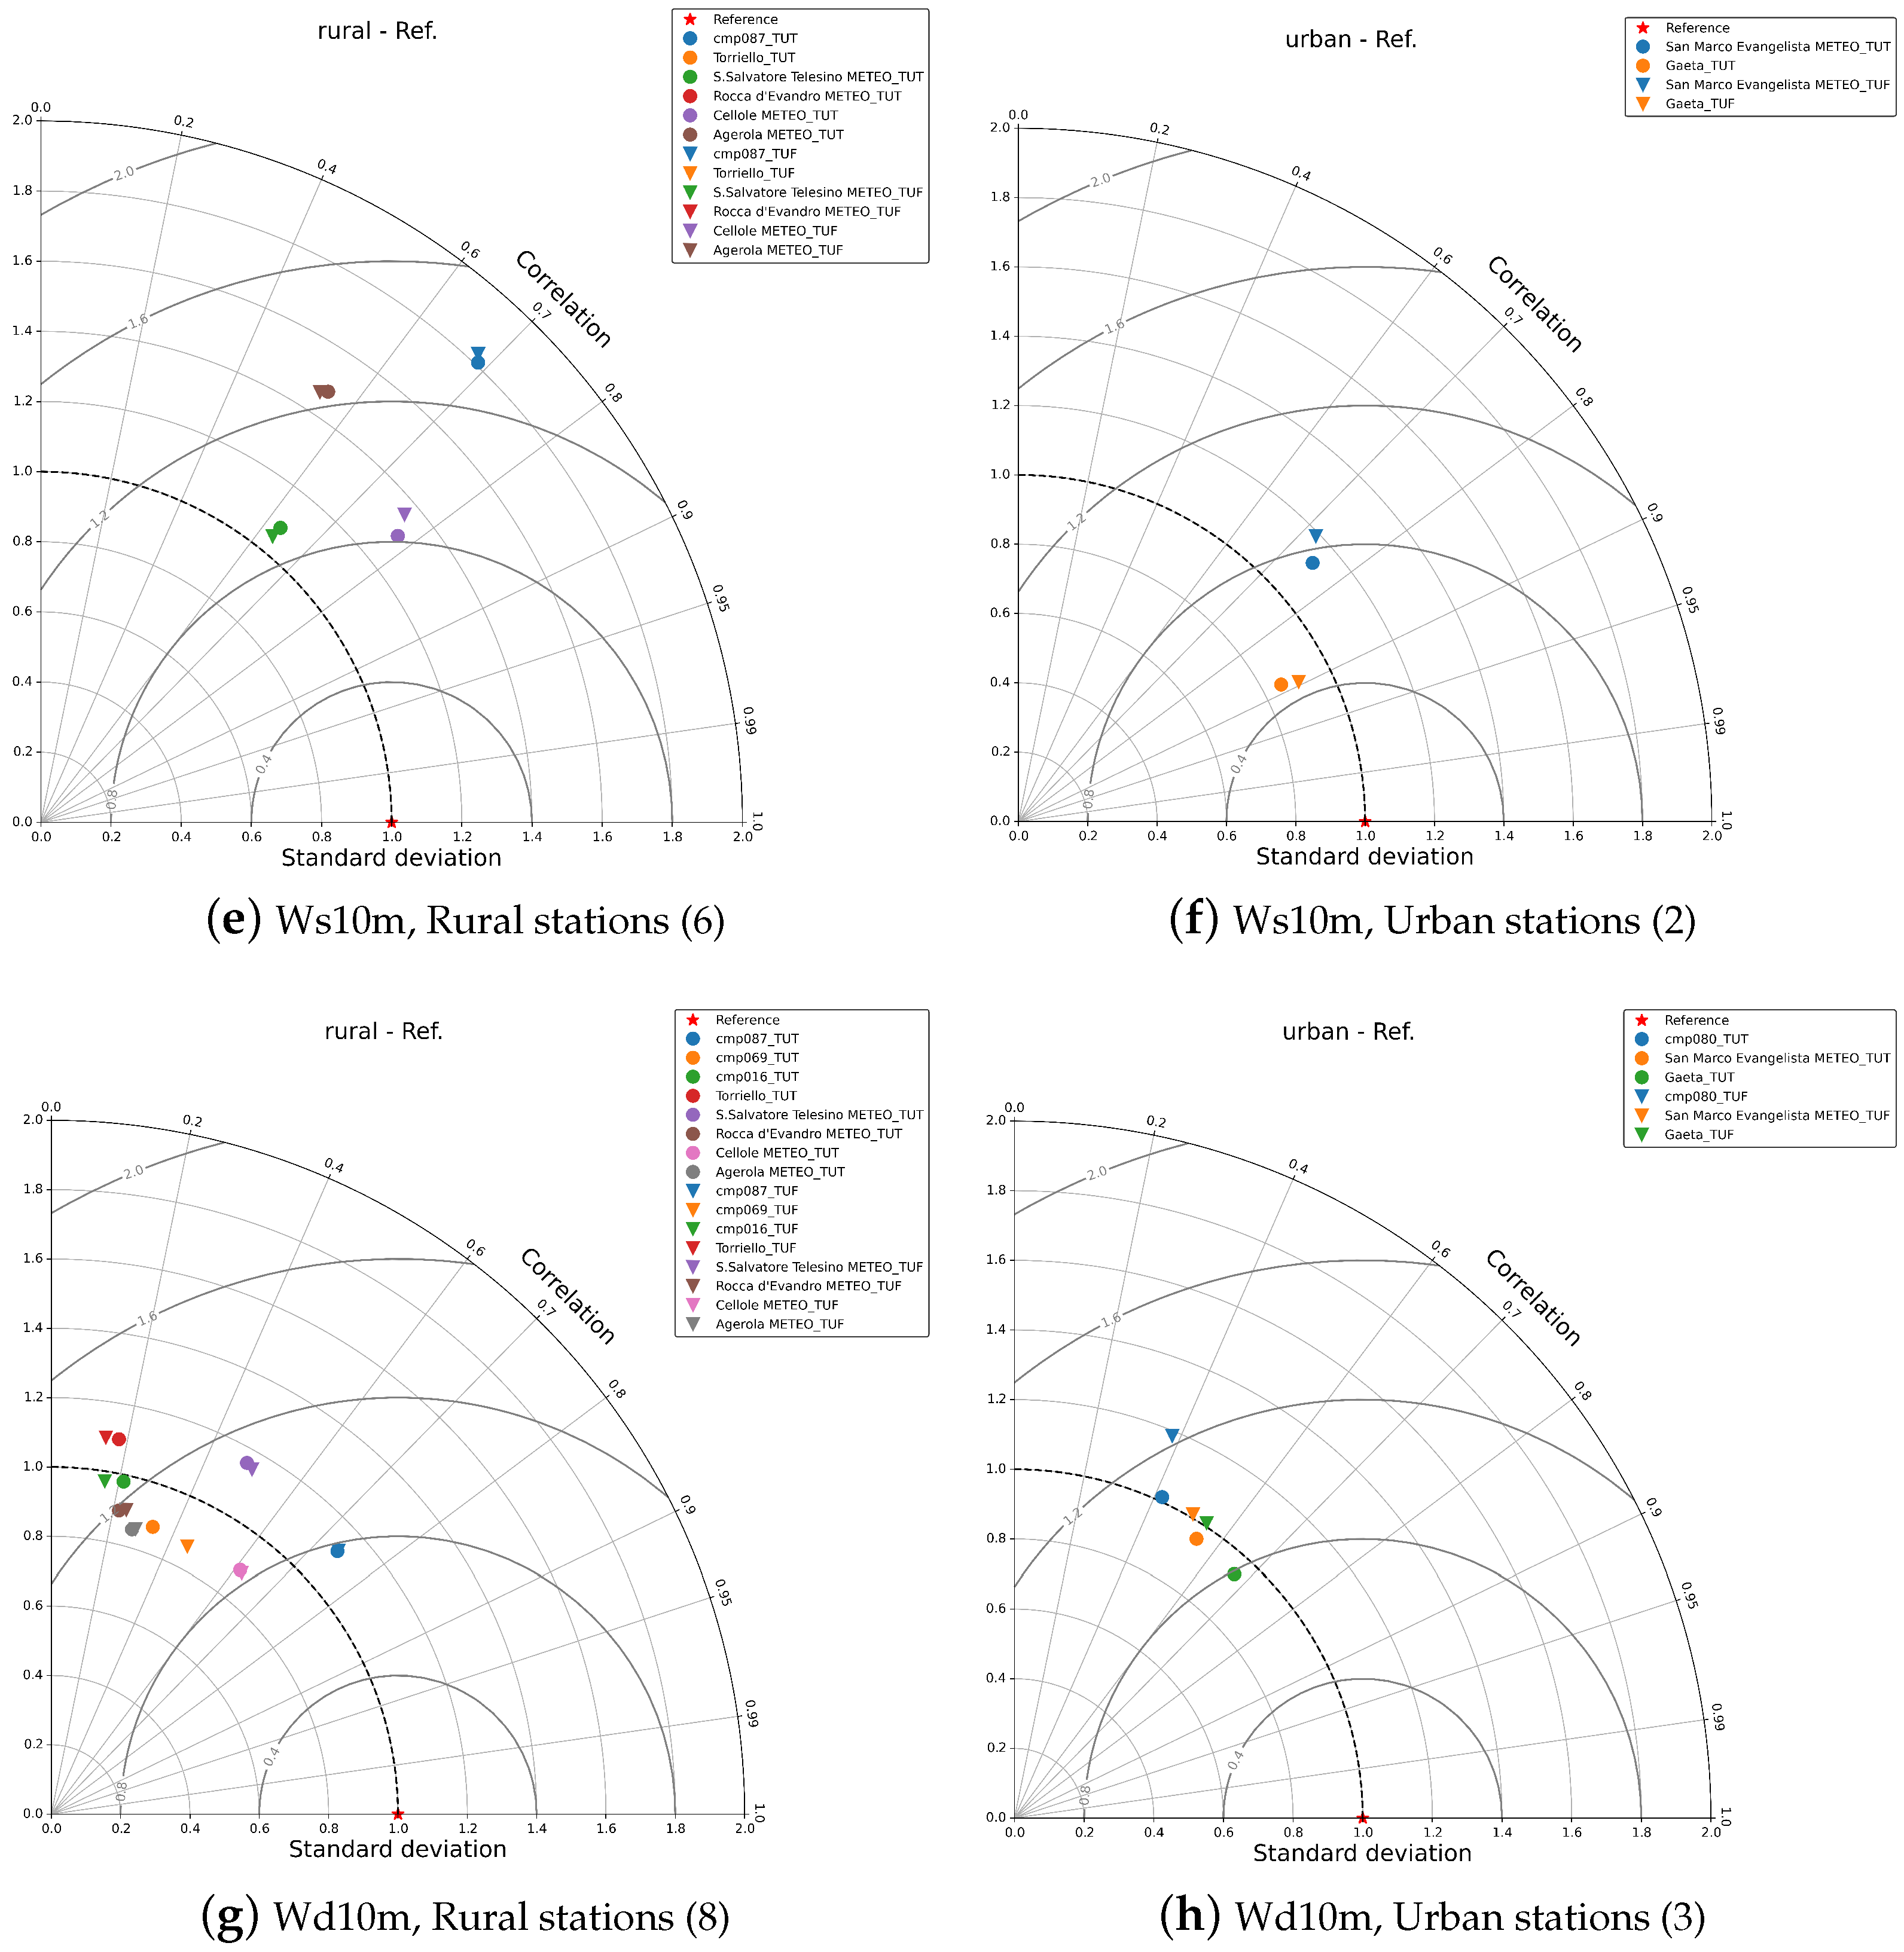
Figure 8a,b shows the Taylor diagrams for T2m, respectively, considering (a) rural and (b) urban stations. Both diagrams highlight performances obtained with TU on and off. For rural stations, the usage of TU does not influence significantly the results, as already shown in Figure 7a. For urban stations instead, TU plays a beneficial role, being the representative points closer to the observation one, with the only exception of Gaeta, which could be affected by the presence of the surrounding sea due to its geographical position. Figure 8c,d shows the same diagrams but related to Rh2m, revealing for the urban sites a contrasting behavior. In fact, in San Marco the accuracy increases when TU is on, but in the other two towns, a degradation is observed regarding CRMSE and correlation, while the ratio of standard deviations is enhanced in some cases. Figure 8e–h, related to Ws10m and Wd10m, shows that the effects on rural stations are not appreciable by switching on TU, whereas on the urban cells, an enhancement is observed.
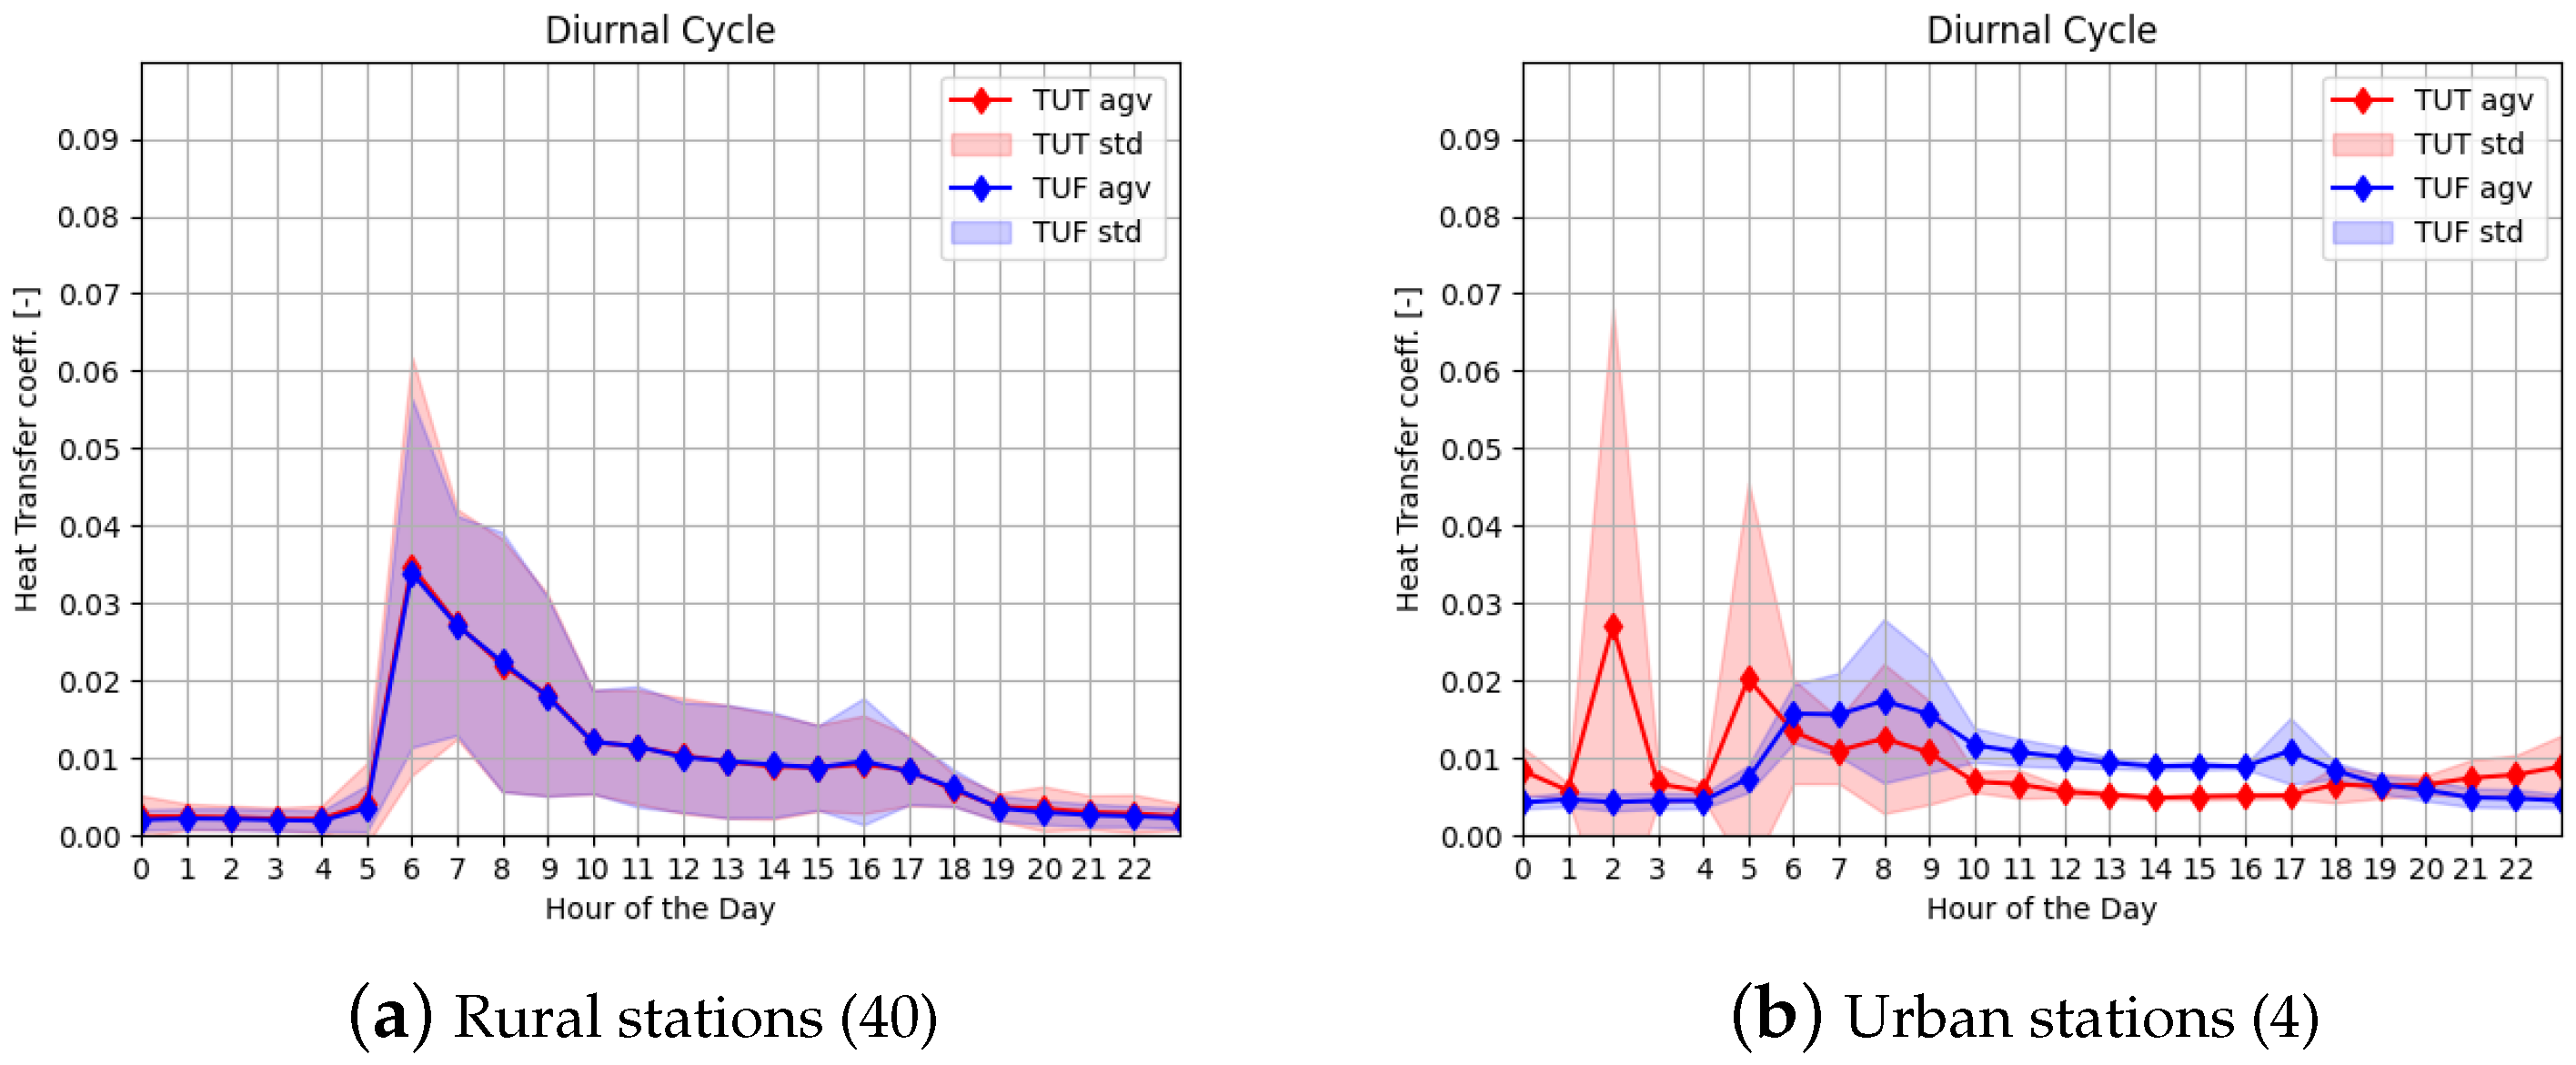
Some considerations about the heat fluxes and heat transfer coefficient are provided, since they concur to the calculation of surface temperature, along with antrophogenic and radiative heat fluxes. Plots provided in Figure 9 and Figure 10 are obtained considering the grid cell closest to the temperature stations, even if in this case, data for comparison are not available. In details, Figure 9 shows the diurnal cycle of the heat transfer coefficient, respectively, in (a) rural and (b) urban stations, obtained considering TU on and off. Focusing on urban cells (b), TU on enhances heat exchange during nighttime and reduces it during the daytime. This coefficient has influence on the latent and sensible heat fluxes in the computation for surface temperature.
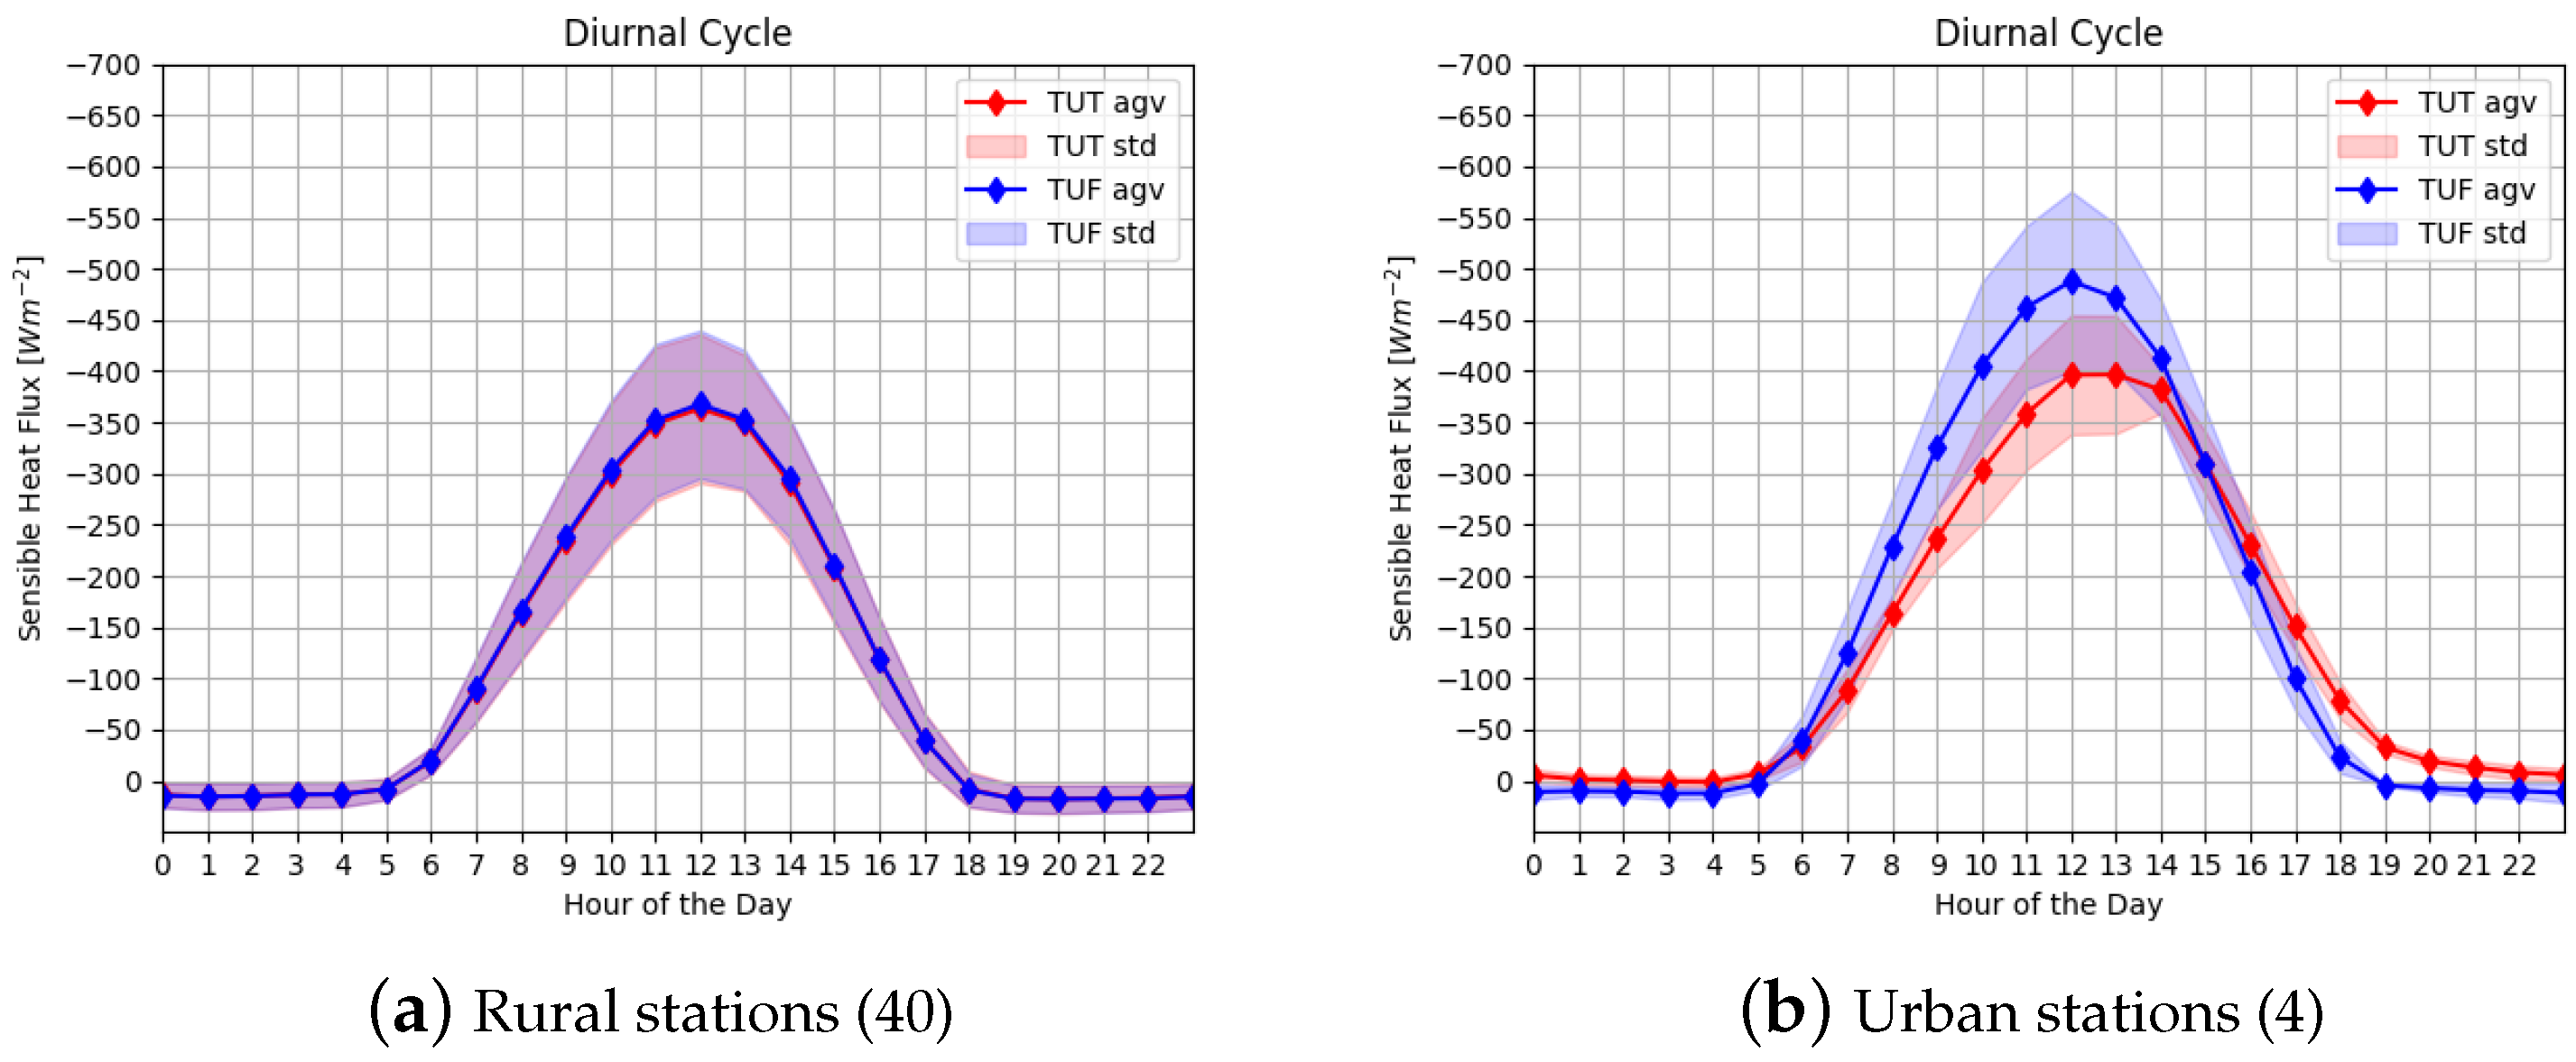
Figure 10 shows the diurnal cycle of sensible surface heat flux, which is assumed negative when flows from the surface to atmosphere. For rural stations, these values are slightly negative nighttime, while after sunrise the heat starts to flow from surface to atmosphere, reaching the maximum at noon. For urban stations, a similar shape is observed when TU is off, while when TU is on, the values become slightly lower and non-symmetric around noon, with a delay in decreasing rate. This effect could influence temperature, humidity, and also the wind speed behavior: in fact, when TU is on, in urban zones, the wind speed output follows closely observed data since, as noted in [16], sensible heat influences the atmospheric boundary layer.
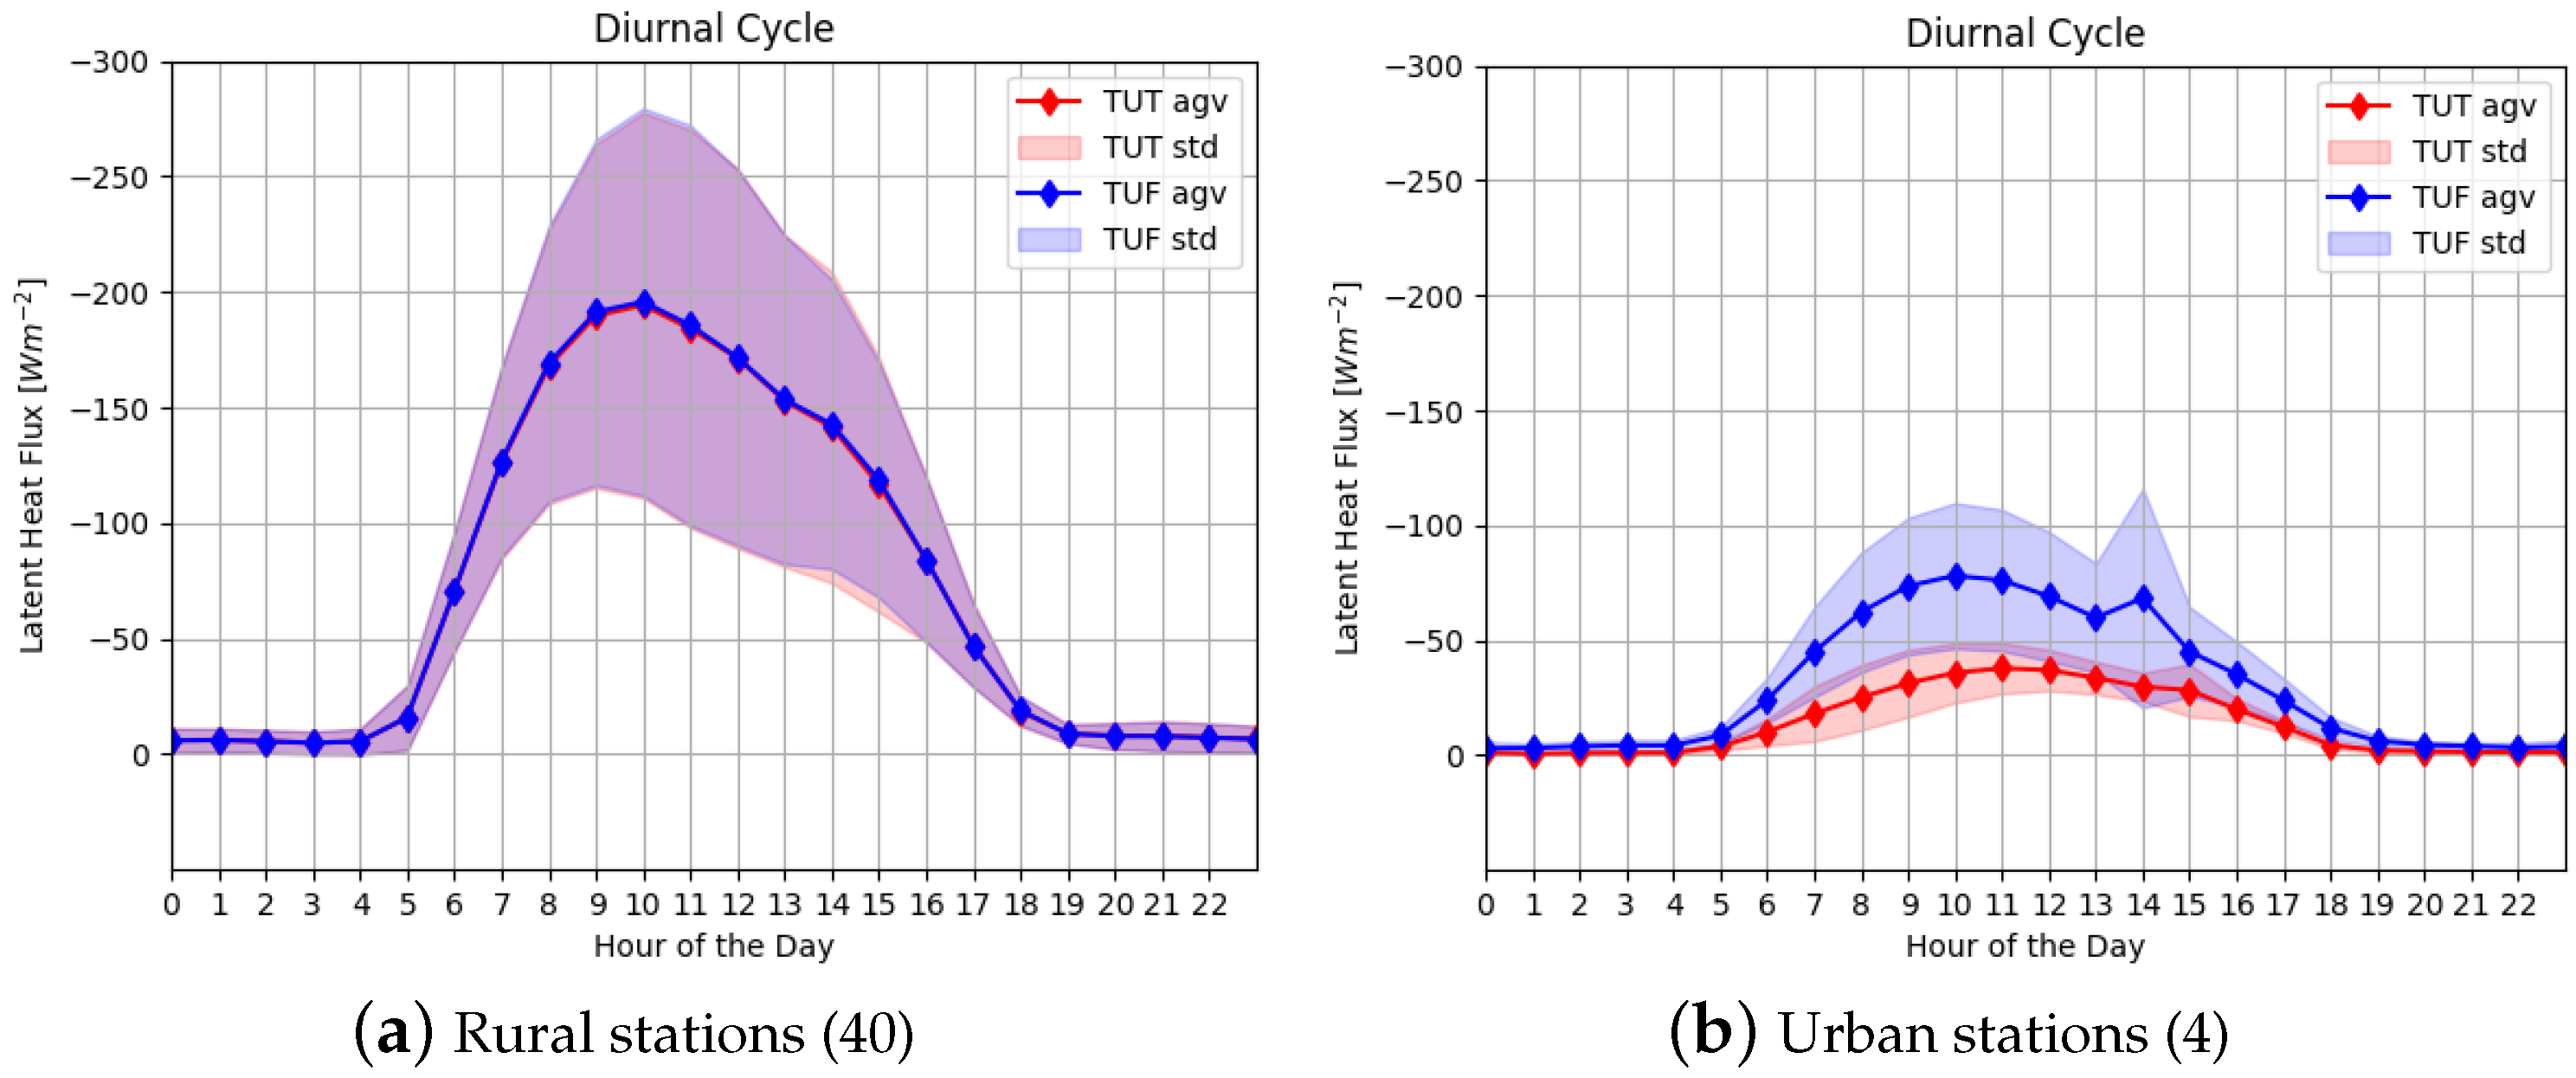
Latent heat is related to the soil evaporation and, where the urban fraction is dominating, it is expected a reduction of latent heat due to lack of water evaporation on sealed soil characterizing urban areas. This behavior is clearly illustrated in Figure 11, where the diurnal cycle of Latent Surface heat fluxes is shown.

6. Urban Heat Island

The objective of this investigation was a deep understanding of the heat flux that results especially nighttime, due to the effects of large urbanized areas, which are characterized by poor vegetation and large anthropogenic activities. In such context, the evaluation of UHI and UDI for the city of Naples, the focus of the present work, has been carried out. To this aim, the temperature and relative humidity measured at ground stations (urban and rural) have been analyzed, considering the metropolitan area of Naples (square box with side of 38 km). Specifically, six stations for UHI and three for UDI are available. Table 1 contains the list of the stations selected, with actual coordinates (latitude, longitude, height) and the corresponding values of the closest points from ICON grid. The value of the external parameter data field for the total impervious surface-area index (fr_paved) related to the cell containing the station is also shown. The last column provides the difference in terms of heights between ICON and actual values: it is worth noting that, for the Napoli Vomero station, the ICON cell height differs from the real value of about 100 m.
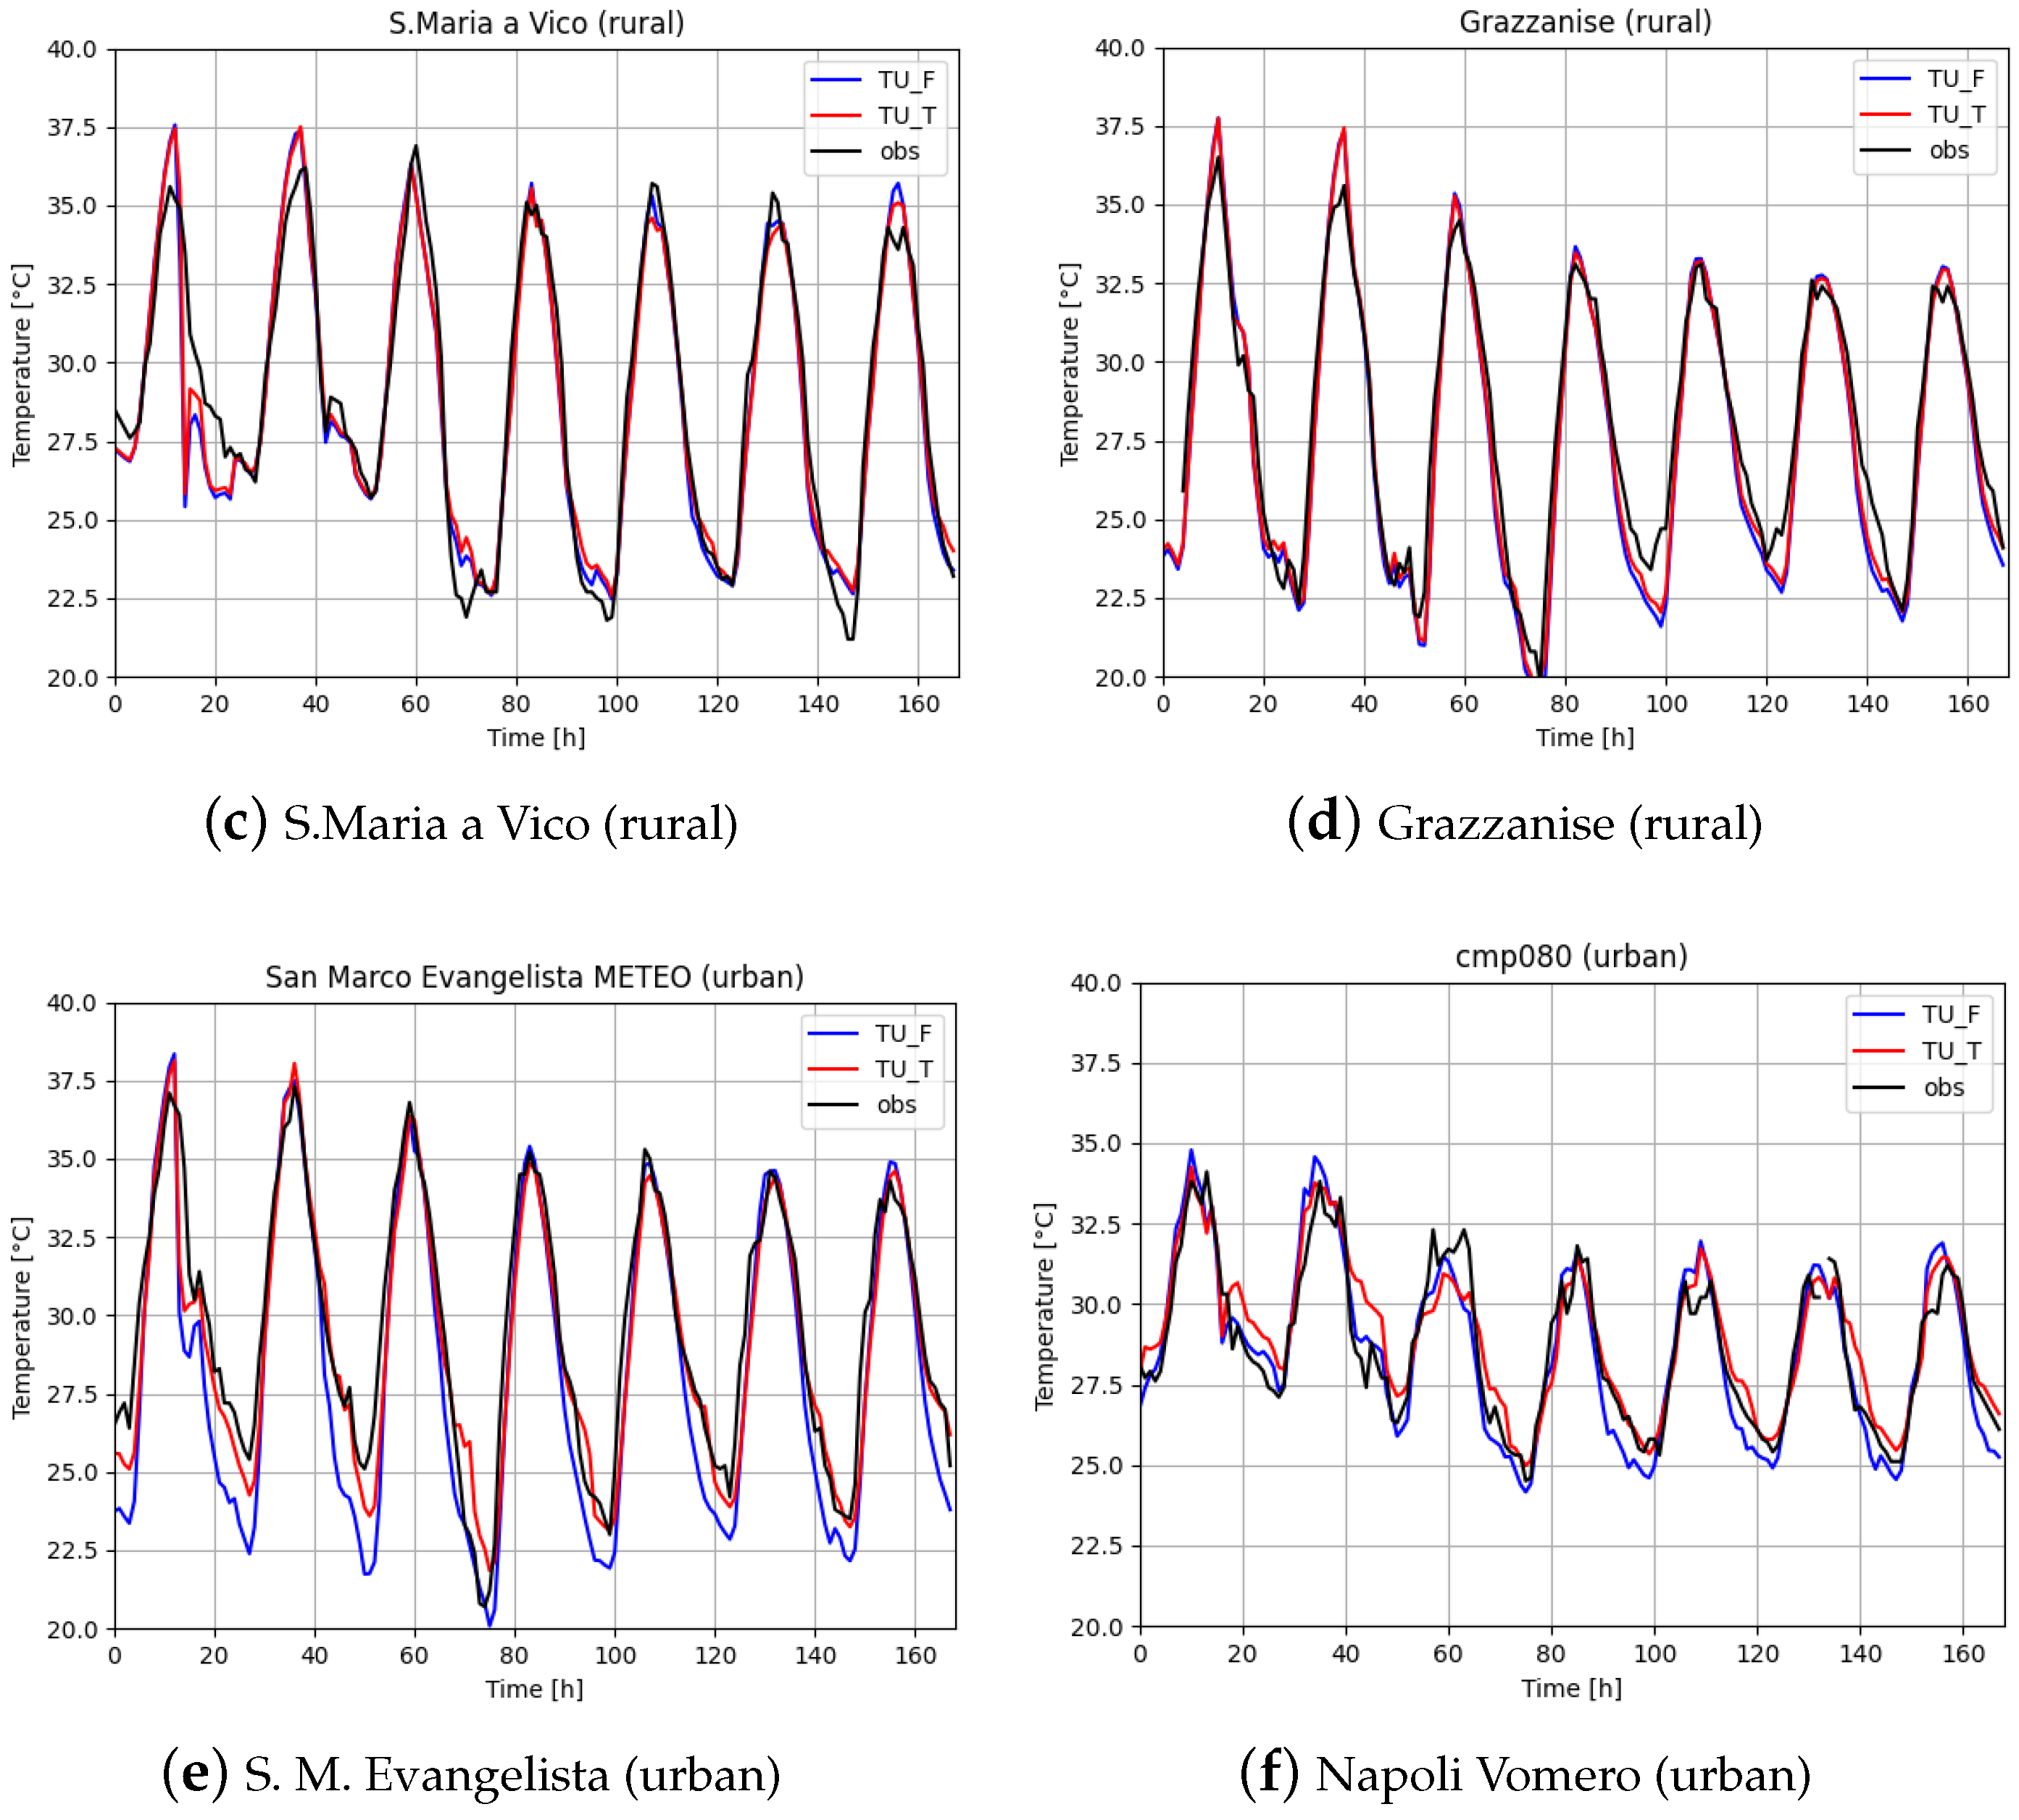
Data from the selected stations have been used and compared to numerical results to evaluate the UHI and UDI intensity. Figure 12 shows the time series of T2m over the considered week, for the selected stations. Both observational data and model output, respectively, with TU on and off are shown. An excellent agreement is generally reported; in particular, in urban stations, the activation of TU allows a better representation of nocturnal minimal values, which are underestimated when TU is off.
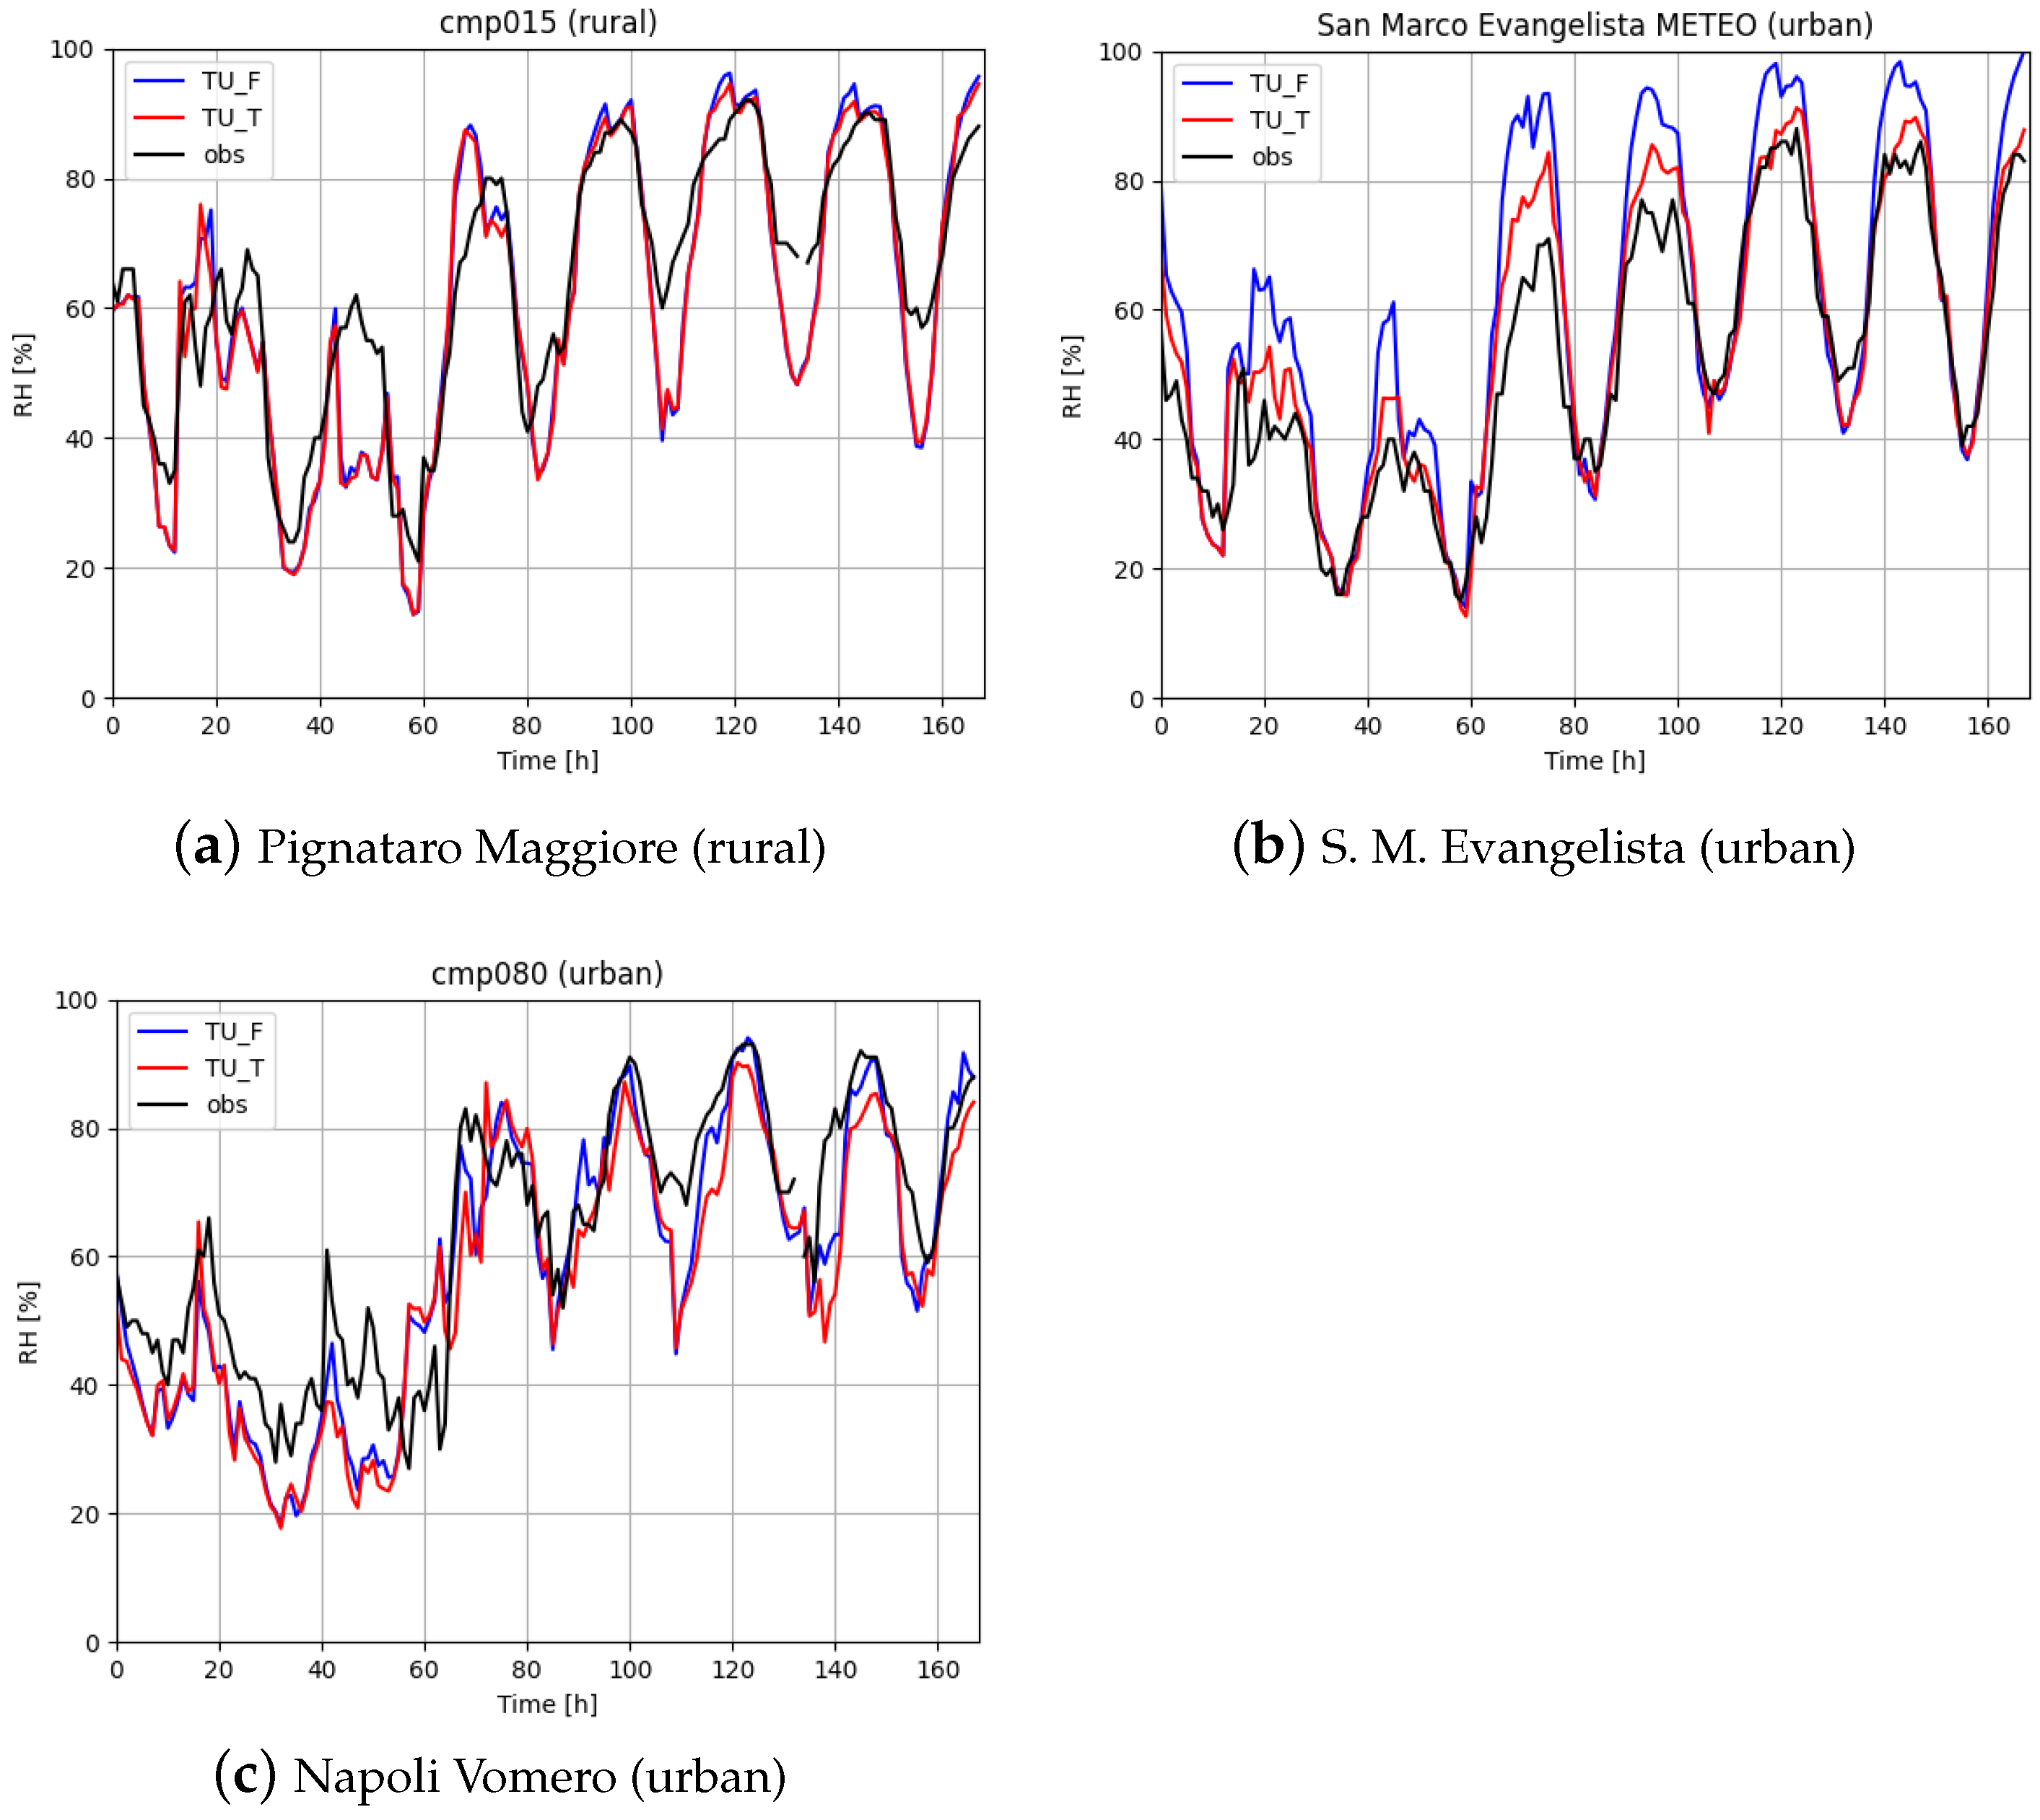
Figure 13 shows the time series of Rh2m over the considered week, for the selected stations. It is evident that after hour 60 (day 3) the average value of Rh2m increased, which is well captured by both simulations. However, large underestimations of minimum values are recorded in rural areas, while in urban areas, the activation of TU allows a better representation of humidity.
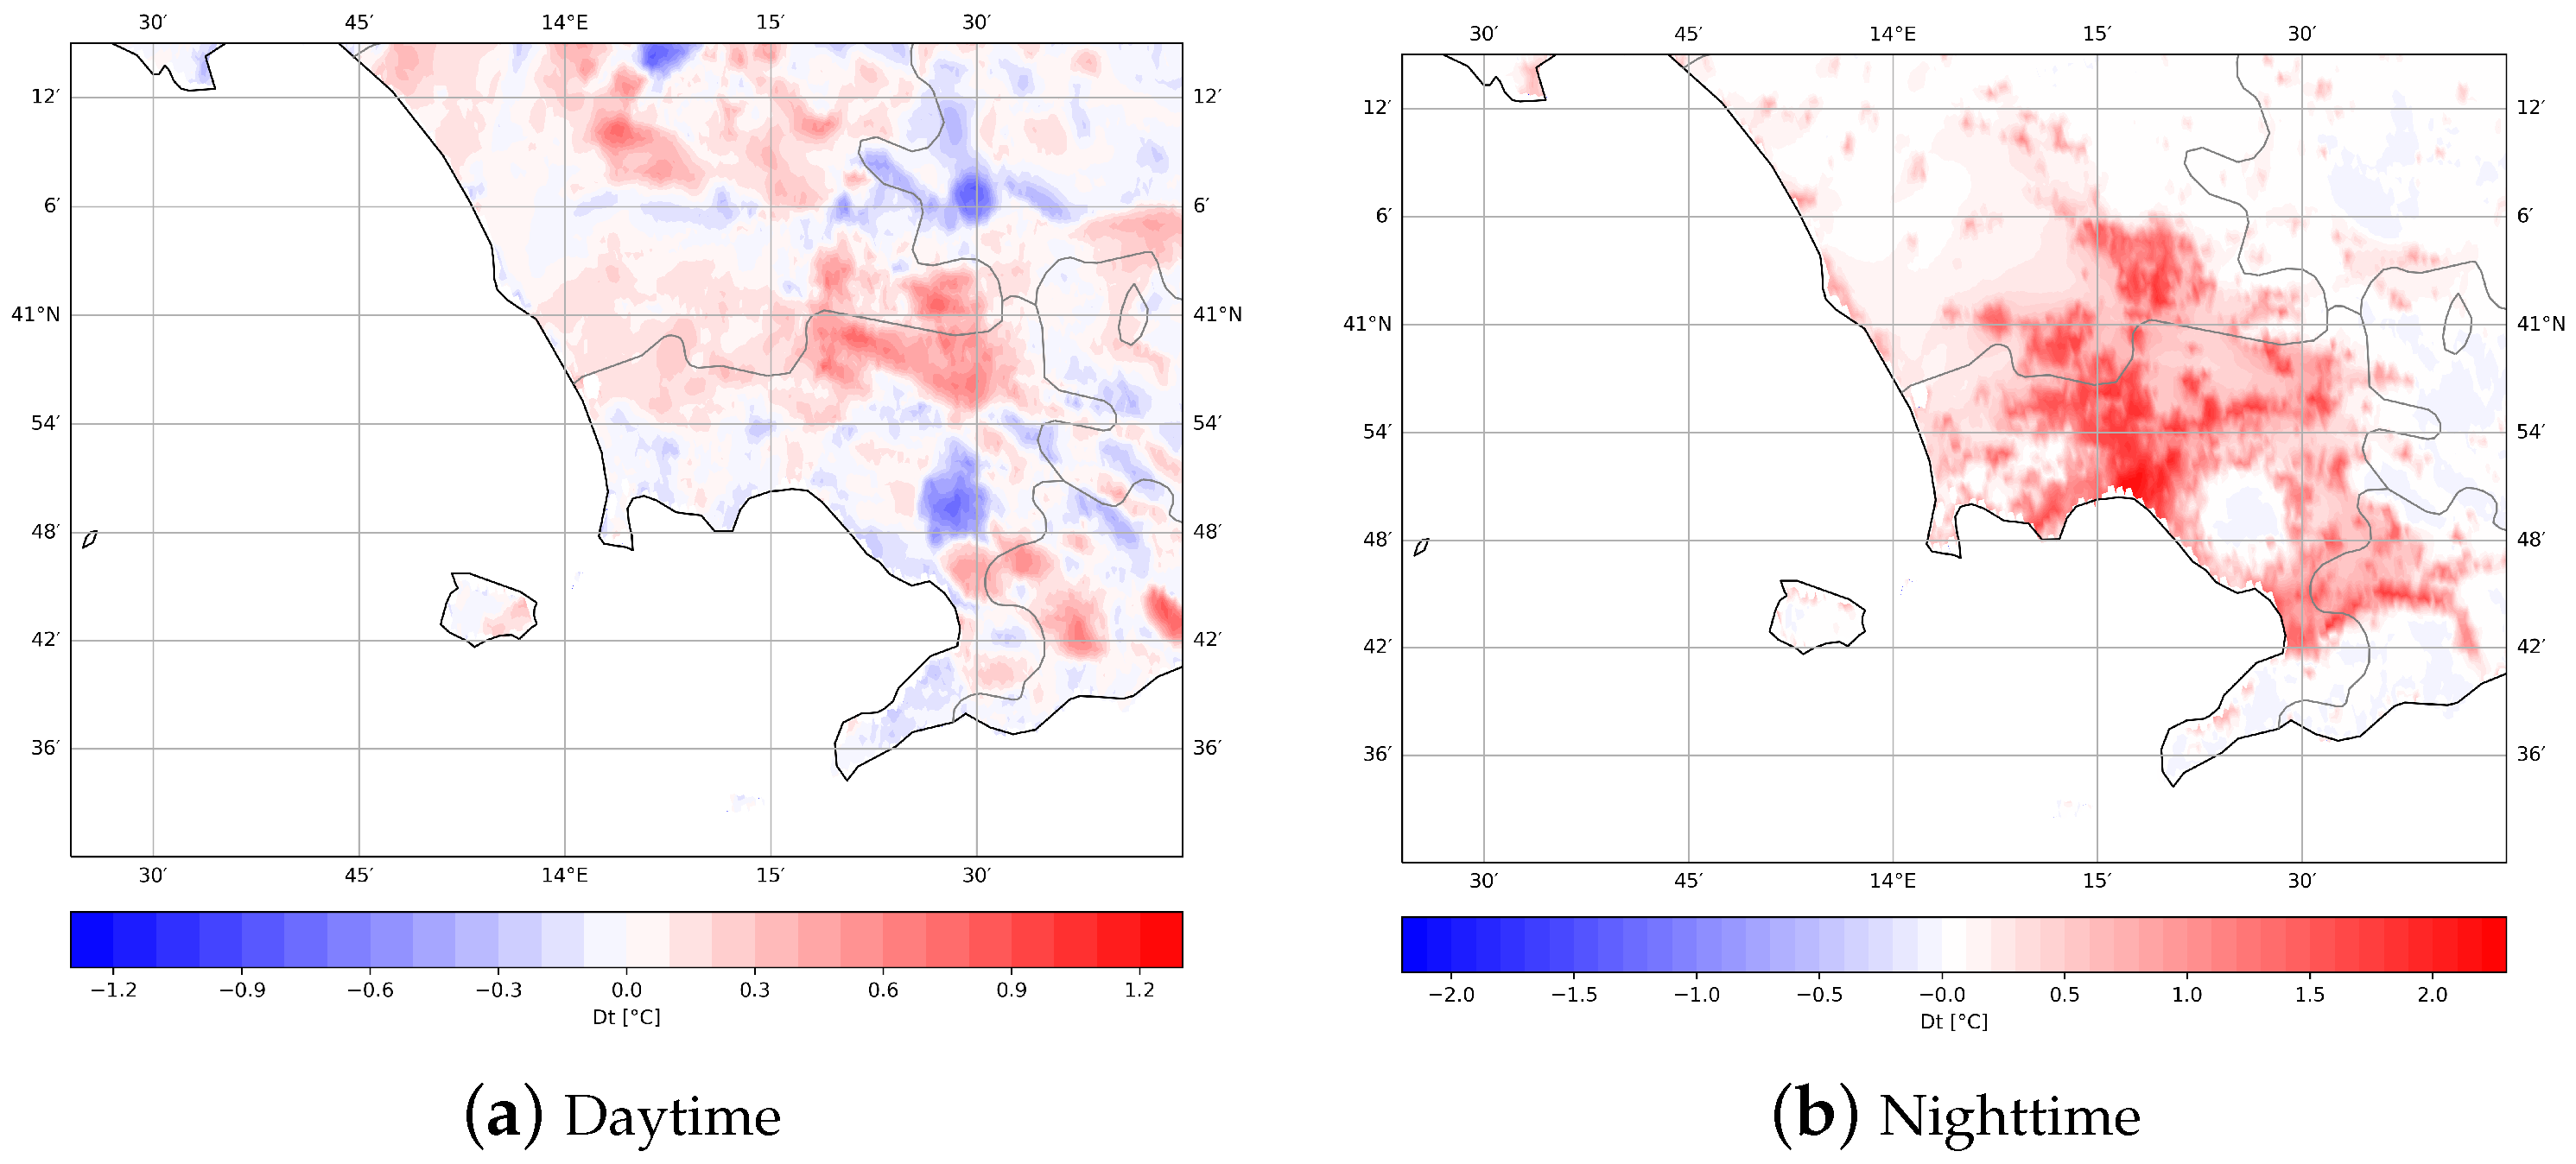
Figure 14 shows the maps of T2m differences provided by ICON, respectively, assuming TU on and TU off, daytime (a) and nighttime (b). Of course, positive values in this map imply that TU is forecasting a higher temperature, due to several contributions related to urban zone: this could be correlated with the map in Figure 4. From a physical point of view, the heat captured by real urban infrastructures is released in the nighttime, producing a local air heating: here, it is possible to note that the heat load gives rise to an increase of T2m well above 2 degrees.
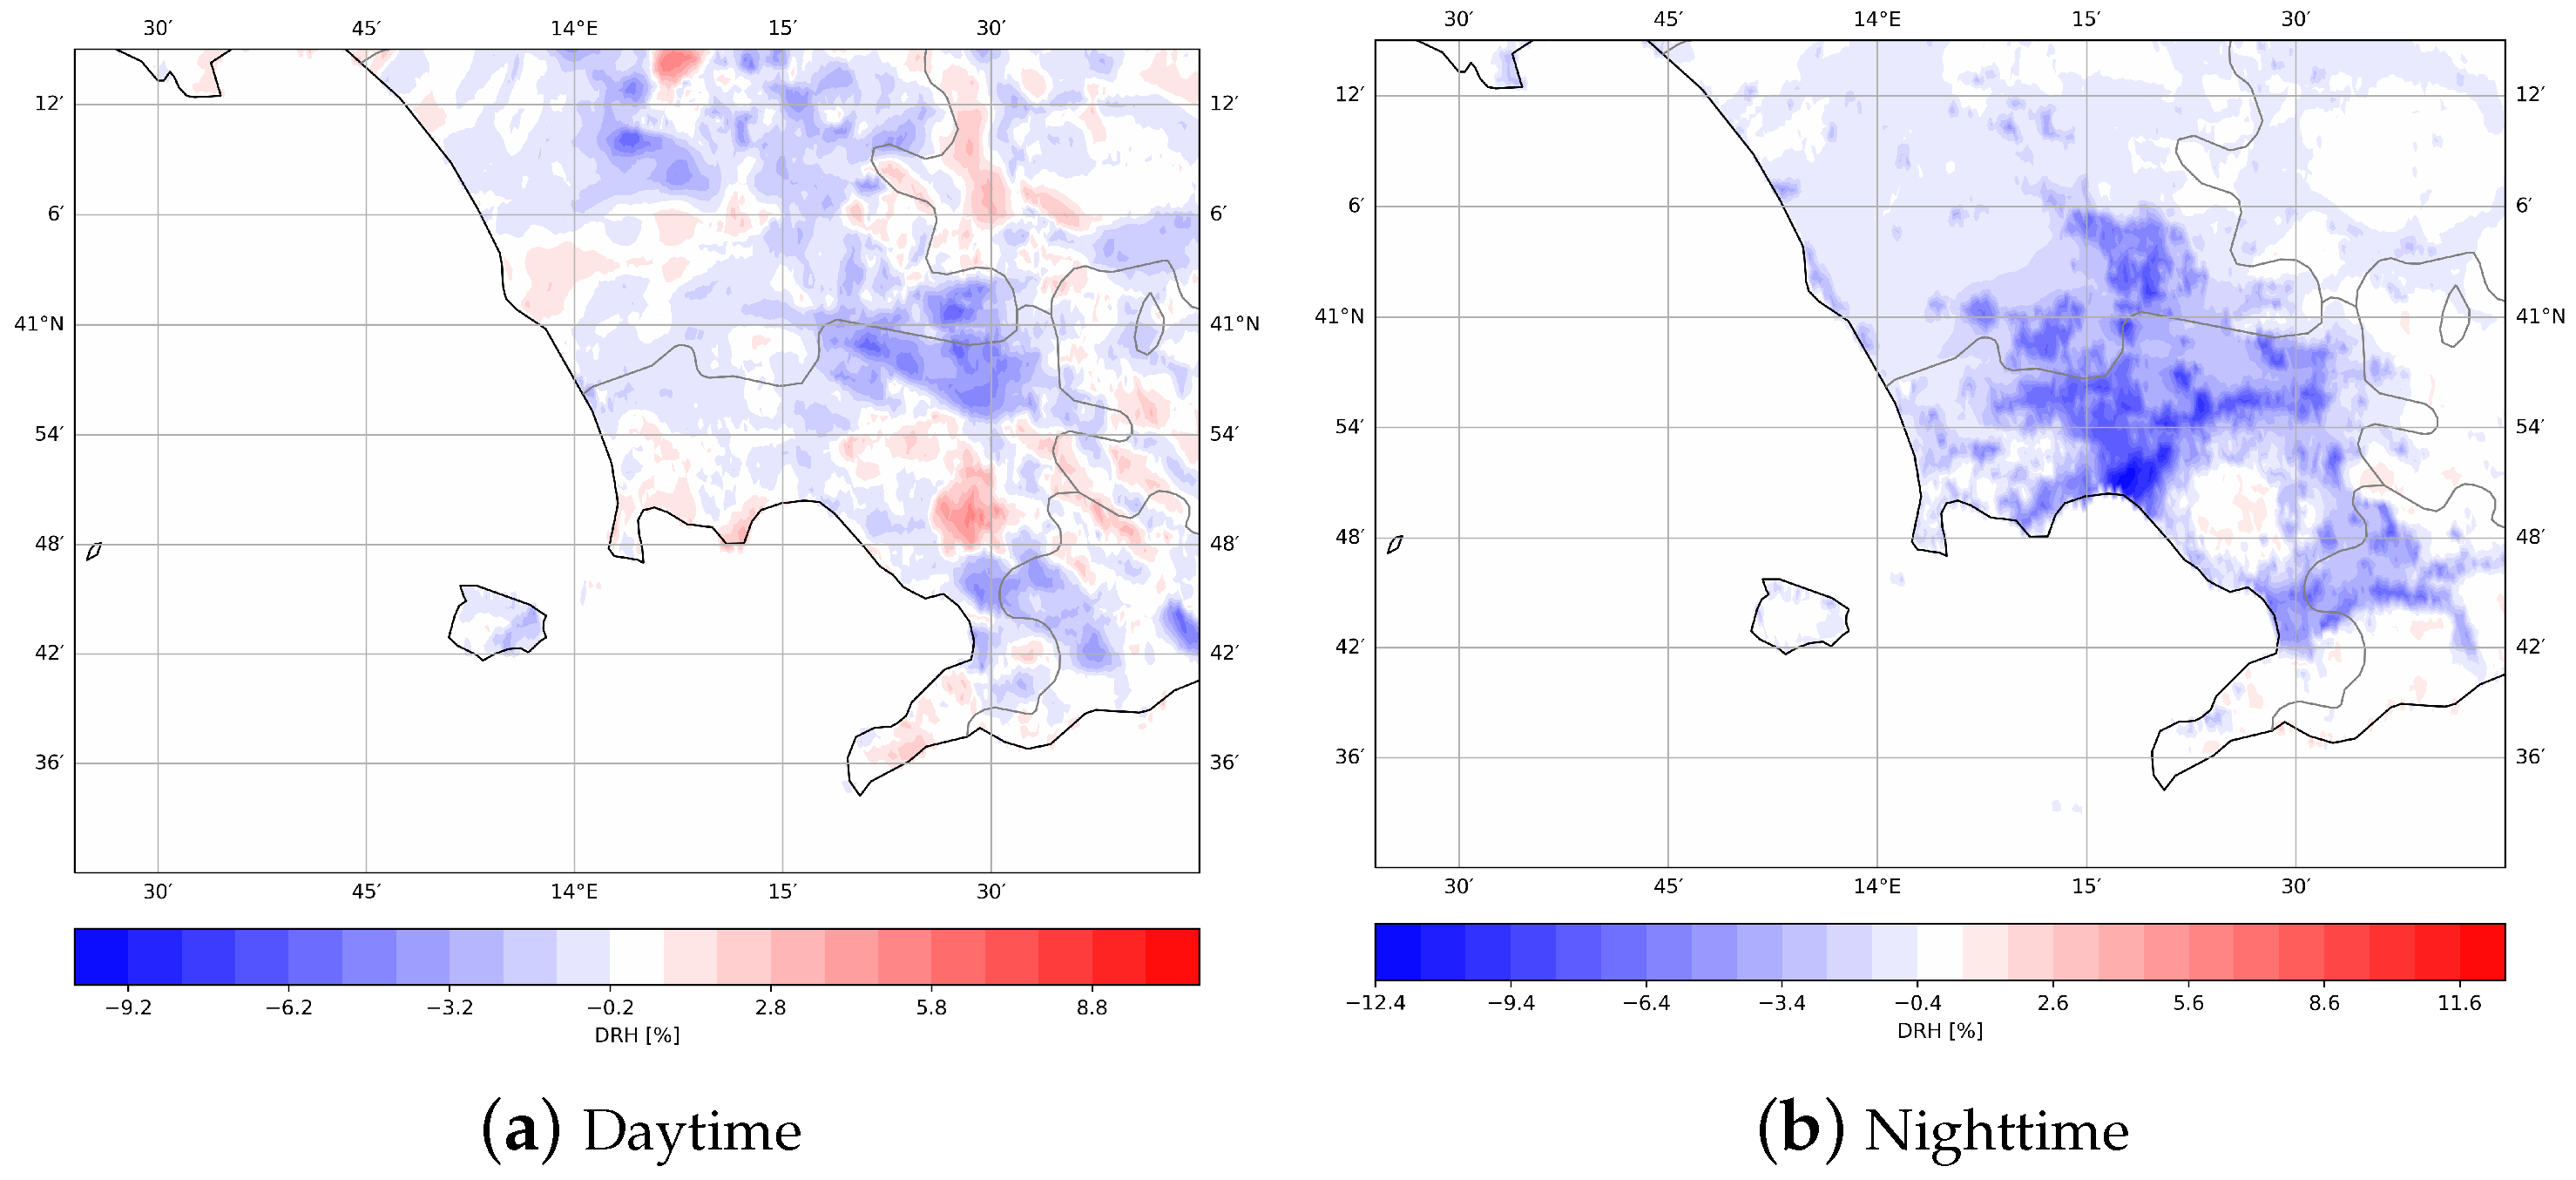
Figure 15 shows similar maps but in terms of Relative Humidity, highlighting the impact of TU on this variable: in detail, during the nighttime, the urban areas are characterized by lower relative humidity with a percentage that reaches −12%. It is worth noting that the impact of TU could be also qualitatively correlated with landscape features (Figure 2), as well as with the cell urban fraction shown in Figure 4.
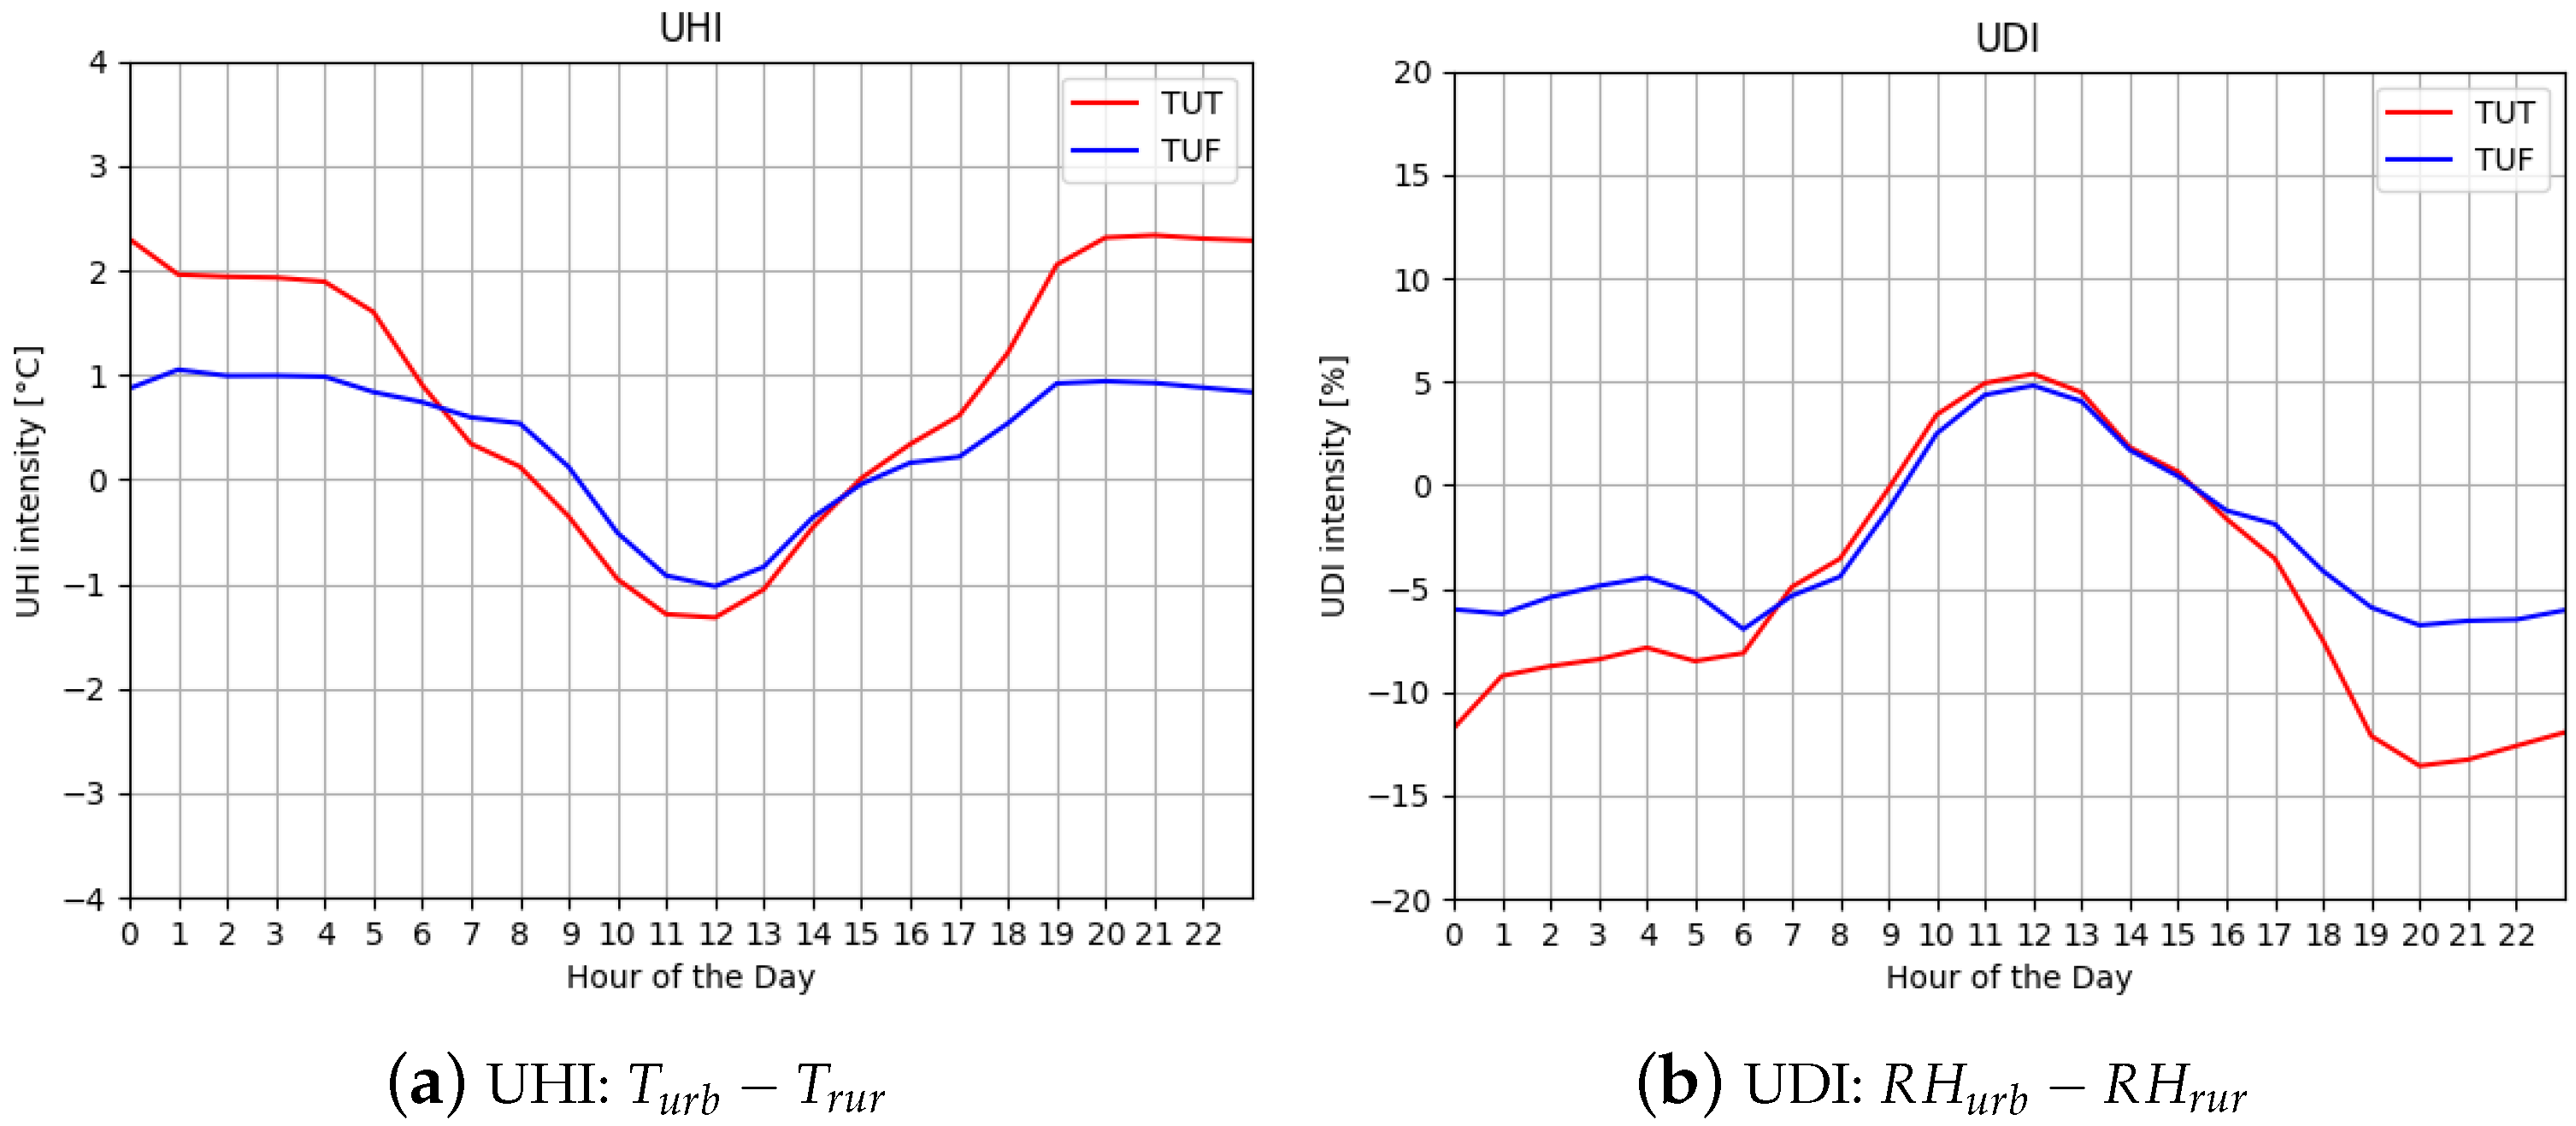
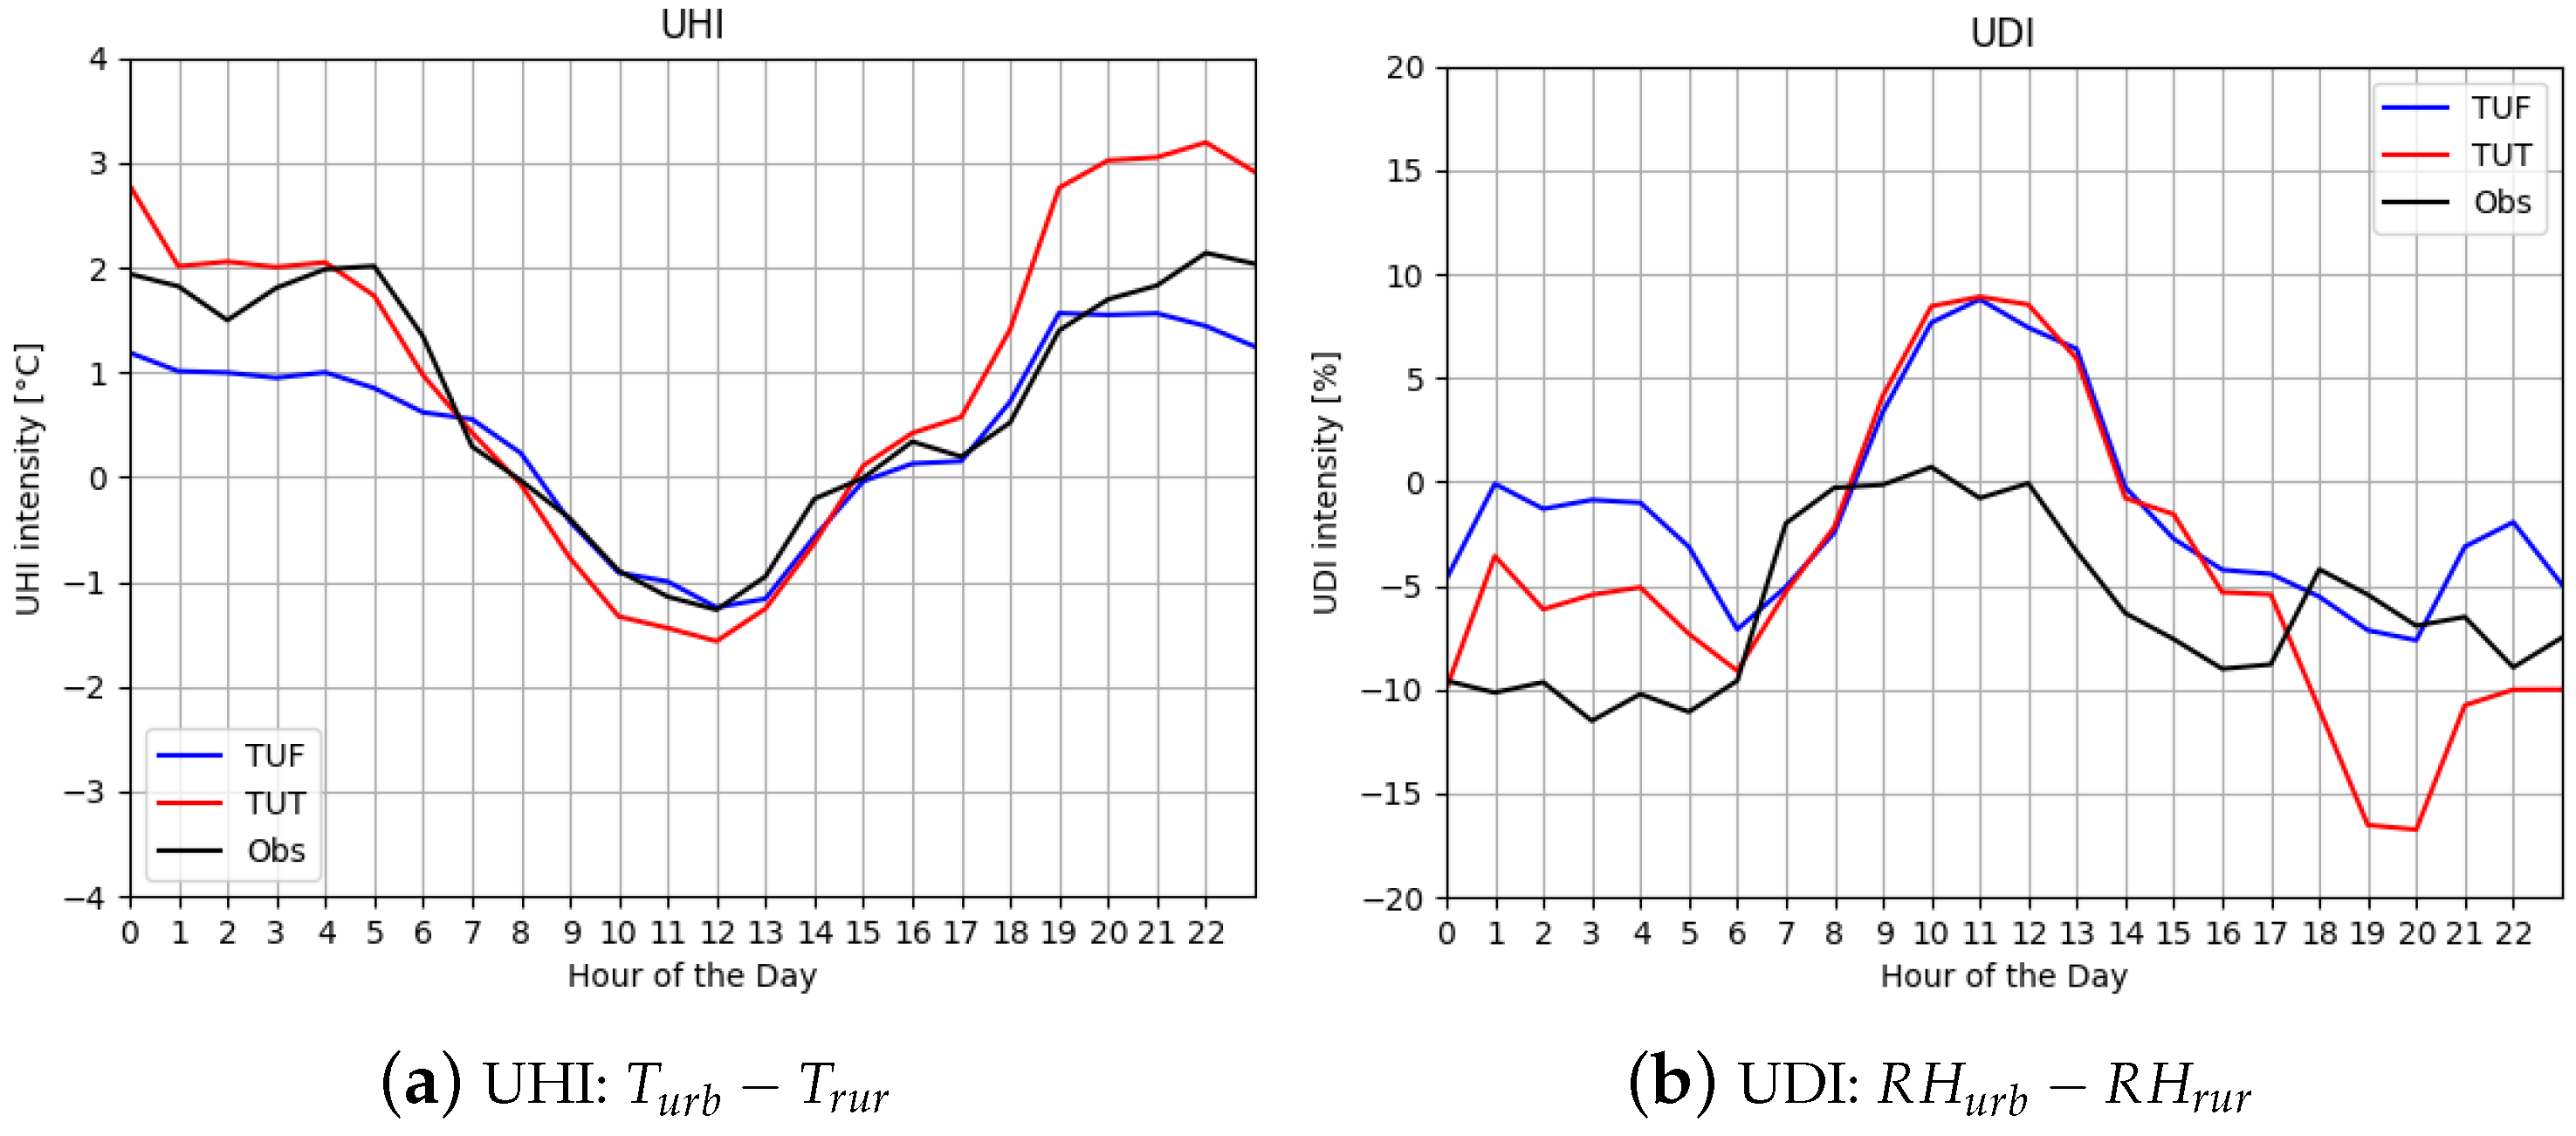
In the following, the results of UHI intensity numerically evaluated by ICON are shown, considering an area within a rectangular box containing both Naples and Caserta cities. Figure 16a shows the hourly mean difference of T2m between urban and rural cells of the aforementioned rectangular box, respectively, with TU switched on and off. In particular, it is evident that when TU is off, the model is able to simulate an UHI intensity up to 1 degree in the nighttime, and while activating TU, UHI intensity goes up to 2.3 deg. During daytime a cooler behavior is simulated in urban areas: it represents a particular phenomenon also known as Urban Cool Island (UCI) [43], also detected in other cities like Turin [44], Rome [9], and New York City [42]. In the area under investigation, TU on slightly accentuates the UCI with values larger than 1 degree.
In Figure 16b, the hourly mean difference between urban and rural areas in terms of Rh2m is shown: during the nighttime, TU on foresees a dryer urban climate (reduction between 8 and 14%), while during the daytime, the urban area is more humid than the rural one. The urban effects on humidity depend on a variety of physical processes (e.g., vapor addition, evo-transpiration, atmospheric inversion, dew formation, and increase of mixing layer height) and on external factors, so it is quite challenging to disentangle the UDI occurrence in different cities [44].
However, a comparison with observational data is fundamental for the evaluation of modeling results and to validate the implemented updates of TU, especially for UHI and UDI, which are the main objects of the present work. Regarding the observed data, the area under investigation is characterized by a low density of stations and also a sparsity of them, as described in the beginning of current section and resumed in Table 1.
Figure 17 shows the UHI (a) and UDI (b) averaged over the considered week in terms of observational values (black curve, see Table 1) and ICON output with TU on (red curve) and off (blue curve). Specifically, in Figure 17a it can be seen that TU on fits well with data in terms of temperature, especially until 05 p.m., while later, the urban temperature jump is overestimated. This could be due to the difficulty of the model in representing the formation of thermal layers in urban areas and the consequent surface cooling, resulting in higher simulated temperatures. The comparison for UDI is quite complex: in Figure 17b, model results show a moister urban environment daytime, differently from observational data. However, it is worth noting that curves are obtained by grouping rural and urban stations, which are classified according to the numerical values of fr-paved, which could be sensibly different from actual values. Furthermore, for UDI, only three stations are available (one urban and two rural).
In order to better quantify the model performances relative to UHI intensity, Table 2 shows the values of numerical indicators obtained, respectively, with TU on and off. It is evident that, when TU is switched on, a better correlation is obtained along with a bias reduction, but with a larger standard deviation ratio.

7. Discussion

The ICON model at high resolution coupled with TU offers good capabilities to support different strategical sectors (e.g., energy, flood, agriculture, tourism, and civil protection), but as a first step, the forecast quality and model deficiencies must be understood, since it is well known that a hectometric resolution is challenging to be employed in weather models for short- and medium-term forecasts. Moreover, if the computational costs are considered, it is necessary to evaluate if these simulations are able to provide good results in complex orographic areas such as southern Italy and if the TU scheme can provide valuable gains. In fact, for many years, in NWP models, cities were represented as natural land surfaces characterized by a reduced vegetation cover, but this schematization revealed itself not able to properly reproduce the UHI. The domain considered in the present study is characterized by a great number of buildings; moreover, the area is close to the sea, resulting in a large sensitivity to the land surface processes. It is evident that in this context the urban canopy is a key issue; in fact, several tests conducted in other areas (Turin, Moscow) [4] showed a non-negligible impact of the land surface scheme TERRA and of the urban scheme TU on temperature (at least 0.5 degrees of difference with its activation). This is due to the fact that the calculation of the surface temperature in TERRA is based on a skin temperature formulation that uses an additional temperature of the canopy leaves as a way to represent energetically balanced vegetation on the surface.
The results provided in the present work reveal that the activation of TU in ICON has positive effects in urban areas. As shown in Garbero et al. [4], similar benefits were also obtained with the inclusion of TU in COSMO model for the simulation of UHI over Naples. Moreover, a rough comparison of the present results with the ones shown in [4] reveals that ICON overperforms COSMO in terms of correlations, while performances between the two models are comparable in terms of other indicators. It is evident that further improvements can be achieved by means of a parameter optimization that control subgrid processes and the representation of model topography and surface exchange, as reported recently in the work of Goger and Dipankar [16]. As also explained in a recent article by ICON developers [45], improvements can be obtained by the adaptive tuning of parameters of microphysics scheme, involving data assimilation in the optimization process, stressing the need for training data (weather stations, satellites, radiosonde, etc.). Among others, vegetation roughness, soil evaporation, and plant evaporation play a fundamental role, and along with ground heat flux, they are subject to large uncertainties or errors in NWP models.
The urban area considered in the present work was also studied in recent works available in literature, such as Cinquegrana et al. [46] and Lauwaet et al. [47]. In particular, in [47], the main features of UHIs over the main European larger cities are presented. For Naples, an UHI magnitude of 1.74 is reported, based on data over a period of 10 years (2008–2017) for the summer season (JJA). In the same work, the authors showed the potential cooling, i.e., the capacity of reducing the UHI indicator by adopting two popular climate adaptation measures, i.e., greening and soil unsealing: the city of Naples shows one of the larger index reduction among other European cities, i.e., 0.82, meaning that a lot of work could be done to obtain extra cooling by unsealing soil and planting more trees.

8. Conclusions

In the present study, an advanced version of ICON model including the urban parameterization TERRA-URB was employed, to assess model performances at very high resolution ( Δ x = 600 m) over the urban metropolitan area of Naples, located in southern Italy. Model validation has been conducted against a collection of ground stations from the Meteo Italian Supercomputing Portal [38]. A specific case study has been selected, i.e., the week 18–24 July 2022, characterized by extremely high temperature as well as calm and dry weather, which gave rise to a very pronounced UHI.
Simulated values of mean T2m show a general good agreement with observations. An excellent behavior is reported in urban stations, where the activation of TU allows a better representation of nocturnal minimal values, which are underestimated when TU is off. Model biases are partially due to shortcomings of the model in simulating some features of the area considered, along with deficiencies in the lateral boundary conditions and internal variability. A strong urban heat and dry island was observed over the considered week, defined as difference of atmospherical values between urban and rural areas, which is properly captured by the model, especially when TU is activated. The dynamics of the air temperature in the city center is well simulated, along with UHI intensity and its daily cycle. The activation of TU scheme has a small impact on temperatures in rural areas, since they are influenced by nearby settlements. Positive effects were recorded also on wind speed, due to a better representation of sensible heat flux [16], which has an influence on the atmospheric boundary layer. Of course, further adjustments in the model configuration are needed to improve the spatial and temporal representation of the variables considered. In fact, the area of Naples is characterized by a large model sensitivity to the change of physical schemes, as demonstrated in [4], regarding simulations with COSMO including TU, and in [46], regarding simulations with ICON (without TU) over a similar domain.

Author Contributions

Conceptualization, D.C. and E.B.; methodology, D.C., A.L.Z., M.M. and E.B.; software, D.C.; validation, D.C. and M.M.; formal analysis, E.B.; investigation, A.L.Z.; data curation, D.C.; writing—original draft preparation, D.C.; writing—review and editing, E.B.; visualization, D.C., M.M. and A.L.Z. All authors have read and agreed to the published version of the manuscript.

Funding

This research received no external funding.

Data Availability Statement

The data presented in this study are available on request from the corresponding author. The data are not publicly available due to privacy.

Acknowledgments

The authors wish to thank Sasha Brand and Daniel Rieger (DWD) for their support in sharing forcing data. This article arises from the activities carried out in the COSMO project PP-CITTA, led by Jan-Peter Schultz (DWD).

Conflicts of Interest

The authors declare no conflicts of interest.

References

  1. Lee, H.; Calvin, K.; Dasgupta, D.; Krinner, G.; Mukherji, A.; Thorne, P.; Trisos, C.; Romero, J.; Aldunce, P.; Ruane, A.C. IPCC, 2023: Summary for Policymakers. In Climate Change 2023: Synthesis Report. Contribution of Working Groups I, II and III to the Sixth Assessment Report of the Intergovernmental Panel on Climate Change; Lee, H., Romero, J., Eds.; IPCC: Geneva, Switzerland, 2024; pp. 1–34. [Google Scholar] [CrossRef]
  2. Pal, S.; Sharma, P. A review of machine learning applications in land surface modeling. Earth 2021, 2, 174–190. [Google Scholar] [CrossRef]
  3. Grimmond, C.S.B.; Blackett, M.; Best, M.J.; Baik, J.J.; Belcher, S.E.; Beringer, J.; Bohnenstengel, S.I.; Calmet, I.; Chen, F.; Coutts, A.; et al. Initial results from Phase 2 of the international urban energy balance model comparison. Int. J. Climatol. 2011, 31, 244–272. [Google Scholar] [CrossRef]
  4. Garbero, V.; Milelli, M.; Bucchignani, E.; Mercogliano, P.; Varentsov, M.; Rozinkina, I.; Rivin, G.; Blinov, D.; Wouters, H.; Schulz, J.P.; et al. Evaluating the urban canopy scheme TERRA_URB in the COSMO model for selected European cities. Atmosphere 2021, 12, 237. [Google Scholar] [CrossRef]
  5. Howard, L. The Climate of London: Deduced from Meteorological Observations Made in The Metropolis and at Various Places Around It; Harvey and Darton, J. and A. Arch, Longman, Hatchard, S. Highley and R. Hunter: London, UK, 1833; Volume 3. [Google Scholar]
  6. Chandler, T. Surface breeze effects of Leicester’s heat island. East Midl. Geogr. 1961, 15, 32–38. [Google Scholar]
  7. Oke, T. Towards a more rational understanding of the urban heat island. McGill Climatol. Bull. 1969, 3, 1–21. [Google Scholar]
  8. Oke, T.R. The energetic basis of the urban heat island. Q. J. R. Meteorol. Soc. 1982, 108, 1–24. [Google Scholar] [CrossRef]
  9. Campanale, A.; Adinolfi, M.; Raffa, M.; Schulz, J.P.; Mercogliano, P. Investigating Urban Heat Island Dynamics Over Rome and Milan Through the Urban Parameterization Terra_Urb Implemented in the Icon Atmospheric Model. 2024. Available online: https://doi.org/10.2139/ssrn.4756850 (accessed on 11 September 2024).
  10. Trusilova, K.; Früh, B.; Brienen, S.; Walter, A.; Masson, V.; Pigeon, G.; Becker, P. Implementation of an Urban Parameterization Scheme into the Regional Climate Model COSMO-CLM. J. Appl. Meteorol. Climatol. 2013, 52, 2296–2311. [Google Scholar] [CrossRef]
  11. Demuzere, M.; Harshan, S.; Järvi, L.; Roth, M.; Grimmond, C.S.B.; Masson, V.; Oleson, K.; Velasco, E.; Wouters, H. Impact of urban canopy models and external parameters on the modelled urban energy balance in a tropical city. Q. J. R. Meteorol. Soc. 2017, 143, 1581–1596. [Google Scholar] [CrossRef]
  12. Li, Y.; Schubert, S.; Kropp, J.P.; Rybski, D. On the influence of density and morphology on the Urban Heat Island intensity. Nat. Commun. 2020, 11, 2647. [Google Scholar] [CrossRef]
  13. Wouters, H.; Demuzere, M.; Blahak, U.; Fortuniak, K.; Maiheu, B.; Camps, J.; Tielemans, D.; van Lipzig, N.P.M. The efficient urban canopy dependency parametrization (SURY) v1.0 for atmospheric modelling: Description and application with the COSMO-CLM model for a Belgian summer. Geosci. Model Dev. 2016, 9, 3027–3054. [Google Scholar] [CrossRef]
  14. Bucchignani, E.; Mercogliano, P.; Garbero, V.; Milelli, M.; Varentsov, M.; Rozinkina, I.; Rivin, G.; Blinov, D.; Kirsanov, A.; Wouters, H.; et al. Analysis and Evaluation of TERRA_URB Scheme: PT AEVUS Final Report; COSMO Technical Report 40; Deutscher Wetterdienst: Offenbach, Germany, 2019. [Google Scholar] [CrossRef]
  15. Schulz, J.P.; Mercogliano, P.; Adinolfi, M.; Apreda, C.; Bassani, F.; Bucchignani, E.; Campanale, A.; Cinquegrana, D.; Dumitrache, R.; Fedele, G.; et al. A new urban parameterisation for the ICON atmospheric model. In Proceedings of the EMS Annual Meeting 2022, Bonn, Germany, 4–9 September 2022. Number 501 in EMS2022. [Google Scholar] [CrossRef]
  16. Goger, B.; Dipankar, A. The impact of mesh size, turbulence parameterization, and land-surface-exchange scheme on simulations of the mountain boundary layer in the hectometric range. Q. J. R. Meteorol. Soc. 2024, 150, 3853–3873. [Google Scholar] [CrossRef]
  17. Shikhovtsev, A.Y.; Kovadlo, P.G.; Lezhenin, A.A.; Gradov, V.S.; Zaiko, P.O.; Khitrykau, M.A.; Kirichenko, K.E.; Driga, M.B.; Kiselev, A.V.; Russkikh, I.V.; et al. Simulating Atmospheric Characteristics and Daytime Astronomical Seeing Using Weather Research and Forecasting Model. Appl. Sci. 2023, 13, 6354. [Google Scholar] [CrossRef]
  18. Otero-Casal, C.; Patlakas, P.; Prósper, M.A.; Galanis, G.; Miguez-Macho, G. Development of a High-Resolution Wind Forecast System Based on the WRF Model and a Hybrid Kalman-Bayesian Filter. Energies 2019, 12, 3050. [Google Scholar] [CrossRef]
  19. Briegel, F.; Wehrle, J.; Schindler, D.; Christen, A. High-resolution multi-scaling of outdoor human thermal comfort and its intra-urban variability based on machine learning. Geosci. Model Dev. 2024, 17, 1667–1688. [Google Scholar] [CrossRef]
  20. Zängl, G.; Reinert, D.; Rípodas, P.; Baldauf, M. The ICON (ICOsahedral Non-hydrostatic) modelling framework of DWD and MPI-M: Description of the non-hydrostatic dynamical core. Q. J. R. Meteorol. Soc. 2015, 141, 563–579. [Google Scholar] [CrossRef]
  21. Schulz, J.P.; Vogel, G.; Becker, C.; Kothe, S.; Rummel, U.; Ahrens, B. Evaluation of the ground heat flux simulated by a multi-layer land surface scheme using high-quality observations at grass land and bare soil. Meteorol. Z. 2016, 25, 607–620. [Google Scholar] [CrossRef]
  22. Hortal, M. The development and testing of a new two-time-level semi-Lagrangian scheme (SETTLS) in the ECMWF forecast model. Q. J. R. Meteorol. Soc. J. Atmos. Sci. Appl. Meteorol. Phys. Oceanogr. 2002, 128, 1671–1687. [Google Scholar]
  23. Raschendorfer, M. The new turbulence parameterization of LM. COSMO Newsl. 2001, 1, 89–97. [Google Scholar]
  24. Mironov, D.; Raschendorfer, M. Evaluation of Empirical Parameters of the New LM Surface-Layer Parameterization Scheme: Results from Numerical Experiments Including the Soil Moisture Analysis; DWD: Offenbach am Main, Germany, 2001. [Google Scholar]
  25. Hogan, R.J.; Bozzo, A. A flexible and efficient radiation scheme for the ECMWF model. J. Adv. Model. Earth Syst. 2018, 10, 1990–2008. [Google Scholar] [CrossRef]
  26. Lin, Y.L.; Farley, R.D.; Orville, H.D. Bulk parameterization of the snow field in a cloud model. J. Appl. Meteorol. Climatol. 1983, 22, 1065–1092. [Google Scholar] [CrossRef]
  27. Rutledge, S.A.; Hobbs, P.V. The mesoscale and microscale structure and organization of clouds and precipitation in midlatitude cyclones. XII: A diagnostic modeling study of precipitation development in narrow cold-frontal rainbands. J. Atmos. Sci. 1984, 41, 2949–2972. [Google Scholar] [CrossRef]
  28. Bechtold, P.; Köhler, M.; Jung, T.; Doblas-Reyes, F.; Leutbecher, M.; Rodwell, M.J.; Vitart, F.; Balsamo, G. Advances in simulating atmospheric variability with the ECMWF model: From synoptic to decadal time-scales. Q. J. R. Meteorol. Soc. J. Atmos. Sci. Appl. Meteorol. Phys. Oceanogr. 2008, 134, 1337–1351. [Google Scholar] [CrossRef]
  29. Tiedtke, M. A comprehensive mass flux scheme for cumulus parameterization in large-scale models. Mon. Weather. Rev. 1989, 117, 1779–1800. [Google Scholar] [CrossRef]
  30. Orr, A.; Bechtold, P.; Scinocca, J.; Ern, M.; Janiskova, M. Improved middle atmosphere climate and forecasts in the ECMWF model through a nonorographic gravity wave drag parameterization. J. Clim. 2010, 23, 5905–5926. [Google Scholar] [CrossRef]
  31. Lott, F.; Miller, M.J. A new subgrid-scale orographic drag parametrization: Its formulation and testing. Q. J. R. Meteorol. Soc. 1997, 123, 101–127. [Google Scholar]
  32. Reinert, D.; Rieger, D.; Prill, F. (Eds.) Working with the ICON Model. Deutscher Wetterdienst Business Area “Research and Development”. 2024. Available online: https://doi.org/10.5676/DWD_pub/nwv/icon_tutorial2024 (accessed on 2 July 2024).
  33. Team, U.; Bontemps, S.; Defourny, P.; Van Bogaert, E.; Team, E.; Arino, O.; Kalogirou, V.; Perez, J.R. GLOBCOVER 2009 Products Description and Validation Report; UCLouvain & ESA Team: Brussels, Belgium, 2011. [Google Scholar]
  34. Flanner, M.G. Integrating anthropogenic heat flux with global climate models. Geophys. Res. Lett. 2009, 36, L02801. [Google Scholar] [CrossRef]
  35. Wouters, H.; Varentsov, M.; Blahak, U.; Schulz, J.P.; Schättler, U.; Bucchignani, E.; Demuzere, M. User Guide for TERRA_URB v2.2: The Urban-Canopy Land-Surface Scheme of the COSMO Model; Deutscher Wetterdienst: Offenbach, Germany, 2017. [Google Scholar] [CrossRef]
  36. Kanda, M.; Kawai, T.; Kanega, M.; Moriwaki, R.; Narita, K.; Hagishima, A. A simple energy balance model for regular building arrays. Bound.-Layer Meteorol. 2005, 116, 423–443. [Google Scholar] [CrossRef]
  37. Fortuniak, K.; Offerle, B.; Grimmond, C. Application of a slab surface energy balance model to determine surface parameters for urban areas. Lund Electron. Rep. Phys. Geogr. 2005, 5, 90–91. [Google Scholar]
  38. Bottazzi, M.; Scipione, G.; Marras, G.F.; Trotta, G.; D’Antonio, M.; Chiavarini, B.; Caroli, C.; Montanari, M.; Bassini, S.; Gascón, E.; et al. The Italian open data meteorological portal: MISTRAL. Meteorol. Appl. 2021, 28, e2004. [Google Scholar] [CrossRef]
  39. Schulz, J.P.; Vogel, G. Improving the Processes in the Land Surface Scheme TERRA: Bare Soil Evaporation and Skin Temperature. Atmosphere 2020, 11, 513. [Google Scholar] [CrossRef]
  40. Abbassi, Y.; Ahmadikia, H.; Baniasadi, E. Impact of wind speed on urban heat and pollution islands. Urban Clim. 2022, 44, 101200. [Google Scholar] [CrossRef]
  41. Droste, A.M.; Steeneveld, G.J.; Holtslag, A.A.M. Introducing the urban wind island effect. Environ. Res. Lett. 2018, 13, 094007. [Google Scholar] [CrossRef]
  42. Gaffin, S.; Rosenzweig, C.; Khanbilvardi, R.; Parshall, L.; Mahani, S.; Glickman, H.; Goldberg, R.; Blake, R.; Slosberg, R.; Hillel, D. Variations in New York city’s urban heat island strength over time and space. Theor. Appl. Climatol. 2008, 94, 1–11. [Google Scholar] [CrossRef]
  43. Santamouris, M. Analyzing the heat island magnitude and characteristics in one hundred Asian and Australian cities and regions. Sci. Total Environ. 2015, 512-513, 582–598. [Google Scholar] [CrossRef] [PubMed]
  44. Milelli, M.; Bassani, F.; Garbero, V.; Poggi, D.; von Hardenberg, J.; Ridolfi, L. Characterization of the Urban Heat and Dry Island effects in the Turin metropolitan area. Urban Clim. 2023, 47, 101397. [Google Scholar] [CrossRef]
  45. Zängl, G. Adaptive tuning of uncertain parameters in a numerical weather prediction model based upon data assimilation. Q. J. R. Meteorol. Soc. 2023, 149, 2861–2880. [Google Scholar] [CrossRef]
  46. Cinquegrana, D.; Zollo, A.L.; Montesarchio, M.; Bucchignani, E. A Metamodel-Based Optimization of Physical Parameters of High Resolution NWP ICON-LAM over Southern Italy. Atmosphere 2023, 14, 788. [Google Scholar] [CrossRef]
  47. Lauwaet, D.; Berckmans, J.; Hooyberghs, H.; Wouters, H.; Driesen, G.; Lefebre, F.; De Ridder, K. High resolution modelling of the urban heat island of 100 European cities. Urban Clim. 2024, 54, 101850. [Google Scholar] [CrossRef]
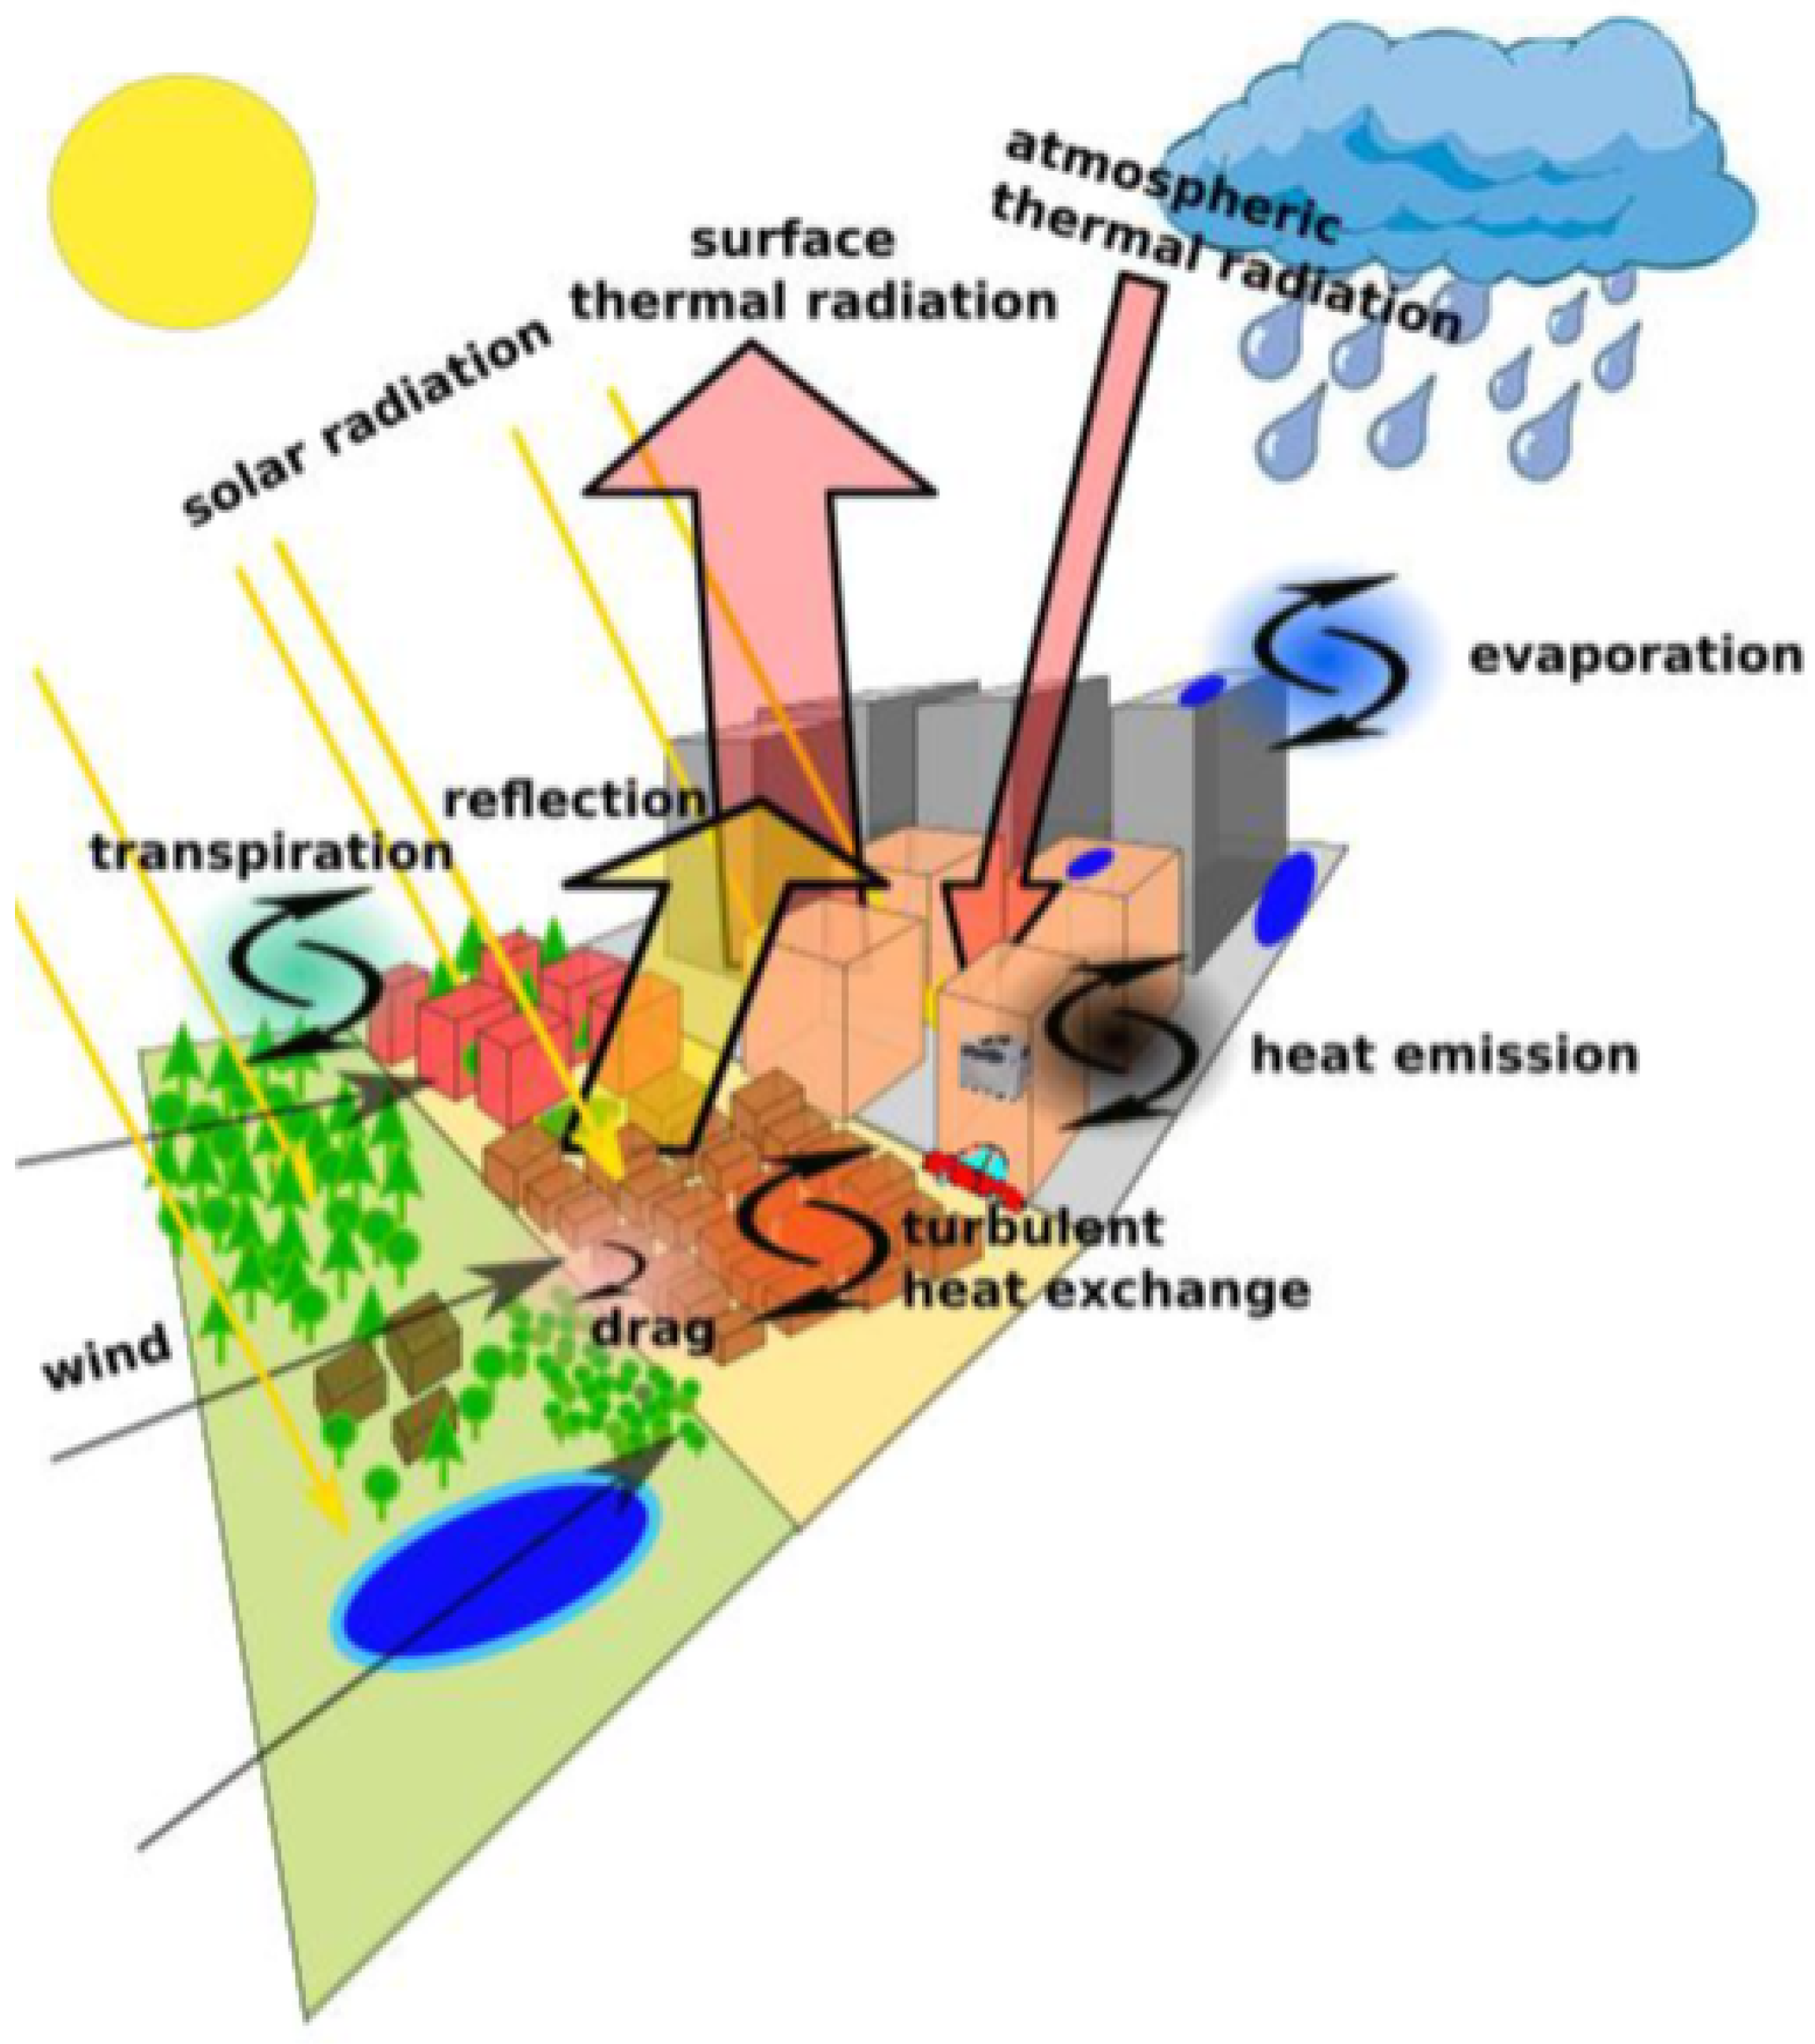
Figure 1. An overview of the urban–atmosphere interactions resolved by TERRA-URB, from Wouters et al. [35].
Atmosphere 15 01119 g001
Figure 2. The orography of the computational domain simulated, located in southern Italy.
Atmosphere 15 01119 g002
Figure 3. Surface air temperature anomaly for July 2022 over Europe, from https://www.copernicus.eu/en/media/image-day-gallery/surface-air-temperature-anomaly-july-2022 (accessed on 13 September 2024).
Atmosphere 15 01119 g003
Figure 4. ICON urban paved fraction values (fr_paved), over a zoomed domain considered for the model validation.
Atmosphere 15 01119 g004
Figure 5. Location of ground stations (a) and corresponding values of ICON urban paved fraction (b).
Atmosphere 15 01119 g005
Figure 6. Diurnal cycles for the variables analyzed, averaged over the considered week, with standard deviations: comparison of ICON output against ground station data.
Atmosphere 15 01119 g006
Figure 7. Diurnal cycles of T2m, Rh2m, Ws10m, and Wd10m, averaged over the considered week, with standard deviations: comparison of ICON output against rural and urban stations data.
Atmosphere 15 01119 g007
Figure 8. Taylor Diagram of T2m, Rh2m, Ws10m, and Wd10m for urban and rural stations: comparison between TU on and off.
Atmosphere 15 01119 g008aAtmosphere 15 01119 g008b
Figure 9. Diurnal cycle of transfer coefficients for heat in rural (a) and urban (b) stations.
Atmosphere 15 01119 g009
Figure 10. Diurnal cycle of Sensible Surface heat fluxes in rural (a) and urban (b) stations.
Atmosphere 15 01119 g010
Figure 11. Diurnal cycle of Latent Surface heat fluxes in rural (a) and urban (b) stations.
Atmosphere 15 01119 g011
Figure 12. Time series of T2m over the considered week, for selected stations (observational data and model output with TU on and off).
Atmosphere 15 01119 g012aAtmosphere 15 01119 g012b
Figure 13. Time series of Rh2m over the considered week, for selected stations (observational data and model output with TU on and off).
Atmosphere 15 01119 g013
Figure 14. Map of temperature differences provided by ICON, assuming TU on and off, over the Naples Metropolitan Area.
Atmosphere 15 01119 g014
Figure 15. Map of relative humidity differences provided by ICON assuming TU on and off, over the Naples Metropolitan Area.
Atmosphere 15 01119 g015
Figure 16. Diurnal cycle of an Urban Heat Island (a) and an Urban Dry Island (b), assuming TU is switched on and off.
Atmosphere 15 01119 g016
Figure 17. Diurnal cycle of an Urban Heat Island and an Urban Dry Island: ICON vs. Observed.
Atmosphere 15 01119 g017
Table 1. Ground stations in the Naples Metropolitan Area (urban stations are shown in bold).
StationsICONDz [m]
Namelatlonz [m]latlonz [m]fr_pavedObs–Icon
cmp080 (Napoli Vomero)40.8414.23215.0040.8414.23117.31.0097.74
San Marco Evangelista METEO41.0214.3427.0041.0214.3321.61.005.40
Grazzanise41.0914.1113.0040.9414.0210.40.252.64
Santa Maria a Vico41.0314.4999.0041.0314.4892.410.006.59
cmp015 (Pignataro Maggiore)41.1814.1669.0041.1814.1763.30.005.70
Pontelatone41.2014.24190.0041.2014.24166.10.0023.94
Table 2. Values of numerical indicators obtained, respectively, with TU on and off for UHI simulation.
RUNSTD_RATIOCorrelation ( ρ )BIAS
TUT1.350.900.28
TUF0.810.86−0.30
Disclaimer/Publisher’s Note: The statements, opinions and data contained in all publications are solely those of the individual author(s) and contributor(s) and not of MDPI and/or the editor(s). MDPI and/or the editor(s) disclaim responsibility for any injury to people or property resulting from any ideas, methods, instructions or products referred to in the content.