Abstract
Monitoring atmospheric pollution in urban areas is challenging because pollutant deposition occurs at short distances, requiring a large amount of sampling and analysis to characterize it. Ecological indicators can help overcome this problem, allowing us to select sites with the highest deposition of pollutants from the atmosphere. Nevertheless, a major gap is the temporal characterization of the accumulation rate of magnetic particles in ecological indicators, which is critical to understand if the bioaccumulation process is linear or if saturation occurs. To overcome this problem, Parmotrema perlatum lichens were magnetically and chemically studied in a pollution gradient over space and time. Lichen transplants were exposed over 18 weeks to a high-traffic road. Results show that magnetic properties and element composition reflected both distance from the road (nonlinear decrease of up to 100 m from source) and exposure time (increasingly linearly over the entire study period with eightfold increments), showing that up to 18 weeks, the accumulation rate remained constant over time, with no saturation occurring. Chemical analysis showed a strong linear relationship between the accumulation of zinc (Zn), antimony (Sb), manganese (Mn), copper (Cu) chromium (Cr) and magnetic susceptibility. Magnetization acquisition curves reveal a time-dependent low-coercivity component, interpreted as mainly related to nonexhaust, mostly brake abrasion particle emissions. It is concluded that the magnetic properties of lichen transplants can be used in urban environments to characterize the spatial and temporal patterns of the deposition of pollution metallic particles from the atmosphere.
1. Introduction
Poor air quality is a major environmental and wellbeing problem, with an estimated 4.2 million people dying prematurely each year for health issues related to degraded ambient air [1], especially related to particulate matter [2]. Increased urbanization can further exacerbate this problem [3,4]; thus, monitoring urban air quality and pollution sources is crucial to protect human health in cities.
Instrumental monitoring of air pollution is expensive, requiring the installation of an extensive network of automated stations to track air quality through space and time. For this reason, data with high spatial resolution on the concentration of pollutants are often lacking [5,6,7], hindering the capacity to identify critical areas for the implementation of air quality actions. Biomonitoring can thus be a useful approach to complement these networks [8,9], allowing for more extensive monitoring in a low-cost and efficient manner [10]. Furthermore, biomonitoring also reflects the effects of pollutants at the ecosystem level [11].
Epiphytic lichens are extensively used in biomonitoring studies [12,13] mainly due to their ability to accumulate contaminants at levels well above their metabolic requirements. These organisms, resulting from a symbiotic relationship between a mycobiont and one or more photobionts, depend on atmospheric wet and dry deposition for nutrient uptake, ultimately also taking up airborne particles in the process. Due to poor air quality, the presence and abundance of lichens in urban areas can be reduced, hampering their use for extensive biomonitoring purposes [14]. Lichen transplants, consisting of thalli taken from a relatively unpolluted area and then exposed in the targeted areas, are a viable alternative, allowing a more defined exposure time and the possibility to establish baseline values before exposure [15]. Thus, lichen transplants have frequently been used in urban studies to identify sources and spatial distribution patterns of several atmospheric pollutants, especially particulate matter [15,16,17].
Biomonitoring of particulate matter using lichen transplants can be specifically useful in urban areas where anthropogenic activities are impacting the air quality. In this sense, the analysis of the magnetic properties of airborne particulate matter is increasingly being used [18,19,20] due to its sensitivity to differentiate between pollution sources, e.g., magnetic particles emitted by engine combustion and brake wear [20]. Moreover, the joint use of magnetic and chemical analyses of exposed biological material for the study of air pollution has recently been developed. This multidisciplinary approach provides original data that complement those from automated stations well, with the ability to handle a large volume of samples at high spatial resolution.
However, one major gap is still constraining a wider use of magnetic biomonitoring to characterize atmospheric pollution, i.e., the characterization of the rate of accumulation of magnetic particles over time. This is critical to understand accumulation patterns and prove whether saturation is reached, as well as whether the bioaccumulation process is linear or not. To overcome this gap, we tested the accumulation pattern of magnetic particles through a lichen biomonitoring study, firstly over space and then over time. In the spatial experiment, samples were exposed at increasing distances from a pollution source (a high-traffic road in Lisbon) to evaluate bioaccumulation as a function of distance. In the temporal experiment, lichen transplants were exposed for 18 weeks at the site with the highest accumulation observed over space and retrieved over time to estimate any temporal trends in bioaccumulation.
To evaluate the bioaccumulation of metallic particles and to characterize their nature, chemical analyses were combined with magnetic measurements, including magnetic susceptibility and its frequency-dependent variability, isothermal remanent magnetization, and its unmixing and hysteresis loops.
2. Materials and Methods
2.1. Study Area, Lichen Species, and Sampling Design
The spatial and temporal studies were carried out in Lisbon, near a high-traffic road. This was located within the campus of the Faculty of Science of the University of Lisbon (Figure 1), located in the northern part of Lisbon city, adjacent to a highway. The lichen Parmotrema perlatum (Huds.) M. Choisy was selected as an ecological indicator. Thalli were collected from a pine forest in the Sintra municipality where the species is abundant, approximately 30 km from Lisbon and away from local sources of air pollution. In the laboratory, samples were cleaned from extraneous matter such as bark, other lichen or moss species, plant fragments, and insects. The preparation was performed manually, with gloves, without any metal tools, and without washing.
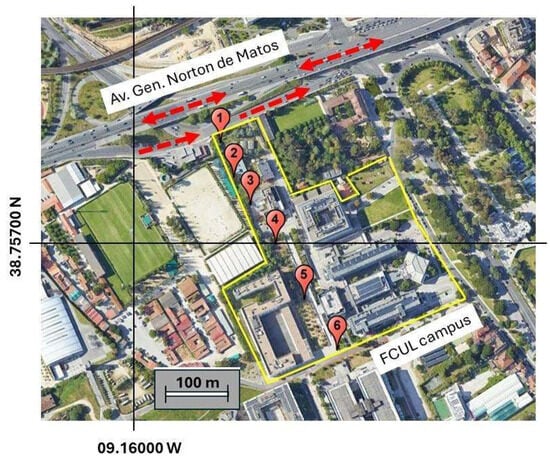
Figure 1.
Google Earth view of the sampling site (Google Earth Pro 7.3.6.9796, Imagery Date: 20 April 2023, accessed: 22 February 2024). Coloured dots indicate lichen transplants exposed in points 1 to 6. The urban highway Av. General Norton de Matos is marked by the red arrows.
The randomly sampled lichen transplants were then enveloped inside a plastic net, and the resulting bags were tied to the branches of trees at the selected sampling points at a height of ca. 2.5 m from the ground.
For the spatial study, lichen transplants were exposed in winter 2021–2022 for 12 weeks (7 December 2021 to 11 March 2022) along a 340 m long transect, with 6 sampling points spaced 50 m to 80 m each other. Point 1 is located near a highway with a high traffic load of roughly 110.000 cars per day, which is assumed as the main local source of metallic pollution. Point 6 is the furthest from the pollution source and relatively removed from any local air pollution source. At each sampling point, 1 lichen transplant was deployed, from which 2 subsamples were obtained for magnetic and chemical analysis, allowing 12 subsamples to be analyzed.
For the temporal study that developed between May and early September 2022, 6 lichen transplants were placed on sampling point 1 (a Myoporum sp. tree). One transplant bag was successively retrieved after 1, 2, 4, 8, 12, and 18 weeks of exposure. From each transplant bag, 3 subsamples were obtained, allowing 18 subsamples to be analyzed.
2.2. Magnetic Analysis
Magnetic parameters provide information on the concentration, magnetic domain state or indirectly the grain size, and the mineralogy of magnetic particles in a sample, e.g., [21,22,23]. The low-field magnetic susceptibility is one of the most widely used properties in environmental magnetism, depending on the concentration of magnetic grains and providing information on the type of magnetic minerals present in a sample. The low-field magnetic susceptibility, using multifrequency alternating fields, is commonly used to evaluate the abundance of ferrimagnetic particles in the grain size transition between superparamagnetic (SP) to stable single domain (SSD) [24,25].
The percentage frequency-dependent susceptibility is expressed as
with χ(lf) and χ(hf) being the magnetic susceptibility measured, respectively, at low frequency (lf) and high frequency (hf) [26]. As this parameter depends on the operating frequencies of the instrument used to measure the magnetic susceptibility, Hrouda [27] proposed a new normalization parameter χ(FN)% (or the percentage loss of susceptibility) that renormalizes the previously defined χ(FD)%, considering the operating frequencies; it is expressed as
The magnetic susceptibility χ was measured with a Kappabridge MFK1-FA (AGICO) using flf = 967 Hz and fhf = 15,616 Hz, with a field intensity of 200 A/m. From now on, the normalized percentage loss of susceptibility, χ(FN)%, will be used.
An Isothermal Remanent Magnetization (IRM) acquisition curve was used to identify mixtures of magnetic materials. The IRM was acquired with a field up to 1.1 T by means of an ASC Impulse Magnetizer model IM-10-30 and measured by a JR-6 Spinner (AGICO, Brno, Czech Republic) magnetometer. The samples were inserted inside cubic plastic holders (8 cm3) and their masses were determined. They were previously demagnetized by an LDA-3A demagnetizer in an alternating magnetic field (AF) up to 100 mT.
The IRM acquisition curves were analyzed and unmixed using an inversion technique that may be applied to mixtures of at least two magnetic components to estimate their microcoercivity distributions [28] using the MaxUnmix program [29] for the determination of the parameters B½ and DP. The coercivity B½ is the magnetic field that must be applied to reach half of the saturation magnetization and is interpreted as an estimation of coercivity of remanence, Bcr. DP is a dispersion parameter that reflects the distribution of the apparent coercivities of a mineral phase and gives an indication of the grain size homogeneity.
For hysteresis loops, lichen fragments were inserted into gel caps and subjected to magnetic fields up to 1T. The coercive force (Bc), the saturation remanent magnetization (Mrs), and the saturation magnetization (Ms) were determined after subtracting the high-field linear trend and dividing the magnetization for the mass of the sample. The coercivity of the remanence (Bcr) was determined from the backfield application curve, after saturating at 1 T. The domain state and magnetic grain size of the samples were compared with theoretical magnetite according to the hysteresis ratios Mrs/Ms vs. Bcr/Bc in the Day plot [30,31,32].
Magnetic susceptibility and IRM were measured in the Paleomagnetic Laboratory—IDL-FCUL, Lisbon, and hysteresis loops were performed in the Paleomagnetism Laboratory of INGV, Rome, using a Lakeshore 8604 VSM magnetometer.
2.3. Chemical Analysis
The decrease in metal bioaccumulation in lichens with distance from busy roads is well known [33,34], and hence, chemical analysis was performed only on the samples used in the temporal study. About 250 mg for each lichen sample was acid-digested with 3 mL of HNO3 (67% concentration), 0.2 mL of HF (48% concentration), and 0.5 mL of H2O2 (30% concentration) in a microwave digestion system (Ethos 900, Milestone, Sorisole (BG)-Italy). Afterward, the samples were analyzed by ICP-MS (NexION 350x, Perkin Elmer) to quantify the content of aluminum (Al), barium (Ba), cadmium (Cd) chromium (Cr), copper (Cu), iron (Fe), manganese (Mn), antimony (Sb), and zinc (Zn). ICP-OES (Optima 2000 DV, Perkin Elmer) was used to measure sulfur (S). These elements were selected for being common traffic-related elements; S was added as a possible tracer of diesel exhaust emission. Analytical quality was verified using the certified reference materials IAEA-336 “Lichen” and GBW07604 “Poplar leaves” for Ni and S, not certified in IAEA-336, and was in the range (98–110%); imprecision of the analysis was expressed by the relative standard deviation of 3 replicates and was below 3% for all elements. Three measurements were repeated for each sample and the results were expressed on a dry weight basis. The limit of detection (LOD) for each element (expressed as ng/g dw) was Al 0.03, Ba 0.002, Cd 0.004, Cr 0.01, Cu 0.007, Fe 0.2 Mn 0.002, S 30, Sb 0.002, Zn 0.1.
Chemical analyses were performed at the Laboratory of Applied and Environmental Botany of the University of Siena.
2.4. Statistical Analysis
To quantify the similarity in the trends of element accumulation and magnetic susceptibility, a correlation analysis was run between these variables using the Spearman coefficient and a significance level of p < 0.05. Regression of magnetic susceptibility was run with time and SIRM as explanatory variables, checking for normality of residues with the Shapiro–Wilk test. All statistical analyses were run using the R software (R Core Team 2024, ver 4.4.1).
3. Results
3.1. Spatial Experiment: Magnetic Susceptibility
The unexposed sample showed χ(0) = 1.9 × 10⁻⁸ m3/kg (Figure 2a), and all exposed samples showed higher values, varying between χ (point 1) = 18 × 10−3 m3/kg and χ (point 6) = 5 × 10⁻⁸ m3/kg. The nonlinear decrease in χ as a function of distance is evident from point 1 up to point 3 (≈100 m), becoming irregular from point 4 to point 6.
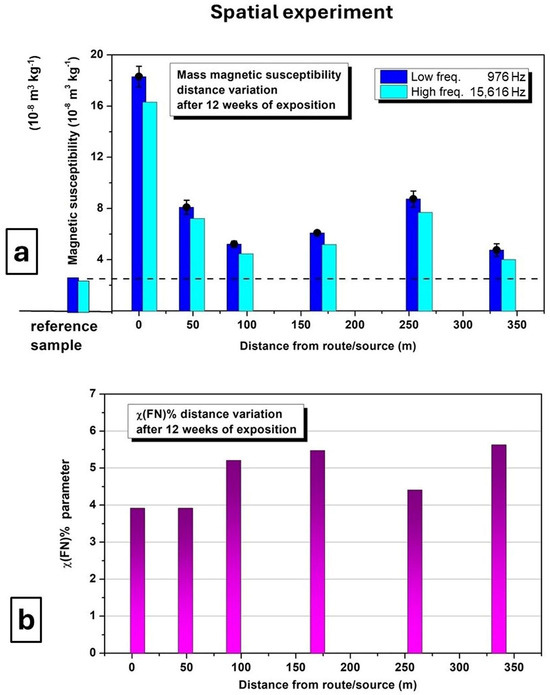
Figure 2.
Spatial experiment: (a) magnetic susceptibility of lichen transplants at low and high frequencies, as a function of distance between point 1 and point 6; (b) the normalized parameter of frequency-dependent magnetic susceptibility for the same samples.
The normalized χ(FN)% parameter (Figure 2b) is constrained between 4% and 6%, and the observed variation is not related to the distance from the source.
3.2. Temporal Experiment: Magnetic Susceptibility
Magnetic susceptibility χ(lf) varied from 3 × 10⁻⁸ m3/kg for the unexposed/control sample at week 0 to χ (lf) = 23 × 10−8 m3/kg at week 18, representing an eightfold increment of χ(lf). The temporal experiment showed a linear increase in the magnetic susceptibility values over time (R2 = 0.976), highlighting the regular bioaccumulation of metallic particles arising from the nearby road (Figure 3a). The progressive increase in χ values was not affected by the small rainfall episodes that were recorded during the experiment (Figure 3b). The evolution of the χ(FN)% parameter (Figure 3c) shows a maximum attained at week 2, followed by a distinct and nearly linear decrease over time up to week 18.
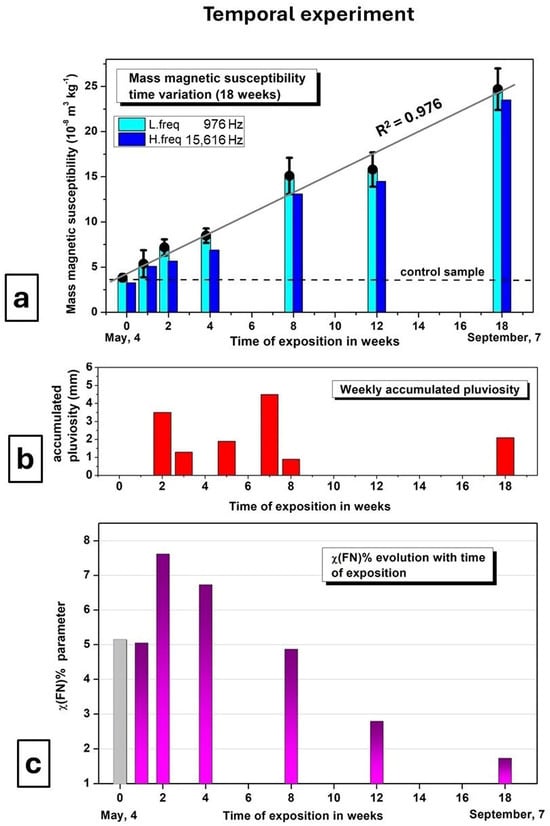
Figure 3.
Temporal experiment: (a) Low (L. freq) and high field (H. freq) magnetic susceptibility values of lichen transplants over 18 weeks. (b) Weekly accumulated rainfall. (c) Normalized parameter of frequency-dependent magnetic susceptibility over time of exposure.
3.3. Temporal Experiment: Magnetic Properties and IRM Acquisition
The IRM acquisition curves (Figure 4a) of selected samples of the time experiment, for week 0 (reference) and weeks 1, 4, 8, and 18 showed that 95% of saturation of the remanent magnetization is acquired at applied fields < 250 mT. The IRM is usually saturated at 500 mT, where it can be considered the SIRM. The Gradient Acquisition Plot (GAP) curves and the unmixed magnetic coercivity components are shown in Figure 4b–f. The week 0 unexposed sample is characterized by one dominant (98%) medium coercivity component centered at B½ = 42.7 mT and a minor (2%) high coercivity component centered at 672.4 mT. Conversely, all exposed samples showed three magnetic components. A soft coercivity component (B½ < 20 mT) is added to the medium and high coercivity components, with an average B½ value between 40 mT and 70 mT and B½ > 650 mT, respectively. For the medium and the high coercivity components, the B½ values systematically increase with the time of exposure. The low coercivity component does not show the same trend and B½ < 20 mT throughout the exposure time.
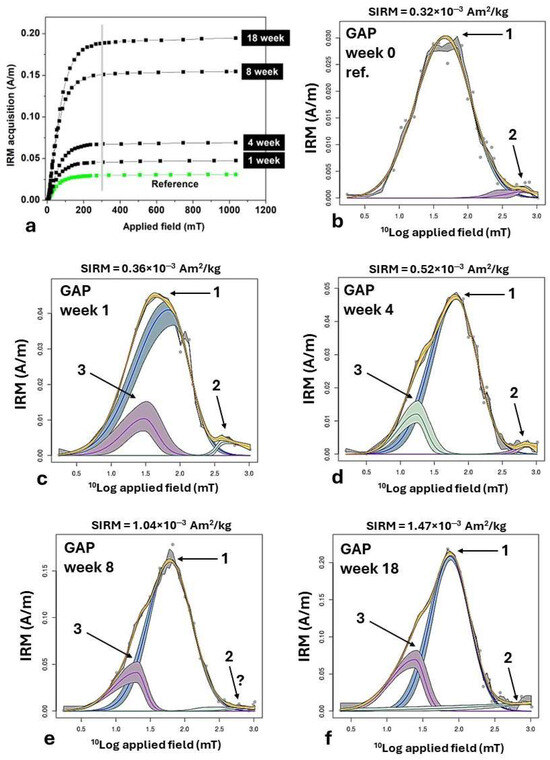
Figure 4.
(a) IRM acquisition up to 1.1 T for the unexposed sample and for the 1-, 4-, 8-, and 18-week exposure time. (b–f) The GAP diagrams, with the coercivity distribution model through the MaxUnmix software (https://shinyapps.carleton.edu/max-unmix/; update 2019; accessed March 2024). Yellow curve represent modelled coercivity distribution and shaded areas represent 95% confidence intervals associated with each component.
The increase in the overall SIRM confirms the progressive acquisition of metallic particles throughout the exposure time. The relevant parameters that characterize the magnetic components obtained by the IRM acquisition are presented in Table 1.

Table 1.
Summary results for the unmixing of coercivities from the time experiment samples. For each component, the SIRM, the B½ value, the percentage contribution (in parentheses), and the DP value of that component are indicated. X means no observed component.
In addition, it is possible to observe (Figure 5) a strong linear relationship between the low-frequency susceptibility and SIRM (R2 = 0.983).
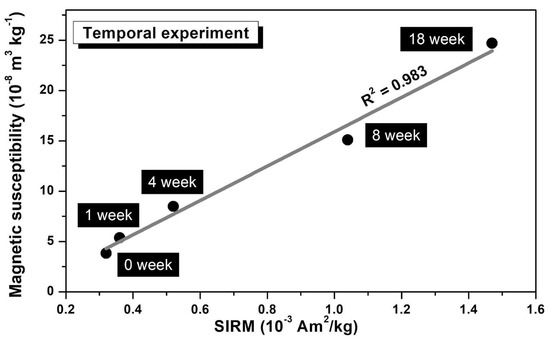
Figure 5.
Plot of low-frequency magnetic susceptibility and SIRM.
3.4. Spatial and Temporal Experiments: The Day Plot
Hysteresis loops were performed for both temporal and spatial experiments, and their respective parameters were calculated for evaluating the domain state/magnetic grain size in the Day plot. In the diagrams, the points calculated for the samples were compared with the “pure” exhaust and brake emissions [20,35]. Both plots, whether from the spatial (Figure 6a) or temporal (Figure 6b) experiments, show that all the samples fall in the PSD central region of the plot. In the spatial experiment, all the points but “point 1” are clustered and slightly shifted with respect to the unexposed sample. Point 1 is closer to the “brakes” emissions, highlighting the bioaccumulation of compatible metallic emissions. In the time experiment, the points shift towards the “brake “emissions as the duration of the exposure increases. The time experiment shows a magnetic granulometry close to the theoretical mixing curve for SD and MD magnetite grains, with increasing income of MD particles as the time of exposure increases.
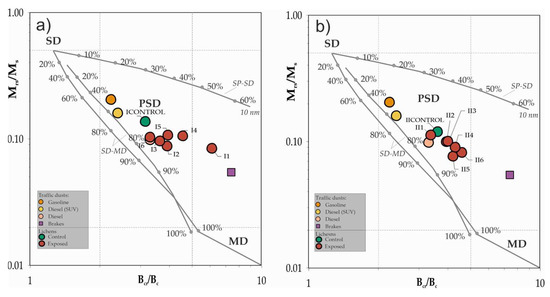
Figure 6.
Bilogarithmic Day plot: (a) space experiment, (b) time experiment. The hysteresis ratios were computed for lichen transplants (red circles for the exposed bags, green circles for control samples) and reported together with the average points for different kinds of fuel exhaust (orange, yellow, and pink circles) and brake dust emissions (purple square) calculated from [35]. The SD (single-domain), PSD (pseudo-single-domain), and MD (multidomain) fields and the theoretical mixing trends for SD-MD and SP-SD pure magnetite particles (SP, superparamagnetic) are from [32,33].
3.5. Chemical Analysis
The accumulation of chemical elements along the 18 weeks of exposure of the temporal experiment was relatively modest, and the ratios of the maximum concentration measured for each element to pre-exposure values (Table 2) are in the range of 1.1 (Ba) to 2.2 (Sb). To highlight the temporal pattern of element accumulation, the results are presented as exposed-to-unexposed (EU) ratios; EU values of magnetic susceptibility are also presented (Table 2). The elements for which a significant (p < 0.05) correlation was found are shown in Figure 7.

Table 2.
Concentrations (mg/kg dw) in unexposed samples and maximum values measured in exposed samples. In the first column is the corresponding low-frequency magnetic susceptibility, χ (m3/kg), in lichen transplants and the ratios of exposed-to-unexposed (EU) values of magnetic susceptibility during the 18 weeks of the temporal experiment. NS means nonsignificant p-value for correlation.
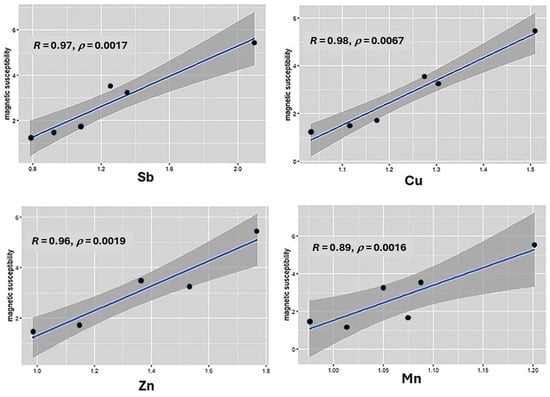
Figure 7.
Linear relation between magnetic susceptibility and the chemical trace elements for which a significant Spearman correlation was found.
4. Discussion
The spatial experiment highlighted a nonlinear decay of magnetic susceptibility from point 2 (≈50 m) to point 6. Using tree leaves [36], it was previously found that χ values decrease to a magnetic background level 20–30 m away from high-traffic roads, as confirmed [37] using lichen transplants. In the Day plot, only point 1 was mainly influenced by nonexhaust brake emissions, while at points 2 to 6, the bioaccumulation of metallic particles may have resulted from a combination of fuel exhausts and other diffuse or natural sources.
The temporal experiment showed that, at least up to 18 weeks, the accumulation of metallic particles, as inferred from the increase in magnetic susceptibility, was linearly time-dependent. χ(lf) and SIRM showed a strong linear relationship, suggesting that they are carried by the same magnetic fractions. Thus, it is possible to exclude relevant variations in the abundance of ultrafine superparamagnetic (SP) particles that enhance the magnetic susceptibility value, while not contributing to SIRM. χ(FN)% values were lower than 8% in both experiments, thus highlighting a low to moderate input of SP particles that can be mostly related to natural sources, recalling that in sediments and soils, SP magnetite grains cause a frequency dependence of low-field susceptibility that usually does not exceed 15 percent/decade of frequency [25].
The SIRM unmixing reveals that low-coercivity MD magnetite was the main accumulated magnetic component, considering that its component systematically increased with time to up to more than 20% contribution to the total remanence magnetization in the 18-week exposure period.
The B½ values of the medium and the hard coercivity components regularly increase with time (Table 1), suggesting the incoming of metallic particles of higher coercivities with respect to those already present before transplanting and/or the progressive oxidation of the bioaccumulated particles. The results of the unmixing methodology are coherent with the Day plot, where the progressive bioaccumulation of softer coercivity magnetic particles shifts the points toward the “brake” area of the plot. This is also consistent with the strong correlations emerging between magnetic susceptibility and several chemical elements, namely Cr, Cu, Mn, Sb, Zn, which are well-known tracers of brake and tire abrasion [20,38]. We can thus suggest that the soft coercivity component, whose proportion increases with time, is mainly related to nonexhaust (i.e., brake abrasion) emissions, with secondary components due to exhaust emissions and natural sources superimposed to those originally carried by the unexposed lichens. The increasing coercivities may be connected to fine exhaust emission and oxidation.
Moreover, the spectrum of unmixed coercivities is coherent with tailpipes and brake pads data in [39], thus confirming that vehicular emissions are the main sources of the particles progressively bioaccumulated by lichens. More specifically, the analysis of the coercivity components from the Isothermal Remanent Magnetization acquisition curves reveals a time-dependent low-coercivity component whose contribution to the overall magnetization increases almost continuously with time. This low-coercivity component is interpreted as being mainly related to nonexhaust (i.e., brake abrasion) emissions, while the other two higher coercivity components are most probably connected to fine exhaust emissions, natural components, and oxidized particles as well. Overall, regarding sources of pollutants, it was observed a good coherence between the results from the SIRM/unmixing analysis and the hysteresis ratios presented in the Day plot, resulting in the progressive accumulation of softer, low-coercivity magnetic particles shifting the points towards the “brake area” of the plot.
The parameter χ(FN)% shows a progressive decay with time of exposure. If the source of contamination does not change during the time experiment, this behavior may suggest a decrease in the relative quantity of ultrafine particles, magnetically SP, with respect to the magnetically stable components.
There are multiple and possibly concurring interpretations of this: (1) SP particles are lost over time due to their increased volatility with respect to larger particles immobilized within the lichen structure; (2) oxidation, which mainly involves smaller particles evolving towards hematite and reducing their contribution to the overall magnetic susceptibility values; and (3) measurement errors connected to the double frequency: the application of high-frequency magnetic field reduces the stability and the sensitivity of the instrument, whose performance increases with χ values. In this case, the difference between χ(lf) and χ(hf) may be triggered by the χ values.
The small changes in FN% values in the space experiment (Figure 2b) suggest that their decay in the time experiment is mainly linked to options 1 and 2.
5. Conclusions
The magnetic susceptibility measured in the lichen transplants linearly increased between the control and exposed samples up to 8 times after 18 weeks of exposure without reaching saturation.
Although the accumulation of chemical elements during the temporal experiment was relatively modest, a strong linear relationship emerged between the amount of Cu, Cr, Mn, Sb, and Zn and the magnetic susceptibility that was verified.
The SIRM analysis reveals a time-dependent low-coercivity component whose contribution to the overall magnetization increases almost continuously with time. This low-coercivity component is interpreted as mainly related to nonexhaust (i.e., brake abrasion) particle emissions, while the other two higher coercivity components are most probably connected to fine exhaust emissions, natural components, and oxidized particles as well.
A good coherence between the results from the SIRM/unmixing analysis and the hysteresis ratios presented in the Day plot is observed, resulting in the progressive accumulation of softer, low-coercivity magnetic particles shifting the points towards the “brake area” of the plot.
It is relevant to highlight that ultrafine particles were detected, as suggested by the frequency dependence of magnetic susceptibility, χ(FN)%, although they were found to decrease with time due to physiochemical alteration.
Thus, ecological indicators can be used to monitor atmospheric pollutant deposition over time. The combined interpretation of magnetic properties and chemical analysis shows that Parmotrema perlatum lichen transplants are suitable to provide fast proxies for the evaluation of air pollution connected to particulate matter emissions in urban environments.
Author Contributions
Conceptualization, M.M., B.R., P.P. and L.G.; methodology, M.M., B.R., P.P., L.G., S.L. and A.W.; formal analysis M.M., P.P., L.G., S.L. and A.W.; data interpretation, M.M., P.P., S.L. and A.W.; writing—original draft preparation M.M., B.R., P.P. and L.G.; Writing—Review and Editing, M.M., P.P., B.R., L.G., S.L. and A.W. All authors have read and agreed to the published version of the manuscript.
Funding
A.W. thanks the Istituto Nazionale di Geofisica e Vulcanologia grant “Progetto INGV Pianeta Dinamico”—code CUP D53J19000170001—funded by Italian Ministry MIUR (“Fondo Finalizzato al rilancio degli investimenti delle amministrazioni centrali dello Stato e allo sviluppo del Paese”, legge 145/2018). The Lakeshore 8604 VSM was funded by the Ministry of University and Research, project PON GRINT, code PIR01_00013.
Institutional Review Board Statement
Not applicable.
Informed Consent Statement
Informed consent was obtained from all subjects involved in the study.
Data Availability Statement
The data supporting the conclusions of this article will be made available by the authors on request.
Acknowledgments
M.M. work was supported by the Portuguese Fundação para a Ciência e a Tecnologia (FCT) I.P./MCTES through national funds (PIDDAC)–UIDB/50019/2020 (https://doi.org/10.54499/UIDB/50019/2020), UIDP/50019/2020 (https://doi.org/10.54499/UIDP/50019/2020) and LA/P/0068/2020 (https://doi.org/10.54499/LA/P/0068/2020). B.R. PhD grant (SFRH/BD/149323/2019) and CE3C/FC/ULisboa (UIDB/00329/2020 and 10.54499/UIDB/00329/2020). P.P to FCT (10.54499/2020.03415.CEECIND/CP1595/CT0006, 10.54499/DivRestore/0001/2020, 10.54499/UIDB/00329/2020).
Conflicts of Interest
The authors declare no conflicts of interest.
References
- World Health Organization. Available online: https://www.who.int/teams/environment-climate-change-and-health/air-quality-energy-and-health/sectoral-interventions/ambient-air-pollution/health-risks (accessed on 1 March 2024).
- Karagulian, F.; Belis, C.A.; Dora, C.F.C.; Prüss-Ustün, A.M.; Bonjour, S.; Adair-Rohani, H.; Amann, M. Contributions to cities’ ambient particulate matter (PM): A systematic review of local source contributions at global level. Atmos. Environ. 2015, 120, 475–483. [Google Scholar] [CrossRef]
- Goossens, J.; Jonckheere, A.-C.; Dupont, L.J.; Bullens, D.M.A. Air Pollution and the Airways: Lessons from a Century of Human Urbanization. Atmosphere 2021, 12, 898. [Google Scholar] [CrossRef]
- Liu, H.; Cui, W.; Zhang, M. Exploring the causal relationship between urbanization and air pollution: Evidence from China. Sustain. Cities Soc. 2022, 80, 103783. [Google Scholar] [CrossRef]
- Olcese, L.E.; Toselli, B.M. Some aspects of air pollution in Córdoba, Argentina. Atmos. Environ. 2002, 36, 299–306. [Google Scholar] [CrossRef]
- Petkova, E.P.; Jack, D.W.; Volavka-Close, N.H.; Kinney, P.L. Particulate matter pollution in African cities. Air Qual. Atmos. Health 2013, 6, 603–614. [Google Scholar] [CrossRef]
- Zhao, L.; Xie, Y.; Wang, J.; Xu, X. A performance assessment and adjustment program for air quality monitoring networks in Shanghai. Atmos. Environ. 2015, 122, 382–392. [Google Scholar] [CrossRef]
- Domínguez-Morueco, N.; Augusto, S.; Trabalón, L.; Pocurull, E.; Borrull, F.; Schuhmacher, M.; Nadal, M. Monitoring PAHs in the petrochemical area of Tarragona County, Spain: Comparing passive air samplers with lichen transplants. Environ. Sci. Pollut. Res. 2017, 24, 11890–11900. [Google Scholar] [CrossRef]
- Marć, M.; Tobiszewski, M.; Zabiegała, B.; Guardia, M.D.L.; Namieśnik, J. Current air quality analytics and monitoring: A review. Anal. Chim. Acta 2015, 853, 116–126. [Google Scholar] [CrossRef]
- Jakubowski, M. Biological monitoring versus air monitoring strategies in assessing environmental–occupational exposure. J. Environ. Monit. 2012, 14, 348–352. [Google Scholar] [CrossRef]
- Wright, L.P.; Zhang, L.; Cheng, I.; Aherne, J.; Wentworth, G.R. Impacts and Effects Indicators of Atmospheric Deposition of Major Pollutants to Various Ecosystems—A Review. Aerosol Air Qual. Res. 2018, 18, 1953–1992. [Google Scholar] [CrossRef]
- Abas, A. A systematic review on biomonitoring using lichen as the biological indicator: A decade of practices, progress and challenges. Ecol. Indic. 2021, 121, 107197. [Google Scholar] [CrossRef]
- Budzyńska-Lipka, W.; Świsłowski, P.; Rajfur, M. Biological Monitoring Using Lichens as a Source of Information About Contamination of Mountain with Heavy Metals. Ecol. Chem. Eng. 2022, 29, 155–168. [Google Scholar] [CrossRef]
- Loppi, S.; Corsini, A.; Paoli, L. Estimating Environmental Contamination and Element Deposition at an Urban Area of Central Italy. Urban Sci. 2019, 3, 76. [Google Scholar] [CrossRef]
- Loppi, S.; Ravera, S.; Paoli, L. Coping with uncertainty in the assessment of atmospheric pollution with lichen transplants. Environ. Forensics 2019, 20, 228–233. [Google Scholar] [CrossRef]
- Boonpeng, C.; Sangiamdee, D.; Noikrad, S.; Boonpragob, K. Lichen biomonitoring of seasonal outdoor air quality at schools in an industrial city in Thailand. Environ. Sci. Pollut. Res. 2023, 30, 59909–59924. [Google Scholar] [CrossRef]
- Marié, D.C.; Chaparro, M.A.E.; Sinito, A.M.; Lavat, A. Magnetic biomonitoring of airborne particles using lichen transplants over controlled exposure periods. SN Appl. Sci. 2020, 2, 104. [Google Scholar] [CrossRef]
- Jordanova, D.; Petrov, P.; Hoffmann, V.; Gocht, T.; Panaiotu, C.; Tsacheva, T.; Jordanova, N. Magnetic signature of different vegetation species in polluted environment. Stud. Geophys. Geod. 2010, 54, 417–442. [Google Scholar] [CrossRef]
- Marié, D.C.; Chaparro, M.A.E.; Irurzun, M.A.; Lavornia, J.M.; Marinelli, C.; Cepeda, R.; Sinito, A.M. Magnetic mapping of air pollution in Tandil city (Argentina) using the lichen Parmotrema pilosum as biomonitor. Atmos. Pollut. Res. 2016, 7, 513–520. [Google Scholar] [CrossRef]
- Winkler, A.; Contardo, T.; Vannini, A.; Sorbo, S.; Basile, A.; Loppi, S. Magnetic Emissions from Brake Wear are the Major Source of Airborne Particulate Matter Bioaccumulated by Lichens Exposed in Milan (Italy). Appl. Sci. 2020, 10, 2073. [Google Scholar] [CrossRef]
- Verosub, K.L.; Roberts, A.P. Environmental magnetism: Past, present, and future. J. Geophys. Res. Solid Earth 1995, 100, 2175–2192. [Google Scholar] [CrossRef]
- Dunlop, D.J.; Özdemir, Ö. Rock Magnetism: Fundamentals and Frontiers; Cambridge University Press: Cambridge, UK, 1997; Volume 1-1. [Google Scholar]
- Tauxe, L.; Banerjee, S.K.; Butler, R.F.; Van der Voo, R. Essentials of Paleomagnetism, 5th Web Ed.; Univ of California Press: Berkeley, CA, USA, 2018. [Google Scholar]
- Dearing, J.A. Environmental Magnetic Susceptibility: Using the Bartington MS2 System; Chi Publishing: Kenilworth, IL USA, 1994; Available online: https://gmw.com/wp-content/uploads/2019/03/JDearing-Handbook-OM0409.pdf (accessed on 2 February 2024).
- Worm, H.-U. On the superparamagnetic-stable single domain transition for magnetite, and frequency dependence of susceptibility. Geophys. J. Int. 1998, 133, 201–206. [Google Scholar] [CrossRef]
- Dearing, J.A.; Dann, R.J.L.; Hay, K.; Lees, J.A.; Loveland, P.J.; Maher, B.A.; O’Grady, K. Frequency-dependent susceptibility measurements of environmental materials. Geophys. J. Int. 1996, 124, 228–240. [Google Scholar] [CrossRef]
- Hrouda, F. Models of frequency-dependent susceptibility of rocks and soils revisited and broadened: Models of frequency-dependent susceptibility. Geophys. J. Int. 2011, 187, 1259–1269. [Google Scholar] [CrossRef]
- Kruiver, P.P.; Dekkers, M.J.; Heslop, D. Quantification of magnetic coercivity components by the analysis of acquisition curves of isothermal remanent magnetisation. Earth Planet. Sci. Lett. 2001, 189, 269–276. [Google Scholar] [CrossRef]
- Heslop, D. On the statistical analysis of the rock magnetic S-ratio. Geophys. J. Int. 2009, 178, 159–161. [Google Scholar] [CrossRef]
- Day, R.; Fuller, M.; Schmidt, V.A. Hysteresis properties of titanomagnetites: Grain-size and compositional dependence. Phys. Earth Planet. Inter. 1977, 13, 260–267. [Google Scholar] [CrossRef]
- Dunlop, D.J. Theory and application of the Day plot (Mrs/Ms versus Hcr/Hc) 1. Theoretical curves and tests using titanomagnetite data. J. Geophys. Res. Solid Earth 2002, 107, EPM 4-1–EPM 4-22. [Google Scholar] [CrossRef]
- Dunlop, D.J. Theory and application of the Day plot (Mrs/Ms versus Hcr/Hc) 2. Application to data for rocks, sediments, and soils. J. Geophys. Res. Solid Earth 2002, 107, EPM 5-1–EPM 5-15. [Google Scholar] [CrossRef]
- Yemets, O.A.; Solhaug, K.A.; Gauslaa, Y. Spatial dispersal of airborne pollutants and their effects on growth and viability of lichen transplants along a rural highway in Norway. Lichenologist 2014, 46, 809–823. [Google Scholar] [CrossRef]
- Contardo, T.; Vannini, A.; Sharma, K.; Giordani, P.; Loppi, S. Disentangling sources of trace element air pollution in complex urban areas by lichen biomonitoring. A case study in Milan (Italy). Chemosphere 2020, 256, 127155. [Google Scholar] [CrossRef]
- Sagnotti, L.; Taddeucci, J.; Winkler, A.; Cavallo, A. Compositional, morphological, and hysteresis characterization of magnetic airborne particulate matter in Rome, Italy. Geochem. Geophys. Geosyst. 2009, 10, 2009GC002563. [Google Scholar] [CrossRef]
- Szönyi, M.; Sagnotti, L.; Hirt, A.M. A refined biomonitoring study of airborne particulate matter pollution in Rome, with magnetic measurements on Quercus ilex tree leaves. Geophys. J. Int. 2008, 173, 127–141. [Google Scholar] [CrossRef]
- Winkler, A.; Contardo, T.; Lapenta, V.; Sgamellotti, A.; Loppi, S. Assessing the impact of vehicular particulate matter on cultural heritage by magnetic biomonitoring at Villa Farnesina in Rome, Italy. Sci. Total Environ. 2022, 823, 153729. [Google Scholar] [CrossRef] [PubMed]
- Grifoni, L.; Winkler, A.; Lella, L.A.D.; Buemi, L.P.; Sgamellotti, A.; Spagnuolo, L.; Loppi, S. Magnetic and chemical biomonitoring of particulate matter at cultural heritage sites: The Peggy Guggenheim Collection case study (Venice, Italy). Environ. Adv. 2024, 15, 100455. [Google Scholar] [CrossRef]
- Letaïef, S.; Carvallo, C.; Franke, C.; Isambert, A.; Camps, P. Contributions and limitations of environmental magnetism to characterize traffic-related particulate matter sources. Geophys. J. Int. 2024, 237, 1505–1525. [Google Scholar] [CrossRef]
Disclaimer/Publisher’s Note: The statements, opinions and data contained in all publications are solely those of the individual author(s) and contributor(s) and not of MDPI and/or the editor(s). MDPI and/or the editor(s) disclaim responsibility for any injury to people or property resulting from any ideas, methods, instructions or products referred to in the content. |
© 2024 by the authors. Licensee MDPI, Basel, Switzerland. This article is an open access article distributed under the terms and conditions of the Creative Commons Attribution (CC BY) license (https://creativecommons.org/licenses/by/4.0/).