Article

Unusual Forbush Decreases and Geomagnetic Storms on 24 March, 2024 and 11 May, 2024

1
Nuclear and Particle Physics Section, Physics Department, National and Kapodistrian University of Athens, 15784 Athens, Greece
2
Pushkov Institute of Terrestrial Magnetism, Ionosphere and Radio Wave Propagation RAS (IZMIRAN), Troitsk, 108840 Moscow, Russia
3
Royal Belgian Institute for Space Aeronomy, 1180 Brussels, Belgium
4
DTU Space Division of Geomagnetism and Geospace, Technical University of Denmark, Centrifugevej, 356, 014, 2800 Kgs. Lyngby, Denmark
*
Author to whom correspondence should be addressed.
Atmosphere 2024, 15(9), 1033; https://doi.org/10.3390/atmos15091033
Submission received: 30 July 2024 / Revised: 20 August 2024 / Accepted: 22 August 2024 / Published: 26 August 2024

Abstract

:
As the current solar cycle 25 progresses and moves towards solar maxima, solar activity is increasing and extreme space weather events are taking place. Two severe geomagnetic storms accompanied by two large Forbush decreases in galactic cosmic ray intensity were recorded in March and May, 2024. More precisely, on 24 March 2024, a G4 (according to the NOAA Space Weather Scale for Geomagnetic Storms) geomagnetic storm was registered, with the corresponding geomagnetic indices Kp and Dst equal to 8 and −130 nT, respectively. On the same day, the majority of ground-based neutron monitor stations recorded an unusual Forbush decrease. This event stands out from a typical Forbush decrease because of its high amplitude decrease phase and rapid recovery phase, i.e., 15% decrease and an extremely rapid recovery of 10% within 1.5 h, as recorded at the Oulu neutron monitor station. Furthermore, on 10–13 May 2024, an unusual G5 geomagnetic storm (geomagnetic indices Kp = 9 and Dst = −412 nT) was registered (the last G5 storm had been observed in 2003). In addition, the polar neutron monitor stations recorded a Ground Level Enhancement (GLE74) during the recovery phase of a large Forbush decrease of 15%, which started on 10 May 2024. In this study, a detailed analysis of these two severe events in regard to the accompanying solar activity, interplanetary conditions and solar energetic particle events is provided. Moreover, the results of the NKUA “GLE Alert++ system”, the NKUA/IZMIRAN “FD Precursory Signals” method and the NKUA “ap Prediction tool” concerning these events are presented.

1. Introduction

Geomagnetic storms (GSs) are defined as intense magnetospheric disturbances accompanied by significant decreases in the horizontal component of the geomagnetic field H [1,2,3,4,5]. The ability to forewarn imminent GSs is of particular importance since they cannot only affect satellites’ electronics, navigation and telecommunication systems and high-potential power grids [6,7,8,9] but also human life, as shown by recent investigations [10,11,12].
GSs are complex phenomena and are a consequence of phenomena that originate in the solar corona and evolve in the solar wind, magnetosphere, ionosphere and thermosphere. More specifically, the effects of GSs on the Earth’s environment result from a chain of processes related to the flow and conversion of solar wind energy and the electrodynamic coupling between the interplanetary medium, the magnetosphere, the ionosphere and the upper layers of the Earth’s atmosphere [13,14].
GSs were first detected using ground-based magnetometers. The decrease in the horizontal component of the geomagnetic field depends on latitude and is maximum at the Equator and minimum at the poles [2,15]. This decrease is caused by the number of particles in the Earth’s ring current increasing. The ring current, located in the magnetosphere, circulates the Earth westward and is located from 2 to 4 Earth radii [15,16]. It shields the lower latitudes of the Earth from magnetospheric electric fields.
Geomagnetic activity is recorded by ground-based observatories and in order to quantify it, geomagnetic indices have been introduced [17,18]. Among others, the planetary Kp index measures the GSs’ intensity and can be used to give radiation risk indices for charging effects on spacecraft [19]. This index is measured every three hours with a scale of 0–9 (0—no geomagnetic storm, 9—intense disturbance). In general, the consequences are present on the Earth’s surface when Kp is 4 or higher. Moreover, the linear ap index is derived from Kp [5]. The ар index varies from 0 to 400 and represents the values of Kp converted to a linear scale in nT, which shows an equivalent amplitude disturbance at the station, which has a lower limit of 400 nT for K = 9. The daily Ap index is the average of eight ap indices for one day (https://www.swpc.noaa.gov/products/planetary-k-index, accessed on 20 June 2024; https://www.gfz-potsdam.de/en/section/geomagnetism/data-products-services/geomagnetic-kp-index, accessed on 20 June 2024). The ap index measures the Earth’s magnetic field disturbances on a global scale.
The development of a storm in middle latitudes is best defined by the Dst (Disturbance storm time) index. This index is extracted from magnetometers of mid-latitude and equatorial stations and is the instantaneous global mean value of the equatorial perturbation H [20]. The World Data Center for Geomagnetism in Kyoto, Japan, compiled this index in 1964 [21].
A GS mainly includes three phases [2,3,22,23] and the duration of typical storms is one to five days. The initial phase lasts approximately up to one day, the main storm phase lasts approximately one day, and the recovery phase several days [17,20]. During GSs, the intensity of the aurora increases, which can be observed not only at the poles but also at lower latitudes.
GSs, depending on their intensity, were originally categorized into four levels according to the Dst index values, i.e., weak (−50 nT < Dst ≤ −30 nT), moderate (−50 nT ≤ Dst ≤ −100 nT), intense (100 nT < Dst ≤ −200 nT) and extreme (Dst ≤ −200 nT) [4,23]. Nowadays, the NOAA Space Weather Prediction Center has classified GSs into five levels according to their intensity, i.e., Kp index value (https://www.swpc.noaa.gov/noaa-scales-explanation, accessed on 20 June 2024). Also, the specific scale provides the possible effects on human activities for each level, gives the frequency of occurrence of such phenomena and a measure of the intensity of the natural cause.
GSs are significant disturbances of the magnetosphere, which occur when the Interplanetary Magnetic Field (IMF) is oriented towards the South and maintains this orientation for an extended period of time [24]. Then, the phenomenon of magnetic reconnection can take place, in which the model of the open magnetosphere applies, that is, the magnetosphere is an open system of energy exchange with the solar wind [17]. Therefore, GSs are directly linked to solar activity and are initiated when disturbances in the solar wind reach the Earth’s magnetosphere [25]. Furthermore, GSs are divided into recurrent and non-recurrent [26,27].
Non-recurrent GSs occur near the maxima of solar activity [28,29]. They are caused by interplanetary disturbances due to coronal mass ejections (CMEs) [30]. These phenomena can exhibit a wide range of intensity and speed, but those most likely to produce a storm are the ones with velocities that exceed the ambient wind speed, resulting in the creation of a shock wave [14].
Recurrent storms occur every 27 days, following the rotation period of the Sun. They occur when the Earth interacts with the compressed plasma and IMF that has been formed in interplanetary space by the interaction of the slow and fast solar wind. These compressed regions are called Co-rotating Interaction Regions (CIRs) [31,32,33]. Recurrent storms occur at the end of the solar cycle [34]. More precisely, during the solar cycle’s descending phase, high-speed solar wind streams originating from coronal holes appear to dominate the periodic geomagnetic activity [35,36]. In this phase of the solar cycle, the coronal holes, regions of low temperature and open field lines, dominate the space and extend to the equatorial regions. From these regions, which have a long lifetime and are shown to rotate with the Sun [14], fast plasma currents constantly escape and “swallow” the magnetosphere once every ~27 days forming the so-called recurrent geomagnetic storms [36]. At a distance of 1 AU from the Sun, CIRs typically do not show rapidly advancing shock waves, so these events do not have an SSC in their initial phase [36]. Ref. [37] found that only about 30% of the CIRs in their study were found to be geoeffective.
As mentioned above, GSs occur when the effectiveness of the ring current to shield against the strong electric fields contained in the solar wind decreases. This happens during the transfer of solar energy via electrodynamic coupling between the interplanetary medium and the magnetosphere. These electric fields are created by the combination of two factors: the solar wind speed and the southward direction of the IMF. Of the two, the IMF is more important for individual storms, due to its more intense changes, while solar wind speed plays an important role in long-term geomagnetic activity [14].
During a solar cycle, two peaks of geomagnetic activity are observed, one just before and one after solar maximum [38]. During the maximum of the 11-year solar cycle, the number of sunspots, solar flares and other solar activity indices present a double peak. This behavior is also evident in some interplanetary and geomagnetic phenomena [39,40]. This structure is called the “Gnevyshev gap”, after the Russian astronomer who first noticed it [41,42]. For example, the “Gnevyshev gap” is present not only in the occurrence rate but also the peak intensity of particles during solar energetic particle events [43]. Moreover, in [44], the effects of the “Gnevyshev gap” on various space weather parameters are discussed. A study of the number of sunspots in relation to the number of intense GSs for the time period 1972–1996 shows that the geomagnetic activity faithfully follows the solar cycle, mainly at the beginning and towards the end of it [14].
When a CME arrives at the Earth, a rapid decrease in the observed galactic cosmic ray (GCR) flux will be observed due to their modulation by the shock wave associated with the CME. This phenomenon is known as a Forbush decrease (FD). Particle detectors on Earth, such as neutron monitors, but also muon detectors will observe FDs in the GCR background, which is continuously monitored. The dependence of FDs’ amplitude on cut-off rigidity ( R ) is described by R γ , where γ ranges from 0.4 to 1.2 [45]. Many scientists have examined whether the Sun’s polarity affects the dependence of FDs on cut-off rigidity but have reached a negative conclusion [46].
Very-high-energy SEP events associated with GeV protons can occasionally be observed as an increase in the background of ground-based neutron monitor observations and, in such cases, they are known as Ground Level Enhancements (GLEs). This increase is due to solar flares and coronal mass ejections. To record a GLE, the solar energetic ions’ energy should be such as to allow them to penetrate the magnetic field of the Earth and interact with the atmosphere. The Earth is shielded from lower-energy particles by the geomagnetic field. The shielding depends on the geomagnetic latitude, i.e., in the polar regions the shielding is minimum (zero), whereas in the equatorial regions, the shielding is maximum. As a result, protons with energy greater than 450 MeV can penetrate the magnetosphere of the Earth in the polar regions and generate a nuclear cascade in the atmosphere. On the other hand, for the equatorial regions, the respective energy is almost 15 GV.
This paper presents an analysis that was performed on the two severe GSs that recently occurred, respectively, on 24 March 2024 and during 10–13 May 2024. Both events were accompanied by a large FD. In addition, while the latter storm was occurring, a GLE event was registered. Section 2 describes the forewarning systems and method used (the “GLE Alert++ system”, the “FD Precursory Signals” method and the “ap Prediction tool”) that were used as part of the analysis. In Section 3, a detailed description of the space environment conditions (e.g., solar activity, interplanetary conditions, solar energetic particle events, cosmic ray intensity variations) during the 24 March 2024 event and the results obtained from the forewarning systems are provided. The 10–13 May 2024 event is described in the same way in Section 4. In Section 5, the findings of the analysis are discussed, and conclusions are provided.

2. Forewarning Systems and Method Used

2.1. GLE Alert++ System

The “GLE Alert ++ system”, built by the Athens Cosmic Ray Group of the National and Kapodistrian University of Athens (NKUA), is fully integrated as a federated product on the ESA SWE Portal (https://swe.ssa.esa.int/web/guest/anemos-federated, accessed on 20 June 2024) and is provided as part of the ESA Space Safety Program Space Weather Service Network under the Space Radiation Expert Service Center (R-ESC).
Based on ground-based neutron monitor observations, GLE Alert++ issues alerts when a GLE event starts to be registered. For this purpose, it relies on neutron monitor data from the high time-resolution Neutron Monitor Database (NMDB), which provides access to neutron monitor measurements from stations around the world and was implemented in the frame of the Seventh Framework Programme of the European Commission (https://www.nmdb.eu/, accessed on 20 June 2024).

2.2. FD Precursory Signals Method

The “FD Precursory Signals” method was developed by the Athens Cosmic Ray Group of NKUA and the Cosmic Ray Group of the Pushkov Institute of Terrestrial Magnetism, Ionosphere and Radiowave Propagation of the Russian Academy of Sciences (IZMIRAN) (https://tools.izmiran.ru/ros, accessed on 20 June 2024).
FD precursors are defined as the pre-decreases and/or pre-increases in cosmic ray intensity which usually precede FDs and the accompanying GSs [47]. They warn of the upcoming geomagnetic disturbance and are detected using the Ring of Stations method [48]. The “FD Precursory Signals” method analyzes figures presenting the cosmic ray intensity variations (decreases and increases) for different asymptotic longitudes as function of time [39].

2.3. ap Prediction Tool

The ap Prediction tool, built by the Athens Cosmic Ray Group of NKUA, is a demonstration product on the ESA SWE Portal (https://swe.ssa.esa.int/web/guest/ap_Prediction-federated, accessed on 20 June 2024). It is provided as part of the ESA Space Safety Program Space Weather Service Network under the Geomagnetic Expert Service Center (G-ESC) and was developed in the frame of the ESA Space Weather Network Development and Pre-Operation Part 1 [49].
Forecasting the ap index is of great importance since it correlates to the GSs and the “breadth” of the aurora oval. The aim of the “ap Prediction” software is to forecast the values of the ap geomagnetic index for the next 3, 6, 9, 12, 24, 48 and 72 h with a 3 h prediction interval. The arrival time of the CMEs is calculated using the NKUA Effective Acceleration Predicted Model (EAM) from the tool’s algorithm [50]. Furthermore, the linear regression machine learning algorithms are used for the estimation of the maximum ap value. Dependable variables are the angular width and the median velocity [51].

3. The Event on 24 March 2024

The G4 GS occurring on 24 March 2024 was accompanied by a large and unusual FD that was registered on the same day. A large FD registered on 24 March 1991 presented similar behavior to this one, but the recovery was not as fast (for more details, see Section 5). In the following a description of the solar activity, the solar energetic particles and interplanetary conditions which led to the development of the GS and the FD are presented.
(a)
Solar activity: A CME with radial velocity equal to 1613 km/s was registered on 23 March 2024, at 01:25 UT. According to the Community Coordinated Modeling Center CME Scoreboard (https://kauai.ccmc.gsfc.nasa.gov/CMEscoreboard/, accessed on 20 June 2024) and the majority of the acceleration models provided therein, the corresponding interplanetary CME (ICME) was expected to arrive at the Earth late on 24 March through 25 March. Moreover, the EAM predicted that the ICME was expected to reach the Earth from 24 March at 07:46 UT until 25 March at 06:42 UT. The actual shock arrival time of the CME was 24 March 2024 at 14:10 UT.
Furthermore, on 20–22 March 2024, a coronal hole, located at the southern hemisphere, rotated across the central meridian. As a result, the high-speed stream flowing from this coronal hole was expected to reach the Earth on 24–25 March 2024.
(b)
Solar energetic particle events: An X1.1 class solar flare from AR3614 peaking on 23 March 2024 at 01:33 UT (www.SolarMonitor.org, accessed on 20 June 2024) was associated with the aforementioned CME. Due to this solar flare, the Space Weather Prediction Center (SWPC) 10 MeV warning threshold of the GOES Proton Flux for particles with energies above 10 MeV was exceeded on 23 March 2024 at 08:10 UT. An S2 solar radiation storm was also registered (http://www.swpc.noaa.gov/products/space-weather-overview, accessed on 15 May 2024).
(c)
Interplanetary conditions: The CME on 23 March 2024 resulted in a peak in solar wind speed (~863 km/s) registered from ACE (Lagrangian Point L1) on 24 March 2024 at 20:35 UT. Regarding the IMF, a sharp decrease in the vertical component Bz (−23 nT) was recorded on 24 March 2024 at 15:20 UT (http://www.swpc.noaa.gov/products/real-time-solar-wind, accessed on 20 June 2024).
(d)
Geomagnetic activity: A GS of level G4 (severe storm) was also registered as a result of the arrival of the above-mentioned CME on 24 March 2024. The daily Ap index and the corresponding Kp index reached the values of 69 and 8. For this storm, the Dst index reached the minimum value (i.e., –130 nT) on 24 March 2024 at 21:00 UT (Real-time (Quicklook) Dst Index Monthly Plot and Table (kyoto-u.ac.jp), accessed on 20 June 2024).
(e)
Forbush decrease on 24 March 2024: Either ICMEs or CIRs could be the causing agents for two distinct space weather events such as FDs and GSs. The ground-based signature of the GS under study was a large FD in the GCR background. The event started on 24 March 2024 as a result of the arrival of the CME and was registered by the majority of the neutron monitor stations of the global network.
Many of the NMDB neutron monitors registered a rather unusual decrease in the GCR background since it presented a high-amplitude decrease phase and a rapid recovery phase.
The FD’s time profile for polar (SOPO, SOPB, APTY, OULU) and middle-latitude (ATHN) stations is presented in Figure 1. The occurrence of a typical FD is located within some days after the CME, its decrease phase lasts a few hours, and the cosmic ray intensity returns to background values during the following several days. However, this is not the case for the event mentioned herein, when a deep decrease in cosmic ray intensity and a very rapid increase were registered. For example, a 15% decrease and a very fast recovery of 10% within 1.5 h were reported at Oulu neutron monitor station (effective vertical cut-off rigidity 0.81 GV). The same behavior was also observed in SOPO and SOPB neutron monitors, amongst others.

3.1. The GLE Alert ++ System

It was highly possible that an alarm would be triggered because of the extremely rapid increase phase of the FD on 24 March 2024. For this reason, the GLE Alert++ system [52], amongst other alert systems, for example, Delaware University’s Alert system [53], issued an alert signal.
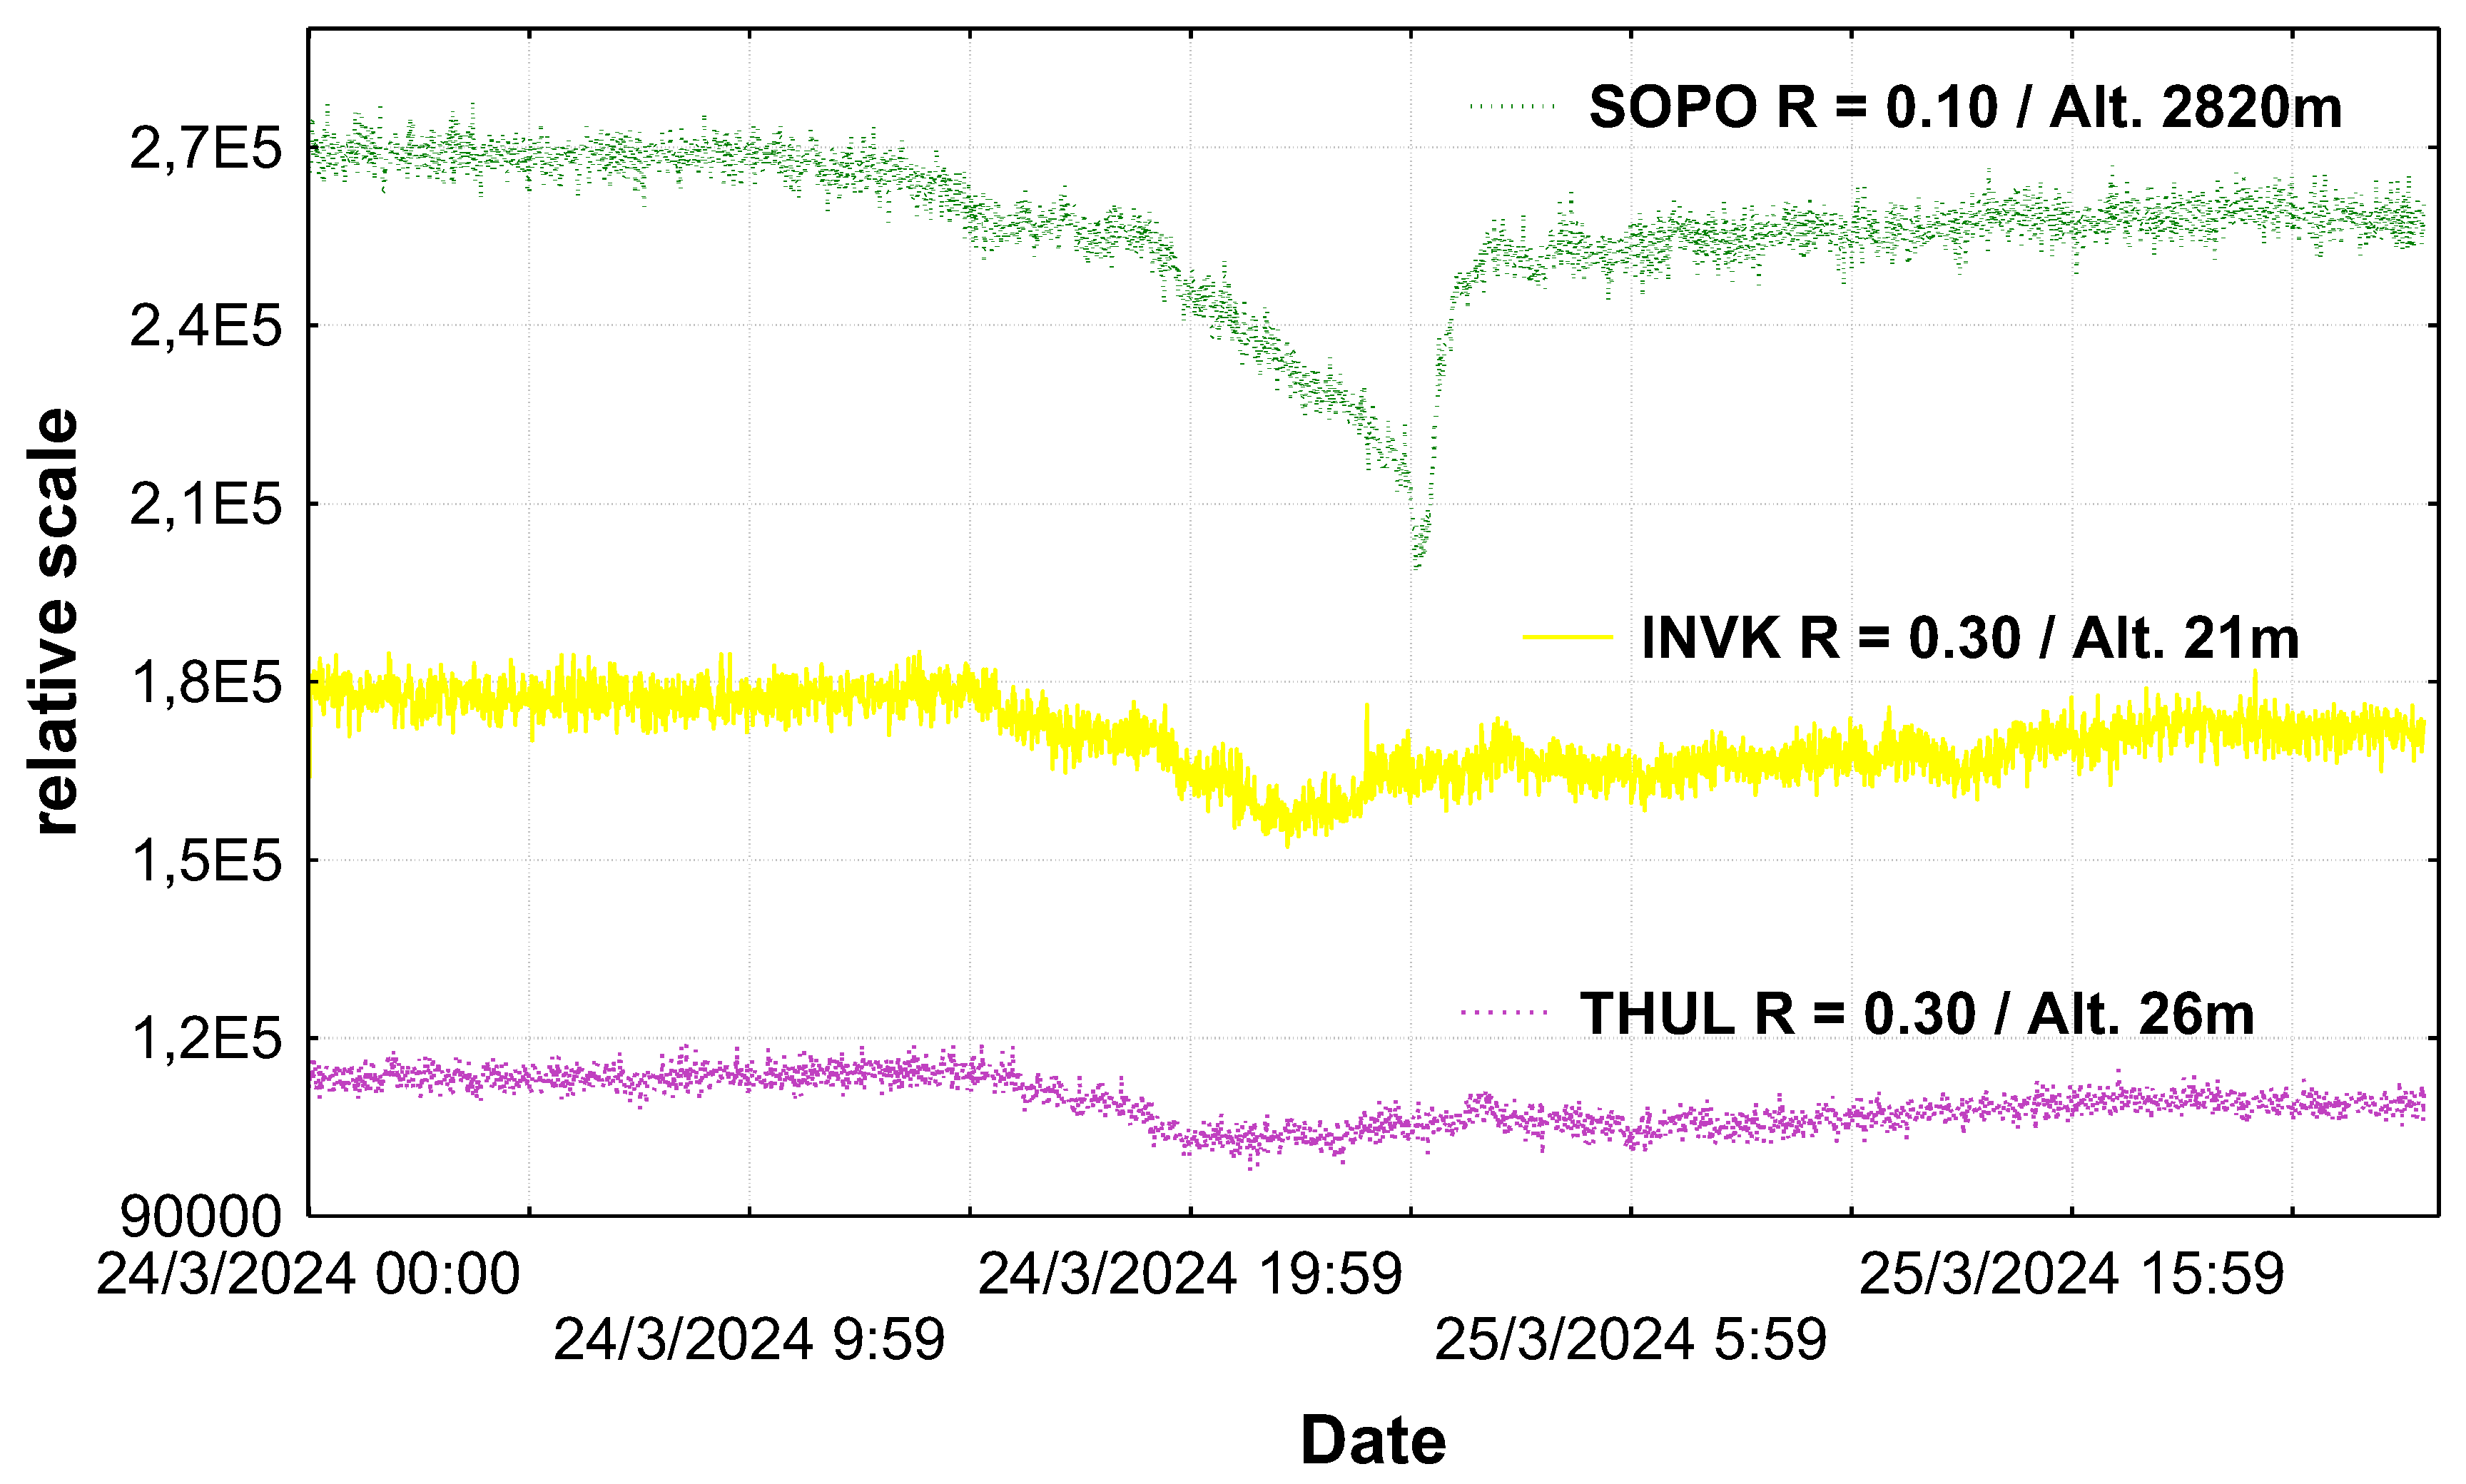
Moreover, this event was highly anisotropic, making its study rather complex. As seen in Figure 2, the SOPO neutron monitor station observed the deep phase several hours later than other stations, e.g., the INVK and THUL neutron monitor stations. The FD’s anisotropic behavior led many stations to enter an alert status with different timestamps. Therefore, more than one general alert notification was issued by the GLE Alert+ system.
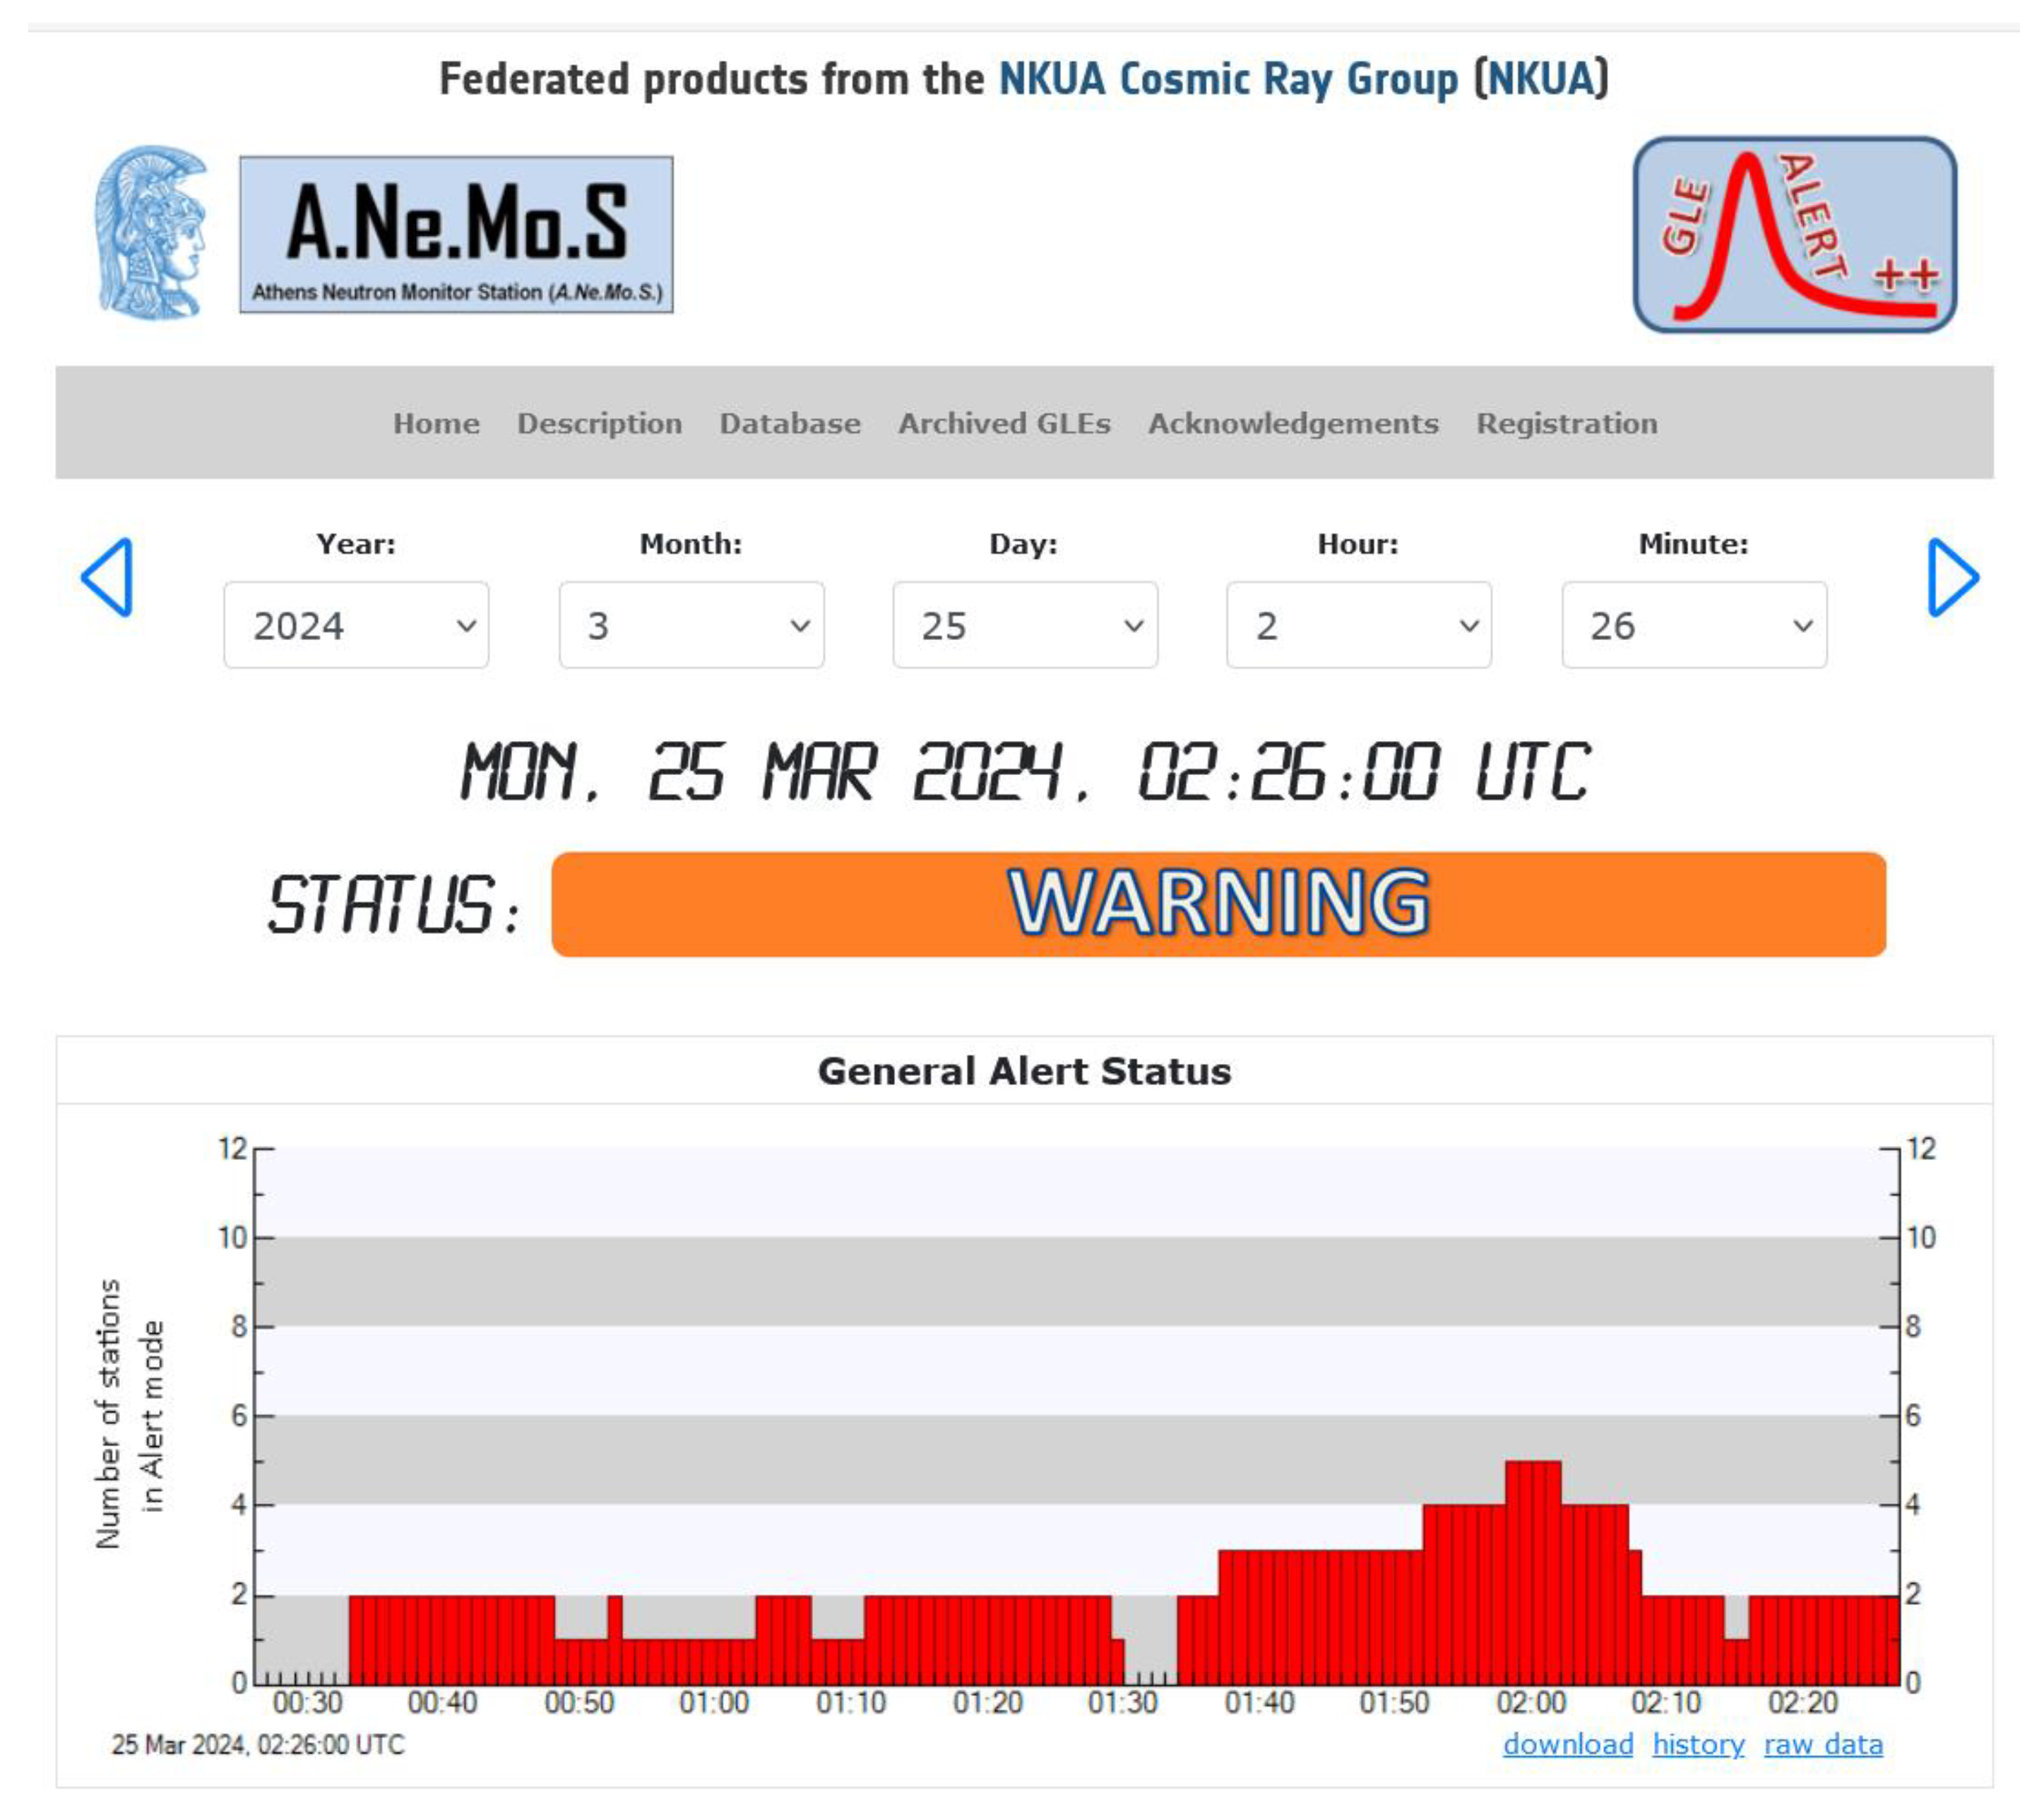
Three GLE Alerts (at 1:37 UT, at 2:26 UT and at 2:35 UT) were issued from the GLE Alert++ system and are summarized below:
(1)
The first email was sent on 25 March 2024 at 01:47 UT, 10 min later than the notification that was issued on 25 March 2024 at 01:37 UT. This notification stated that three neutron monitor stations—SOPB, SOPO, YKTK—detected a GLE event. The delayed time was due to the delay of YKTK sending data.
(2)
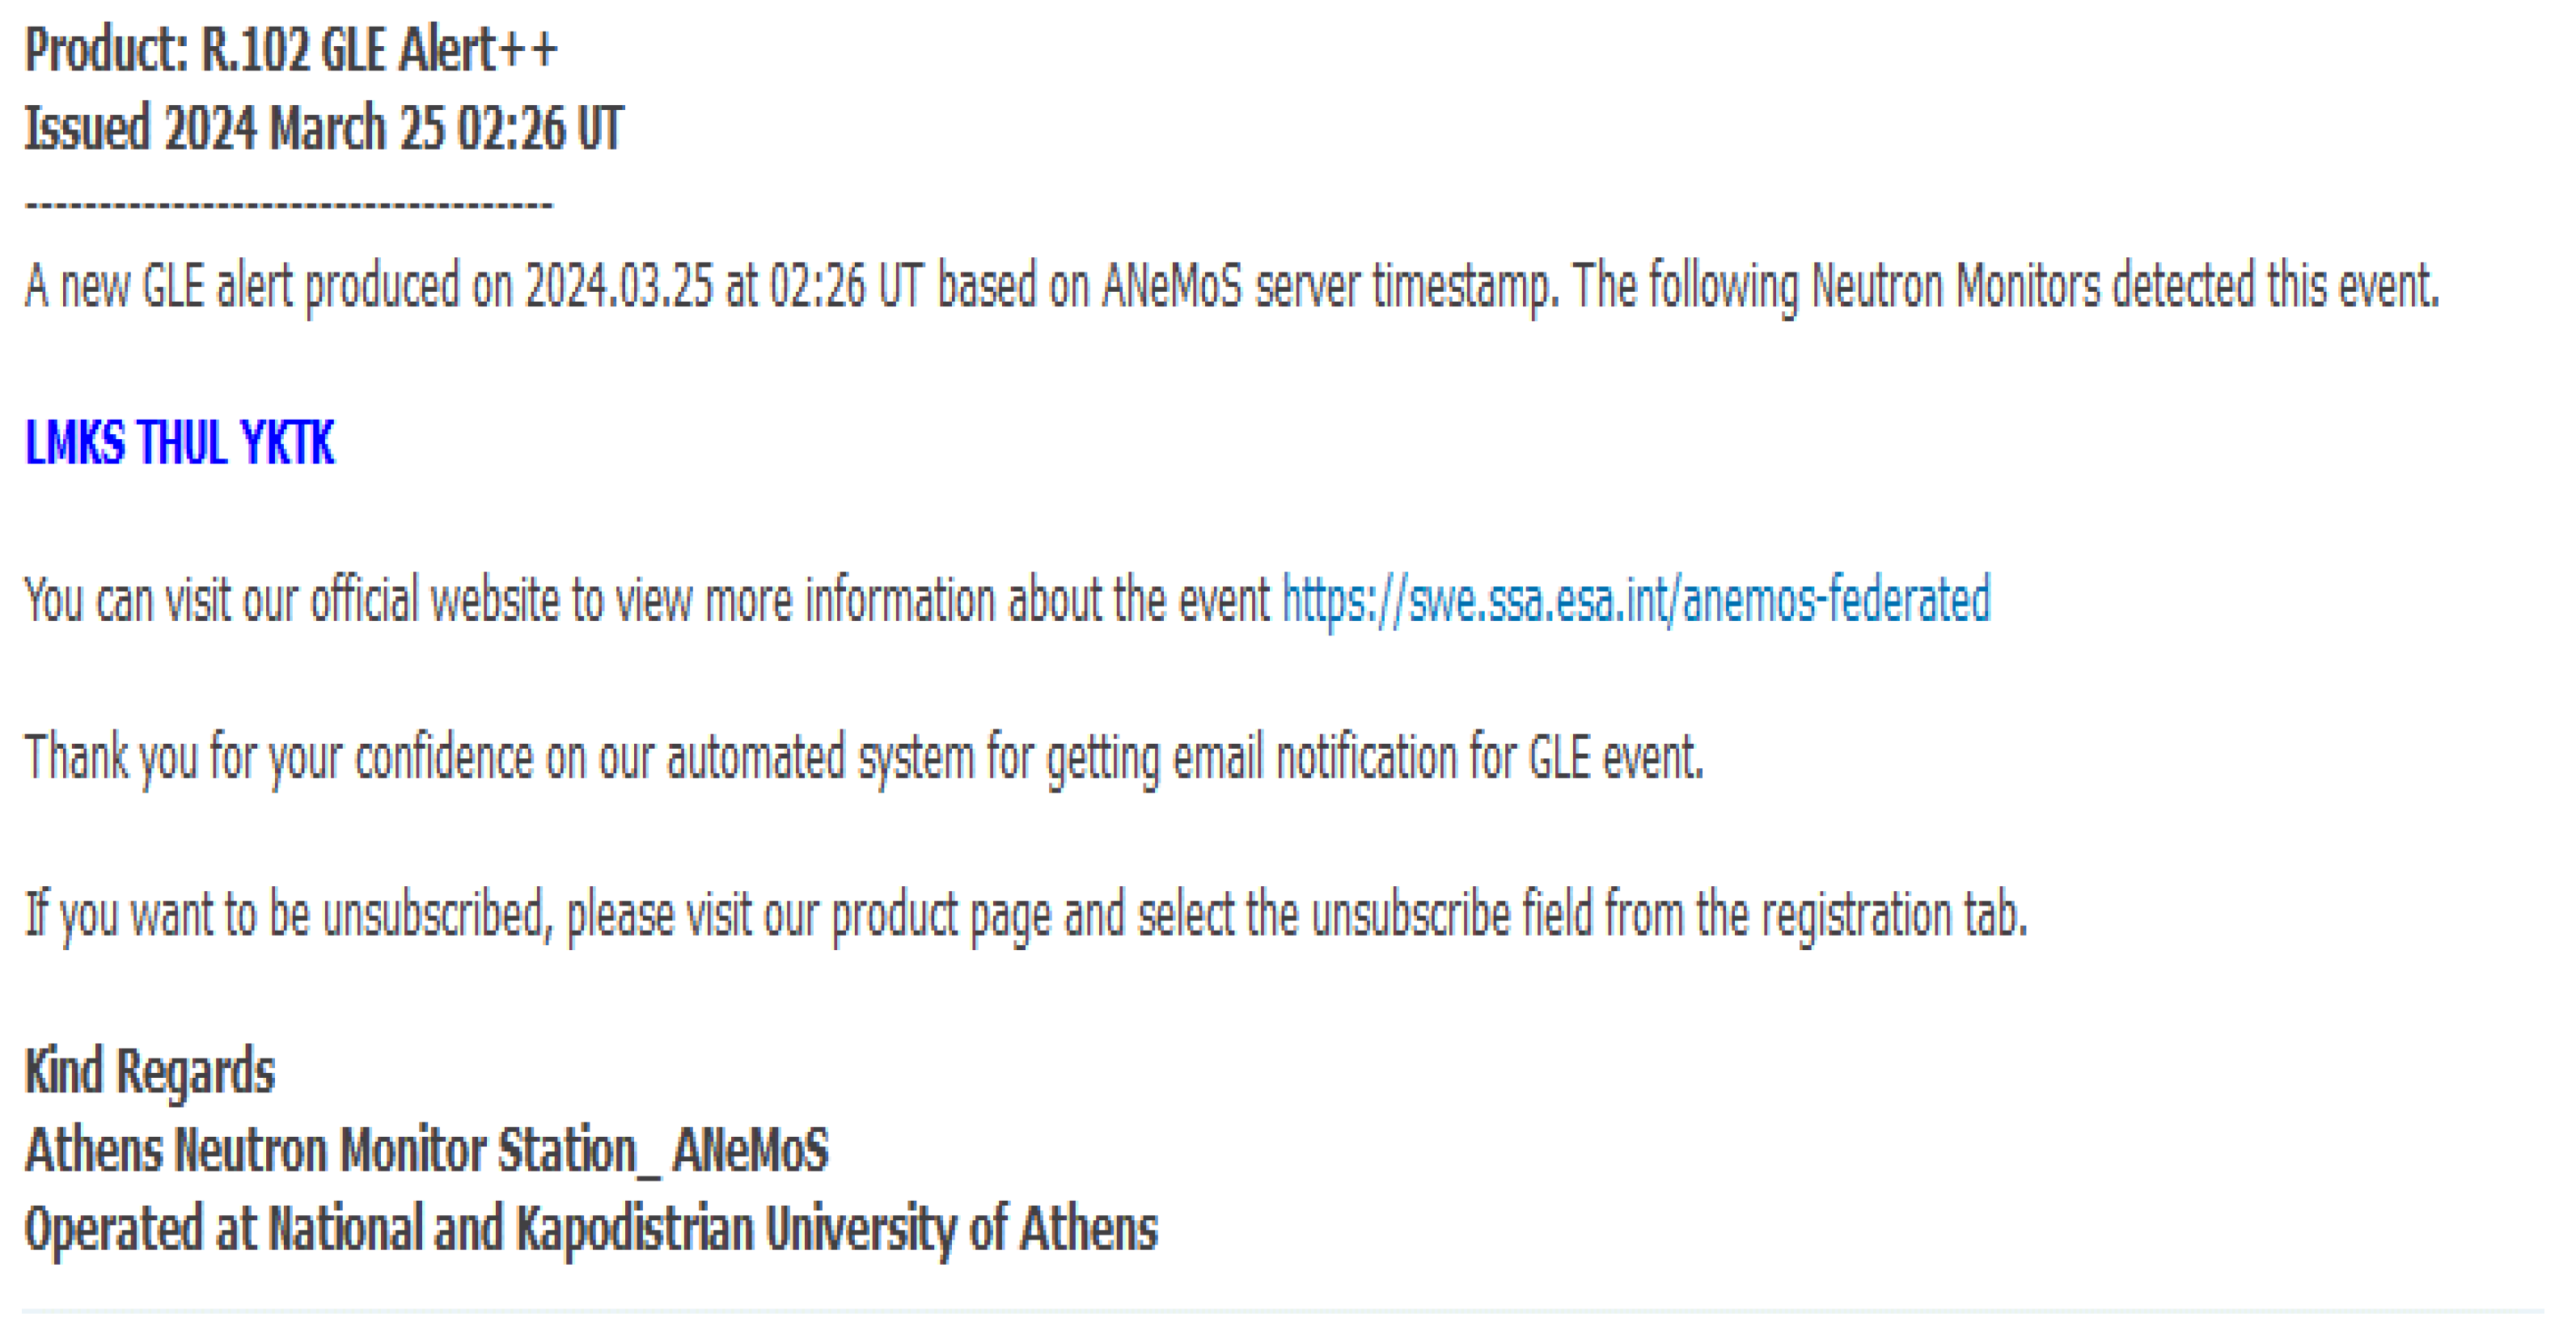
The second email was sent on 25 March 2024 at 02:28 UT, 2 min later than the notification that was issued on 25 March 2024 at 02:26 UT. This notification stated that three neutron monitor stations—LMKS, THUL, YKTK—detected a GLE event. In this case, the time delay of 2 min was within the typical time of stations to send data.
(3)
The third email was sent on 25 March 2024 at 02:42 UT, 7 min later than the notification that was issued on 25 March 2024 at 02:35 UT. This notification stated that three neutron monitor stations—AATB, LMKS, THUL—detected a GLE event. The delay was due to the THUL station sending all data together at 2:42 UT.
The first GLE Alert as detected by the GLE Alert ++ system and its e-mail notification issued at 02:26 UT on 25 March 2024 to registered users are given in Figure 3 and Figure 4, respectively.
After a thorough analysis, it was concluded that these were false alerts due to how the alert trigger is defined in the alert algorithm. Because the GLE Alert ++ algorithm relies on real-time data flow from neutron monitor stations, it was highly likely to be misled by the rapid increase in the recovery phase of the FD. So, SPAM GLE Alerts were raised.

3.2. FD Precursory Signals

Prior to the evolution of the FD on 24 March 2024, the method regarding FD precursors was applied.
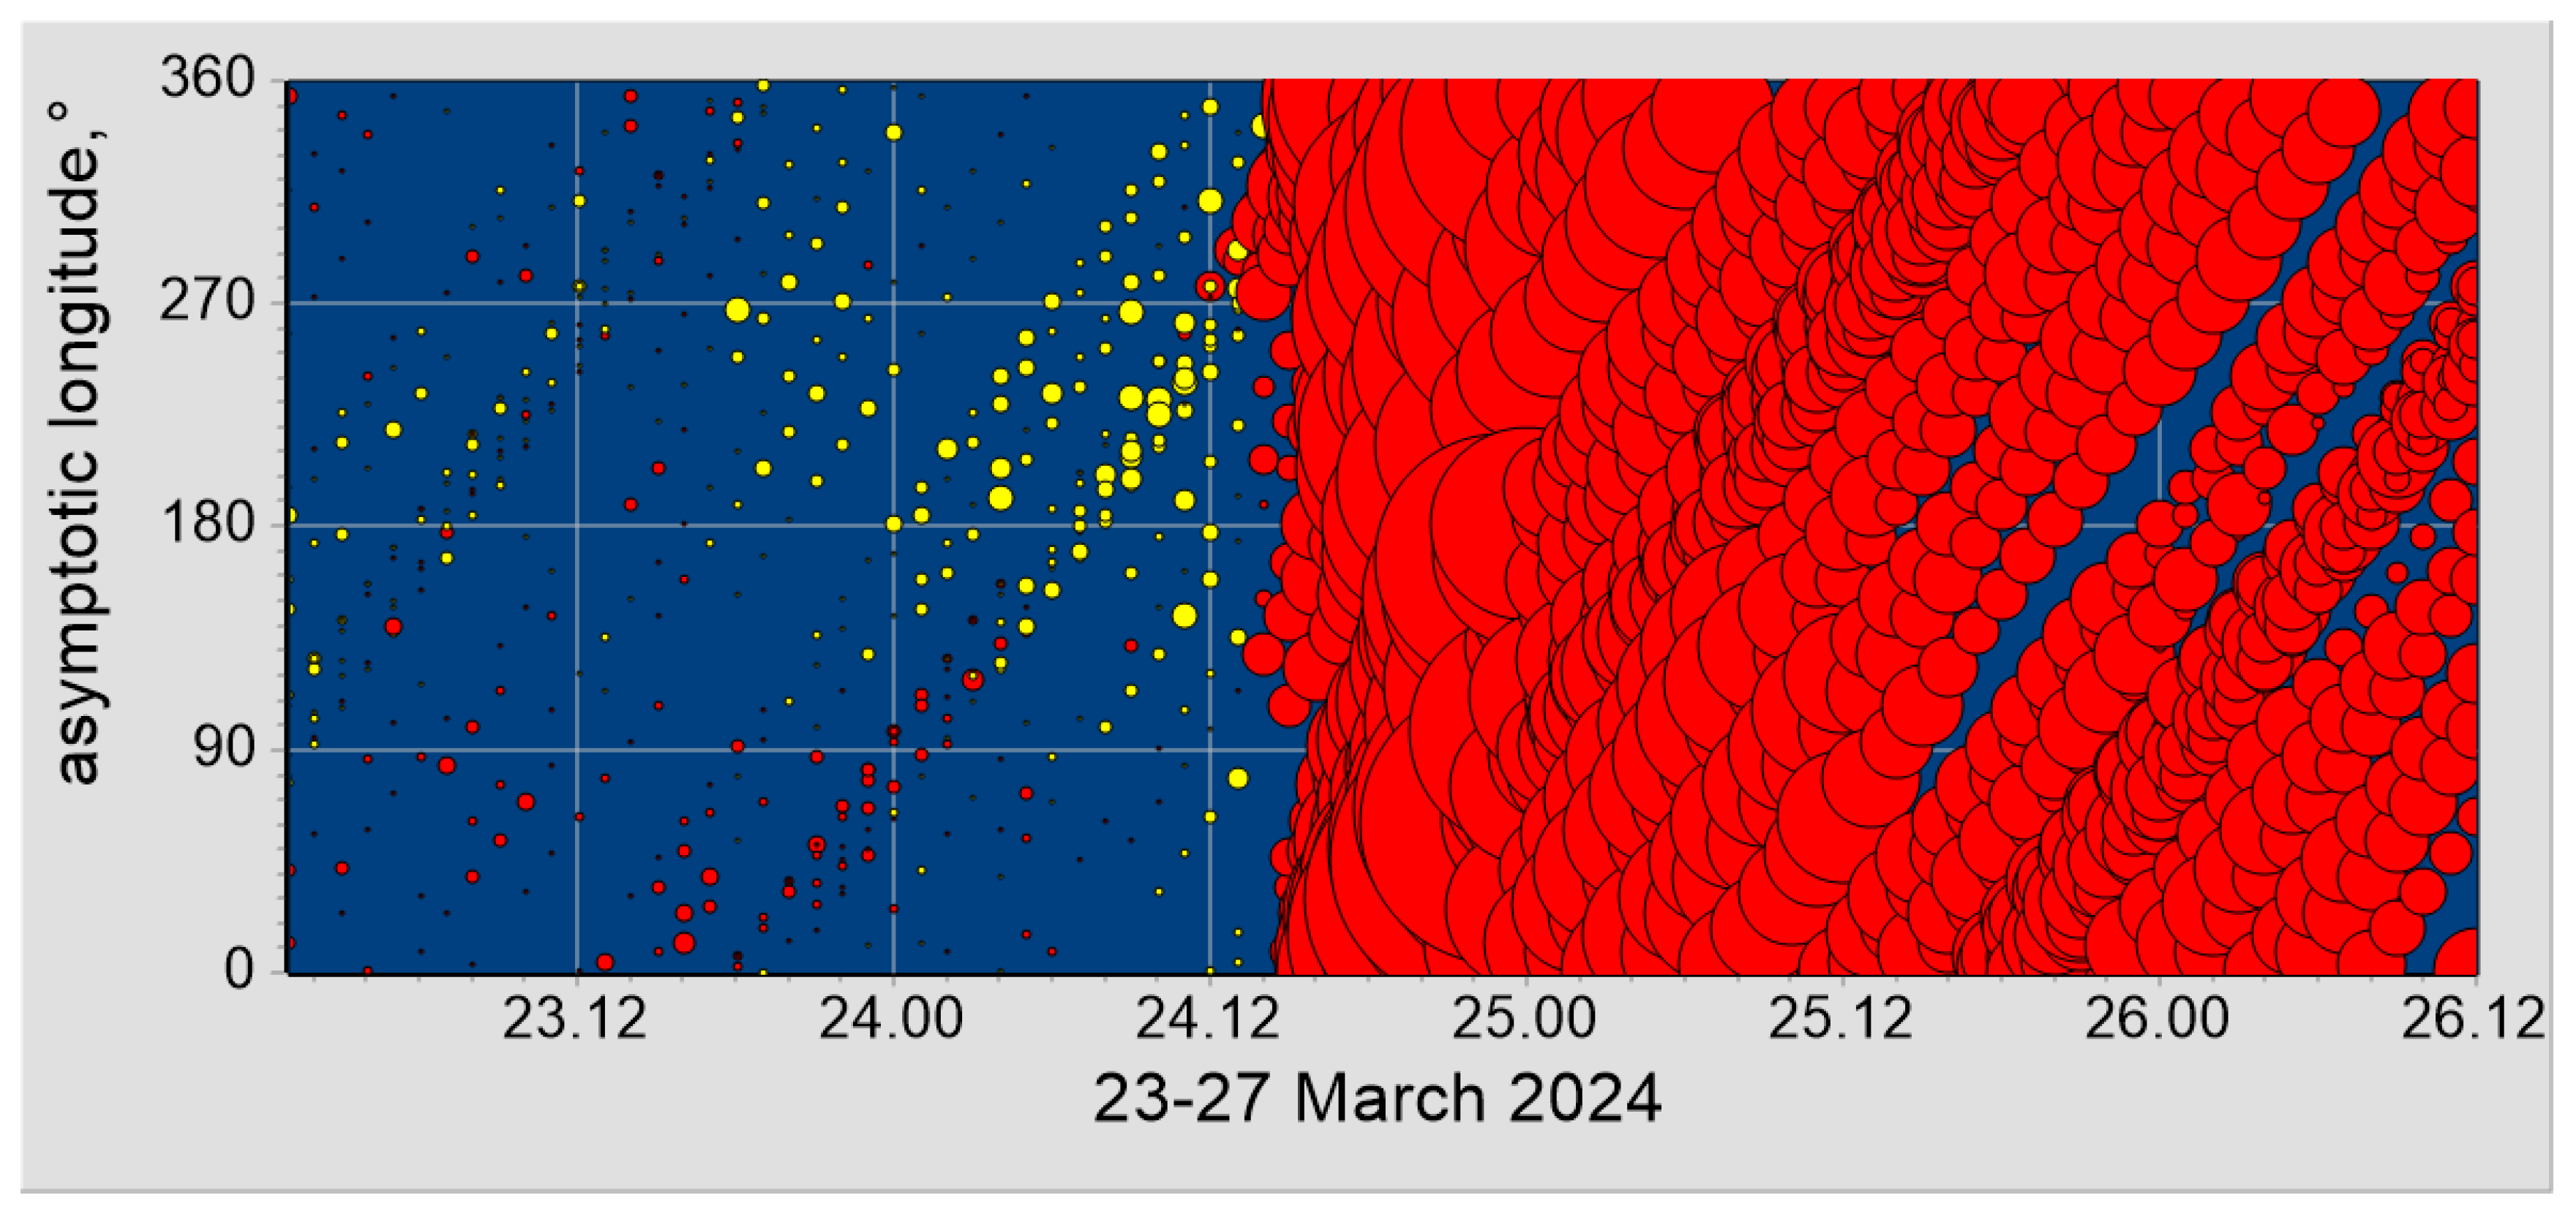
Figure 5 presents the cosmic ray intensity variations for different asymptotic longitudes covering 23–27 March 2024. Decreases and increases in cosmic ray intensity are represented by red- and yellow-colored circles, respectively, estimated with respect to an undisturbed base period. The size of the variation is proportional to the circle’s size. The horizontal axis represents time (DD.HH). Pre-increases in cosmic ray intensity above 150° longitudes a few hours before the development of the FD on 24 March 2024 are clearly seen for this event (Figure 5).

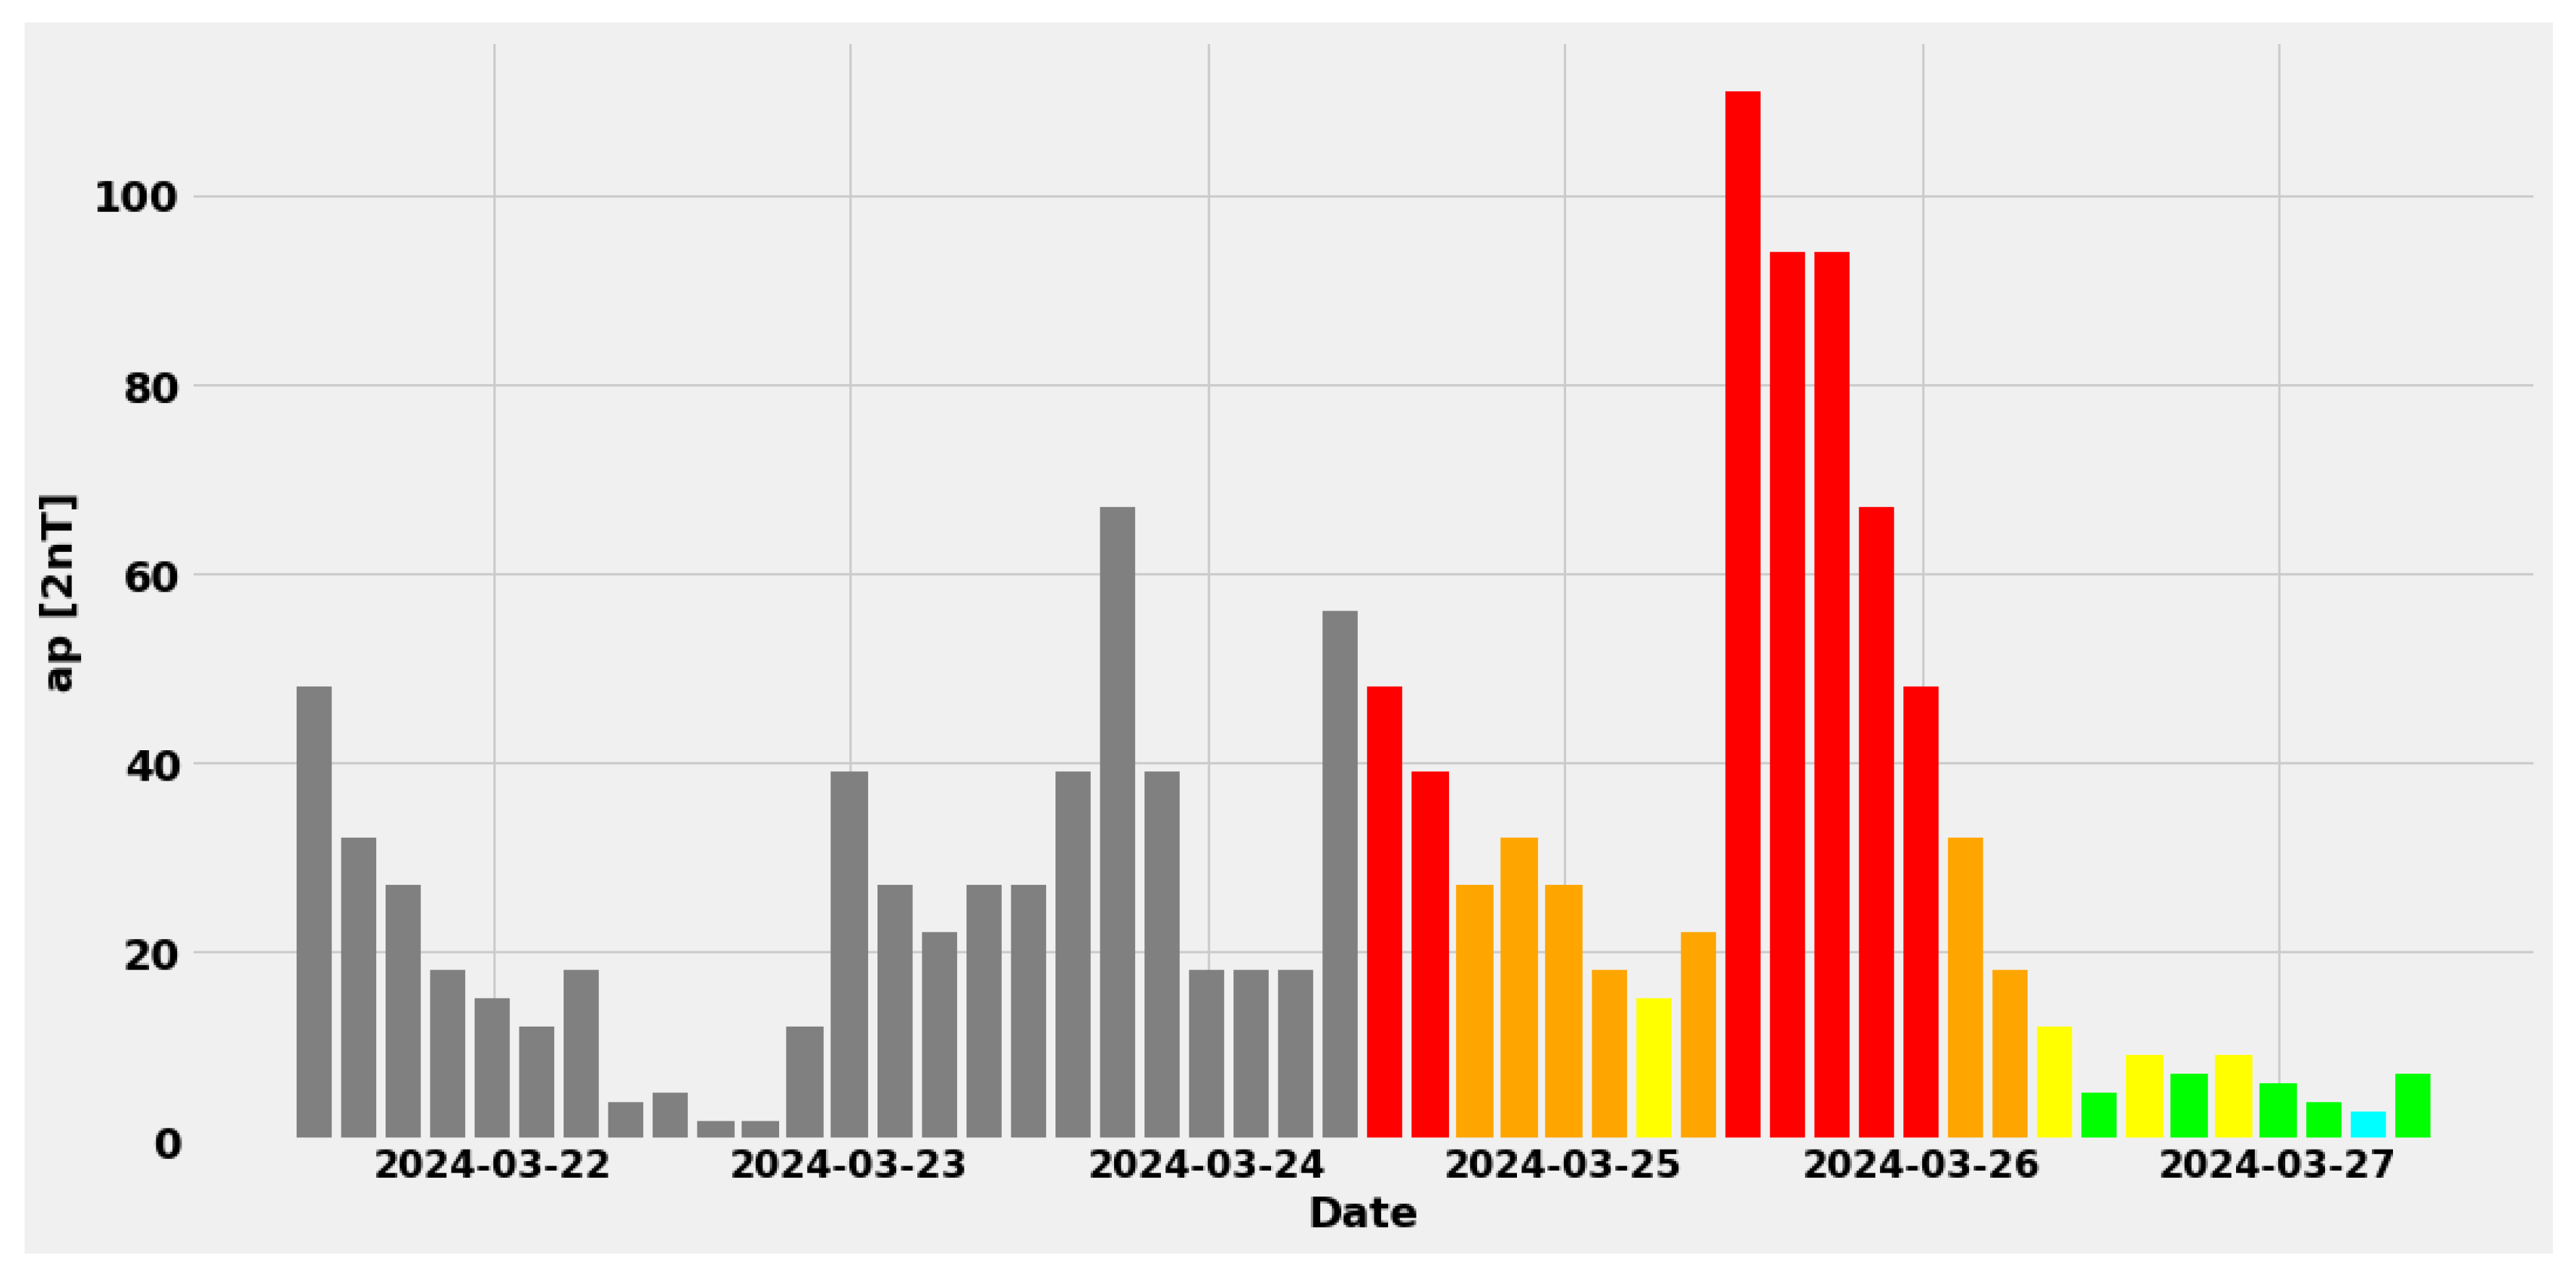
3.3. The ap Prediction Tool

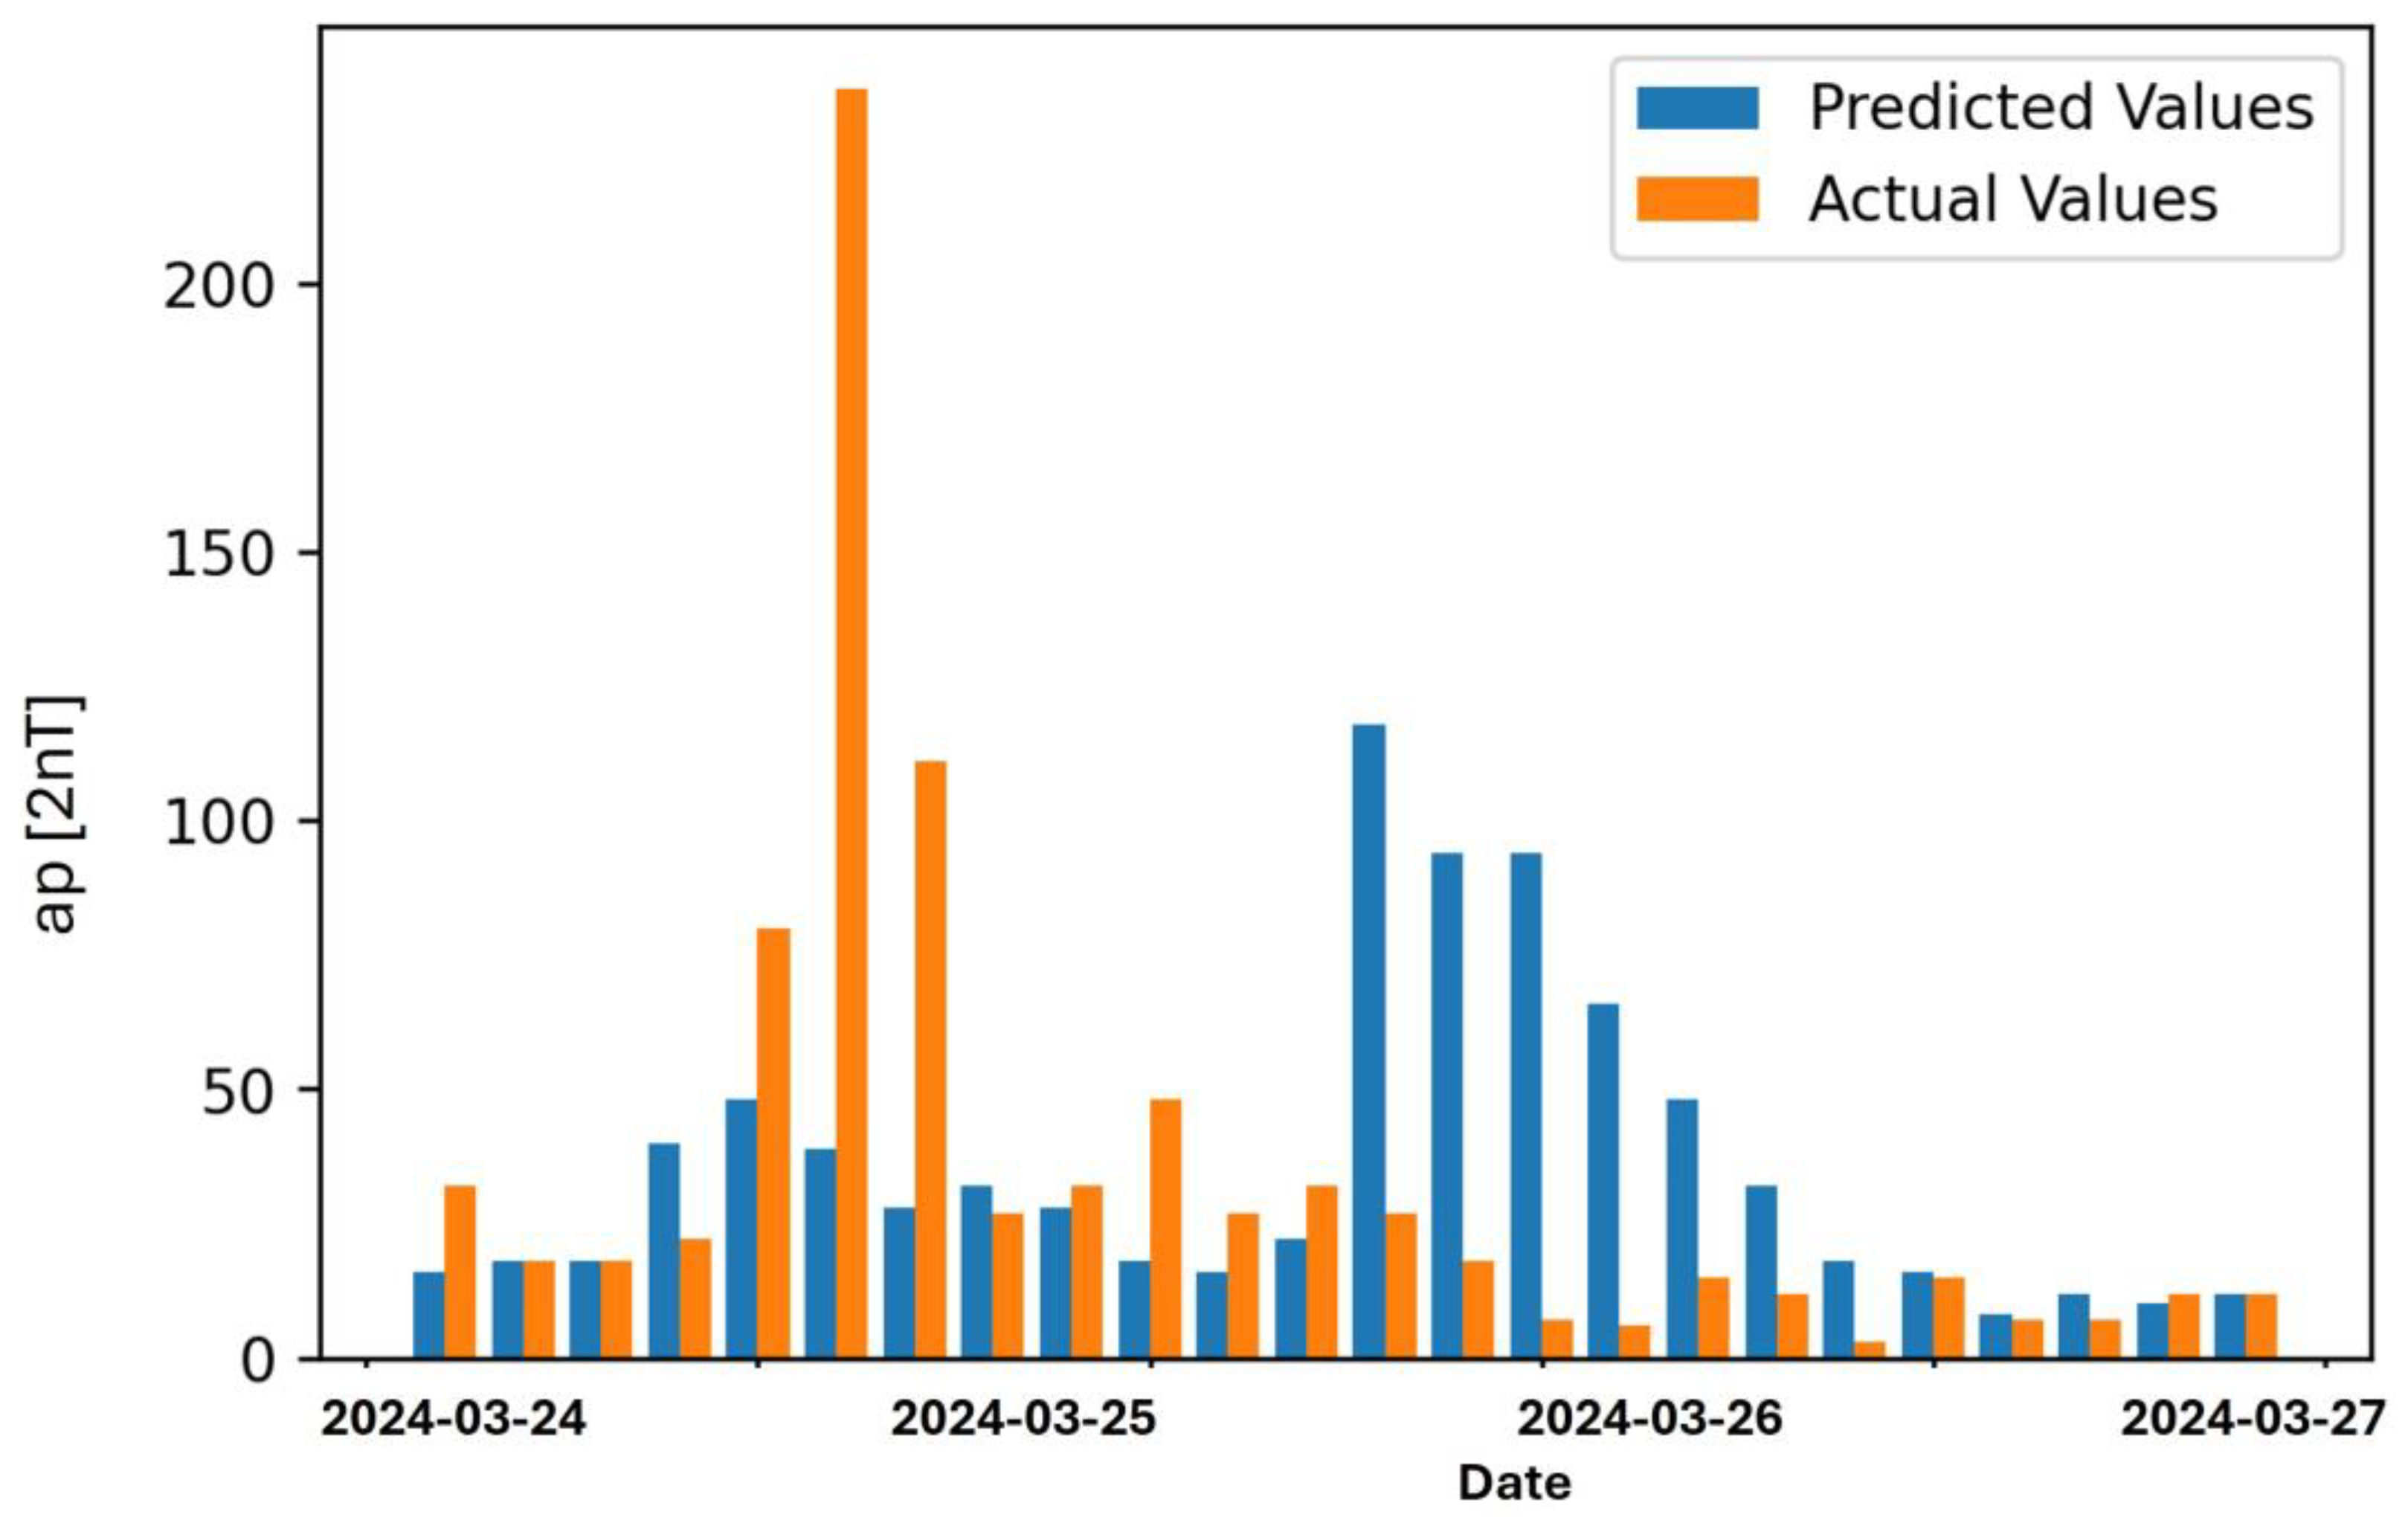
The CME’s arrival at the Earth on 24 March 2024 and the ap index fluctuations were estimated by the ap Prediction tool (Figure 6). In this figure, the color cyan corresponds to ap values 0–3, lime to 4–7, yellow 9–15, orange 18–32, red 39–154 and magenta > 179. The maximum value of the predicted apmax was 111 nT on 25 March 2024 at 12:00 UT. This corresponds to a Kp-index value equal to 7. The actual value of apmax (according to GFZ) was 236 nT on 24 March 2024 at 18:00 UT and the Kp-index value was 8+ (http://www-app3.gfz-potsdam.de/kp_index/qlyymm.html, accessed on 20 June 2024). The actual and predicted values of the ap index from the tool during the arrival of the ICME are illustrated in Figure 7.
It was concluded that the predicted values by the ap Prediction tool are more or less satisfactory. Improved results will be provided once the product’s machine learning algorithms are trained using data from a number of past CMEs.

4. The Event on 11 May 2024

The GS that took place during 10–13 May 2024 was a historic event. A similar event was last observed almost 20 years ago [54]. The Earth’s magnetic field was hit by several CMEs and, as a result, an extreme GS (G5) was registered in middle-latitude stations. Moreover, a GLE event (GLE74) was recorded in polar neutron monitor stations during the recovery phase of a large FD on 10 May 2024.
(a)
Solar activity: On 8 May, at 05:36 UT, a full halo CME was observed (CME Scoreboard (nasa.gov), accessed on 20 June 2024). According to EAM predictions, the corresponding ICME was expected to reach the Earth on 10 May between 14:59 UT and 23:52 UT. On the same day, at 12:24 UT, another full hallo CME was registered from AR3664 following a long-duration solar flare of M8.6 class. The latter CME was expected to reach the Earth on May 11 between 02:35 UT and 08:11 UT (EAM predictions).
Moreover, on 9 May at 09:24 UT, a halo CME was observed after the X2.3 class solar flare. This CME was expected to reach the Earth between 10 May at 23:16 UT and 11 May at 19:45 UT according to EAM predictions. The next day (10 May), another CME was observed at 07:12 UT, after an X3.9 class solar flare. According to EAM predictions, this ICME was expected to reach the Earth on 12 May between 08:50 UT and 22:46 UT. On 11 May, an X5.8 class solar flare was associated with another bright partial halo CME that was observed on 11 May at 01:36 UT. This CME was expected to reach the Earth between 12 May at 18:00 UT and 13 May at 13:15 UT (EAM predictions).
Several M-class and nine X-class solar flares were registered during the time period from 8 May 2024 until 13 May 2024. The most energetic one (class X5.8) was the solar flare registered on 11 May 2024 at 01:23 UT (peak time) from the active region AR3664 (www.SolarMonitor.org, accessed on 20 June 2024). A level R3 radio blackout was also recorded (http://www.swpc.noaa.gov/products/space-weather-overview, accessed on 15 May 2024).
(b)
Solar energetic particle events: On 10 May, at 14:10 UT, the GOES Proton Flux for particles with energies above 10 MeV exceeded the SWPC 10 MeV warning threshold. An S2 level solar radiation storm was observed (http://www.swpc.noaa.gov/products/space-weather-overview, accessed on 15 May 2024).
(c)
Interplanetary conditions: The ACE detected a solar wind speed increase at about 989 Km/s on 12 May 2024 at 00:50 UT. Moreover, a sharp decrease in the vertical component Bz of the IMF (−48 nT) was recorded on 11 May 2024 at 00:45 UT (http://www.swpc.noaa.gov/products/real-time-solar-wind, accessed on 20 June 2024).
(d)
Geomagnetic activity: The GS that was due to the CMEs produced on 8–9 May 2024 was of level G5 (severe storm) according to the NOAA Space Weather Prediction Center (https://www.swpc.noaa.gov/noaa-scales-explanation, accessed on 20 June 2024). On 11 May 2024, the daily Ap-index and the corresponding Kp-index reached maximum values of 274 and 9, respectively. Also, on 11 May 2024, at 00:00 UT, the actual value of apmax was equal to 400, according to the GFZ German Research Centre for Geosciences (http://www-app3.gfz-potsdam.de/kp_index/qlyymm.html, accessed on 20 June 2024).
The Dst index, during the time period of the GS, had a minimum value –412 nT on 11 May 2024 at 03:00 UT (Real-time (Quicklook) Dst Index Monthly Plot and Table (kyoto-u.ac.jp), accessed on 20 June 2024).
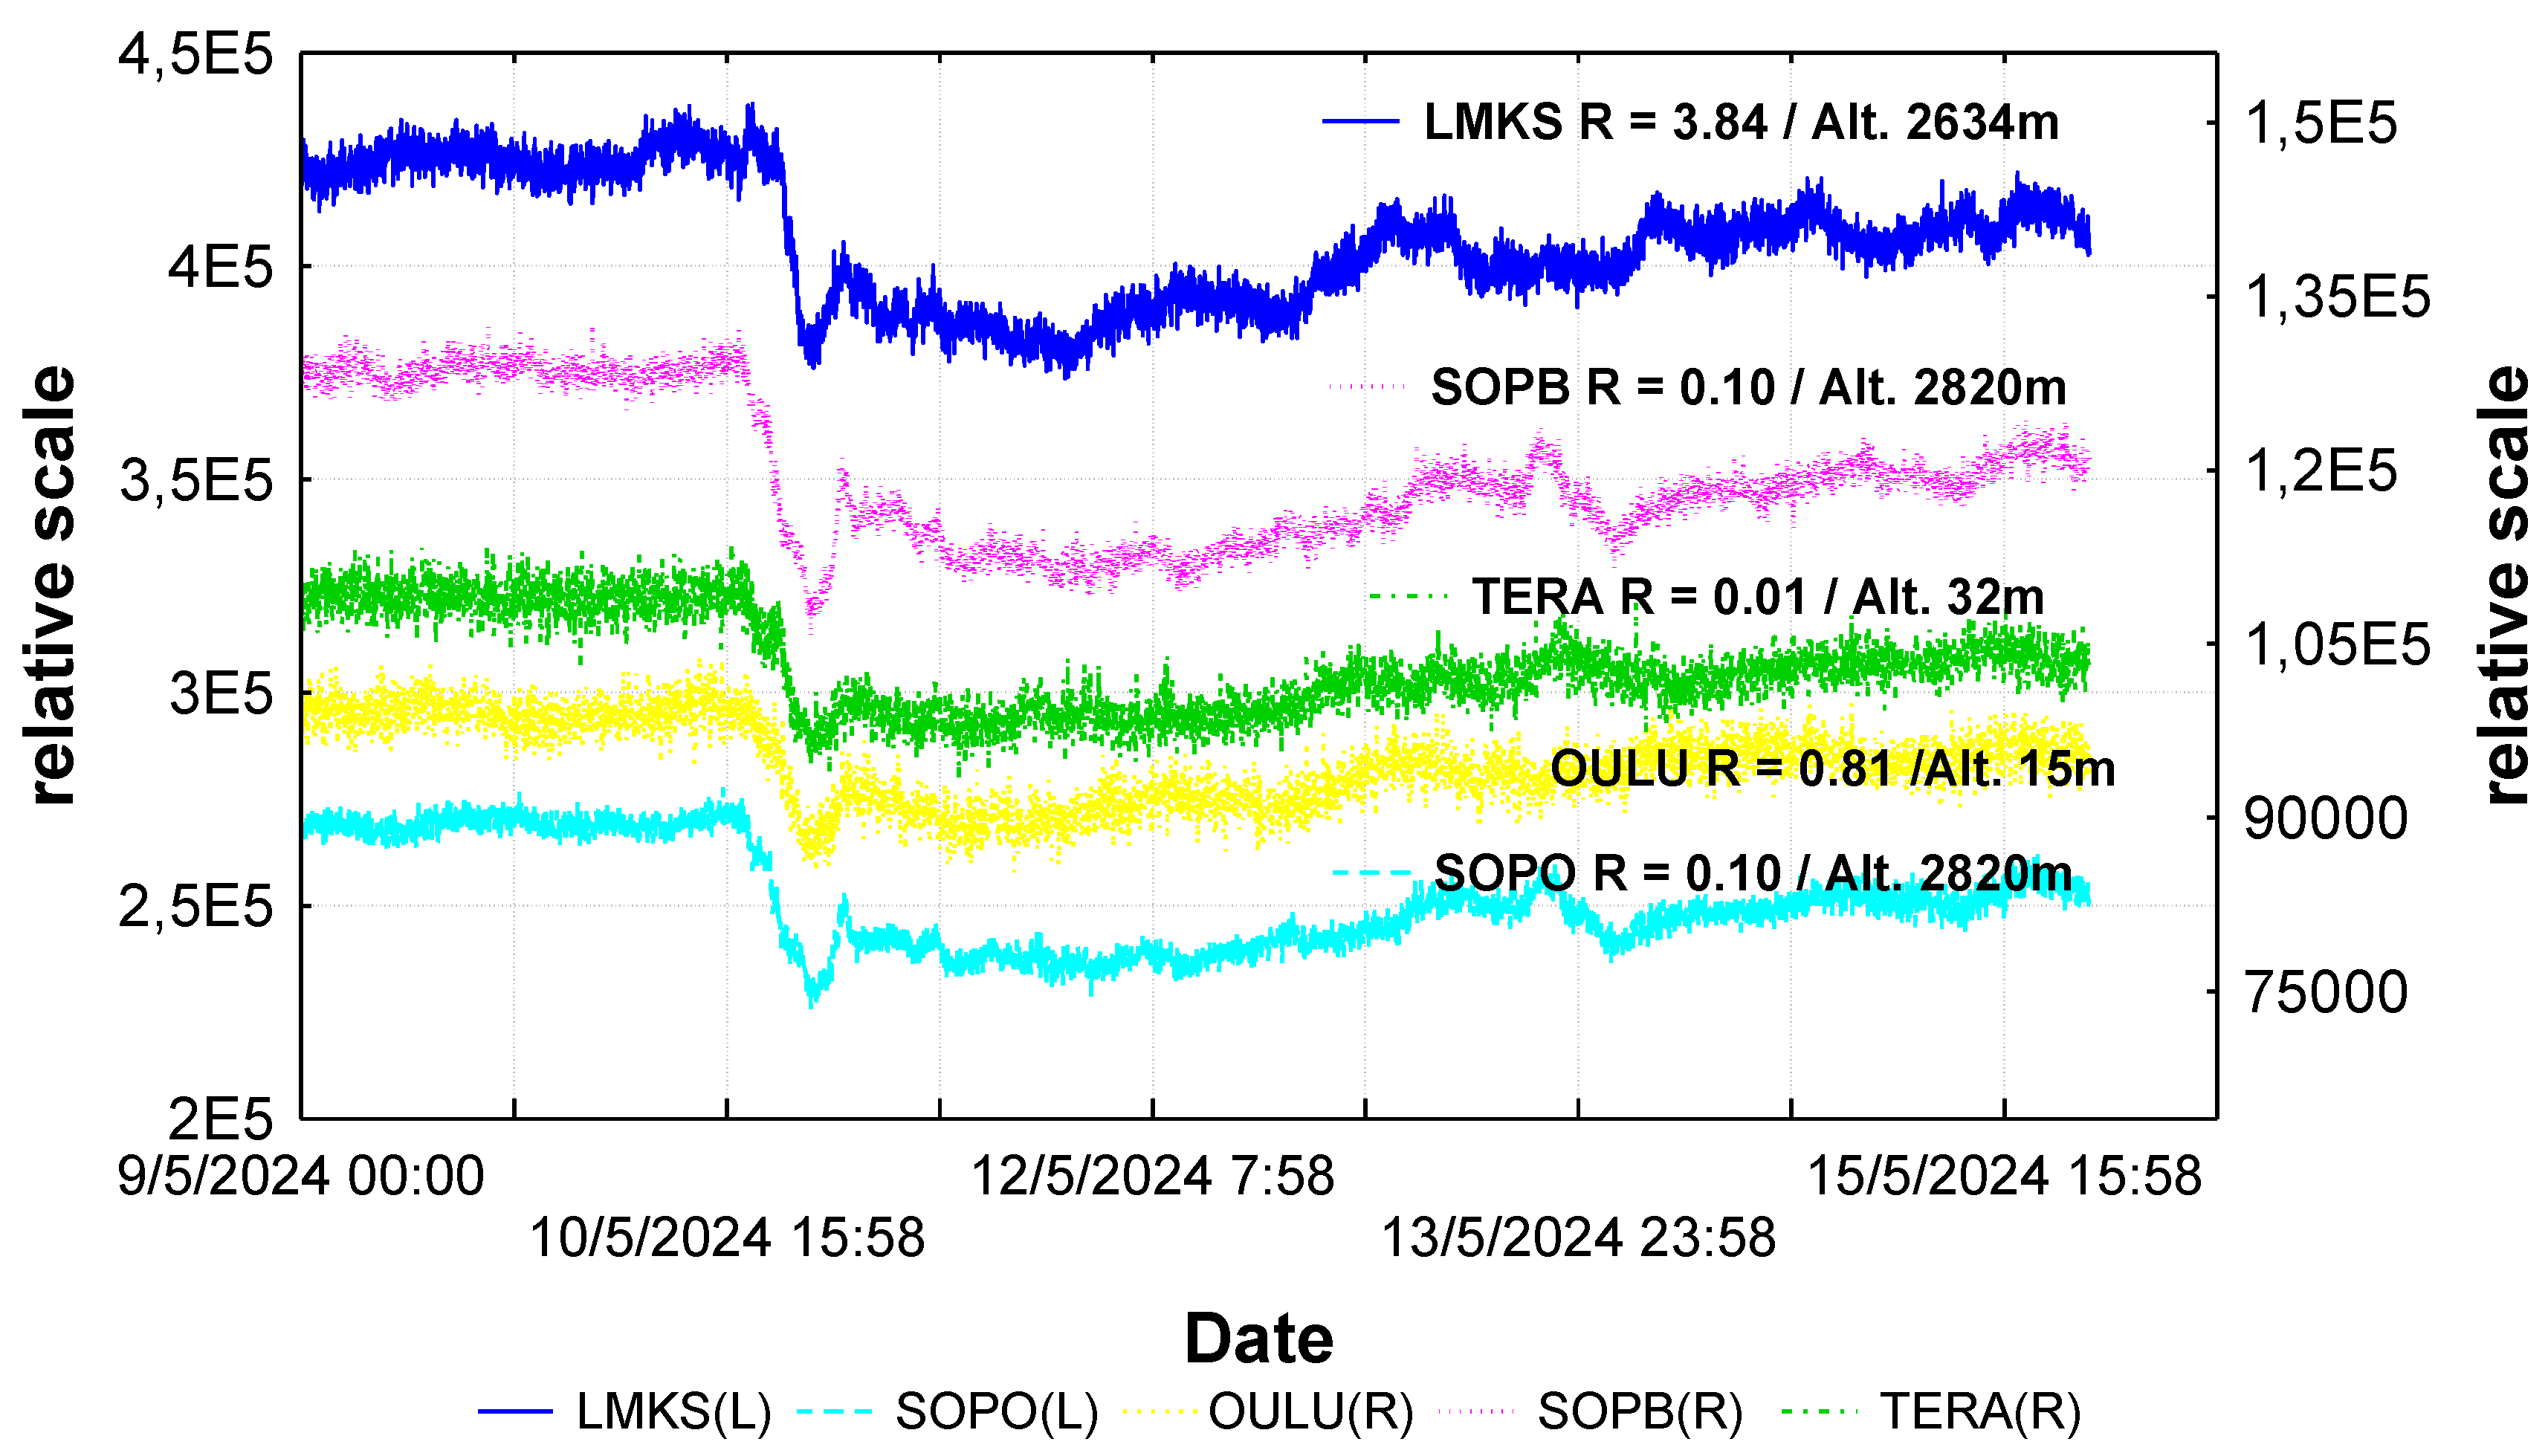
  • (e) Forbush decrease on 11 May 2024: The arrival of the aforementioned CMEs resulted in an FD in the GCR background. The event started on 10 May 2024. Figure 8 shows the FD as registered by the TERA, SOPO, SOPB, OULU and LMKS neutron monitor stations. During the recovery phase of this event, the GLE event (GLE74) was recorded (see Section 4.1).

4.1. The GLE Alert ++ System

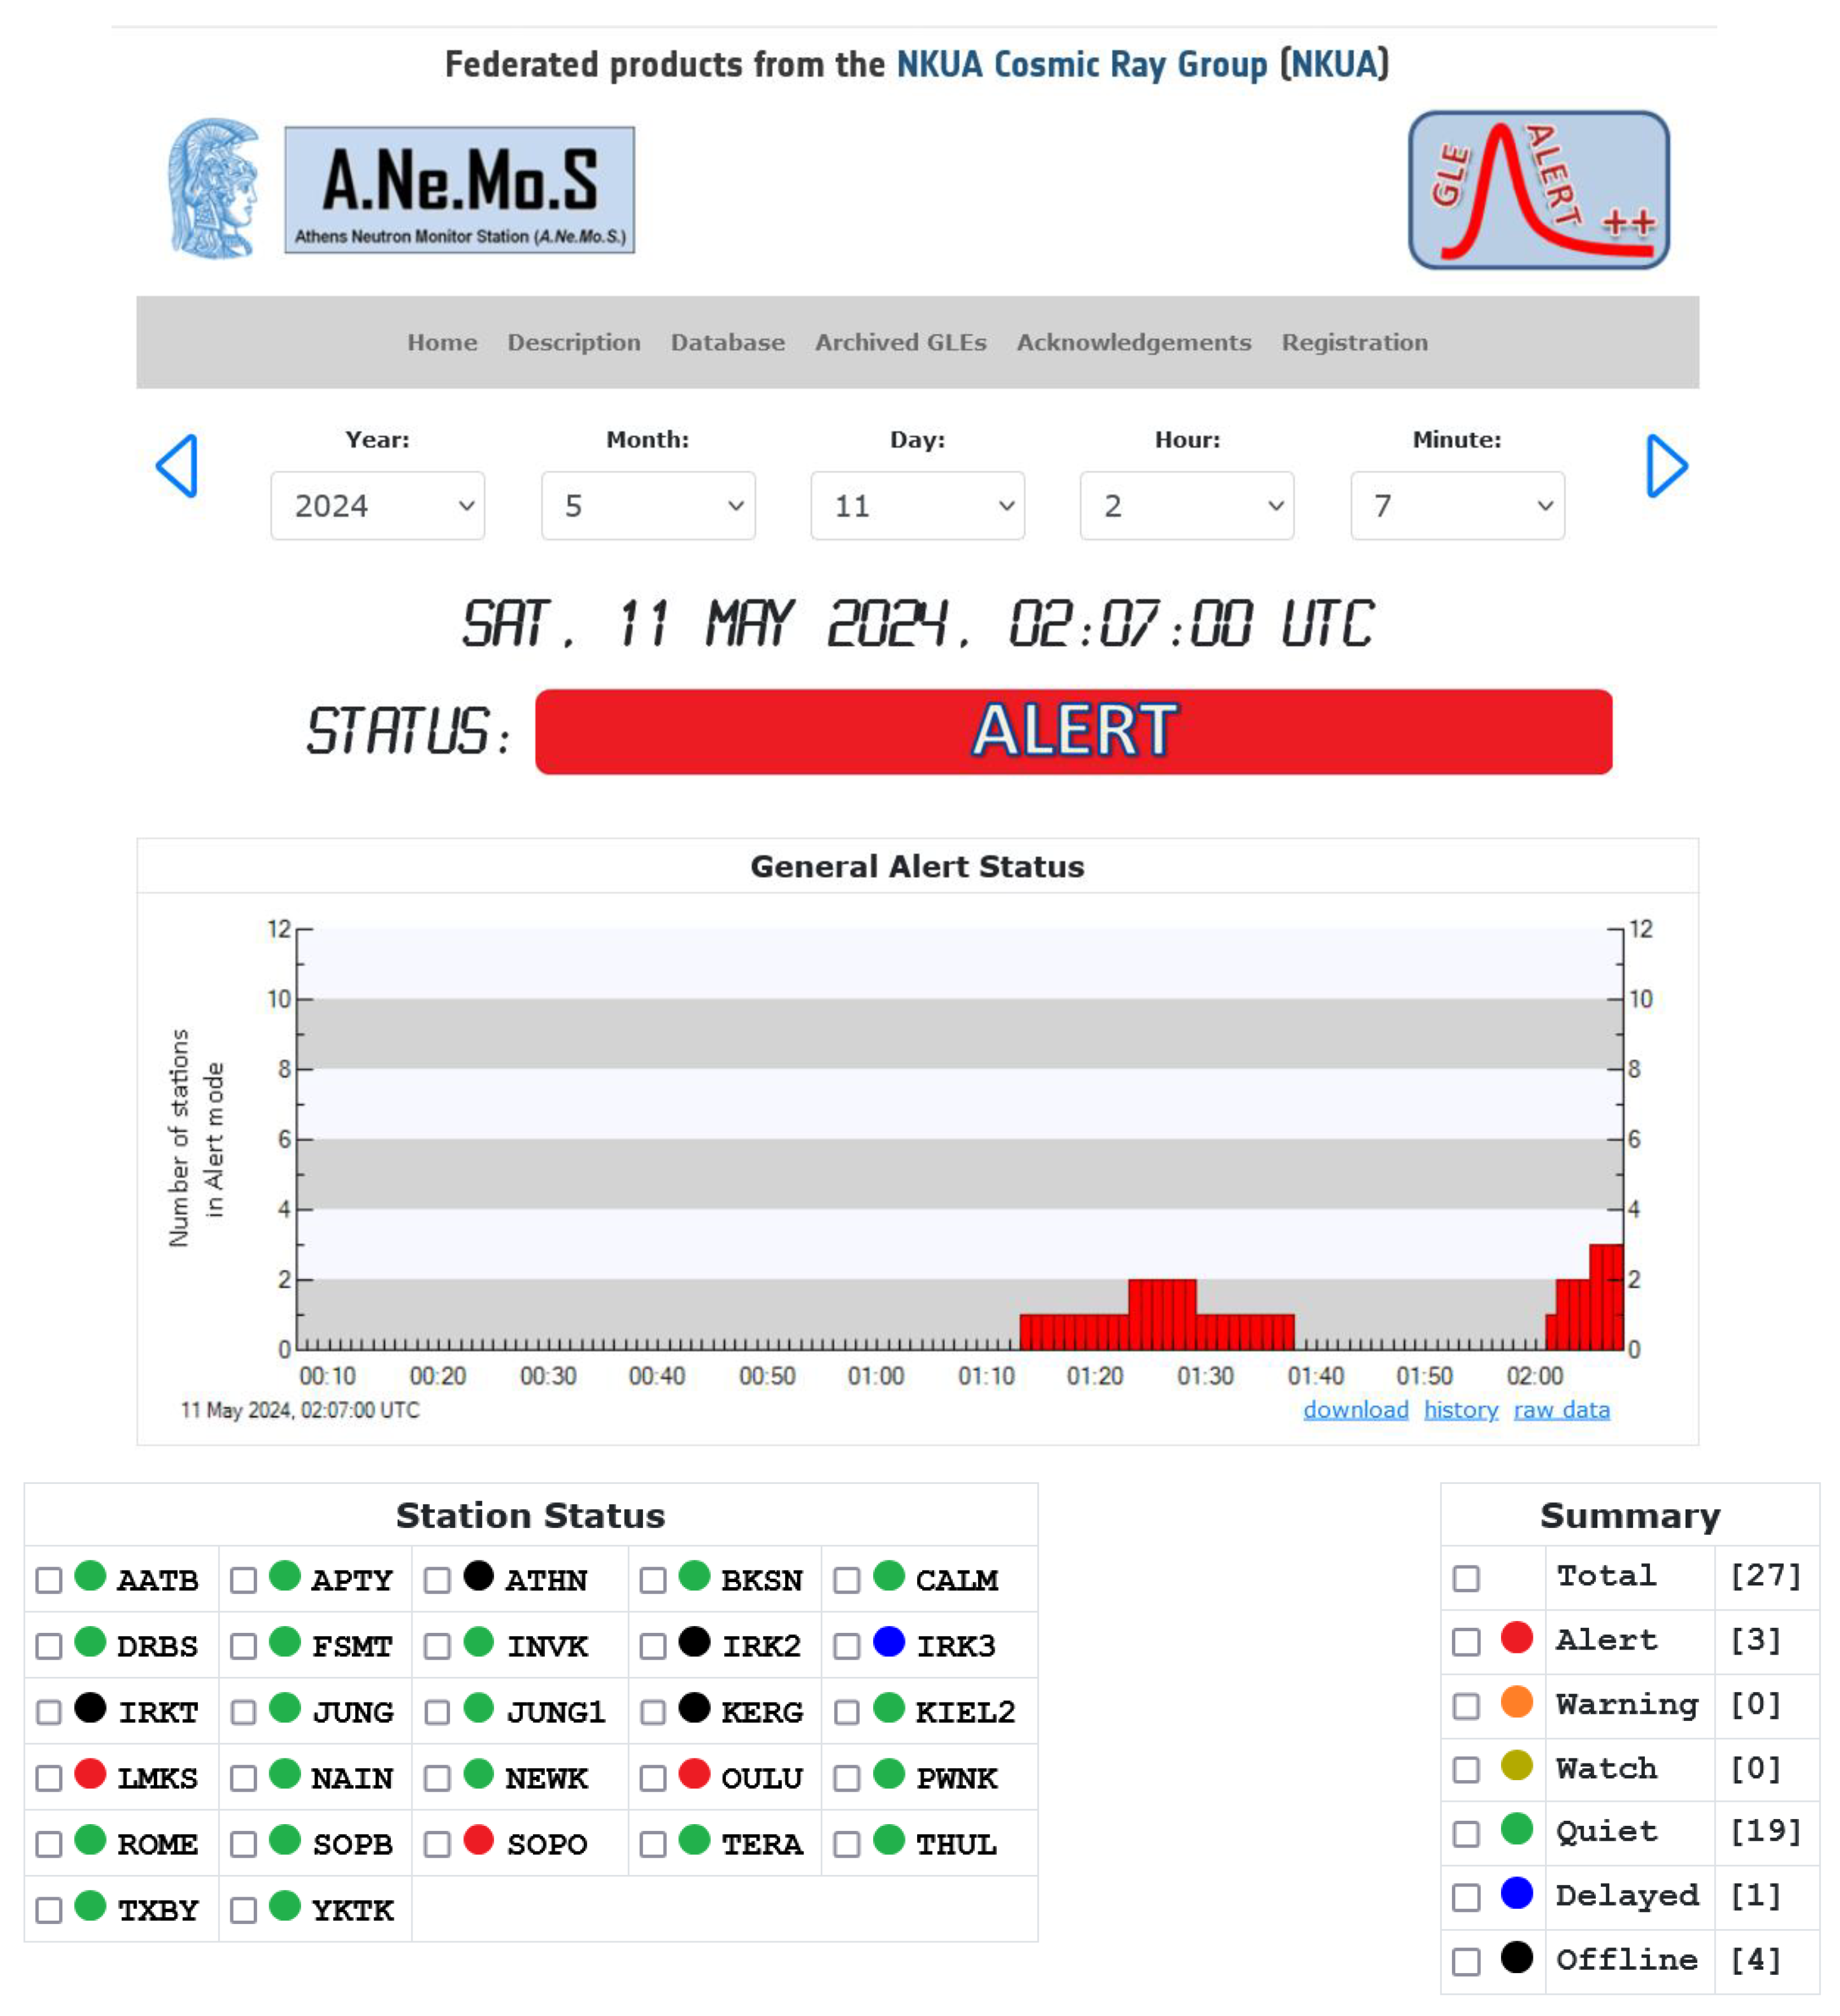
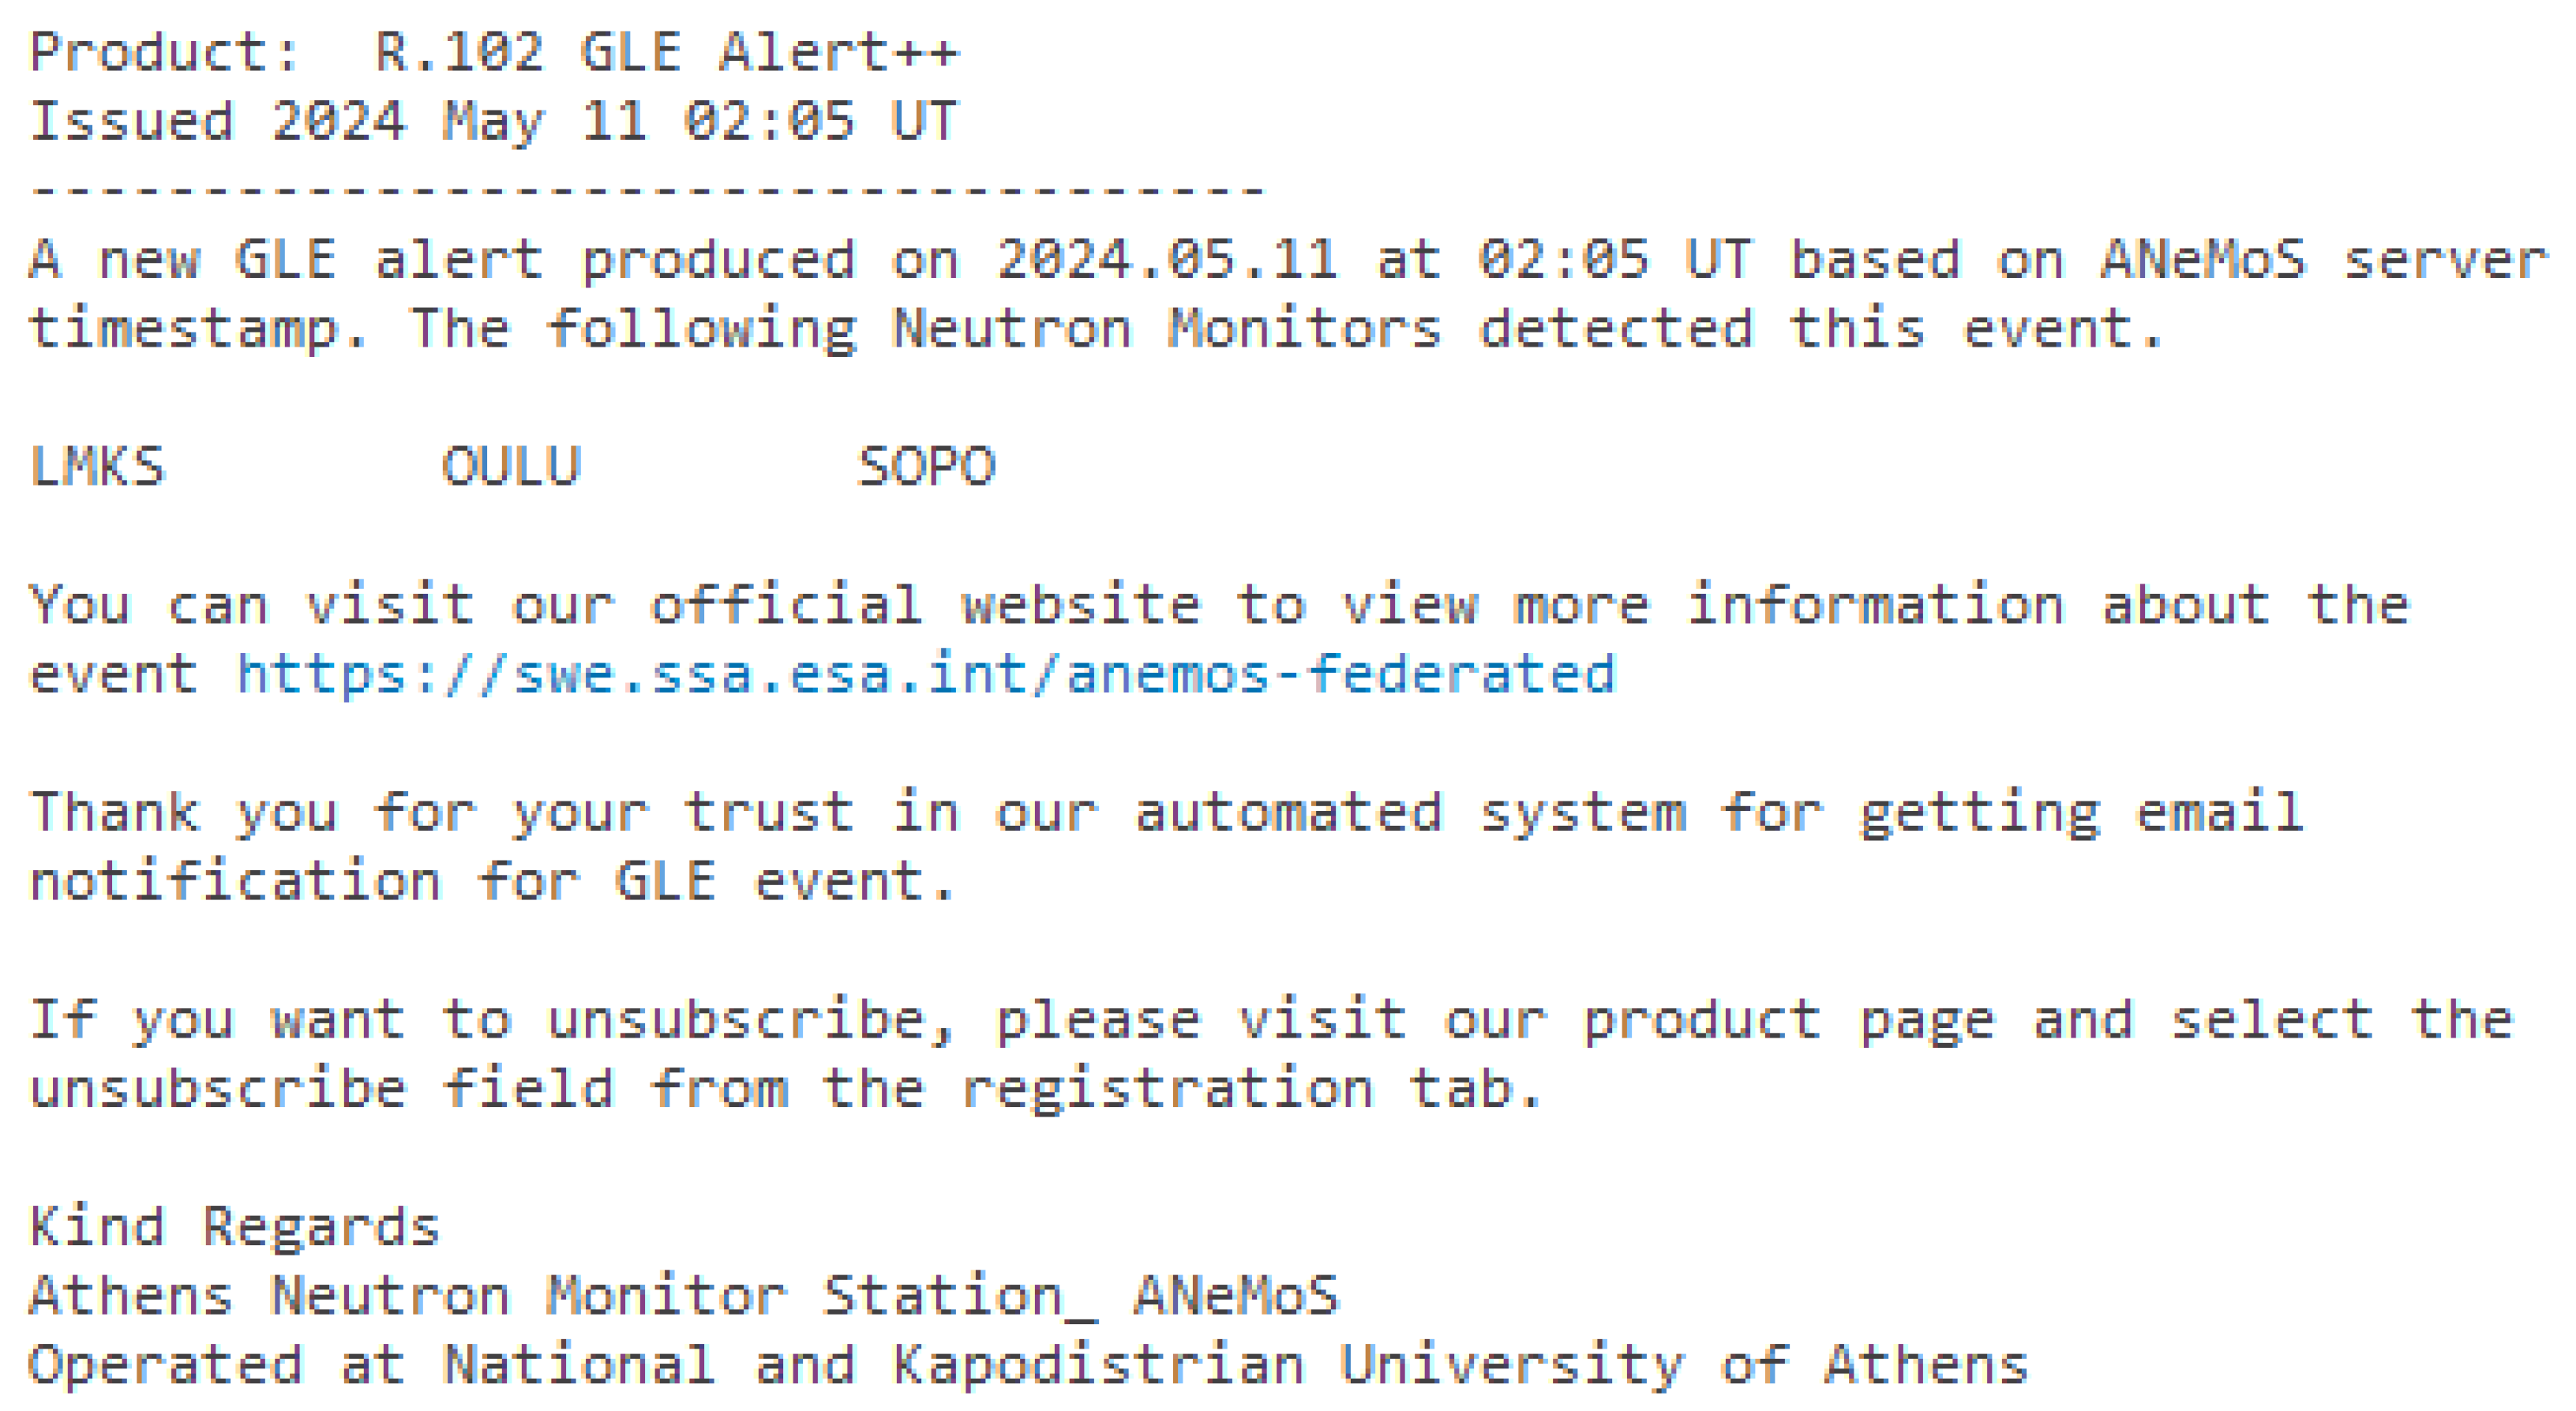
The GLE74 event was detected by the A.Ne.Mo.S. GLE Alert++ system. LMKS, OULU, and SOPO entered in alert status after several minutes (Figure 9). A notification was issued on 11 May 2024 at 02:05 UT based on the A.Ne.Mo.S. server timestamp (Figure 10).

4.2. FD Precursory Signals

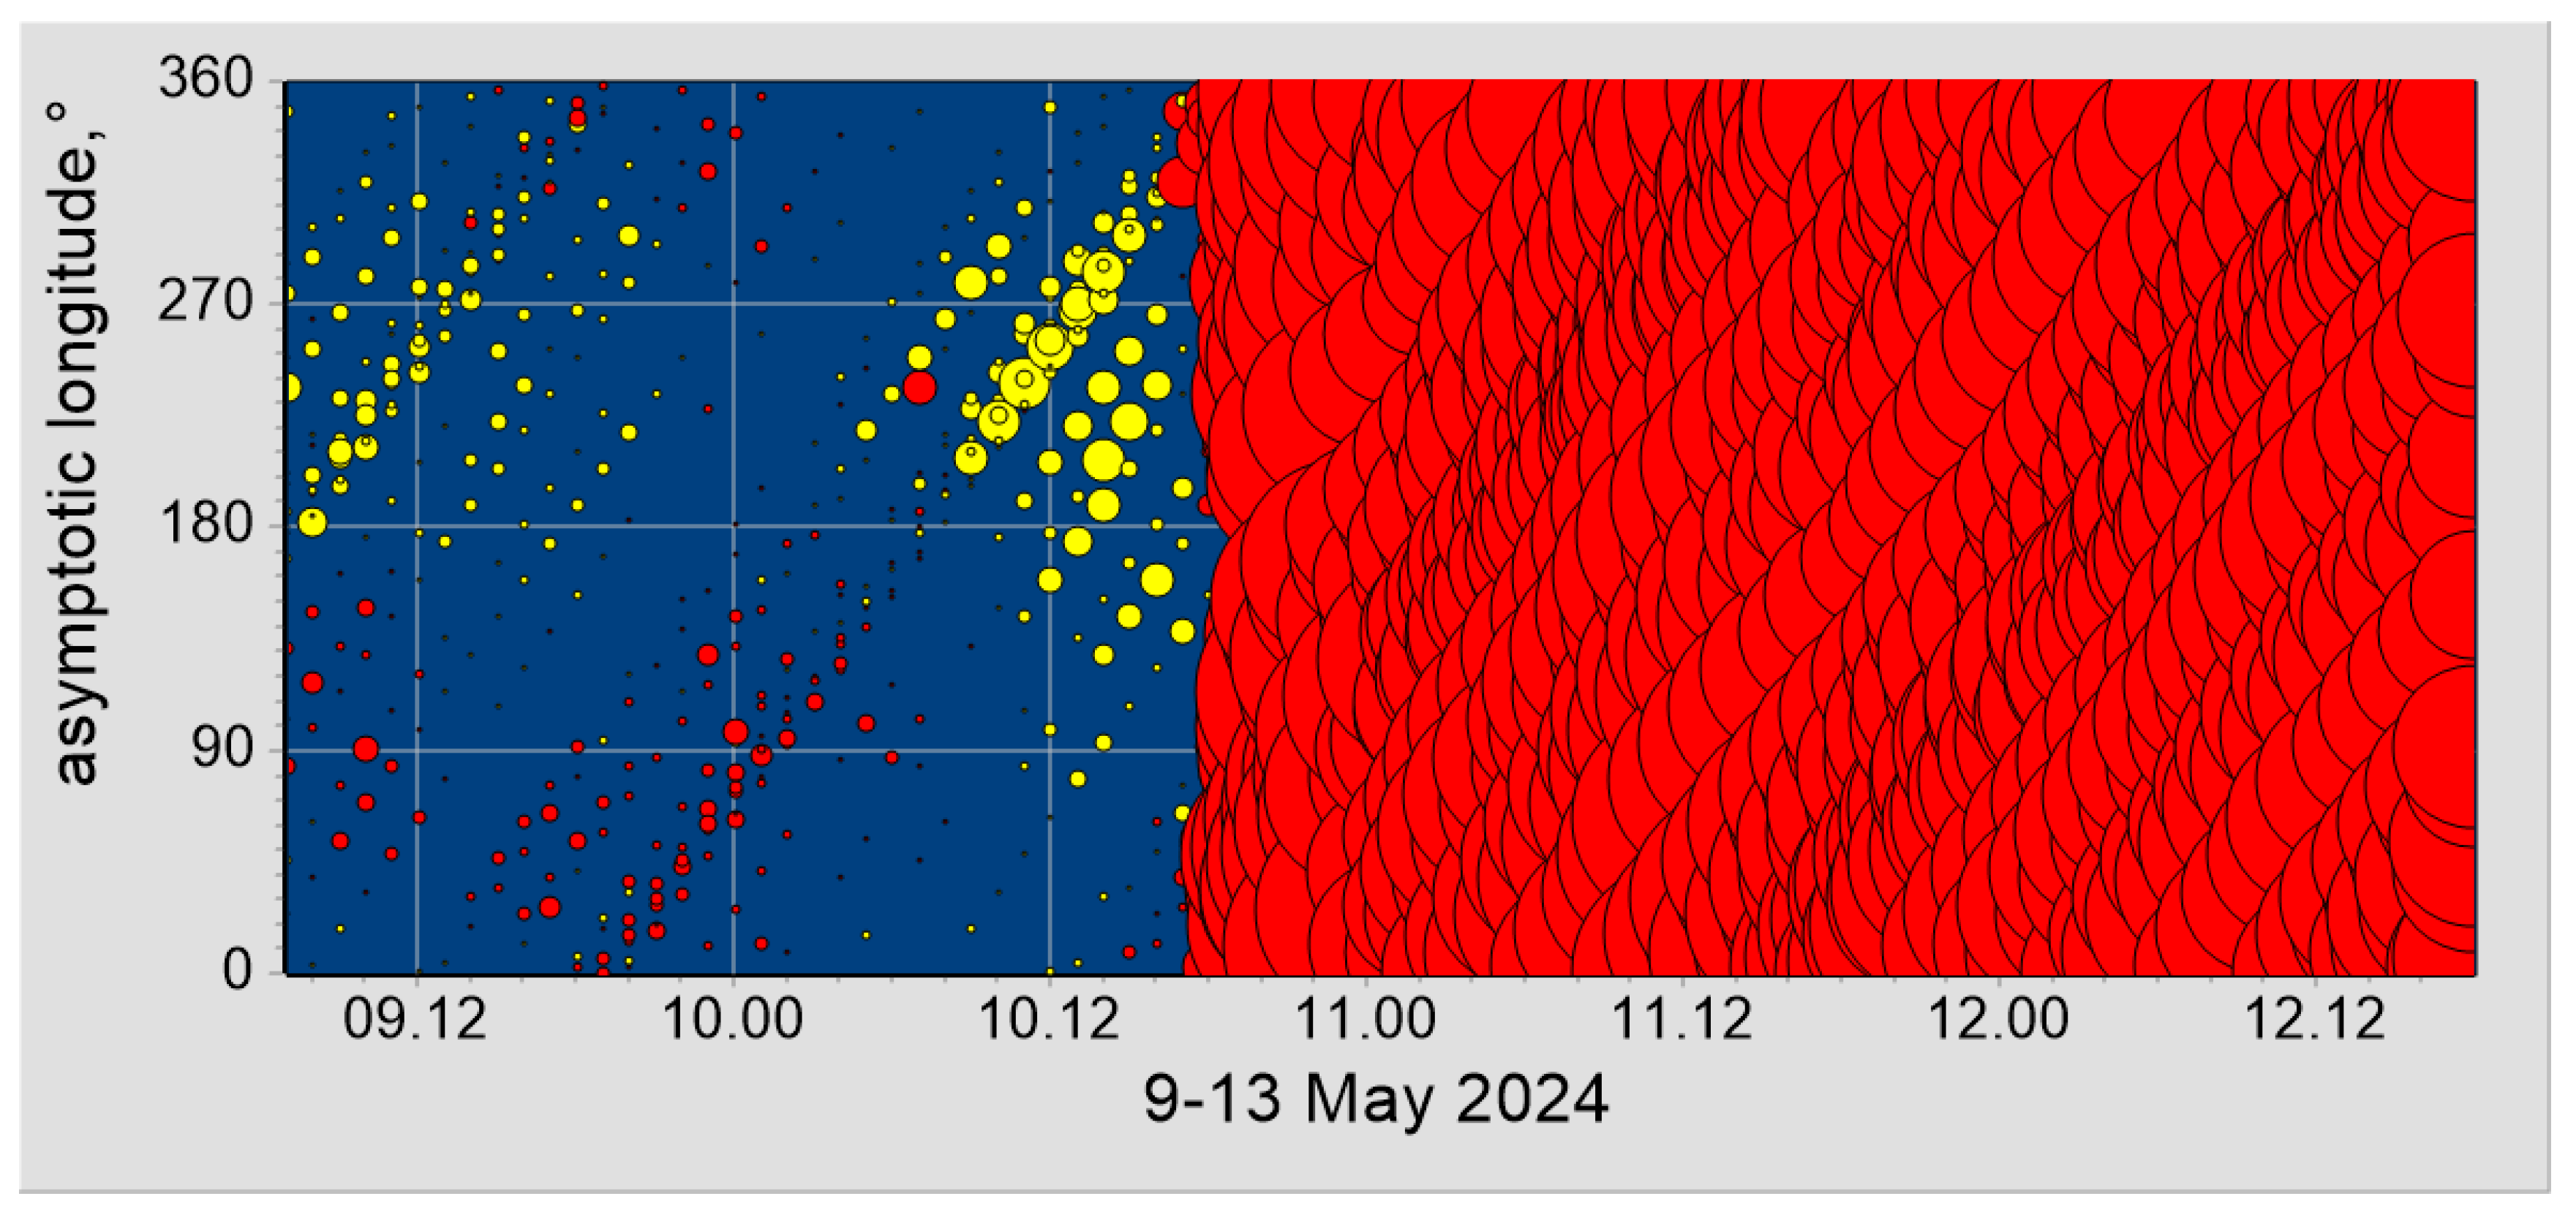
The FD occurring on 10 May 2024 was also analyzed in regard to precursors using the FD precursors method. The cosmic ray intensity variations for different asymptotic longitudes as function of time diagram for this event revealed clear signs of pre-increase in longitudes ~130°–320° almost 8 h before the development of the event (Figure 11).

4.3. The ap Prediction Tool

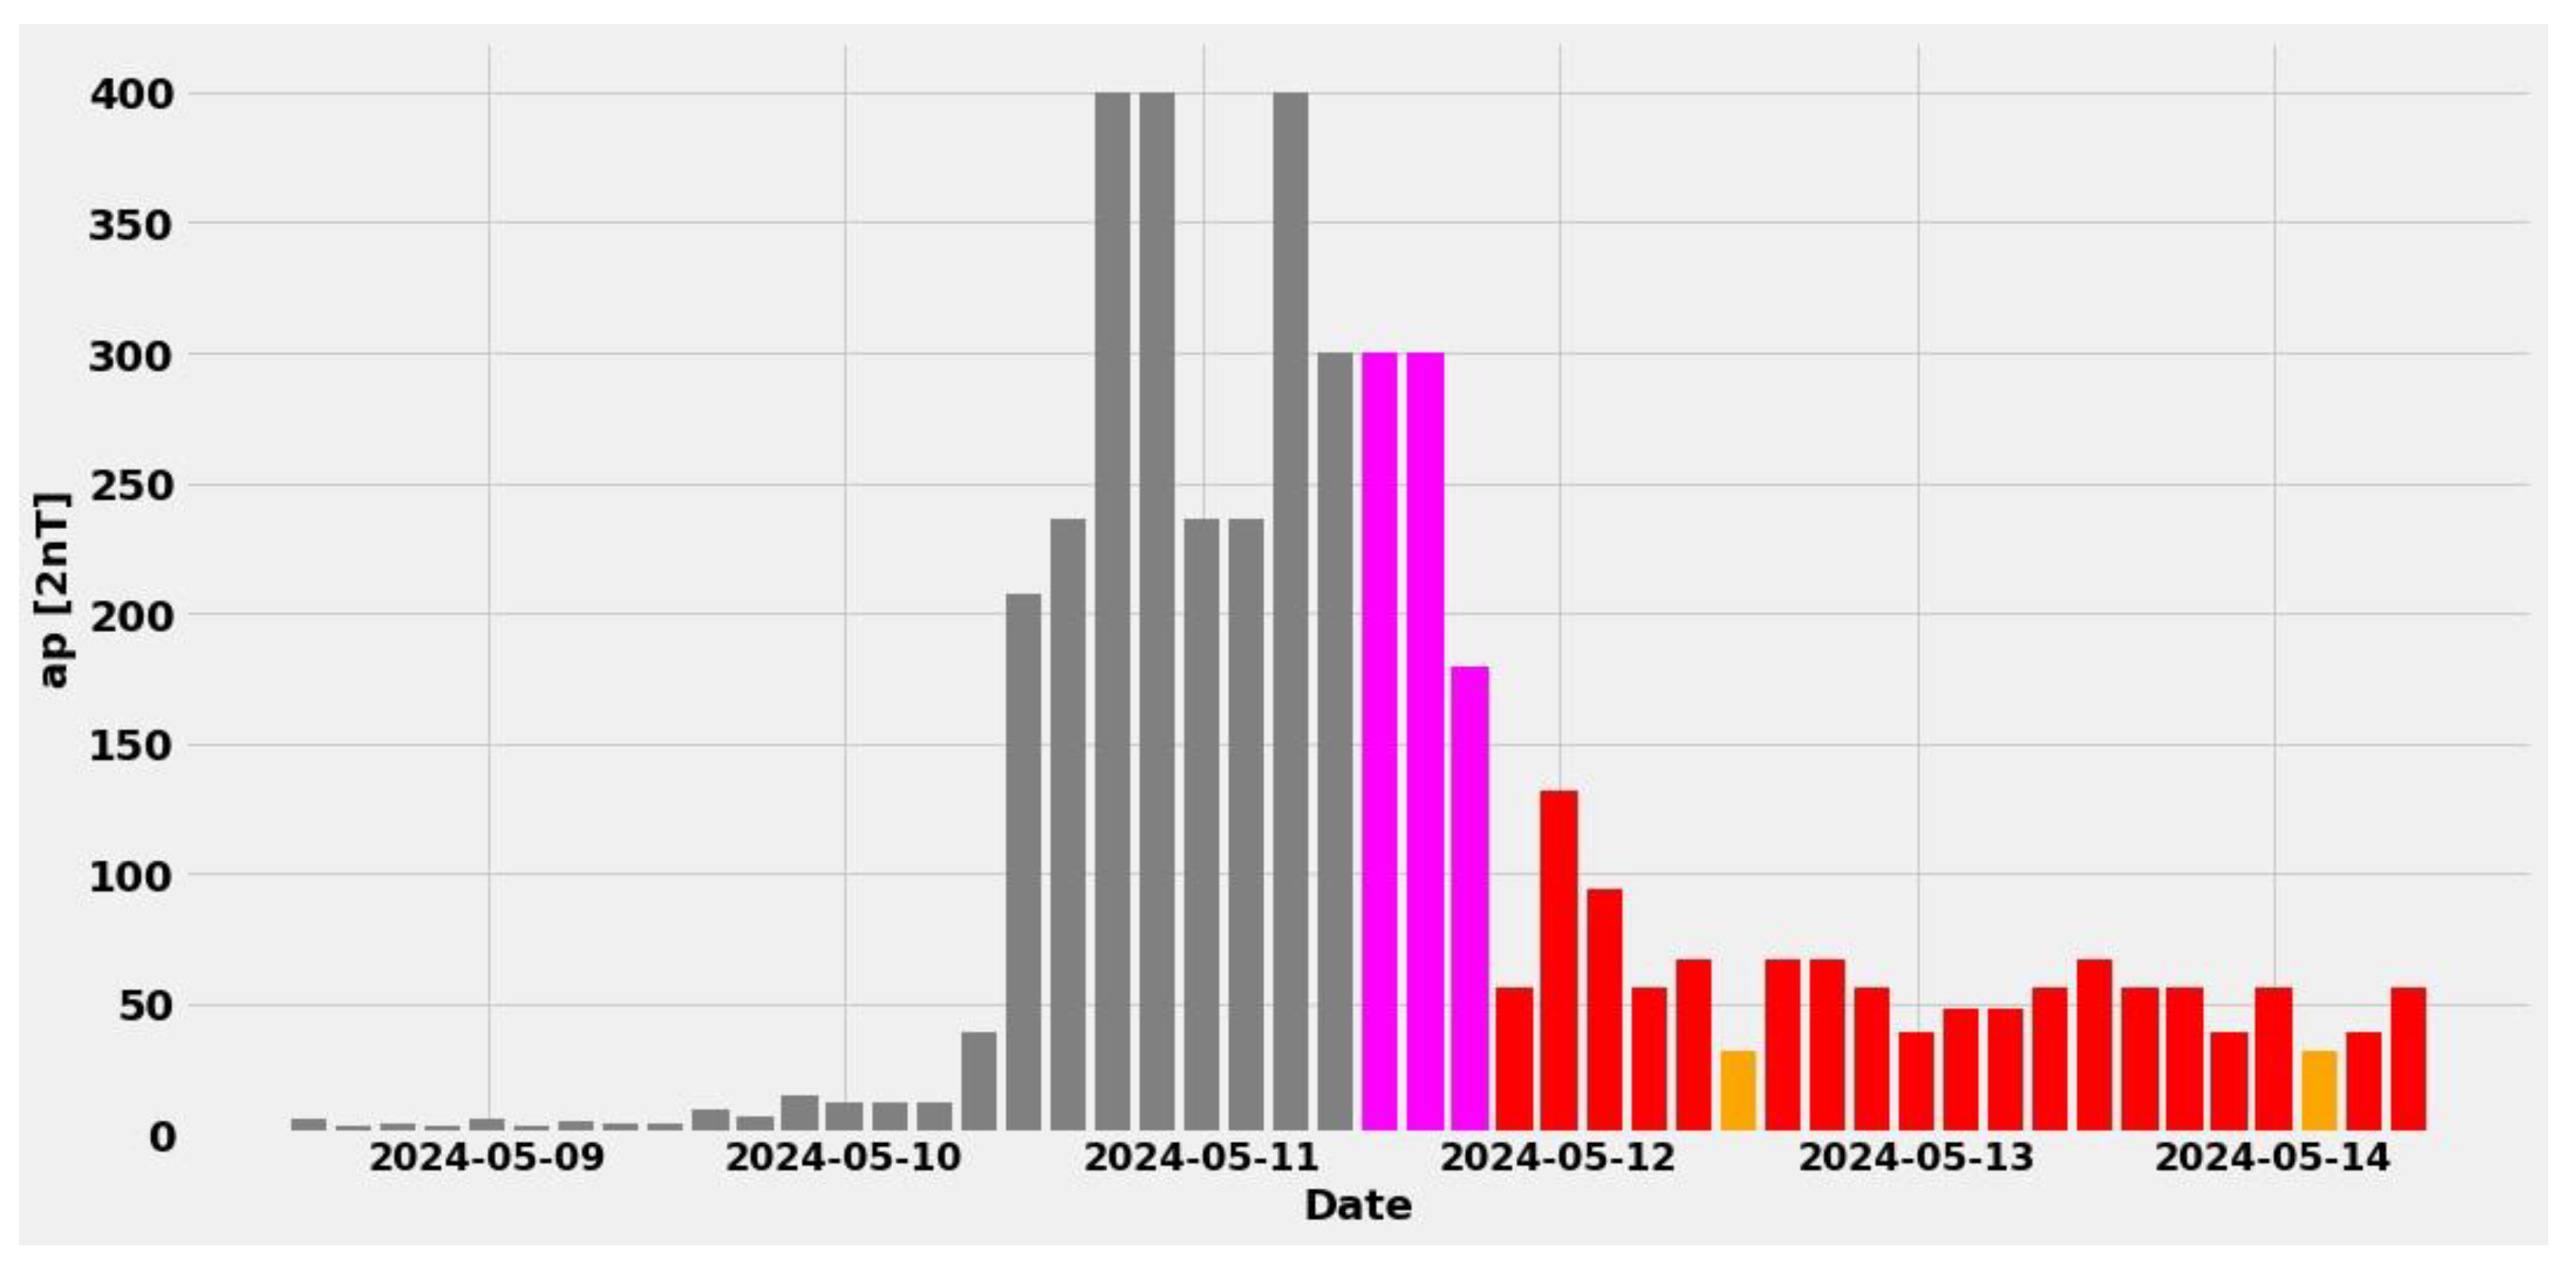
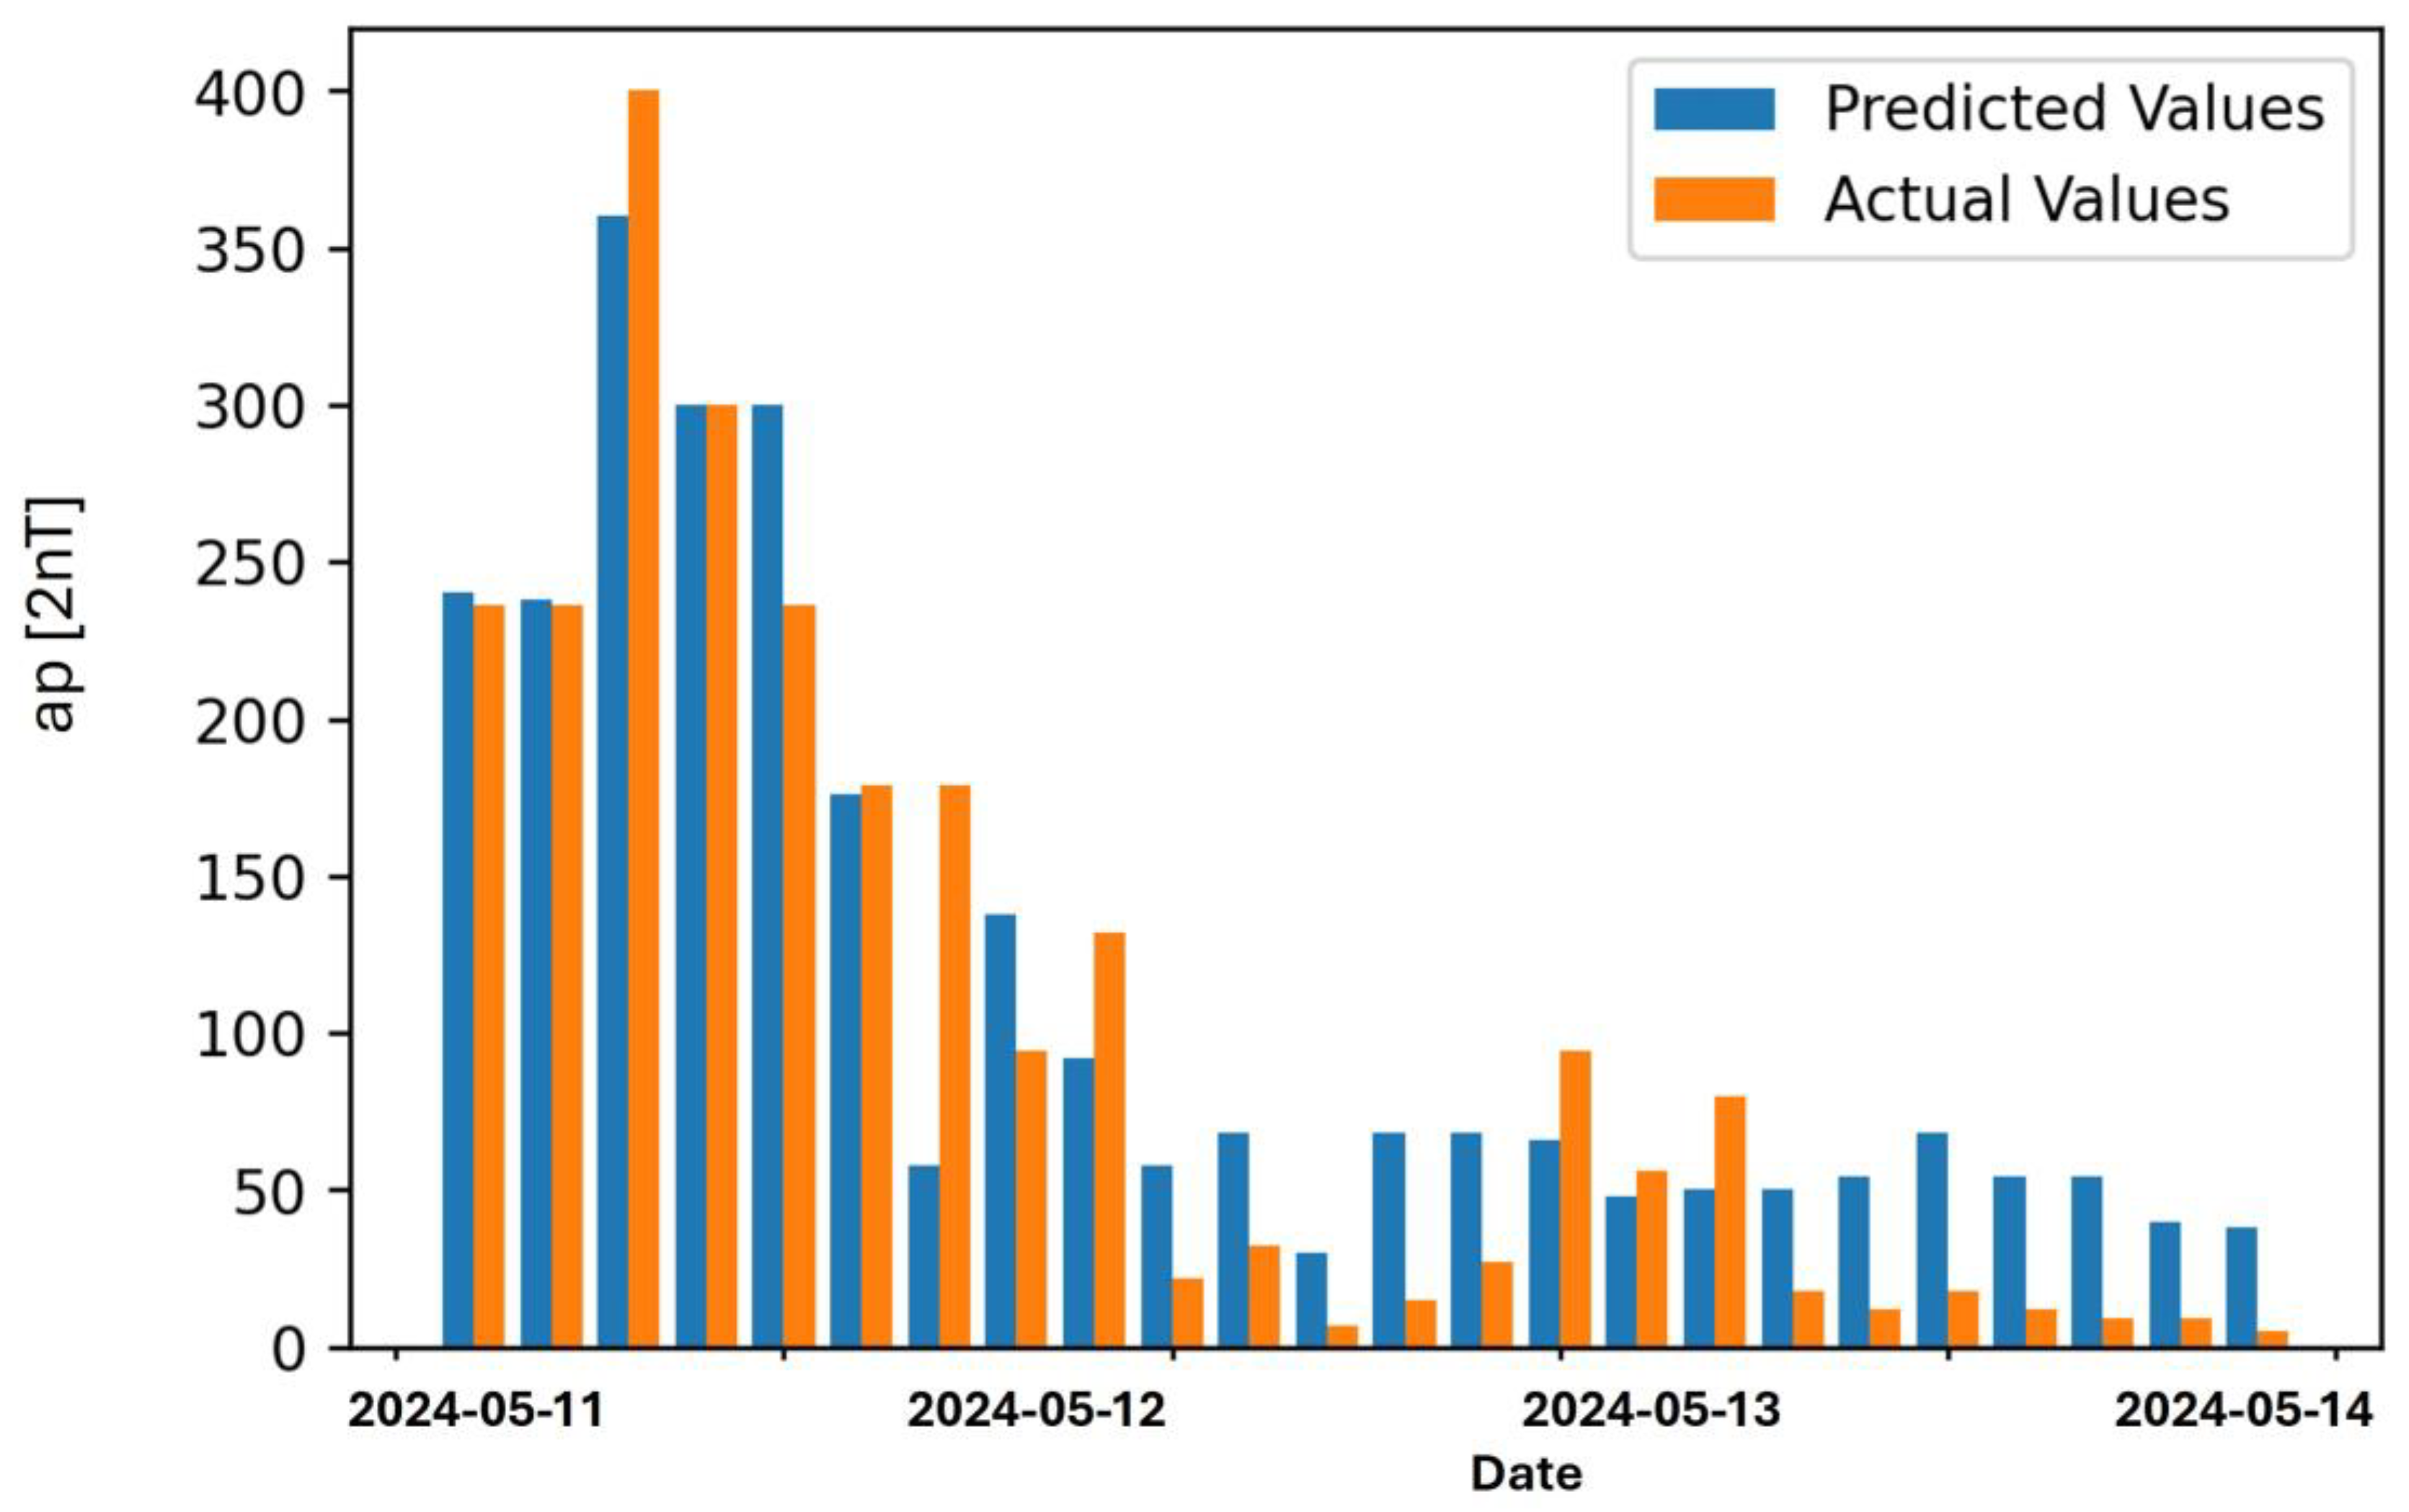
The ap Prediction tool estimated the arrival of the CMEs to the Earth on 10–13 May 2024 and the ap index fluctuations (Figure 12). During the GS, the actual value of apmax was 400, which corresponds to a Kp of value 9, according to the GFZ (http://www-app3.gfz-potsdam.de/kp_index/qlyymm.html, accessed on 20 June 2024). The actual and predicted values of the ap index from the tool during the arrival of the ICME are shown in Figure 13.

5. Discussion and Conclusions

This work has presented two unique space weather events recorded in the beginning of 2024. On 24 March and 11 May 2024, two severe GSs accompanied by two large FDs were registered. During the latter event, a GLE event was also observed. Apart from a detailed presentation of the events’ analysis, herein, the results of the forewarning systems and method used (NKUA “GLE Alert ++ system”, NKUA/IZMIRAN “FD Precursory Signals” method and NKUA “ap Prediction tool”) regarding these events have also been included.

5.1. Space Environment Conditions

The analysis of the ground-based neutron monitor data (provided by NMDB) and the satellite data (provided by NOAA) showed that on 24 March 2024, a severe GS (G4) led to an unusual FD with a large decrease in GCRs and a very rapid recovery phase [55]. This event differed significantly from a typical FD. In fact, only one previous FD, which was registered on 24 March 1991 [56], is similar to the event presented herein. Even though the recovery of the large FD on 24 March 1991 was not as fast, it was still impressive, mainly due to significant anisotropies [56].
Moreover, on 10–13 May 2024, a historic event took place. An extreme GS (G5) was registered by middle-latitude neutron monitor stations as the result of several ICMEs hitting the Earth’s magnetic field during this time period. This event was the strongest in over two decades. The last time a G5 GS was observed was the “Halloween Space Weather Storms” of 2003 [54]. Many places worldwide witnessed a remarkable display of aurora borealis during the May 2024 event. Auroras were also visible in lower latitudes (e.g., Armenia), which is, on principle, unusual. Moreover, a GLE event was recorded in the polar neutron monitor stations during the recovery phase of a large FD (~15%) and issued as GLE74.

5.2. Forewarning Systems and Method

The response and reliability of three forewarning systems were tested during these two events.
Regarding the GLE Alert++ system, a successful GLE74 alert was issued and registered on 11 May 2024. Due to the extremely rapid FD recovery of the 24 March 2024 event, alarm systems were triggered but were afterwards proven to not be valid. Therefore, this rare event and the corresponding false alerts provided a unique opportunity to thoroughly examine the effectiveness of the GLE Alert ++ algorithm. This can be summarized as follows:
(a)
The GLE Alert++ algorithm generates alerts in real time when a statistically significant rise of cosmic ray intensity is detected. The algorithm has the ability to analyze data in real-time; therefore, when cosmic ray data are notably increased, a prompt signal is issued. For the above-mentioned event, three emails notifications were sent to the users, when at least three stations were in Alert mode.
(b)
As mentioned, such a rapid recovery phase was not present even during the previous, almost similar, FD on 24 March 1991. Therefore, for the first time ever, the GLE Alert algorithm was misled due to the sudden and rapid recovery phase of the FD. This event should be viewed as an opportunity to find ways to improve the algorithm (and prevent false alerts in future exceptionally rare cases).
“FD Precursory Signals” were registered some hours before the evolution of the main FD events in both cases. Specifically, pre-increases in cosmic ray intensity above 150° longitudes a few hours before the development of the FD on 24 March 2024 and in longitudes ~130°–320° almost 8 h before the development of the FD on 10 May 2024 were clearly observed in the asymptotic longitude–time diagrams.
It can be argued that the “ap Prediction tool” provided satisfactory results for both events. For the event on 24 March 2024, the maximum value of the predicted apmax was 111 nT on 25 March 2024 at 12:00 UT, while the actual value of apmax (according to GFZ) was 236 nT on 24 March 2024 at 18:00 UT. For the event on 11 May 2024, the maximum value of the predicted apmax was 300 nT, while the actual value of apmax was 400. The tool is expected to improve once more past CMEs are included in the product’s machine learning algorithms.

Author Contributions

Software, A.A., A.B., P.P. and A.S.; data curation, M.L.; writing—original draft preparation, M.-C.P.; writing—review and editing, M.A., N.S., M.G., M.-C.P., N.C., M.D. and L.D.; supervision, H.M., A.B. and V.Y. All authors have read and agreed to the published version of the manuscript.

Funding

This work received no external funding.

Institutional Review Board Statement

Not applicable.

Informed Consent Statement

Not applicable.

Data Availability Statement

Data from neutron monitors available at www.nmdb.eu, (accessed on 20 June 2024).

Acknowledgments

This research was supported by the European Space Agency under the framework of the Space Weather Network: Operational and Development activities (SWESNET), contract number 4000134036/21/D/MRP. The authors would like to thank the cosmic ray data providers of the high-resolution Neutron Monitor Database (NMDB) and all the solar, interplanetary and geomagnetic data providers.

Conflicts of Interest

The authors declare no conflicts of interest.

References

  1. Sydney, C.; Julius, B. Geomagnetism; Clarendon Press: Oxford, UK, 1940; Original from the University of Michigan. [Google Scholar]
  2. Parks, G.K. Physics of Space Plasmas; Westview Press: Boulder, CO, USA, 1991. [Google Scholar]
  3. Gonzalez, W.D.; Joselyn, J.A.; Kamide, Y.; Kroehl, H.W.; Rostoker, G.; Tsurutani, B.T.; Vasyliunas, V.M. What is a geomagnetic storm? J. Geophys. Res. 1994, 99, 5771–5792. [Google Scholar] [CrossRef]
  4. Gonzalez, W.D.; Tsurutani, B.T.; Clúa de Gonzalez, A.L. Interplanetary origin of geomagnetic storms. Space Sci. Rev. 1999, 88, 529–562. [Google Scholar] [CrossRef]
  5. Hanslmeier, A. The Sun and space weather. In Astrophysics and Space Science Library; Springer: Dordrecht, The Netherlands, 2007; p. 347. [Google Scholar]
  6. Wrenn, G.L.; Rodgers, D.J.; Ryden, K.A. A solar cycle of spacecraft anomalies due to internal charging. Ann. Geophys. 2002, 20, 953–956. [Google Scholar] [CrossRef]
  7. Wrenn, G.L. Chronology of “killer” electrons: Solar cycles 22 and 23. J. Atmos. Sol.-Terr. Phys. 2009, 71, 1210–1218. [Google Scholar] [CrossRef]
  8. Rama Rao, P.V.S.; Gopi Krishna, S.; Vara Prasad, J.; Prasad, S.N.V.S.; Prasad, D.S.V.V.D.; Niranjan, K. Geomagnetic storm effects on GPS based navigation. Ann. Geophys. 2009, 27, 2101–2110. [Google Scholar] [CrossRef]
  9. Chapman, S.C.; Horne, R.B.; Watkins, N.W. Using the index over the last 14 Solar cycles to characterize extreme geomagnetic activity. Geophys. Res. Lett. 2020, 47, e2019GL086524. [Google Scholar] [CrossRef]
  10. Baker, D.N.; Daly, E.; Daglis, I.; Kappenman, J.G.; Panasyuk, M. Effects of space weather on technology infrastructure. Space Weather 2004, 2. [Google Scholar] [CrossRef]
  11. Eastwood, J.P.; Biffis, E.; Hapgood, M.A.; Green, L.; Bisi, M.M.; Bentley, R.D.; Wicks, R.; McKinnell, L.-A.; Gibbs, M.; Burnett, C. The economic impact of space weather: Where do we stand? Risk Anal. 2017, 37, 206–218. [Google Scholar] [CrossRef]
  12. Buzulukova, N.; Tsurutani, B. Space Weather: From solar origins to risks and hazards evolving in time. Front. Astron. Space Sci. 2022, 9, 1017103. [Google Scholar] [CrossRef]
  13. Kamide, Y.; Yokoyama, N.; Gonzalez, W.; Tsurutani, B.T.; Daglis, I.A.; Brekke, A.; Masuda, S. Two-step development of geomagnetic storms. J. Geophys. Res. 1998, 103, 6917–6921. [Google Scholar] [CrossRef]
  14. Daglis, I.A. Space Storms and Space Weather Hazards; NATO ASI Series; Springer: Dordrecht, The Netherlands, 2001. [Google Scholar]
  15. Bozhidar, S.; Georgi, S. Knowledge Discovery in Big Data from Astronomy and Earth Observation; Petr, Š., Fathalrahman, A., Eds.; Elsevier: Amsterdam, The Netherlands, 2020; ISBN 978-0-12-819154-5. [Google Scholar] [CrossRef]
  16. Lakhina, G.S.; Tsurutani, B.T. Geomagnetic storms: Historical perspective to modern view. Geosci. Lett. 2016, 3, 5. [Google Scholar] [CrossRef]
  17. Kallenrode, M.B. An introduction to plasmas and particles in the heliosphere and magnetospheres. In Space Physics; Springer: Berlin/Heidelberg, Germany, 1998. [Google Scholar]
  18. Collado-Villaverde, A.; Muñoz, P.; Cid, C. Classifying and bounding geomagnetic storms based on the SYM-H and ASY-H indices. Nat. Hazards 2024, 120, 1141–1162. [Google Scholar] [CrossRef]
  19. Matzka, J.; Stolle, C.; Yamazaki, Y.; Bronkalla, O.; Morschhauser, A. The geomagnetic Kp index and derived indices of geomagnetic activity. Space Weather 2021, 19, e2020SW002641. [Google Scholar] [CrossRef]
  20. Kivelson, M.G.; Russell, C.T. Introductions to Space Physics; Cambridge University Press: Cambridge, UK, 1995. [Google Scholar]
  21. Vania, J.K.; Ilie, R.; Chen, M.W. Chapter 1—Introduction and historical background. In Ring Current Investigations; Vania, J.K., Ilie, R., Chen, M.W., Eds.; Elsevier: Amsterdam, The Netherlands, 2020; pp. 1–13. ISBN 9780128155714. [Google Scholar] [CrossRef]
  22. Loewe, C.A.; Prölss, G.W. Classification and mean behavior of magnetic storms. J. Geophys. Res. 1997, 102, 14209–14213. [Google Scholar] [CrossRef]
  23. Akasofu, S.I. A Review of the Current Understanding in the Study of Geomagnetic Storms. Int. J. Earth Sci. Geophys. 2018, 4, 1–13. [Google Scholar] [CrossRef]
  24. Haines, C.; Owens, M.J.; Barnard, L.; Lockwood, M.; Ruffenach, A. The Variation of Geomagnetic Storm Duration with Intensity. Sol. Phys. 2019, 294, 154. [Google Scholar] [CrossRef]
  25. Reyes, P.I.; Pinto, V.A.; Moya, P.S. Geomagnetic storm occurrence and their relation with solar cycle phases. Space Weather 2021, 19, e2021SW002766. [Google Scholar] [CrossRef]
  26. Shadrina, L.P. Two types of geomagnetic storms and relationship between Dst and AE indexes. E3S Web Conf. 2017, 20, 01010. [Google Scholar] [CrossRef]
  27. Wang, C.; Ye, Q.; He, F.; Chen, B.; Zhang, X. A new method for predicting non-recurrent geomagnetic storms. Space Weather 2023, 21, e2023SW003522. [Google Scholar] [CrossRef]
  28. Hayakawa, H.; Ebihara, Y.; Willis, D.M.; Hattori, K.; Giunta, A.S.; Wild, M.N.; Hayakawa, S.; Toriumi, S.; Mitsuma, Y.; Macdonald, L.T. The great space weather event during 1872 February recorded in East Asia. Acta Pathol. Jpn. 2018, 862, 15. [Google Scholar] [CrossRef]
  29. Riley, P.; Love, J.J. Extreme geomagnetic storms: Probabilistic forecasts and their uncertainties. Space Weather 2017, 15, 53–64. [Google Scholar] [CrossRef]
  30. Ramesh, K.B. Solar cycle variation of the occurrence of geomagnetic storms. In Solar Drivers of Interplanetary and Terrestrial Disturbances; ASP Conference Series; Astronomical Society of the Pacific: San Francisco, CA, USA, 1996; Volume 95, pp. 462–469. [Google Scholar]
  31. Crooker, N.U.; Gosling, J.T.; Bothmer, V.; Forsyth, R.J.; Gazis, P.R.; Hewish, A.; Horbury, T.S.; Intriligator, D.S.; Jokipii, J.R.; Kóta, J.; et al. CIR Morphology, Turbulence, Discontinuities, and Energetic Particles. Space Sci. Rev. 1999, 89, 179–220. [Google Scholar] [CrossRef]
  32. Tsurutani, B.T.; Gonzalez, W.D.; Gonzalez, A.L.C.; Guarnieri, F.L.; Gopalswamy, N.; Grande, M.; Kamide, Y.; Kasahara, Y.; Lu, G.; Mann, I.; et al. Corotating solar wind streams and recurrent geomagnetic activity: A review. J. Geophys. Res. 2006, 111, A07S01. [Google Scholar] [CrossRef]
  33. Richardson, I.G. Solar wind stream interaction regions throughout the heliosphere. Living Rev. Sol. Phys. 2018, 15, 1. [Google Scholar] [CrossRef] [PubMed]
  34. Tandberg-Hanssen, E.; Emslie, A.G. The Physics of Solar Flares; Cambridge University Press: Cambridge, UK, 1988. [Google Scholar]
  35. Reames, D.V. Particle acceleration at the Sun and in the heliosphere. Space Sci. Rev. 1999, 90, 413–491. [Google Scholar] [CrossRef]
  36. Tsurutani, B.T. The interplanetary causes of magnetic storms, substorms and geomagnetic quiet. In Space Storms and Space Weather Hazards; Springer: Dordrecht, The Netherlands, 2001. [Google Scholar]
  37. Hajra, R.; Sunny, J.V. Corotating Interaction Regions during Solar Cycle 24: A Study on Characteristics and Geoeffectiveness. Sol. Phys. 2022, 297, 30. [Google Scholar] [CrossRef]
  38. Cliver, E.W.; Boriakoff, V.; Bounar, K.H. The 22-yr cycle of geomagnetic and solar wind activity. J. Geophys. Res. 1996, 101, 27091. [Google Scholar] [CrossRef]
  39. Gnevyshev, M.N. Essential features of the 11-year solar cycle. Sol. Phys. 1997, 51, 175. [Google Scholar] [CrossRef]
  40. Feminella, F.; Storini, M. Large-Scale Dynamical Phenomena during Solar Activity Cycles. Astron. Astrophys. 1997, 322, 311–319. [Google Scholar]
  41. Gnevyshev, M.N. The Corona and the 1 l-Year Cycle of Solar Activity. Sov. Astron. 1963, 7, 311. [Google Scholar]
  42. Storini, M.; Pase, S. Long-term Solar Features Derived from Polar-looking Cosmic-Ray Detectors. STEP GBRSC News 1995, 5, 255–258. [Google Scholar]
  43. Bazilevskaya, G.A.; Makhmutov, V.S.; Sladkova, A.I. Gnevyshev gap effects in solar energetic particle activity. Adv. Space Res. 2006, 38, 484–488. [Google Scholar] [CrossRef]
  44. Storini, M.; Bazilevskaya, G.A.; Fluckiger, E.O.; Krainev, M.B.; Makhmutov, V.S.; Sladkova, A.I. The GNEVYSHEV gap: A review for space weather. Adv. Space Res. 2003, 31, 895–900. [Google Scholar] [CrossRef]
  45. Cane, H.V. Coronal mass ejections and Forbush decreases. Space Sci. Rev. 2000, 93, 55–77. [Google Scholar] [CrossRef]
  46. Morishita, I.; Nagashima, K.; Sakakibara, S.; Munakata, K. Long Term Changes of the Rigidity Spectrum of Forbush Decreases. In Proceedings of the 21st International Cosmic Ray Conference, Adelaide, Australia, 6–19 January 1990; Volume 6, pp. 217–220. [Google Scholar]
  47. Papailiou, M.-C.; Abunina, M.; Mavromichalaki, H.; Shlyk, N.; Belov, S.; Abunin, A.; Gerontidou, M.; Belov, A.; Yanke, V.; Triantou, A. Precursory Signs of Large Forbush Decreases in Relation to Cosmic Rays Equatorial Anisotropy Variation. Atmosphere 2024, 15, 742. [Google Scholar] [CrossRef]
  48. Abunina, M.A.; Belov, A.V.; Eroshenko, E.A.; Abunin, A.A.; Yanke, V.G.; Melkumyan, A.A.; Shlyk, N.S.; Pryamushkina, I. Ring of Stations Method in Cosmic Rays Variations Research. Sol. Phys. 2020, 295, 69. [Google Scholar] [CrossRef]
  49. Mavromichalaki, H.; Livada, M.; Stassinakis, A.; Gerontidou, M.; Papailiou, M.-C.; Drube, L.; Karmi, A. The ap prediction tool implemented by the A.Ne.Mo.S./NKUA Group. Atmosphere, 2024; submitted. [Google Scholar]
  50. Paouris, E.; Mavromichalaki, H. Effective Acceleration Model for the arrival time of interplanetary shocks driven by coronal mass ejections. Sol. Phys. 2017, 292, 180. [Google Scholar] [CrossRef]
  51. Stassinakis, A.; Livada, M.; Gerontidou, M.; Tezari, A.; Mavromichalaki, H.; Paouris, E.; Makrantoni, P. Forecast of the Geomagnetic Index ap during CME events. In Proceedings of the 19th European Space Weather Week, Toulouse, France, 20–24 November 2023. [Google Scholar]
  52. Mavromichalaki, H.; Paschalis, P.; Gerontidou, M.; Tezari, A.; Papailiou, M.-C.; Lingri, D.; Livada, M.; Stassinakis, A.; Crosby, N.; Dierckxsens, M. An Assessment of the GLE Alert++ Warning System. Atmosphere 2024, 15, 345. [Google Scholar] [CrossRef]
  53. Kuwabara, T.; Bieber, J.; Clem, J.; Evenson, P.; Pyle, R.; Munakata, K.; Yasue, S.; Kato, C.; Akahane, S.; Koyama, M.; et al. Real-time cosmic ray monitoring system for space weather. Space Weather 2006, 4, S08001. [Google Scholar] [CrossRef]
  54. Weaver, M.; Murtagh, W.; Balch, C.; Biesecker, D.; Combs, L.; Crown, M.; Doggett, K.; Kunches, J.; Singer, H.; Zezula, D. Halloween Space Weather Storms of 2023; NOAA Technical Memorandum OAR SEC-88; National Oceanic and Atmospheric Administration: Washington, DC, USA, 2004. [Google Scholar]
  55. Mishev, A.; Larsen, N.; Asvestari, E.; Sáiz, A.; Shea, M.A.; Strauss, D.T.; Ruffolo, D.; Banglieng, C.; Seunarine, S.; Duldig, M.L.; et al. Anisotropic Forbush decrease of 24 March 2024: First look. Adv. Space Res. 2024, in press. [CrossRef]
  56. Hofer, M.Y.; Flueckiger, E.O. Cosmic ray spectral variations and anisotropy near Earth during the March 24, Forbush decrease. J. Geophys. Res. Space Phys. 1991, 105, 23085–23097. [Google Scholar] [CrossRef]
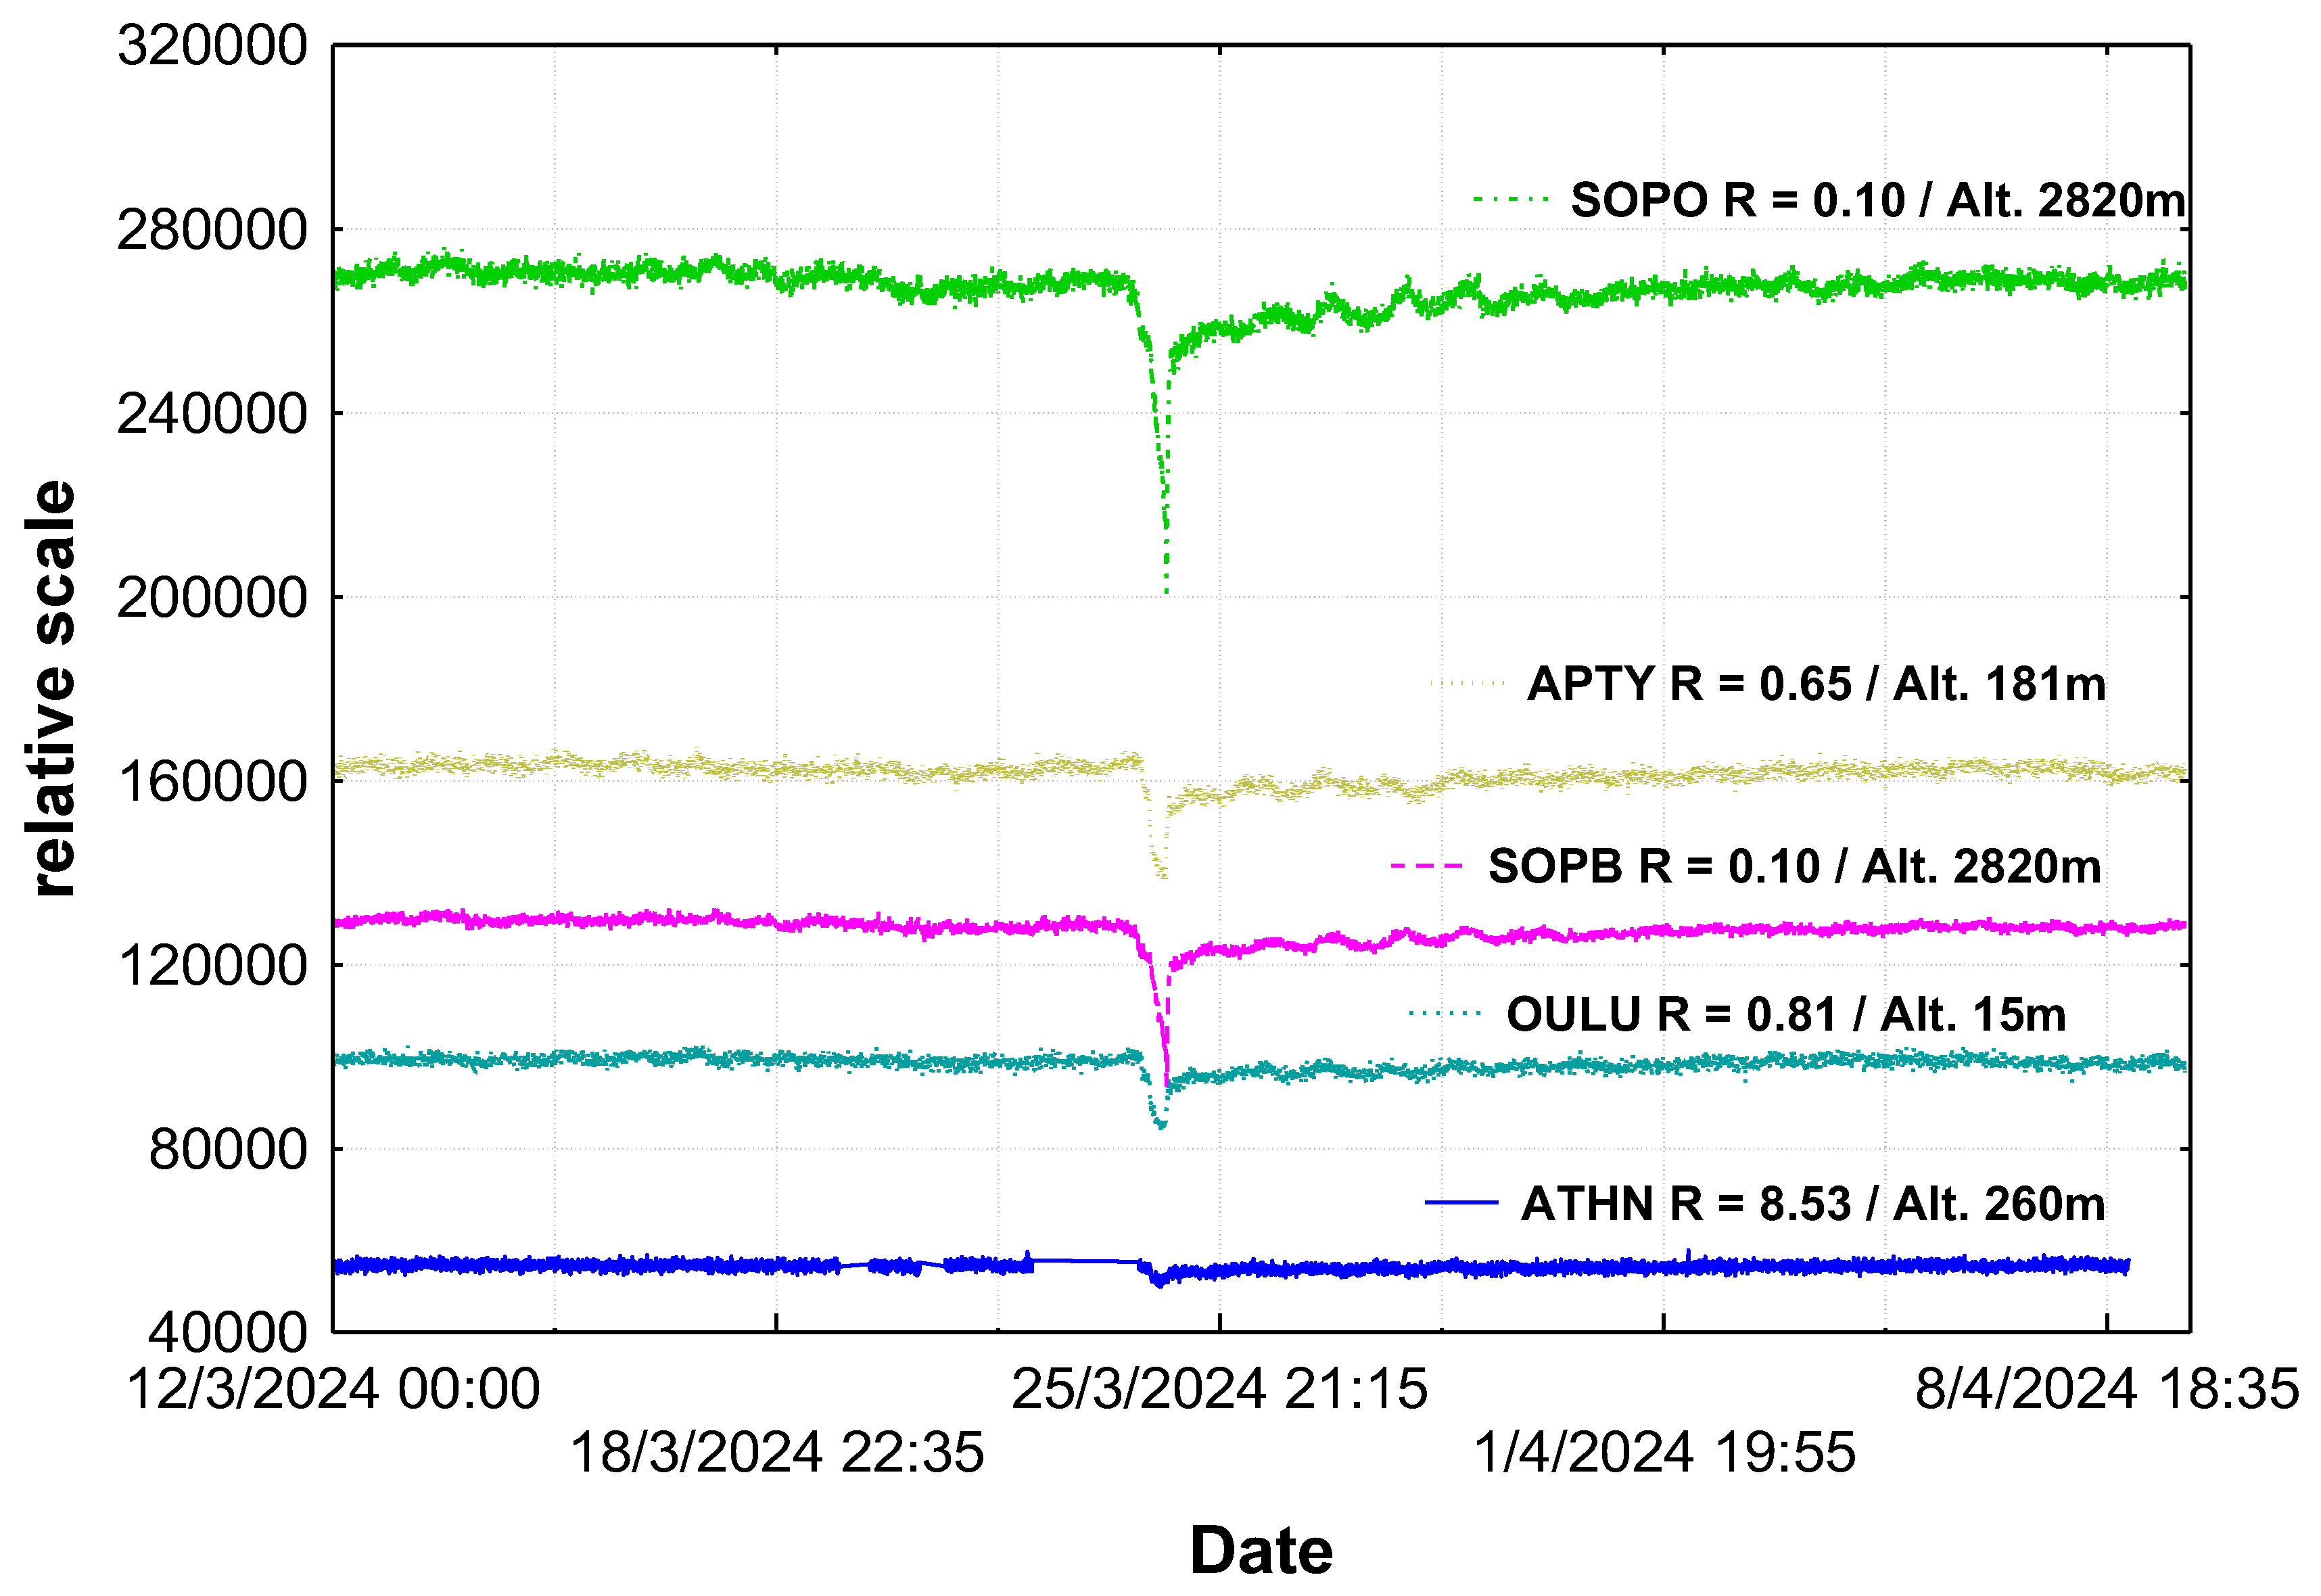
Figure 1. The FD on 24 March 2024 as recorded by five neutron monitor stations (SOPO, SOPB, APTY, OULU, ATHN).
Atmosphere 15 01033 g001
Figure 2. The FD on 24 March 2024, as detected by SOPO, THUL and INVK neutron monitor stations.
Atmosphere 15 01033 g002
Figure 3. The GLE Alert as detected on 25 March at 02:26 UT by the LMKS, THUL, YKTK neutron monitor stations.
Atmosphere 15 01033 g003aAtmosphere 15 01033 g003b
Figure 4. The GLE Alert notification that was sent to registered users.
Atmosphere 15 01033 g004
Figure 5. The asymptotic longitude–time diagram for the FD on 24 March 2024. Decreases and increases in cosmic ray intensity are represented by red- and yellow-colored circles, respectively, estimated with respect to an undisturbed base period. The size of the variation is proportional to the circle’s size. The horizontal axis represents time (DD.HH).
Atmosphere 15 01033 g005
Figure 6. Scaled color plot of ap values. The actual data provided by GFZ from 21 March 2024 to 24 March 2024 for the previous 72 h are shown in gray color. The forecasted ap values from 24 March 2024 to 27 March 2024 for the next 72 h are shown as a function of color. The color cyan corresponds to ap values 0–3, lime to 4–7, yellow 9–15, orange 18–32, red 39–154 and magenta > 179.
Atmosphere 15 01033 g006
Figure 7. Predicted and real ap values for the time period from 24 March 2024 to 27 March 2024.
Atmosphere 15 01033 g007
Figure 8. The FD on 10 May 2024, as detected by SOPO, SOPB, TERA, OULU and LMKS neutron monitor stations.
Atmosphere 15 01033 g008
Figure 9. The GLE Alert as detected on 11 May at 02:07 UT by the LMKS, SOPO and OULU neutron monitor stations.
Atmosphere 15 01033 g009
Figure 10. The GLE Alert notification that was sent to registered users.
Atmosphere 15 01033 g010
Figure 11. The asymptotic longitude–time diagram for the FD on 10 May 2024. Decreases and increases in cosmic ray intensity are represented by red- and yellow-colored circles, respectively, estimated with respect to an undisturbed base period. The size of the variation is proportional to the circle’s size. The horizontal axis represents time (DD.HH).
Atmosphere 15 01033 g011
Figure 12. Scaled color plot of ap values. The actual data provided by GFZ from 8 May 2024 to 11 May 2024 for the past 72 h are shown in gray color. The forecasted ap values from 11 May 2024 to 14 May 2024, for the next 72 h, are shown as a function of color. The color cyan corresponds to ap values 0–3, lime to 4–7, yellow 9–15, orange 18–32, red 39–154 and magenta > 179.
Atmosphere 15 01033 g012
Figure 13. Predicted and real ap values for the time period from 11 May 2024 to 14 May 2024.
Atmosphere 15 01033 g013
Disclaimer/Publisher’s Note: The statements, opinions and data contained in all publications are solely those of the individual author(s) and contributor(s) and not of MDPI and/or the editor(s). MDPI and/or the editor(s) disclaim responsibility for any injury to people or property resulting from any ideas, methods, instructions or products referred to in the content.