Article

Evaluation of Seasonal Prediction of Extreme Wind Resource Potential over China Based on a Dynamic Prediction System SIDRI-ESS V1.0

1
Shanghai Investigation, Design and Research Institute Co., Ltd., Shanghai 200434, China
2
Key Laboratory of Polar Atmosphere-Ocean-Ice System for Weather and Climate of the MOE, Department of Atmospheric and Oceanic Sciences and Institute of Atmospheric Sciences, Fudan University, Shanghai 200438, China
3
Key Laboratory for Polar Science of the MNR, Polar Research Institute of China, Shanghai 200136, China
4
Southern Marine Science and Engineering Guangdong Laboratory (Zhuhai), Zhuhai 519080, China
*
Author to whom correspondence should be addressed.
Atmosphere 2024, 15(9), 1024; https://doi.org/10.3390/atmos15091024
Submission received: 27 June 2024 / Revised: 13 August 2024 / Accepted: 21 August 2024 / Published: 23 August 2024
(This article belongs to the Special Issue Prediction and Modeling of Extreme Weather Events)

Abstract

:
Wind resources play a pivotal role in building sustainable energy systems, crucial for mitigating and adapting to climate change. With the increasing frequency of extreme events under global warming, effective prediction of extreme wind resource potential can improve the safety of wind farms and other infrastructure, while optimizing resource allocation and emergency response plans. In this study, we evaluate the seasonal prediction skill for summer extreme wind events over China using a 20-year hindcast dataset generated by a dynamical seamless prediction system designed by Shanghai Investigation, Design and Research Institute Co., Ltd. (Shanghai, China) (SIDRI-ESS V1.0). Firstly, the hindcast effectively simulates the spatial distribution of summer extreme wind speed thresholds, even though it tends to overestimate the thresholds in most regions. Secondly, high prediction skills, measured by temporal correlation coefficient (TCC) and normalized root mean square error (nRMSE), are observed in northeast China, central east China, southeast China, and the Tibetan Plateau (TCC is about 0.5 and the nRMSE is below 0.9 in these regions). The highest skills emerge in southeast China with a maximum TCC greater than 0.7, and effective prediction skill can extend up to a 5-month lead time. Ensemble prediction significantly enhances predictive skill and reduces uncertainty, with 24 ensemble members being sufficient to saturate TCC and 12–16 members for nRMSE in most key regions and lead times. Furthermore, we show that the prediction skill for extreme wind counts is strongly related to the prediction skill for summer mean wind speeds, particularly in southeast China. Overall, SIDRI-ESS V1.0 shows promising performance in predicting extreme winds and has great potential to provide services to the wind industry. It can effectively help to optimize wind farm operating strategies and improve power generation efficiency. However, further improvements are needed, particularly in areas where prediction skills for extreme winds are influenced by smaller-scale weather phenomena and areas with complex underlying surfaces and climate characteristics.

1. Introduction

Wind energy, as an important part of renewable energy, has been widely used and developed rapidly in the process of transforming the world energy system [1,2,3]. Recently, the wind power industry has experienced a period of rapid growth, with the grid-connected capacity increasing swiftly. As a country at the forefront of clean energy, wind power generation in China reached 886 TWh in 2023, accounting for 9% of the total power generation and making wind power the third-largest source of electricity in China [4]. China has made a significant contribution to global wind power growth, accounting for 60% of global wind power additions in 2023, and this trend will continue in the future [4,5]. The utilization of wind energy significantly reduces the dependence on traditional energy sources and provides a sustainable solution for alleviating the energy crisis and mitigating climate change [6,7,8,9]. However, the fluctuating, intermittent, seasonal and interannual variations in wind resources can lead to significant changes in wind power output, which show great impacts on the power quality, safe and stable operation, and economic benefits of the power system [10,11,12,13]. Therefore, it is necessary to conduct seamless prediction for wind resources.
For the wind energy industry, seasonal prediction provides a foundation for wind farm operation and maintenance planning, electricity market trading, and measurements of wind farm power generation efficiency. Recently, the demand for seasonal prediction of wind speed and extreme winds has been growing, driven by requirements for the economic efficiency and safe operation of wind farm stations [14,15,16,17,18,19]. Meanwhile, under the promotion of the Global Framework for Climate Services, the development and utilization of seasonal prediction in the wind power industry have gradually become one of the main directions of global climate services [20].
Previous studies have mainly focused on the seasonal prediction of wind speed, particularly in regions where the wind power industry is well developed. This is because seasonal variations in wind speed play a crucial role in the wind power industry [17,19,21,22]. Numerous studies have indicated that state-of-the-art seasonal prediction systems have shown reliable predictive skills for seasonal wind speed in these regions, such as SEAS5 in the European Centre for Medium-Range Weather Forecasts (ECMWF) [23], GloSea Versions 5 and 6 in the Met Office [17,24,25,26], and Météo France System 5 [22,27], and can thus provide climate services to the wind energy industry [18,22,28,29,30,31,32]. Extreme wind events also have great impacts on the wind energy industry. Extreme wind events, characterized by unusually high wind speeds, have significant impacts on society, economy, and the environment. On the one hand, extreme winds offer high-energy periods for wind power generation, allowing turbines to operate at full capacity and increase efficiency. On the other hand, they can also pose potential destructive risks, often resulting in sandstorms, or are accompanied by other extreme weather events, such as typhoons, strong convection, and storm surges. These events can lead to severe damages, including property destruction, agricultural losses, and disruptions to energy infrastructure and human activities [33,34,35,36]. For example, sustained extreme wind caused a tower collapse accident at a wind farm station in Heilongjiang Province in January 2020. And in March 2024, Nanchang City experienced an extreme wind event accompanied by strong convection, resulting in casualties and economic losses. Some studies have shown that the frequency of extreme winds exhibits significant trends and strong interannual variability in the observation [37,38,39]. This also suggests that extreme wind counts and their potential can be predicted on a seasonal scale. Given the potential consequences, the seasonal prediction of extreme wind events is crucial and highly beneficial for the wind energy industry. In the planning phase, seasonal prediction for extreme wind resources can optimize the siting of wind farms, ensuring locations are in high-energy wind regions with manageable risks. During the designing and building phases, seasonal prediction of extreme wind resources allows for efficient scheduling to mitigate impacts on project safety and progress. In the operational phase, it provides a scientific basis for utilizing and responding to different extreme wind speeds, assisting energy companies and related departments in developing informed operational and emergency plans. This proactive approach reduces the risks associated with extreme winds, thus enhancing the efficiency of wind energy resource utilization.
By analyzing the prediction skill of the first generation of the dynamic ensemble seamless prediction system designed by Shanghai Investigation, Design and Research Institute Co., Ltd. (SIDRI-ESS V1.0), this study contributes to understanding the skill and potential of current dynamic prediction systems in predicting extreme wind events. The findings may offer valuable insights for improving seasonal prediction skill and enhancing preparedness for extreme wind events, ultimately aiming to reduce adverse impacts on society and the environment. The remainder of this paper is organized as follows. In Section 2, we introduce the data and methods used in this study, including the model, hindcasts, the observational dataset, the definition of extreme wind events, and skill metrics. Section 3 describes the seasonal prediction skill for extreme wind counts over China, and explores the possible reasons for prediction skill. A summary and discussion are given in Section 4 and Section 5, respectively.

2. Data and Methods

2.1. Model and Hindcast Dataset

A 20-year hindcast from 2003 to 2022 was generated based on the SIDRI-ESS V1.0. SIDRI-ESS V1.0 is composed of four components, including atmosphere, ocean, sea ice, and land components, and realizes heat and momentum exchange among subsystems through a coupler. The atmosphere component has a horizontal resolution of 1° × 1° and 32 vertical layers. At present, SIDRI-ESS V1.0 only assimilates 6-hourly air temperature, humidity, surface pressure, sea level pressure, and zonal and meridional winds from atmospheric reanalysis data (Final Reanalysis Data, FNL) by using an incremental analysis updating (IAU) process to generate the initial atmospheric conditions. The ocean, sea ice, and land components adjust in response to the atmospheric component, due to the interaction in the global climate system. The hindcasts were produced on the penultimate day of each month, with 24 ensemble members generated using a time-lag perturbation method. And each member has 190-day integration (January and December have 230-day and 250-day integration, respectively) (Figure 1). The temporal resolution of output data of hindcast is 6-hourly. In this study, we focus on boreal summer (June–July–August, JJA) due to the lower prediction skill in most prediction systems caused by the combined effect of a more complex climate and limited model simulation ability during JJA [40,41,42,43]. The hindcast starting the prediction from May is denoted as 1-month lead.

2.2. Observed Dataset

We used the fifth generation of the European Centre for Medium-Range Weather Forecasts (ECMWF) atmospheric reanalysis (ERA5 hourly data on single levels from 1940 to present) [44] as a reference dataset to verify the predictive skill of the hindcasts. The ERA5 dataset has a grid resolution of 0.25° × 0.25° covering the period from 1940 to present. For subsequent analyses, ERA5 is processed into corresponding daily and monthly datasets, and interpolated to a grid resolution of 1° × 1° by using bilinear interpolation.

2.3. Definition of Extreme Wind Events

For both the hindcasts and ERA5, extreme wind events are identified as when daily mean 10m wind speed (ws10m) exceeds the 95th percentile of daily mean ws10m for each month during the period of 2003–2022 [36,45]. We took the 95th percentile as the extreme ws10m threshold due to its value varying across different regions. The percentile method provides an objective and statistically meaningful criterion that effectively captures extreme wind events within each grid, ensuring the comparability of extreme wind standards across different regions [36,45,46,47]. Taking June as an example, the ws10m values for a total of 600 days (2003–2022, 20 years) were ranked from the lowest to highest for each grid, the threshold of extreme wind in June is defined as the 95th percentile of these 600 days. If the daily mean ws10m exceeds this threshold, an extreme wind event is considered to have occurred on that specific day of the June in that year. In this study, we focus on the seasonal prediction skill of the number of extreme wind events during boreal summer. The extreme wind counts are calculated as the total number of extreme wind events in JJA for each year.

2.4. Skill Metrics

To investigate the predictive skill of SISRI-ESS V1.0 in extreme wind, temporal correlation coefficient (TCC) and normalized root mean square error (nRMSE) are taken as the skill metrics. The skill metrics were calculated for each individual ensemble member and ensemble member mean (EMM) of hindcasts, respectively.
TCC is used to measure the temporal correlation between hindcasts and corresponding observations. TCC is defined as
T C C = i = 1 n ( F i - F ¯ i ) ( O i - O ¯ i ) i = 1 n ( F i - F ¯ i ) 2 i = 1 n ( O i - O ¯ i ) 2
where F is the predicted variable, O is observation, i is time, N is the length of the time period, and bar is the climatological mean state. Statistical significances of TCC are tested using the two-tailed student t-test method.
nRMSE is a common metric to measure the bias between hindcasts and observation, and eliminate the effect of various magnitudes. nRMSE is defined as
n R M S E = 1 N i = 1 N [ ( F i - F ¯ i ) - ( O i - O ¯ i ) ] 2 1 N i = 1 N ( O i - O ¯ i ) 2 = R M S E σ o
where RMSE is the root mean square error, and σ o is the standard deviation in the observations.

3. Results

3.1. Evaluation of Extreme Winds Threshold

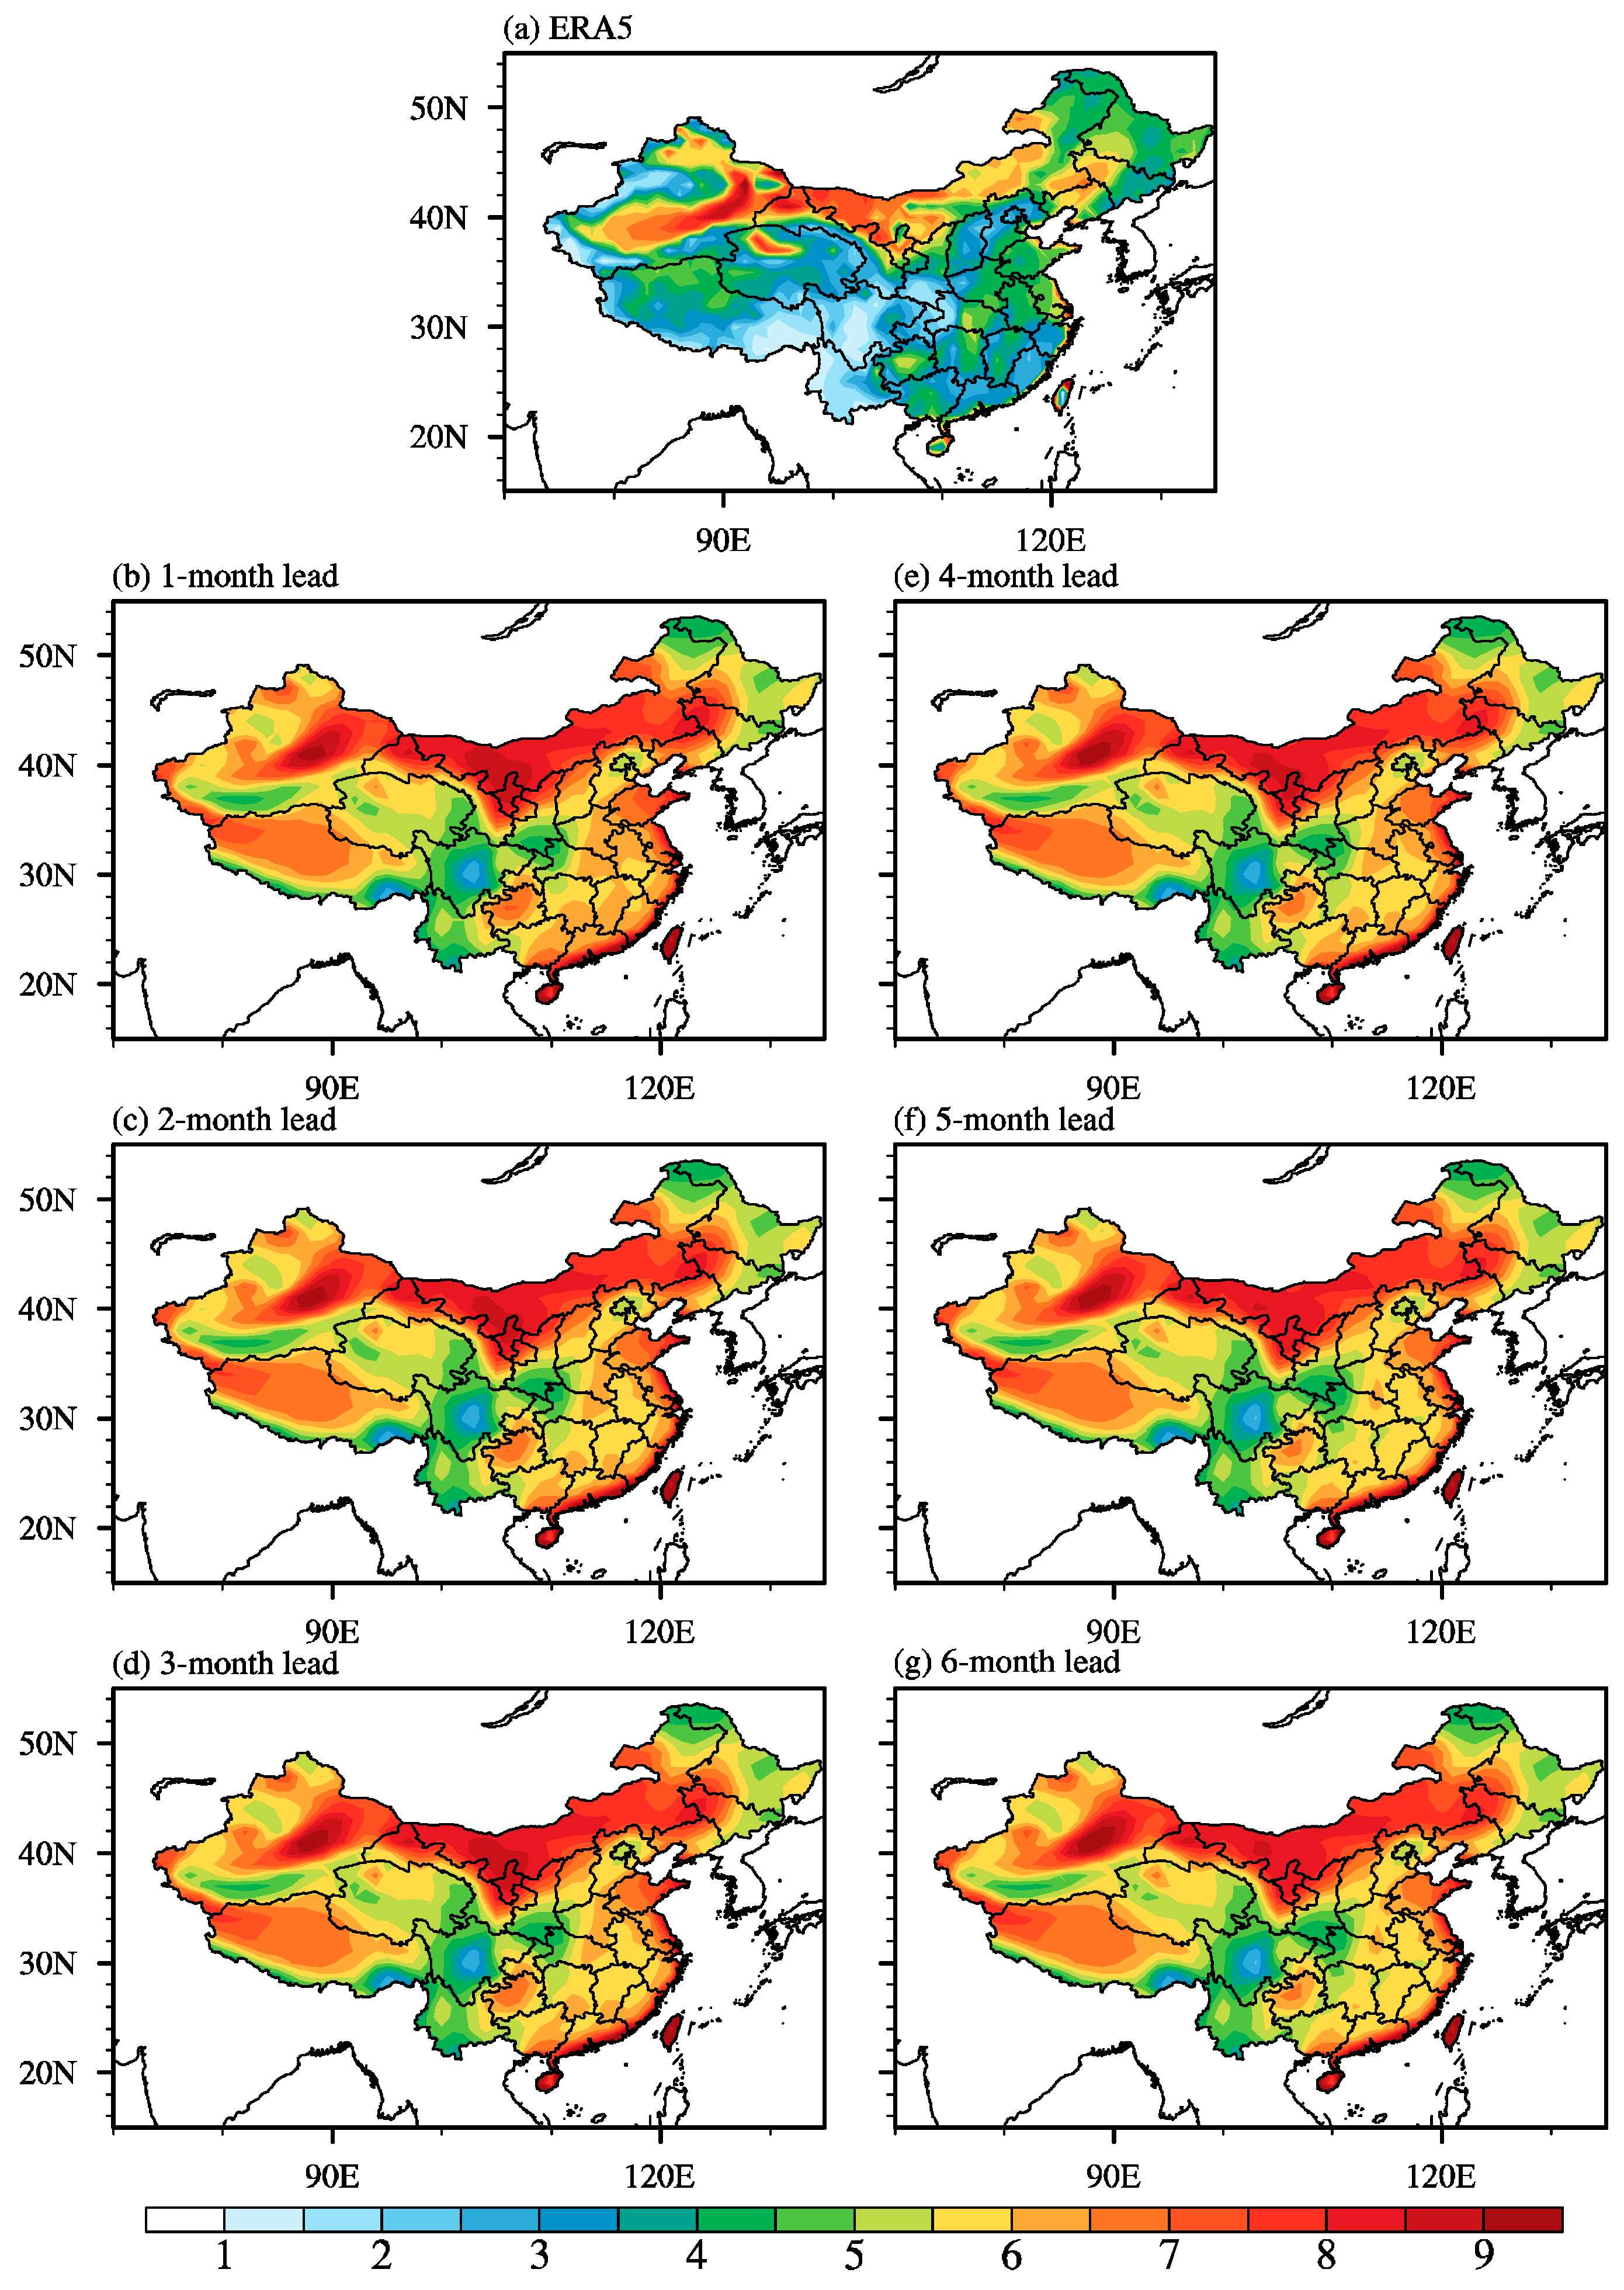
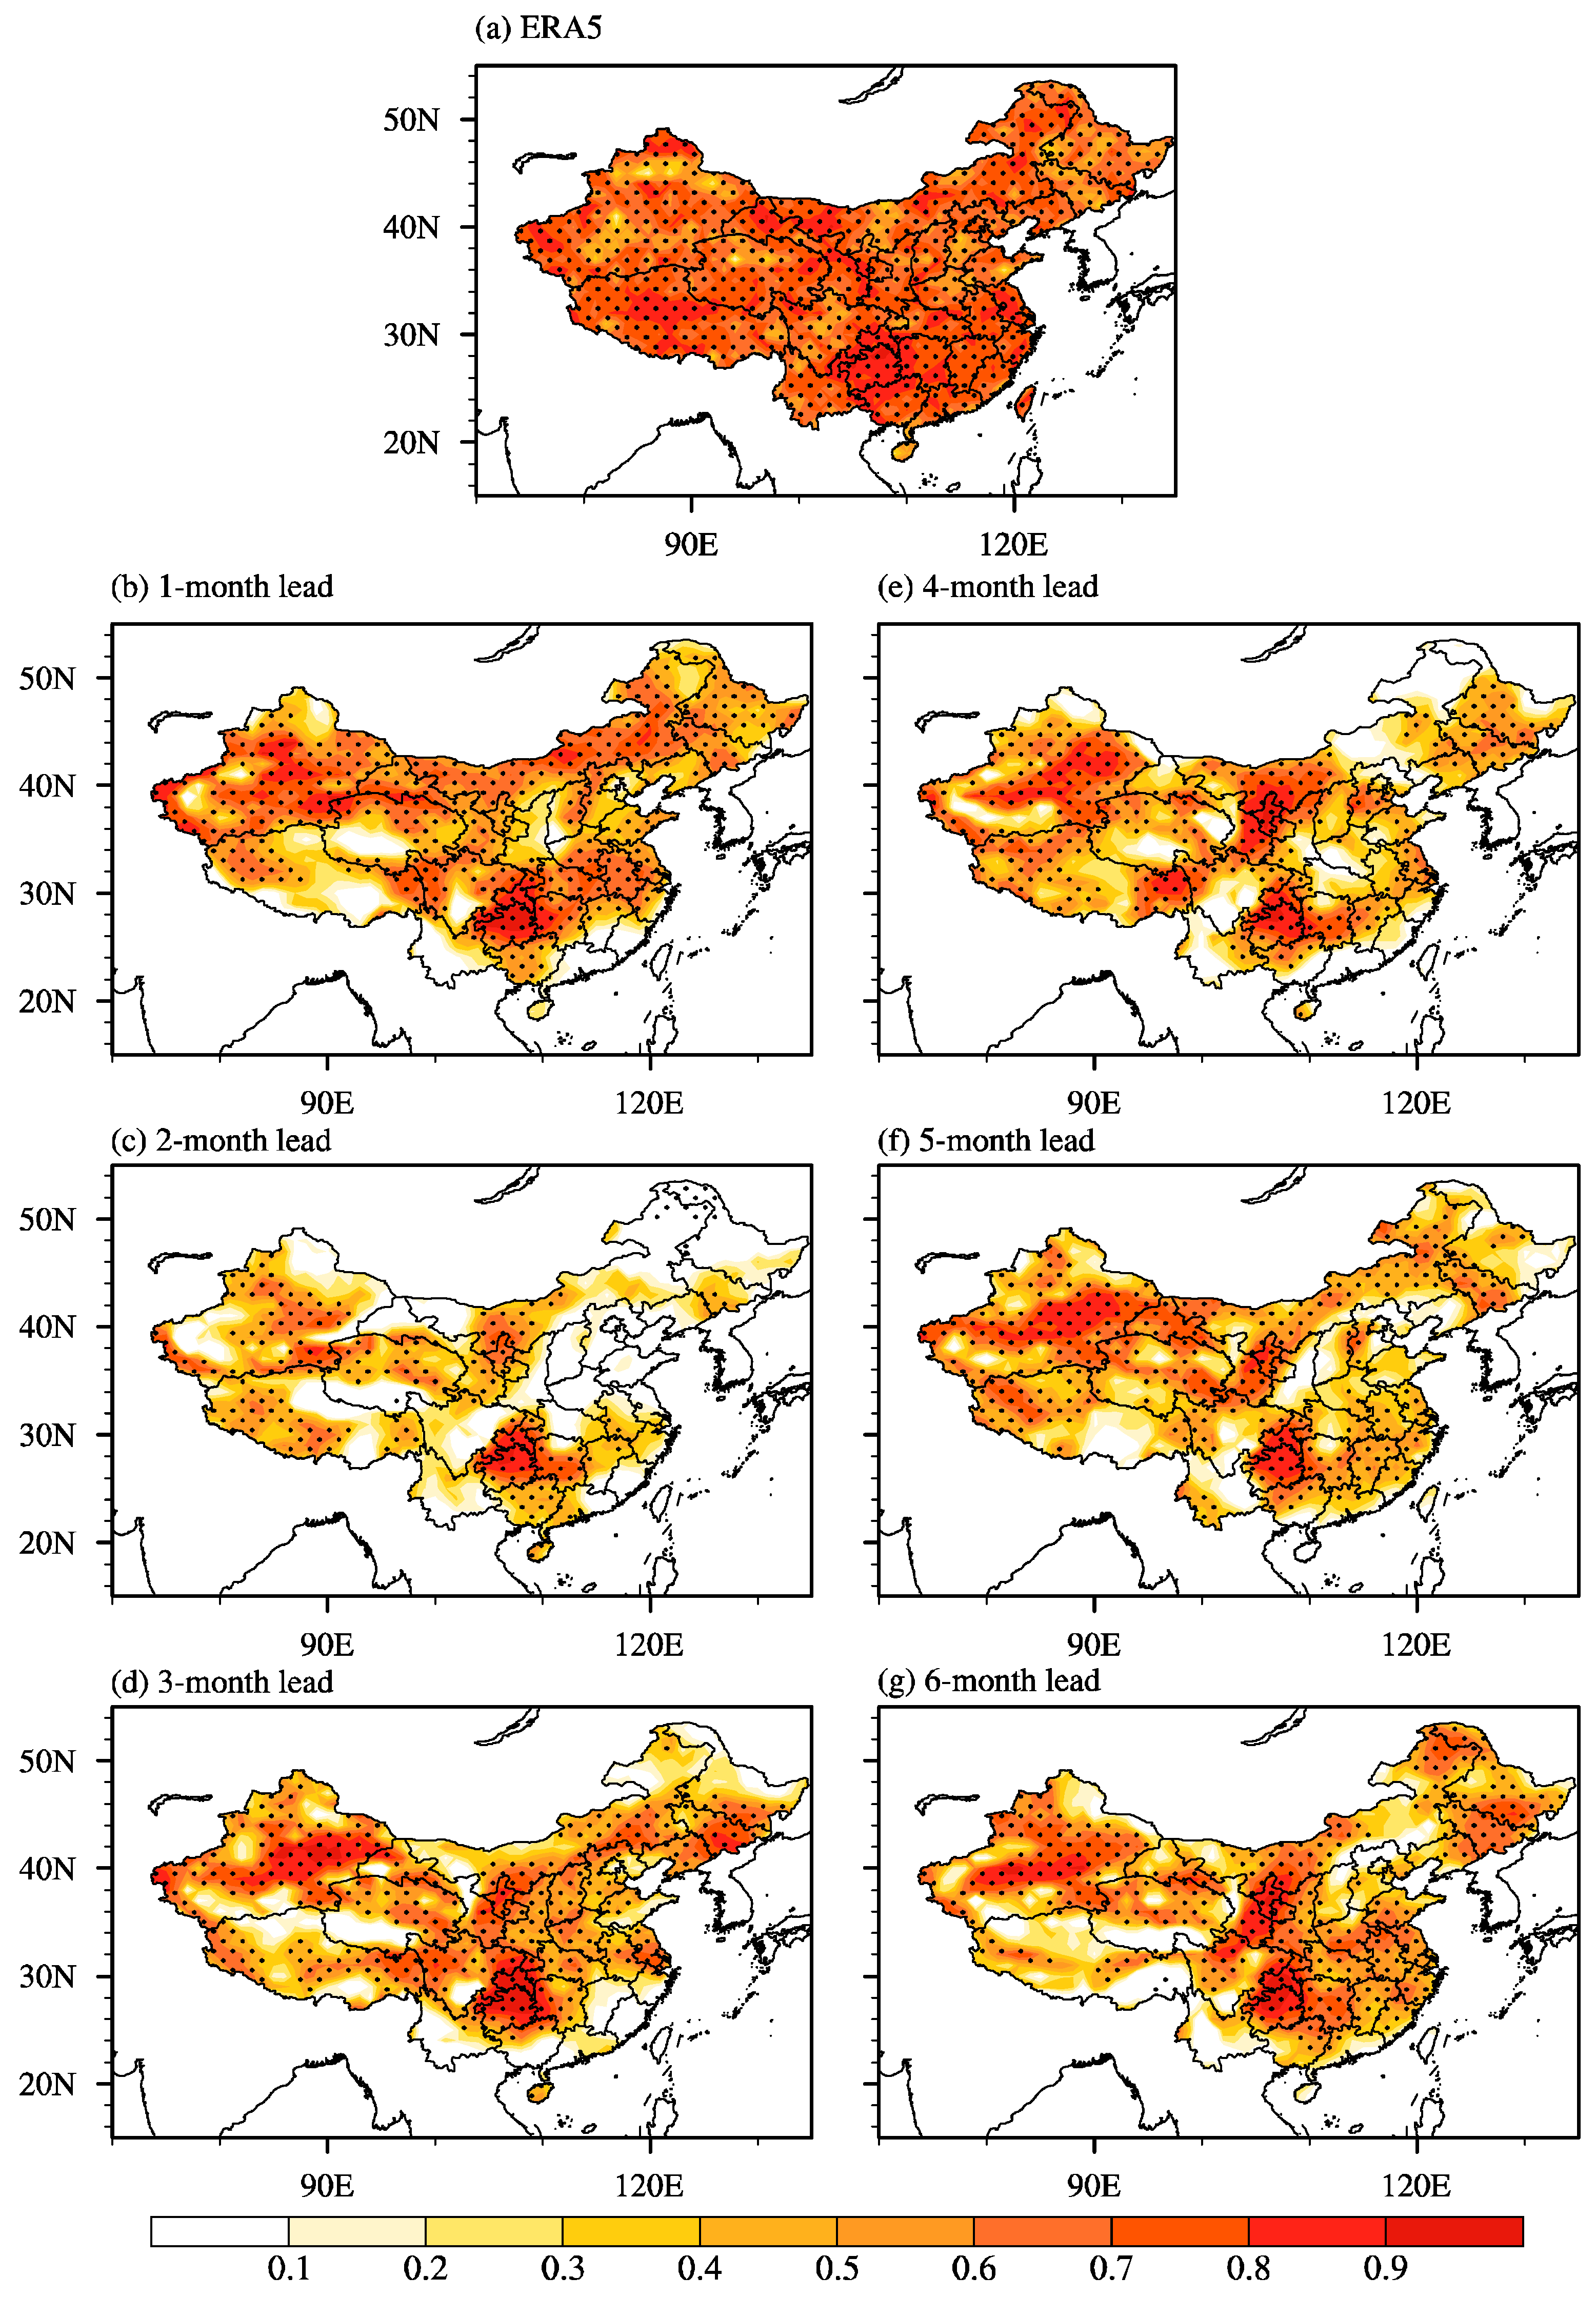
Figure 2 shows the spatial distribution of JJA-mean extreme ws10m thresholds over China for both ERA5 and EMM of the hindcasts during 2003–2022. The large values (ws10m greater than 7 m/s) of the extreme ws10m threshold in ERA5 mainly occur in northern China, such as Xinjiang and Inner Mongolia, which are typical arid and semi-arid areas. Extreme wind events in these areas often trigger corresponding sandstorms [36], influencing agriculture, ecosystems, economy, and human life. The extreme ws10m threshold can reach about 4–5 m/s over most regions of China, such as eastern China and the Tibetan Plateau, while the threshold only reaches about 2 m/s in the Yunnan–Guizhou Plateau and Sichuan Basin (Figure 2a). The extreme ws10m thresholds in the hindcasts of SISRI-ESS V1.0 from 1-month to 6-month lead time show a similar spatial distribution to that in ERA5, but the hindcasts generally overestimate the extreme ws10m threshold in most regions, except for southern Xinjiang and parts of northeast China. Notably, the extreme ws10m thresholds in coastal cities are higher than those in northeast China in the hindcasts, which is contrary to the results in ERA5 (Figure 2).
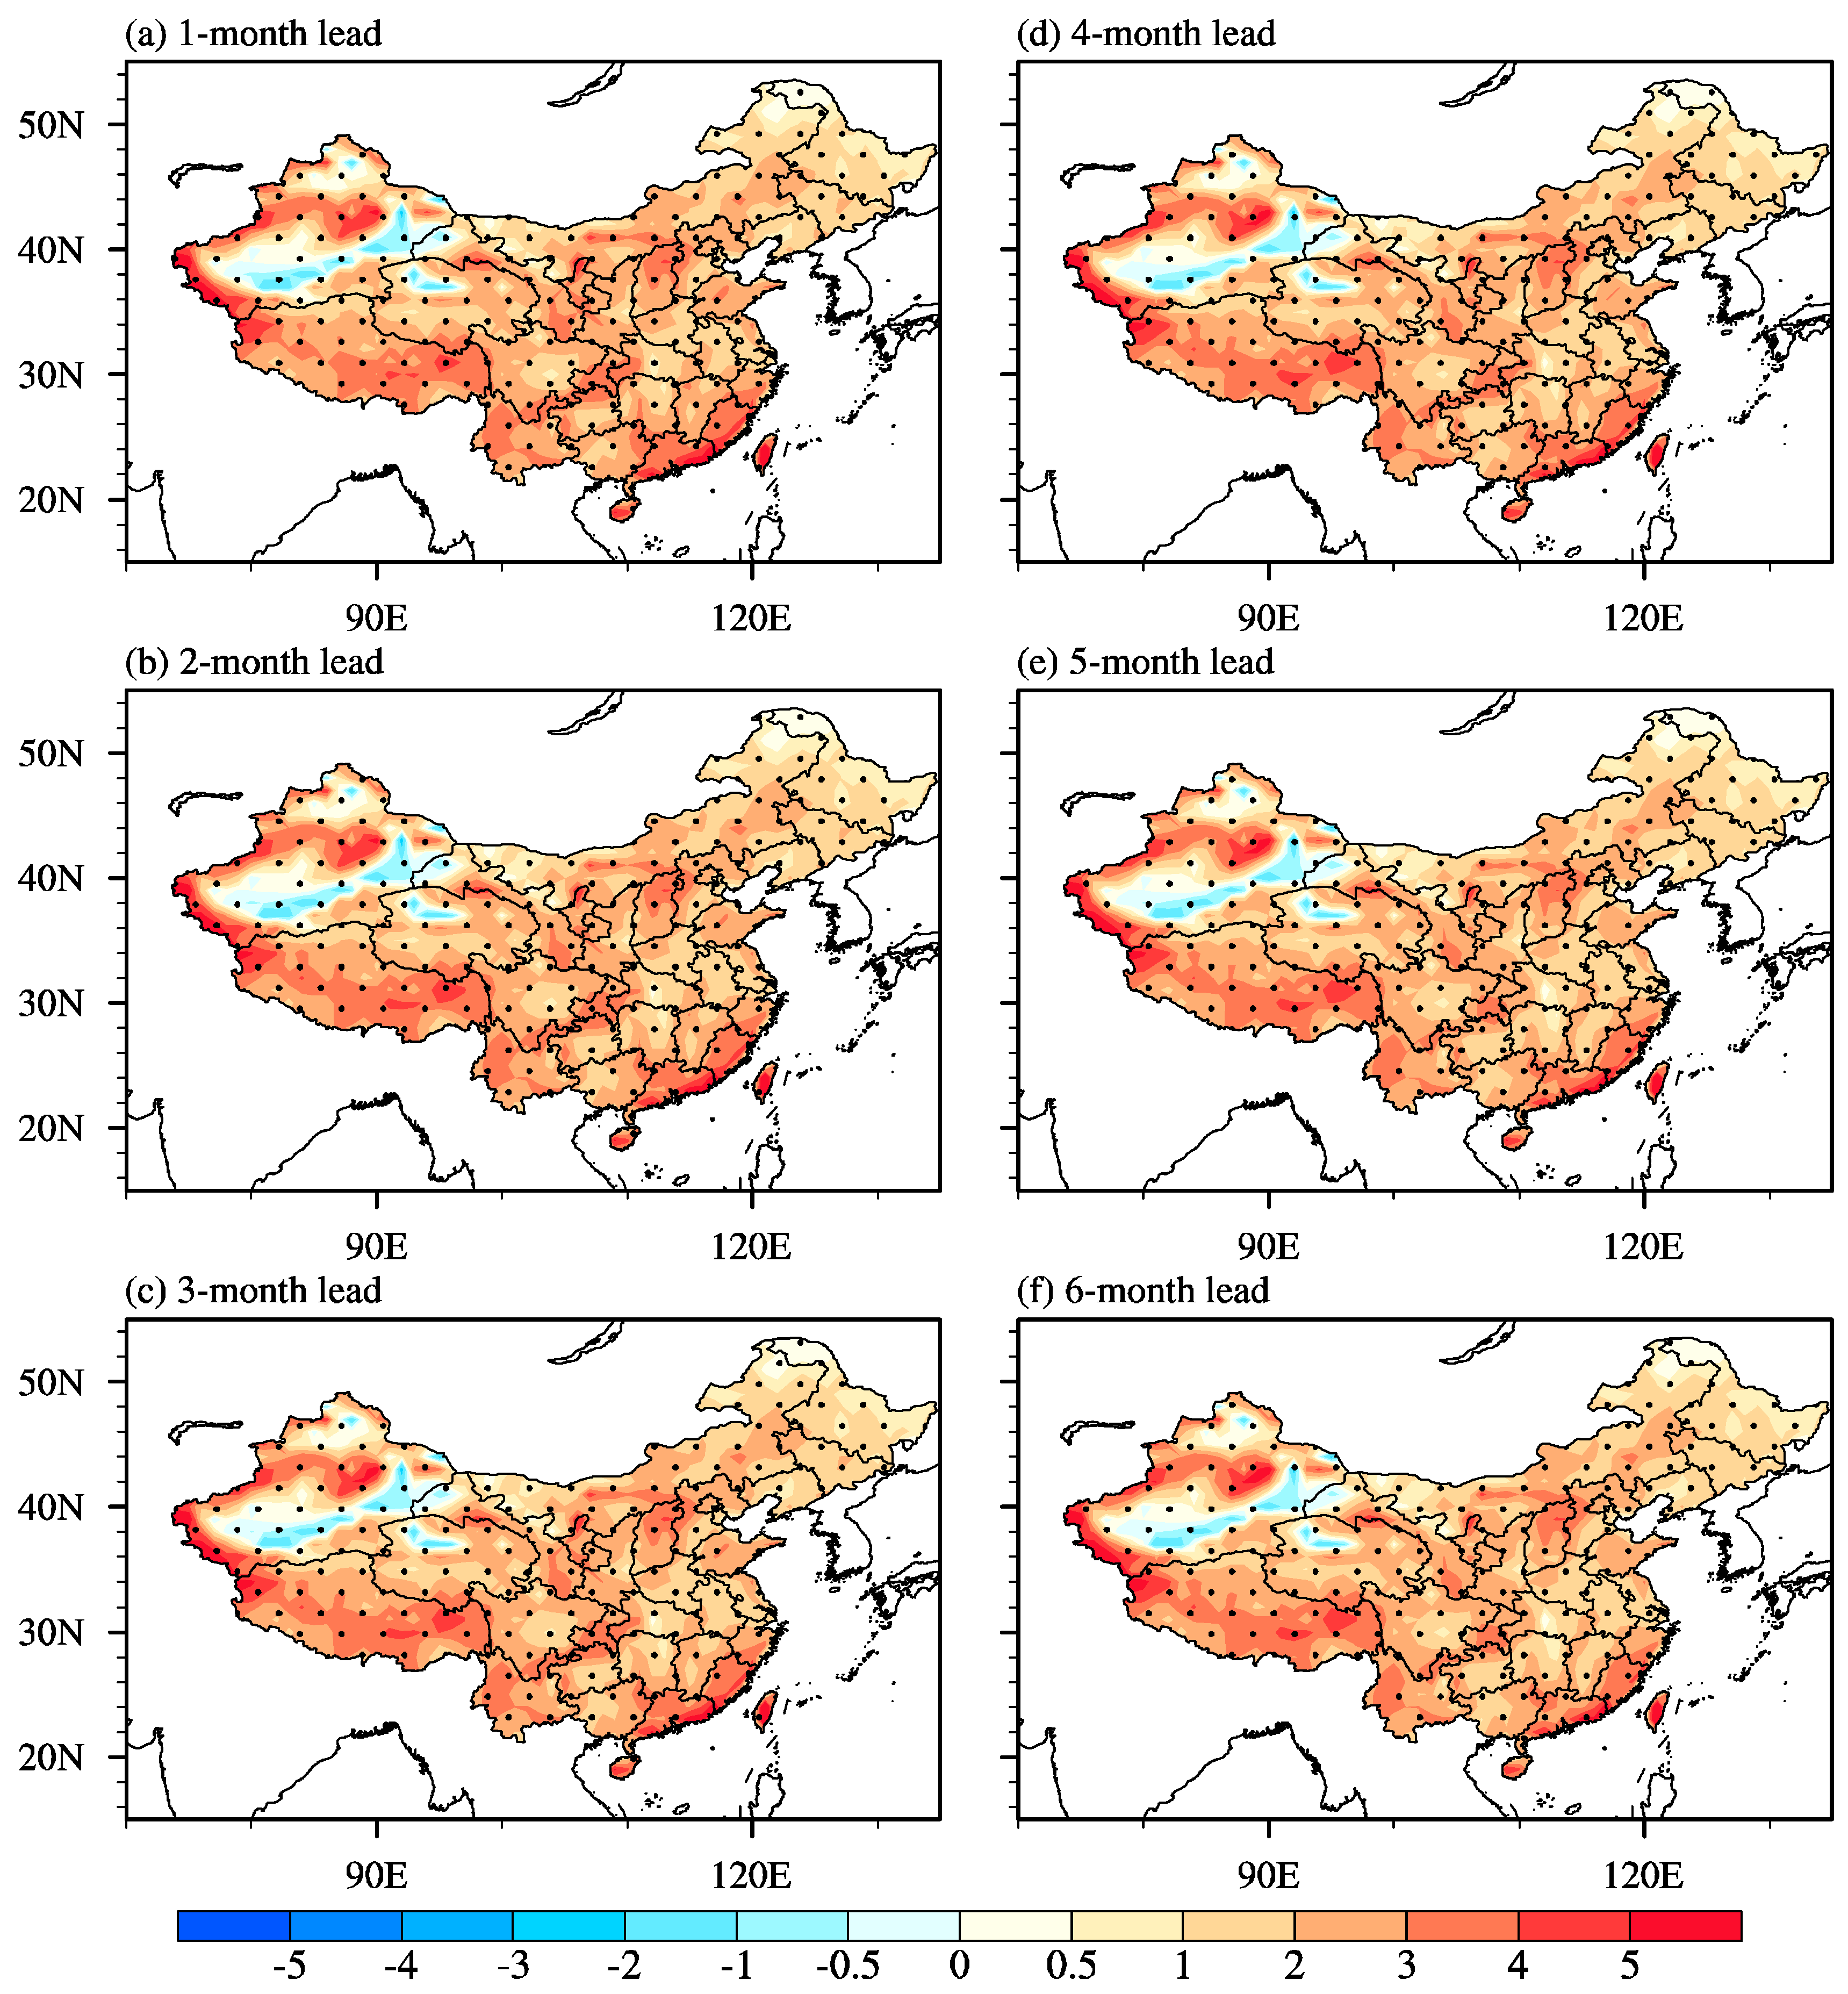
The biases between the hindcasts and ERA5 also show the same result. In addition to the weak negative biases in parts of northwest China, there are significant positive biases in most regions, indicating that SISRI-ESS V1.0 substantially overestimates the extreme ws10m threshold over China (Figure 3). This overestimation is particularly pronounced in southeast coastal China and the western border of China. Moreover, these results remain consistent across different lead times.

3.2. Skill in Predicting Extreme Wind Counts on Seasonal Timescale

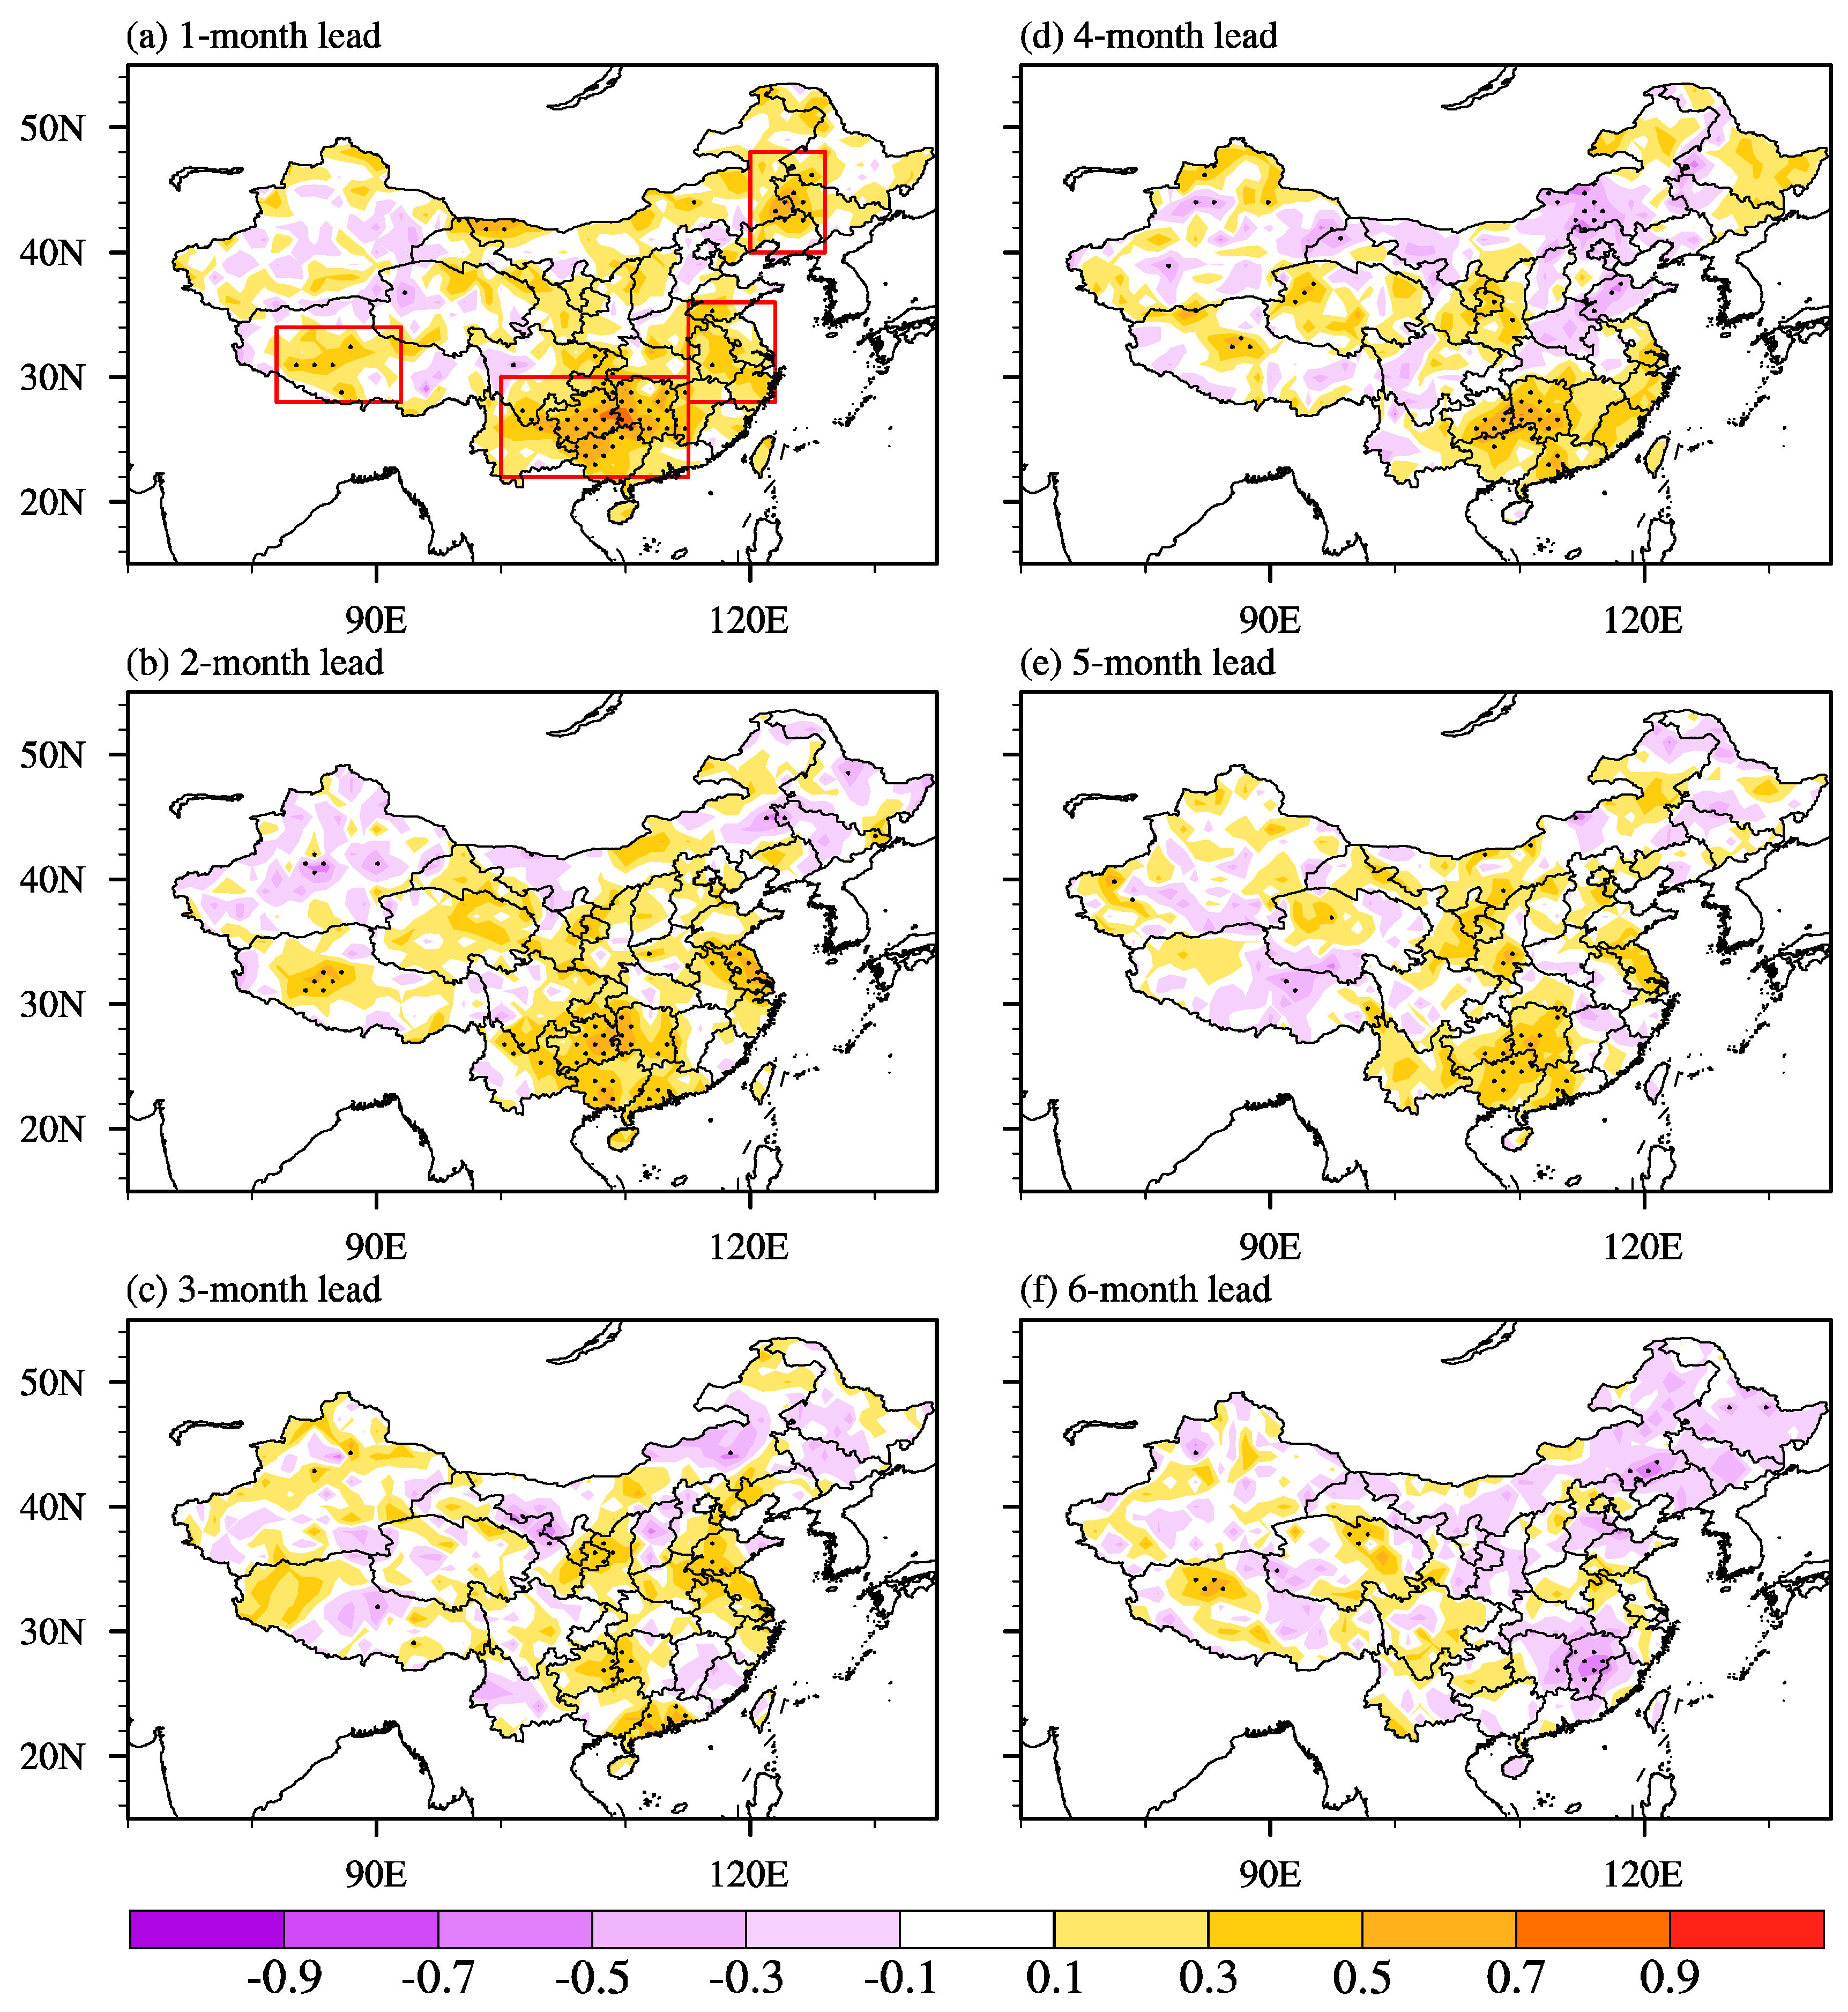
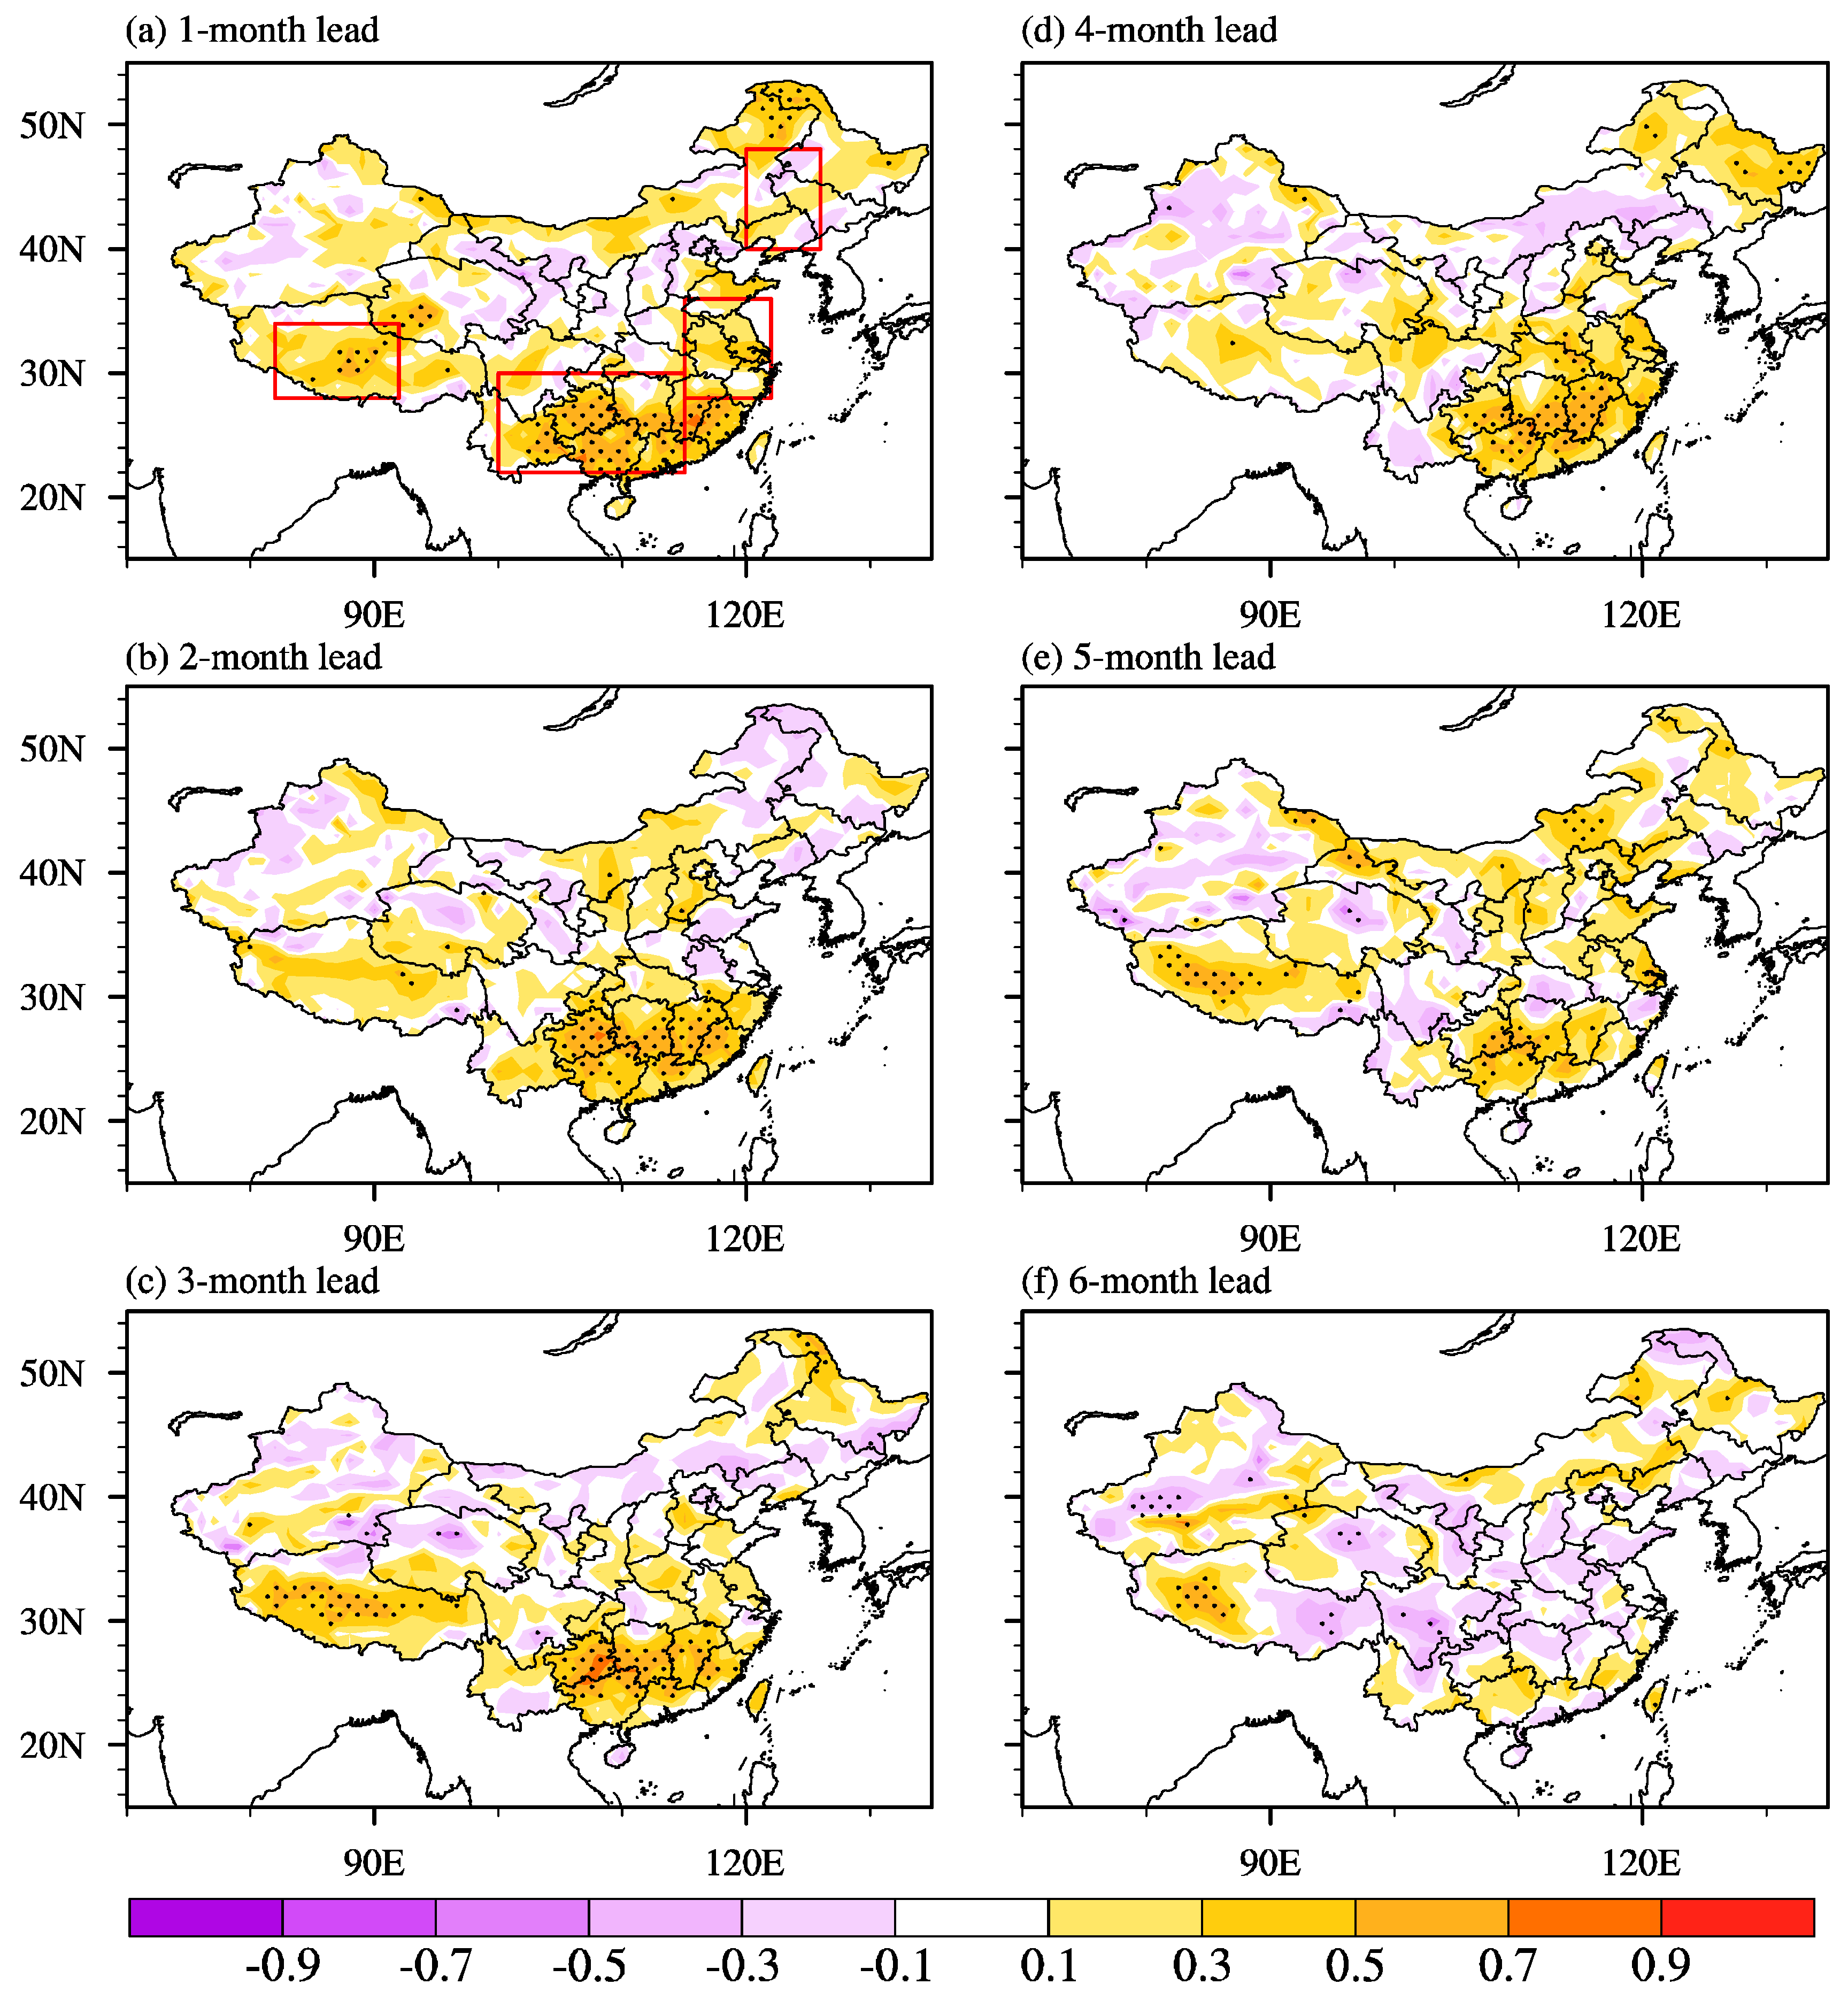
To evaluate the seasonal prediction skill for extreme wind counts over China in the hindcasts of SISRI-ESS V1.0, we first analyze the temporal correlation coefficient (TCC) of summer extreme wind counts between ERA5 and EMM of the hindcasts from 1-month to 6-month lead times. Figure 4 shows that high skill scores mainly appear in northeast China, central east China, southeast China, and the Tibetan Plateau (indicated by red boxes in Figure 4a), with the highest prediction skill observed in southeast China. As the lead time increases, the areas with significant TCC skill scores over China gradually shrink, and the TCC in most regions declines.
In northeast China, effective prediction skill for summer extreme wind counts is only present at a 1-month lead time (the maximum in TCC exceeds 0.5; Figure 4a), with negative correlation coefficients observed from 2-month to 6-month lead times. In central east China, TCC skill scores remain around 0.3–0.5 in the EMM of the hindcasts from 1-month to 3-month lead times. For the Tibetan Plateau, significant prediction skill is maintained only for a 2-month lead. In contrast, high skill scores in southeast China persist in the hindcasts from 1-month to 5-month lead times, with TCC values remaining above 0.5 and even reaching 0.7–0.9 at their maximum. Unfortunately, the current dynamic prediction system lacks prediction skill in some regions with high extreme wind speed thresholds, such as Xinjiang and Inner Mongolia.
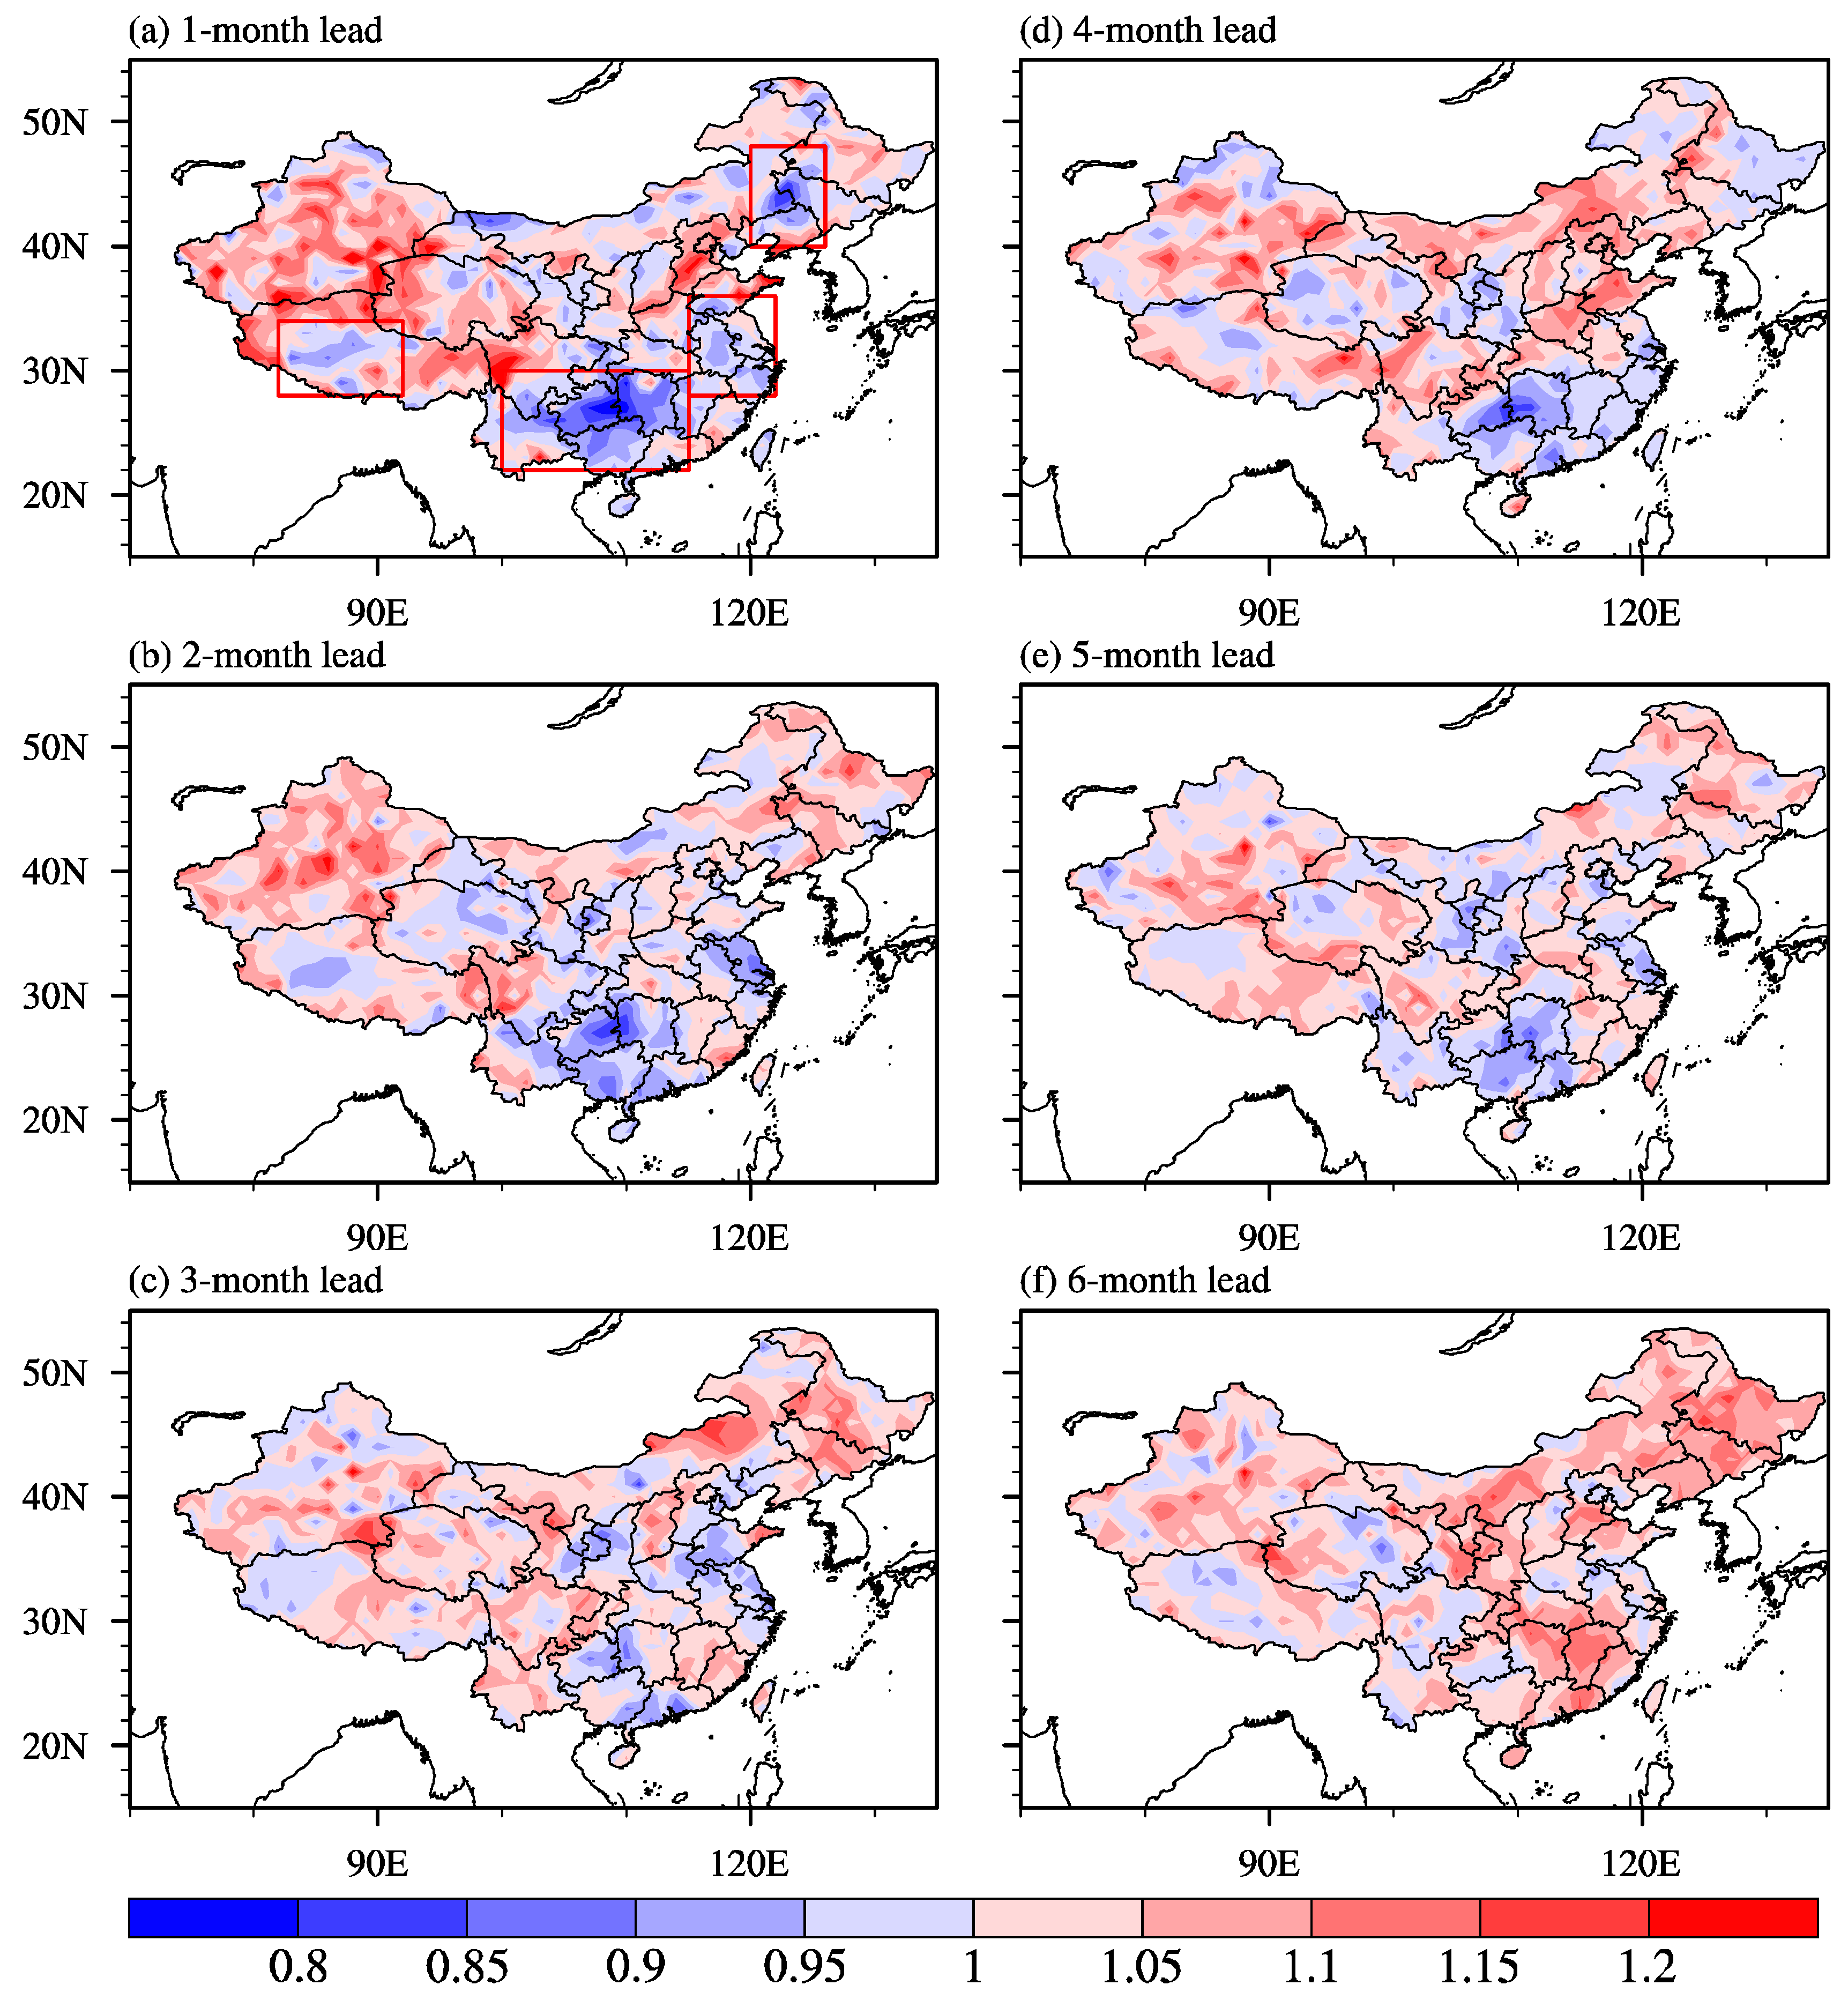
Meanwhile, the nRMSE in these four key regions is below 0.9, significantly lower than any other regions in the hindcasts at a 1-month lead time (Figure 5a). Then, the nRMSE gradually increases in northeast China, central east China, and the Tibetan Plateau from 2-month to 6-month lead times. Although the nRMSE in southeast China also shows a moderate increase from 2-month to 6-month lead times, a reversal occurs at a 4-month lead time and restores the skill as presented in 1-month and 2-month lead times. In contrast, the trends of nRMSE in western China show a slight decrease from 1-month to 6-month lead times, especially in Xinjiang (Figure 5).
Currently, most wind farms in China are concentrated in the northern, central eastern, and southeastern regions [48,49]. These areas have an increasing demand for electricity market transactions but a lack of reliable seasonal prediction ability to provide support. It is worth noting that SIDRI-ESS V1.0 shows high predictive skill for extreme winds in northeast, central east, and southeast China. These results can at least help wind farms and power generation companies in these areas to formulate production plans earlier and more effectively, optimize operational strategies, and thus improve power generation efficiency and benefits.
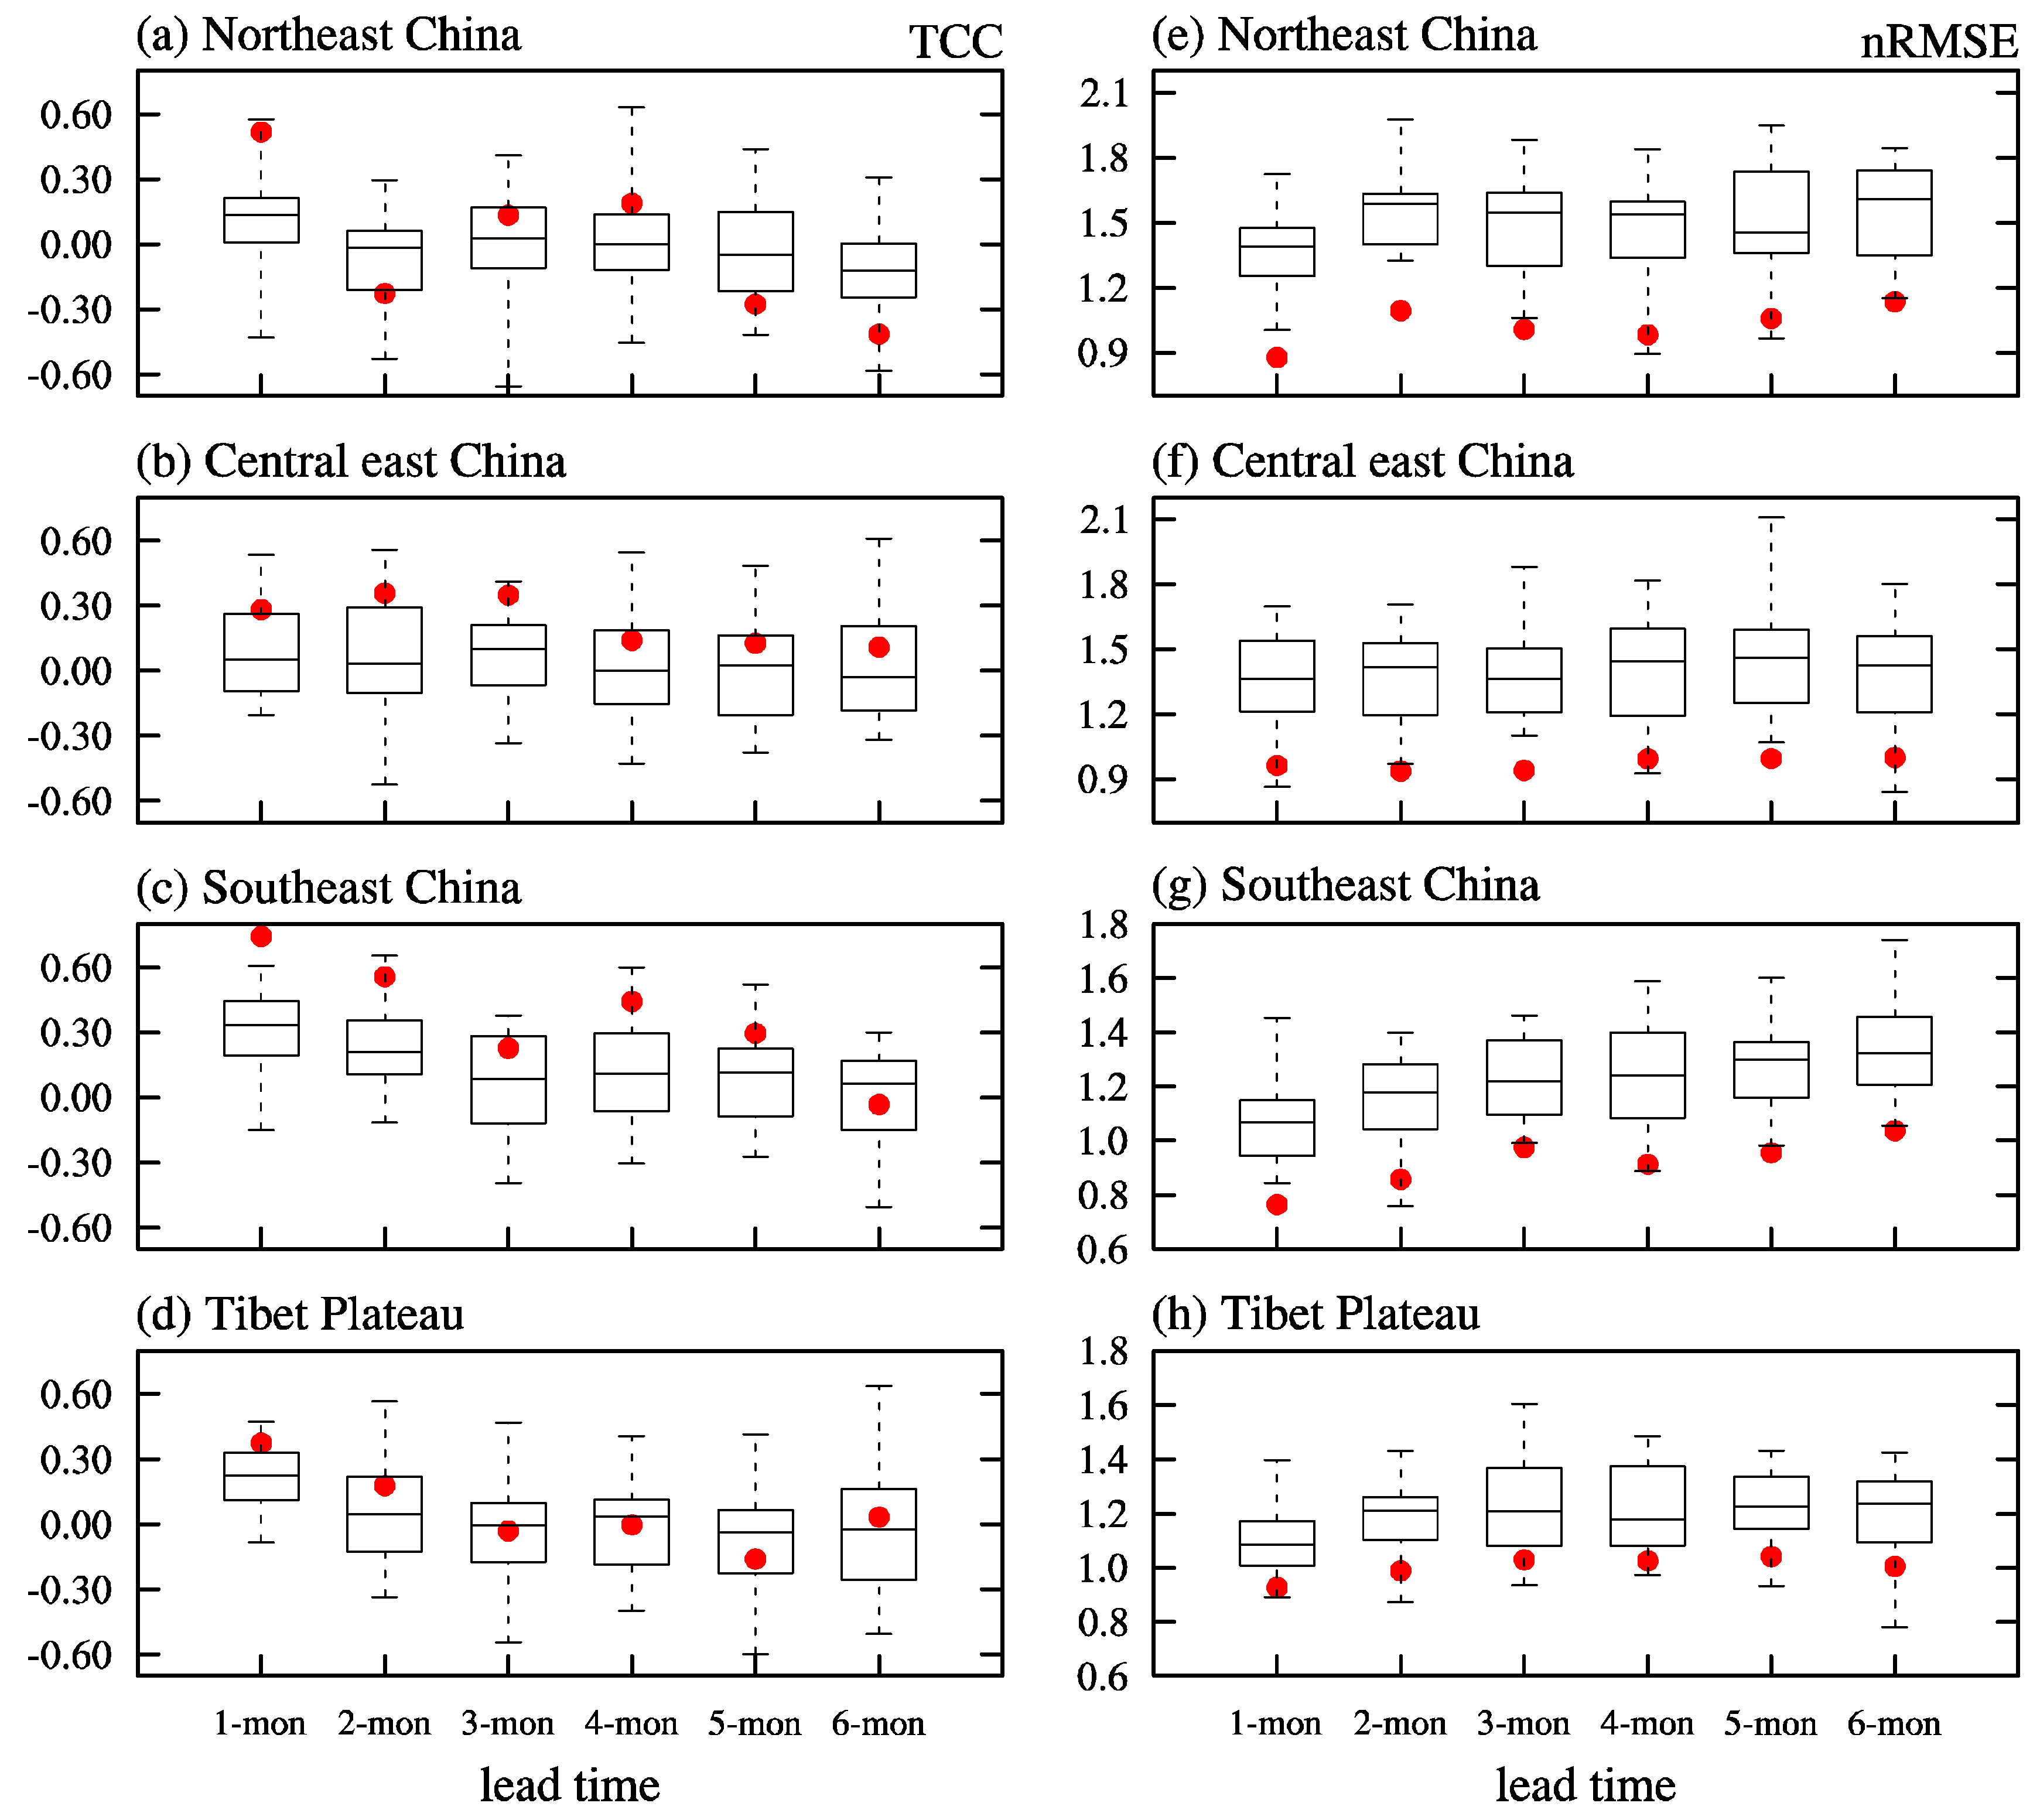
We also examined the result of area-averaged JJA extreme wind counts in these four key regions, showing the uncertainty among ensemble members (Figure 6). From a TCC perspective, northeast China has the largest member spread among the four key regions, with values ranging from −0.45 to 0.63 at a 4-month lead time. The difference between the maximum and minimum TCC values among ensemble members can reach about 1.1 (Figure 7a). However, the member spread of TCC in southeast China is relatively small among the four key regions and very stable across different lead times. The difference in TCC values remains about 0.7 (Figure 6c). Notably, the TCC of the EMM exceeds that of most individual members for most regions and lead times (Table 1), and is very close to or even exceeds the best result of an individual ensemble member, highlighting the advantage of ensemble prediction (Figure 6a–d). The role of ensemble prediction is more evident in the nRMSE skill score, where the results in the ensemble member are better than those of at least 20 individual members (Table 2), and are basically close to or less than the minimum of individual ensemble members in the four key regions (Figure 6e–h). This indicates that ensemble prediction significantly reduces the error of a single ensemble member.

3.3. Impact of Ensemble Size

The above section demonstrated that ensemble prediction improves the prediction skill of extreme wind counts on a seasonal timescale. Previous studies have also shown that the seasonal prediction skill for wind speed and extreme events (such as extreme temperatures and typhoons) increases with the number of ensemble members [30,31,50,51]. In this section, we discuss the impact of ensemble size on the predictive skill of extreme wind counts.
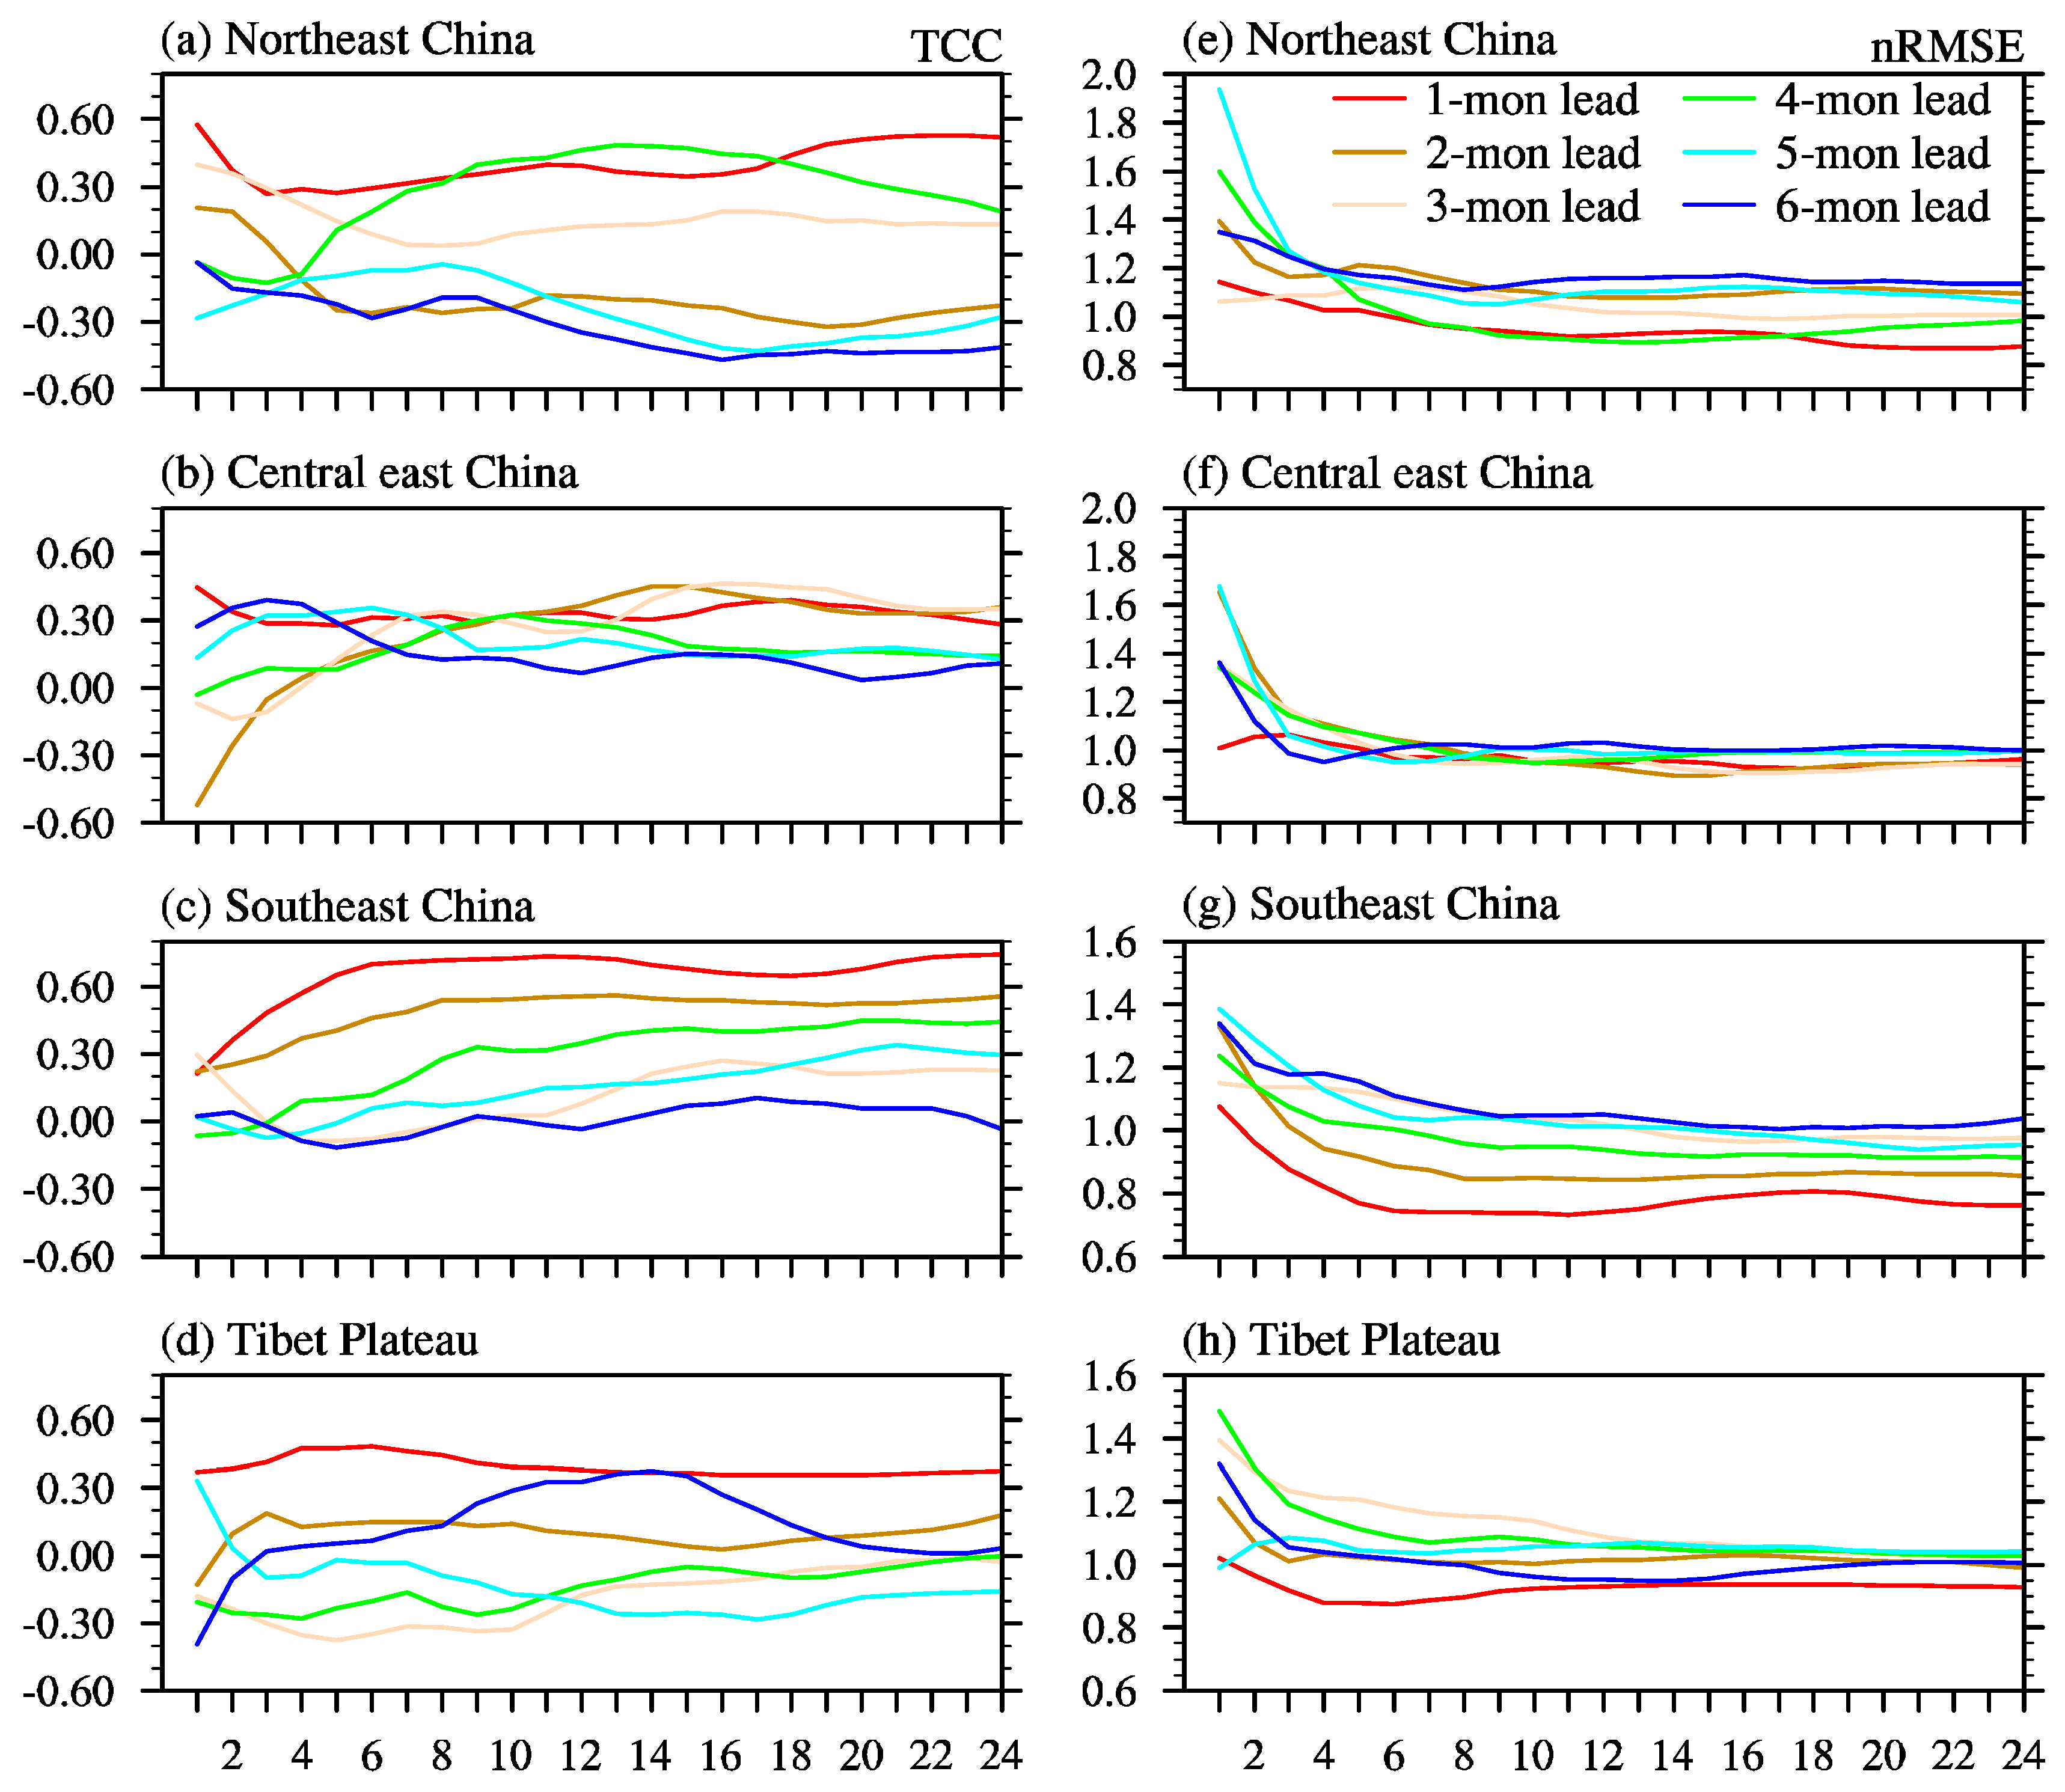
As shown in Figure 7, we plot the TCC and nRMSE skill scores against the number of ensemble members for four key regions, respectively. In northeast China, the significant TCC only exists at a 1-month lead time (Figure 4a and Figure 7a). Although the prediction skill decreased when ensemble members increased from one to three, the TCC skill score continued to rise as the ensemble size increased to 24 members, and it seems that even 24 members are not sufficient to achieve the highest prediction skill in this region. For the other three regions, the TCC skill scores improved when the member size increased from 1 to 24, and 24 ensemble members tended to saturate the skill for all lead times. However, there are exceptions, such as the TCC of southeast China at a 5-month lead time and the Tibetan Plateau at a 2-month lead time, which require a further increase in ensemble member size (Figure 7a–d). Regarding the nRMSE skill score, increasing the number of ensemble members rapidly decreases the nRMSE, and 12 to 16 members make the nRMSE reach stability (Figure 7e–h).

3.4. Possible Reasons for the Prediction Skill

The next question is what is responsible for the seasonal prediction skill for extreme wind counts over China. We attempt to answer this by elucidating the relationship between JJA-mean wind speed and extreme wind counts. In ERA5, the TCC between JJA-mean wind speed and extreme wind counts exceeds 0.7 in most regions of China, indicating that when the JJA-mean wind speed is high in a region, the region is likely to experience more extreme wind events (Figure 8a). The hindcasts also show a strong relationship over most regions from 1-month to 6-month lead times (Figure 8b–g), suggesting that the prediction skill for extreme wind counts is related to the prediction skill for seasonal mean wind speed.
This relationship is particularly robust from 1-month to 6-month lead times in southeast China, where high prediction skill for JJA-mean wind speed is also observed (Figure 9). Nevertheless, it is noted that this relationship in the hindcasts disappears over the southeastern coastal cities of China (Guangdong and Fujian provinces). This suggests that the prediction skill for extreme wind count is not significant, even though the prediction skill for wind speed is high (Figure 4 and Figure 9). The smaller-scale convective storms, typhoon landings, and storm surges may contribute to the occurrence of extreme winds in these regions during summertime.

4. Summary

In this study, the seasonal predictive skill of extreme wind over China is evaluated using the 20-year hindcast datasets of a dynamic seamless prediction system, SIDRI-ESS V1.0. The main conclusions are summarized as follows.
First, SISRI-ESS V1.0 simulates the spatial distribution of summer extreme wind speed thresholds over China well. The large threshold values are mainly concentrated in the north of China, such as Xinjiang and Inner Mongolia in both ERA5 and the hindcasts. We found that the hindcasts generally overestimate them over most regions of China, except for southern Xinjiang and parts of northeast China. This overestimation is particularly pronounced in southeast coastal China and the western border of China, with biases remaining consistent across different lead times.
Second, the skill evaluation of TCC and nRMSE revealed that high prediction skill mainly appears in northeast China, central east China, southeast China, and the Tibetan Plateau. Notably, southeast China shows the highest prediction skill, with TCC values remaining robust up to a 5-month lead time (the maximum TCC can exceed 0.5 then). And the prediction skill decreases with increasing lead time in most regions. However, significant skills are lost in areas like Xinjiang and Inner Mongolia, which have high extreme wind speed thresholds. We also indicate that ensemble prediction greatly improves the seasonal prediction skills for extremes, and reduces its uncertainty. The prediction skill in EMM of hindcasts exceeds that of most individual members for most regions and lead times, and is basically close to or better than the best results of individual ensemble members. Furthermore, the prediction skill for extreme wind counts is significantly enhanced as the ensemble size increases. In most regions, TCC skill scores increase with ensemble size, and 24 ensemble members tend to saturate the skill for nearly all lead times. Additionally, 12 to 16 members are sufficient for nRMSE to reach stability.
Third, the prediction skill of extreme wind counts is largely related to the skill of summer mean wind speed over most regions. Regions with high wind speeds are likely to experience more extreme wind events. This relationship is particularly strong in southeast China, where high prediction skills for both mean wind speed and extreme wind counts are observed. However, this relationship diminishes in the southeastern coastal cities (Guangdong and Fujian provinces), where smaller-scale convective storms, typhoons, and storm surges likely play a significant role in generating extreme winds.

5. Discussion

The seasonal variations in wind resources have a significant impact on wind power generation, which can directly affect the energy management and economic benefits of the wind power industry [29,52,53]. Previous studies have mainly focused on seasonal prediction for seasonal mean wind speed in specific regions [17,18,21,22,28,29,30,31]. However, extreme wind events occur frequently under global warming [34,54,55], posing growing challenges to the safety management and operational efficiency of wind farms. This study utilizes a seamless dynamic prediction system (SIDRI-ESS V1.0) to conduct seasonal prediction for summer extreme wind resource potential over China. The results indicate that the predictive skill is primarily concentrated in the northeast China, central east China, southeast China, and the Tibetan Plateau. The best performance is observed in southeast China, extending the effective lead time up to 5 months. Our analysis indicates that the seasonal prediction skill for extreme winds in these regions is likely closely related to the prediction skill for seasonal mean wind speeds. However, this relationship disappears in the southeastern coastal region, suggesting that the prediction skill for local convection or tropical cyclones may play an important role. Additionally, it is noteworthy that SIDRI-ESS V1.0 did not show reliable prediction skill in regions with high extreme wind speed thresholds. The physical mechanisms influencing extreme winds in these regions deserve further investigation due to the complex underlying surfaces (such as the intricate topography of plateaus and basins) and climate characteristics (mostly arid to semi-arid regions) in these regions, thus providing a basis for improving the predictive skill for extreme wind resources in the dynamic prediction system. Additionally, using deep learning algorithms could further enhance the prediction skill for these regions [56,57].

Author Contributions

Conceptualization, Z.Y., J.L. and W.Z.; Methodology, Z.Y. and J.L.; Formal analysis, Z.Y., Z.L. and Y.Z.; Writing—original draft, Z.Y., J.L. and W.Z.; Writing—review and editing, J.L., W.Z., Z.L., Y.Z. and S.L. All authors have read and agreed to the published version of the manuscript.

Funding

This study was funded by Guangdong Basic and Applied Basic Research Foundation [grant number 2023A1515240029] and the Southern Marine Science and Engineering Guangdong Laboratory [grant number 316323005].

Institutional Review Board Statement

Not applicable.

Informed Consent Statement

Not applicable.

Data Availability Statement

The data presented in this study are available on request from the corresponding author. The data are not publicly available due to privacy.

Conflicts of Interest

Zixiang Yan, Jinxiao Li, Zouxing Lin, Yuxin Zang and Siyuan Li are employees of Shanghai Investigation Design and Research Institute Co., Ltd. The paper reflects the views of the scientists and not the company. All authors declare no conflict of interest.

References

  1. GWEC. Global Wind Report 2020; Global Wind Energy Council: Lisbon, Portugal, 2021. [Google Scholar]
  2. GWEC. Global Wind Report 2021; Global Wind Energy Council: Lisbon, Portugal, 2022. [Google Scholar]
  3. GWEC. Global Wind Report 2022; Global Wind Energy Council: Lisbon, Portugal, 2023. [Google Scholar]
  4. Wiatros-Motyka, M.; Fulghum, N.; Jones, D. Global Electricity Review 2024; Ember: Westlake Village, CA, USA, 2024. [Google Scholar]
  5. WWEA. WWEA Annual Report 2023; World Wind Energy Association: Bonn, Germany, 2024. [Google Scholar]
  6. Barthelmie, R.J.; Pryor, S.C. Potential contribution of wind energy to climate change mitigation. Nat. Clim. Change 2014, 4, 684–688. [Google Scholar] [CrossRef]
  7. He, G.; Lin, J.; Sifuentes, F.; Liu, X.; Abhyankar, N.; Phadke, A. Rapid cost decrease of renewables and storage accelerates the decarbonization of China’s power system. Nat. Commun. 2020, 11, 2486. [Google Scholar] [CrossRef]
  8. Liu, L.; Wang, Y.; Wang, Z.; Li, S.; Li, J.; He, G.; Li, Y.; Liu, Y.; Piao, S.; Gao, Z.; et al. Potential contributions of wind and solar power to China’s carbon neutrality. Resour. Conserv. Recycl. 2022, 180, 106155. [Google Scholar] [CrossRef]
  9. Wang, Y.; Wang, R.; Tanaka, K.; Ciais, P.; Penuelas, J.; Balkanski, Y.; Sardans, J.; Hauglustaine, D.; Liu, W.; Xing, X.; et al. Accelerating the energy transition towards photovoltaic and wind in China. Nature 2023, 619, 761–767. [Google Scholar] [CrossRef] [PubMed]
  10. Negrete-Pincetic, M.; Gui, W.; Kowli, A.; Pulgar-Painemal, H. Emerging issues due to the integration of wind power in competitive electricity markets. In Proceedings of the 2010 Power and Energy Conference At Illinois (PECI), Urbana-Champaign, IL, USA, 12–13 February 2010; pp. 45–50. [Google Scholar]
  11. Rao, V.; Bedford, A.; Mokhtar, M.; Howe, J.M. Power Profiling and Inherent Lag Prediction of a Wind Power Generating System for Its Integration to an Energy Storage System. In Proceedings of the 2013 IEEE International Conference on Systems, Man, and Cybernetics, Manchester, UK, 13–16 October 2013; pp. 133–138. [Google Scholar]
  12. Yang, Y.; Wu, K.; Long, H.; Gao, J.; Yan, X.; Kato, T.; Suzuoki, Y. Integrated electricity and heating demand-side management for wind power integration in China. Energy 2014, 78, 235–246. [Google Scholar] [CrossRef]
  13. Ren, G.; Liu, J.; Wan, J.; Guo, Y.; Yu, D. Overview of wind power intermittency: Impacts, measurements, and mitigation solutions. Appl. Energy 2017, 204, 47–65. [Google Scholar] [CrossRef]
  14. Troccoli, A.; Boulahya, M.S.; Dutton, J.A.; Furlow, J.; Gurney, R.J.; Harrison, M. Weather and Climate Risk Management in the Energy Sector. Bull. Am. Meteorol. Soc. 2010, 91, 785–788. [Google Scholar] [CrossRef]
  15. Troccoli, A.; Audinet, P.; Bonelli, P.; Boulahya, M.S.; Buontempo, C.; Coppin, P.; Dubus, L.; Dutton, J.A.; Ebinger, J.; Griggs, D.; et al. Promoting New Links Between Energy and Meteorology. Bull. Am. Meteorol. Soc. 2013, 94, ES36–ES40. [Google Scholar] [CrossRef]
  16. Vladislavleva, E.; Friedrich, T.; Neumann, F.; Wagner, M. Predicting the energy output of wind farms based on weather data: Important variables and their correlation. Renew. Energy 2013, 50, 236–243. [Google Scholar] [CrossRef]
  17. Clark, R.T.; Bett, P.E.; Thornton, H.E.; Scaife, A.A. Skilful seasonal predictions for the European energy industry. Environ. Res. Lett. 2017, 12, 024002. [Google Scholar] [CrossRef]
  18. Torralba, V.; Doblas-Reyes, F.J.; MacLeod, D.; Christel, I.; Davis, M. Seasonal Climate Prediction: A New Source of Information for the Management of Wind Energy Resources. J. Appl. Meteorol. Climatol. 2017, 56, 1231–1247. [Google Scholar] [CrossRef]
  19. Wohland, J.; Reyers, M.; Märker, C.; Witthaut, D. Natural wind variability triggered drop in German redispatch volume and costs from 2015 to 2016. PLoS ONE 2018, 13, e0190707. [Google Scholar] [CrossRef] [PubMed]
  20. Hewitt, C.; Mason, S.; Walland, D. The Global Framework for Climate Services. Nat. Clim. Change 2012, 2, 831–832. [Google Scholar] [CrossRef]
  21. Orlov, A.; Sillmann, J.; Vigo, I. Better seasonal forecasts for the renewable energy industry. Nat. Energy 2020, 5, 108–110. [Google Scholar] [CrossRef]
  22. Bett, P.E.; Thornton, H.E.; Troccoli, A.; De Felice, M.; Suckling, E.; Dubus, L.; Saint-Drenan, Y.-M.; Brayshaw, D.J. A simplified seasonal forecasting strategy, applied to wind and solar power in Europe. Clim. Serv. 2022, 27, 100318. [Google Scholar] [CrossRef]
  23. Johnson, S.J.; Stockdale, T.N.; Ferranti, L.; Balmaseda, M.A.; Molteni, F.; Magnusson, L.; Tietsche, S.; Decremer, D.; Weisheimer, A.; Balsamo, G.; et al. SEAS5: The new ECMWF seasonal forecast system. Geosci. Model Dev. 2019, 12, 1087–1117. [Google Scholar] [CrossRef]
  24. MacLachlan, C.; Arribas, A.; Peterson, K.A.; Maidens, A.; Fereday, D.; Scaife, A.A.; Gordon, M.; Vellinga, M.; Williams, A.; Comer, R.E.; et al. Global Seasonal forecast system version 5 (GloSea5): A high-resolution seasonal forecast system. Q. J. R. Meteorol. Soc. 2015, 141, 1072–1084. [Google Scholar] [CrossRef]
  25. Williams, K.D.; Harris, C.M.; Bodas-Salcedo, A.; Camp, J.; Comer, R.E.; Copsey, D.; Fereday, D.; Graham, T.; Hill, R.; Hinton, T.; et al. The Met Office Global Coupled model 2.0 (GC2) configuration. Geosci. Model Dev. 2015, 8, 1509–1524. [Google Scholar] [CrossRef]
  26. Williams, K.D.; Copsey, D.; Blockley, E.W.; Bodas-Salcedo, A.; Calvert, D.; Comer, R.; Davis, P.; Graham, T.; Hewitt, H.T.; Hill, R.; et al. The Met Office Global Coupled Model 3.0 and 3.1 (GC3.0 and GC3.1) Configurations. J. Adv. Model. Earth Syst. 2018, 10, 357–380. [Google Scholar] [CrossRef]
  27. Batté, L.; Ardilouze, C.; Déqué, M. Forecasting West African Heat Waves at Subseasonal and Seasonal Time Scales. Mon. Weather Rev. 2018, 146, 889–907. [Google Scholar] [CrossRef]
  28. Bett, P.E.; Thornton, H.E.; Lockwood, J.F.; Scaife, A.A.; Golding, N.; Hewitt, C.; Zhu, R.; Zhang, P.; Li, C. Skill and Reliability of Seasonal Forecasts for the Chinese Energy Sector. J. Appl. Meteorol. Climatol. 2017, 56, 3099–3114. [Google Scholar] [CrossRef]
  29. Bett, P.E.; Thornton, H.E.; Felice, M.D.; Suckling, E.B.; Dubus, L.; Troccoli, A.; Goodess, C. Assessment of Seasonal Forecasting Skill for Energy Variables. ECEM Deliverable D3.4.1; Met Office Technical Report; Met Office: Exeter, UK, 2018.
  30. Lockwood, J.F.; Thornton, H.E.; Dunstone, N.; Scaife, A.A.; Bett, P.E.; Li, C.; Ren, H.-L. Skilful seasonal prediction of winter wind speeds in China. Clim. Dyn. 2019, 53, 3937–3955. [Google Scholar] [CrossRef]
  31. Lockwood, J.F.; Stringer, N.; Hodge, K.R.; Bett, P.E.; Knight, J.; Smith, D.; Scaife, A.A.; Patterson, M.; Dunstone, N.; Thornton, H.E. Seasonal prediction of UK mean and extreme winds. Q. J. R. Meteorol. Soc. 2023, 149, 3477–3489. [Google Scholar] [CrossRef]
  32. Lee, D.Y.; Doblas-Reyes, F.J.; Torralba, V.; Gonzalez-Reviriego, N. Multi-model seasonal forecasts for the wind energy sector. Clim. Dyn. 2019, 53, 2715–2729. [Google Scholar] [CrossRef]
  33. Vallis, M.B.; Loredo-Souza, A.M.; Ferreira, V.; Nascimento, E.d.L. Classification and identification of synoptic and non-synoptic extreme wind events from surface observations in South America. J. Wind. Eng. Ind. Aerodyn. 2019, 193, 103963. [Google Scholar] [CrossRef]
  34. Outten, S.; Sobolowski, S. Extreme wind projections over Europe from the Euro-CORDEX regional climate models. Weather Clim. Extrem. 2021, 33, 100363. [Google Scholar] [CrossRef]
  35. Owen, L.E.; Catto, J.L.; Dunstone, N.J.; Stephenson, D.B. How well can a seasonal forecast system represent three hourly compound wind and precipitation extremes over Europe? Environ. Res. Lett. 2021, 16, 074019. [Google Scholar] [CrossRef]
  36. Jiang, Y.; Miao, Y.; Zhao, Y.; Liu, J.; Gao, Y. Extreme-wind events in China in the past 50 years and their impacts on sandstorm variations. Front. Earth Sci. 2023, 10, 1058275. [Google Scholar] [CrossRef]
  37. Corti, S.; Molteni, F.; Palmer, T.N. Signature of recent climate change in frequencies of natural atmospheric circulation regimes. Nature 1999, 398, 799–802. [Google Scholar] [CrossRef]
  38. Brönnimann, S.; Martius, O.; Waldow, H.E.v.; Welker, C.; Luterbacher, J.; Compo, G.P.; Sardeshmukh, P.D.; Usbeck, T. Extreme winds at northern mid-latitudes since 1871. Meteorol. Z. 2012, 21, 13–27. [Google Scholar] [CrossRef]
  39. Yu, L.; Zhong, S.; Bian, X.; Heilman, W.E. Climatology and trend of wind power resources in China and its surrounding regions: A revisit using Climate Forecast System Reanalysis data. Int. J. Climatol. 2016, 36, 2173–2188. [Google Scholar] [CrossRef]
  40. Kumar, A.; Hoerling, M.P. Prospects and Limitations of Seasonal Atmospheric GCM Predictions. Bull. Am. Meteorol. Soc. 1995, 76, 335–345. [Google Scholar] [CrossRef]
  41. Wang, B.; Fan, Z. Choice of South Asian Summer Monsoon Indices. Bull. Am. Meteorol. Soc. 1999, 80, 629–638. [Google Scholar] [CrossRef]
  42. Becker, E.J.; van den Dool, H.; Peña, M. Short-Term Climate Extremes: Prediction Skill and Predictability. J. Clim. 2013, 26, 512–531. [Google Scholar] [CrossRef]
  43. Doblas-Reyes, F.J.; García-Serrano, J.; Lienert, F.; Biescas, A.P.; Rodrigues, L.R.L. Seasonal climate predictability and forecasting: Status and prospects. WIREs Clim. Change 2013, 4, 245–268. [Google Scholar] [CrossRef]
  44. Hersbach, H.; Bell, B.; Berrisford, P.; Hirahara, S.; Horányi, A.; Muñoz-Sabater, J.; Nicolas, J.; Peubey, C.; Radu, R.; Schepers, D.; et al. The ERA5 global reanalysis. Q. J. R. Meteorol. Soc. 2020, 146, 1999–2049. [Google Scholar] [CrossRef]
  45. de Brito Neto, F.A.; Mendes, D.; Spyrides, M.H.C. Analysis of extreme wind events in the Weddell Sea region (Antarctica) at Belgrano II Station. J. S. Am. Earth Sci. 2022, 116, 103804. [Google Scholar] [CrossRef]
  46. Messmer, M.; Simmonds, I. Global analysis of cyclone-induced compound precipitation and wind extreme events. Weather Clim. Extrem. 2021, 32, 100324. [Google Scholar] [CrossRef]
  47. Zhang, Y.; Sun, X.; Chen, C. Characteristics of concurrent precipitation and wind speed extremes in China. Weather Clim. Extrem. 2021, 32, 100322. [Google Scholar] [CrossRef]
  48. Sun, H.; Luo, Y.; Zhao, Z.; Chang, R. The Impacts of Chinese Wind Farms on Climate. J. Geophys. Res. Atmos. 2018, 123, 5177–5187. [Google Scholar] [CrossRef]
  49. Sherman, P.; Chen, X.; McElroy, M.B. Wind-generated Electricity in China: Decreasing Potential, Inter-annual Variability and Association with Changing Climate. Sci. Rep. 2017, 7, 16294. [Google Scholar] [CrossRef]
  50. Hamilton, E.; Eade, R.; Graham, R.J.; Scaife, A.A.; Smith, D.M.; Maidens, A.; MacLachlan, C. Forecasting the number of extreme daily events on seasonal timescales. J. Geophys. Res. Atmos. 2012, 117, D03114. [Google Scholar] [CrossRef]
  51. Li, J.; Bao, Q.; Liu, Y.; Wu, G.; Wang, L.; He, B.; Wang, X.; Yang, J.; Wu, X.; Shen, Z. Dynamical Seasonal Prediction of Tropical Cyclone Activity Using the FGOALS-f2 Ensemble Prediction System. Weather Forecast 2021, 36, 1759–1778. [Google Scholar] [CrossRef]
  52. Brayshaw, D.J.; Troccoli, A.; Fordham, R.; Methven, J. The impact of large scale atmospheric circulation patterns on wind power generation and its potential predictability: A case study over the UK. Renew. Energy 2011, 36, 2087–2096. [Google Scholar] [CrossRef]
  53. Hamlington, B.D.; Hamlington, P.E.; Collins, S.G.; Alexander, S.R.; Kim, K.-Y. Effects of climate oscillations on wind resource variability in the United States. Geophys. Res. Lett. 2015, 42, 145–152. [Google Scholar] [CrossRef]
  54. Gentile, E.S.; Zhao, M.; Hodges, K. Poleward intensification of midlatitude extreme winds under warmer climate. Npj Clim. Atmos. Sci. 2023, 6, 219. [Google Scholar] [CrossRef]
  55. Liu, H.; Li, D.; Chen, Q.; Feng, J.; Qi, J.; Yin, B. The multiscale variability of global extreme wind and wave events and their relationships with climate modes. Ocean Eng. 2024, 307, 118239. [Google Scholar] [CrossRef]
  56. Tong, X.; Li, J.; Zhang, F.; Li, W.; Pan, B.; Li, J.; Letu, H. The Deep-Learning-Based Fast Efficient Nighttime Retrieval of Thermodynamic Phase from Himawari-8 AHI Measurements. Geophys. Res. Lett. 2023, 50, e2022GL100901. [Google Scholar] [CrossRef]
  57. Tong, X.; Zhou, W.; Xia, J. Improving Boreal Summer Precipitation Predictions from the Global NMME through Res34-Unet. Geophys. Res. Lett. 2024, 51, e2023GL106391. [Google Scholar] [CrossRef]
Figure 1. Design of SIDRI-ESS V1.0 and introduction of the hindcast. SIDRI-ESS V1.0 was generated based on a coupled global climate model (CGCM). Six-hourly atmospheric FNL reanalysis data were used to generate the atmospheric initial conditions for SIDRI-ESS V1.0 by using incremental analysis updating (IAU). A 20-year (2003–2022) hindcast with 24 ensemble members is conducted based on SIDRI-ESS V1.0. The output data of the hindcast have a horizontal resolution of 1° × 1° with a 6-hourly time resolution.
Atmosphere 15 01024 g001
Figure 2. Spatial distribution of JJA-mean extreme 10m wind speed (ws10m, unit: m/s) threshold over China during 2003–2022. (a) ws10m threshold in ERA5. (bg) are the results of the 24 ensemble member mean (EMM) of hindcasts at a 1-month lead to 6-month lead, respectively.
Atmosphere 15 01024 g002
Figure 3. Spatial distribution of biases in JJA-mean extreme ws10m threshold over China between EMM of hindcasts and ERA5 at different lead times during 2003–2022. (a) Results in 1-month lead. (bf) as in (a), but for 2-month to 6-month lead, respectively. Values reaching 90% confidence level are dotted in black.
Atmosphere 15 01024 g003
Figure 4. Temporal correlation coefficient (TCC) of JJA extreme wind counts between EMM of hindcasts and ERA5 at different lead times during 2003–2022. (a) Results in 1-month lead. (bf) as in (a), but for 2-month to 6-month lead, respectively. Values reaching 90% confidence level in two-tailed t-test are dotted in black. Red boxes in (a) are four key regions: northeast China (40° N–48° N, 120° E–126° E), central east China (28° N–36° N, 115° E–122° E), southeast China (22° N–30° N, 100° E–115° E) and Tibetan Plateau (28° N–34° N, 82° E–92° E).
Atmosphere 15 01024 g004
Figure 5. As in Figure 4, but for normalized root mean square error (nRMSE). (a) Results in 1-month lead. (bf) as in (a), but for 2-month to 6-month lead, respectively. Values reaching 90% confidence level in two-tailed t-test are dotted in black. Red boxes in (a) are four key regions: northeast China (40° N–48° N, 120° E–126° E), central east China (28° N–36° N, 115° E–122° E), southeast China (22° N–30° N, 100° E–115° E) and Tibetan Plateau (28° N–34° N, 82° E–92° E).
Atmosphere 15 01024 g005
Figure 6. Box plot for TCC (left panels) and nRMSE (right panels) of area-averaged JJA extreme wind counts over four key regions. The abscissa represents the lead time in months. The shorter bars denote the maximum and minimum values in ensemble members. The upper and lower boundaries of the box are the 75th and 25th percentiles of ensemble members. The middle line in the box is the median. The red dots are the results for EMM.
Atmosphere 15 01024 g006
Figure 7. Impact of ensemble size on skill scores. Left panels: impact of ensemble size on TCC of area-averaged JJA extreme wind counts for (a) northeast China, (b) central east China, (c) southeast China, and (d) Tibetan Plateau. The abscissa represents the number of ensemble members. Red, dark gold, orange, green, cyan, and blue lines represent 1-month lead to 6-month lead, respectively. The right panels are the same as the left panels, but for nRMSE.
Atmosphere 15 01024 g007
Figure 8. Relationship between JJA-mean ws10m and JJA extreme wind counts over China during 2003–2022. (a) Correlation between JJA-mean ws10m and JJA extreme wind counts in ERA5. (bg) as in (a), but for EMM of hindcasts at 1-month to 6-month lead, respectively. Values reaching 90% confidence level are dotted in black.
Atmosphere 15 01024 g008
Figure 9. TCC of JJA-mean ws10m between EMM of hindcasts and ERA5 at different lead times during 2003–2022. (a) Results in 1-month lead. (bf) as in (a), but for 2-month to 6-month lead, respectively. Values reaching 90% confidence level are dotted in black. Red boxes in (a) are four key regions: northeast China (40° N–48° N, 120° E–126° E), central east China (28° N–36° N, 115° E–122° E), southeast China (22° N–30° N, 100° E–115° E) and Tibetan Plateau (28° N–34° N, 82° E–92° E).
Atmosphere 15 01024 g009
Table 1. The number of members when the TCC of the ensemble mean exceeds the TCC of individual members. Bold values indicate that the prediction skill in the ensemble mean exceeds 50% of ensemble members.
Lead Time1-Month2-Month3-Month4-Month5-Month6-Month
Northeast China235171951
Central east China182020161515
Southeast China24231522209
Tibet Plateau21171111813
Table 2. As in Table 1, but for nRMSE.
Lead Time1-Month2-Month3-Month4-Month5-Month6-Month
Northeast China242424222324
Central east China232424232423
Southeast China242324222424
Tibet Plateau232222222120
Disclaimer/Publisher’s Note: The statements, opinions and data contained in all publications are solely those of the individual author(s) and contributor(s) and not of MDPI and/or the editor(s). MDPI and/or the editor(s) disclaim responsibility for any injury to people or property resulting from any ideas, methods, instructions or products referred to in the content.