Article

Monthly Precipitation Outlooks for Mexico Using El Niño Southern Oscillation Indices Approach

by
Miguel Angel González-González
* and
Arturo Corrales-Suastegui
Campo Experimental Pabellón, Instituto Nacional de Investigaciones Forestales, Agrícolas y Pecuarias, Pabellón de Arteaga 20670, Aguascalientes, Mexico
*
Author to whom correspondence should be addressed.
Atmosphere 2024, 15(8), 981; https://doi.org/10.3390/atmos15080981
Submission received: 3 May 2024 / Revised: 12 July 2024 / Accepted: 24 July 2024 / Published: 16 August 2024

Abstract

:
The socioeconomic sector increasingly relies on accessible and cost-effective tools for predicting climatic conditions. This study employs a straightforward decision tree classifier model to identify similar monthly ENSO (El Niño Southern Oscillation) conditions from December 2000 to November 2023, using historically monthly ENSO Indices data from December 1950 to November 2000 as a reference. The latter is to construct monthly precipitation hindcasts for Mexico spanning from December 2000 to November 2023 through historically high-resolution monthly precipitation rasters. The model’s performance is evaluated at a global and local scale across seasonal periods (winter, spring, summer, and fall). Assessment using global Hansen–Kuiper Skill Score and Heidkee Skill Score metrics indicates skillful performance across all seasons (>0.3) nationwide. However, local metrics reveal a higher spatial percent of corrects (>0.40) in winter and spring, corresponding to dry seasons, while a lower percent of corrects (<0.40) are observed in more extensive areas during summer and fall, indicative of rainy seasons, due to increased variability in precipitation. The choice of averaging method influences the degree of underestimations and overestimations, impacting the model’s variability. Spearman correlations highlight regions with significant model performance, revealing potential misinterpretations of high hit rates during winter and spring. Notably, during the fall, the model demonstrates spatial skill across most of Mexico, while in the spring, it performs well in the southern and northeastern regions and, in the summer, in the northwestern areas. Integration of accurate forecasts of ENSO Indices to predict precipitation months ahead is crucial for the operational efficacy of this model, given its heavy reliance on anticipating ENSO behavior. Overall, the empirical method exhibits great promise and potential for application in other developing countries directly impacted by the El Niño phenomenon, owing to its low resource costs.

1. Introduction

Precipitation outlooks are becoming increasingly important because of their impact on agroecology and socioeconomic activities worldwide. Seasonal forecasts have focused on the climatic variable of precipitation; in the long term, they are socially relevant because they have the potential to inform about the operational management of water administration systems such as reservoirs in dams or irrigation systems in agriculture [1]. Therefore, many farming activities depend on the climate effects on a specific region; recently, several droughts of importance have been reported in different countries, for example in South Africa (2014–2016), Australia (2012–2016), Brazil (2012–2015), New Zealand (2012–2013), the Marshall Islands (2012–2013), the Southern U.S., and Mexico (2011–2012) [2]. In Mexico, water availability for rainfed and irrigated agriculture is crucial, and it represents a high risk for the latter sector since more than half of Mexican agriculture is based on seasonal rainfall [3]. In north–central Mexico, the 2011–2012 droughts impacted the states of Chihuahua, Coahuila, Durango, Zacatecas, San Luis Potosí, and Aguascalientes, which was the worst drought in 70 years, according to officials [4]. During this prolonged dry period, national grain volumes dropped drastically; for example, bean production reached roughly 40% [5], which wreaked havoc on the national grain supply. Likewise, the 1982–83 El Niño event cost for Mexico and Central America is estimated at six hundred million dollars [6]. The El Niño event of 1997–1998 resulted in an even more dramatic economic loss of two billion dollars for Mexico alone [7].
Successful monthly seasonal precipitation outlooks depend mainly on a revolution in our understanding of the coupled ocean–atmosphere system. Large-scale factors such as El Niño, the North Atlantic Oscillation, the Intertropical Convergence Zone, Hurricanes, Easter Waves, and Jet Currents behave differently in intensity and frequency from year to year, implying that the rainfall prediction for an area or region is a complex task. Notwithstanding, a known phenomenon with direct influence on global climate is El Niño Southern Oscillation (ENSO) [8,9,10,11,12,13,14], which usually alters global/regional precipitation during its different phases [15]. ENSO is an instance of warm temperature anomalies on the sea surface in the east and center of the Equatorial Pacific. During warmth, temperature anomalies (consecutive three-monthly indices above 0.5 °C) signify the presence of an El Niño event, while inversely indicate the presence of La Niña (indices below −0.5 °C). In Mexico, Mendez-González [16], Adams et al. [17], Corrales-Suastegui et al. [18], Englehart and Douglas [19], and Gay–García [20] found a connection between ENSO phases and precipitation and used them as seasonal/monthly precipitation outlooks. The latter forecasts are constrained to empirical or statistical techniques due to the constraints of computational infrastructure to run geophysical models in poor or developed countries.
Integrating a decision tree classification approach to predict seasonal/monthly precipitation, coupled with ocean and atmospheric indices, marks a pioneering advancement in climate prediction. This innovative method, as evidenced by Modaresi et al. [21], Quian et al. [22], Yaseen et al. [23], Lou et al. [24], Feng et al. [25], Sattari et al. [26], and Xiang et al. [27], has demonstrated promising results, showing its potential to forecast precipitation patterns.
The multifaceted utilization of oceanic indices sets this approach apart, leveraging a diverse range of data sources to enhance predictive accuracy. By incorporating such comprehensive datasets, this method captures the intricate dynamics of precipitation and offers insights into the underlying mechanisms governing climatic variations. Moreover, the decision tree classifier models capitalize on the well-established influence of the El Niño Southern Oscillation (ENSO) phenomenon, as highlighted by Wei et al. [28,29], Saha and Nanjundiah [30], and Begum et al. [31]. ENSO’s pivotal role as a primary predictor underscores the sophistication of this method by accounting for key drivers of inter–annual climate variability.
In essence, amalgamating decision tree classification techniques with a comprehensive array of predictors, including oceanic and atmospheric indices with a focus on ENSO, not only breaks new ground in precipitation prediction but also holds immense promise for advancing our understanding of climate dynamics on both seasonal and inter-annual scales. Thus, this study aimed to test monthly precipitation hindcasts for Mexico in the last two decades (2000–2023) by using a straightforward decision tree classifier model based on historically similar ENSO conditions. After determining the model skill, it could be used as an operational monthly precipitation outlook for decision-makers, farmers, and potential users to plan their activities in the long term.

2. Methodology

2.1. Area of Study

Mexico is located on the continent of North America. The territory covers 1,953,162 km2 and is distributed almost equally on both sides of the Tropic of Cancer. In most of the country, the topography is rough and contains many climatic groups and subgroups, varying from dry to humid climates over short distances. Up north of the Tropic of Cancer (23°26′), the arid and semi-arid climate prevail, and to the south, the humid and subhumid climate prevails as well (Figure 1a). Climate seasons are December–February (winter), March–May (spring), June–August (summer), and September–November (fall).
The country is highly influenced by seasonal trade winds and cyclones that occur in this area from the Pacific and Atlantic oceans [32]. In Mexico, the average annual rainfall is 777 mm, though in the far northwest, it hardly reaches 100 mm, while in the southeast and southern Pacific coast, an average of between 2000 mm and up to 4000 mm is recorded [33]. In most of the country, considerable annual precipitation occurs during the summer [34]. However, a midsummer minimum is detected (MSD (Midsummer Drought) [35], and the extreme northwest is influenced by a Mediterranean climate with a rainy season during the winter [36].

2.2. ENSO Indices and Precipitation

A seasonal outlook model proposed in this study considers the historical condition of warming or cooling of the Tropical Pacific Ocean, determined by the ENSO Indices in Region 3.4 (ENSO3.4). ENSO3.4 is located between ENSO3 and ENSO4 (overlapped); this is the region where index anomalies reflect most of the ENSO phenomenon [37]. Monthly ENSO3.4 Indices were obtained from the NOAA-CPC [38]. Figure 1b shows the monthly ENSO3.4 Indices from December 1950 to November 2023. Meaningful oscillations are observed between the phenomenon’s cooling negative and warming positive indices. In most decades, cooling prevailed; only a warm decade was detected in the 90s. By utilizing the Mann–Kendall trend test from R software (version 4.2.1) (trend package), a positively significant trend (illustrated by a dotted line) is discernible throughout the seven decades of ENSO3.4 data. It should be noted that 1955, 1973–1974, and 1988 stand out as the coldest events, and 1972, 1982–1983, 1997–1998, and 2015–2016 as the warmest (Figure 1b).
A database of monthly historical precipitation (December 1950 to December 1980) from Livneh et al. [39] and monthly recent precipitation (January 1981 to November 2023) from CHIRPS2.0 [40] for Mexico were collected in a raster format (.tif). Both geospatial information was spatially and temporally combined from December 1950 to November 2023. The raster spatial resolution (0.05°) was the same as CHIRPS2.0, as was the spatial alignment of the pixels, i.e., historical pp pixels (before 1981) coincided with recent precipitation pixels (after 1981). A total of 68,632 pixels for the Mexican territory were analyzed.

2.3. Decision Tree Classifier Model

Similar precipitation months (December 1950 to November 2000) for each precipitation hindcast (December 2000 to November 2023) were computed in a raster format based on the ENSO3.4 Index tabular data.
An absolute deviation decision tree classifier model developed by Corrales-Suastegui et al. [18] in MS Excel was obtained from INIFAP (National Institute of Forestry, Agriculture, and Livestock Research) and adapted within RStudio software (RStudio-2022.07.2+576) (readxl and Bert packages) to compute historically similar months for each target Index month. The monthly ENSO3.4 Index data were split into target Index months (December 2000 to November 2023 (TIin)) and historical Index months (December 1950 to November 2000 (HIin)). Absolute deviations for each TIi were calculated by the HIin, e.g., the absolute deviation for December 2000 compared to December 1950 |TIDec2000HIDec1950|, and so forth until December 2000 compared to December 1999|TIDec2000HIDec1999|. Then, the last TIi was |TINov2023HINov2000|, which in this case was for Lag0 (no delay or the same month). All absolute deviations for each TIi were organized from the lowest to the highest values to compute their respective tercile. The upper tercile (lowest absolute deviation values) recognized historically similar months from HIin for each TIi.
Additionally, a six-month lag (Lag−5, Lag−4, Lag−3, Lag−2, Lag−1, and Lag0, or no lag) was utilized as nodes for pruning the decision tree classification. This approach was employed to capture the seasonal transitions of ENSO3.4, as described in the following Formula (1):
UTAD for Lag−5, …, Lag0 for TIi = |TIiHIin|
where UTAD is the upper tercile absolute deviation for each Lag of six months for a target Index month (TIi) and historical Index months (HIin). For instance, it was computed the absolute deviations for Lag−5 for TIDec2000 = |TIAug2000HIAug1950|, |TIAug2000HIAug1951|, until |TIAug2000HIAug1999|, then the upper tercile absolute deviation values for TIDec2000 with Lag-5 (historically similar Augusts) were identified.
Thereupon, the upper terciles were organized from Lag−5 to Lag0 by selecting, in principle, the historically similar months for Lag−5, then the historically similar months for Lag−4, and so forth until Lag0 (no Lag). Notably, only the historically similar months identified for each Lag were considered for the subsequent Lag.
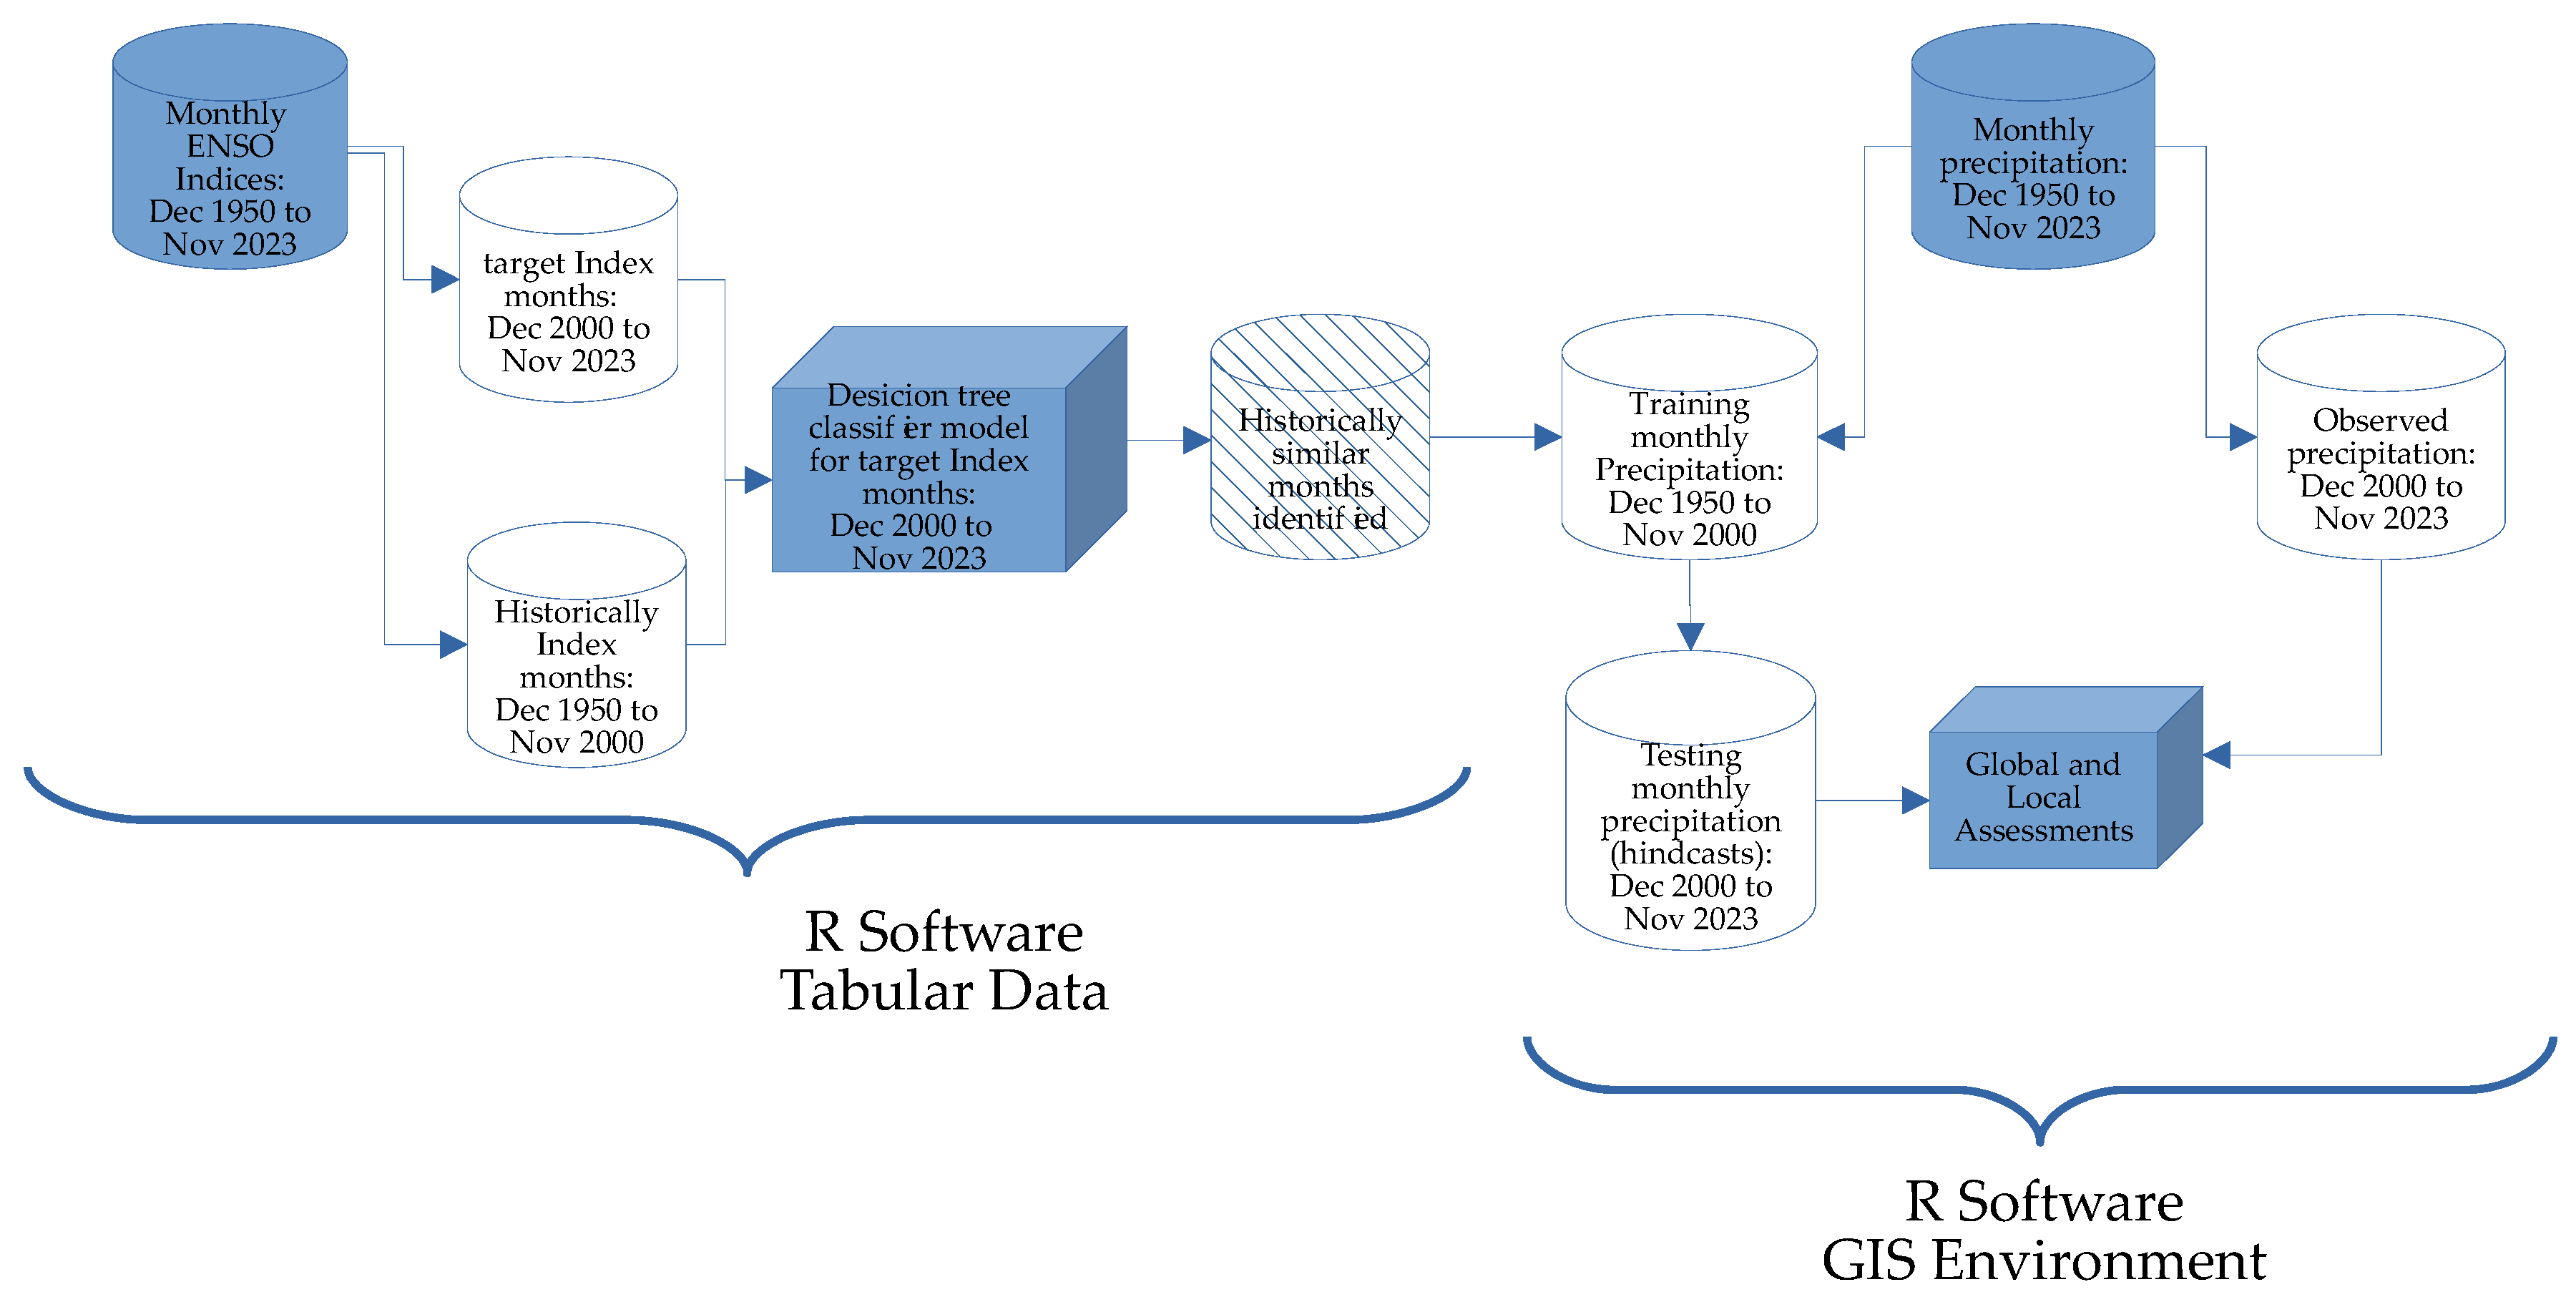
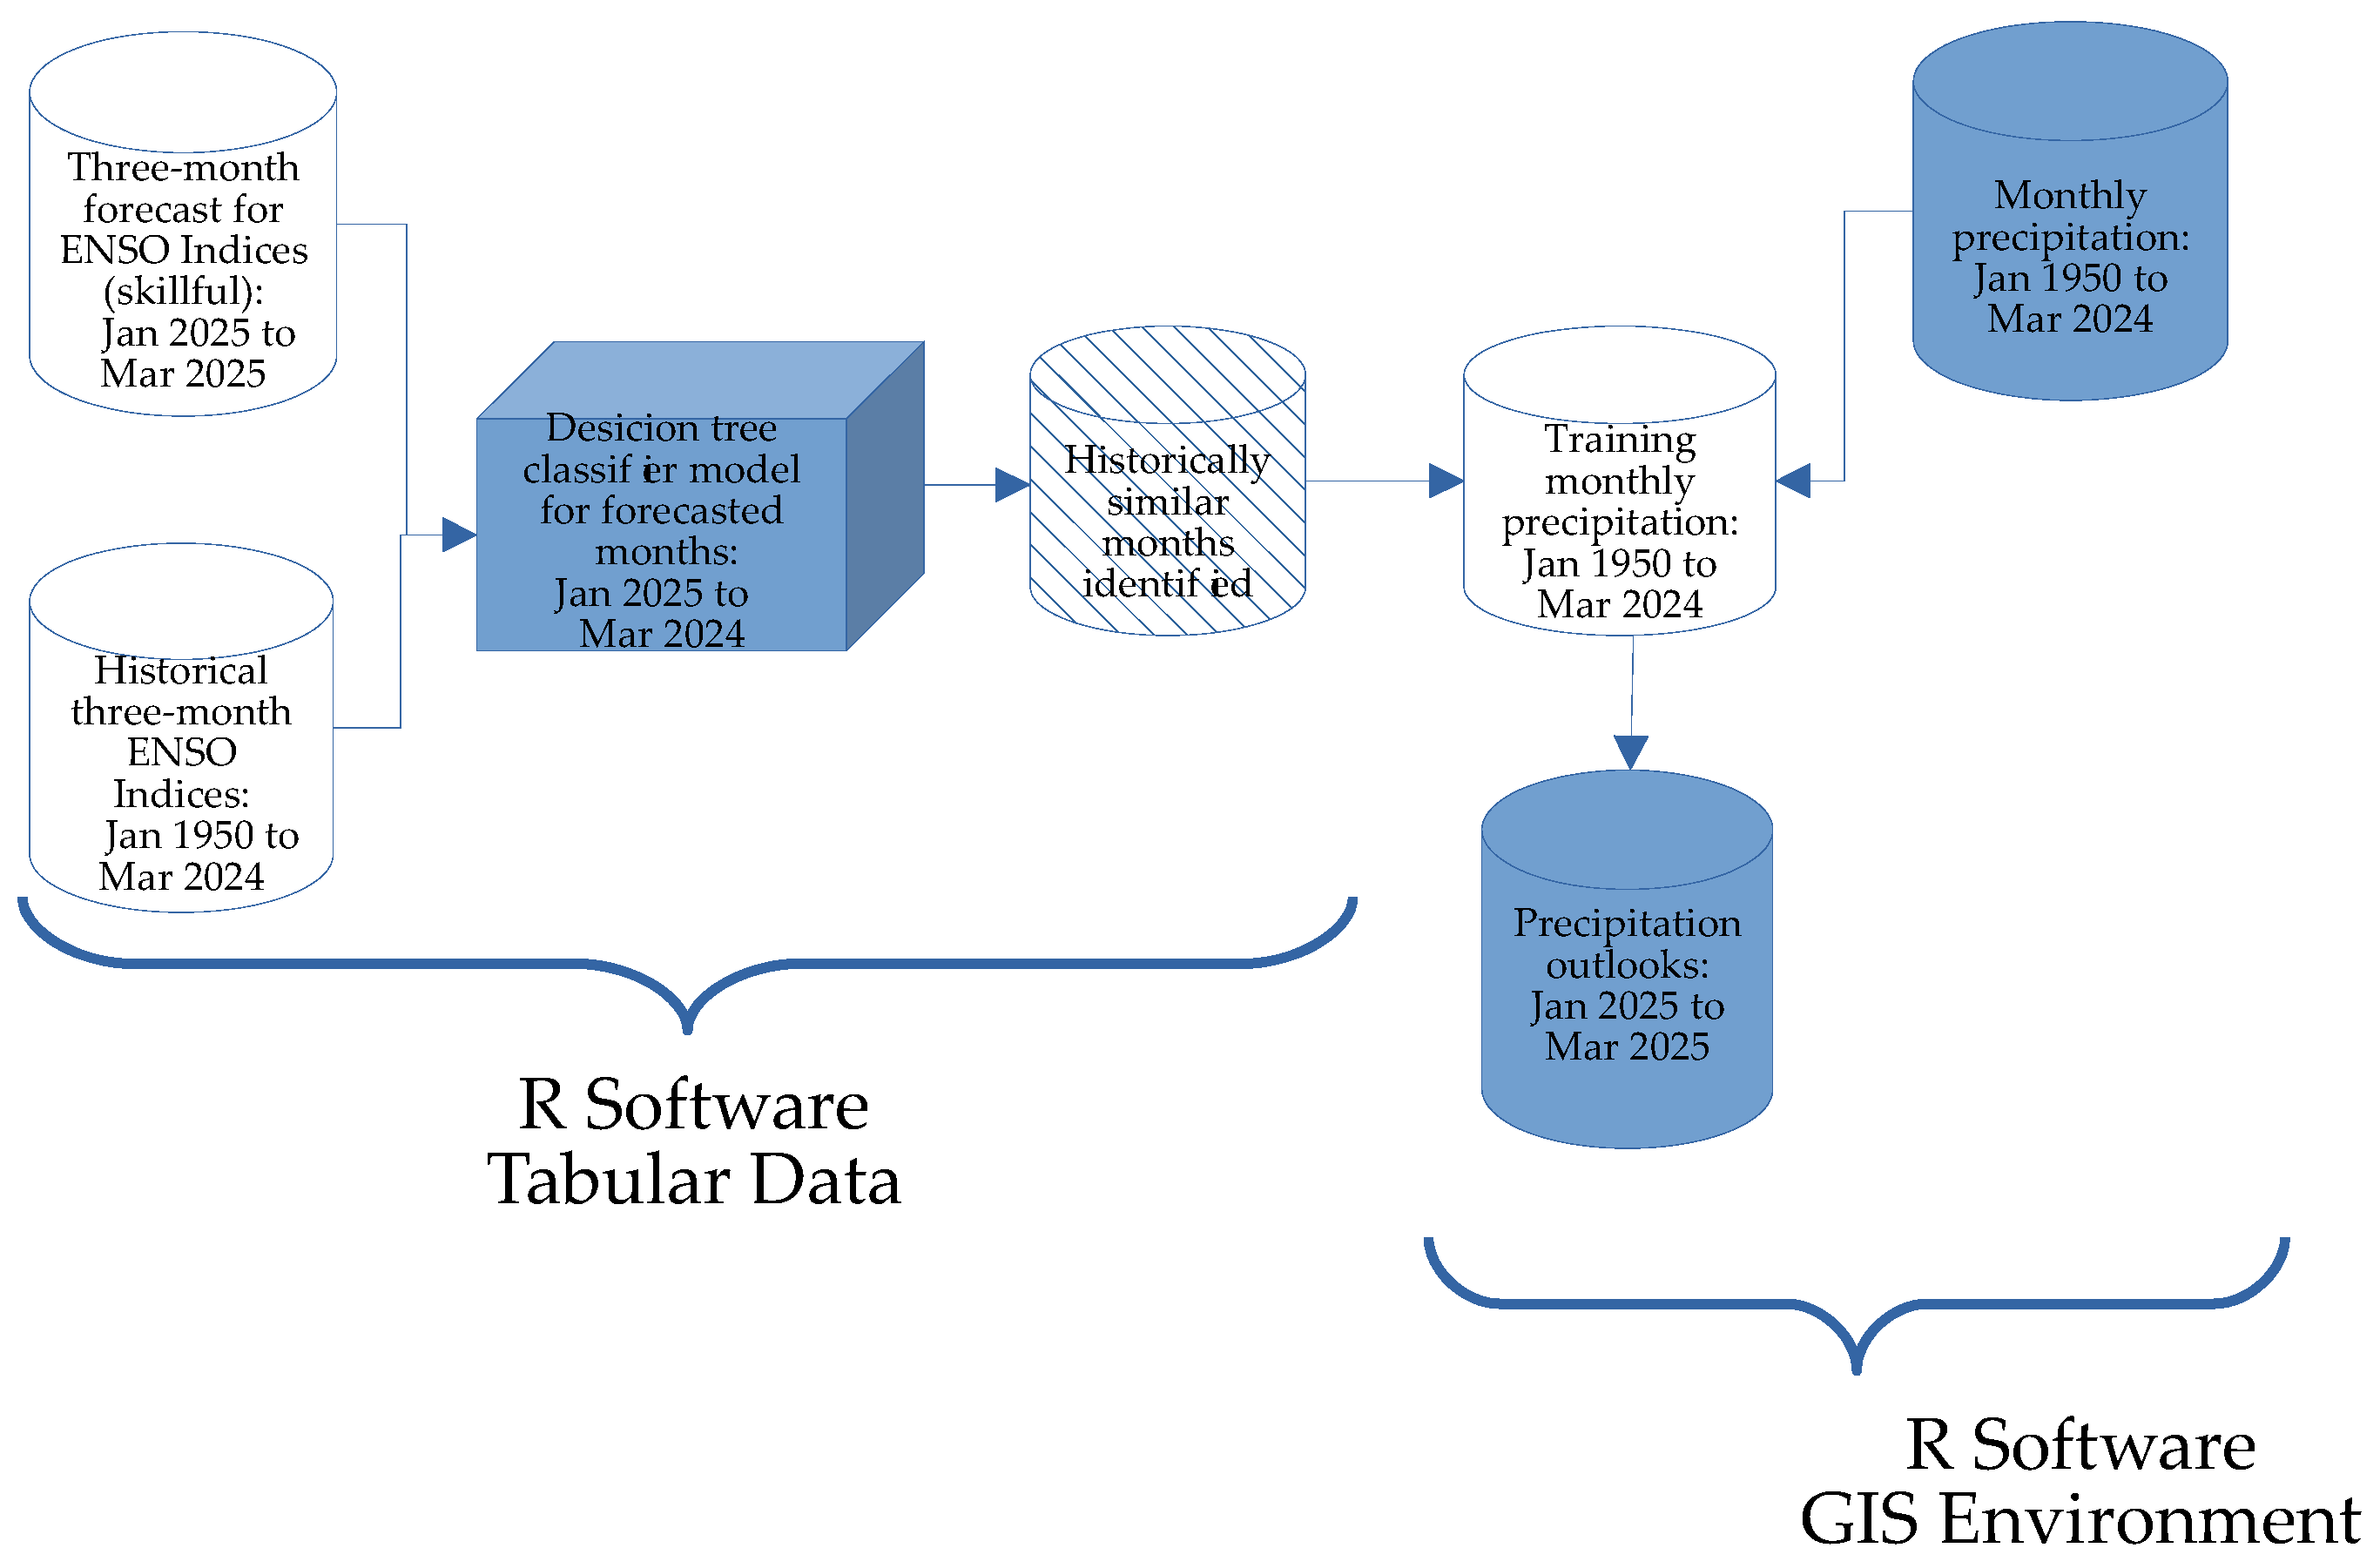
Lastly, the similar months, i.e., from the historically ENSO3.4 Index months, identified for each target ENSO3.4 Index month (TIi), were used to select rasters of precipitation training months (PTrin) for each precipitation testing month (PTsi…n). The latter is to compute the monthly hindcasts from December 2000 to November 2023 by performing the median of the similar months identified. At this point and on, precipitation was used in a GIS−like environment (rasters) in R software (version 4.2.1) by installing raster and rgdal packages (Figure 2).

2.4. Assessments

Each precipitation hindcast raster was compared with its monthly precipitation observation raster to assess the skill of the decision tree classifier model. Formerly, both precipitation data sets (hindcasts and observations) were classified into six categories: 0–20 mm, 21–75 mm, 76–150 mm, 151–300 mm, 301–450 mm, and above 451 mm. Monthly categorized precipitation hindcasts and observations were contrasted on an overall or national scale by a single value and on a local or spatial scale by visual maps. The national assessment employed the following monthly metrics: (a) Hansen–Kuiper Skill Score (KSS), (b) Heidke Skill Score (HSS) and its trend to verify if the model performs better through time by utilizing the Mann–Kendall trend test from R software (version 4.2.1) (trend package), (c) probability of detection for each precipitation classification (POD), and (d) mean absolute error.
The relationship between ENSO and precipitation can be complex and variable due to the country’s diverse geography and climate regimes. While some areas of Mexico may experience increased rainfall during El Niño events, others may see decreased precipitation or minimal impacts. To identify local effects, the monthly (a) spatial percent of correct/hit rate (sPC), (b) spatial Bias (sBias), and (c) a spatial Spearman correlation (srho p ≤ 0.10) were performed to detect statistical significance. Then, monthly metrics were summarized in the following three-month seasons: winter (DJF), spring (MAM), summer (JJA), and fall (SON).
National monthly metrics KSS, HSS, and POD were vector−averaged (three months), and local monthly metrics sPC and sBias were mapped–averaged (three months). srho was mapped−intersected (three months) to delimit areas with significant values (p ≤ 0.10) (Table 1).

3. Results

3.1. ENSO 3.4 Indices and Similar Months

The frequency of cold, neutral, and warm episodes for the testing period (December 2000 to November 2023), based on the average ENSO3.4 Index Lag of six months (Lag−5, …, and Lag0), detected events where most of the precipitation hindcasts were performed. In Table 2, it was observed that neutral events dominated around 50% of the period (133), followed by a similar number of cold and warm events (87 and 56 episodes, respectively). In the winter (DJF) and spring (MAM) seasons, warm and cool events outpaced the neutral events. Conversely, neutral events outpaced summer and fall trimesters, especially in summer, where 47 neutral events out of the 69. Therefore, precipitation hindcasts occurred mainly in neutral events during the summer and cool–warm episodes in the spring and fall trimesters (Table 2).
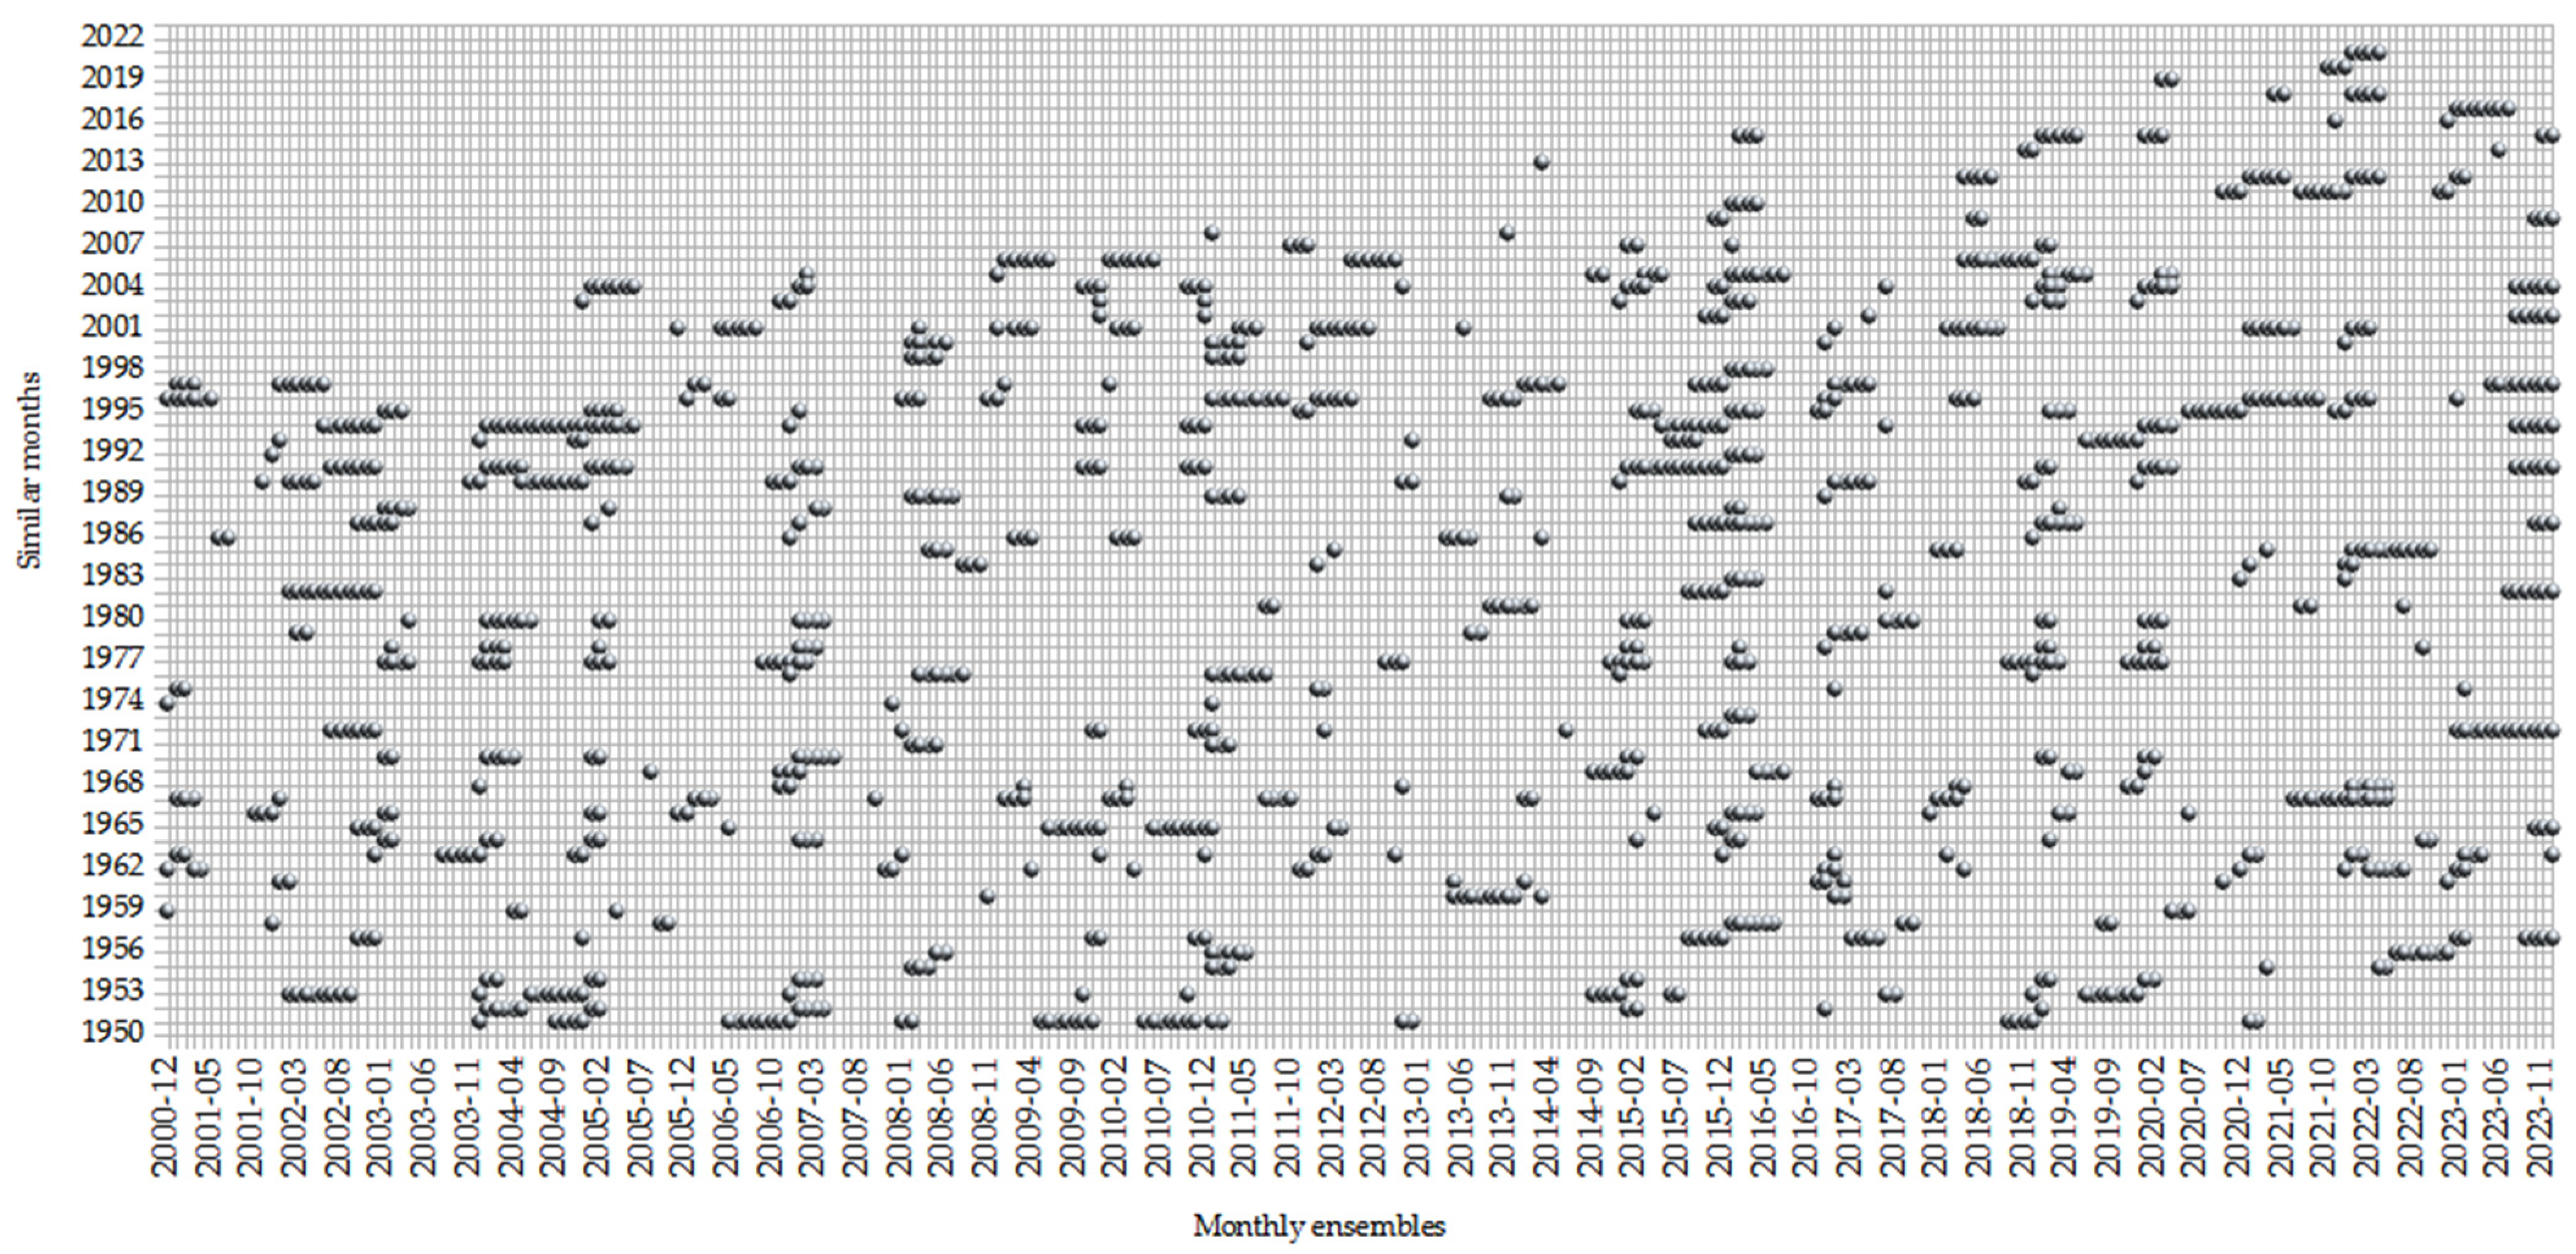
Nineteen missing hindcasts could not be computed because there were no monthly similarities. A maximum number of sixteen similar months (historical months) and a minimum of one month were identified to obtain each hindcast. It is observed that most of the similar months were in the 1960s (198) and 1990s (277) (Figure 3).

3.2. Overall Model Efficiency and Probability of Detection

The national model skill across the country is better than random chance for each season performed, according to the KSS and HSS (above 0.31) in Table 3. The highest is detected during the winter and spring (0.41 and 0.48, respectively), and the lowest in the summer and fall (0.37 and 0.31, respectively). Comparable skills are reported by Fuentes-Franco et al. [41] for their hybrid precipitation seasonal model (a statistical and dynamic model) for winter and summer in Mexico. Gay-García et al. [20] performed monthly precipitation outlooks using ENSO analogs during the winter and spring, which were also better than those in the summer and fall. The mean absolute error shows low values in winter and spring (11 mm and 13 mm) and high values in summer and fall (52 mm and 44 mm); the latter is due to the rainy season in most of Mexico during those seasons.
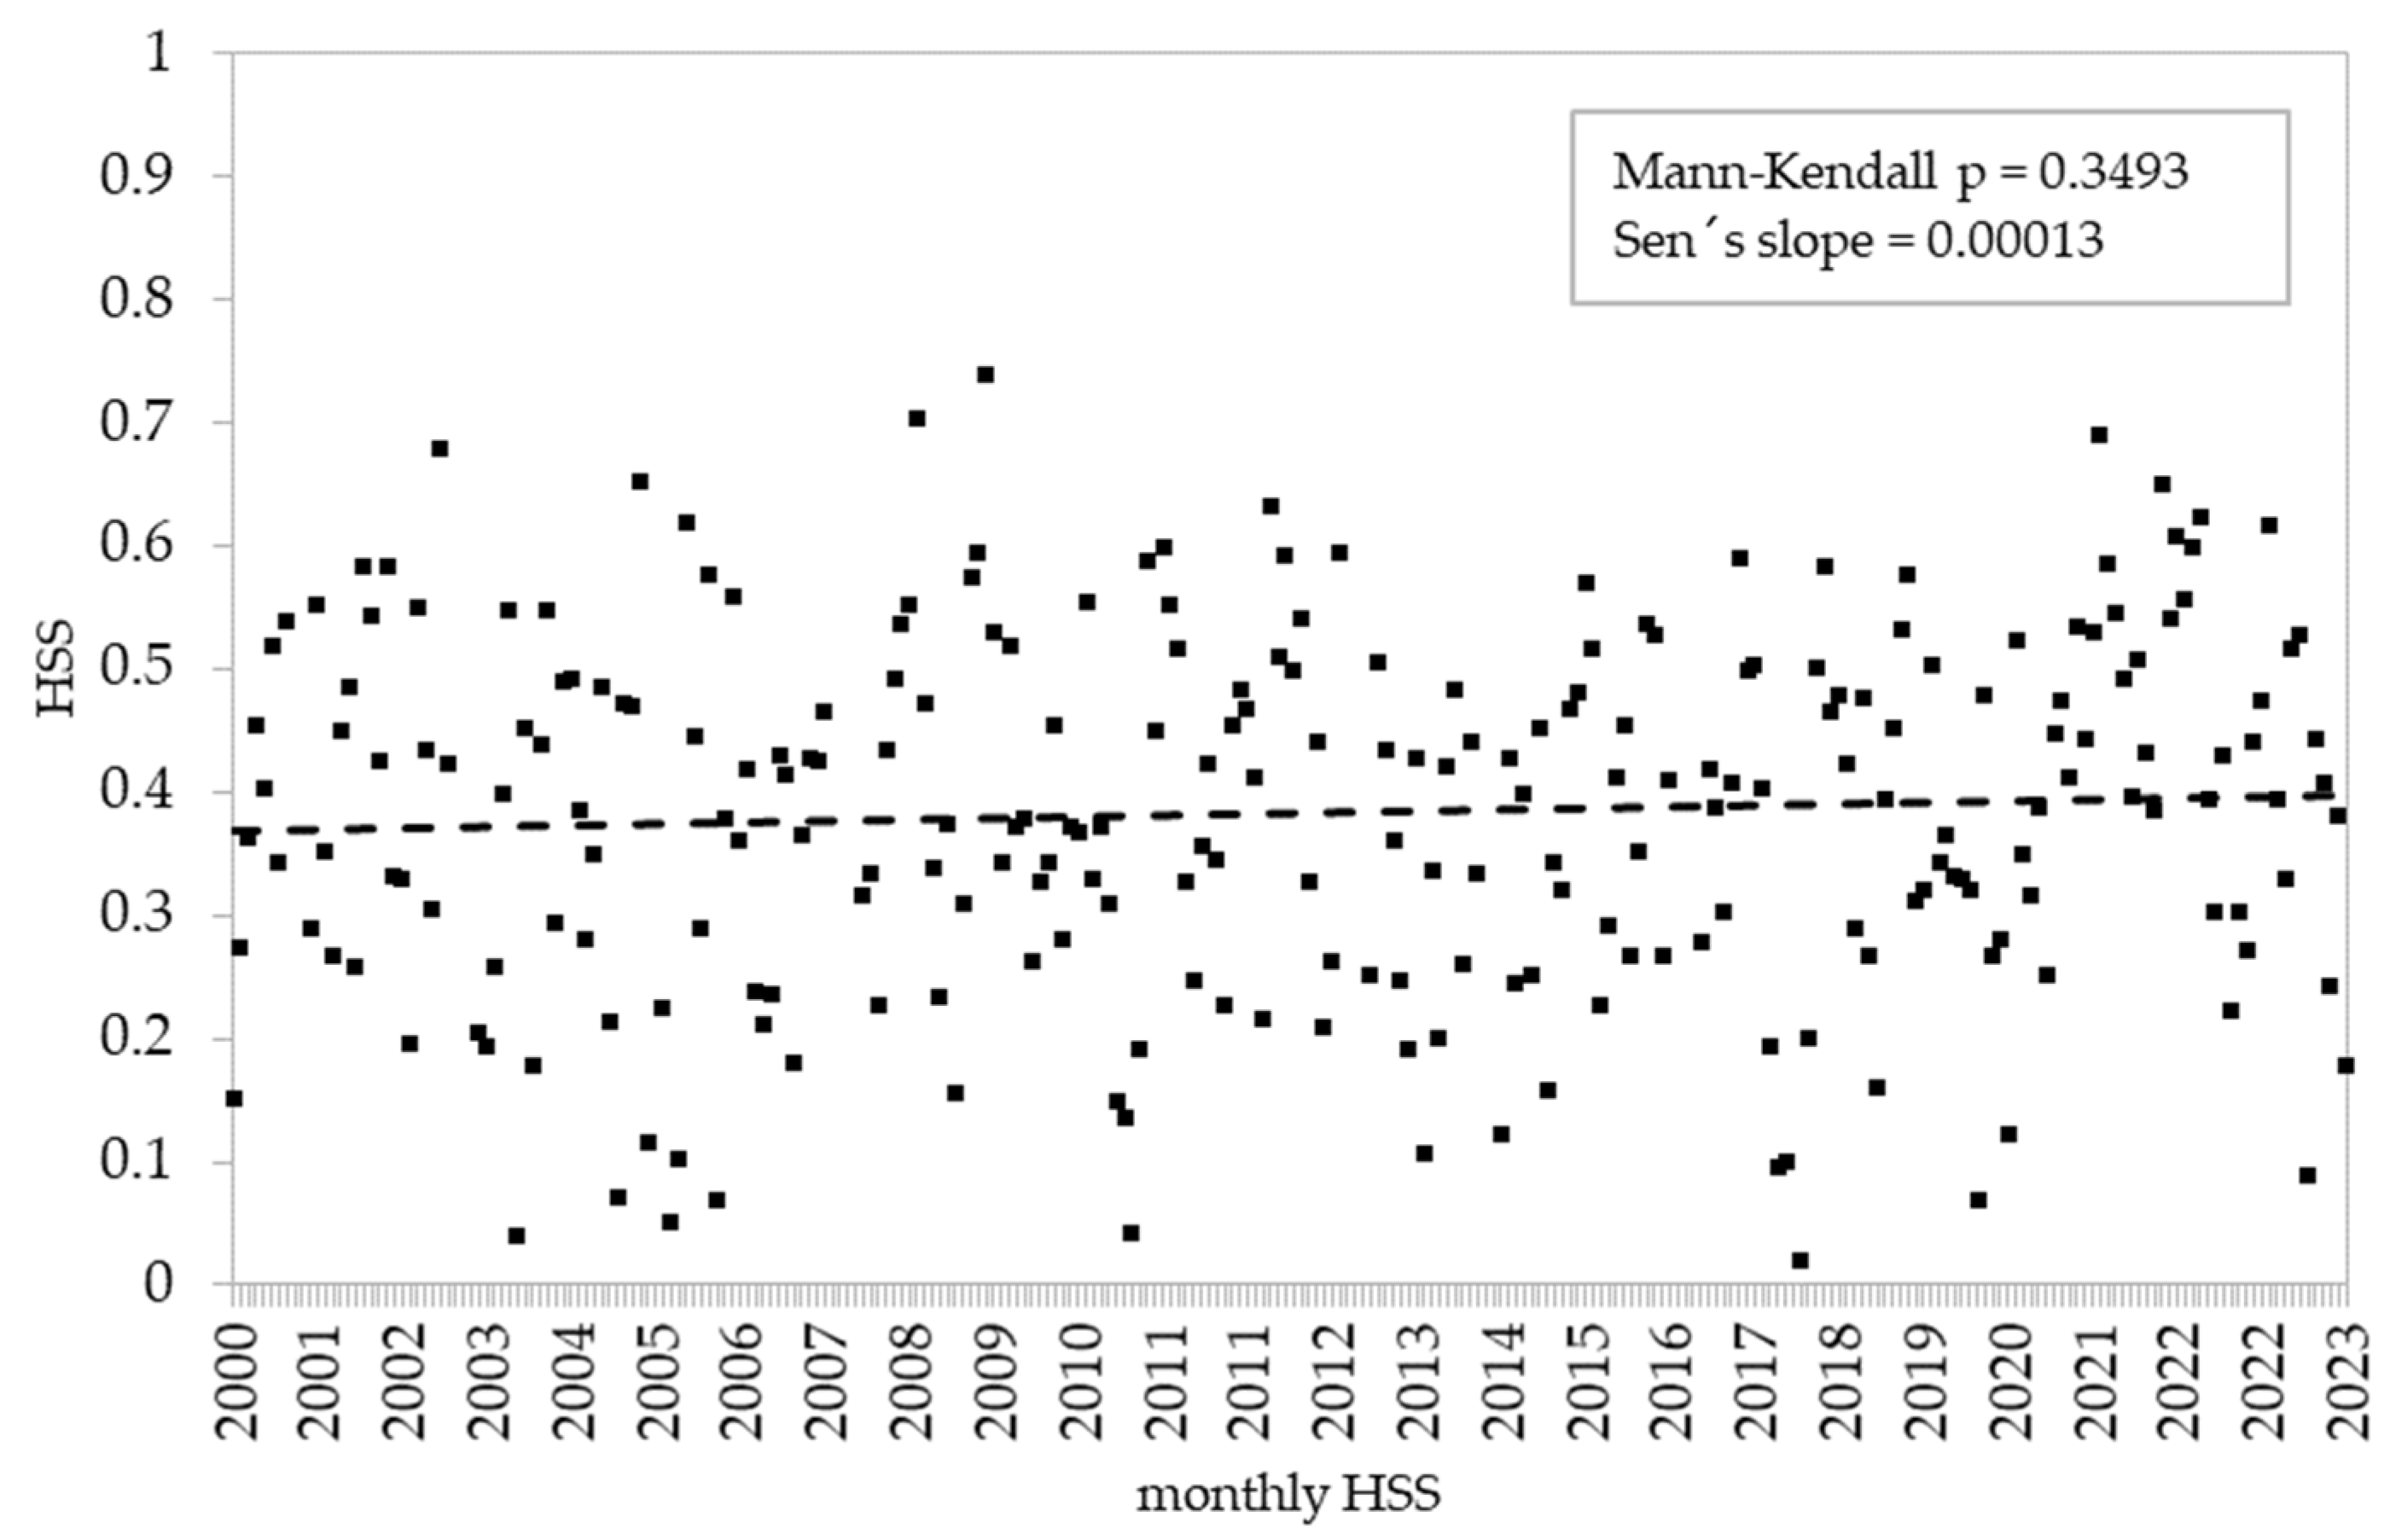
Climate change is an important issue that the model should detect because the proposed decision tree-classifier model considers historical months. Despite other similar prediction precipitation models (analogs) for Mexico demonstrating acceptable results [20,42,43], there is a need to analyze their performance trend. Note that the KSS was not analyzed, as it is very similar to the HSS. Therefore, in Figure 4, the HSS trend shows a slight positive slope (Sen’s slope = 0.00013). Although this trend is not statistically significant (Mann–Kendall p = 0.3493), it suggests that the model may not effectively capture changes in precipitation with future outlooks.
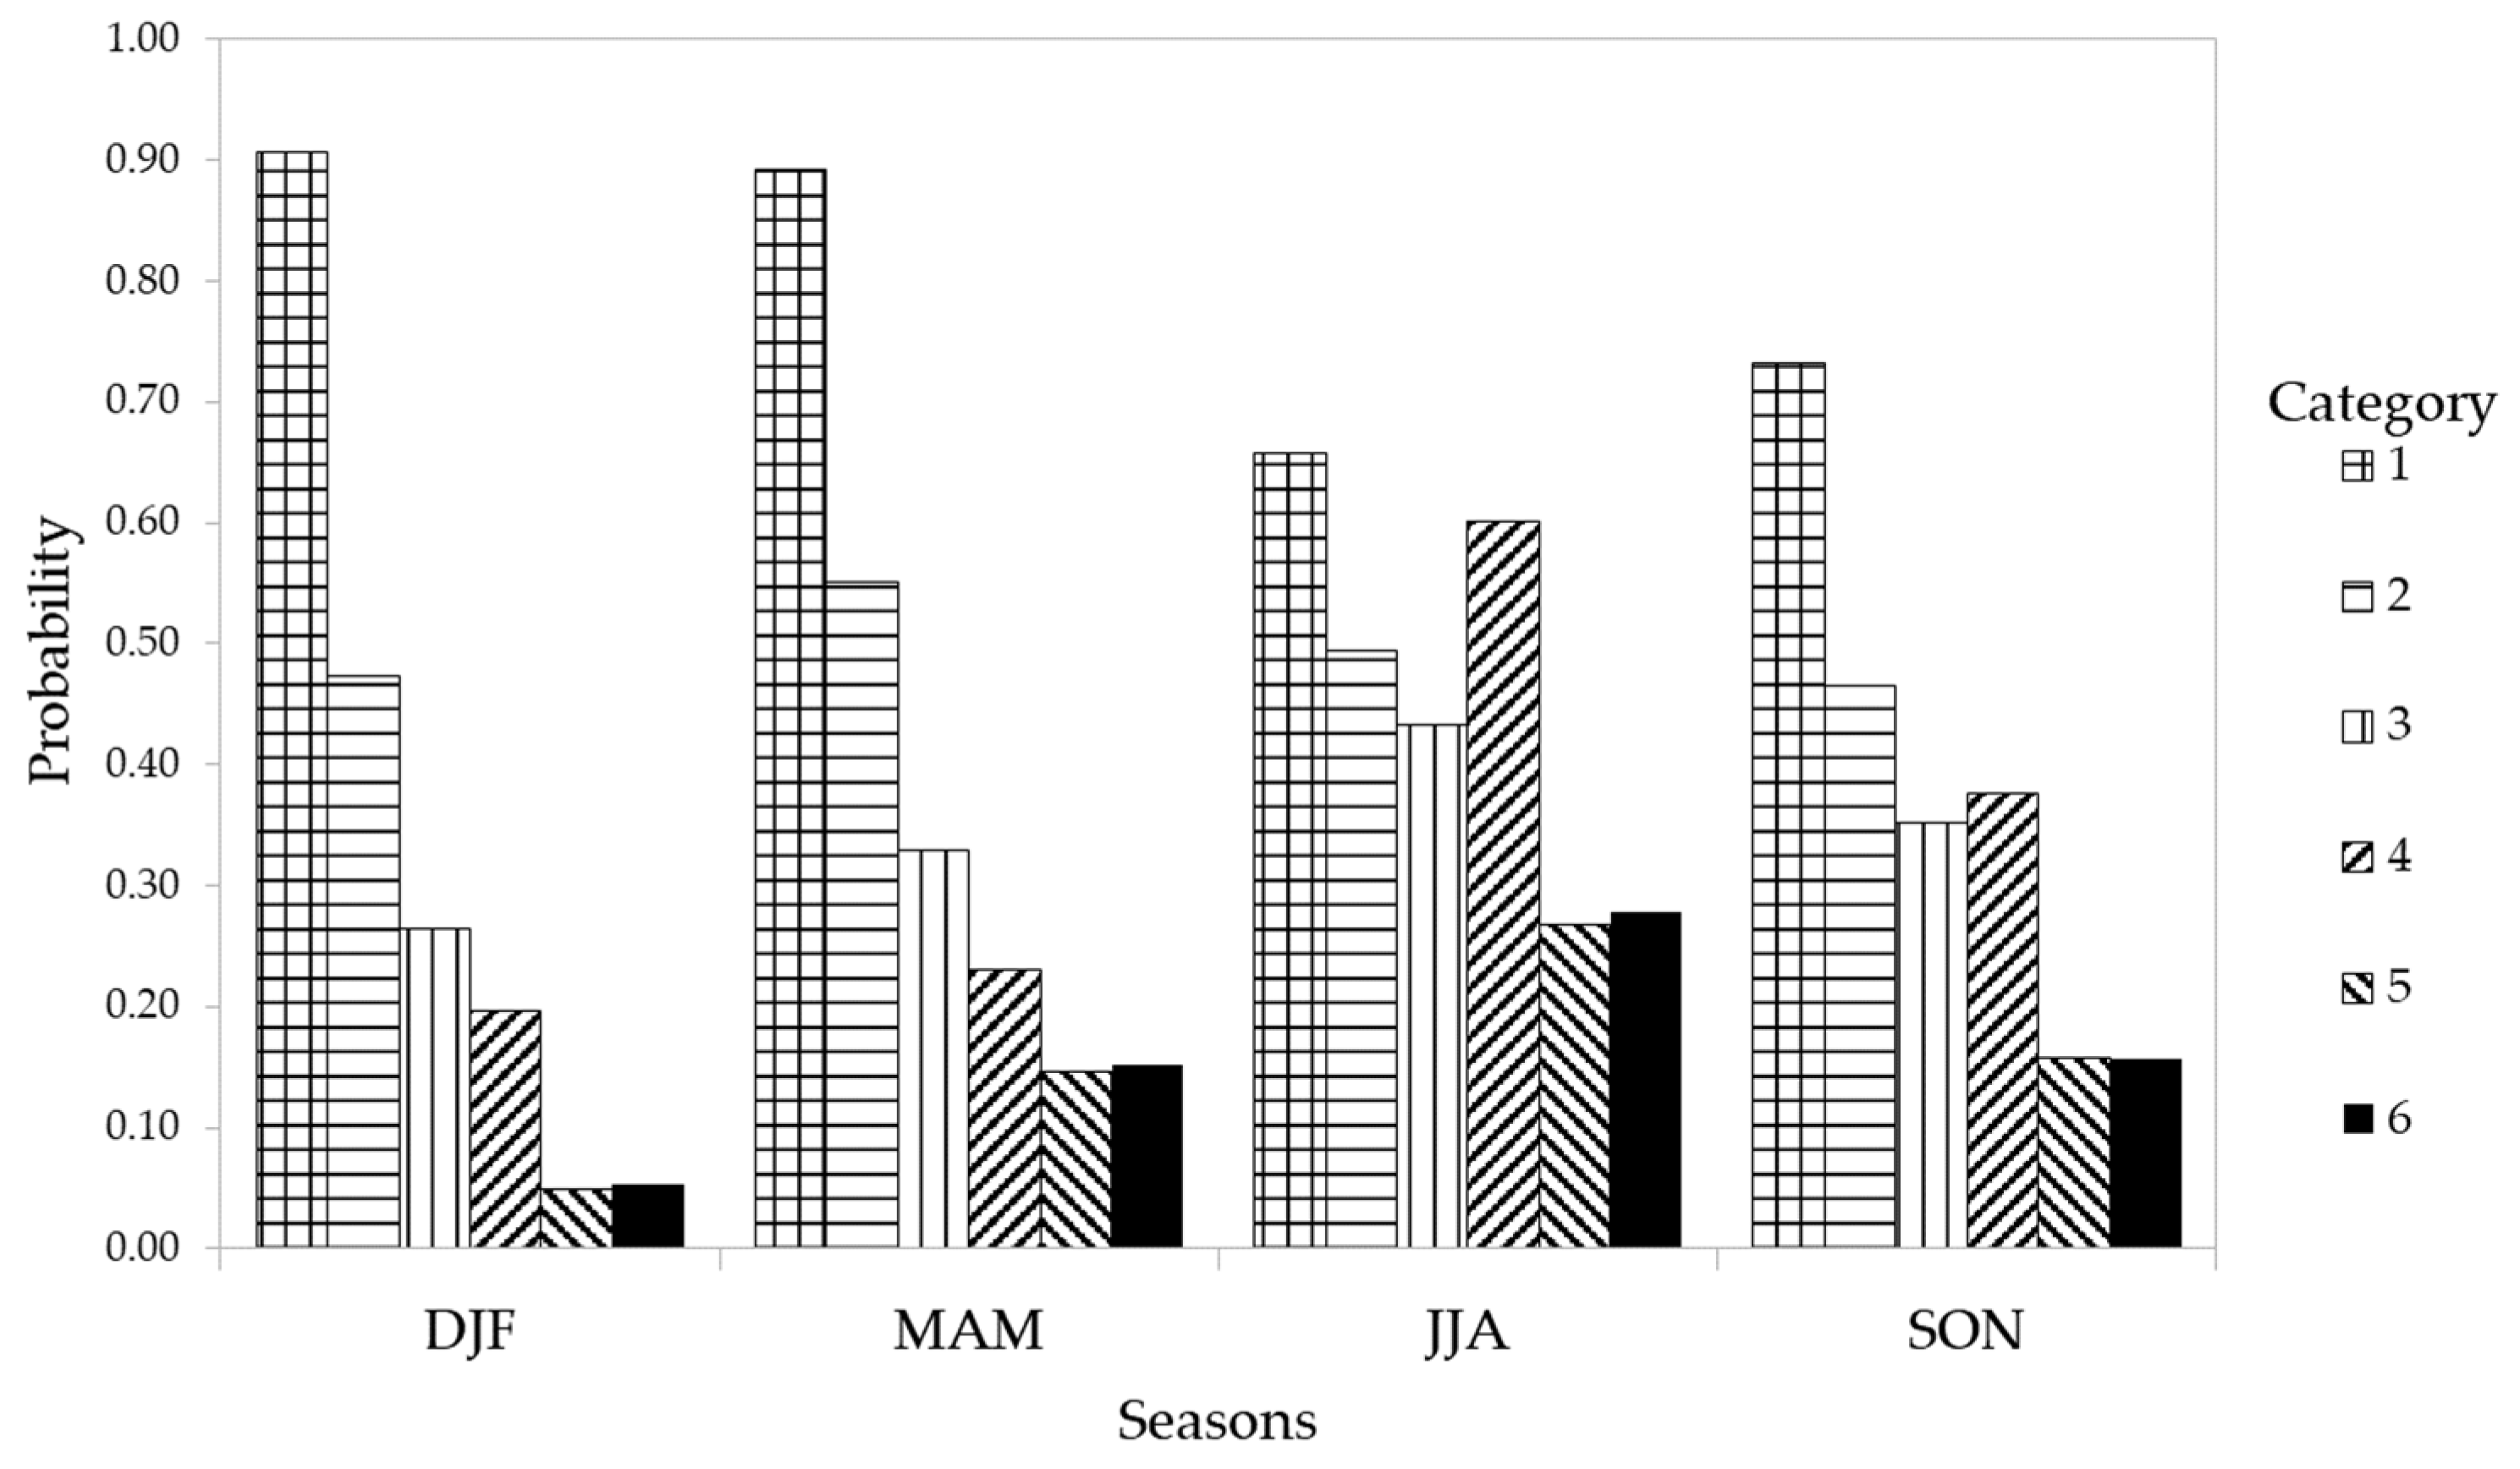
A high POD (>0.80) of the first category (1–20 mm) is observed during the winter and spring due to low precipitation observed and hindcast (dry seasons in most of the country). In summer and fall, a lower POD (>0.30) is observed for the first four classifications (1–20 mm, 21–75 mm, 76–150 mm, and 151–300 mm) because it is the period where the rainy season spans (Figure 5), and thus more classifications for the model to miss. In all seasons, higher classification performances (301–450 mm and above 450 mm) are poor because of the drawback of the model to forecast extreme events, i.e., averaging similar years removes higher values or outliers. Hence, the model tends to be climatology.
A crucial requirement lies in conducting local analysis to pinpoint spatially where the model demonstrates proficiency, mainly for practical applications in hydrology, agronomy, and various other sectors, as presented in the following results.

3.3. Spatial Percent of Correct, Bias, and Correlations

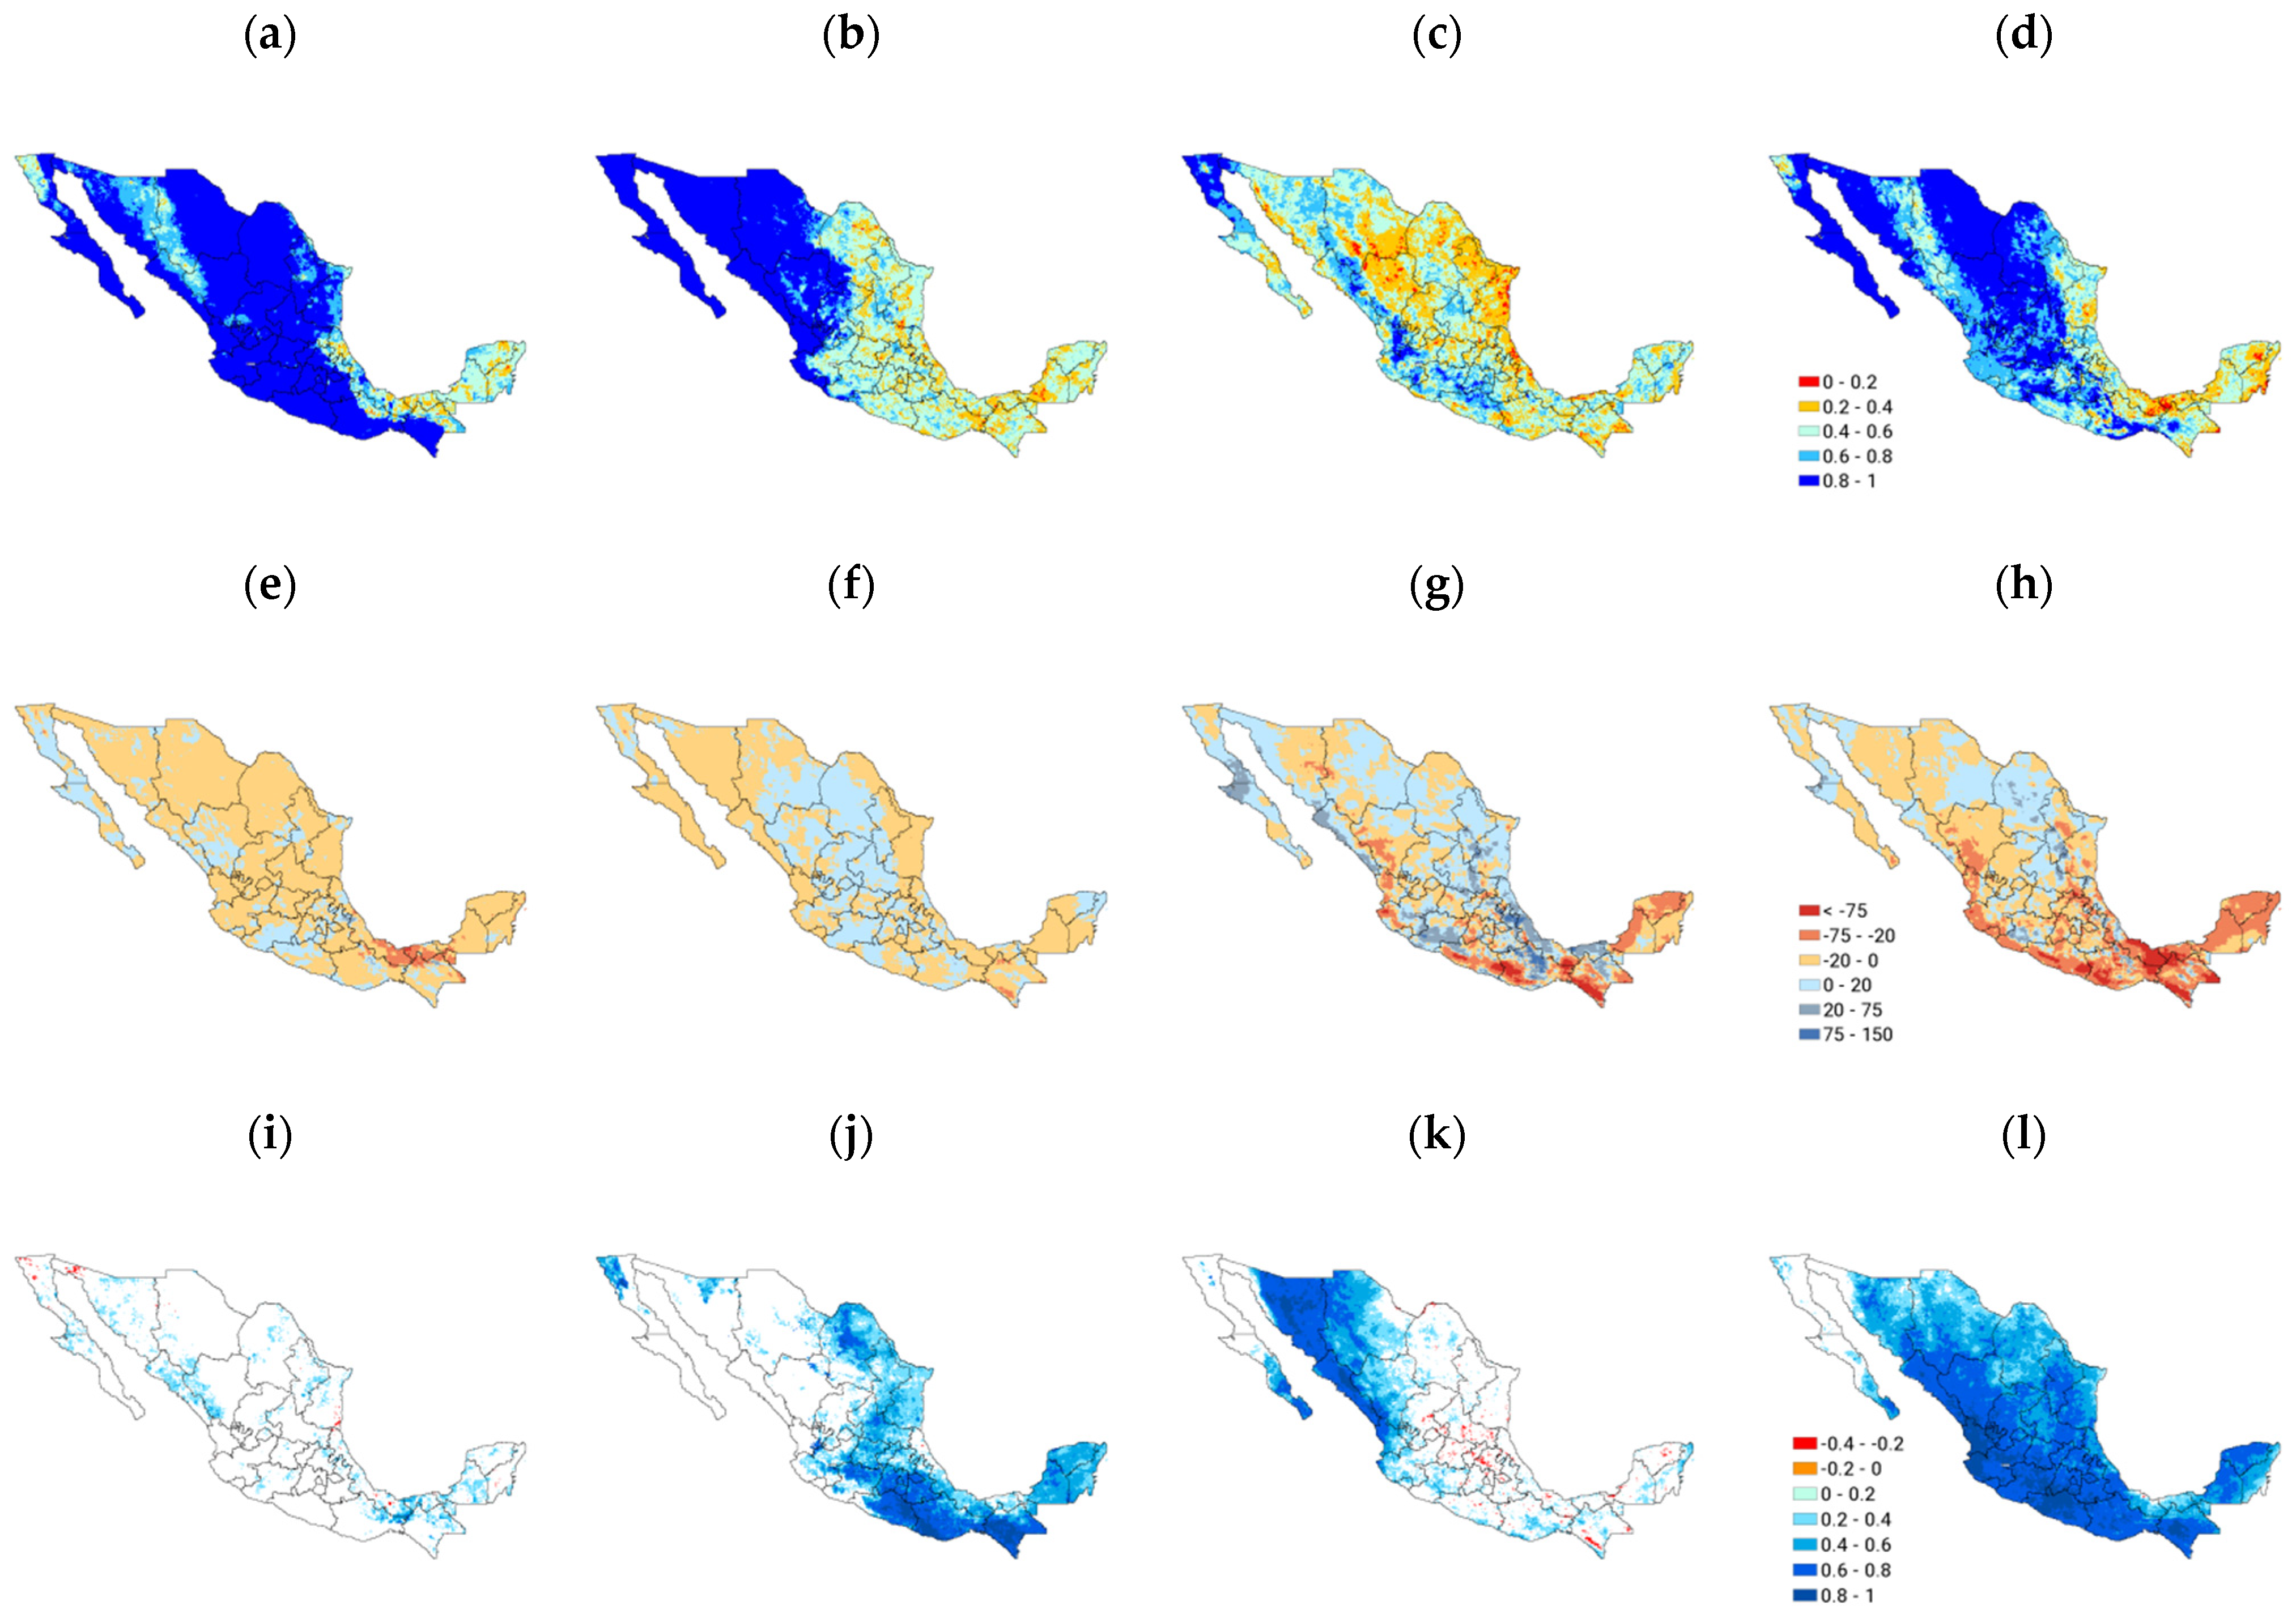
Local metrics such as sPC indicate high hit rate values during the winter (DJF) in most of Mexico (national average of 0.84); only small areas in northwestern, east, and southeastern Mexico showed hit rates less than 0.40. As mentioned, the latter is due to this period when the dry season in Mexico begins, and thus, hindcasts and observation classifications match more frequently. Meanwhile, negative sBias (hindcast underestimations) are detected in most of Mexico, especially in the southern Gulf of Mexico, and positive sBias (precipitation overestimations) are mainly detected in areas of the Mexican Pacific. However, only significant spatial positive correlations (srho) are in Mexico’s dispersed areas, though there is a subtle northwestern and southeastern pattern (Figure 6a,e,i).
In spring (MAM), the sPC’s national average is 0.70. Higher hit rates (>0.60) are revealed in large areas of Mexico, especially in the west. Only lower hit rates (<0.40) are discernible in some eastern and southeastern Mexico areas. Likely, low precipitation (the national driest season) allowed those high hit rates, just as Gay-García et al. [20] forecast in the state of Tlaxcala during the spring of 1998. There is a hindcast overestimation (positive bias), mainly in the Mexican Altiplano. Precipitation hindcasts during this period foresaw favorable rains, though observations implied otherwise. Meanwhile, underestimations are mainly in the Pacific, Gulf of Mexico, and southeastern Mexico. In the meantime, spatial positive correlations are significant in continuous areas of northeastern, eastern, southern, southeastern, and far northwestern Mexico (Figure 6b,f,j).
The sPC’s national average is 0.49 during the summer (JJA). Hit rates are above 0.40 in the northwestern, central Pacific, south–central Mexico, and southeastern Mexico, especially. Lower hit rates (<0.40) are identified in northeastern and eastern Mexico, and northern Altiplano. Low hit rates in the summer can be explained by some other external factors aside from ENSO3.4 Indices since ENSO’s phase remained neutral for most of the study period. Furthermore, due to the beginning of the rainy season, more precipitation classifications are tested; therefore, fewer hit rates are noticeable. Positive and negative sBias are spatially sparse (low and high sBias depend on the locality). However, on the Pacific southern coast of Mexico, there are remarkable underestimations (negative sBias) from the model (>75 mm), followed by a remarkable overestimation (positive sBias) in the Gulf of Mexico and northwestern Mexico. The low sBias are explained by extreme precipitation from hurricanes that the ensemble model cannot capture (using the median of historical months). Likewise, dry seasons in similar years explain the high bias (overestimations) due to the averaging method. Spatial positive significant correlations (srho) are spatially continuous in western and northwestern Mexico (Figure 6c,g,k).
During the fall (SON), the sPC’s national average was 0.72. There are also larger areas with higher hit rates than in the summer (<0.8), especially in northern, northwest, and central Mexico. The former is because in this season, the rainy season ends in most of Mexico, i.e., easterly flows (humid) dwindle in September–October, and finally, western flows (dry) begin in November [44]. Lower hit rates (<0.40) are in Mexico’s far northeast, east, and southeastern. Overestimations (positive sBias) are located in most of northern Mexico since precipitation climatology is low. On the other hand, underestimations (negative sBias) are predominant in coastal southern and southeastern Mexico because of underestimations of cyclonic heavy rainfalls. The fall is the only season where significant spatial positive correlations are nearly across the country, except in northwestern Mexico (Baja California Peninsula) (Figure 6d,h,l).

4. Discussion

It is worth mentioning that to be used as a long-range operational forecast tool, it is necessary to acquire skillful forecasts of ENSO3.4 Indices (Figure 7). Namely, if we want to perform a precipitation three-month outlook (Lead 3), we must use the three-month ENSO3.4 Index forecasts with high certainty. That can be a drawback when there is high uncertainty in the ENSO3.4 Index forecasts in the following months, primarily if we want to perform precipitation outlooks more than six months ahead (Lead 6) [45].
According to the national analysis, model skill seems related to low precipitation observed and hindcast in the winter and the spring, even though higher precipitation in the summer shows skill (POD > 0.3 in the first four categories). In summary, the national assessments demonstrate that the proposed forecast model has skill across seasons (KSS and HSS > 0). However, the trend line of the monthly skills from December 2000 to November 2023 is not statistically significant. This suggests that the historical monthly data need to be updated to account for important precipitation changes in the years ahead, potentially due to the impacts of climate change.
Local metrics indicate that large areas with high spatial hit rates (>0.40) during the winter and spring can be deceiving because of the low precipitation observed and hindcasts due to dry seasons. One interesting point is that during the fall, KSS and HSS were the lowest of the four seasons, but sPC was the highest, and srho showed significant areas in most of the Mexican territory. Also, significant srho showed spatially continuous areas in the spring in southern Mexico and northwestern Mexico in the summer, contrary to Adams and Comrey [46], who exposed that the high interannual variability of the North American monsoon is not directly linked to ENSO. In winter, significant srho was spatially scattered, similar to Bravo-Cabrera et al. [47] and Mendez-González et al. [16], who found significant positive correlations between winter precipitation (weather stations) and ENSO. That is, during all seasons, the ENSO signal is not as strong in extensive and continuous areas in Mexico utilizing this method (constrained to some local areas and regions), and it demonstrates that spatially, the strongest ENSO signal in most of Mexico using this method is confined to predict precipitation during the fall months, aside from the Baja California Peninsula.
Hence, this study implies that the KSS and HSS were only metrics to verify globally that the model was acceptable in all seasons without necessarily showing when or where the model has more skill. Therefore, other metrics, such as spatial metrics, were performed. Regarding spatial Bias (sBias), there are usually more precipitation underestimations than overestimations in winter and spring because the method to average (median) historical precipitation values hinders high precipitation predictions, which is also a drawback of using this empirical method to forecast extreme precipitation events [48]. During the summer and fall, the method underestimates precipitation on the Mexican coasts (tropical rains) and overestimates precipitation inland, so the method also does not capture rainfall deficits such as extensive droughts as stated for the averaging method used and thus a lack of spatial/temporal variability.
Predicting the relationship between ENSO and precipitation in Mexico requires considering the complex interactions between large-scale climate phenomena and regional factors. Therefore, while ENSO can provide nationwide insights into potential climate impacts, it may not always directly correlate with precipitation patterns in specific regions. This leads to spatial mismatches, as presented in the spatial metrics during the hindcasts. One potential source of spatial mismatch between ENSO Indices and precipitation patterns in Mexico could be the influence of other climate drivers and regional factors [49,50,51,52,53,54,55]. To that end, other climate indices should be integrated into the model, e.g., PNA, AMO, etc. However, additional decision tree classification pruning to select similar years might lead to zero analogs since, in this study, there were 19 hindcasts without similar years using just one predictor. Therefore, there is a need to use other methods that account for fractions of relationships between precipitation and climate indices, such as neural networks and regression trees, just to name a few. Moreover, model performance might be improved globally or spatially by integrating bias correction for future model adaptation [56,57,58].

5. Summary and Conclusions

In the present study, we introduced an empirical method to predict monthly precipitation over Mexican territory in high resolution. The method takes historically monthly ENSO3.4 conditions as input to construct monthly precipitation hindcasts and uses a 6 month Lag to account for ENSO changes or transitions. During the model training period (December 2000 to November 2023), ENSO events were neutral roughly 50% of the time, balanced by cooling and warming events, so it implies that the proposed model includes most of the ENSO conditions to predict monthly precipitation.
A key underlying aspect of the model is that the verification was based on global and local metrics between monthly hindcasts and observed monthly precipitation (grouped seasonally: winter, spring, summer, and fall) over a 23-year period. Overall, our model approach using only the ENSOS3.4 Indices approach provides skill over Mexico, although some areas of interest should be identified to measure the level of certainty. To be used as an operative model, it must integrate skillful forecasts of ENSO Indices depending on the desired leads, which is essential as the model’s monthly precipitation outlooks depend on anticipating future ENSO behavior.
Raster, high-resolution climate data are becoming the standard, replacing point weather stations in areas where no weather data are available. However, CHIPRS2.0 and Livneh et al.’s data observations must be validated since they are used as forecast inputs. Therefore, scientific mesh data, such as CHIRPS2.0, Livneh et al., ERA5, and others, should be analyzed and tested in future works to use the best input for monthly outlooks.
The direct influence of ENOS in Mexico allows for a straightforward model to benefit from and also promises usage in other developing countries. Even so, it is demonstrated that local topography, proximity to bodies of water, and other geographic features can also influence precipitation patterns and may lead to spatial variations that do not perfectly align with formerly established ENSO patterns, as stated in the present study and other studies.

Author Contributions

Conceptualization, M.A.G.-G.; methodology, M.A.G.-G.; software, A.C.-S.; validation, M.A.G.-G. and A.C.-S.; formal analysis, M.A.G.-G. and A.C.-S.; investigation, M.A.G.-G.; resources, M.A.G.-G.; data curation, M.A.G.-G. and A.C.-S.; writing—original draft preparation, M.A.G.-G.; writing—review and editing, M.A.G.-G. and A.C.-S.; visualization, M.A.G.-G.; supervision, M.A.G.-G. and A.C.-S.; project administration, A.C.-S.; funding acquisition, A.C.-S. All authors have read and agreed to the published version of the manuscript.

Funding

This research was funded by the Instituto Nacional de Investigaciones Forestales, Agrícolas y Pecuarias (INIFAP) of Mexico. Proyecto SIGI 11254636311.

Institutional Review Board Statement

Not applicable.

Informed Consent Statement

Not applicable.

Data Availability Statement

The precipitation data and ENSO3.4 Indices used to support this study are available at: https://data.chc.ucsb.edu/products/CHIRPS-2.0/ (accessed on 2 May 2024). ENSO3.4 Indices and https://www.cpc.ncep.noaa.gov/data/indices/ersst5.nino.mth.91-20.ascii (accessed on 2 May 2024). Likewise, hindcast data are available at: https://www.dropbox.com/scl/fo/g1semm8f0fd3pws4s2woq/AATkx1xubRHg8QwDRfDCmm4?rlkey=nt47wmpbgpfpj2wa7vx9mpoti&e=2&st=t1jr8jss&dl=0 (accessed on 2 May 2024).

Acknowledgments

The authors gratefully acknowledge the Instituto Nacional de Investigaciones Forestales, Agricolas y Pecuarias (INIFAP), experimental station Pabellon, for supporting this research. We also gratefully acknowledge the anonymous reviewers who helped us improve this work.

Conflicts of Interest

The authors declare no conflict of interest.

Abbreviations

AbbreviationDefinition
ENSO3.4 El Niño Southern Oscillation Region 3.4
CHIRPS2.0The Climate Hazards Group InfraRed Precipitation with Station, second version
Acronyms
TIinTarget Index months based on ENSO3.4 Indices from December 2000 to November 2023
HIinHistorically index months based on ENSO3.4 Indices from December 1950 to November 2000
Lag0No Lag applied to monthly Indices
Lag–5Five-month Lag applied to monthly Indices
PTrinTraining precipitation months from December 1950 to November 2000 (based on ENSO3.4 Indices)
PTsinTesting precipitation months from December 2000 to November 2023 (based on ENSO3.4 Indices)
KSSHansen–Kuipers Skill Score metric to evaluate seasonally overall model performance (nationwide scale)
HSSHeidke Skill Score metric to evaluate seasonally overall model performance (nationwide scale)
sPCSpatial Percent of Correct to evaluate locally (pixel scale) and seasonally the model performance
sBiasSpatial Bias to detect locally (pixel scale) and seasonally over/underestimation model performance
srhoSpearman Correlation to detect locally (pixel scale) and seasonally significant correlations (p ≤ 0.10)

References

  1. Wedgbrow, C.S.; Wilby, R.L.; Fox, H.R.; O’Hare, G. Prospects for seasonal forecasting of summer drought and low river flow anomalies in England and Wales. Int. J. Climatol. 2002, 22, 219–236. [Google Scholar] [CrossRef]
  2. NOAA—National Oceanic and Atmospheric Administration. National Centers for Environmental Information, Global Climate Reports: 2011, 2012, 2013, 2014, 2015, 2016. Available online: https://www.ncdc.noaa.gov/sotc/global/ (accessed on 5 July 2022).
  3. Conde, C.; Ferrer, R.; Orozco, S. Climate change and climate variability impacts on rain-fed agricultural activities and possible adaptation measures. A Mexican case study. Atmósfera 2006, 19, 181–194. [Google Scholar]
  4. CONAGUA/SMN-Comisión Nacional del Agua/Servicio Meteorológico Nacional, Seguimiento Mensual de Afectación por sequía. Available online: https://smn.conagua.gob.mx/tools/DATA/Climatología/Sequía/Monitor%20de%20sequía%20en%20America%20del%20Norte/sequia1211.pdf (accessed on 20 December 2022).
  5. SIAP-Sistema de Información Agroalimentaria y Pesquera, Anuario Estadístico de la Producción Agrícola 2011. Available online: https://nube.siap.gob.mx/cierreagricola/ (accessed on 10 November 2022).
  6. International Research Institute for Climate Prediction-IRI, IDB-ENSO Project IMPACTS. Available online: https://iri.columbia.edu/~idb_enso/luisbrito/Impacts.html#:~:text=Muchos%20países%20tomaron%20acciones%20preventivas,de%20600%20millones%20de%20dólares (accessed on 18 January 2022).
  7. Delgadillo, J.; Rodríguez, D.; Aguilar, T. Los aspectos económicos y sociales de El Niño. In Los Impactos de El Niño en México; Magaña, V., Ed.; Dirección General de Protección Civil, Secretaría de Gobernación: Ciudad de México, Mexico, 1999; pp. 181–210. [Google Scholar]
  8. Butler, A.H.; Polvani, L.M. El Niño, La Niña, and stratospheric sudden warmings: A reevaluation in light of the observational record. Geophys. Res. Lett. 2011, 38, L13807. [Google Scholar] [CrossRef]
  9. Vega-Camarena, J.P.; Brito-Castillo, L.; Pineda-Martínez, L.F.; Farfán, L.M. ENSO Impact on Summer Precipitation and Moisture Fluxes over the Mexican Altiplano. J. Mar. Sci. Eng. 2023, 11, 1083. [Google Scholar] [CrossRef]
  10. Hegyi, B.M.; Deng, Y. A Dynamical Fingerprint of Tropical Pacific Sea Surface Temperatures on the Decadal-Scale Variability of Cool-Season Arctic Precipitation. J. Geophys. Res. 2011, 116, D20121. [Google Scholar] [CrossRef]
  11. Di Lorenzo, E.; Cobb, K.M.; Furtado, J.; Schneider, N.; Anderson, B.; Bracco, A.; Alexander, M.A.; Vimont, D. Central Pacific El Niño and decadal climate change in the North Pacific. Nat. Geosci. 2010, 3, 762–765. [Google Scholar] [CrossRef]
  12. Yang, X.; DelSole, T. Systematic comparison of ENSO teleconnection patterns between models, observations. J. Clim. 2012, 25, 425–446. [Google Scholar] [CrossRef]
  13. Bell, C.J.; Gray, L.J.; Charlton-Perez, A.J.; Joshi, M.M.; Scaife, A.A. Stratospheric Communication of El Niño Teleconnections to European Winter. J. Clim. 2009, 22, 4083–4096. [Google Scholar] [CrossRef]
  14. Cagnazzo, C.; Manzini, E. Impact of the stratosphere on the Winter tropospheric teleconnections between ENSO and the North Atlantic and European Region. J. Clim. 2009, 22, 1223–1238. [Google Scholar] [CrossRef]
  15. Vicente-Serrano, S.M.; López-Moreno, J.I.; Gimeno, L.; Nieto, R.; Morán-Tejeda, E.; Lorenzo-Lacruz, J.; Beguería, S.; Azorin-Molina, C. A multiscalar global evaluation of the impact of ENSO on droughts. J. Geophys. Res. Atmos. 2011, 116, D20109. [Google Scholar] [CrossRef]
  16. Mendez-González, J.; Návar-Cháidez, J.D.J.; González-Rodríguez, H.; Treviño-Garza, E.J. Teleconexiones del fenómeno ENSO a la precipitación mensual en México. Cienc. UANL 2007, 10, 290–298. [Google Scholar]
  17. Adams, R.M.; Houston, L.L.; McCarl, B.A.; Tiscareño, M.; Matus, J.; Weiher, R.F. The benefits to Mexican agriculture of an El Niño-Southern Oscillation (ENSO) early warning system. Agric. For. Meteorol. 2003, 115, 183–194. [Google Scholar] [CrossRef]
  18. Corrales-Suastegui, A.; González-Jasso, L.A.; Narváez-Mendoza, M.P.; González González, M.A.; Ruiz Álvarez, O.; Maciel-Pérez, L.H. PronEst: Aplicación Informática para Generar Pronósticos Estacionales de Lluvias y Heladas de uno a Tres Meses, 1st ed.; Comité Editorial del CEPAB-INIFAP: Pabellón de Arteaga, Mexico, 2014; Folleto Técnico Núm. 62; pp. 1–21. ISBN 978-607-37-0381-9. [Google Scholar]
  19. Englehart, P.J.; Douglas, A.V. The role of eastern North Pacific tropical storms in the rainfall climatology of western Mexico. Int. J. Climatol. J. R. Meteorol. Soc. 2001, 21, 1357–1370. [Google Scholar] [CrossRef]
  20. Gay-García, C.; Hernández-Vazquez, J.; Jiménez-López, J.; Lezama-Gutiérrez, J.; Magaña-Rueda, V.M.; Morales-Acoltzi, T.; Orozco-Flores, S. Evaluation of Climatic forecasts of rainfall for the Tlaxcala State (Mexico): 1998–2002. Atmósfera 2004, 17, 127–150. [Google Scholar]
  21. Modaresi, F.; Ebrahimi, K.; Danandeh Mehr, A. A novel approach to predictor selection among large-scale climate Indices for seasonal rainfall forecasting in small catchments. Hydrol. Sci. J. 2024, 69, 488–505. [Google Scholar] [CrossRef]
  22. Qian, Q.; Jia, X.; Lin, H.; Zhang, R. Seasonal forecast of non monsoonal winter precipitation over the Eurasian continent using machine-learning models. J. Clim. 2021, 34, 7113–7129. [Google Scholar] [CrossRef]
  23. Yaseen, Z.M.; Ali, M.; Sharafati, A.; Al-Ansari, N.; Shahid, S. Forecasting standardized precipitation Index using data intelligence models: Regional investigation of Bangladesh. Sci. Rep. 2021, 11, 3435. [Google Scholar] [CrossRef]
  24. Lou, D.; Yang, M.; Shi, D.; Wang, G.; Ullah, W.; Chai, Y.; Chen, Y. K-Means and c4.5 decision tree-based prediction of long-term precipitation variability in the Poyang Lake basin China. Atmosphere 2021, 12, 834. [Google Scholar] [CrossRef]
  25. Feng, P.; Wang, B.; Liu, D.L.; Ji, F.; Niu, X.; Ruan, H.; Shi, L.; Yu, Q. Machine learning-based integration of large-scale climate drivers can improve the forecast of seasonal rainfall probability in Australia. Environ. Res. Lett. 2020, 15, 084051. [Google Scholar] [CrossRef]
  26. Sattari, M.T.; Shaker Sureh, F.; Kahya, E. Monthly precipitation assessments in association with atmospheric circulation Indices by using tree-based models. Nat. Hazards 2020, 102, 1077–1094. [Google Scholar] [CrossRef]
  27. Xiang, B.; Zeng, C.; Dong, X.; Wang, J. The application of a decision tree and stochastic forest model in summer precipitation prediction in Chongqing. Atmosphere 2020, 11, 508. [Google Scholar] [CrossRef]
  28. Wei, W.; Yan, Z.; Jones, P. A decision-tree approach to seasonal prediction of extreme precipitation in eastern China. Int. J. Climatol. 2020, 40, 255–272. [Google Scholar] [CrossRef]
  29. Wei, W.; Yan, Z.; Tong, X.; Han, Z.; Ma, M.; Yu, S.; Xia, J. Seasonal prediction of summer extreme precipitation over the Yangtze River based on random forest. Weather. Clim. Extrem. 2022, 37, 100477. [Google Scholar] [CrossRef]
  30. Saha, M.; Nanjundiah, R.S. Prediction of the ENSO and EQUINOO indices during June–September using a deep learning method. Meteorol. Appl. 2020, 27, e1826. [Google Scholar] [CrossRef]
  31. Begum, B.; Tajbar, S.; Khan, B.; Rafiq, L. Identification of relationships between climate Indices and precipitation fluctuation in Peshawar City-Pakistan. J. Res. Environ. Earth Sci. 2021, 10, 264–278. [Google Scholar]
  32. Ramírez-Carlos, B. Manual del Busca Ciclones, Versión 3.0. Subdirección de Riesgos Hidrometeorológicos. Sistema Nacional de Protección Civil Centro Nacional de Prevención de Desastres SEGOB-CENAPRED. 2017, pp. 1–12. Available online: https://www1.cenapred.unam.mx/COORDINACION_ADMINISTRATIVA/SRM/FRACCION_XLI_A/72.pdf (accessed on 3 December 2022).
  33. López-Cruz, A.; Soto-Pinto, L.; Salgado-Mora, M.G.; Huerta-Palacios, G. Simplification of the structure and diversity of cocoa agroforests does not increase yield nor influence frosty pod rot in El Soconusco, Chiapas, Mexico. Agrofor. Syst. 2021, 95, 201–214. [Google Scholar] [CrossRef]
  34. Perdigon-Morales, J.; Romero-Centeno, R.; Perez, P.O.; Barrett, B.S. The midsummer drought in Mexico: Perspectives on duration intensity from the CHIRPS precipitation database. Int. J. Climatol. 2018, 38, 2174–2186. [Google Scholar] [CrossRef]
  35. Corrales-Suastegui, A.; Fuentes-Franco, R.; Pavia, E.G. The mid-summer drought over Mexico and Central America in the 21st century. Int. J. Climatol. 2019, 40, 1703–1715. [Google Scholar] [CrossRef]
  36. Walkowiak, A.M.; Solana, E. Distribución Estacional De Lluvias En Baja California, México. Análisis De Probabilidades. Atmósfera 1989, 2, 209–218. [Google Scholar]
  37. Barnston, A.G.; Chelliah, M.; Goldenberg, S.B. Documentation of a highly ENSO-related SST region in the equatorial Pacific. Atmos.-Ocean. (Can. Meteorol. Oceanogr. Soc.) 1997, 35, 367. [Google Scholar]
  38. NOAA-National Oceanic and Atmospheric Administration. CPC-Climate Prediction Center, Monthly Atmospheric & SST Indices. Available online: https://www.cpc.ncep.noaa.gov/data/indices/ersst5.nino.mth.91-20.ascii (accessed on 10 January 2022).
  39. Livneh, B.; Bohn, T.J.; Pierce, D.S.; Munoz-Ariola, F.; Nijssen, B.; Cayan, D.; Vose, R.; Brekki, L.D. Development of a spatially comprehensive, daily hydrometeorological data set for Mexico, the conterminous U.S., and southern Canada 1950–2013. Nat. Sci. Data 2015, 2, 150042. [Google Scholar] [CrossRef]
  40. Funk, C.; Peterson, P.; Landsfeld, M.; Pedreros, D.; Verdin, J.; Shukla, S.; Husak, G.; Rowland, J.; Harrison, L.; Hoell, A.; et al. The climate hazards infrared precipitation with stations—A new environmental record for monitoring extremes. Sci. Data 2015, 2, 150066. [Google Scholar] [CrossRef] [PubMed]
  41. Fuentes-Franco, R.; Giorgi, F.; Pavia, E.G.; Graef, F.; Coppola, E. Seasonal precipitation forecast over Mexico based on a hybrid statistical–dynamical approach. Int. J. Climatol. 2018, 38, 4051–4065. [Google Scholar] [CrossRef]
  42. Magallanes-Quintanar, R.; Galván-Tejada, C.E.; Galván-Tejada, J.I.; Méndez-Gallegos, S.D.J.; García-Domínguez, A.; Gamboa-Rosales, H. Narx neural networks models for prediction of standardized precipitation Index in central Mexico. Atmosphere 2022, 13, 1254. [Google Scholar] [CrossRef]
  43. Magaña, V.O.; Vázquez, J.L.; Pérez, J.L.; Pérez, J.B. Impact of El Niño on precipitation in Mexico. Geofísica Int. 2003, 42, 313–330. Available online: https://www.redalyc.org/articulo.oa?id=56842304 (accessed on 2 May 2024). [CrossRef]
  44. Bravo, J.L.; Azpra, E.; Zarraluqui, V.; Gay, C. Some variations of the rainfall in Mexico City from 1954 to 1988 and their statistical significance. Atmósfera 2014, 27, 367–376. [Google Scholar] [CrossRef]
  45. Chen, Y.; Huang, X.; Luo, J.-J.; Lin, Y.; Wright, J.S.; Lu, Y.; Chen, X.; Jiang, H.; Lin, P. Prediction of ENSO using multivariable deep learning. Atmos. Ocean. Sci. Lett. 2023, 16, 100350. [Google Scholar] [CrossRef]
  46. Adams, D.K.; Comrie, A.C. The North American Monsoon. Bull. Am. Meteor. Soc. 1997, 78, 2197–2214. [Google Scholar] [CrossRef]
  47. Bravo-Cabrera, J.L.; Azpra-Romero, E.; Zarraluqui-Such, V.; Gay-García, C. Effects of El Niño in Mexico during rainy and dry seasons: An extended treatment. Atmósfera 2017, 30, 221–232. [Google Scholar] [CrossRef]
  48. Korecha, D.; Sorteberg, A. Validation of operational seasonal rainfall forecast in Ethiopia. Water Resour. Res. 2013, 49, 7681–7697. [Google Scholar] [CrossRef]
  49. Bhattacharya, T.; Chiang, J.C. Spatial variability and mechanisms underlying El Niño-induced droughts in Mexico. Clim. Dyn. 2014, 43, 3309–3326. [Google Scholar] [CrossRef]
  50. Andrade-Velázquez, M.; Medrano-Pérez, O.R. Precipitation patterns in Usumacinta and Grijalva basins (southern Mexico) under a changing climate. Rev. Bio Cienc. 2020, 7, 1–22. [Google Scholar] [CrossRef]
  51. Medrano-Pérez, O.R. Ciudades sobrecargadas: La sobreexplotación de recursos como limitante del desarrollo sustentable. Antipod. Rev. Antropol. Arqueol. 2020, 39, 3–12. [Google Scholar] [CrossRef]
  52. Campos, M.N.; Cárdenas, O.L.; Gaxiola, A.; González, G.E.G. Meteorological interaction between drought/oceanic indicators and rainfed maize yield in an arid agricultural zone in northwest Mexico. Arab. J. Geosci. 2020, 13, 131. [Google Scholar] [CrossRef]
  53. Montero-Martínez, M.J.; Pita-Díaz, O.; Andrade-Velázquez, M. Potential influence of the atlantic multidecadal oscillation in the recent climate of a small basin in Central Mexico. Atmosphere 2022, 13, 339. [Google Scholar] [CrossRef]
  54. Nguyen, P.L.; Min, S.K.; Kim, Y.H. Combined impacts of the El Niño-Southern Oscillation and Pacific decadal oscillation on global droughts assessed using the standardized precipitation evapotranspiration Index. Int. J. Climatol. 2021, 41, E1645–E1662. [Google Scholar] [CrossRef]
  55. Mijares-Fajardo, R.; Lobato-Sánchez, R.; Patiño-Gómez, C.; Guevara-Polo, D.E. Atlantic and Pacific Sea surface temperature correlations with precipitation over northern Mexico. Atmósfera 2024, 38, 217–234. [Google Scholar] [CrossRef]
  56. Crochemore, L.; Ramos, M.H.; Pappenberger, F. Bias correcting precipitation forecasts to improve the skill of seasonal streamflow forecasts. Hydrol. Earth Syst. Sci. 2016, 20, 3601–3618. [Google Scholar] [CrossRef]
  57. Manzanas, R.; Lucero, A.; Weisheimer, A.; Gutiérrez, J.M. Can bias correction and statistical downscaling methods improve the skill of seasonal precipitation forecasts? Clim. Dyn. 2018, 50, 1161–1176. [Google Scholar] [CrossRef]
  58. Manzanas, R.; Gutiérrez, J.M. Process-conditioned bias correction for seasonal forecasting: A case-study with ENSO in Peru. Clim. Dyn. 2019, 52, 1673–1683. [Google Scholar] [CrossRef]
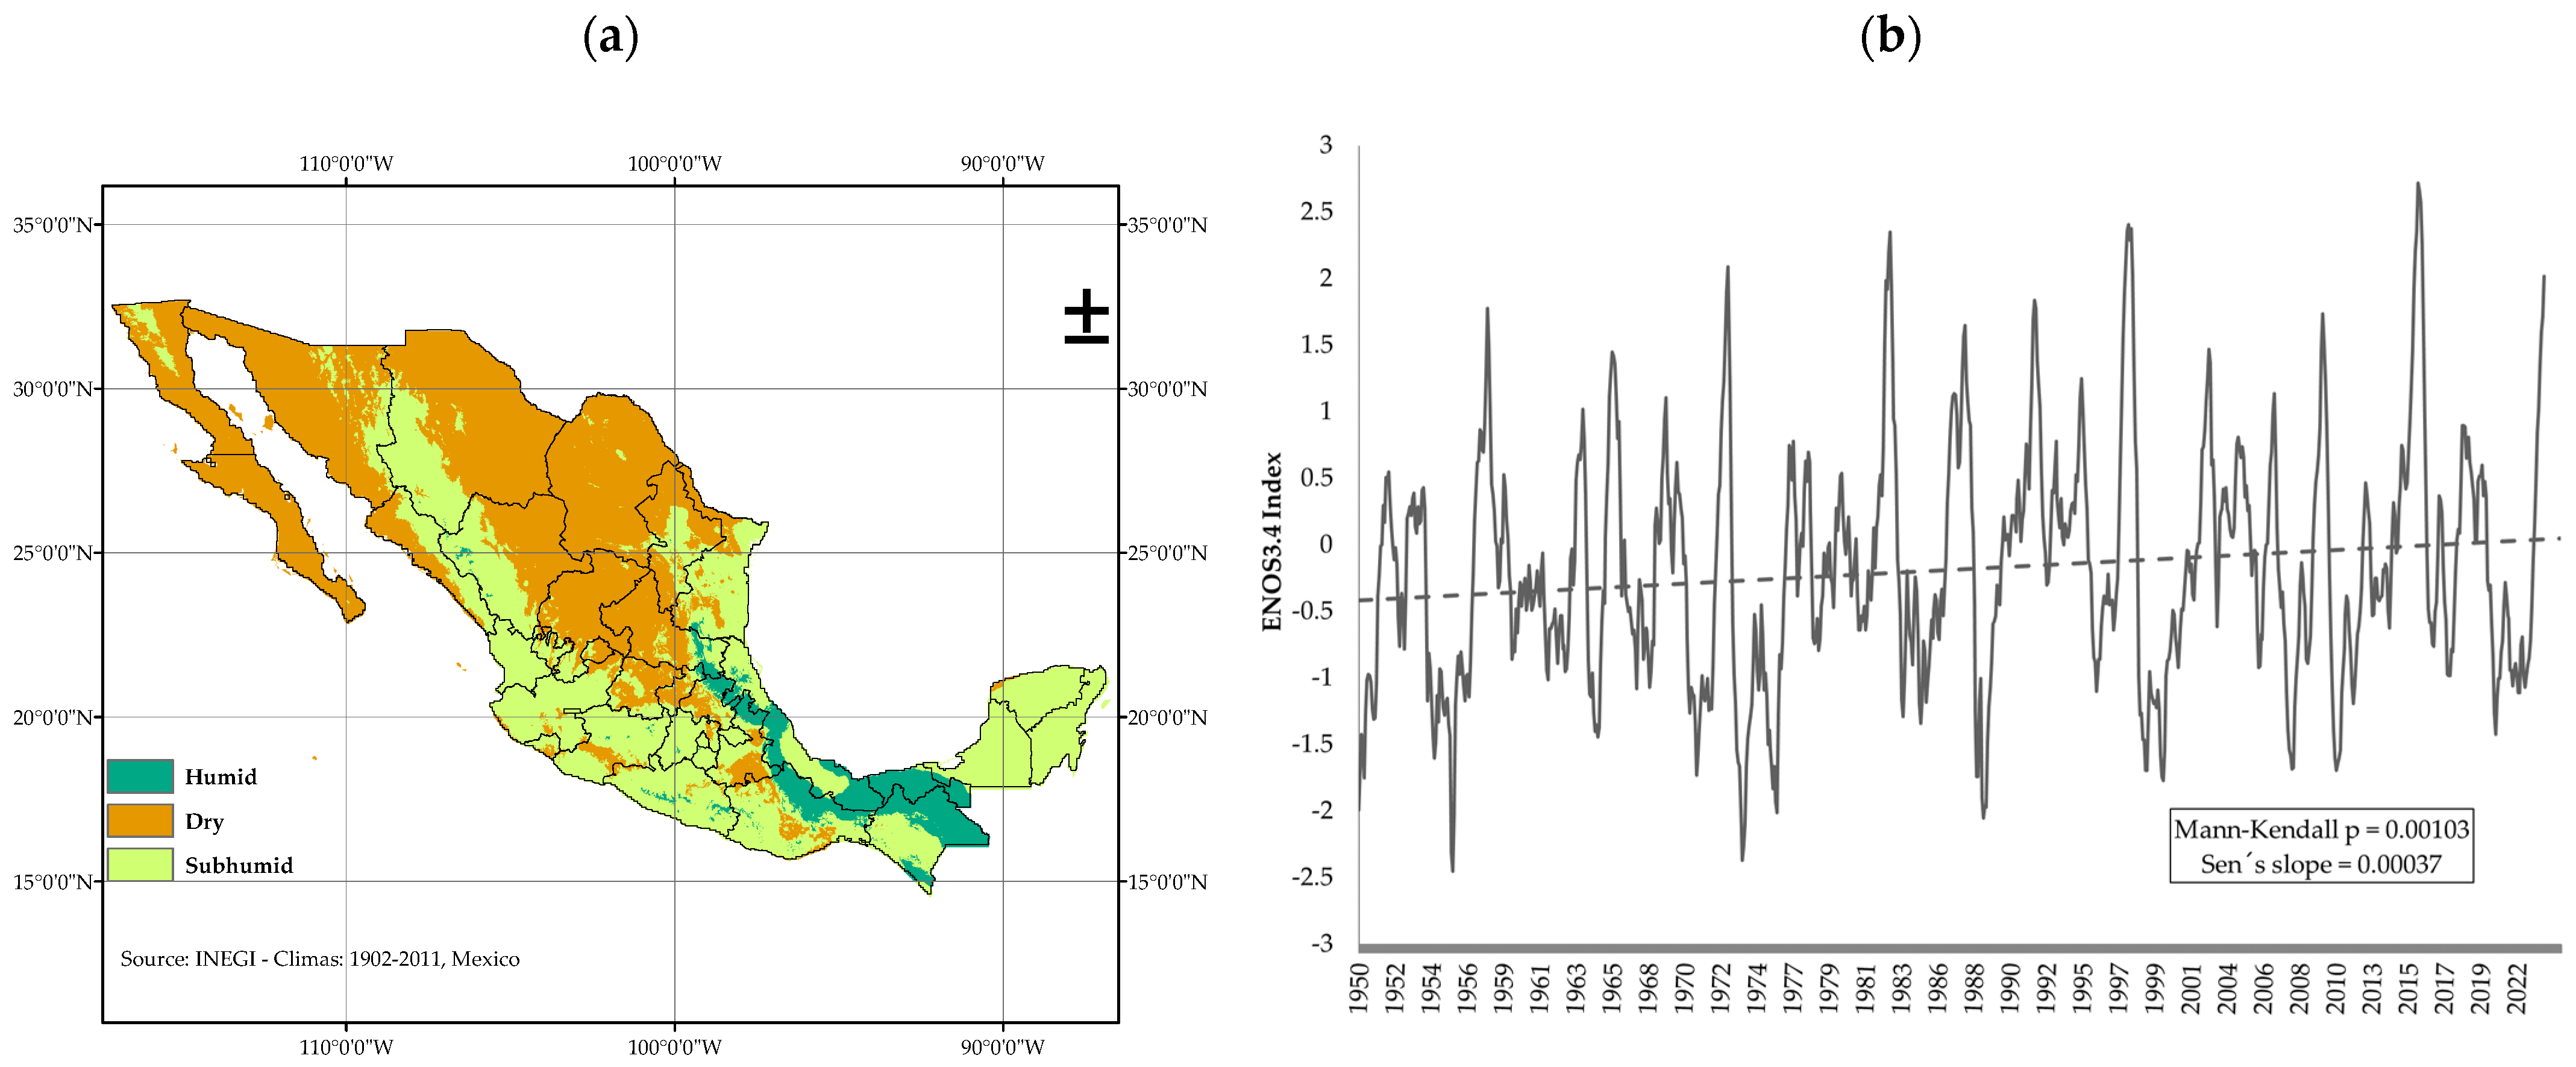
Figure 1. (a) Mexico’s type of humidity regime and (b) monthly historical ENSO3.4 Indices (1950–2023) and trend line (dotted line).
Atmosphere 15 00981 g001
Figure 2. Process to achieve spatial precipitation hindcasts using ENSO3.4 Indices and their comprehensive assessments.
Atmosphere 15 00981 g002
Figure 3. Similar months (y-axis) to compute each monthly hindcast (x-axis).
Atmosphere 15 00981 g003
Figure 4. Monthly Heidke Skill Score (HSS) for December 2000–November 2023 hindcasts and trend line (dotted line).
Atmosphere 15 00981 g004
Figure 5. National probability of detection (POD) for each precipitation category across seasons.
Atmosphere 15 00981 g005
Figure 6. Spatial percent of corrects (sPC) in (a) winter, (b) spring, (c) summer, and (d) fall; likewise, spatial Bias (sBias) in (e) winter, (f) spring, (g) summer, and (h) fall; and srho (spatial significant Spearman correlations p ≤ 0.10) in (i) winter, (j) spring, (k) summer, and (l) fall.
Atmosphere 15 00981 g006
Figure 7. Process for developing onwards precipitation outlooks, such as for the period from January 2025 to March 2025.
Atmosphere 15 00981 g007
Table 1. National and local metrics were used to assess the ENSO3.4 Index model approach.
NationalLocal
Hansen–Kuiper Skill Score (KSS)[Σp(f,o) − Σp(f)p(o)]/[1 − Σ(p(f)2]Spearman correlation (srho)1 − ((6Σd2)/(n3 − n))
Heidke Skill Score (HSS)[Σp(f,o) − Σp(f)p(o)]/[1 − Σp(f)p(o)]Percent of correct (sPC)hits/number of events
Probability of detection (POD)hits/hits+missesBias (sBias)forecast − observed
Mean Absolute ErrorΣ 1/n |forecast − observed|
Table 2. ENSO’s cool, neutral, and warm events for each season during the hindcast period from December 2000 to November 2023.
EventSeasons
DJFMAMJJASON
Cool2828131887
Neutral22244740133
Warm191791156
Table 3. National model efficiency for each season, employing the metrics: Hansen–Kuiper Skill Score (KSS), Heidke Skill Score (HSS), and Mean Absolute Error (MAE).
MetricSeasons
DJFMAMJJASON
KSS0.410.480.370.32
HSS0.400.450.370.31
MAE11135244
Disclaimer/Publisher’s Note: The statements, opinions and data contained in all publications are solely those of the individual author(s) and contributor(s) and not of MDPI and/or the editor(s). MDPI and/or the editor(s) disclaim responsibility for any injury to people or property resulting from any ideas, methods, instructions or products referred to in the content.