1. Introduction
The large-scale circulation in the atmospheres of planetary bodies is primarily driven by the horizontal gradient of the incident solar heat flux falling on the surface. The resulting meridional temperature contrast maintains poleward material and momentum transport from the warmer equatorial regions [
1]. On slowly rotating planets, such as Venus, these thermal boundary conditions lead to the emergence of single-cell meridional convection on each hemisphere. Faster spinning bodies, e.g., Earth, Mars, or Saturn’s largest moon, Titan, exhibit more complex forms of atmospheric circulation that are characterized by a larger number of overturning cells with alternating dominant meridional flow directions [
2].
The Rossby number
of such systems can be estimated as
, where
U is the typical flow (wind) velocity and
L denotes the relevant horizontal length scale, e.g., the radius of the planet.
quantifies the relative contribution of the Coriolis force to the flow and is proportional to the ratio of the rotation period
(i.e., the duration of a sidereal or “intertial” day) and the hydrodynamic timescale
. For
—as in the case of the planet Venus with
Earth days—the Coriolis effect is practically negligible, whereas in the
limit, it is dominant, yielding quasi-geostrophic flow. The order-of-magnitude estimates of
for the aforementioned planetary bodies are as follows:
,
,
, and
[
3].
A third timescale of relevance may be defined by the solar day (synodic rotation period)
of the given planet, i.e., the duration between two subsequent sunrises. In the cases of Mars or Earth—except for the polar regions in summer and winter—the sidereal day and solar day are practically the same (
). On these bodies, the solar day is also much shorter than the hydrodynamic timescale (
); hence, the diurnal temperature variations average out and do not affect the general character of the large-scale atmospheric circulation. In the case of Venus, however, which has a solar day of 117 Earth days, the situation is just the opposite (
), and the atmospheric dynamics are largely influenced by the slowly changing day–night thermal contrast. Moreover, the resulting thermal tide and the huge difference between its period and that of the sidereal day are found to be responsible for the so-called Eliassen–Palm momentum flux, which fuels the famous super-rotation of the Venusian upper atmosphere [
4].
Due to the obvious observation bias—as short-period phenomena are easier to observe in a limited measurement time frame than slowly changing ones—the vast majority of the over 5000 extrasolar planets (exoplanets for short) discovered and confirmed to date [
5] orbit very close to their host star, making their attitude necessarily tidally locked [
6]. Therefore, their orbital period (“year”) matches the duration of the sidereal day
T. These periods—typically ranging from a few days to a few weeks—are presumably short enough to yield small Rossby numbers,
, at which the Coriolis force has a profound effect on the planet’s atmospheric circulation. As a consequence of the tidal locking, the same hemisphere is always illuminated, rendering
. The existence of permanent day and night sides poses a unique thermal boundary condition: the flow may then be primarily driven by the zonal—and not the meridional—temperature gradient.
Although the Earth- and space-based telescopes of the present day are not yet capable of direct observations of the atmospheric circulation patterns on exoplanets, there already exists a rapidly increasing pool of works investigating conceptual numerical models of the flow states in such systems [
7]. Based on the data provided by instruments, such as the Kepler, TESS, and James Webb space observatories, it is possible to estimate the sidereal periods, the diameters, and—via spectroscopy—the compositions of exoplanet atmospheres [
8]. Moreover, the characteristic wind speeds
U of certain exoplanets have also been deduced from the observed Doppler shift and broadening of atmospheric spectral lines [
9]. With such empirical data on
U,
, and the length scale (planet radius)
L, the Rossby number
of the large-scale atmospheric circulation of an exoplanet can be estimated.
Once the relevant nondimensional parameters of the system can be determined, as well as the basic geometry of the setting and its boundary conditions, one may attempt to construct a minimalistic experimental model based on the principle of hydrodynamic similarity. Our objective was to create such an apparatus to explore the combined effect of the permanent zonal thermal contrast and rotation. For this purpose, we modified the differentially heated rotating annulus, a classic apparatus to study the basic large-scale dynamics of a mid-latitude atmosphere.
The traditional configuration (sketched in the left panel of
Figure 1) consists of a rotating annular gap whose inner sidewall is cooled and the outer one is heated; thus, the working fluid experiences a radial temperature gradient. These “traditional” thermal boundary conditions imitate the meridional differential incoming solar heat flux on the planet, and the key non-dimensional parameters can be set in the experiment to match those of actual planets.
These parameters are the aforementioned Rossby number
, and the Taylor number
, which quantifies the importance of inertial forces relative to viscous forces [
1]. Such laboratory settings have been widely used for over half a century since the pioneering works of David Fultz, Raymond Hide, and their respective groups [
10]; more recently, annulus experiments have proven to be useful test beds for the validation and benchmarking of numerical methods operational in weather forecasting [
11,
12], and they have contributed to the better understanding of temperature distribution transitions in our changing climate [
13,
14,
15].
Our modified configuration is sketched in the right panel of
Figure 1. In this version, the co-rotating heating and cooling boundary segments are both situated along the outer (“equatorial”) sidewall—indicated here with the same colors as in the left panel, i.e., red for heating and blue for cooling—yielding a “dipole-like” reflectional antisymmetry in the forcing, which represents the thermal contrast between the day and night sides. We explored the general character of the temperature field in this configuration, the emerging characteristic temperature difference in the flow at various values of
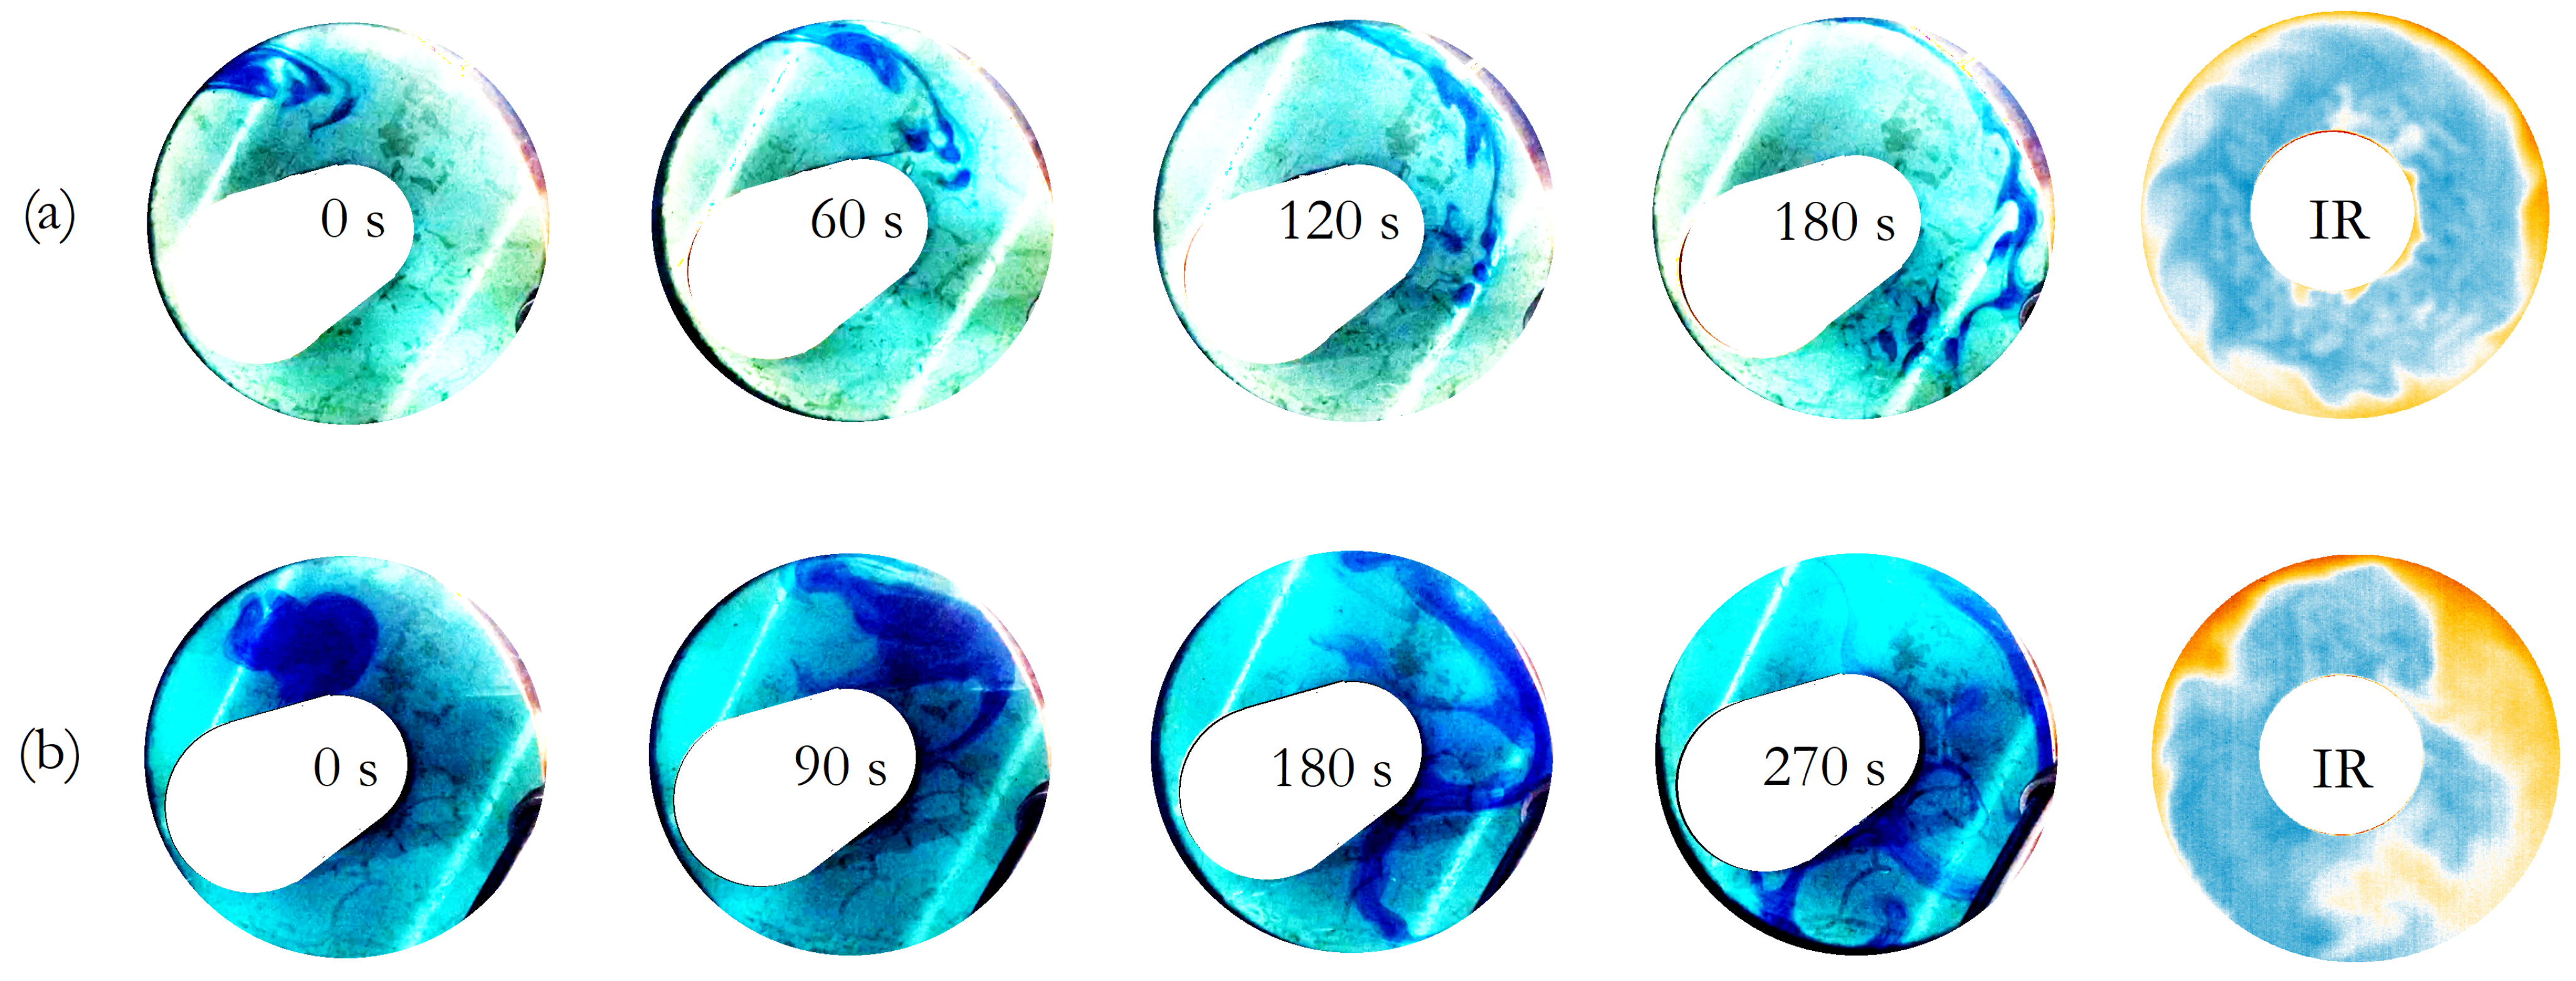
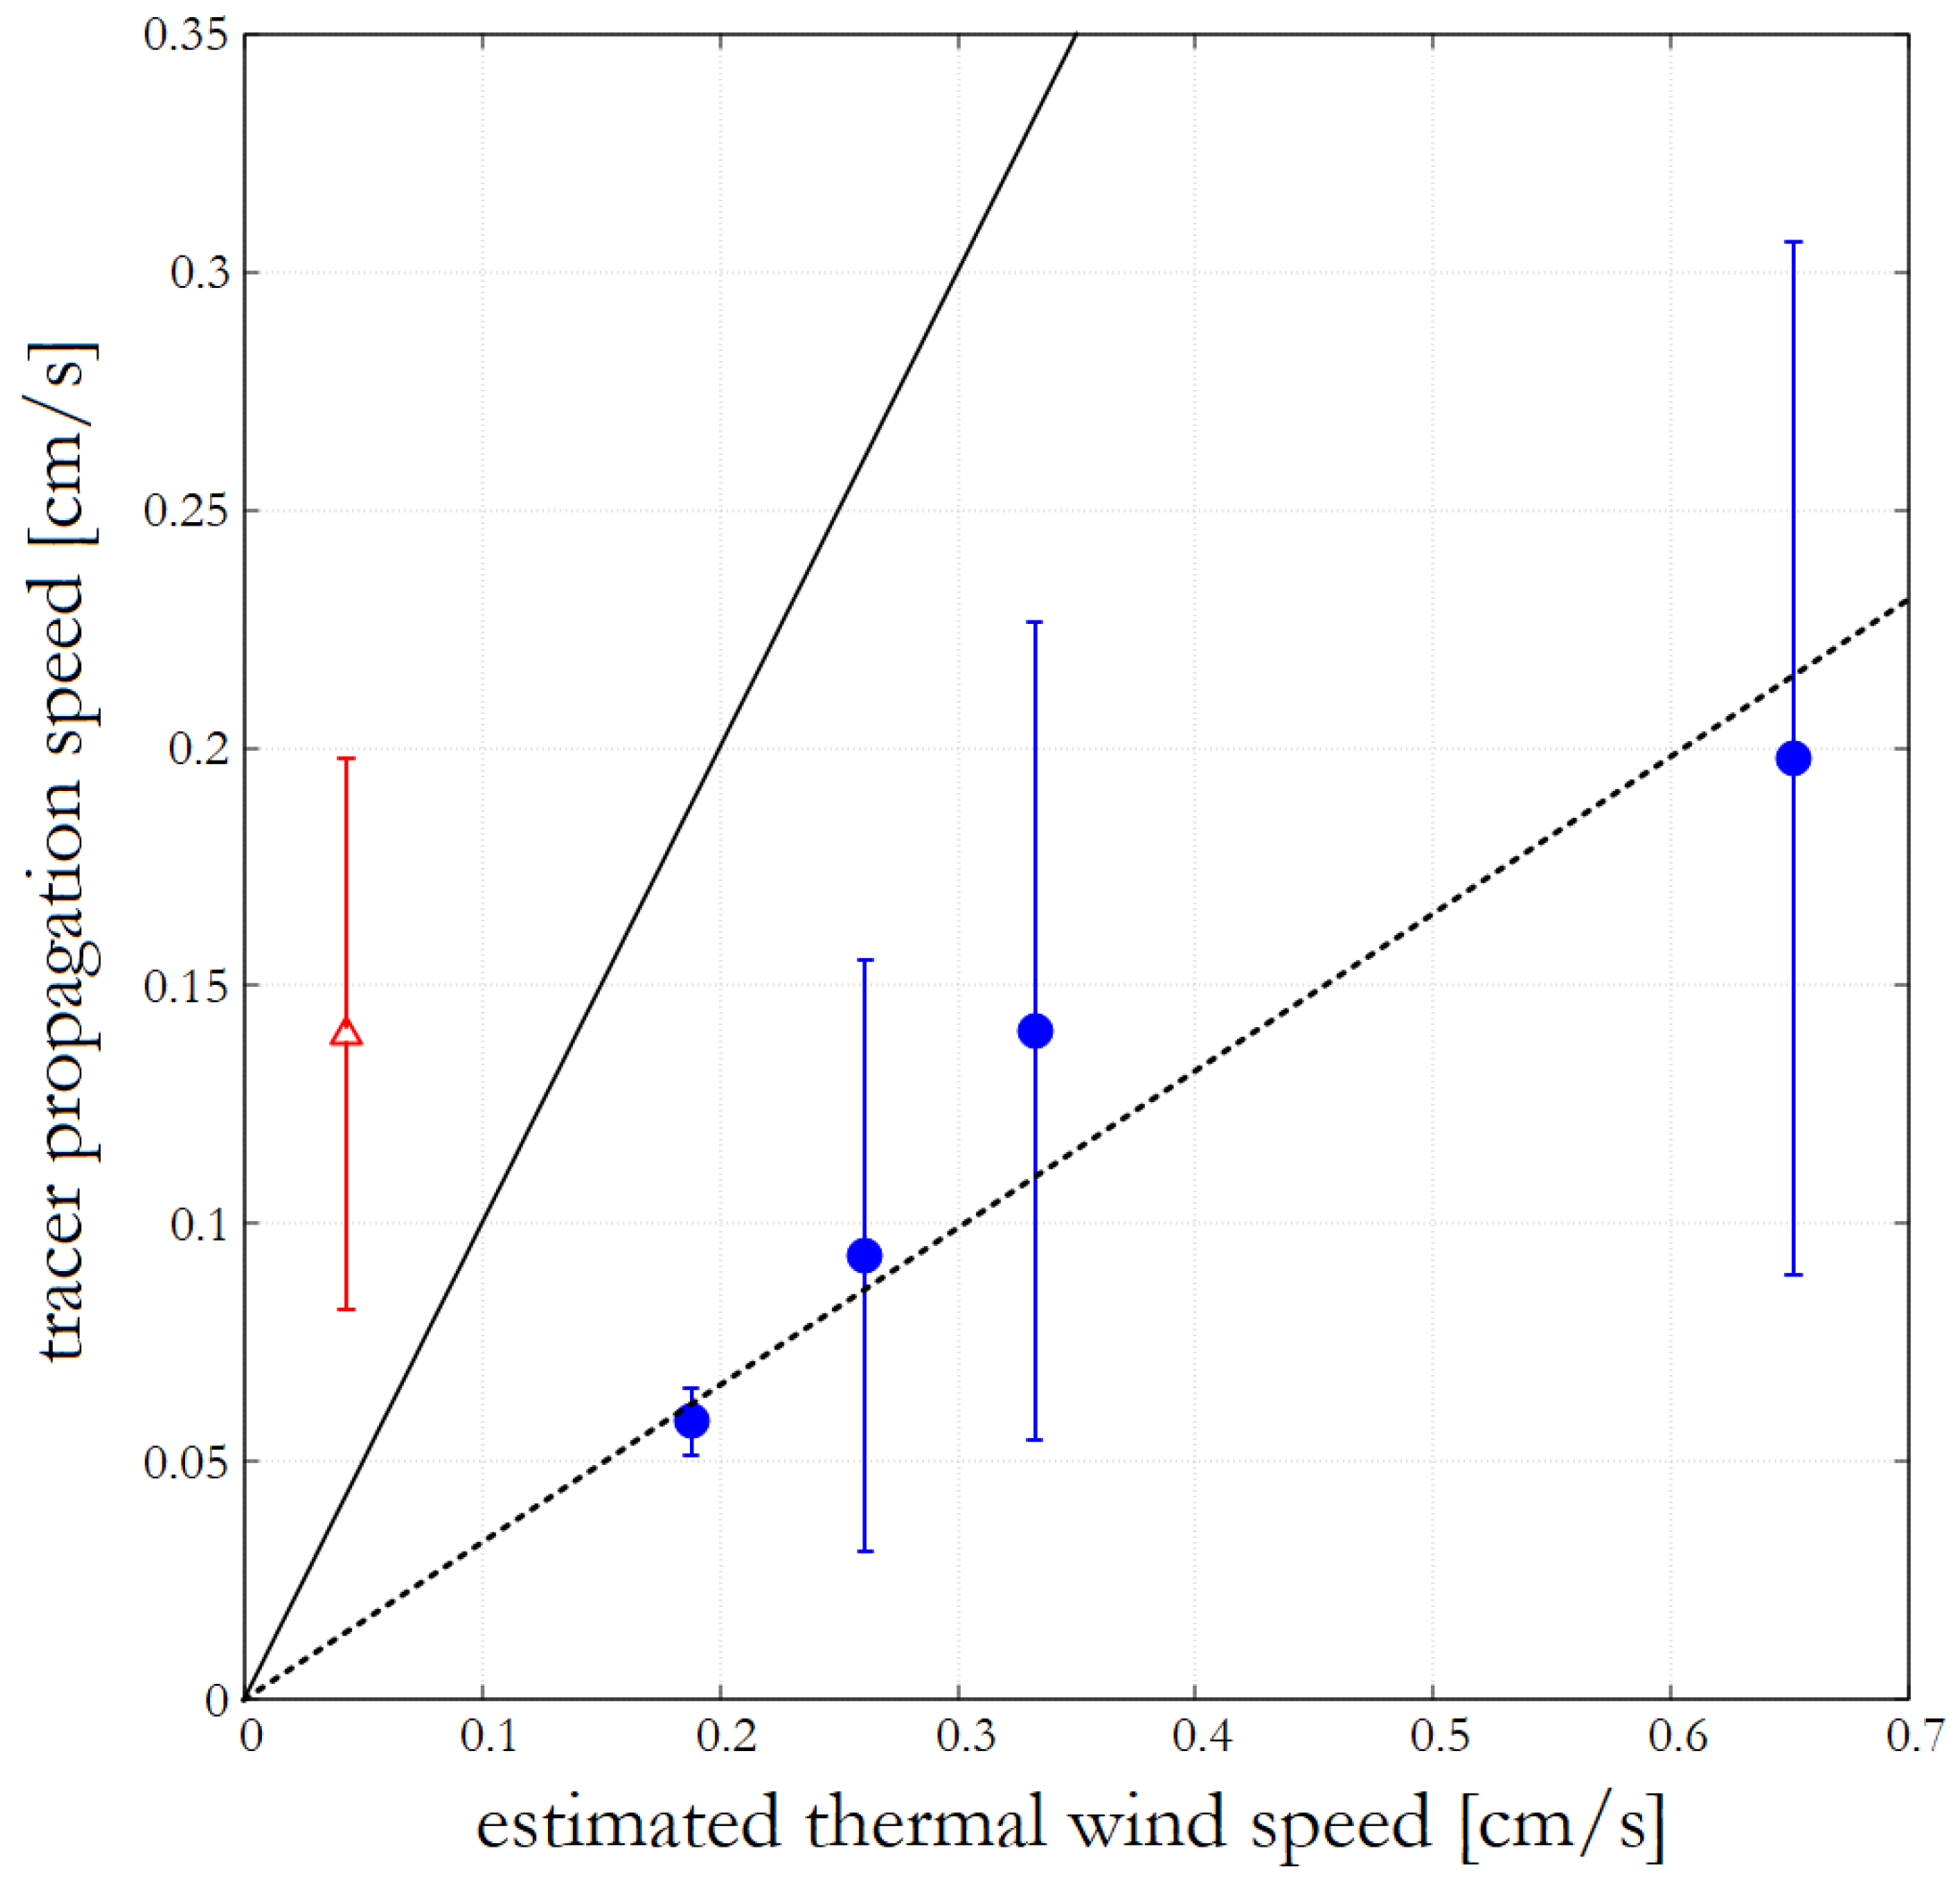
, the typical “wind” speeds in the system, and the propagation patterns of passive tracers.
This paper is organized as follows. In
Section 2, we describe our setup in detail and provide an overview of the applied data acquisition and evaluation methods. We present our results in
Section 3 and then discuss the broader implications of our findings in
Section 4.
2. Setup and Methods
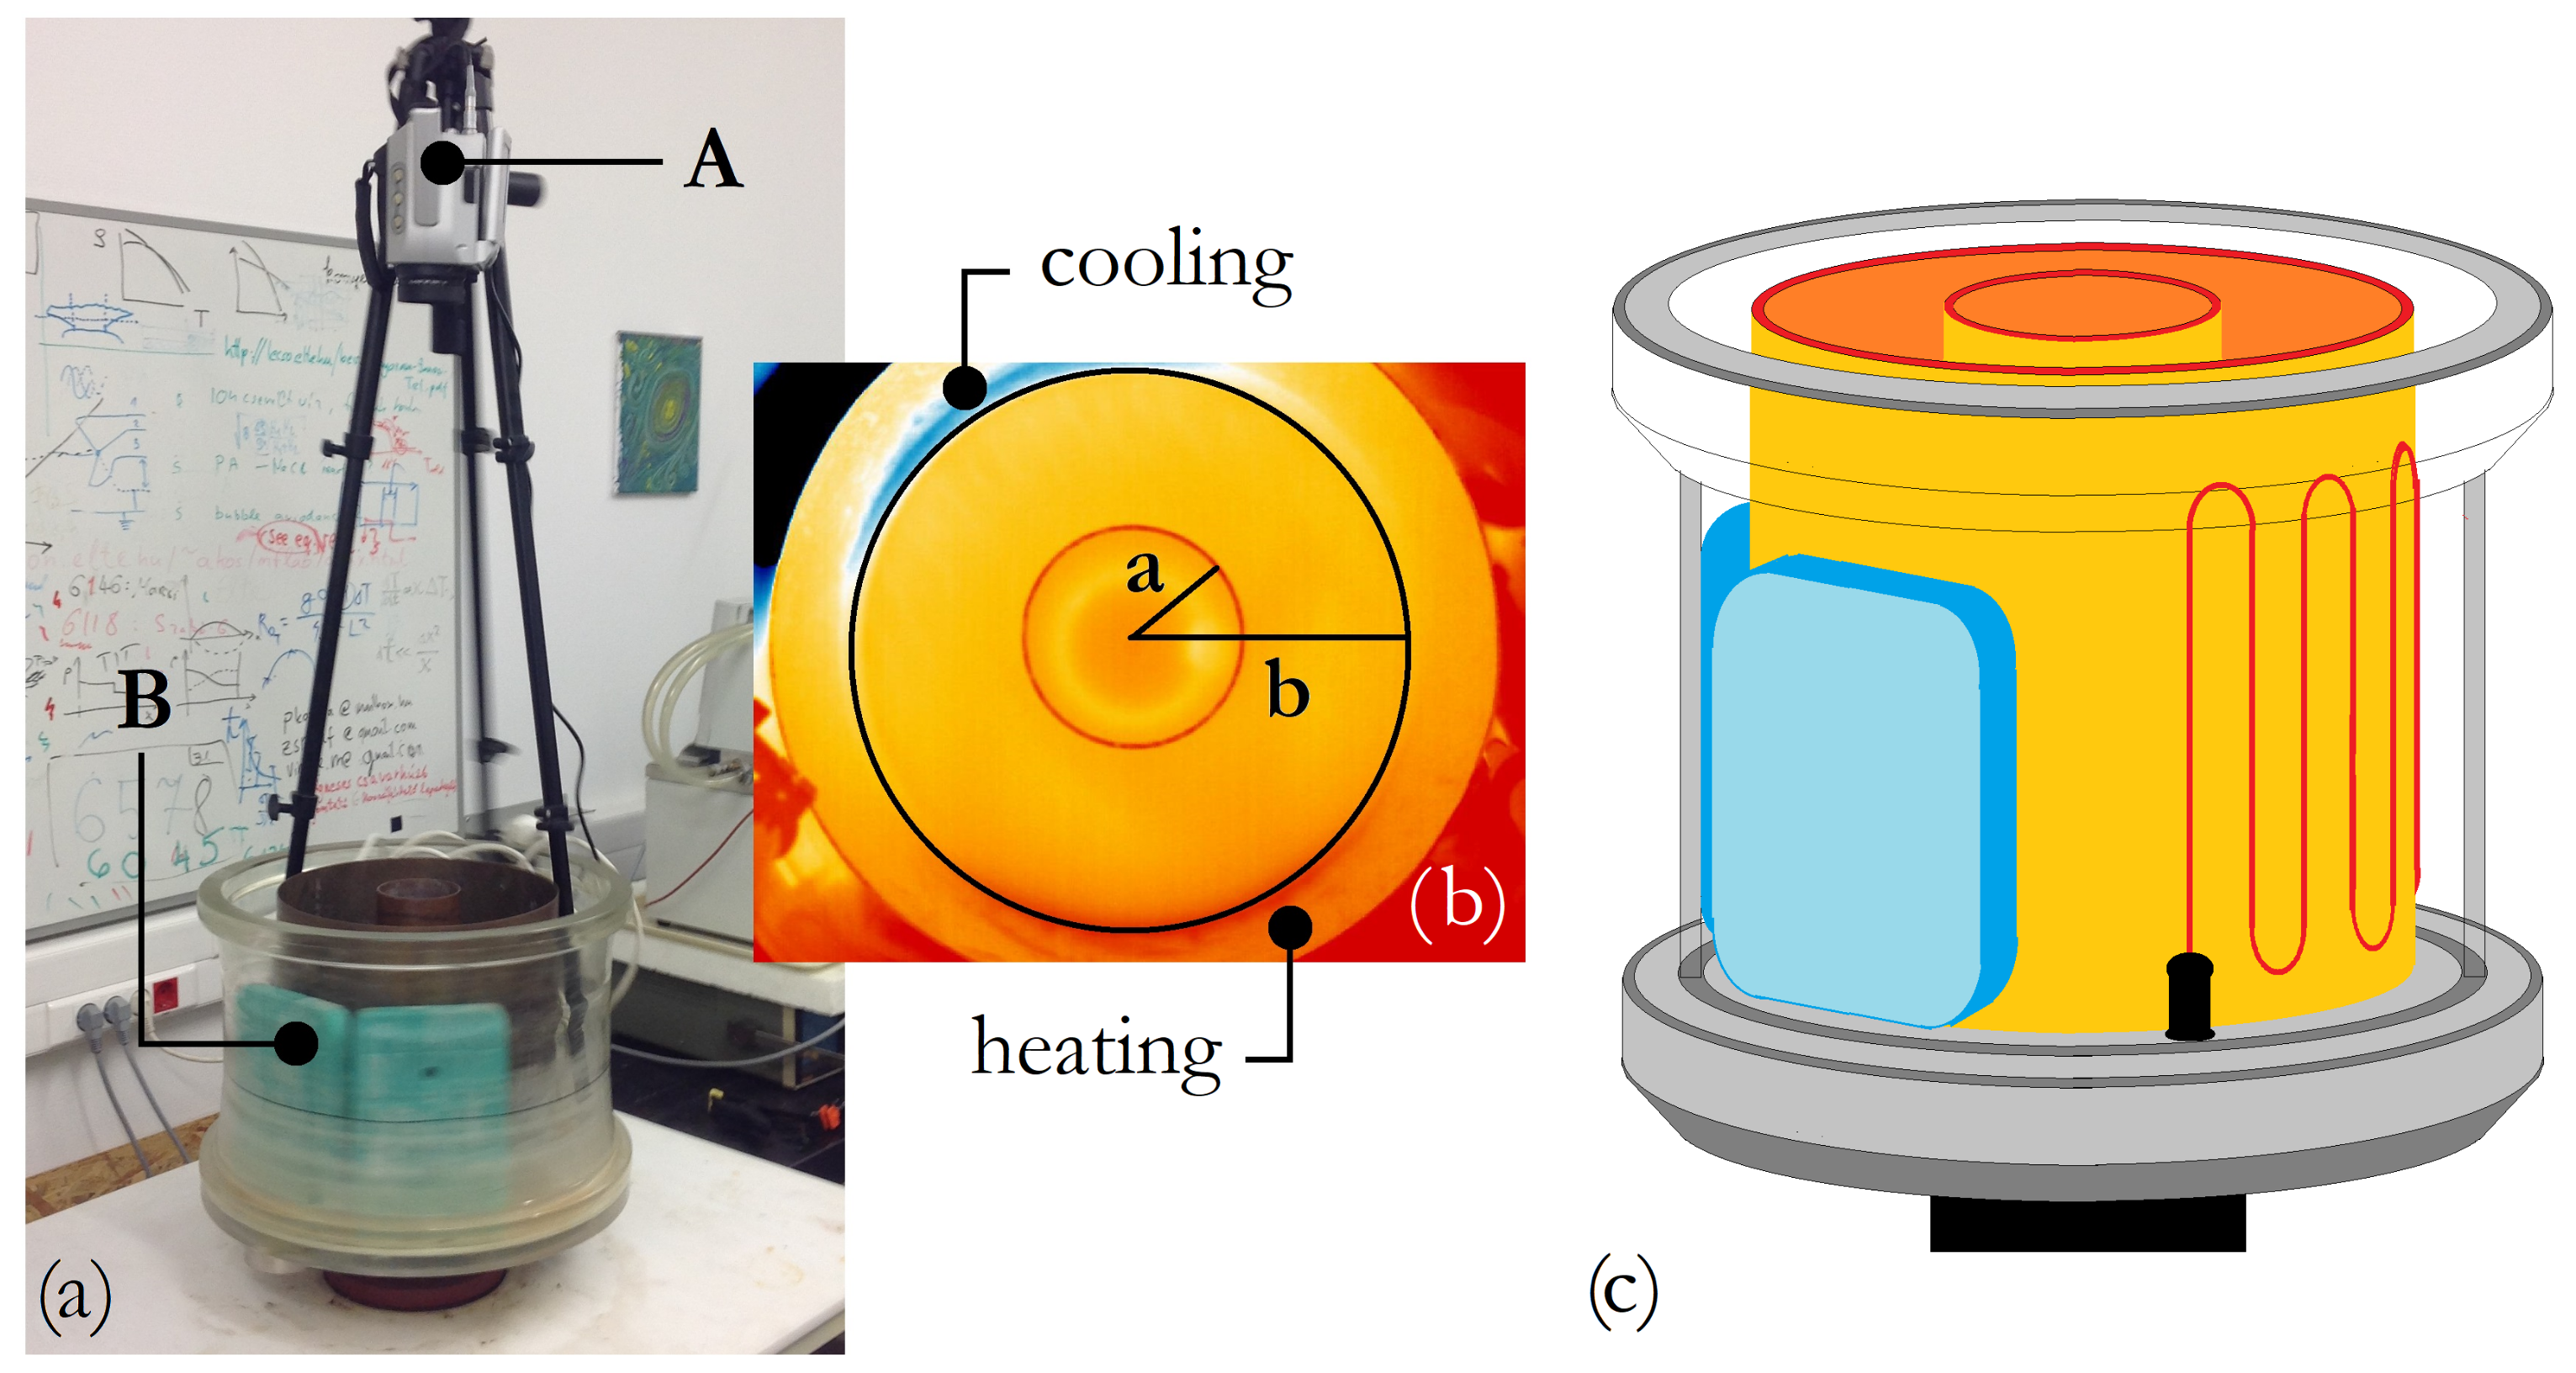
The layout of the experiment platform is shown in the photo of
Figure 2a. The rotating tank, mounted on a turntable, was separated into sections by 2 mm-thick co-axial cylindrical sidewalls made of copper. The working fluid (water) was placed into the annular gap between the inner cylinder (with a radius
a = 4.5 cm) and the outer rim (with a radius
b = 14.75 cm) (rendering the gapwidth as a characteristic length scale
cm). The water level was set to
cm in all performed experiment runs.
The baroclinic annulus of the von Kármán Laboratory (Eötvös University, Budapest) was modified for our measurements with the installation of electric heating elements—which are controlled by a thermostat—covering one half of the outer rim (as sketched in
Figure 1a) and cooling elements that are mounted on the opposite side (
Figure 2). The heating element consists of a fabric of heating wire wrapped around one side of the outer copper cylinder. The heating wire was attached to a co-rotating USB power source mounted on the rotating platform, and it was heated up to a maximum temperature of 75 °C (releasing a power of 2.5 W). This configuration is shown in red at the right hand side of the schematic of
Figure 2c. Cooling was facilitated by two removable commercially available plastic ice packs (shown in blue in
Figure 2), which were also placed onto the rotating platform so that they touched the copper sidewall at the opposing side. These cooling elements were filled with a mixture of water and propylene glycol and were initially cooled down to −17.5 °C in a laboratory freezer. The geometrical dimensions of the two ice packs were 22 cm × 15 cm × 2 cm. The bottom plate of the cylindrical rotating tank was made of a ca. 2 cm thick acrylic disk.
After setting the temperature boundary conditions and initiating rotation at the required angular velocity (ranging from 0.47 rad/s to 2.59 rad/s), we waited at least 30 min for the flow to develop before starting the data acquisition. We evaluated 16 experiment runs in total, corresponding to different settings of , and processed 58 infrared images and 5 video recordings of the developed flow.
The tank was left uncovered to facilitate the observation of water surface temperature fields and the sidewall temperatures using a thermal camera. A VarioCAM
® HR Inspect (680/30 mm) infrared imager (manufactured by InfraTec GmbH in Dresden, Germany) was mounted above the tank onto a co-rotating tripod facing downward, as shown in
Figure 2. The field of view—as seen in the non-rotating control image in
Figure 2b—of the acquired 640 pixel × 480 pixel thermograms covered the entire free water surface and the vertical outer rim in its vicinity with a thermal resolution of 0.01 °C (note that, due to perspective distortion of the camera looking into the tank from above, the vertical sidewalls were also captured above the water level).
The acquired infrared images were pre-processed using VarioCAM
® IRBIS
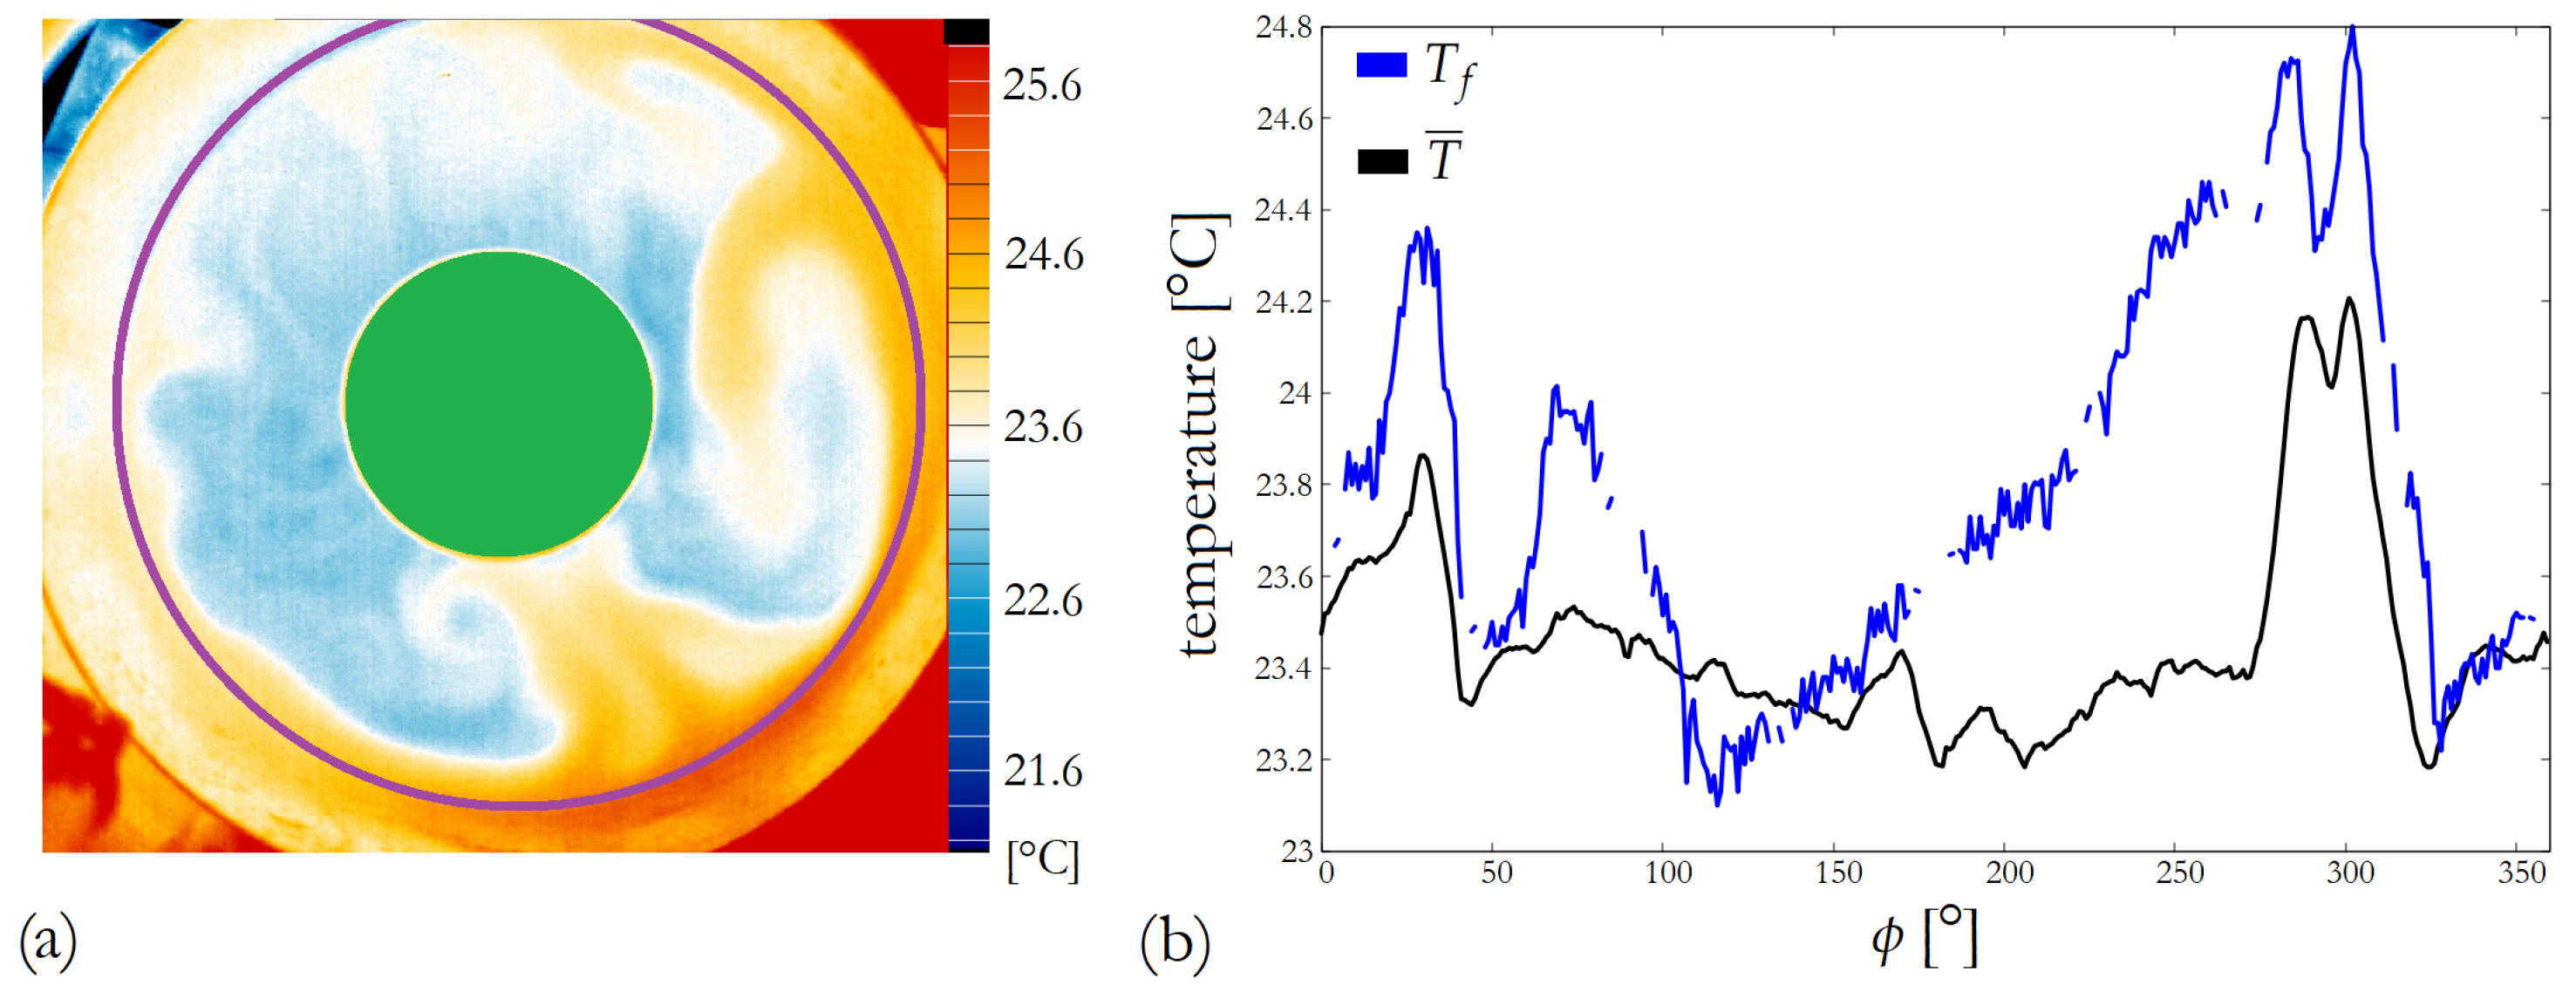
® 3 thermography software (created by InfraTec GmbH in Dresden, Germany). Then, one-dimensional temperature profiles as a function of the azimuthal angle
were extracted from each thermogram: one from the part that shows the “forcing temperature”
at the outer sidewall just above the water surface along a circular contour of radius
from the center (e.g., along the violet circle shown in
Figure 3a yielding the blue curve in Panel b); and the azimuthal profile
of the surface temperature field averaged over the gapwidth over the radial distances
(as shown in a black curve in
Figure 3b).
In a few runs, a co-rotating camera operating in the visual range (the CCD camera of an Apple iPad 2 tablet, manufactured by Foxconn Inc. in Shenzhen, China) was also installed onto the same tripod, capturing 1920 pixel × 1080 pixel frames of the water surface in time-lapse mode, i.e., at a 2 fps temporal resolution. In these experiments, blue food dye was injected manually from a syringe into the water, and the spreading of this passive tracer cloud in the flow was evaluated from the video recordings using the Tracker 6.0.9 video analysis tool [
16].
4. Discussion
In this pilot study, we performed laboratory experiments in a modified version of the differentially heated rotating annulus experiment, which—to the best of our knowledge—has never been conducted. Such experiments can be useful for exploring the large-scale atmospheric flows of given particular exoplanets once their relevant parameters of hydrodynamic similarity—e.g., the Rossby number —can be determined from observations.
Although the direct imaging of the weather in exoplanetary atmospheres seems to be out of reach with the astronomical instruments of the present and the near future, there already exist some promising results in determining the characteristic wind speeds of certain exoplanets from the shape and position of their spectral lines [
9]. The authors expect an explosive increase in such data in the foreseeable future now that the James Webb Space Telescope, launched in late 2021, is fully operational and can provide infrared spectra of exoplanetary atmospheres at an unprecedented clarity [
20].
In the present study, we intentionally focused on the Rossby number as this is the only relevant parameter combination that is expected to become accessible for a larger number of tidally locked exoplanets relatively soon (since planet diameter, rotation rate, and characteristic wind speeds are the only reasonably available quantities). It is to be noted, however, that—just as in the case of the traditional rotating annulus setting—other nondimensional parameters related to kinetic energy dissipation and measures of the effects of “eddy viscosity” and “eddy diffusivity”, e.g., Taylor, Rayleigh, or Ekman numbers, also affect the flows in rotating planetary atmospheres. Deducing these parameters—from spectral data only—seems to be rather challenging. From the measured atmospheric composition and relying on “educated guesses” based on known analogs—such as planetary bodies in our solar system—it may also become possible to address the viscosity-related aspects of these atmospheric circulations. It should be noted, however, that, in the present study, we did not intend to model an actual confirmed exoplanet but to explore the character of the flow in a wide range of in this thus-far-untried configuration as a preparation for targeted investigations in the future.
Regarding the scalability of the results from laboratory experiments to actual planets, it is important to emphasize that the Rossby number
can be considered the relevant (nondimensional) scale parameter in planetary atmospheres as long as the Coriolis effect plays a dominant role in the circulation. This practically implies that, in the
regime, the circulation patterns in a differentially heated rotating annulus setting are expected to resemble the ones of a real planet in a qualitative sense, as has been widely demonstrated for the case of Earth’s mid-latitude atmosphere throughout the rich history of rotating annulus experiments since the 1950s. However, for the
range (and above), other processes become more relevant, rendering the laboratory results less adequate. Also, it is only in the small-
regime that the assumption of thermal wind balance, which requires quasi-geostrophy for estimating wind speeds—as in Equation (
1)—is valid.
Furthermore, our minimalistic model is built on the approximation that the zonal (day–night) temperature contrast is the key boundary condition driving the circulation. However, this assumption does not necessarily hold for all exoplanets. Either varying surface albedos or a Venus-like dense atmosphere with a strong greenhouse effect can result in such conditions where the thermally driven circulation is driven primarily by, e.g., vertical or meridional temperature gradients instead, yielding very different flow states.
Another clear limitation of such experiments in general is that they are unable to capture the dynamics arising from the curvature of the spherical planetary body, which is first and foremost the so-called
-effect [
1], i.e., the latitude-dependence of the Coriolis force. It is well understood, for instance, that, in fast rotating planets, the (
)
-effect leads to the formation of zonal regions of alternating wind directions, as in the case of, e.g., the Hadley or Farrel cells of Earth or the spectacular stripes of Jupiter [
3]. In the absence of the
-effect—as in the “flat” experiment—such patterns cannot develop; hence, the flow in the experiment instead represents the dynamics of a zonal domain (a meridional overturning cell with thermal wind) of the atmosphere and whose actual width is set by the so-called Rhines scale [
1] of a real planet.
After mentioning these limitations, the question may arise in the reader of what data in this experimental setup (and the presented results) can contribute to a better understanding of real atmospheres that cannot be obtained via numerical simulations just as effectively. Indeed, a substantial pool of numerical analyses already exist in the atmospheric circulation of tidally locked exoplanets from general circulation models of varying complexity [
7]. However, since it is not possible to observe such systems at a resolution that facilitates the direct detection of atmospheric patterns, these numerical results cannot be tested and validated. Note that, in our solar system, there is no planet that is tidally locked to the Sun that could possible used as a test case. Laboratory experiments, on the other hand, can serve as test beds, and—despite the simplified geometry and boundary conditions—can provide certain benchmark settings with which the findings from simulations can be contrasted. Comparisons of this kind between the classic rotating annulus setting and numerical model results (in terms of, e.g., drift rates, and the general character of Rossby waves) have proven to be useful in the validation and fine tuning of terrestrial atmospheric circulation models; hence, they have already contributed to making weather forecasts more accurate [
11].

