Article

Mesospheric Ozone Depletion during 2004–2024 as a Function of Solar Proton Events Intensity

1
Faculty of Physics, St. Petersburg State University, 199034 St. Petersburg, Russia
2
Physikalisch-Meteorologisches Observatorium Davos/World Radiation Center (PMOD/WRC), 7260 Davos, Switzerland
*
Author to whom correspondence should be addressed.
Atmosphere 2024, 15(8), 944; https://doi.org/10.3390/atmos15080944
Submission received: 21 June 2024 / Revised: 1 August 2024 / Accepted: 2 August 2024 / Published: 6 August 2024
(This article belongs to the Special Issue Cosmic Rays, Ozone Depletion and Climate Change)

Abstract

:
Solar proton events (SPEs) affect the Earth’s atmosphere, causing additional ionization in the high-latitude mesosphere and stratosphere. Ionization rates from such solar proton events maximize in the stratosphere, but the formation of ozone-depleting nitrogen and hydrogen oxides begins at mesospheric altitudes. The destruction of mesospheric ozone is associated with protons with energies of about 10 MeV and higher and will strongly depend on the intensity of the flux of these particles. Most studies investigating the impact of SPEs on the characteristics of the middle atmosphere have been based on either simulations or reanalysis datasets, and some studies have used satellite observations to validate model results. We study the impact of SPEs on cold-season ozone loss in both the northern and southern hemispheres using Aura MLS mesospheric ozone measurements over the 2004 to 2024 period. Here, we show how strongly SPEs can deplete polar mesospheric ozone in different hemispheres and attempt to evaluate this dependence on the intensity of solar proton events. We found that moderate SPEs consisting of protons with an energy of more than 10 MeV and a flux intensity of more than 100 pfu destroy mesospheric ozone in the northern hemisphere up to 47% and in the southern hemisphere up to 33%. For both hemispheres, the peak of winter ozone loss was observed at about 76 km. In the northern hemisphere, maximum winter ozone loss was observed on the second day after a solar proton event, but in the southern hemisphere, winter ozone depletion was already detected on the first day. In the southern hemisphere, mesospheric ozone concentrations return to pre-event levels on the ninth day after a solar proton event, but in the northern hemisphere, even on the tenth day after a solar proton event, the mesospheric ozone layer may not be fully recovered. The strong SPEs with a proton flux intensity of more than 1000 pfu lead to a maximum winter ozone loss of up to 85% in the northern hemisphere, and in the southern hemisphere winter, ozone loss reaches 73%.

1. Introduction

Our planet’s atmosphere and ionosphere are constantly bombarded with energetic charged particles coming from the Sun, space, and the Earth’s magnetosphere, collectively known as energetic precipitating particles. Energetic precipitating particles (EPPs) are mostly protons and electrons of solar, space, or magnetospheric origins. Such EPPs can be auroral and radiation belt electrons, and protons of solar and galactic origins. The EPPs are considered to play an important role contributing to the natural forcing of the polar middle atmosphere, e.g., [1,2,3,4,5,6]. Precipitating particles collide with molecules of air and induce increasing atmospheric ionization rates (formation of ion pairs per second), e.g., [7,8,9,10,11]. The ionization rate induced by EPPs affects excitation, dissociation, and recombination processes, as well as chemical reactions, and ultimately affects the ionospheric electron density, global electrical circuit, and leads to ozone depletion., e.g., [12,13,14,15,16,17].
The ionization of neutral molecules by energetic particles activates chains of complex ionic reactions, which ultimately produce such important products for atmospheric chemistry as nitrogen and hydrogen oxides. The odd hydrogen group (or family of hydrogen-containing radicals HOx) includes hydrogen (H), hydroxyl (OH), and hydroperoxide (HO2) [18]. The lifetime of such radicals is short (minutes). Interacting with mesospheric ozone, HOx radicals participate in chains of rapid reactions at altitudes between about 60 and 80 km. However, there are longer-lived chemical families, such as the nitrogen group NOy which includes the following constituents: N, NO, NO2, NO3, HNO3, HNO4, ClNO3, N2O5 [19]. Since elements of this group survive longer (hours and months in polar night conditions) [19], they are subject to movement by air currents and being transported to the stratosphere can lead to stratospheric ozone depletion.
Ozone destruction in the mesosphere occurs through catalytic cycles. Components of the HOx and NOx (N, NO, NO2) families are involved in chains of chemical reactions leading to the destruction of mesospheric ozone. The main catalytic reactions with NOx lead to the destruction of ozone: N O + O 3 = N O 2 + O 2 and N O 2 + O = N O + O 2 O 3 + O = 2 O 2 . The catalytic reactions with odd hydrogen HOx that is also an effective catalyst for the destruction of O 3 , especially in the mesosphere: O H + O 3 = H O 2 + O 2 and H O 2 + O = O H + O 2 O 3 + O = 2 O 2 .
There are many papers showing that the EPPs forcing via the production of ion pairs impacts middle atmosphere chemistry and causes ozone depletion, e.g., [2,3,20,21,22,23].
Seppälä et al. [24] exploited the 1-D model and indicated for the first time that the enhanced ionization from a series of substorms leads to an ozone loss of 5–50% in the mesosphere depending on the season. The estimation of polar ozone depletion under energetic electron precipitation on solar cycle timescales was conducted by Andersson et al. [25], where it was shown that energetic electrons can lead to short-term ozone depletion up to 90% and over solar cycle of up to 34% at about 80 km. The dependence of the ozone destruction in the northern hemisphere under energetic electron precipitation on the level of geomagnetic disturbances and seasons was studied by Mironova et al. [26]. On a year scale, it was found that, in wintertime, the maximum short-term ozone depletion, at an altitude of about 80 km, can reach up to 80% during strong geomagnetic disturbances with a Kp of more than 5. In fall and spring, the maximum short-term ozone depletion is less intense and can reach 20% during strong geomagnetic activities. Regardless of the season, the geomagnetic disturbances lead to short-term ozone mesospheric depletion from about 5% to 35% with Kp varying from about 3 to 5. The paper [26] showed that, despite the intensity of energetic electron precipitation, polar mesospheric ozone is not destroyed in the summer due to the presence of UV radiation.
Jackman et al. [15,27,28] have conducted numerous studies assessing short-term ozone depletion after solar proton events (SPEs). In the paper [27], it was demonstrated that one strong solar proton event can lead to short-term ozone depletion up to 40% in the polar lower mesosphere. In the paper [15], it was found that mesospheric ozone decreased by over 30% during SPEs of August 1972; October 1989; July 2000; and October–November 2003. Over 1–2 days in January and March 2012 during SPE periods, mesospheric ozone decreased by more than 20% for several days in the northern polar region [28].
It is well known that the ionization rate during solar proton events maximizes in the stratosphere [3]; however, at mesospheric altitudes, the formation of ozone-depleting nitrogen and hydrogen oxides and catalytic ozone destruction of mesospheric ozone also takes place.
In this paper, we study the wintertime ozone depletion in the mesosphere as a function of the intensity of solar proton precipitation flux with particle energies of more than 10 MeV during SPEs for the long period of Aura MLS ozone observations from July 2004 until June 2024.

2. Data, Methods, and Results

2.1. Solar Proton Events Registration

SPEs are associated with fast powerful energy release phenomena such as solar flares and coronal mass ejections. The intensity of solar proton events depends on the solar eruption strength during coronal mass ejections and solar flares. Solar proton events appear most often during the maximum of solar cycles; however, there is no consistent pattern in the distribution of solar proton events throughout each cycle. Although the elemental composition of solar cosmic rays changes from one event to another, it is dominated by protons [29]. The energy spectrum of solar cosmic rays covers more than four orders of magnitude in energy and more than ten orders of magnitude in intensity [3,30]. SPEs with energies below several hundred MeV are well-measured onboard numerous spacecraft.
The NOAA Space Weather Prediction Center (SWPC) collects solar proton events regularly using the data from geostationary GOES (Geosynchronous Operational Environmental Satellite) from 1976 to the present. The dataset includes proton flux information, which integrates 5 min averages for energies more than 10 MeV, given in particle flux units (pfu or number of particles per cm−2 sr−1 s−1).
In our study, we separate solar proton events depending on the particle flux intensity into events with a proton flux intensity of more than 100 pfu and strong events with flux of more than 1000 pfu. According to NOAA solar radiation storm classification, we consider strong and moderate solar proton events (see for more details https://www.swpc.noaa.gov/noaa-scales-explanation (accessed on 1 August 2024)). Moderate solar proton events are recorded approximately 25 times per solar cycle, and strong SPEs occur about 10 times per cycle.

2.2. Aura MLS Ozone Observation

The Earth Observing System (EOS) Microwave Limb Sounder (MLS) is an instrument on NASA’s Aura spacecraft, launched in July 2004. AURA is in a quasi-polar sun-synchronous orbit at an altitude of 705 km. MLS registers millimeter and sub-millimeter wavelength thermal emissions, vertically scanning Earth’s limb in the orbit plane to give daily near-global (82 SH–82 NH latitude) coverage, with 15 orbits per day, taking measurements during both day and night. One of the important MLS retrieval products is ozone.
In our study, we consider the latest (version 5) MLS O3 measurements with increased vertical range for ozone and some other species [31]. A new version of data retrievals has better quality of the O3, H2O, and CO retrieval in the upper mesosphere. The recommended pressure range for scientific investigation is from 261 hPa to 0.001 hPa. Preliminary research has shown that the improvements are sufficient to increase the vertical range recommended for scientific use (see for more details https://mls.jpl.nasa.gov/data/v5-0_data_quality_document.pdf (accessed on 1 August 2024)).

2.3. Superposed Epoch Analysis

We separated the solar proton events from 2004 to 2024 into two groups based on their association with the intensity of proton fluxes for energies more than 10 MeV given in particle flux units. The first group includes moderate SPEs with an intensity of proton flux more than 100 pfu. The strong SPEs (with more than 1000 pfu) were assigned to the second group.
Aura MLS ozone altitudinal profiles were considered in the pressure range of 0.002–0.1 hPa over polar latitude bands 60–80 NH and 60–80 SH.
Superposed epoch analysis was conducted within each group separately to obtain averaged information on how the magnitudes of solar proton events and ozone depletion in the upper mesosphere are related. The starting day of the SPEs was set when the observed solar proton flux exceeded 10 MeV energy. The effect of SPEs on instantaneous mesospheric ozone depletion during the winter season is studied separately for the southern and northern hemispheres. To estimate the ozone depletion magnitude, we considered the percentage of the maximum ozone deviation after the day of a solar proton event.
Since SPEs can last for hours or days, and periods of solar proton precipitation can be associated with several separate coronal mass ejections, it becomes necessary to separate the events. For superposed epoch analysis, it was important to select a 15-day period (5 days before the event, 10 days after) during which there were no other events, to ensure that the effects of two events did not overlap, so events with intervals of less than 10 days between them and other events were excluded from consideration.

2.4. Results

The response of the atmosphere to EPPs varies depending on atmospheric conditions and availability of solar UV radiation that depends on the solar zenith angle (SZA) [26,28]. Since UV radiation affects the atmospheric state, the effects in the atmosphere caused by SPEs strongly depend on SZA. SPEs’ impact on HOx and NOx production leads to different ozone responses during the same months of the year in both hemispheres. This means that variations in mesospheric ozone depending on the SPEs will differ in the summer and winter months.
For our study, SPEs with a proton flux intensity of more than 100 pfu were selected and these SPEs are presented in Table 1 and Table 2. Table 1 includes solar proton events that took place from September to March 2004–2024 and Table 2 includes SPEs that took place from April to August 2004–2024. The SPE selection is described in Section 2.3.
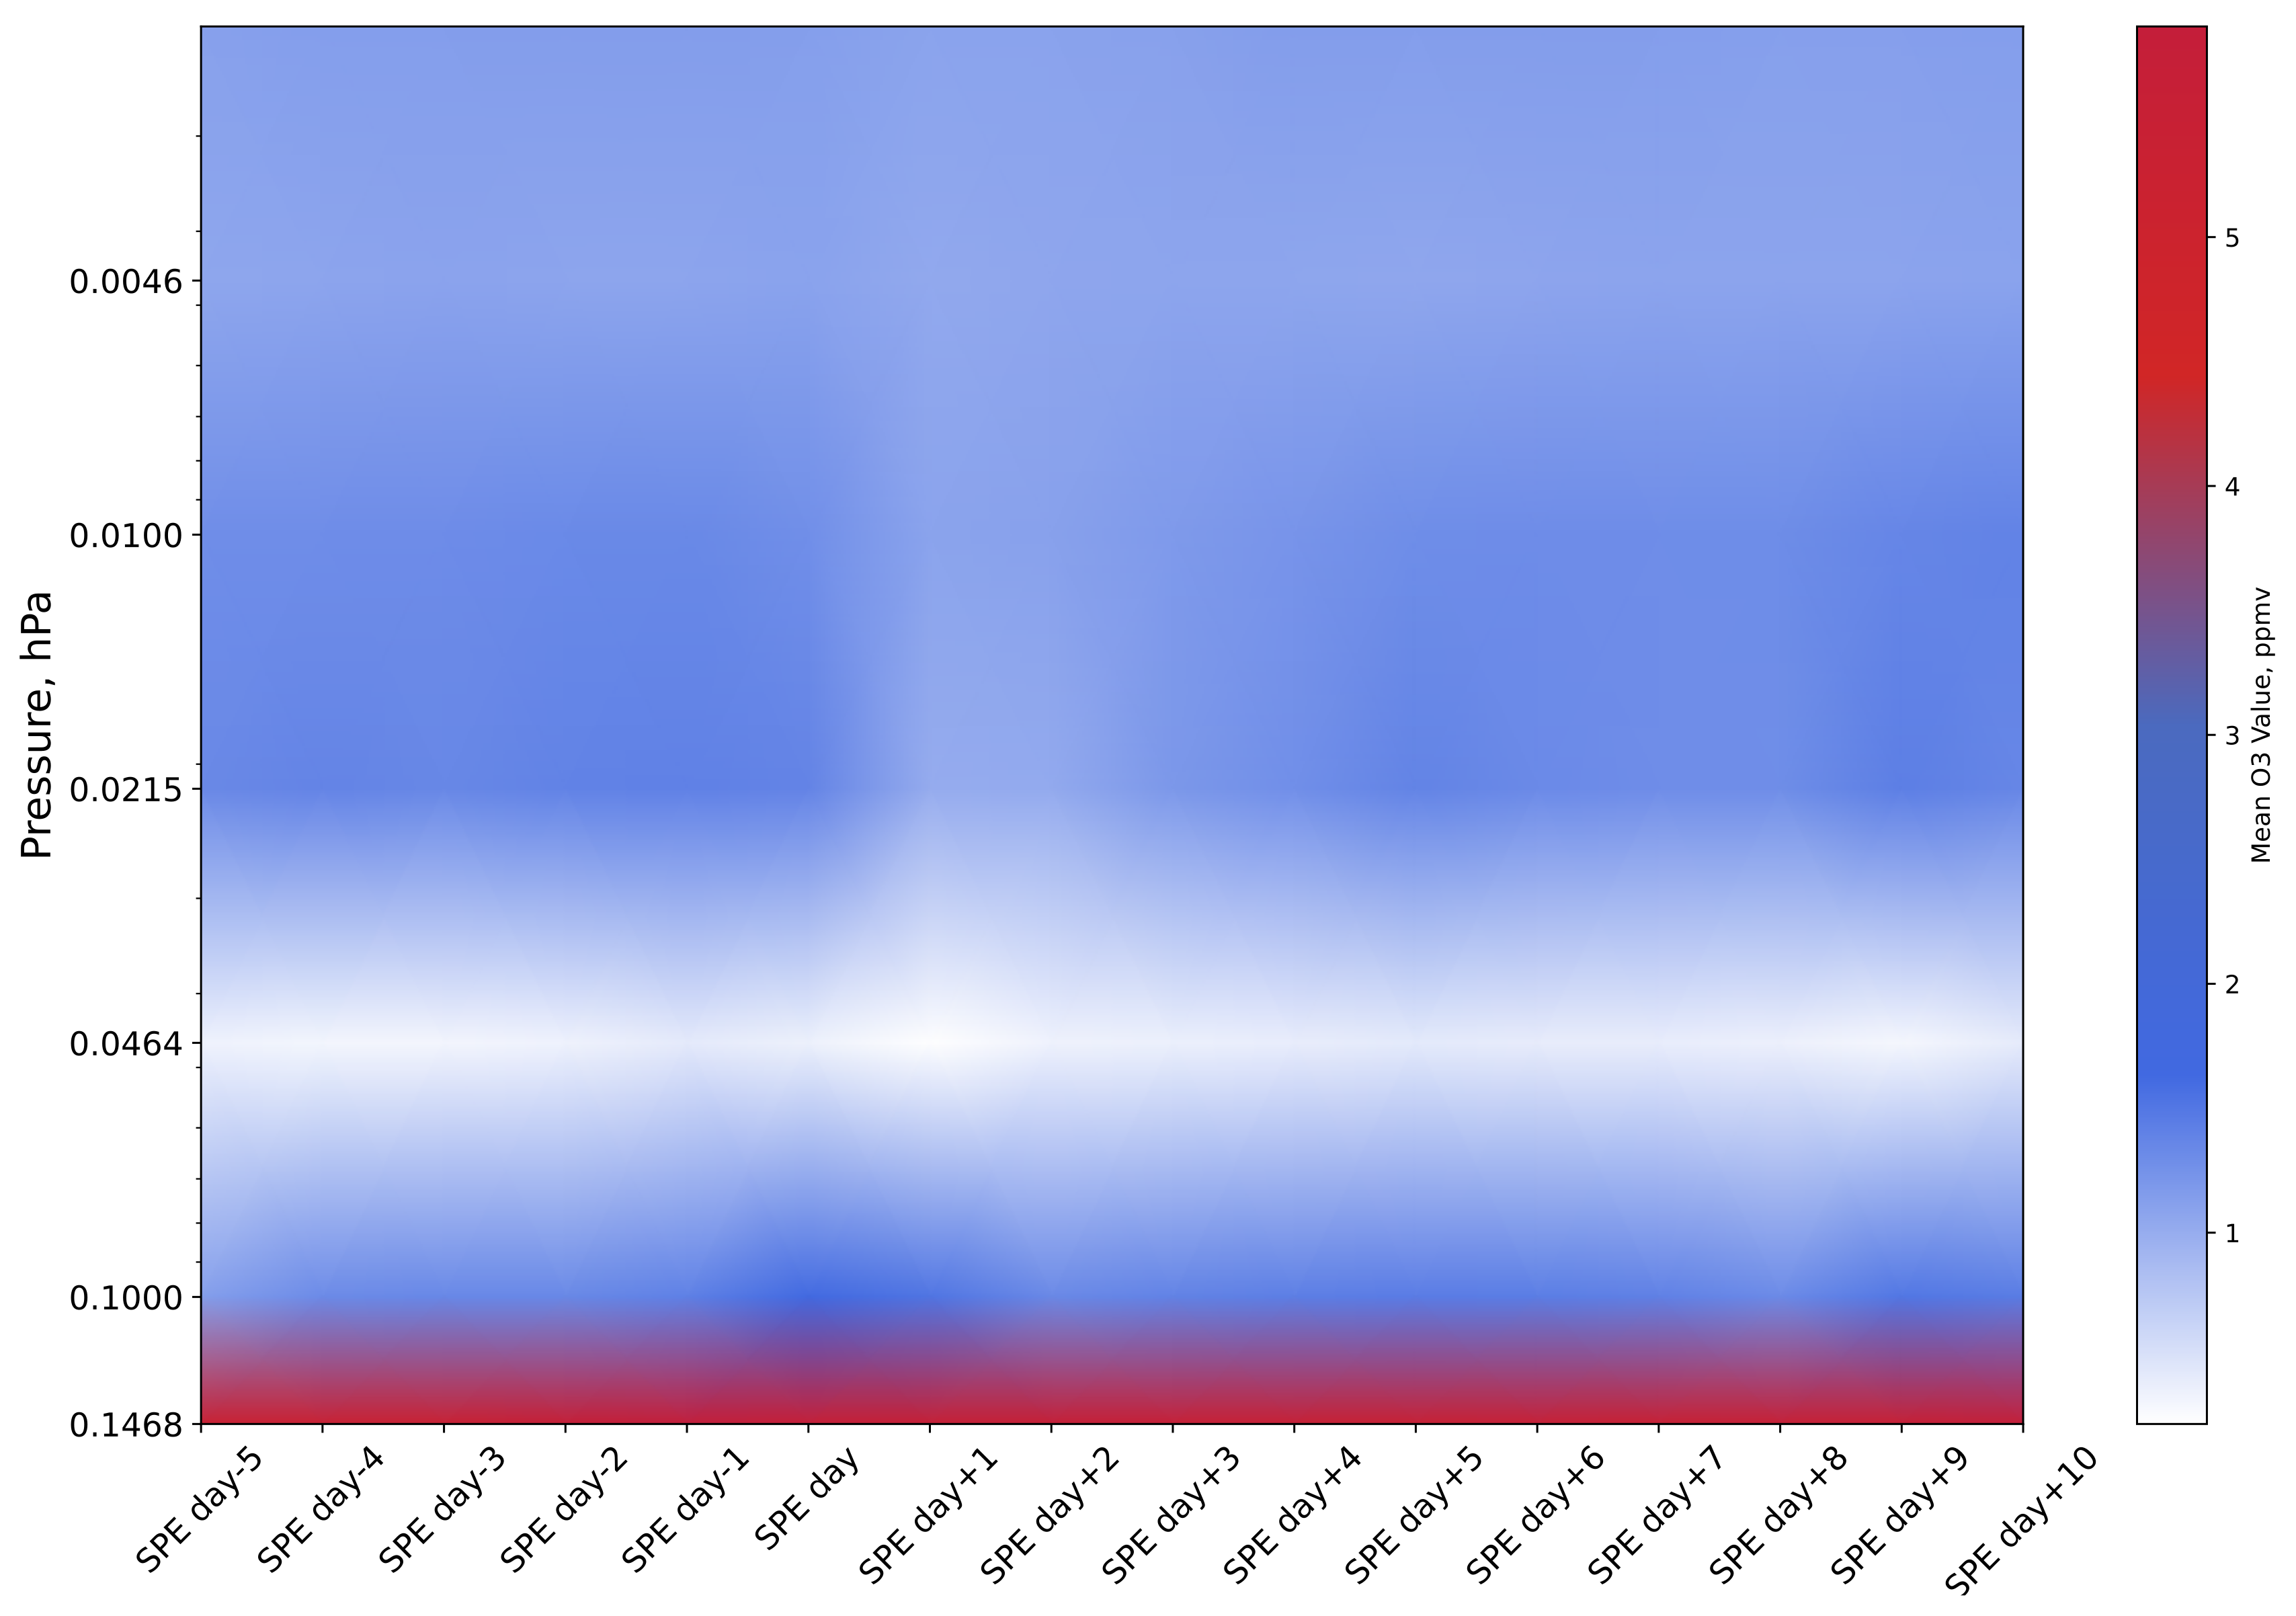
Figure 1 shows the results of the superposed epoch analysis of Aura MLS altitude ozone profiles at 60-80NH before and after SPEs, which are summarized in Table 1. It is important to notice that Figure 1 shows the behavior of ozone profiles during wintertime, which includes months from September to March in the northern hemisphere.
Figure 2 presents the results of superposed epoch analysis of Aura MLS altitude ozone profiles at 60–80 SH before and after SPEs, which are summarized in Table 2. Here, Figure 2 shows the behavior of ozone profiles during wintertime which includes months from April to August in the southern hemisphere.
Figure 1 and Figure 2 show that, after the SPEs, there are decreases in winter ozone concentrations in both hemispheres in the mesosphere at the 0.01 hPa–0.046 hPa pressure range. Longer ozone depletion after SPEs occurs in the northern hemisphere compared to the southern hemisphere. It can be explained by the number of solar proton events that are included in superposed epoch analysis. In the northern hemisphere, effects are summarized based on eleven solar proton events, and in the southern hemisphere, effects are summarized based on five solar proton events. The more events that are considered, the longer the effect on ozone depletion may be noticeable, since the superimposed epoch method takes into account events of different intensities.
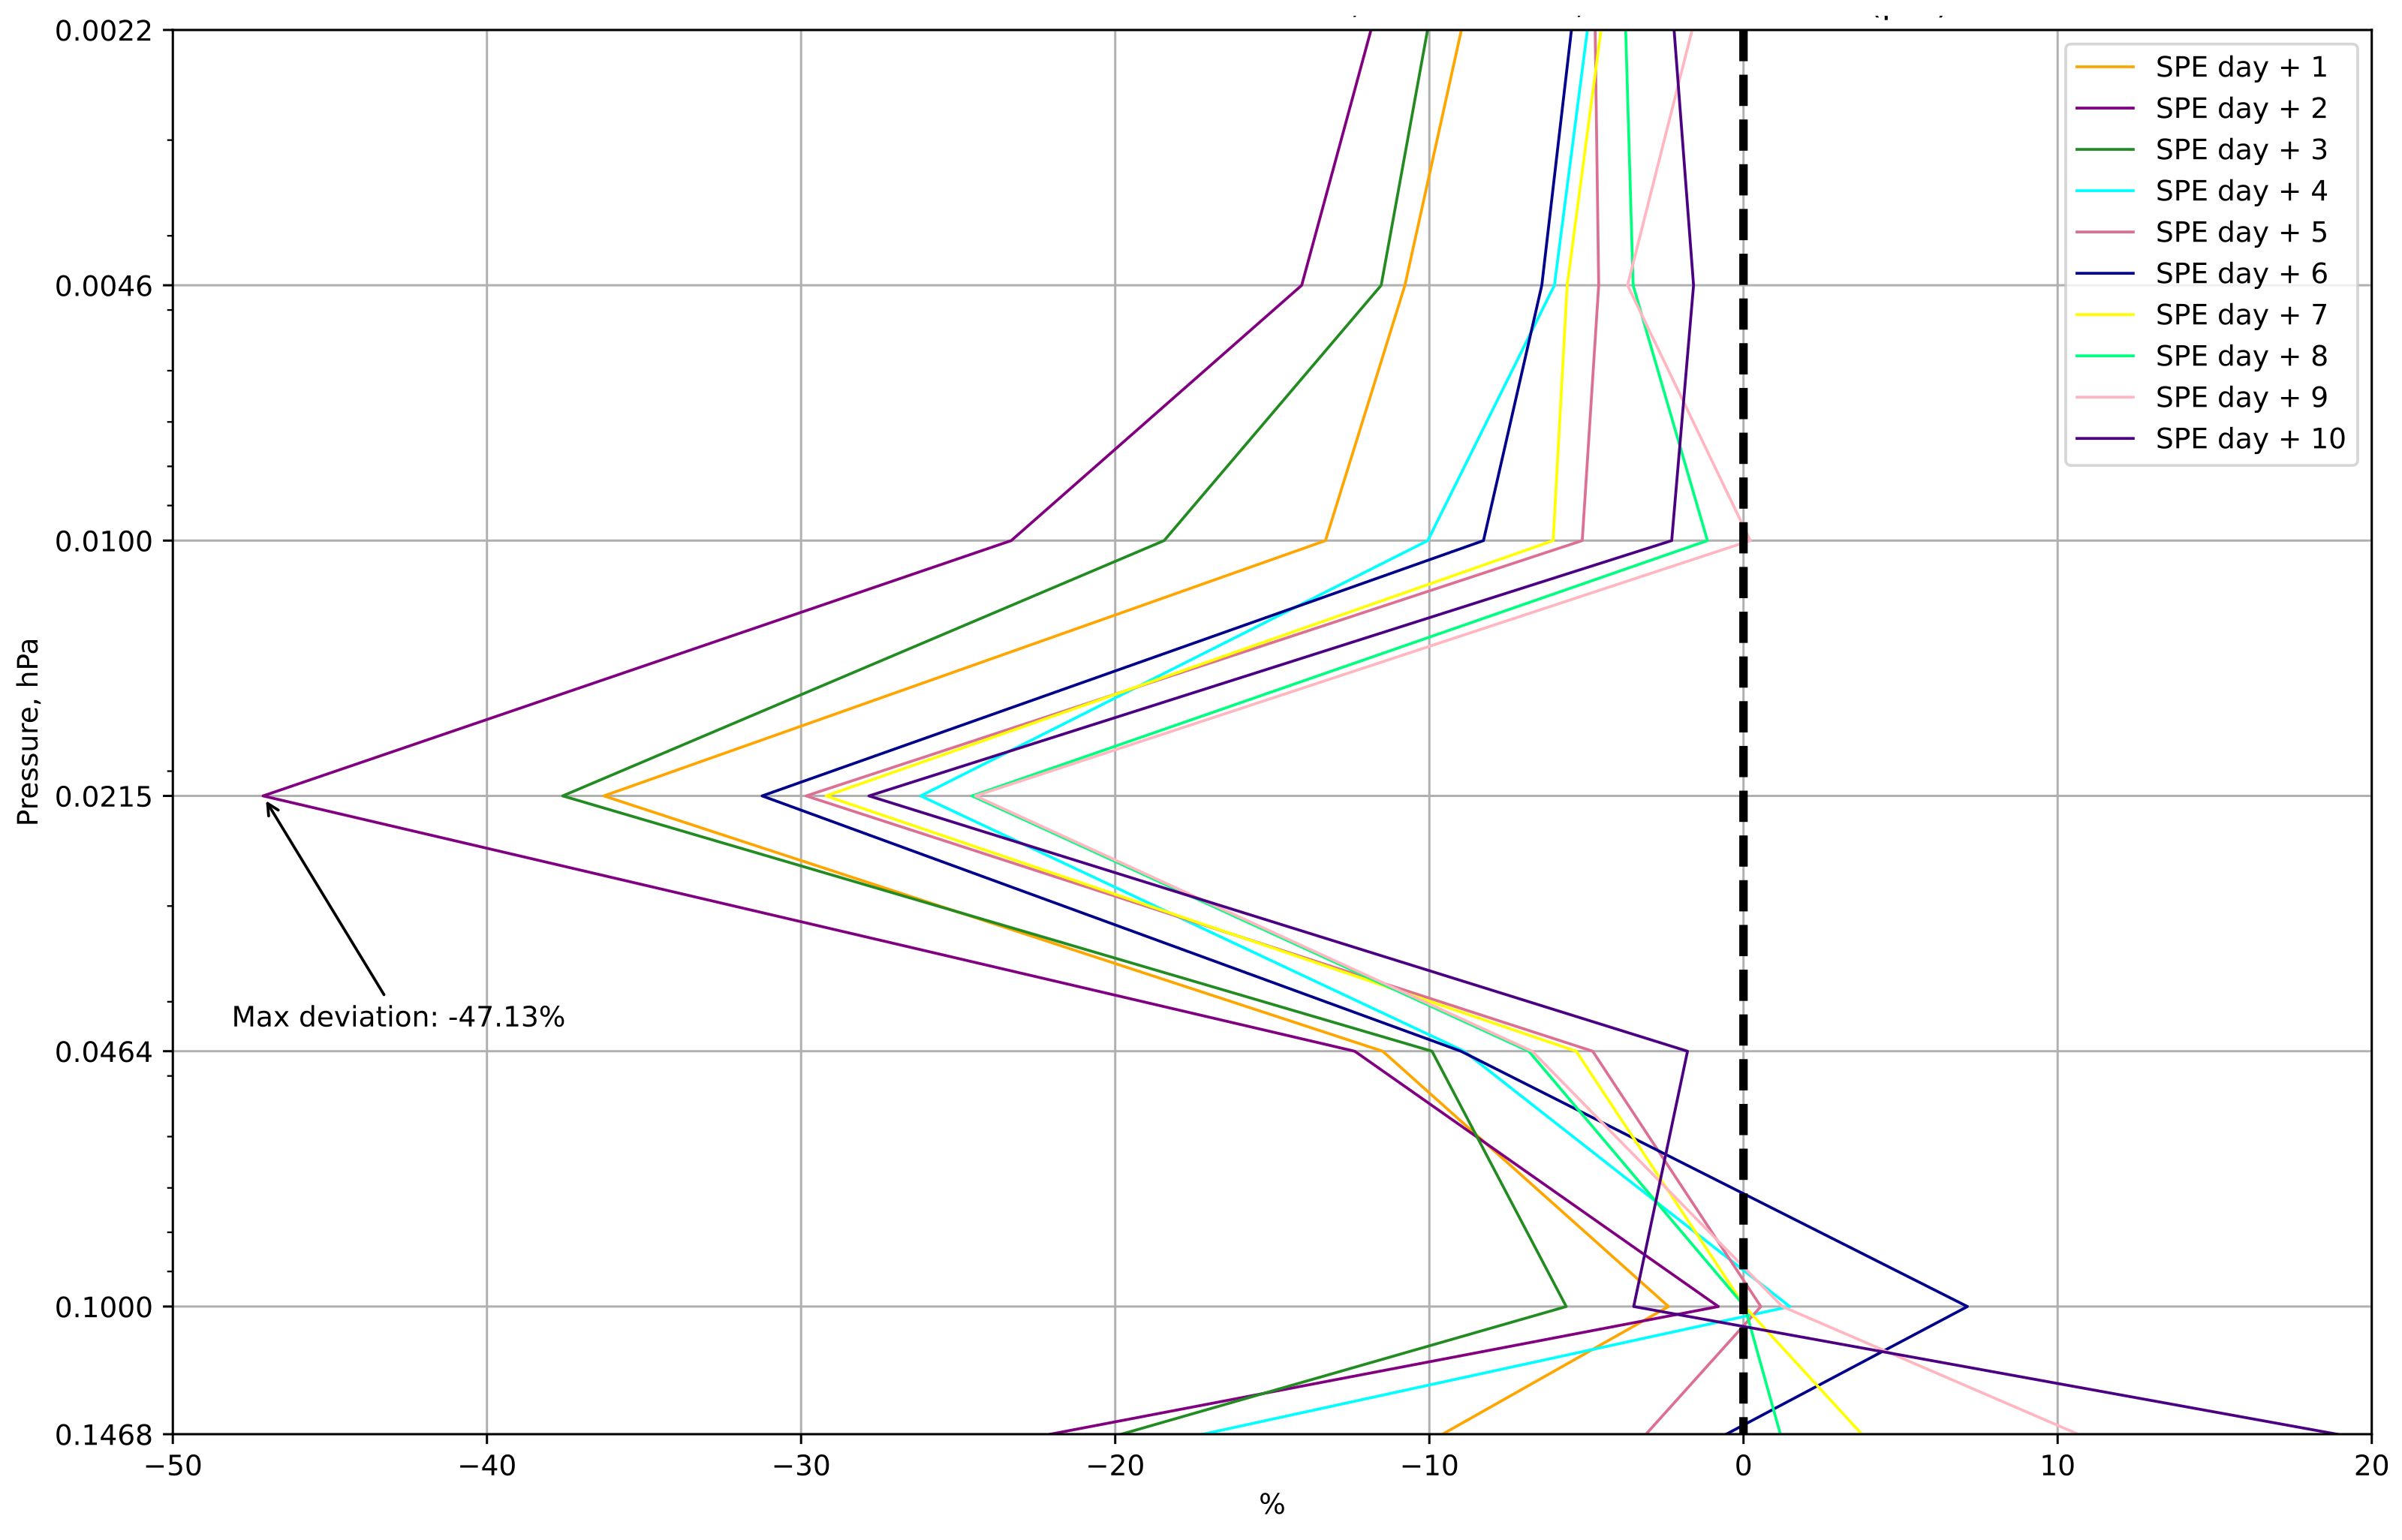
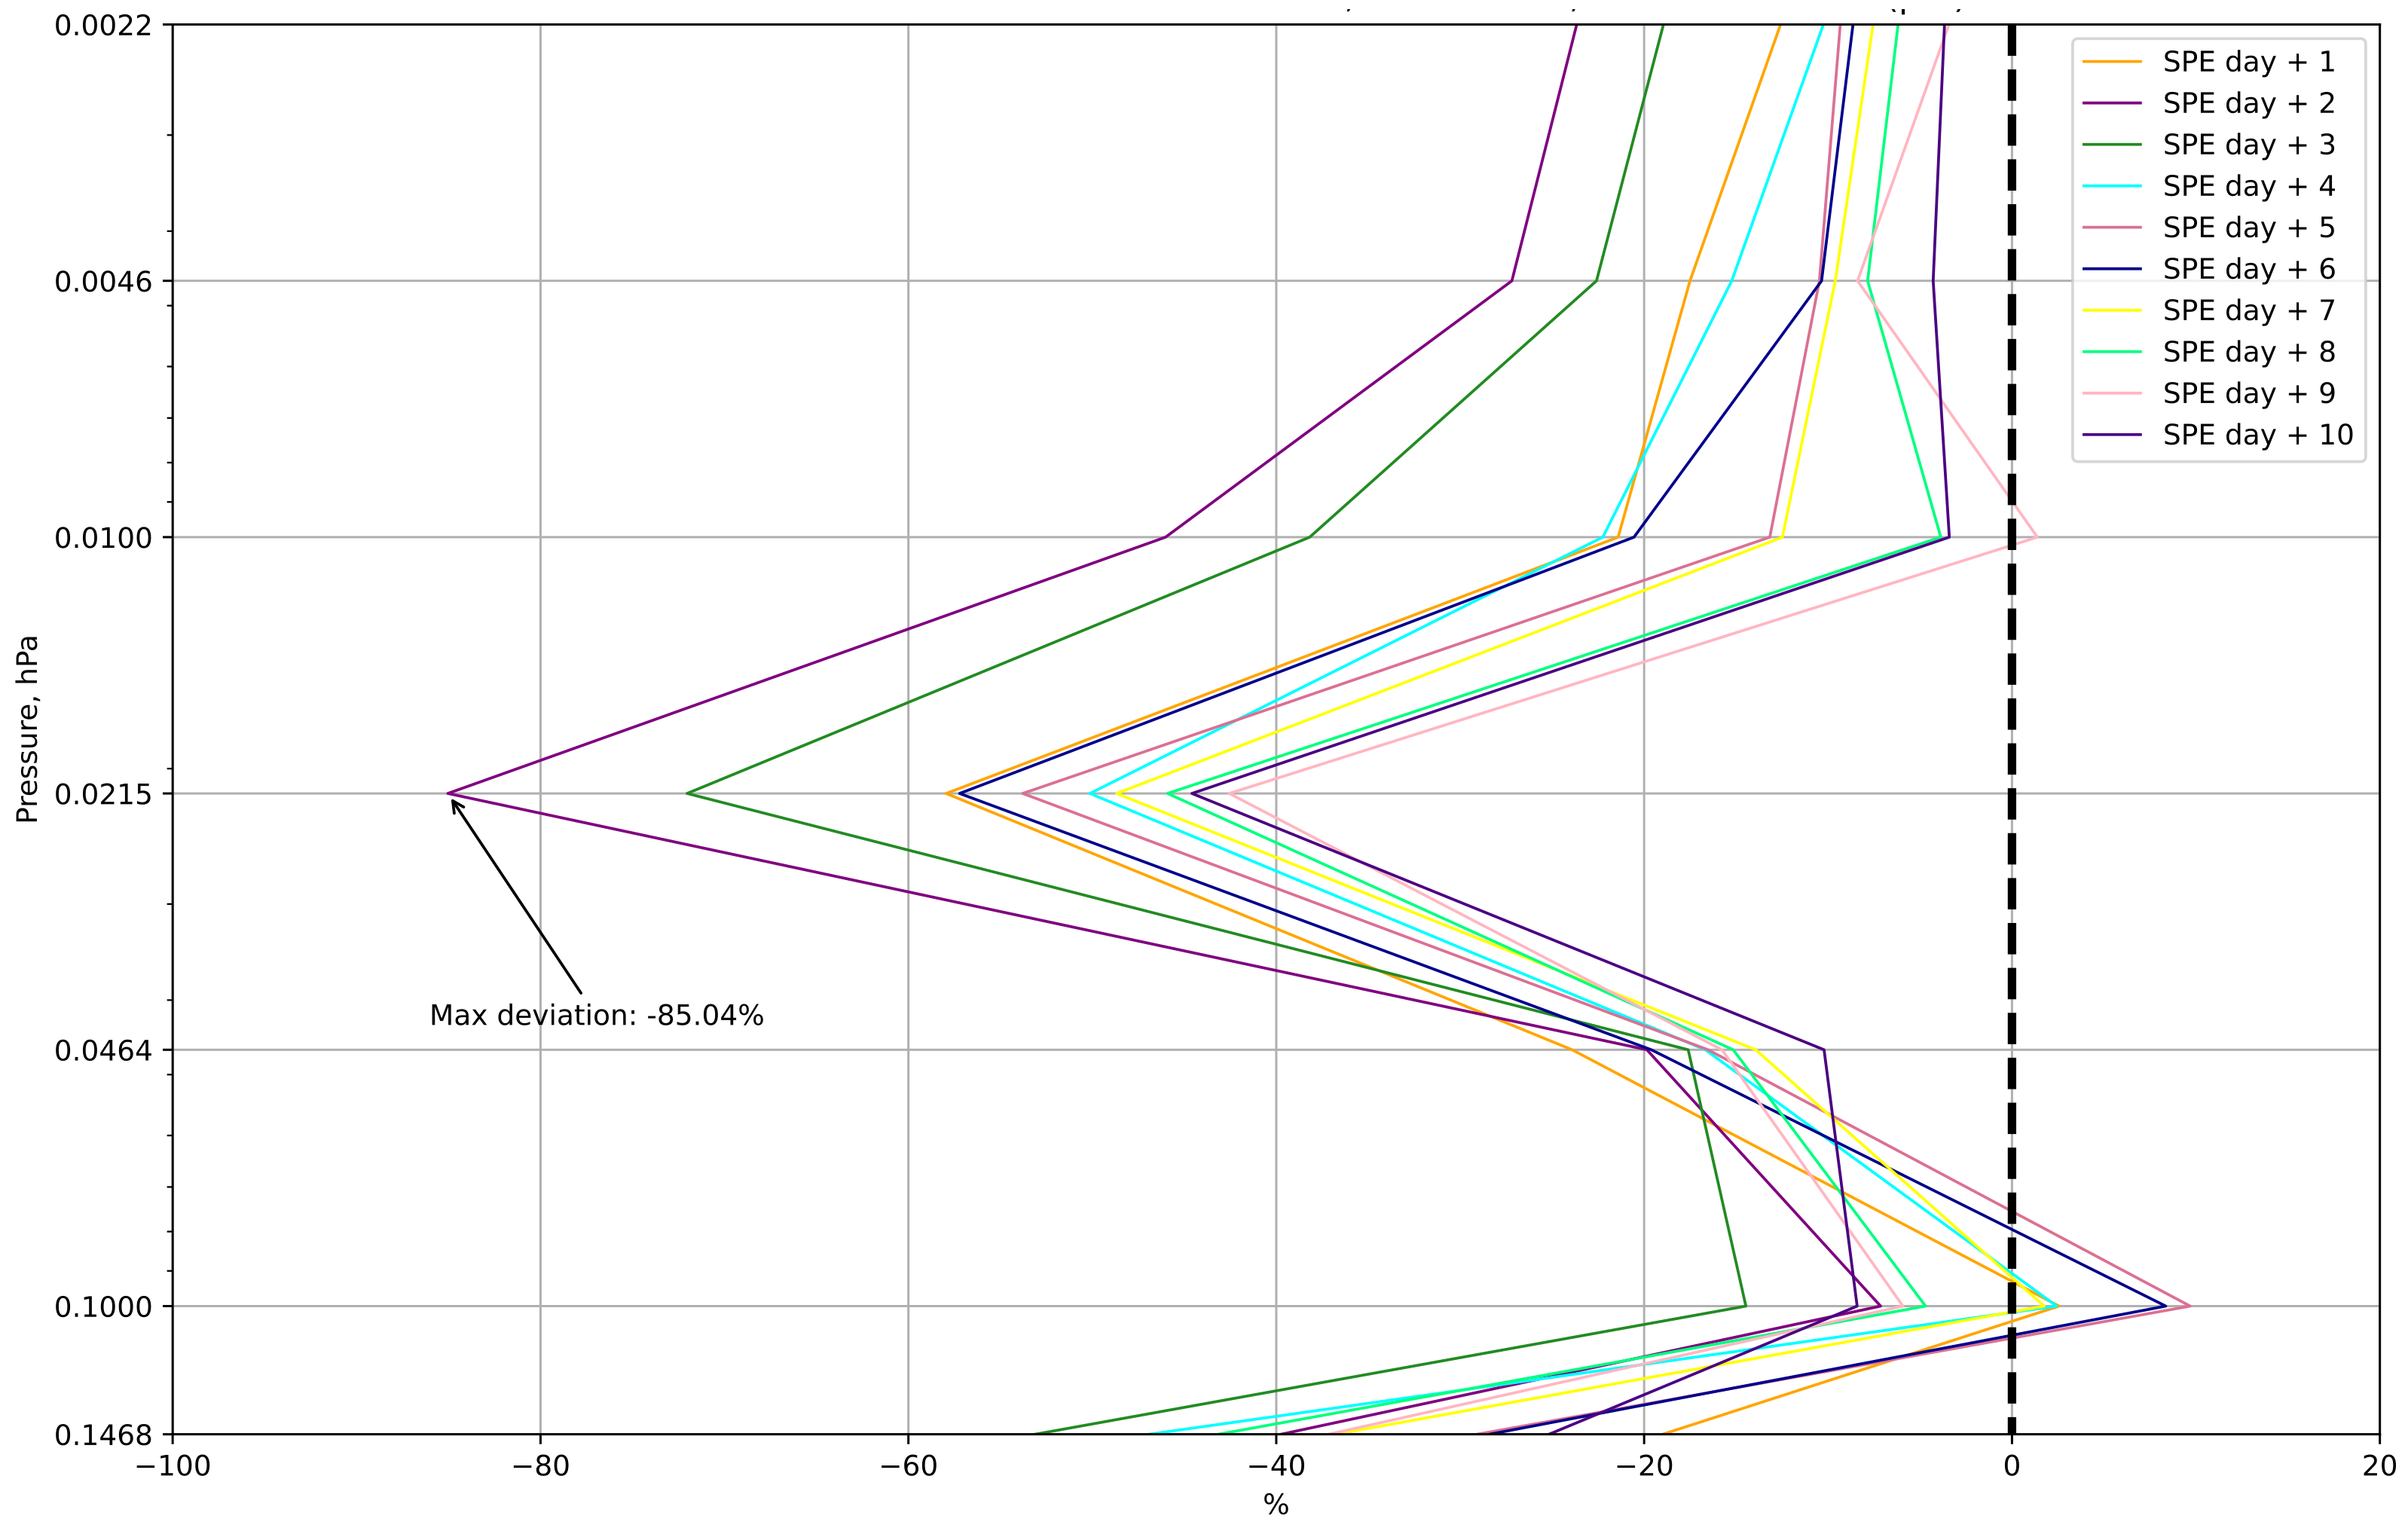
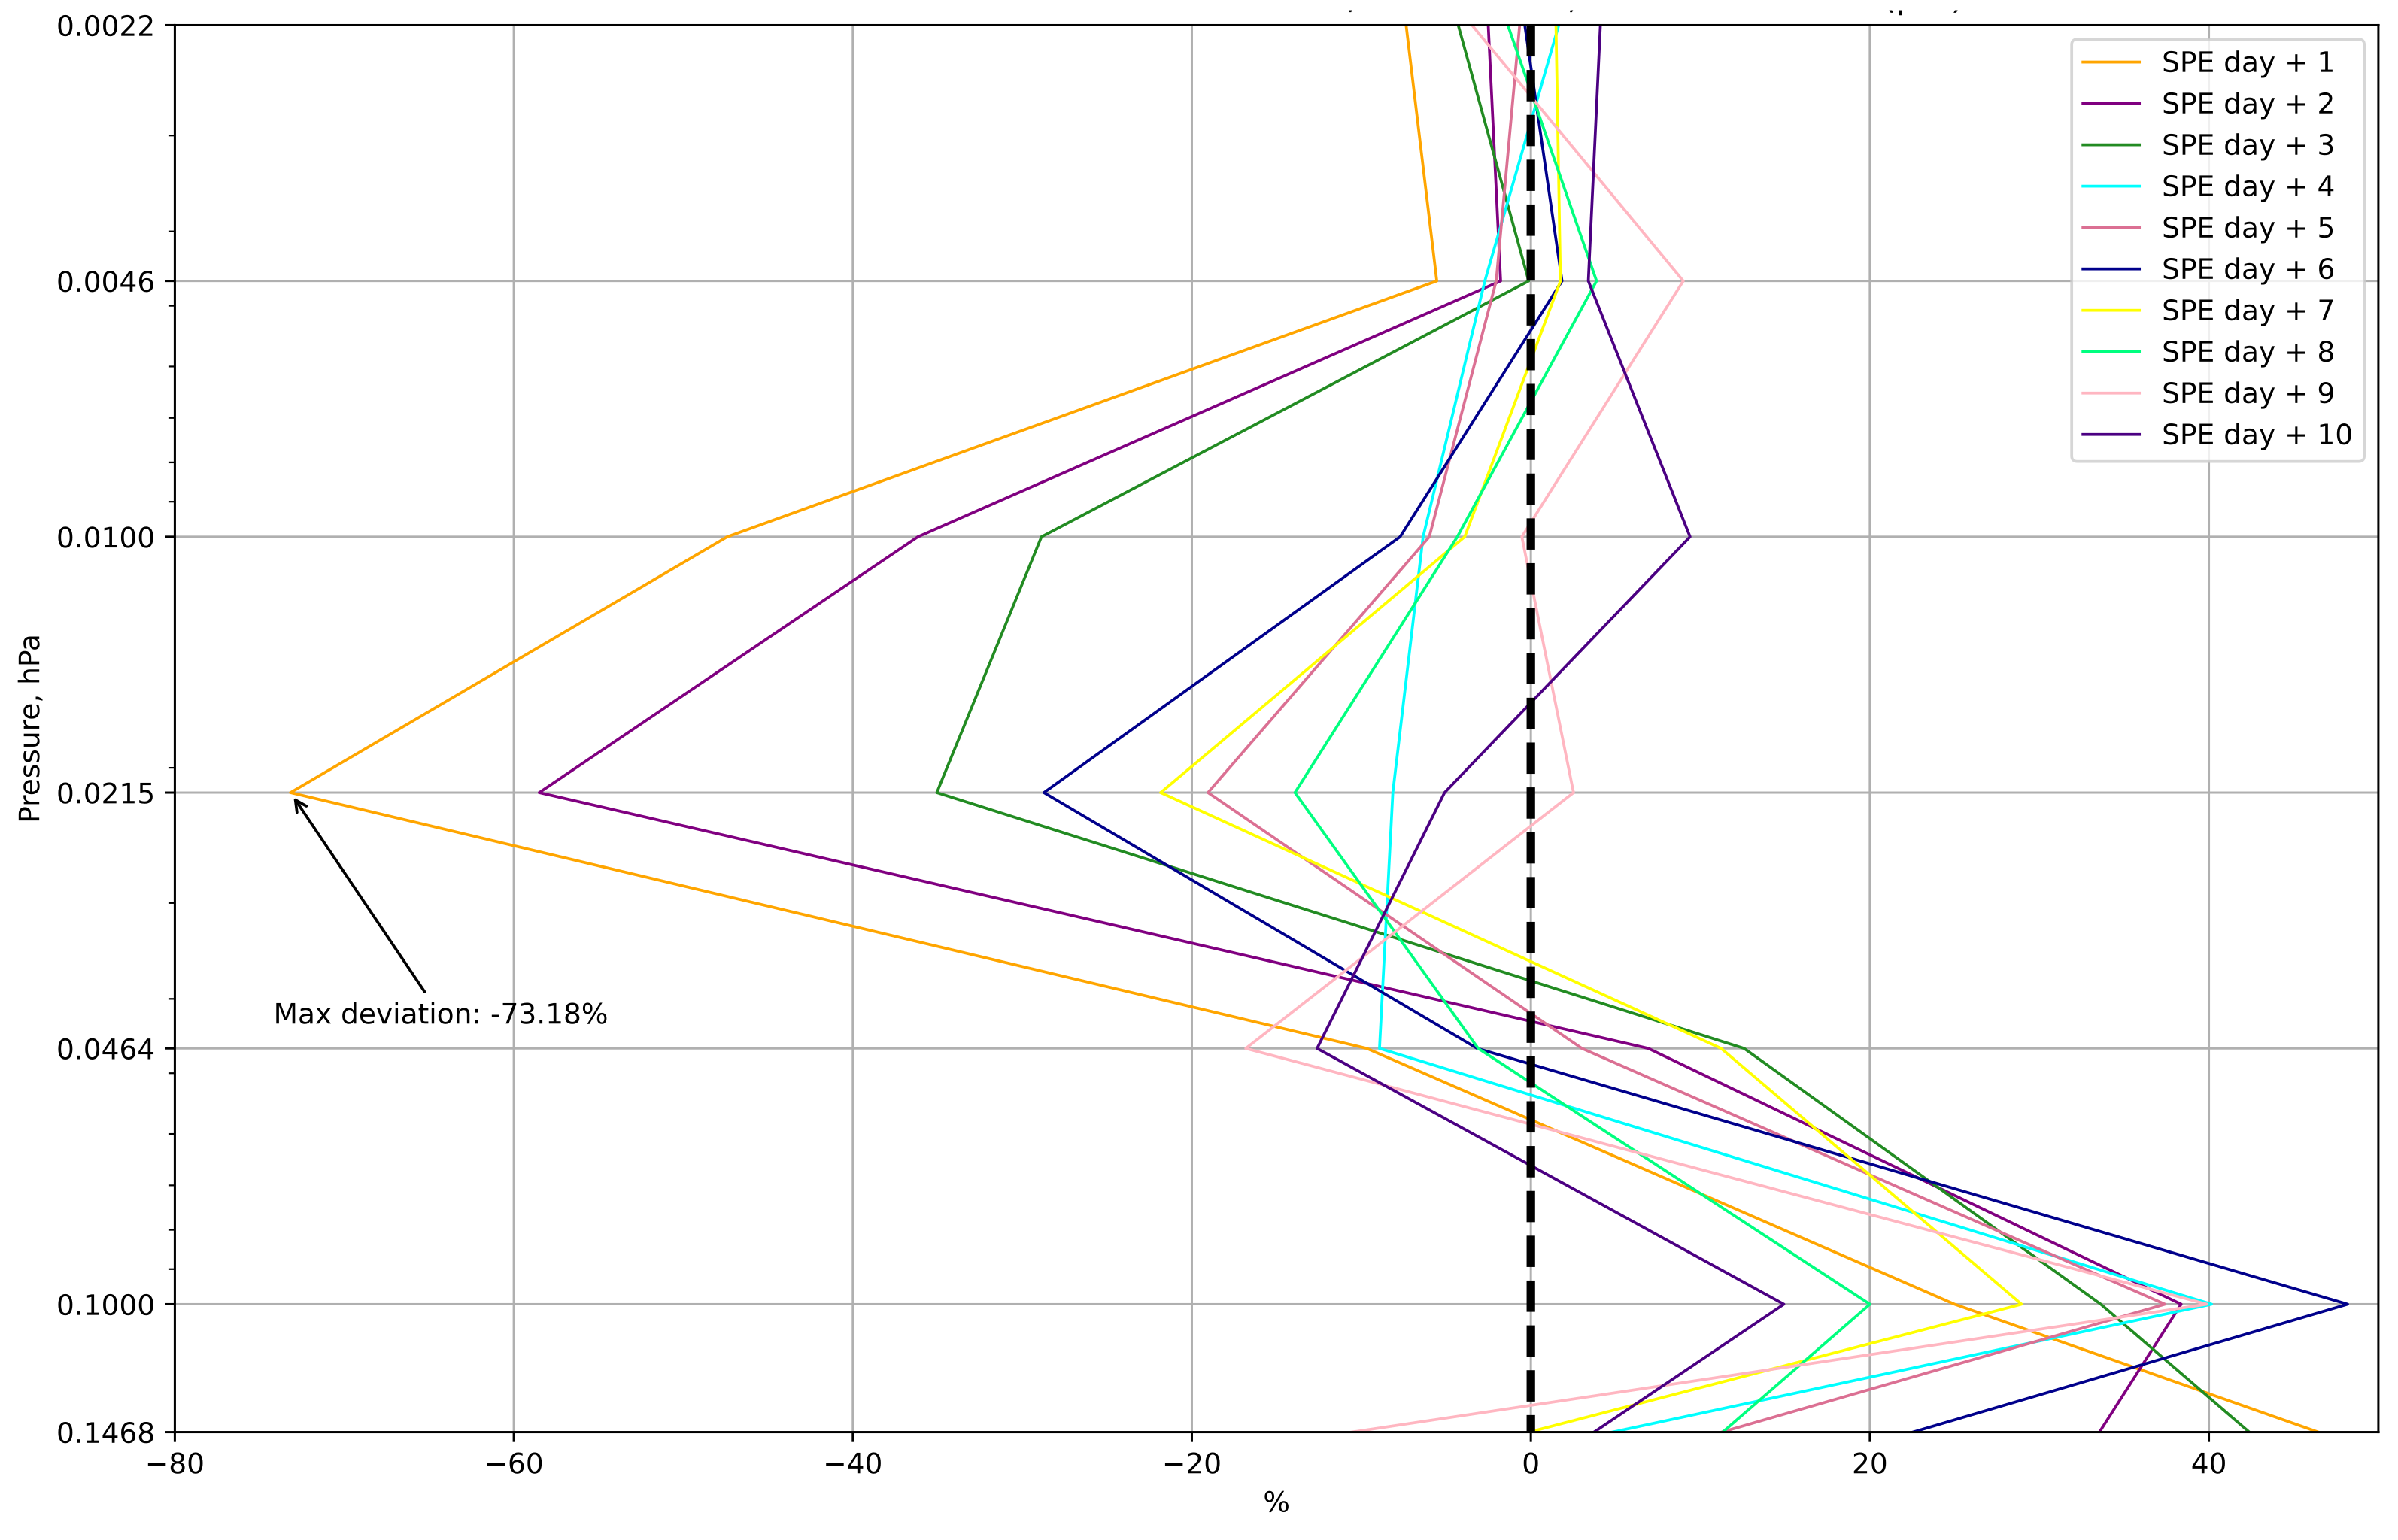
Figure 3 and Figure 4 present the evolution of the vertical profile of ozone concentration after moderate and strong SPEs. In the northern hemisphere, ozone depletion begins one day after the start of a winter solar proton event. It can be seen here that, after a solar proton event, there is a decrease in ozone concentration in the mesosphere starting from the 0.02 hPa pressure level (about 76 km). After winter moderate SPEs with a proton flux intensity of more than 100 pfu, maximum ozone depletion around 0.02 hPa reaches 47%. After strong winter SPEs with a proton flux intensity of more than 1000 pfu, maximum ozone depletion around 0.02 hPa reaches 85%. It turns out that, the stronger the flux of solar protons, the more ozone will be destroyed in wintertime.
On the third day after an SPE, ozone concentrations start to return to the pre-event ozone concentration level. However, despite this, even 10 days after a solar proton event, mesospheric ozone concentrations have not returned to pre-event concentration levels and the ozone layer is still depleted by about 20–40% depending on the intensity of the solar proton event, perhaps due to the influence of other, smaller solar proton events that we are not considering.
The maximum ozone destruction observed on the second day can be explained by the fact that the day of a solar proton event appearance was chosen as the key day; however, as can be seen from Table 1, the duration of the SPE usually lasts at least several hours and can last for days. Solar proton precipitation, which lasts for several days, also does not allow for mesospheric ozone to recover.
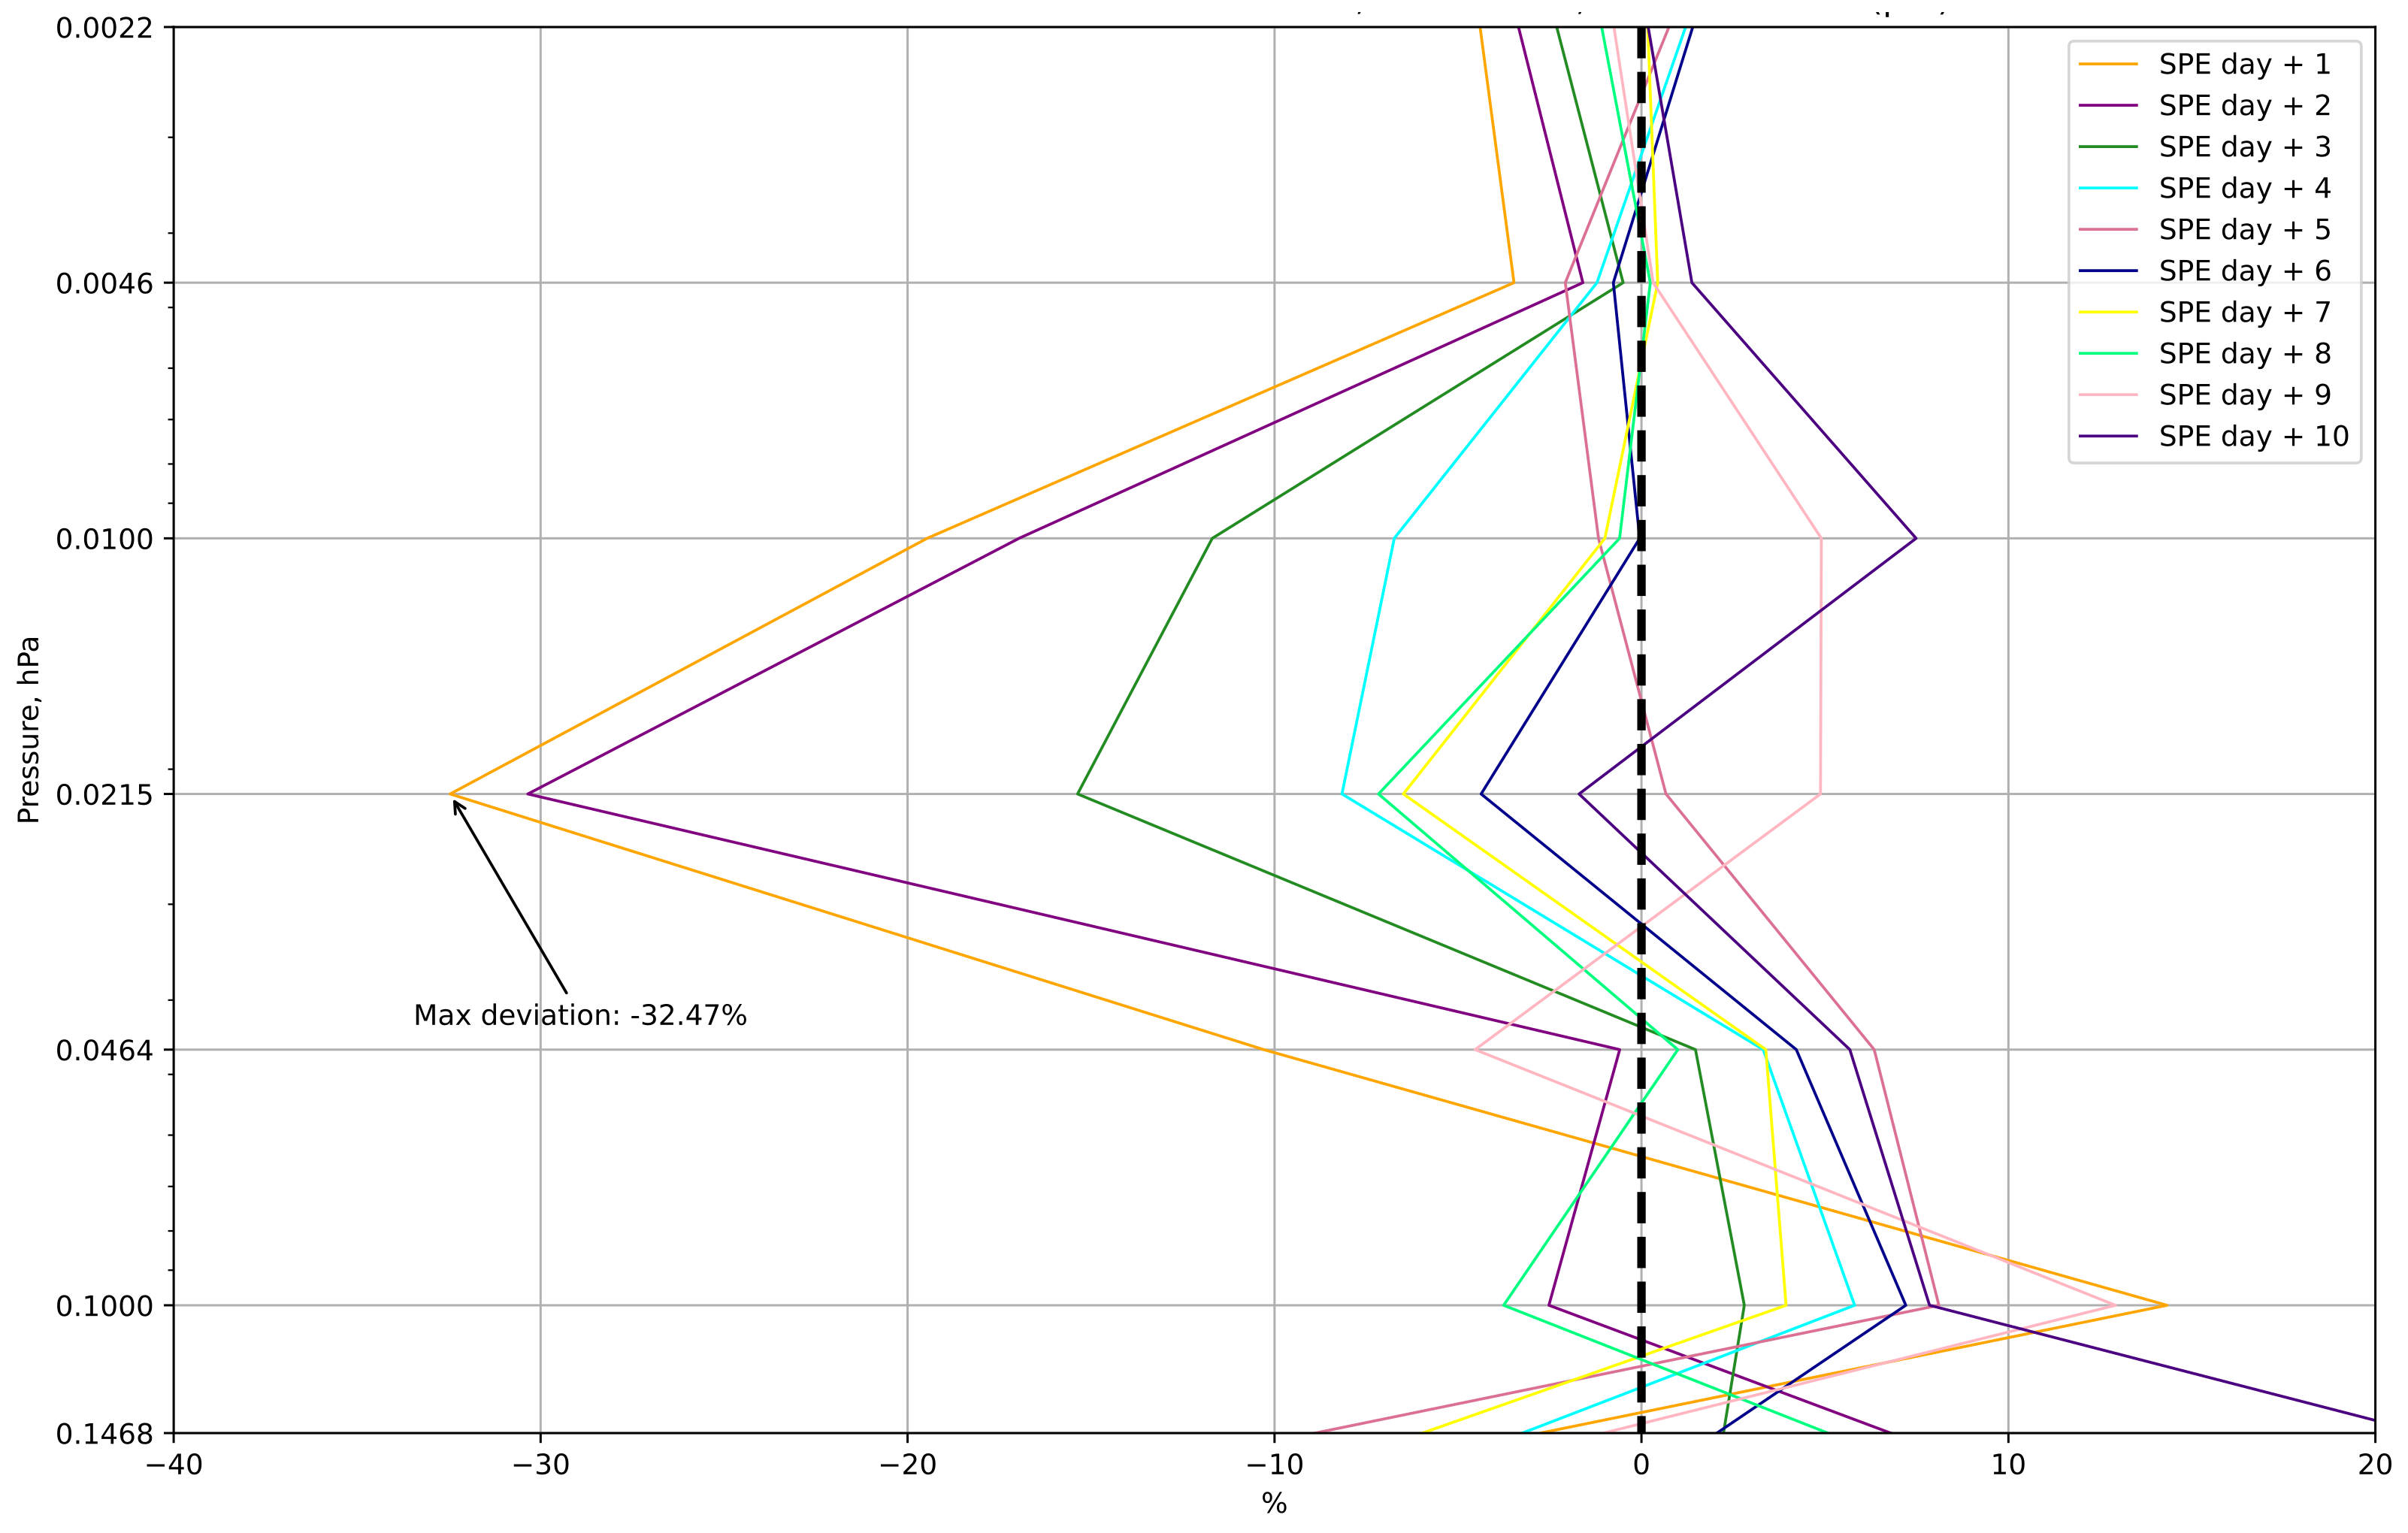
Figure 5 and Figure 6 present the behavior of the vertical altitude profile of ozone concentration after SPEs, which are summarized in Table 2. In the southern hemisphere, winter ozone depletion begins on the day after the start of a solar proton event. As in the northern hemisphere, in the southern hemisphere a decrease in winter ozone concentration at the mesosphere level is observed above a 0.02 hPa (about 76 km) pressure level. After moderate SPEs with a proton flux intensity of more than 100 pfu, maximum winter ozone depletion around 0.02 hPa reaches 32%. After strong SPEs with a proton flux intensity of more than 1000 pfu, maximum winter ozone depletion around 0.02 hPa reaches 73%. On the second day after a solar proton event, ozone concentrations start to return to pre-event ozone concentration levels. In the southern hemisphere, after a solar proton event, mesospheric ozone concentrations return to pre-event concentration levels on the ninth day.
Comparing the SPE effects in the northern and southern hemispheres presented in Figure 5 and Figure 6, as well as in Figure 1 and Figure 2, we can conclude that SPEs destroy winter ozone in the northern hemisphere more severely than in the southern hemisphere. However, in both cases, maximal ozone destruction is observed at the same pressure level of about 0.02 hPa. The difference in ozone destruction between hemispheres is of about 10%. Over the northern hemisphere, a winter ozone recovery period after SPEs is much longer compared to the southern hemisphere. The intensity of solar proton flux also affects ozone destruction and the magnitude of the effects is within 10% if we compare moderate SPEs with a proton flux intensity of more than 100 pfu and strong SPEs with a proton flux intensity of more than 1000 pfu.

3. Discussions and Conclusions

In this work, we study mesospheric ozone depletion as a function of solar proton precipitation using Aura MLS O3 measurements from 2004 to 2024. To characterize SPEs, we use the NOAA SWPC collection of winter solar proton events separated by a proton flux intensity for energies greater than 10 MeV, which are integrated into a five-minute averages measured by the GOES spacecraft in geostationary orbit. In our study, we group SPEs according to the particle flux intensity into two cases with proton flux intensity greater than 100 pfu and 1000 pfu. We used superimposed epoch analysis to obtain average information about how the magnitude of solar proton events and mesospheric winter ozone depletion in both hemispheres are related.
To study the impact of solar proton events on mesospheric ozone concentration on the days of solar proton events, as well as during the 5 days before and 10 days after the SPE, we apply superposed epoch analysis. To ensure that the effects of the two events did not overlap, the events with intervals of less than 10 days between them and other events were excluded from consideration. This period was chosen to evaluate the behavior of ozone in the absence of solar particle events and to compare it with the levels during and after SPEs. It should be noted that the ozone concentration fluctuates very slightly before the event, but after the SPE, it decreases at certain altitudes by about 30–80%, depending on the strength of the particle flux. In the southern hemisphere, the winter ozone concentration in the atmosphere returns to the pre-event level within 10 days; however, in the northern hemisphere, the ozone recovery process is slower.
The reactions to the same SPEs are different in the two hemispheres due to the different solar zenith angles. The study results clearly show that, between September and March, moderate SPEs with proton flux intensity greater than 100 pfu will deplete winter mesospheric ozone more strongly in the northern hemisphere (47%), while in the southern hemisphere, ozone deviates by a maximum of 13–17%, which is not presented here as a figure. Between April and August, moderate SPEs with proton flux intensity greater than 100 pfu will deplete winter mesospheric ozone more strongly in the southern hemisphere (33%), but in the northern hemisphere, ozone deviation is much weaker by a maximum of about 5–10%, which is not presented here as a figure.
Maximum ozone depletion from SPEs occurs at altitudes of about 0.02 hPa (around 76 km). For the southern hemispheres, the peak of winter ozone loss occurs on the day after a solar proton event and, for the northern hemispheres, the peak of ozone loss occurs on the second day. In the southern hemisphere, mesospheric ozone concentrations return to pre-event levels on the ninth day after a solar proton event, and in the northern hemisphere, even on the tenth day after a solar proton event, the mesospheric ozone layer does not fully recover.
The effect of the strong SPEs with a proton flux intensity of more than 1000 pfu, which occurred from September to March, demonstrated a maximum ozone loss of up to 85% in the northern hemisphere. Strong SPEs with a proton flux intensity of more than 1000 pfu, occurred from April to August, with a maximum ozone loss of up to 73% in the southern hemisphere at altitudes around 0.02 hPa.
The analysis of the long-term MLS observations of the mesospheric ozone reveal that ozone destruction caused by the same SPEs slightly differs between the hemispheres. In polar mesosphere, ozone without the presence of UV radiation is more strongly affected by energetic particle precipitation than in UV present. The destruction of mesospheric ozone will be stronger and more noticeable only in the winter hemisphere. Precipitating solar protons produce a large amount of HOx and NOx, which means that solar energetic particles will lead to more ozone depletion, comparable to other seasons when solar UV is available. Polar winter mesospheric ozone destruction strongly depends on solar proton flux intensity. The maximum ozone destruction up to 85% under strong SPEs can be reached in the winter hemisphere. Estimation of mesospheric ozone depletion based on data analysis indicates that the short-term ozone depletion during solar proton events is comparable to ozone depletion during geomagnetic disturbances.

Author Contributions

Conceptualization, I.M.; software, G.D. and N.B.; data analysis, G.D., I.M. and E.R.; writing—original draft preparation, I.M., G.D. and E.R. All authors have read and agreed to the published version of the manuscript.

Funding

The work was supported by Saint Petersburg State University under research grant 116234986.

Institutional Review Board Statement

Not applicable.

Informed Consent Statement

Not applicable.

Data Availability Statement

NOAA SWPC SPE data: https://www.ngdc.noaa.gov/stp/space-weather/interplanetary-data/solar-proton-events/SEP%20page%20code.html (last accessed on 6 June 2024). Aura MLS data: https://mls.jpl.nasa.gov/ (last accessed on 6 June 2024). All data from the investigation is available upon request from I.M. and G.D. The data presented in this study are available upon request from the corresponding author.

Acknowledgments

The authors acknowledge the support from Saint Petersburg State University under research grant 116234986.

Conflicts of Interest

The authors declare no conflicts of interest.

References

  1. Randall, C.E.; Harvey, V.L.; Manney, G.L.; Orsolini, Y.; Codrescu, M.; Sioris, C.; Brohede, S.; Haley, C.S.; Gordley, L.L.; Zawodny, J.M.; et al. Stratospheric effects of energetic particle precipitation in 2003–2004. Geoph. Res. Lett. 2005, 32, L05802. [Google Scholar] [CrossRef]
  2. Rozanov, E.; Calisto, M.; Egorova, T.; Peter, T.; Schmutz, W. Influence of the Precipitating Energetic Particles on Atmospheric Chemistry and Climate. Surv. Geophys. 2012, 33, 483–501. [Google Scholar] [CrossRef]
  3. Mironova, I.A.; Aplin, K.L.; Arnold, F.; Bazilevskaya, G.A.; Harrison, R.G.; Krivolutsky, A.A.; Nicoll, K.A.; Rozanov, E.V.; Turunen, E.; Usoskin, I.G. Energetic Particle Influence on the Earth’s Atmosphere. Space Sci. Rev. 2015, 194, 1–96. [Google Scholar] [CrossRef]
  4. Matthes, K.; Funke, B.; Andersson, M.E.; Barnard, L.; Beer, J.; Charbonneau, P.; Clilverd, M.A.; Dudok de Wit, T.; Haberreiter, M.; Hendry, A.; et al. Solar forcing for CMIP6 (v3.2). Geosci. Model Dev. 2017, 10, 2247–2302. [Google Scholar] [CrossRef]
  5. Sinnhuber, M.; Berger, U.; Funke, B.; Nieder, H.; Reddmann, T.; Stiller, G.; Versick, S.; von Clarmann, T.; Maik Wissing, J. NOy production, ozone loss and changes in net radiative heating due to energetic particle precipitation in 2002–2010. Atm. Chem. Phys. 2018, 18, 1115–1147. [Google Scholar] [CrossRef]
  6. Randall, C.; Harvey, L.; Pedatella, N.; Bailey, S.; Maruyama, N.; Chen, T. Sun-Earth Coupling via Energetic Particle Precipitation. Bull. Am. Astron. Soc. 2023, 55, 332. [Google Scholar] [CrossRef]
  7. Usoskin, I.G.; Kovaltsov, G.A.; Mironova, I.A. Cosmic ray induced ionization model CRAC:CRII: An extension to the upper atmosphere. J. Geophys. Res. Atmos. 2010, 115, D10302. [Google Scholar] [CrossRef]
  8. Fang, X.; Randall, C.E.; Lummerzheim, D.; Wang, W.; Lu, G.; Solomon, S.C.; Frahm, R.A. Parameterization of monoenergetic electron impact ionization. Geoph. Res. Lett. 2010, 37, L22106. [Google Scholar] [CrossRef]
  9. Artamonov, A.A.; Mishev, A.L.; Usoskin, I.G. Atmospheric ionization induced by precipitating electrons: Comparison of CRAC:EPII model with a parametrization model. J. Atmos. Sol. -Terr. Phys. 2016, 149, 161–166. [Google Scholar] [CrossRef]
  10. Xu, W.; Marshall, R.A.; Tyssøy, H.N.; Fang, X. A Generalized Method for Calculating Atmospheric Ionization by Energetic Electron Precipitation. J. Geophys. Res. (Space Phys.) 2020, 125, e28482. [Google Scholar] [CrossRef]
  11. Mironova, I.; Kovaltsov, G.; Mishev, A.; Artamonov, A. Ionization in the Earth’s Atmosphere Due to Isotropic Energetic Electron Precipitation: Ion Production and Primary Electron Spectra. Remote Sens. 2021, 13, 4161. [Google Scholar] [CrossRef]
  12. Rycroft, M.J.; Nicoll, K.A.; Aplin, K.L.; Giles Harrison, R. Recent advances in global electric circuit coupling between the space environment and the troposphere. J. Atmos. Sol.-Terr. Phys. 2012, 90, 198–211. [Google Scholar] [CrossRef]
  13. Bozóki, T.; Sátori, G.; Williams, E.; Mironova, I.; Steinbach, P.; Bland, E.C.; Koloskov, A.; Yampolski, Y.M.; Budanov, O.V.; Neska, M.; et al. Solar cycle-modulated deformation of the Earth-ionosphere cavity. Front. Earth Sci. 2021, 9, 735. [Google Scholar] [CrossRef]
  14. Kirillov, A.S. Calculation of rate coefficients of electron energy transfer processes for molecular nitrogen and molecular oxygen. Adv. Space Res. 2004, 33, 998–1004. [Google Scholar] [CrossRef]
  15. Jackman, C.H.; Marsh, D.R.; Vitt, F.M.; Garcia, R.R.; Fleming, E.L.; Labow, G.J.; Randall, C.E.; López-Puertas, M.; Funke, B.; von Clarmann, T.; et al. Short and medium term atmospheric constituent effects of very large solar proton events. Atm. Chem. Phys. 2008, 8, 765–785. [Google Scholar] [CrossRef]
  16. Tacza, J.; Raulin, J.P.; Mendonca, R.R.S.; Makhmutov, V.S.; Marun, A.; Fernandez, G. Solar Effects on the Atmospheric Electric Field During 2010–2015 at Low Latitudes. J. Geophys. Res. Atmos. 2018, 123, 11970–11979. [Google Scholar] [CrossRef]
  17. Meraner, K.; Schmidt, H. Climate impact of idealized winter polar mesospheric and stratospheric ozone losses as caused by energetic particle precipitation. Atm. Chem. Phys. 2018, 18, 1079–1089. [Google Scholar] [CrossRef]
  18. Solomon, S.; Rusch, D.W.; Gerard, J.C.; Reid, G.C.; Crutzen, P.J. The effect of particle precipitation events on the neutral and ion chemistry of the middle atmosphere: II. Odd hydrogen. Planet. Space Sci. 1981, 29, 885–893. [Google Scholar] [CrossRef]
  19. Porter, H.S.; Jackman, C.H.; Green, A.E.S. Efficiencies for production of atomic nitrogen and oxygen by relativistic proton impact in air. J. Chem. Phys. 1976, 65, 154–167. [Google Scholar] [CrossRef]
  20. Funke, B.; Baumgaertner, A.; Calisto, M.; Egorova, T.; Jackman, C.H.; Kieser, J.; Krivolutsky, A.; López-Puertas, M.; Marsh, D.R.; Reddmann, T.; et al. Composition changes after the “Halloween” solar proton event: The High Energy Particle Precipitation in the Atmosphere (HEPPA) model versus MIPAS data intercomparison study. Atm. Chem. Phys. 2011, 11, 9089–9139. [Google Scholar] [CrossRef]
  21. Andersson, M.E.; Verronen, P.T.; Marsh, D.R.; Seppälä, A.; Päivärinta, S.M.; Rodger, C.J.; Clilverd, M.A.; Kalakoski, N.; van de Kamp, M. Polar Ozone Response to Energetic Particle Precipitation Over Decadal Time Scales: The Role of Medium-Energy Electrons. J. Geophys. Res. Atmos. 2018, 123, 607–622. [Google Scholar] [CrossRef]
  22. Mironova, I.; Karagodin-Doyennel, A.; Rozanov, E. The effect of Forbush decreases on the polar-night HOx concentration affecting stratospheric ozone. Front. Earth Sci. 2021, 8, 669. [Google Scholar] [CrossRef]
  23. Grankin, D.; Mironova, I.; Bazilevskaya, G.; Rozanov, E.; Egorova, T. Atmospheric Response to EEP during Geomagnetic Disturbances. Atmosphere 2023, 14, 273. [Google Scholar] [CrossRef]
  24. Seppala, A.; Clilverd, M.A.; Beharrell, M.J.; Rodger, C.J.; Verronen, P.T.; Andersson, M.E.; Newnham, D.A. Substorm-induced energetic electron precipitation: Impact on atmospheric chemistry. Geoph. Res. Lett. 2015, 42, 8172–8176. [Google Scholar] [CrossRef]
  25. Andersson, M.E.; Verronen, P.T.; Rodger, C.J.; Clilverd, M.A.; Seppälä, A. Missing driver in the Sun-Earth connection from energetic electron precipitation impacts mesospheric ozone. Nat. Commun. 2014, 5, 5197. [Google Scholar] [CrossRef]
  26. Mironova, I.; Grankin, D.; Rozanov, E. Mesospheric Ozone Depletion Depending on Different Levels of Geomagnetic Disturbances and Seasons. Atmosphere 2023, 14, 1205. [Google Scholar] [CrossRef]
  27. Jackman, C.H.; Deland, M.T.; Labow, G.J.; Fleming, E.L.; Weisenstein, D.K.; Ko, M.K.W.; Sinnhuber, M.; Russell, J.M. Neutral atmospheric influences of the solar proton events in October–November 2003. J. Geophys. Res. (Space Phys.) 2005, 110, A09S27. [Google Scholar] [CrossRef]
  28. Jackman, C.H.; Randall, C.E.; Harvey, V.L.; Wang, S.; Fleming, E.L.; López-Puertas, M.; Funke, B.; Bernath, P.F. Middle atmospheric changes caused by the January and March 2012 solar proton events. Atm. Chem. Phys. 2014, 14, 1025–1038. [Google Scholar] [CrossRef]
  29. Shea, M.A.; Smart, D.F. A Summary of Major Solar Proton Events. Sol. Phys. 1990, 127, 297–320. [Google Scholar] [CrossRef]
  30. Bazilevskaya, G.A.; Usoskin, I.G.; Flückiger, E.O.; Harrison, R.G.; Desorgher, L.; Bütikofer, R.; Krainev, M.B.; Makhmutov, V.S.; Stozhkov, Y.I.; Svirzhevskaya, A.K.; et al. Cosmic Ray Induced Ion Production in the Atmosphere. Space Sci. Rev. 2008, 137, 149–173. [Google Scholar] [CrossRef]
  31. Livesey, N.J.; Tang, A.J.; Chattopadhyay, G.; Stachnik, R.A.; Jarnot, R.; Kooi, J.W.; Millan, L.; Santee, M.L.; Chang, M.C.; Huang, R. A Continuity Microwave Limb Sounder (MLS) instrument to augment the record from Aura MLS. AGU Fall Meet. Abstr. 2020, 2020, A197-09. [Google Scholar]
Figure 1. Results of superposed epoch analysis of Aura MLS ozone altitudinal profiles over 60–80 NH before and after SPEs, which are summarized in Table 1.
Atmosphere 15 00944 g001
Figure 2. Results of superposed epoch analysis of Aura MLS ozone altitudinal profiles over 60–80 SH before and after SPEs, which are summarized in Table 2.
Atmosphere 15 00944 g002
Figure 3. Northern hemisphere ozone depletion (in %) after SPEs compared to the average ozone concentration observed before SPEs, which are summarized in Table 1. The ozone profile for each day is obtained using superposed epoch analysis of Aura MLS ozone altitudinal profiles for 60–80 NH after moderate SPEs with a proton flux intensity of more than 100 pfu.
Atmosphere 15 00944 g003
Figure 4. Northern hemisphere ozone depletion (in %) after SPEs compared to the average ozone concentration observed before SPEs, which are summarized in Table 1. The ozone profile for each day is obtained using superposed epoch analysis of Aura MLS ozone altitudinal profiles for 60–80 NH after strong SPEs with a proton flux intensity of more than 1000 pfu.
Atmosphere 15 00944 g004
Figure 5. Southern hemisphere ozone depletion (in %) after SPEs compared to the average ozone concentration observed before SPEs, which are summarized in Table 2. Each day ozone profile—results superposed epoch analysis of Aura MLS ozone altitudinal profiles for 60–80 SH after solar proton events. Moderate SPEs—with a proton flux intensity of more than 100 pfu.
Atmosphere 15 00944 g005
Figure 6. Southern hemisphere ozone depletion (in %) after SPEs compared to the average ozone concentration observed before SPEs, which are summarized in Table 2. Each day ozone profile—results superposed epoch analysis of Aura MLS ozone altitudinal profiles for 60–80 SH after SPE. Strong solar proton events—with a proton flux intensity of more than 1000 pfu.
Atmosphere 15 00944 g006
Table 1. Moderate solar proton events from September to March 2004–2024 with proton fluxes greater than 100 pfu that were selected for superposed epoch analysis.
SPE Start DateSPE Maximum Date>10 MeV Maximum (pfu)
Yr M/D (UTC)Yr M/D (UTC)
2004 09/13 20052004 09/14 0005273
2005 01/16 02102005 01/17 17505040
2005 09/08 02152005 09/11 04251880
2006 12/06 15552006 12/07 19301980
2012 01/23 05302012 01/24 15306310
2012 03/07 05102012 03/08 11156530
2013 09/30 05052013 09/30 2005182
2014 09/11 02402014 09/12 1555126
2017 09/05 00402017 09/08 0035844
2024 01/29 06152024 01/29 1805137
2024 03/23 08152024 03/23 1820956
Table 2. Moderate solar proton events from April to August 2004–2024 with proton fluxes greater than 100 pfu, that were selected for superposed epoch analysis.
SPE Start DateSPE Maximum Date>10 MeV Maximum (pfu)
Yr M/D (UTC)Yr M/D (UTC)
2005 05/14 052522005 05/15 02403140
2005 07/14 02452005 07/15 0345134
2005 08/22 20402005 08/23 1045330
2012 05/17 02102012 05/17 0430255
2013 04/11 10552013 04/11 1645114
Disclaimer/Publisher’s Note: The statements, opinions and data contained in all publications are solely those of the individual author(s) and contributor(s) and not of MDPI and/or the editor(s). MDPI and/or the editor(s) disclaim responsibility for any injury to people or property resulting from any ideas, methods, instructions or products referred to in the content.