Article

Evaluating the Impact of Increased Heavy Oil Consumption on Urban Pollution Levels through Isotope (δ13C, δ34S, 14C) Composition

by
Laurynas Bučinskas
*,
Inga Garbarienė
,
Agnė Mašalaitė
,
Justina Šapolaitė
,
Žilvinas Ežerinskis
,
Dalia Jasinevičienė
and
Andrius Garbaras
Center for Physical Sciences and Technology, Saulėtekio Ave. 3, LT-10257 Vilnius, Lithuania
*
Author to whom correspondence should be addressed.
Atmosphere 2024, 15(8), 883; https://doi.org/10.3390/atmos15080883
Submission received: 28 June 2024 / Revised: 19 July 2024 / Accepted: 23 July 2024 / Published: 24 July 2024

Abstract

:
The impact of heavy fuel oil (HFO) on the chemical and isotopic composition of submicron particulate matter (PM1) was investigated. For this purpose, we conducted an analysis of water-soluble inorganic ions (WSIIs) and multiple isotopes (δ34S, δ13C, 14C) of PM1 and SO2 collected during two heating periods: before (2021–2022) and during the use of HFO (2022–2023) in Vilnius, Lithuania. The results showed that the combustion of HFO increased the concentrations of SO2 (by 94%) and PM1-related sulfate (by 30%). It also altered the chemical composition of PM1, with sulfate becoming the predominant component (~40%) of WSIIs. The stable sulfur isotope ratios of SO234SSO2) and sulfate (δ34SPM1) shifted significantly to more negative values (δ34SSO2 = 0.4‰, δ34SPM1 = −0.3‰) compared to the previous heating period. Anticorrelation between δ13C and δ34S values indicated increased contributions of 13C-enriched fossil fuel sources (coal and HFO) in EC, although the share of fossil fuels in elemental carbon (EC) slightly decreased during the HFO period. The combustion of HFO affected the concentrations of PM1 chemical components and substantially impacted the isotopic composition and source contributions of sulfate and EC.

1. Introduction

In recent decades, concerns about air quality have attained global significance due to the rapid industrialization observed in many countries [1,2]. Submicron particulate matter (PM1) is one of the most significant pollutants, with substantial variability in concentration and chemical composition [3] and whose diverse constituents can significantly affect environmental and climatic processes [4,5]. PM1 mainly comprises carbonaceous materials, including organic and elemental carbon (OC and EC), and water-soluble inorganic ions (WSIIs) such as sulfate (SO42−), nitrate (NO3), and ammonium (NH4+) [6,7,8]. Organic carbon encompasses a wide range of organic compounds [9], including those directly emitted from natural and anthropogenic sources (primary OC [10,11,12]) and those formed in the atmosphere through chemical reactions (secondary OC [5,13,14,15]), whereas EC is released directly from incomplete combustion processes such as fossil fuel combustion and biomass burning. EC can persist in the atmosphere for several days due to its chemical inertness, significantly contributing to atmospheric warming [16,17]. Secondary inorganic ions (SO42− and NO3) predominantly form in the atmosphere through chemical reactions from their gaseous precursors, sulfur dioxide (SO2) and nitrogen oxides (NOx). Water-soluble inorganic ions (WSIIs) influence the hygroscopic properties [18] and acidity of PM [19]. They also significantly contribute to visibility degradation [20] and enhance the formation of haze [21,22,23].
Numerous control measures have been implemented in Europe’s energy, manufacturing, industry, and transport sectors to achieve substantial improvements in air quality. The EURO vehicle standards have led to a 50% reduction in PM2.5 emissions from global road transport exhaust [24]. Fuel quality directives, which regulate sulfur content and promote the use of less carbon-intensive fuels such as natural gas instead of coal or fuel oil, have resulted in decreased emissions of SO2 and PM [24,25].
The Russian invasion of Ukraine in February 2022 triggered a significant crisis in the European gas market. The substantial reduction in Russian gas supply led to unprecedented increases in European gas prices, reaching record highs in 2022 [26]. The Lithuanian government has authorized the use of low-sulfur (0.9%) heavy fuel oil (HFO) for central heating as a substitute for natural gas, maintaining stable heating prices for consumers. Heavy fuel oil releases significant quantities of particulate matter [27,28], sulfur dioxide [29,30], nitrogen oxides [31], and heavy metals [32,33], making it a crucial factor influencing urban air quality [34]. During the 2022–2023 heating period, heavy fuel oil comprised approximately 36% of the fuel utilized for heat production in the Vilnius power station [35]. With significant changes in emission sources during the recent heating season, there was a clear need for a comprehensive study on the impact of HFO combustion on urban air quality.
To assess the impact of HFO usage on the air quality of Vilnius, we compared the period of HFO usage to the conventional heating (CH) period of 2021–2022, when HFO was not used in thermal power stations. Studies of this kind are rare because of the unique opportunity to compare two distinct periods: one characterized by increased heavy fuel oil usage and the other without it. Stable isotope analysis provides a valuable tool for identifying the origin of aerosols and their formation processes [36,37,38,39]. Furthermore, the combination of stable carbon and radiocarbon isotope (δ13C and 14C) methods allows for even more detailed characterization of the particles formed during the combustion of coal, liquid fossil fuels, and biomass [40,41]. Although radiocarbon analysis provides an unambiguous distinction between fossil and non-fossil sources [12,40,42], partitioning sources of distinct fossil fuels oftentimes poses inherent difficulties due to overlapping stable isotope value ranges [43,44,45]. On the other hand, sulfur isotope analysis is useful for tracking secondary sulfate-forming reactions [46,47,48] and has been applied to investigate their sources [49,50,51,52,53]. Numerous previous studies either applied carbon isotopes to describe fossil fuel combustion contributions [40,54,55,56] or applied sulfur isotopes to characterize distinct anthropogenic sources and sometimes the fraction of oil combustion itself [48,52,53]. Therefore, the application of combined analysis (δ34S, δ13C, and 14C measurements) can provide a detailed description of pollution sources and atmospheric reactions and can help elucidate the impact heavy fuel oil usage had on local air quality in Vilnius. This study provides wintertime concentration levels of water-soluble inorganic ions (WSIIs) in PM1 in Vilnius, Lithuania, both before (2021–2022) and during (2022–2023) the introduction of heavy fuel oil. The analysis of PM1’s chemical and isotopic (δ13C, δ34S, 14C) composition was performed to characterize the contribution of fossil fuel sources to carbonaceous (EC) and sulfur-containing PM1 during selected heating periods.

2. Materials and Methods

2.1. Sampling Site

The sampling site was located in the southeastern part of Lithuania, specifically in the capital city of Vilnius (54.72 N, 25.32 E). The sampling station for PM1 sulfate and SO2 gas samples was on the rooftop of a four-story building (158 m a.s.l., 25 m a.g.l.), within the Center for Physical Sciences and Technology (Figure 1, marked by a star). The site is positioned in a forested environment surrounded by a combination of residential and private properties. The site is situated in a relatively low-traffic zone, located more than 1 km east of a bustling highway. Furthermore, pollution advecting from the more urbanized parts of the city (southwest direction) influences air quality at the sampling site.
The thermal power station (TPS) in Vilnius is the largest of its kind in the city, located approximately 8.9 km southwest of the sampling site (Figure 1, marked by a chimney). It boasts a substantial heating capacity of 913 MW and generates 24 MW of electric power. This facility plays a crucial role in providing heating and electricity to Vilnius, particularly during the colder months.

2.2. Sample Collection

Weekly samples of PM1 and SO2 were collected simultaneously using a tandem filter setup. Initially, a quartz fiber filter (Whatman QM-A) 0.15 m in diameter was used to capture deposited PM1 samples. Positioned beneath it, a K2CO3-impregnated glass fiber filter (Sartorius MG 227/1/60, Bohemia, NY, USA) was employed to collect SO2 gasses. A high-volume PM1 sampler (DIGITEL DH-77, Volketswil, Switzerland) operating at a flow rate of 0.5 m3/min facilitated sample collection. Filters underwent pre-treatment at 500 °C for 8 h prior to sampling. Twenty-three samples of submicron particulate matter (PM1) and twenty-one SO2 gas samples were collected during two heating periods (2021–2022 and 2022–2023) spanning from 28 October to 31 March. After sampling, the filters were individually separated, wrapped in pre-combusted aluminum foil, sealed in plastic bags, and stored at −20 °C in a freezer until further analysis. Ultimately, the samples collected on quartz fiber filters were used for stable isotope measurements of elemental carbon and sulfate, as well as for radiocarbon and water-soluble inorganic ion concentration measurements. K2CO3-impregnated glass fiber filters were used only for the stable isotope measurements of SO2 gasses.

2.3. Stable Isotope Measurements

For the analysis of their isotopic composition, PM1 and SO2 samples required pre-treatment for both sulfur and elemental carbon measurements. The elemental carbon fraction was separated from organic carbon by combusting a single punch (2.84 cm2) of quartz fiber filter material with collected PM1 at 375 °C [57,58]. Following this, the filter material was pretreated with 37% HCl vapors in a glass desiccator for 12 h to remove the carbonate fraction [59,60]. Then, HCl was replaced with NaOH pellets to neutralize any remaining acid from the samples. After these procedures, the filter punch was packed in a tin capsule for stable carbon isotope measurements.
For the isotopic composition measurements of sulfur, half of the quartz fiber filter (76.97 cm2) was used for sulfate extraction, while the entire impregnated glass fiber filter was utilized for SO2 pretreatment. The following methods of sulfate extraction were nearly identical for SO2 and PM1. The filter material was shredded and immersed in 100 mL ultrapure water. For SO2 samples, 30% hydrogen peroxide was added to oxidize SO2 to SO42−. The samples were ultrasonicated and left overnight. The next day, they were filtered using 0.22 μm syringe filters, and the filtered solution was acidified to a pH between 2 and 3 with HCl. Then, 5 mL of 1 mol/L of BaCl2 was added to precipitate the sulfate as BaSO4. The following day, the precipitate was collected on 0.2 μm cellulose acetate filters and any remaining Cl was washed away with ultrapure water. The samples were dried, and the filter material was combusted at 500 °C, leaving only the BaSO4 behind. For the isotope analysis, 0.50 mg of BaSO4 was packed with vanadium pentoxide (V2O5) powder within tin capsules.
Stable isotope ratio values were measured using an elemental analyzer (EA, Thermo Flash EA 1112, Marlton, NJ, USA) connected to an isotope ratio mass spectrometer (IRMS, Thermo Delta V Advantage, Sheffield, UK). Stable isotope values of carbon and sulfur were measured in per mille (‰) and are expressed as follows:
δ X = R s a m p l e R r e f e r e n c e R r e f e r e n c e · 1000
where δX is the δ value of a particular element X (C or S), which denotes the relative difference between the isotope ratios of the measured sample and the reference material. Rsample is the isotope ratio of 13C/12C (or 34S/32S) in the sample, and Rreference is the isotope ratio of the reference material Pee Dee Belemnite (PDB) for carbon and Vienna Canon Diablo Triolite (VCDT) for sulfur. For scale normalization, caffeine IAEA-600 and graphite USGS24 reference materials were used for carbon isotope analysis, and IAEA-S-1 and NBS-127 reference materials were used for sulfur isotope analysis. Generally, measurement precision was better than 0.2‰ for carbon and 0.3‰ for sulfur. When possible, multiple measurements of each sample were made, and blank correction was applied to eliminate the influence of filter materials.

2.4. Radiocarbon Measurements

For radiocarbon measurements, aerosol samples were first graphitized using an Automated Graphitization System coupled with an Elemental Analyzer (EA-AGE-3, Ionplus AG, Dietikon, Switzerland). Due to very low elemental carbon amounts in samples, the graphitization of low-carbon aerosol filters (PM1) involved employing the sample dilution method and using the mass balance equation to estimate 14C values, as described in detail in a study by Butkus et al. [61]. Following this method, aerosol samples with as little as 40 µg of carbon could be graphitized. With the EA-AGE-3 system, multiple pieces or punches of a single sample could be combusted separately, and the resulting CO2 gas was captured by a zeolite trap and subsequently transferred into a single reactor. Thus, 10 punches (28.35 cm2) of the filter sample containing low carbon content were combusted, while the remaining carbon needed for graphitization was supplemented with 14C-free reference material (phthalic anhydride, PhA, 0 pMC). The 14C values were then calculated using a mass balance equation:
p M C m i x t u r e = p M C ( s ) n ( s ) + p M C P h A n P h A
p M C ( s ) = p M C m i x t u r e p M C P h A n P h A n ( s )
where pMC(mixture)—measured pMC of the mixture, pMC(s)—pMC of the sample, n(s) is the partial contribution of the sample; pMC(PhA)—pMC of phthalic anhydride, n(PhA) is the partial contribution of the phthalic anhydride.
Radiocarbon analysis was performed using a Single-Stage Accelerator Mass Spectrometer (SSAMS, National Electrostatics Corp., Middleton, WI, USA). The background of measurements using phthalic anhydride (Alfa Aesar) was estimated at 0.25 pMC (percent of modern carbon), the NIST OXII (134.06 pMC) standard was used as reference material, and the 14C/12C ratio was measured with an accuracy better than 0.3%. Isotopic fractionation was corrected with the ratio of 13C to 12C.
In this study, the fraction of modern carbon is used and expressed as [62]
f M   = ( C 14 / C 12 ) s a m p l e 0.749 ( C 14 / C 12 ) O x I I
where (14C/12C)sample is the 14C/12C ratio of the sample and (14C/12C)OxII is the ratio of the isotope reference material (OxII).
We can calculate the fraction of non-fossil carbon (fnf), considering that fM for fossil fuel sources is equal to 0, and using a fM value of 1.02 [63,64,65] for contemporary biomass burning sources. Fraction fnf estimates that the biomass used for domestic heating primarily originates from contemporary sources [40,66]. The non-fossil carbon fraction can be determined as follows:
f n f = f M 1.02
Additionally, we can calculate the fraction of fossil carbon as follows:
f f = 1 f n f

2.5. Water Soluble Inorganic Ions and SO2 Concentration Measurements

First, a punch (0.20 cm2) of quartz filter material was placed into a tube, and 10 mL of high-purity water was added to dissolve water-soluble inorganic ions (WSIIs). The sample tubes were then ultrasonicated for 30 min, and the solution was then filtered through a 0.22 μm syringe filter. The concentrations of WSIIs were then measured using an ion chromatograph (850 Professional IC, Metrohm, Herisau, Switzerland). Inorganic anions were separated using a Metrosep A Supp 7–250/4.0 column. The eluent used was 3.6 mM sodium carbonate, and 20 mM H2SO4 was used as a regenerant. Ambient SO2 concentration data were obtained from a local monitoring station located 8.5 km away from the sampling location.

2.6. Meteorological Data

Meteorological observation data, including temperature, humidity, wind speed, and mixed layer depth, were obtained from publicly accessible data provided by the National Oceanic and Atmospheric Administration (NOAA) [67].
NOAA HYSPLIT model was used to model backward air mass trajectories for the corresponding sampling periods [68]. To assess the influence of distant air masses, they were categorized as ‘clean’ or ‘polluted’ [69]. Air masses originating from the western regions of Europe, such as Germany and Poland, as well as from the northern and eastern regions, including Latvia, Estonia, Belarus, Ukraine, and Russia, were considered moderately polluted. Southwestern and southern regions were labeled as more polluted directions (Southern Poland, Germany and Czechia). The northwestern direction (Baltic Sea, Scandinavia) was classified as clean. Examples of prevailing air masses are given in Figure S1.

3. Results and Discussion

3.1. Concentration of Water-Soluble Inorganic Ions and SO2

The winter period of 2021–2022 was classified as the conventional heating (CH) period during which biomass and natural gas contributed 61% and 39%, respectively, to the total fuel utilized for thermal energy generation at the Vilnius thermal power station [70]. During the 2022–2023 heating season, low-sulfur (0.9%) heavy fuel oil largely replaced natural gas at the Vilnius thermal power station. This period is referred to as the heavy fuel oil (HFO) period in the rest of this study. During this period, the primary fuel for heating generation was biomass (56%), followed by heavy fuel oil (36%), with smaller contributions from natural gas (7%) and diesel (1%) [35]. Both periods exhibited similar seasonal meteorological conditions. During the CH period, the averages of temperature, relative humidity, mixed layer depth, and wind speed were 0.6 ± 2.8 °C, 82 ± 14%, 503 ± 124 m, and 16.1 ± 4.4 km/h, respectively. The prevailing air mass directions were from the southwest, west, and northwest. During the HFO period, the averages of temperature, relative humidity, mixed layer depth, and wind speed were −0.3 ± 3.4 °C, 90 ± 5%, 430 ± 118 m, and 15.4 ± 3.5 km/h respectively. The prevailing air mass directions were also similar to the previous period (southeast, southwest, and west).
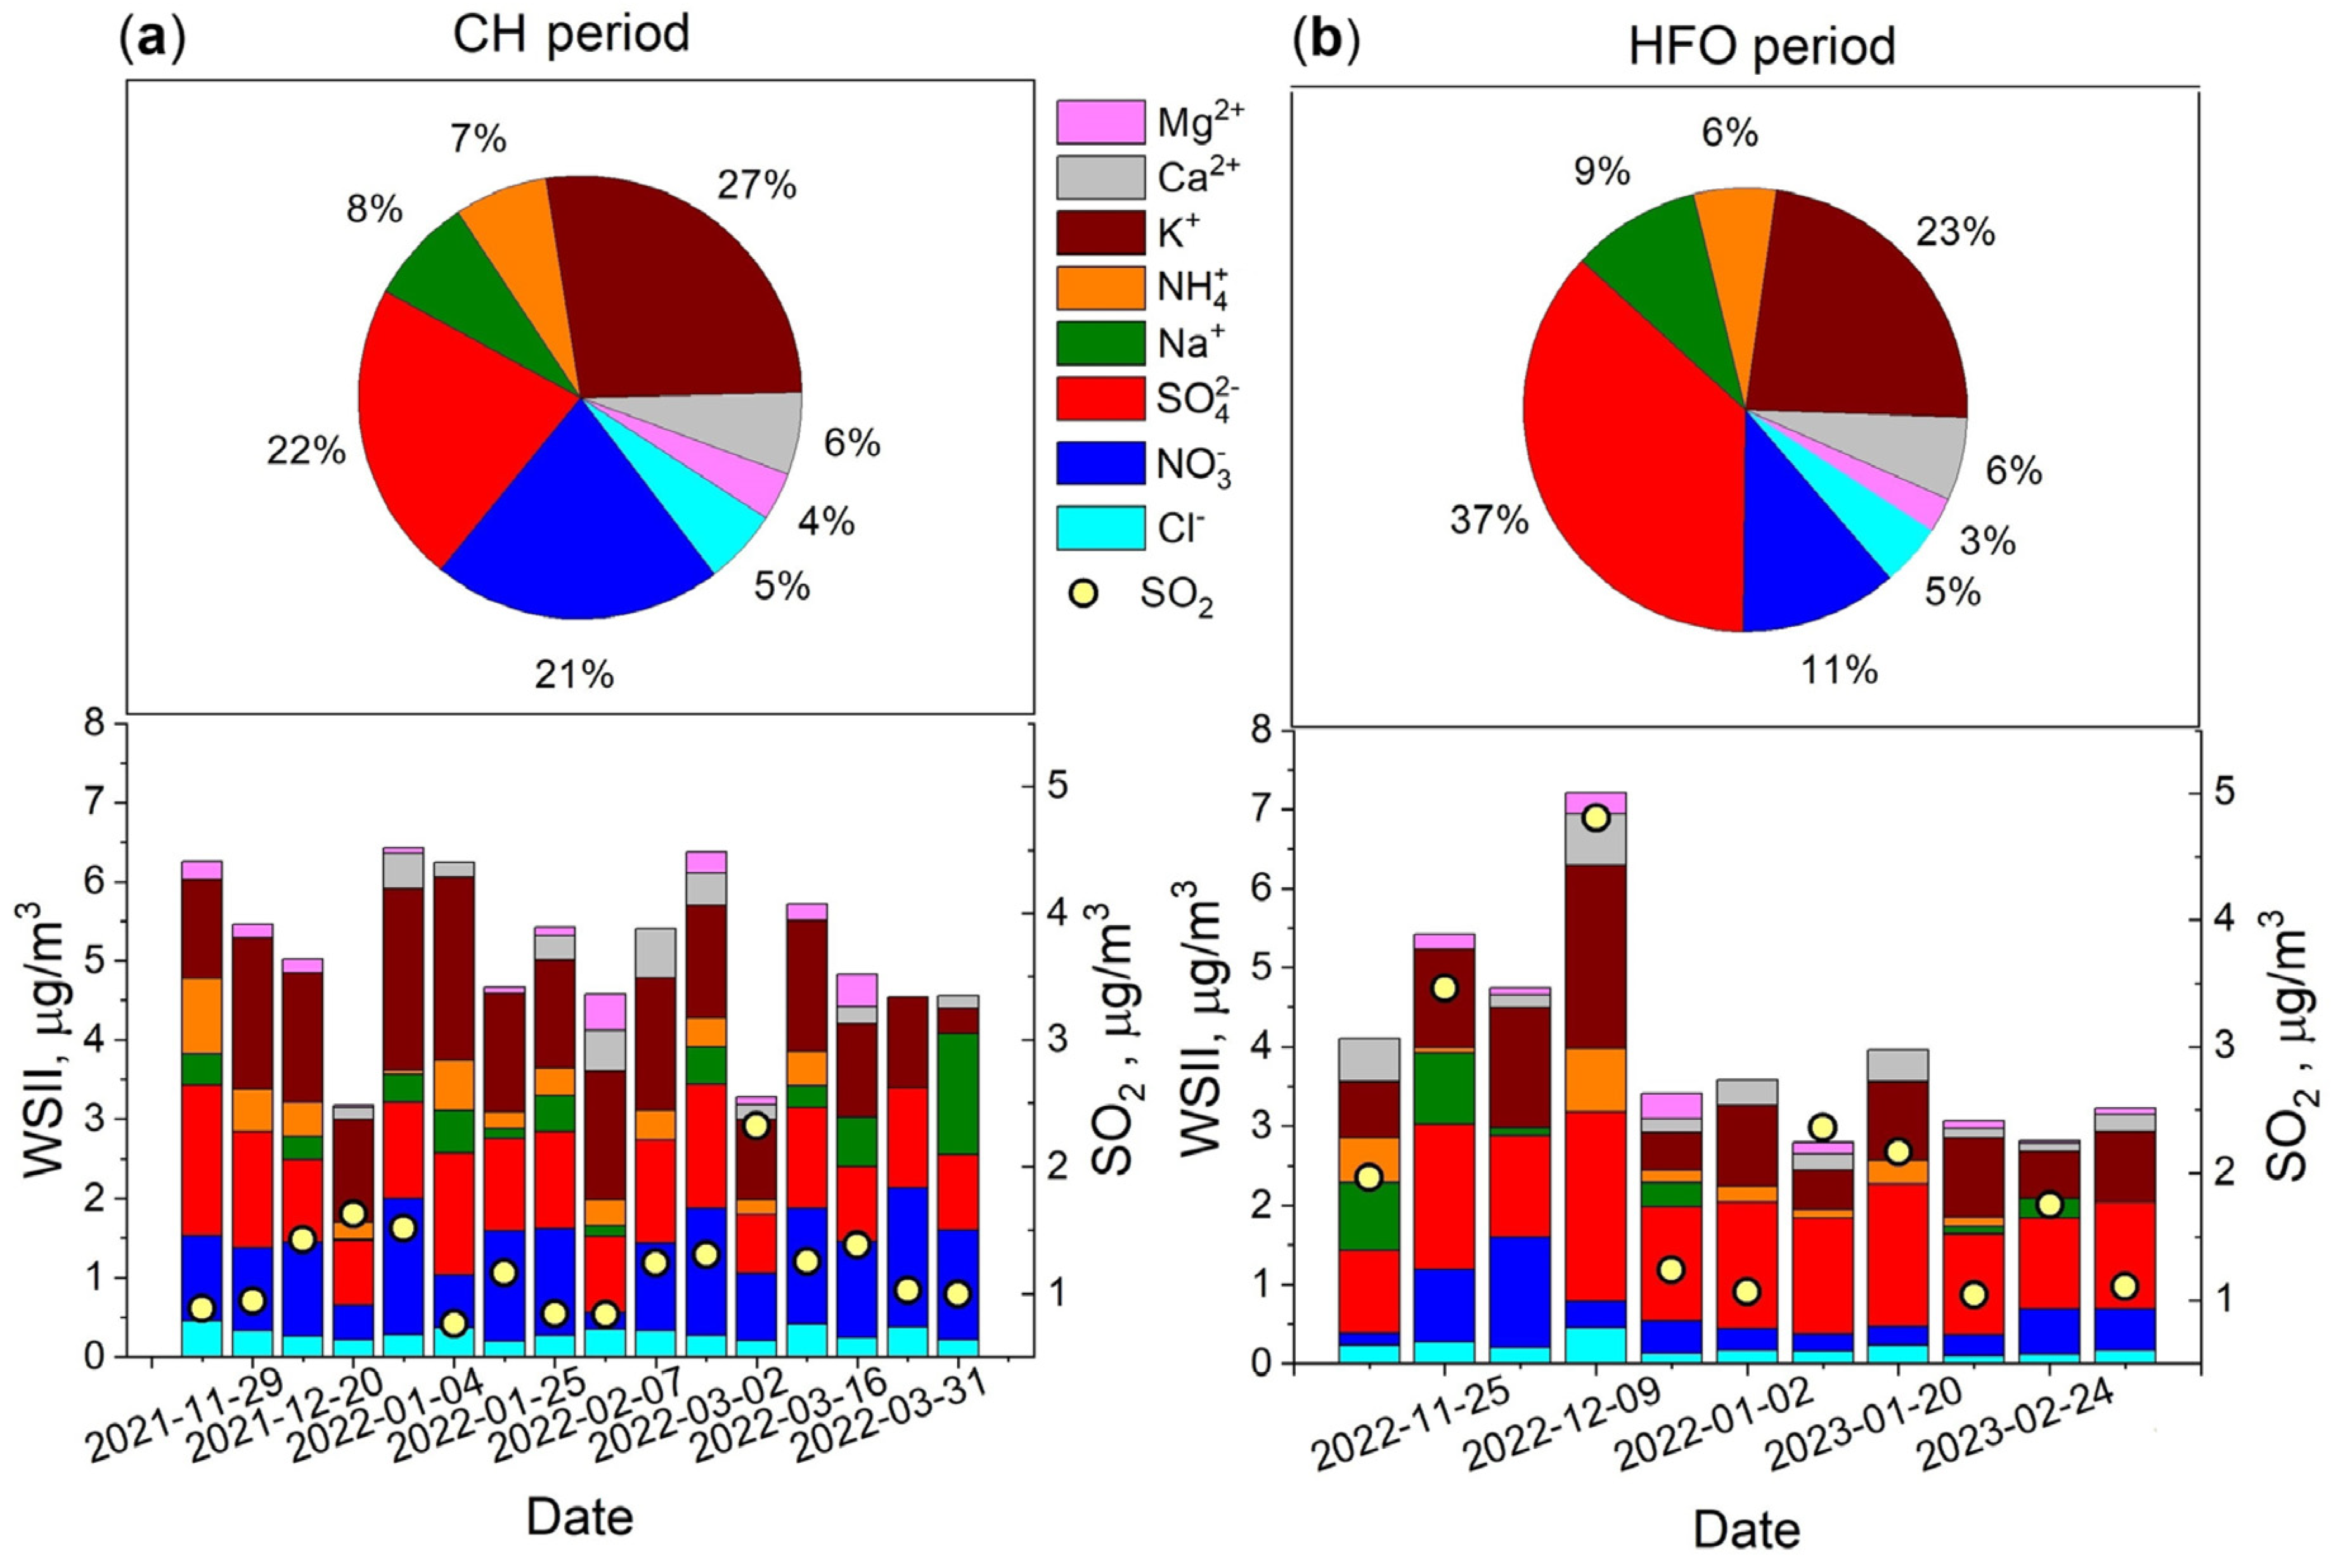
A time series of the concentrations of eight water-soluble inorganic ions (Na+, NH4+, K+, Mg2+, Ca2+, Cl, NO3, and SO42−) during both periods is presented in Figure 2. Three out of eight ions (SO42−, K+ and NO3) were the most abundant, accounting for about 70% of WSIIs during both periods (Figure 2). The CH period was characterized by concentration levels of WSIIs following the order: K+ > SO42− > NO3 > Na+ > NH4+ > Ca2+ > Cl > Mg2+. The concentrations of total WSIIs (sum of Na+, NH4+, K+, Mg2+, Ca2+, Cl, NO3, and SO42−) varied from 3.17 to 6.42 μg/m3 during the CH period, with an average of 5.12 μg/m3. The average concentrations of potassium, sulfate, and nitrate were 1.61 ± 0.48, 1.16 ± 0.31, and 1.05 ± 0.44 μg/m3, respectively. K+ was the predominant ion during this period, accounting for 27% of total WSII, largely due to significant emissions from biomass burning (61%) [70].
During the HFO period, concentrations of WSIIs ranged between 2.79 and 7.21 μg/m3, with an average value of 4.03 μg/m3. The average concentrations of WSIIs in PM1 followed a different trend, namely SO42− > K+>NO3 > Na+ > NH4+ > Ca2+ > Cl > Mg2+, during this period. The concentration levels of NO3- and K+ were lower, with average values of 0.47 ± 0.37 and 1.04 ± 0.58 μg/m3, respectively. In contrast, sulfate concentrations increased modestly by a factor of 1.3, with an average value of 1.53 ± 0.38 μg/m3. The chemical composition of PM1-related WSIIs was similar during both (CH and HFO) periods, with the exception of sulfate and nitrate. The share of sulfate increased from 22% in the 2021–2022 heating season to 37% in the 2022–2023 heating season, while the relative contribution of nitrate decreased by 10%, reaching only 11% during the HFO period. Additionally, the use of HFO had a significant impact on SO2 concentrations and, as shown in Figure 2, concentrations doubled from 1.30 ± 0.39 μg/m3 during the CH period to 2.54 ± 2.13 μg/m3 during the HFO period.
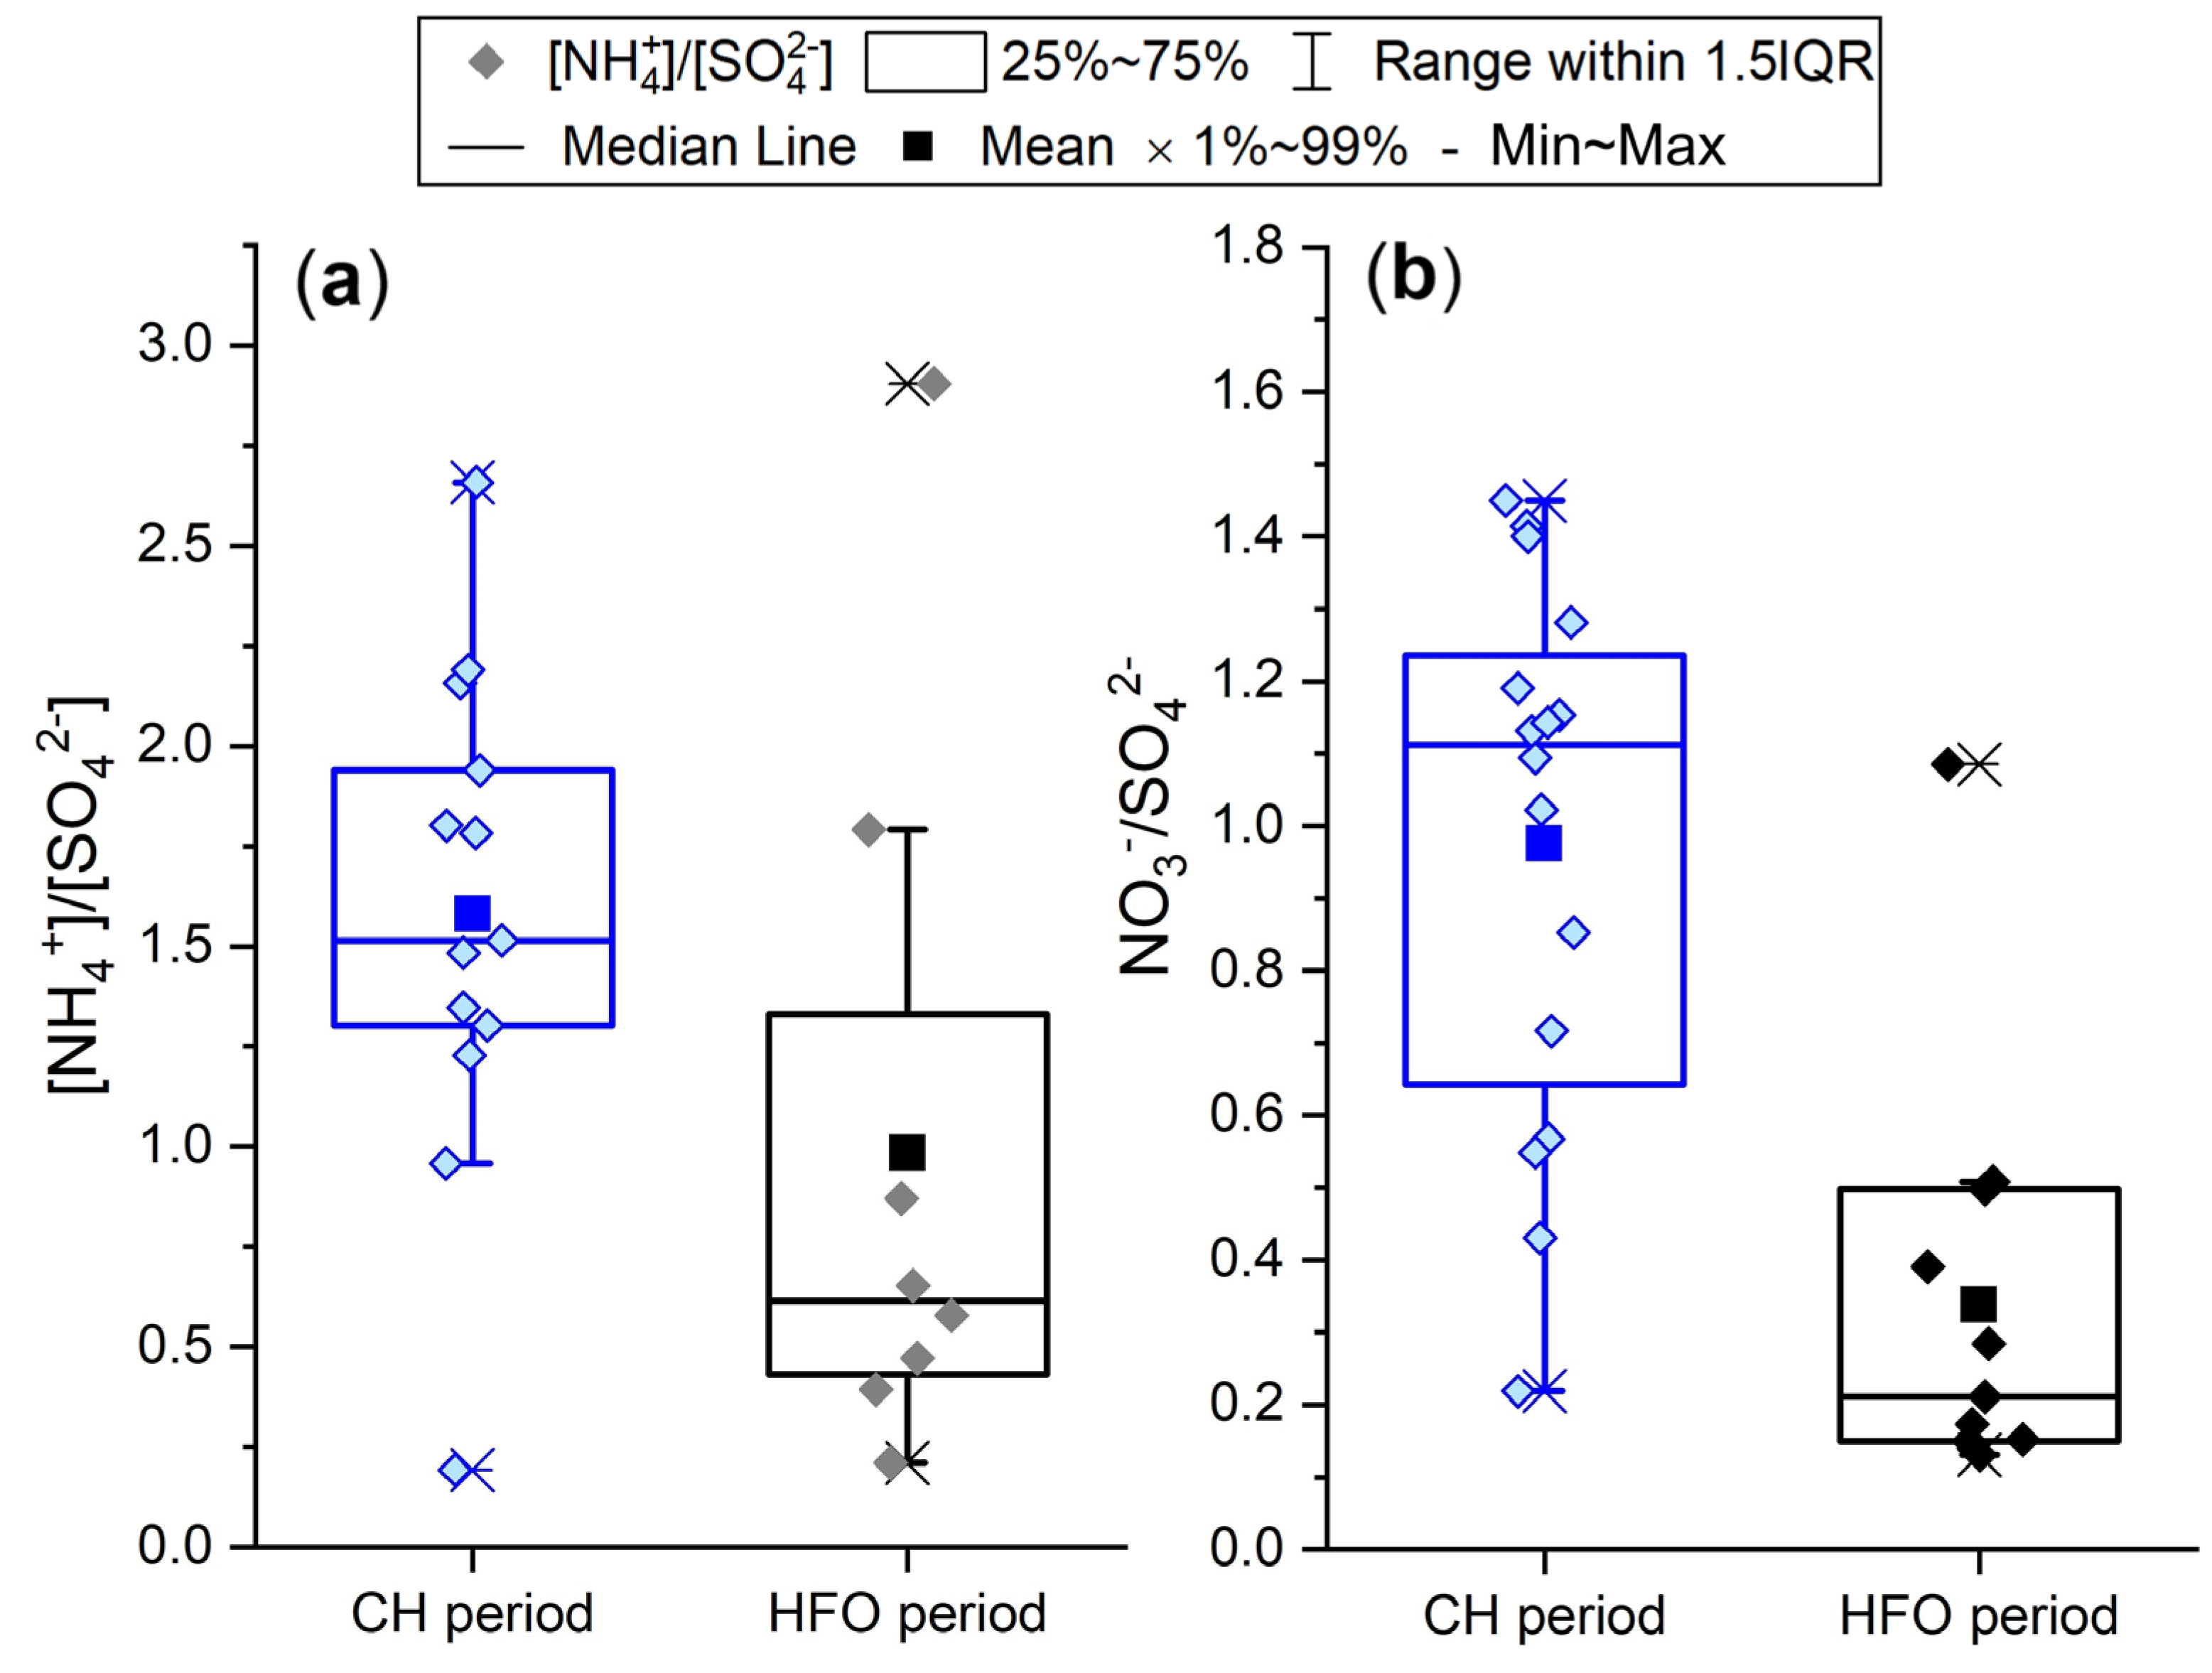
During the CH period, the concentrations of sulfate (1.16 μg/m3) were on similar level to SO2 concentrations (1.3 μg/m3) due to the absence of intense local sulfur pollution sources. Sulfate showed a moderate correlation with SO2 (r = −0.55, p < 0.05), indicating an increased contribution of distant sources to sulfate concentrations in Vilnius during the 2021–2022 heating season. Sulfate correlated significantly only with ammonium (r = 0.77, p < 0.05), suggesting that the main form of sulfate in PM1 could be (NH4)2SO4. The higher NO3 concentrations can be attributed not only to intense emission sources, but also to various chemical factors, including the concentrations of gaseous precursors (SO2, NOx and NH3) and the thermodynamic equilibrium between gas and particulate phases [71,72]. The neutralization of sulfuric acid by ammonia and the subsequent formation of particulate ammonium sulfate usually outweigh the formation of ammonium nitrate. Ammonium nitrate is formed only in the presence of an excess of ammonium [73,74]. The high [NH4+]/[SO42−] molar ratio (1.6 ± 0.5) together with the significantly increased NO3/SO42− ratios (0.90 ± 0.78) suggest that lower SO2 concentrations during the CH period could contribute to higher nitrate formation (Figure 3). In contrast, during the HFO period, high SO2 concentrations with a low [NH4+]/[SO42−] molar ratio (0.98 ± 0.52) and small NO3/SO42− ratio (0.34 ± 0.31) were observed (Figure 3), indicating a limited formation of NH4NO3.
A strong correlation between sulfate and K+ was found (Figure S2b, r = 0.72, p < 0.05), suggesting that K2SO4 was the predominant form of PM1-related sulfate during the HFO period. The relationship between K+ and sulfate in secondary particulate matter affected by biomass burning has been established in several studies [75,76,77]. The formation of K2SO4 could result from rapid photochemical oxidation or aqueous phase reactions between KCl (emitted during biomass burning) and SO2 [78]. In this study, the S/K ratio of 0.6 was closely aligned with the S/K values observed near biomass burning sources [75,79], indicating local sulfate formation. These results highlight the significant influence of heavy fuel oil usage on both SO2 concentration levels and the subsequent pathways of PM1-related sulfate formation.

3.2. Carbon and Sulfur Isotope Analysis

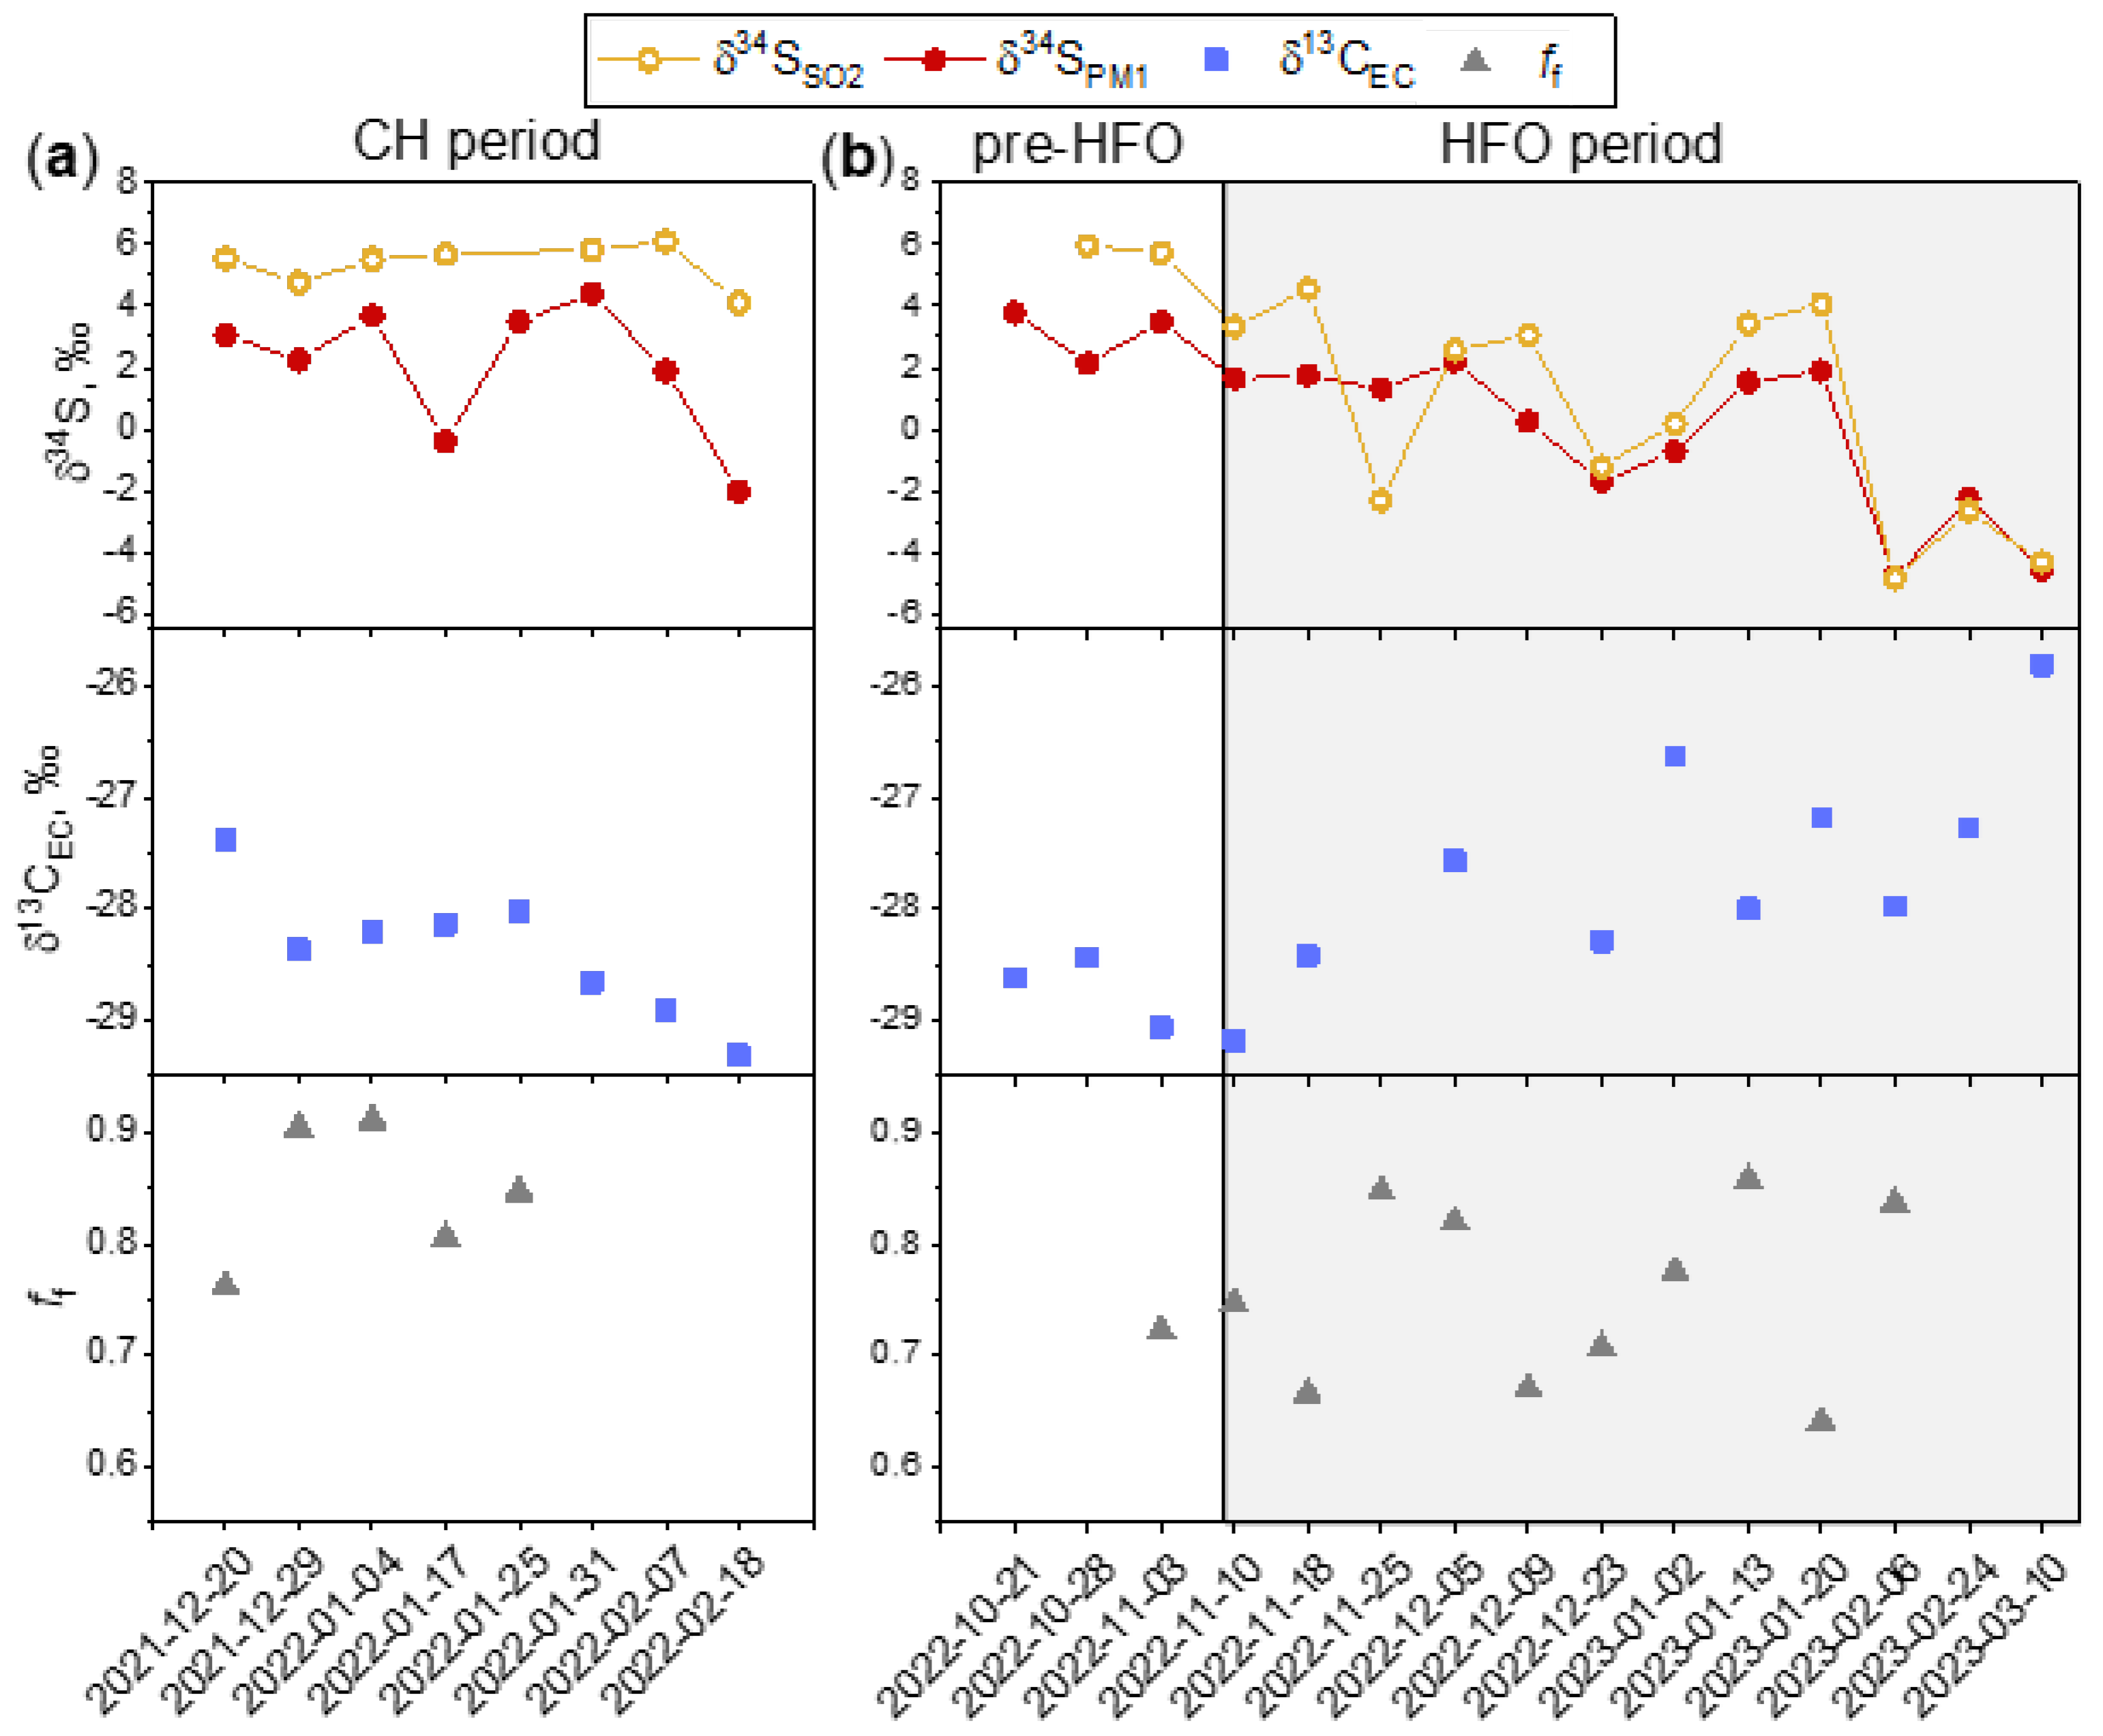
Stable isotope values of SO234SSO2) and PM1 sulfate (δ34SPM1), along with stable isotope values of EC (δ13CEC) and the fraction of fossil fuel-derived EC (ff) are given for both periods of 2021–2022 (CH) (Figure 4a) and 2022–2023 (HFO) (Figure 4b). During the CH period, δ34SSO2 values were relatively stable and varied from 4.8‰ to 6.1‰ with an average of 5.4 ± 0.6‰. Measured stable isotope values of SO2 reflect the influence of local sulfur emission sources due to the absence of large SO2 emission sources around Vilnius and due to its short atmospheric lifetime (~12 h) [80]. Measured values are similar to δ34S values of biomass burning (7.3–9.1‰ [81]) and traffic emissions (4.0–8.0‰ [82]) indicative of their increased contributions. Thus, during the CH period, δ34SSO2 values suggest that local emission sources remained constant. On the other hand, the δ34SPM1 values of sulfate were more negative and varied considerably, ranging from -2.0‰ to 4.4‰ with an average of 2.0 ± 2.1‰. Thus, δ34SPM1 values suggested a fluctuating influence of sulfur pollution sources. The lowest recorded values on 17 January 2021 (−0.4‰), 7 February 2021 (1.9‰), and 18 February 2021 (−2‰) are close to or are even lower than those typically associated with coal combustion sources (−1.0 to 4.4‰) [45]. Previous studies have reported [83] that air masses coming from the southwestern direction significantly affect sulfur pollution levels in Vilnius. During the days with the most negative δ34SPM1 values, air masses originated from neighboring countries to the southwestern direction (Figure S1), where coal is extensively used for domestic heating and energy production [84,85]. Overall, during CH period, δ34SSO2 values represented local sulfur pollution sources, whilst δ34SPM1 values indicated the influence of distant pollution sources.
Elemental carbon values of δ13CEC ranged from −27.4‰ to −29.3‰, with an average of −28.4 ± 0.6‰ (Figure 4a). These values fall in the range of biomass burning values of the EC fraction (EC: −29.9‰ to −25.4‰ [44,86,87]) and are close to traffic emission values (TC: −31.6 to −29.89‰ [88]) but are outside the typical coal combustion values (δ13CEC: −24.7–−23.3‰ [86,89,90]). Additionally, during the CH period, fossil fuel fraction varied between 76 and 91% (Figure 4a), averaging 85 ± 6%, representing the combined contributions of coal combustion and traffic emissions. Thus, the non-fossil fuel (biomass burning) fraction contributed ~15%, accordingly, which is comparable to previous studies [54,55,91,92] and supports our hypothesis regarding various pollution sources (local and distant).
The HFO period (Figure 4b) displays significant differences in δ34S values for both SO2 and sulfate in comparison to the CH period. During the HFO period, the previously stable background of low SO2 pollution (CH period) and its consistent δ34SSO2 values are disrupted by increased HFO emissions and a considerable variability in δ34SSO2 values is observed. δ34SSO2 values show a gradual shift towards more negative values, ranging from −4.9‰ to 4.6‰ and, on average, being equal to 0.4 ± 3.2‰. Similarly, δ34SPM1 values displayed an average of −0.3 ± 2.4‰, with a minimum-recorded value of −4.8‰. During the HFO period, both δ34SSO2 and δ34SPM1 exhibited unusually negative values, which fall outside the δ34S range typical of sulfur pollution sources such as biomass burning, coal combustion, or traffic emissions observed in Lithuania [83]. These negative δ34S values may therefore indicate the influence of an additional source, possibly that of heavy fuel oil utilized in the thermal power station. Unfortunately, the δ34S value of HFO used in Vilnius TPS during this time is unknown; thus, it cannot be directly compared to measured emission values. To our knowledge, no studies in recent decades have measured the δ34S values of HFO emissions in Eastern or Northern Europe. However, previous studies have shown that fuel oil can exhibit a wide range of δ34S values, depending on the fuel origin [51]. The δ34S values measured during the HFO period could possibly be of Middle Eastern origin (δ34S values vary from −11.5‰ to −2.7‰) [93]. Moreover, during the HFO usage period, the δ34SPM1 values approach those of δ34SSO2, with an average difference of 0.7‰, while during the CH and pre-HFO period, the difference between δ34SPM1 and δ34SSO2 was 2.23‰ and 3.31‰, accordingly. Thus, during the HFO period, characterized by increased SO2 concentrations, the influence of local pollution sources predominates over distant sources. Consequently, both δ34SSO2 and δ34SPM1 values predominantly indicate local sulfur emissions, in contrast to the CH period, when distant sources took precedence.
δ13CEC values during the HFO period show a gradual shift towards more positive values, starting from an average of −28.8 ± 0.3‰ (pre-HFO period) and reaching an average of −27.5 ± 0.8‰ (HFO period) with a highest recorded value of −25.8‰ (Figure 4b). δ13CEC values could possibly indicate a rising impact of HFO emissions (~−25.5% in particles [43]). Widory [43] found that fractionation around 3‰ occurs during the combustion of fuel oil. In the case of current measurements in Vilnius, the initial δ13C value of fuel oil is unknown. However, particles enriched with more 13C during the HFO period may indicate that the carbon delta values may have been influenced by fuel oil during this period. Furthermore, during this period, the observed trend towards more negative values of both δ34SSO2 and δ34SPM1, along with a coincident shift of δ13CEC towards more positive values, suggests a common pollution source. This is also evidenced by a significant negative correlation between δ34SPM1 and δ13CEC (Figure S3, r = −0.6, p < 0.05).
During the HFO period, the fossil fuel emission fraction of total EC (average 75 ± 7%) slightly decreased in comparison to the CH period (Figure 4b). A boxplot comparison between the periods is given in Supplementary Material (Figure S4). The decrease in ff during the HFO period could have been caused by increased emissions from biomass burning, with recorded δ13CEC values falling within the range typical of biomass burning values. Although, as previously stated, δ13CEC values become more positive, indicating an influence of additional source, possibly of HFO combustion.
In summary, the isotopic composition results of SO234SSO2), sulfate (δ34SPM1), and elemental carbon (δ13CEC) reveal clear trends caused by increased heavy fuel oil usage in the Vilnius thermal power station during the 2022–2023 heating season. However, the fraction of fossil fuel emissions slightly decreased during the HFO period, attributable to varying contributions of fossil and non-fossil fuel combustion to the aerosol budget.

4. Conclusions

To evaluate the impact of heavy fuel oil (HFO) usage on air quality in Vilnius, Lithuania, a comparative analysis was conducted on the wintertime concentration levels of water-soluble inorganic ions (WSIIs) in PM1 during two periods: the conventional heating period (CH period: 2021–2022) and the period of HFO introduction (HFO period: 2022–2023). Significant impacts of HFO usage on the pollution levels and source contributions of sulfur-containing species in Vilnius were observed, evidenced by changes in stable isotope values of sulfur dioxide (SO2) and particulate matter sulfate (PM1). The combustion of HFO led to a 94% increase in SO2 concentrations and a 30% increase in PM1-related sulfate. This process also altered the chemical composition of PM1, making sulfate the predominant component (~40%) of water-soluble inorganic ions. During the 2021–2022 period, characterized by the absence of HFO, δ34SSO2 values were relatively stable (5.4 ± 0.6‰). This stability is indicative of a mixture of sulfur emissions originating from local biomass burning and traffic sources. In contrast, δ34SPM1 values during the same period exhibited significant variation (2.0 ± 2.1‰), influenced by the origin of the air masses. This variation accentuates the substantial influence of distant pollution sources on the sulfate budget in Vilnius during the 2021–2022 period. Conversely, during the 2022–2023 period, when HFO was used, both δ34SSO2 and δ34SPM11 values shifted towards more negative values (δ34SSO2 = 0.4 ± 3.2‰, δ34SPM1 = −0.3 ± 2.4‰), indicating a predominant influence of local HFO emissions over distant sources. The overall fraction of fossil fuel contribution in EC marginally decreased during the HFO period (75 ± 7%) compared to the CH period (85 ± 6%). Concurrently, δ13CEC values became more positive, indicating a shift in the EC isotope composition towards 13C-enriched fossil fuel emission sources (possible HFO combustion). Ultimately, this study underscores the influence of fuel type changes on local air quality and the isotopic signatures of particulate matter and sulfur dioxide.

Supplementary Materials

The following supporting information can be downloaded at: https://www.mdpi.com/article/10.3390/atmos15080883/s1, Figure S1: Examples of prevailing backward air mass projections, made using the NOAA HYSPLIT model; Figure S2: Correlation between the concentrations of SO42− and K+ during the (a) conventional period (CH, p < 0.05) and (b) increased heavy fuel oil usage period (HFO, p < 0.05); Figure S3: δ34SPM1 dependence on δ13CEC values (p < 0.05) during the years 2022–2023; Figure S4: Comparison between ff values of the conventional heating period (CH) and the heavy fuel usage period (HFO).

Author Contributions

Conceptualization, A.G. and I.G.; methodology, L.B.; validation, A.M. and I.G.; formal analysis, L.B. and I.G.; investigation, L.B. and I.G.; resources, A.G.; data curation, A.G., D.J. and Ž.E.; writing—original draft preparation, L.B.; writing—review and editing, I.G., A.M. and J.Š.; visualization, L.B. and I.G.; supervision, A.G. All authors have read and agreed to the published version of the manuscript.

Funding

This research received no external funding.

Institutional Review Board Statement

Not applicable.

Informed Consent Statement

Not applicable.

Data Availability Statement

Data will be made available on request. The data are not publicly available due to Ph.D. thesis restrictions.

Conflicts of Interest

The authors declare no conflicts of interest.

References

  1. Fenger, J. Urban Air Quality. Atmos. Environ. 1999, 33, 4877–4900. [Google Scholar] [CrossRef]
  2. World Health Organization. WHO Global Air Quality Guidelines. Particulate Matter (PM2.5 and PM10), Ozone, Nitrogen Dioxide, Sulfur Dioxide and Carbon Monoxide; World Health Organization: Geneva, Switzerland, 2021. [Google Scholar]
  3. Squizzato, S.; Masiol, M.; Agostini, C.; Visin, F.; Formenton, G.; Harrison, R.M.; Rampazzo, G. Factors, Origin and Sources Affecting PM1 Concentrations and Composition at an Urban Background Site. Atmos. Res. 2016, 180, 262–273. [Google Scholar] [CrossRef]
  4. Fuzzi, S.; Baltensperger, U.; Carslaw, K.; Decesari, S.; Van Der Gon, H.D.; Facchini, M.C.; Fowler, D.; Koren, I.; Langford, B.; Lohmann, U.; et al. Particulate matter, air quality and climate: Lessons learned and future needs. Atmos. Chem. Phys. 2015, 15, 8217–8299. [Google Scholar] [CrossRef]
  5. Tomasi, C.; Fuzzi, S.; Kokhanovsky, A.A. Atmospheric Aerosols: Life Cycles and Effects on Air Quality and Climate. In Atmospheric Aerosols: Life Cycles and Effects on Air Quality and Climate; John Wiley & Sons: New York, NY, USA, 2017. [Google Scholar]
  6. Bressi, M.; Cavalli, F.; Putaud, J.P.; Fröhlich, R.; Petit, J.-E.; Aas, W.; Äijälä, M.; Alastuey, A.; Allan, J.; Aurela, M.; et al. A European aerosol phenomenology—7: High-time resolution chemical characteristics of submicron particulate matter across Europe. Atmos. Environ. X 2021, 10, 100108. [Google Scholar] [CrossRef]
  7. Shao, P.; Tian, H.; Sun, Y.; Liu, H.; Wu, B.; Liu, S.; Liu, X.; Wu, Y.; Liang, W.; Wang, Y.; et al. Characterizing remarkable changes of severe haze events and chemical compositions in multi-size airborne particles (PM1, PM2.5 and PM10) from January 2013 to 2016–2017 winter in Beijing, China. Atmos. Environ. 2018, 189, 133–144. [Google Scholar] [CrossRef]
  8. Huang, B.; Gan, T.; Pei, C.; Li, M.; Cheng, P.; Chen, D.; Cai, R.; Wang, Y.; Li, L.; Huang, Z.; et al. Size-segregated Characteristics and Formation Mechanisms of Water-soluble Inorganic Ions during Different Seasons in Heshan of Guangdong, China. Aerosol Air Qual. Res. 2020, 20, 1961–1973. [Google Scholar] [CrossRef]
  9. Jimenez, J.L.; Canagaratna, M.R.; Donahue, N.M.; Prevot, A.S.H.; Zhang, Q.; Kroll, J.H.; DeCarlo, P.F.; Allan, J.D.; Coe, H.; Ng, N.L.; et al. Evolution of Organic Aerosols in the Atmosphere. Science 2009, 326, 1525–1529. [Google Scholar] [CrossRef] [PubMed]
  10. Espen Yttri, K.; Canonaco, F.; Eckhardt, S.; Evangeliou, N.; Fiebig, M.; Gundersen, H.; Hjellbrekke, A.-G.; Myhre, C.L.; Platt, S.M.; Prévôt, A.S.H.; et al. Trends, composition, and sources of carbonaceous aerosol at the Birkenes Observatory, northern Europe, 2001–2018. Atmos. Chem. Phys. 2021, 21, 7149–7170. [Google Scholar] [CrossRef]
  11. Zhang, Q.; Hu, W.; Ren, H.; Yang, J.; Deng, J.; Wang, D.; Sun, Y.; Wang, Z.; Kawamura, K.; Fu, P. Diurnal variations in primary and secondary organic aerosols in an eastern China coastal city: The impact of land-sea breezes. Environ. Pollut. 2023, 319, 121016. [Google Scholar] [CrossRef]
  12. Szidat, S.; Ruff, M.; Perron, N.; Wacker, L.; Synal, H.-A.; Hallquist, M.; Shannigrahi, A.S.; Yttri, K.E.; Dye, C.; Simpson, D. Fossil and non-fossil sources of organic carbon (OC) and elemental carbon (EC) in Göteborg, Sweden. Atmos. Chem. Phys. 2009, 9, 1521–1535. [Google Scholar] [CrossRef]
  13. Ivančič, M.; Gregorič, A.; Lavrič, G.; Alföldy, B.; Ježek, I.; Hasheminassab, S.; Pakbin, P.; Ahangar, F.; Sowlat, M.; Boddeker, S.; et al. Two-year-long high-time-resolution apportionment of primary and secondary carbonaceous aerosols in the Los Angeles Basin using an advanced total carbon–black carbon (TC-BC(λ)) method. Sci. Total Environ. 2022, 848, 157606. [Google Scholar] [CrossRef] [PubMed]
  14. Ni, H.; Huang, R.-J.; Cosijn, M.M.; Yang, L.; Guo, J.; Cao, J.; Dusek, U. Measurement report: Dual-carbon isotopic characterization of carbonaceous aerosol reveals different primary and secondary sources in Beijing and Xi’an during severe haze events. Atmos. Chem. Phys. 2020, 20, 16041–16053. [Google Scholar] [CrossRef]
  15. Meusinger, C.; Dusek, U.; King, S.M.; Holzinger, R.; Rosenørn, T.; Sperlich, P.; Julien, M.; Remaud, G.S.; Bilde, M.; Röckmann, T.; et al. Chemical and isotopic composition of secondary organic aerosol generated by α-pinene ozonolysis. Atmos. Chem. Phys. 2017, 17, 6373–6391. [Google Scholar] [CrossRef]
  16. Cappa, C.D.; Onasch, T.B.; Massoli, P.; Worsnop, D.R.; Bates, T.S.; Cross, E.S.; Davidovits, P.; Hakala, J.; Hayden, K.L.; Jobson, B.T.; et al. Radiative Absorption Enhancements Due to the Mixing State of Atmospheric Black Carbon. Science 2012, 337, 1078–1081. [Google Scholar] [CrossRef]
  17. Samset, B.H.; Myhre, G.; Herber, A.; Kondo, Y.; Li, S.-M.; Moteki, N.; Koike, M.; Oshima, N.; Schwarz, J.P.; Balkanski, Y.; et al. Modelled black carbon radiative forcing and atmospheric lifetime in AeroCom Phase II constrained by aircraft observations. Atmos. Chem. Phys. 2014, 14, 12465–12477. [Google Scholar] [CrossRef]
  18. He, Q.; Yan, Y.; Guo, L.; Zhang, Y.; Zhang, G.; Wang, X. Characterization and source analysis of water-soluble inorganic ionic species in PM2.5 in Taiyuan City, China. Atmos. Res. 2017, 184, 48–55. [Google Scholar] [CrossRef]
  19. Gao, X.; Yang, L.; Cheng, S.; Gao, R.; Zhou, Y.; Xue, L.; Shou, Y.; Wang, J.; Wang, X.; Nie, W.; et al. Semi-continuous measurement of water-soluble ions in PM2.5 in Jinan, China: Temporal variations and source apportionments. Atmos. Environ. 2011, 45, 6048–6056. [Google Scholar] [CrossRef]
  20. Yuan, C.-S.; Lee, C.-G.; Liu, S.-H.; Chang, J.-C.; Yuan, C.; Yang, H.-Y. Correlation of atmospheric visibility with chemical composition of Kaohsiung aerosols. Atmos. Res. 2006, 82, 663–679. [Google Scholar] [CrossRef]
  21. Wang, G.; Zhang, R.; Gomez, M.E.; Yang, L.; Zamora, M.L.; Hu, M.; Lin, Y.; Peng, J.; Guo, S.; Meng, J.; et al. Persistent sulfate formation from London Fog to Chinese haze. Proc. Natl. Acad. Sci. USA 2016, 113, 13630–13635. [Google Scholar] [CrossRef]
  22. Zhang, Y.; Huang, W.; Cai, T.; Fang, D.; Wang, Y.; Song, J.; Hu, M.; Zhang, Y. Concentrations and chemical compositions of fine particles (PM2.5) during haze and non-haze days in Beijing. Atmos. Res. 2016, 174-175, 62–69. [Google Scholar] [CrossRef]
  23. Sun, Z.; Mu, Y.; Liu, Y.; Shao, L. A comparison study on airborne particles during haze days and non-haze days in Beijing. Sci. Total Environ. 2013, 456–457, 1–8. [Google Scholar] [CrossRef] [PubMed]
  24. Crippa, M.; Janssens-Maenhout, G.; Dentener, F.; Guizzardi, D.; Sindelarova, K.; Muntean, M.; Van Dingenen, R.; Granier, C. Forty years of improvements in European air quality: Regional policy-industry interactions with global impacts. Atmos. Chem. Phys. 2016, 16, 3825–3841. [Google Scholar] [CrossRef]
  25. Syrek-Gerstenkorn, Z.; Syrek-Gerstenkorn, B.; Paul, S. A Comparative Study of SOx, NOx, PM2.5 and PM10 in the UK and Poland from 1970 to 2020. Appl. Sci. 2024, 14, 3292. [Google Scholar] [CrossRef]
  26. Celasun, O.; Mineshima, A.; Arregui, N.; Mylonas, V.; Ari, A.; Teodoru, I.; Black, S.; Zhunussova, K.; Iakova, D.; Parry, I. Surging Energy Prices in Europe in the Aftermath of the War: How to Support the Vulnerable and Speed up the Transition Away from Fossil Fuels; IMF Working Papers; IMF: Washington, DC, USA, 2022; Volume 2022. [Google Scholar] [CrossRef]
  27. Wu, D.; Li, Q.; Ding, X.; Sun, J.; Li, D.; Fu, H.; Teich, M.; Ye, X.; Chen, J. Primary Particulate Matter Emitted from Heavy Fuel and Diesel Oil Combustion in a Typical Container Ship: Characteristics and Toxicity. Environ. Sci. Technol. 2018, 52, 12943–12951. [Google Scholar] [CrossRef]
  28. Garaniya, V.; McWilliam, D.; Goldsworthy, L.; Ghiji, M. Extensive chemical characterization of a heavy fuel oil. Fuel 2018, 227, 67–78. [Google Scholar] [CrossRef]
  29. Pei, X.; Jameel, A.G.A.; Chen, C.; AlGhamdi, I.A.; AlAhmadi, K.; AlBarakati, E.; Saxena, S.; Roberts, W.L. Swirling Flame Combustion of Heavy Fuel Oil: Effect of Fuel Sulfur Content. J. Energy Resour. Technol. Trans. ASME 2020, 143, 082103. [Google Scholar] [CrossRef]
  30. Tao, L.; Fairley, D.; Kleeman, M.J.; Harley, R.A. Effects of Switching to Lower Sulfur Marine Fuel Oil on Air Quality in the San Francisco Bay Area. Environ. Sci. Technol. 2013, 47, 10171–10178. [Google Scholar] [CrossRef] [PubMed]
  31. Saario, A.; Rebola, A.; Coelho, P.J.; Costa, M.; Oksanen, A. Heavy fuel oil combustion in a cylindrical laboratory furnace: Measurements and modeling. Fuel 2005, 84, 359–369. [Google Scholar] [CrossRef]
  32. Allouis, C.; Beretta, F.; D’alessio, A. Structure of inorganic and carbonaceous particles emitted from heavy oil combustion. Chemosphere 2003, 51, 1091–1096. [Google Scholar] [CrossRef]
  33. Alonso-Hernández, C.M.; Bernal-Castillo, J.; Bolanos-Alvarez, Y.; Gómez-Batista, M.; Diaz-Asencio, M. Heavy metal content of bottom ashes from a fuel oil power plant and oil refinery in Cuba. Fuel 2011, 90, 2820–2823. [Google Scholar] [CrossRef]
  34. Oeder, S.; Kanashova, T.; Sippula, O.; Sapcariu, S.C.; Streibel, T.; Arteaga-Salas, J.M.; Passig, J.; Dilger, M.; Paur, H.-R.; Schlager, C.; et al. Particulate Matter from Both Heavy Fuel Oil and Diesel Fuel Shipping Emissions Show Strong Biological Effects on Human Lung Cells at Realistic and Comparable In Vitro Exposure Conditions. PLoS ONE 2015, 10, e0126536. [Google Scholar] [CrossRef]
  35. AB Vilniaus Šilumos Tinklai. Available online: https://chc.lt/lt/gn/44/vilniaus-silumos-tinklai-nuo-kovo-pabaigos-nebenaudos-mazasierio-mazuto-grizta-prie-atpigusiu-gamtiniu-duju:757 (accessed on 12 May 2024).
  36. Masalaite, A.; Holzinger, R.; Remeikis, V.; Röckmann, T.; Dusek, U. Characteristics, sources and evolution of fine aerosol (PM 1) at urban, coastal and forest background sites in Lithuania. Atmos. Environ. 2017, 148, 62–76. [Google Scholar] [CrossRef]
  37. Masalaite, A.; Holzinger, R.; Ceburnis, D.; Remeikis, V.; Ulevičius, V.; Röckmann, T.; Dusek, U. Sources and atmospheric processing of size segregated aerosol particles revealed by stable carbon isotope ratios and chemical speciation. Environ. Pollut. 2018, 240, 286–296. [Google Scholar] [CrossRef]
  38. Cachier, H.; Buat-Menard, P.; Fontugne, M.; Rancher, J. Source terms and source strengths of the carbonaceous aerosol in the tropics. J. Atmos. Chem. 1985, 3, 469–489. [Google Scholar] [CrossRef]
  39. Fisseha, R.; Saurer, M.; Jäggi, M.; Siegwolf, R.T.W.; Dommen, J.; Szidat, S.; Samburova, V.; Baltensperger, U. Determination of primary and secondary sources of organic acids and carbonaceous aerosols using stable carbon isotopes. Atmos. Environ. 2008, 43, 431–437. [Google Scholar] [CrossRef]
  40. Garbarienė, I.; Šapolaitė, J.; Garbaras, A.; Ežerinskis, Ž.; Pocevičius, M.; Krikščikas, L.; Plukis, A.; Remeikis, V. Origin Identification of Carbonaceous Aerosol Particles by Carbon Isotope Ratio Analysis. Aerosol. Air Qual. Res. 2016, 16, 1356–1365. [Google Scholar] [CrossRef]
  41. Garbaras, A.; Šapolaitė, J.; Garbarienė, I.; Ežerinskis, Ž.; Mašalaitė-Nalivaikė, A.; Skipitytė, R.; Plukis, A.; Remeikis, V. Aerosol source (biomass, traffic and coal emission) apportionment in Lithuania using stable carbon and radiocarbon analysis. Isot. Environ. Health Stud. 2018, 54, 463–474. [Google Scholar] [CrossRef]
  42. Dusek, U.; Ten Brink, H.M.; Meijer, H.A.J.; Kos, G.; Mrozek, D.; Röckmann, T.; Holzinger, R.; Weijers, E.P. The contribution of fossil sources to the organic aerosol in the Netherlands. Atmos. Environ. 2013, 74, 169–176. [Google Scholar] [CrossRef]
  43. Widory, D. Combustibles, fuels and their combustion products: A view through carbon isotopes. Combust. Theory Model. 2006, 10, 831–841. [Google Scholar] [CrossRef]
  44. Aguilera, J.; Whigham, L.D. Using the 13C/12C carbon isotope ratio to characterise the emission sources of airborne particulate matter: A review of literature. Isot. Environ. Health Stud. 2018, 54, 573–587. [Google Scholar] [CrossRef]
  45. Górka, M.; Skrzypek, G.; Hałas, S.; Jędrysek, M.-O.; Strąpoć, D. Multi-seasonal pattern in 5-year record of stable H, O and S isotope compositions of precipitation (Wrocław, SW Poland). Atmos. Environ. 2017, 158, 197–210. [Google Scholar] [CrossRef]
  46. Guo, Z.; Lu, K.; Qiu, P.; Xu, M.; Guo, Z. Quantifying SO2 oxidation pathways to atmospheric sulfate using stable sulfur and oxygen isotopes: Laboratory simulation and field observation. Atmos. Chem. Phys. 2024, 24, 2195–2205. [Google Scholar] [CrossRef]
  47. Kawamura, H.; Matsuoka, N.; Tawaki, S.; Momoshima, N. Sulfur Isotope Variations in Atmospheric Sulfur Oxides, Particulate Matter and Deposits Collected at Kyushu Island, Japan. Water Air Soil. Pollut. 2001, 130, 1775–1780. [Google Scholar] [CrossRef]
  48. Mukai, H.; Tanaka, A.; Fujii, T.; Zeng, Y.; Hong, Y.; Tang, J.; Guo, S.; Xue, H.; Sun, Z.; Zhou, J.; et al. Regional Characteristics of Sulfur and Lead Isotope Ratios in the Atmosphere at Several Chinese Urban Sites. Environ. Sci. Technol. 2001, 35, 1064–1071. [Google Scholar] [CrossRef]
  49. Guo, Z.; Li, Z.; Farquhar, J.; Kaufman, A.J.; Wu, N.; Li, C.; Dickerson, R.R.; Wang, P. Identification of sources and formation processes of atmospheric sulfate by sulfur isotope and scanning electron microscope measurements. J. Geophys. Res. Atmos. 2010, 115. [Google Scholar] [CrossRef]
  50. Inomata, Y.; Ohizumi, T.; Take, N.; Sato, K.; Nishikawa, M. Transboundary transport of anthropogenic sulfur in PM2.5 at a coastal site in the Sea of Japan as studied by sulfur isotopic ratio measurement. Sci. Total Environ. 2016, 553, 617–625. [Google Scholar] [CrossRef] [PubMed]
  51. Norman, A.L.; Barrie, L.A.; Toom-Sauntry, D.; Sirois, A.; Krouse, H.R.; Li, S.M.; Sharma, S. Sources of aerosol sulphate at Alert: Apportionment using stable isotopes. J. Geophys. Res. Atmos. 1999, 104, 11619–11631. [Google Scholar] [CrossRef]
  52. Lin, Y.-C.; Yu, M.; Xie, F.; Zhang, Y. Anthropogenic Emission Sources of Sulfate Aerosols in Hangzhou, East China: Insights from Isotope Techniques with Consideration of Fractionation Effects between Gas-to-Particle Transformations. Environ. Sci. Technol. 2022, 56, 3905–3914. [Google Scholar] [CrossRef] [PubMed]
  53. Han, X.; Guo, Q.; Liu, C.; Fu, P.; Strauss, H.; Yang, J.; Hu, J.; Wei, L.; Ren, H.; Peters, M.; et al. Using stable isotopes to trace sources and formation processes of sulfate aerosols from Beijing, China. Sci. Rep. 2016, 6, 29958. [Google Scholar] [CrossRef]
  54. Dusek, U.; Hitzenberger, R.; Kasper-Giebl, A.; Kistler, M.; Meijer, H.A.J.; Szidat, S.; Wacker, L.; Holzinger, R.; Röckmann, T. Sources and formation mechanisms of carbonaceous aerosol at a regional background site in the Netherlands: Insights from a year-long radiocarbon study. Atmos. Chem. Phys. 2017, 17, 3233–3251. [Google Scholar] [CrossRef]
  55. Genberg, J.; Hyder, M.; Stenström, K.; Bergström, R.; Simpson, D.; Fors, E.O.; Jönsson, J.; Swietlicki, E. Source apportionment of carbonaceous aerosol in southern Sweden. Atmos. Chem. Phys. 2011, 11, 11387–11400. [Google Scholar] [CrossRef]
  56. Zotter, P.; Ciobanu, V.G.; Zhang, Y.L.; El-Haddad, I.; Macchia, M.; Daellenbach, K.R.; Salazar, G.A.; Huang, R.-J.; Wacker, L.; Hueglin, C.; et al. Radiocarbon analysis of elemental and organic carbon in Switzerland during winter-smog episodes from 2008 to 2012—Part 1: Source apportionment and spatial variability. Atmos. Chem. Phys. 2014, 14, 13551–13570. [Google Scholar] [CrossRef]
  57. Garbaras, A.; Rimšelyte, I.; Kvietkus, K.; Remeikis, V. Δ13C Values in Size-Segregated Atmospheric Carbonaceous Aerosols at a Rural Site in Lithuania. Lith. J. Phys. 2009, 49, 229–236. [Google Scholar] [CrossRef]
  58. Schmid, H.; Laskus, L.; Jürgen Abraham, H.; Baltensperger, U.; Lavanchy, V.; Bizjak, M.; Burba, P.; Cachier, H.; Crow, D.; Chow, J.; et al. Results of the “carbon conference” international aerosol carbon round robin test stage I. Atmos. Environ. 2001, 35, 2111–2121. [Google Scholar] [CrossRef]
  59. Kawamura, K.; Kobayashi, M.; Tsubonuma, N.; Mochida, M.; Watanabe, T.; Lee, M. Organic and Inorganic Compositions of Marine Aerosols from East Asia: Seasonal Variations of Water-Soluble Dicarboxylic Acids, Major Ions, Total Carbon and Nitrogen, and Stable C and N Isotopic Composition. Geochem. Soc. Spec. Publ. 2004, 9, S1873–S9881. [Google Scholar]
  60. Masalaite, A.; Remeikis, V.; Zenker, K.; Westra, I.; Meijer, H.; Dusek, U. Seasonal changes of sources and volatility of carbonaceous aerosol at urban, coastal and forest sites in Eastern Europe (Lithuania). Atmos. Environ. 2020, 225, 117374. [Google Scholar] [CrossRef]
  61. Šapolaitė, J.; Garbarienė, I.; Garbaras, A.; Bučinskas, L.; Pabedinskas, A.; Remeikis, V.; Ežerinskis, Ž. Development of graphitization method for low carbon aerosol filter samples with Automated Graphitization System AGE-3. Appl. Radiat. Isot. 2022, 190, 110461. [Google Scholar] [CrossRef]
  62. Stuiver, M.; Polach, H.A. Discussion Reporting of 14C Data. Radiocarbon 1977, 19, 355–363. [Google Scholar] [CrossRef]
  63. Niu, Z.; Feng, X.; Zhou, W.; Wang, P.; Liu, Y.; Lu, X.; Du, H.; Fu, Y.; Li, M.; Mei, R.; et al. Tree-ring Δ14C time series from 1948 to 2018 at a regional background site, China: Influences of atmospheric nuclear weapons tests and fossil fuel emissions. Atmos. Environ. 2020, 246, 118156. [Google Scholar] [CrossRef]
  64. Romano, S.; Pichierri, S.; Fragola, M.; Buccolieri, A.; Quarta, G.; Calcagnile, L. Characterization of the PM2.5 aerosol fraction monitored at a suburban site in south-eastern Italy by integrating isotopic techniques and ion beam analysis. Front. Environ. Sci. 2022, 10, 971204. [Google Scholar] [CrossRef]
  65. Heal, M.R.; Naysmith, P.; Cook, G.T.; Xu, S.; Duran, T.R.; Harrison, R.M. Application of 14C analyses to source apportionment of carbonaceous PM2.5 in the UK. Atmos. Environ. 2011, 45, 2341–2348. [Google Scholar] [CrossRef]
  66. Levin, I.; Hesshaimer, V. Radiocarbon—A Unique Tracer of Global Carbon Cycle Dynamics. Radiocarbon 2000, 42, 69–80. [Google Scholar] [CrossRef]
  67. NOAA. Climate Data Online (CDO). Available online: https://www.ncei.noaa.gov/cdo-web/ (accessed on 17 March 2024).
  68. Stein, A.F.; Draxler, R.R.; Rolph, G.D.; Stunder, B.J.B.; Cohen, M.D.; Ngan, F. NOAA’s HYSPLIT Atmospheric Transport and Dispersion Modeling System. Bull. Am. Meteorol. Soc. 2015, 96, 2059–2077. [Google Scholar] [CrossRef]
  69. Davuliene, L.; Jasineviciene, D.; Garbariene, I.; Andriejauskiene, J.; Ulevicius, V.; Bycenkiene, S. Long-term air pollution trend analysis in the South-eastern Baltic region, 1981–2017. Atmos. Res. 2020, 247, 105191. [Google Scholar] [CrossRef]
  70. AB Vilniaus šilumos tinklai. PEOPLE CREATE HEAT. 2021. Available online: https://chc.lt/data/public/uploads/2022/06/ifrs-vst-en-2021-final.pdf (accessed on 12 May 2024).
  71. Harrison, R.M.; Jones, A.M.; Beddows, D.C.S.; Derwent, R.G. The effect of varying primary emissions on the concentrations of inorganic aerosols predicted by the enhanced UK Photochemical Trajectory Model. Atmos. Environ. 2013, 69, 211–218. [Google Scholar] [CrossRef]
  72. Tsimpidi, A.P.; Karydis, V.A.; Pandis, S.N. Response of Inorganic Fine Particulate Matter to Emission Changes of Sulfur Dioxide and Ammonia: The Eastern United States as a Case Study. J. Air Waste Manag. Assoc. 2007, 57, 1489–1498. [Google Scholar] [CrossRef]
  73. Pathak, R.K.; Yao, X.; Chan, C.K. Sampling Artifacts of Acidity and Ionic Species in PM2.5. Environ. Sci. Technol. 2003, 38, 254–259. [Google Scholar] [CrossRef]
  74. Steinfeld, J.I. Atmospheric Chemistry and Physics: From Air Pollution to Climate Change. Environ. Sci. Policy Sustain. Dev. 1998, 40, 26. [Google Scholar] [CrossRef]
  75. Niemi, J.V.; Tervahattu, H.; Vehkamäki, H.; Kulmala, M.; Koskentalo, T.; Sillanpää, M.; Rantamäki, M. Characterization and source identification of a fine particle episode in Finland. Atmos. Environ. 2004, 38, 5003–5012. [Google Scholar] [CrossRef]
  76. Viana, M.; Reche, C.; Amato, F.; Alastuey, A.; Querol, X.; Moreno, T.; Lucarelli, F.; Nava, S.; Calzolai, G.; Chiari, M.; et al. Evidence of biomass burning aerosols in the Barcelona urban environment during winter time. Atmos. Environ. 2013, 72, 81–88. [Google Scholar] [CrossRef]
  77. Li, J.; Pósfai, M.; Hobbs, P.V.; Buseck, P.R. Individual aerosol particles from biomass burning in southern Africa: 2, Compositions and aging of inorganic particles. J. Geophys. Res. Atmos. 2003, 108. [Google Scholar] [CrossRef]
  78. Liu, X.; Van Espen, P.; Adams, F.; Cafmeyer, J.; Maenhaut, W. Biomass Burning in Southern Africa: Individual Particle Characterization of Atmospheric Aerosols and Savanna Fire Samples. J. Atmos. Chem. 2000, 36, 135–155. [Google Scholar] [CrossRef]
  79. Christensen, K.A.; Stenholm, M.; Livbjerg, H. The formation of submicron aerosol particles, HCl and SO2 in straw-fired boilers. J. Aerosol Sci. 1998, 29, 421–444. [Google Scholar] [CrossRef]
  80. Lee, C.; Martin, R.V.; Van Donkelaar, A.; Lee, H.; Dickerson, R.R.; Hains, J.C.; Krotkov, N.; Richter, A.; Vinnikov, K.; Schwab, J.J. SO2 emissions and lifetimes: Estimates from inverse modeling using in situ and global, space-based (SCIAMACHY and OMI) observations. J. Geophys. Res. 2011, 116. [Google Scholar] [CrossRef]
  81. Sawlani, R.; Agnihotri, R.; Sharma, C.; Patra, P.K.; Dimri, A.P.; Ram, K.; Verma, R.L. The severe Delhi SMOG of 2016: A case of delayed crop residue burning, coincident firecracker emissions, and atypical meteorology. Atmos. Pollut. Res. 2018, 10, 868–879. [Google Scholar] [CrossRef]
  82. Norman, A.; Belzer, W.; Barrie, L. Insights into the biogenic contribution to total sulphate in aerosol and precipitation in the Fraser Valley afforded by isotopes of sulphur and oxygen. J. Geophys. Res. Atmos. 2004, 109. [Google Scholar] [CrossRef]
  83. Bučinskas, L.; Garbarienė, I.; Mašalaitė, A.; Šapolaitė, J.; Ežerinskis, Ž.; Jasinevičienė, D.; Remeikis, V.; Garbaras, A. Dual carbon and sulfur isotopes as tracers of PM1 pollution sources after COVID-19 confinement in Vilnius, Lithuania. Urban. Clim. 2024, 55, 101894. [Google Scholar] [CrossRef]
  84. Bertelsen, N.; Mathiesen, B.V. EU-28 Residential Heat Supply and Consumption: Historical Development and Status. Energies 2020, 13, 1894. [Google Scholar] [CrossRef]
  85. Igliński, B.; Piechota, G.; Buczkowski, R. Development of biomass in polish energy sector: An overview. Clean. Technol. Environ. Policy 2015, 17, 317–329. [Google Scholar] [CrossRef]
  86. Zhang, C.; Liu, Y.; Kang, S.; Yan, F.; Hu, Z.; Chen, P.; Huang, G.; Li, C.; Stubbins, A. Stable Carbon Isotope Signatures of Carbonaceous Aerosol Endmembers in the Tibetan Plateau. Environ. Sci. Technol. 2023. [Google Scholar] [CrossRef]
  87. Liu, G.; Li, J.; Xu, H.; Wu, D.; Liu, Y.; Yang, H. Isotopic compositions of elemental carbon in smoke and ash derived from crop straw combustion. Atmos. Environ. 2014, 92, 303–308. [Google Scholar] [CrossRef]
  88. Garbaras, A.; Garbarienė, I.; Bučinskas, L.; Šapolaitė, J.; Ežerinskis, Ž.; Matijošius, J.; Rimkus, A.; Remeikis, V. Characterization of Particulate Matter Emissions from Internal Combustion Engines Using Δ13C Values: Impact of Engine Operation Conditions and Fuel Type on PM10 Isotopic Composition. Atmos. Pollut. Res. 2023, 14, 101868. [Google Scholar] [CrossRef]
  89. Yao, P.; Huang, R.-J.; Ni, H.; Kairys, N.; Yang, L.; Meijer, H.A.J.; Dusek, U. 13C signatures of aerosol organic and elemental carbon from major combustion sources in China compared to worldwide estimates. Sci. Total Environ. 2022, 810, 151284. [Google Scholar] [CrossRef] [PubMed]
  90. Kawashima, H.; Haneishi, Y. Effects of Combustion Emissions from the Eurasian Continent in Winter on Seasonal Δ13C of Elemental Carbon in Aerosols in Japan. Atmos. Environ. 2012, 46, 568–579. [Google Scholar] [CrossRef]
  91. Szidat, S.; Jenk, T.M.; Gäggeler, H.W.; Synal, H.-A.; Fisseha, R.; Baltensperger, U.; Kalberer, M.; Samburova, V.; Wacker, L.; Saurer, M.; et al. Source Apportionment of Aerosols by 14C Measurements in Different Carbonaceous Particle Fractions. Proc. Radiocarb. 2004, 46, 475–484. [Google Scholar] [CrossRef]
  92. Bernardoni, V.; Calzolai, G.; Chiari, M.; Fedi, M.; Lucarelli, F.; Nava, S.; Piazzalunga, A.; Riccobono, F.; Taccetti, F.; Valli, G.; et al. Radiocarbon analysis on organic and elemental carbon in aerosol samples and source apportionment at an urban site in Northern Italy. J. Aerosol Sci. 2013, 56, 88–99. [Google Scholar] [CrossRef]
  93. Becker, S.; Hirner, A.V. Characterisation of Crude Oils by Carbon and Sulphur Isotope Ratio Measurements as a Tool for Pollution Control. Isot. Environ. Health Stud. 1998, 34, 255–264. [Google Scholar] [CrossRef]
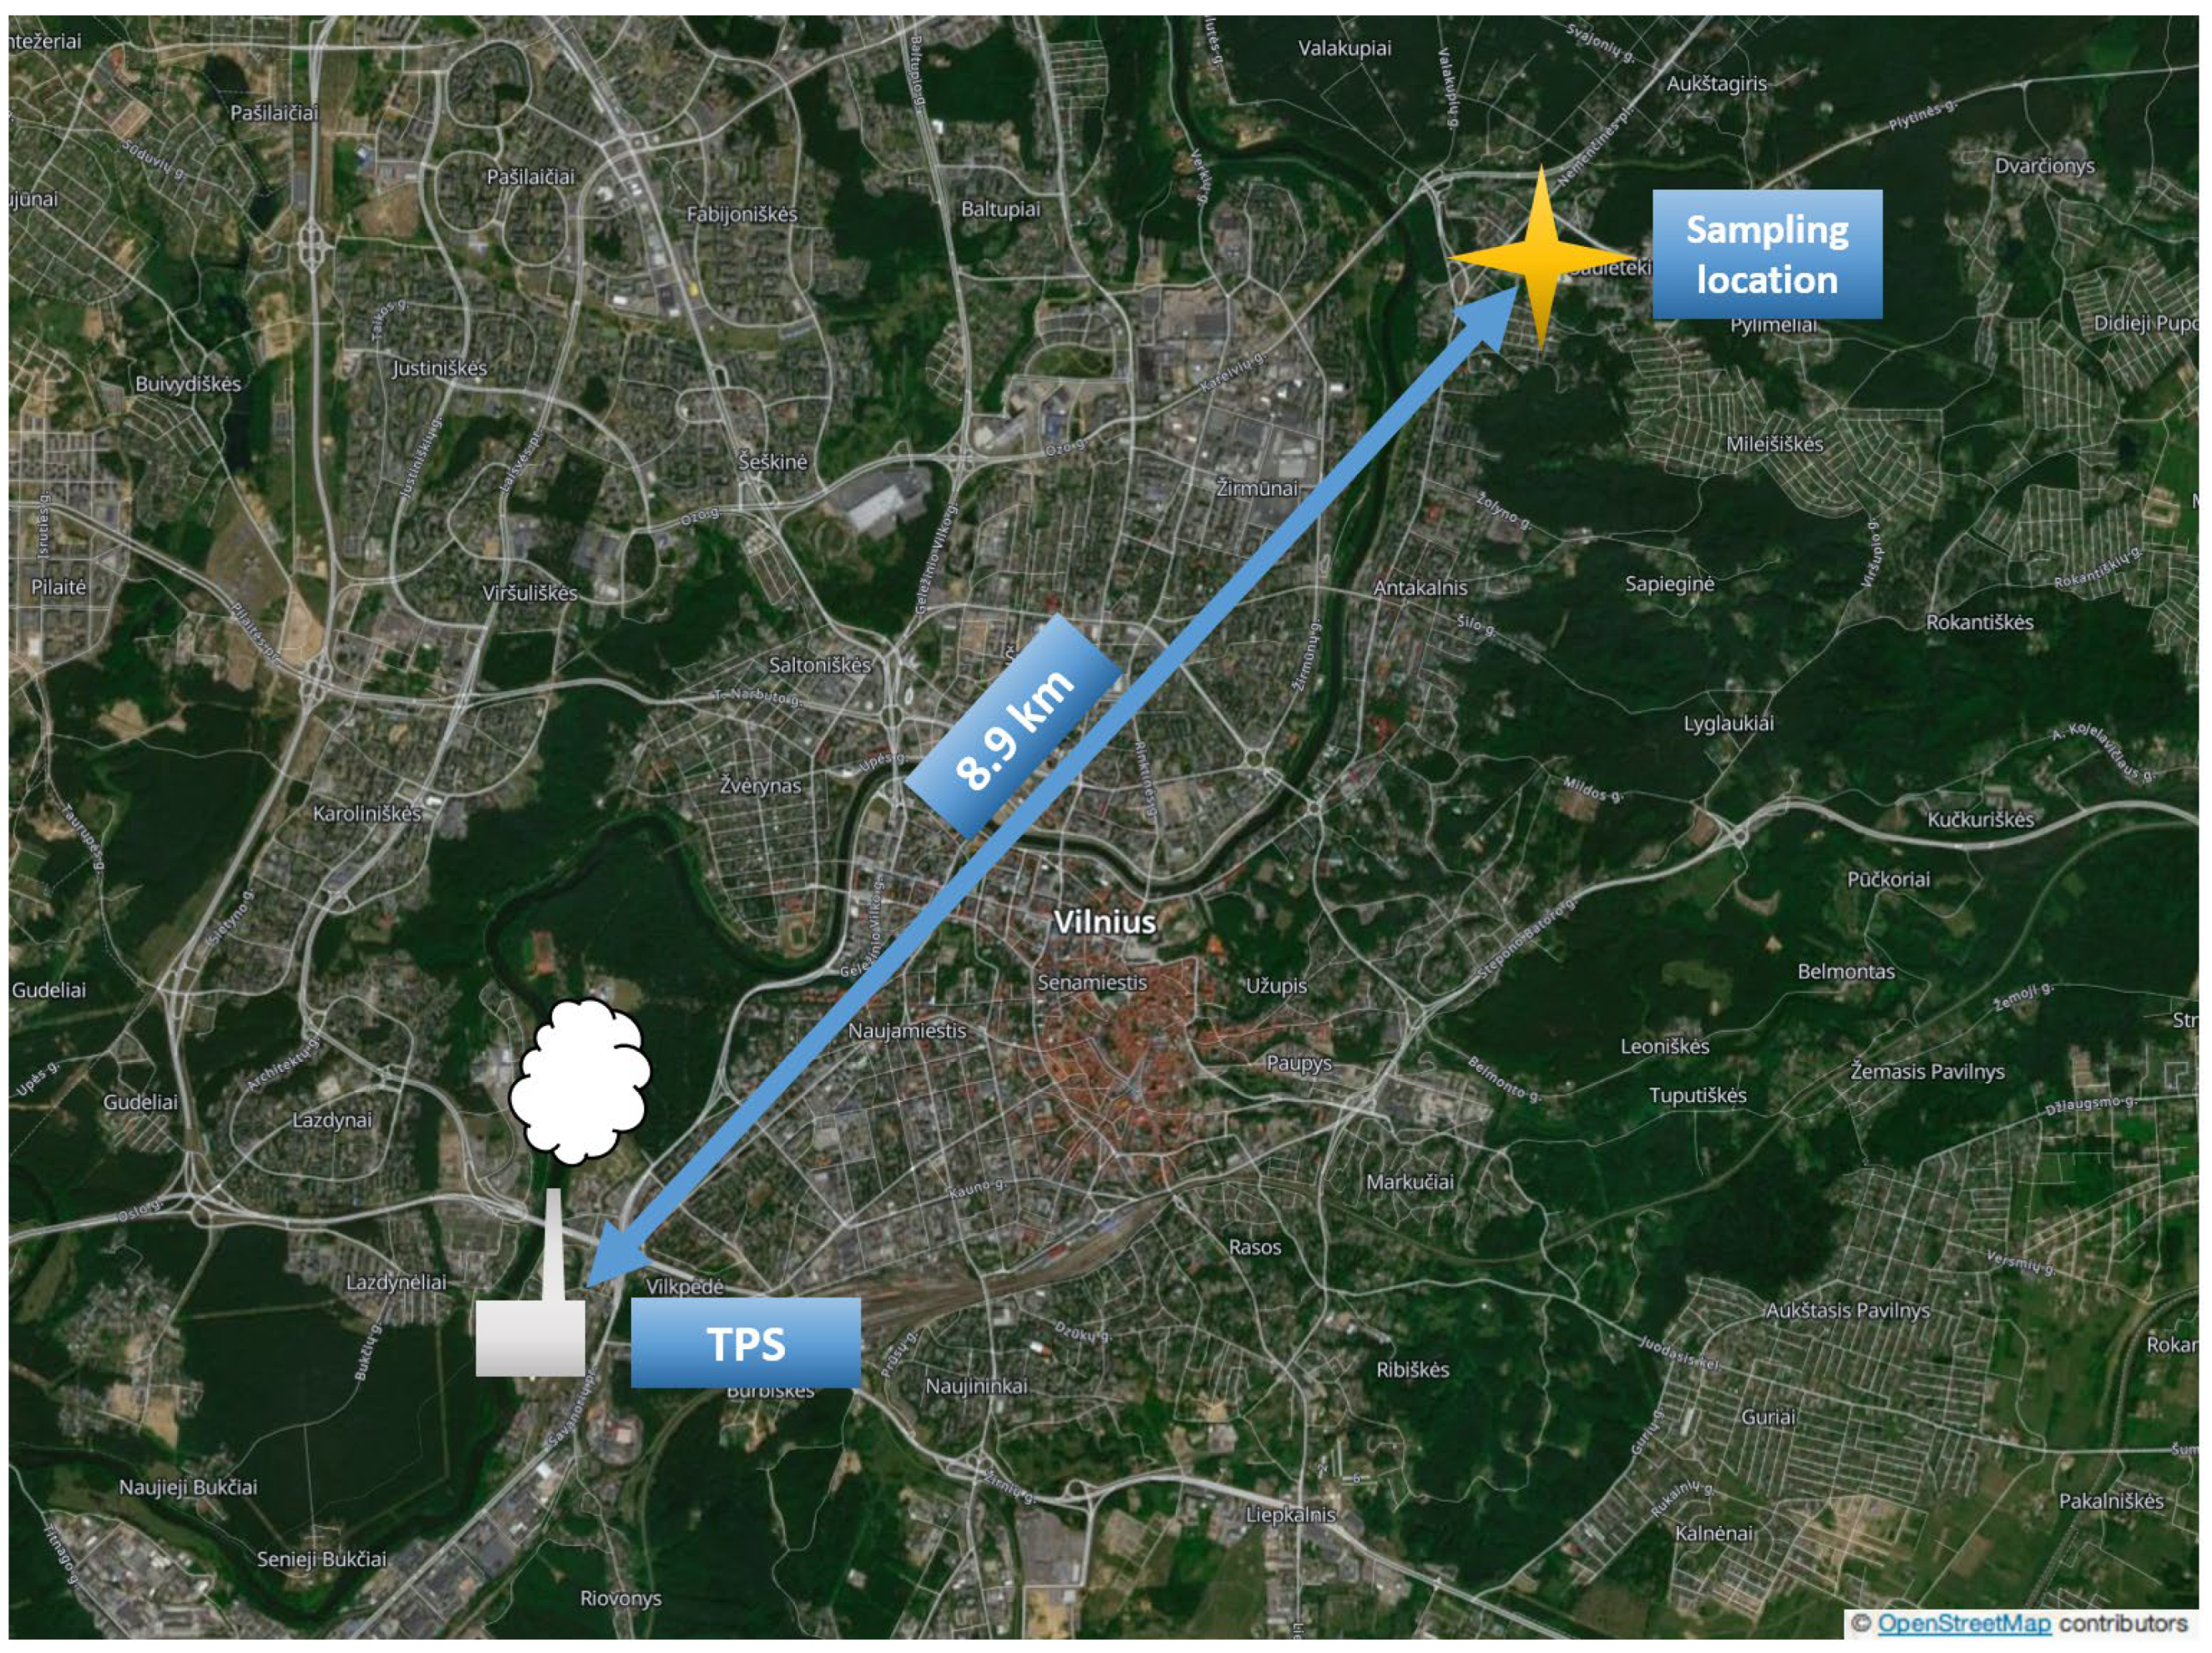
Figure 1. Relative positions of the thermal power station (TPS) and the sampling site (54.72 N, 25.32 E) in Vilnius.
Atmosphere 15 00883 g001
Figure 2. Variation in mass concentrations of WSIIs in PM1, their fractional contributions to total WSIIs, and SO2 concentrations during the CH and HFO periods.
Atmosphere 15 00883 g002
Figure 3. [NH4+]/[SO42−] molar ratios (a) and NO3/SO42− ratios (b) during the CH (2021–2022) and HFO (2022–2023) periods.
Atmosphere 15 00883 g003
Figure 4. Comparison between the heating seasons of (a) 2021–2022 and (b) 2022–2023, displaying corresponding δ34S values for SO2 and PM1 as well as δ13CEC and ff values for PM1. The gray shading indicates the period of HFO usage.
Atmosphere 15 00883 g004
Disclaimer/Publisher’s Note: The statements, opinions and data contained in all publications are solely those of the individual author(s) and contributor(s) and not of MDPI and/or the editor(s). MDPI and/or the editor(s) disclaim responsibility for any injury to people or property resulting from any ideas, methods, instructions or products referred to in the content.