Abstract
The spatial–temporal variations of fine particulate matter (PM2.5) in Akure, a city in southwestern Nigeria, are examined based on multi-year continuous observations using low-cost PM2.5 sensors at six different sites. The average annual concentration of PM2.5 across these sites was measured at 41.0 µg/m3, which surpassed both the Nigerian national air quality standard and the World Health Organization air quality guideline level. PM2.5 levels were significantly higher during the dry season (November–March), often exceeding hazardous levels (over 350 µg/m3), than during the wet season. The analyses of trends in air mass trajectories and satellite data on fire occurrences imply that the transport of dust and accumulation of PM2.5 originating from local/regional open burning activities played crucial roles in increased PM2.5 concentrations during the dry season. Further, site-to-site variations in the PM2.5 levels were observed, with relatively high concentrations at less urbanized sites, likely due to high local emissions from solid fuel combustion, waste burning, and unpaved road dust. Diurnal patterns showed morning and evening peaks at less urbanized sites, accounting for an estimated 51–77% of local emissions. These results highlight the importance of local emission sources in driving spatial–temporal PM2.5 variations within the city and the need for targeted mitigation strategies to address the significant air pollution challenges in Akure and similar regional cities in West Africa.
1. Introduction
Air pollution is a significant issue for public health in numerous regions worldwide. Particulate matter (PM), specifically PM2.5, which refers to suspended particles with aerodynamic diameters less than 2.5 µm, is widely recognized as a highly detrimental contaminant and the most important component of air pollutants contributing to human health, particularly in developing countries [1]. Its ability to deeply infiltrate the respiratory system and access the bloodstream renders it particularly worrisome [2]. It is a significant contributor to many diseases, including respiratory and cardiovascular conditions. McDuffie et al. [3] assert that prolonged exposure to PM2.5 is significantly hazardous to the environment and human health. They suggested that outdoor PM2.5 caused approximately 4.1 million premature deaths worldwide in the year 2019, accounting for 7.3% of the overall global mortality. Southerland et al. [4] have estimated the global average urban PM2.5 concentration in 2019 to be 35 μg/m3, which is seven times more than the World Health Organization’s (WHO) recommended guideline of 5 μg/m3. The regions with high levels of PM2.5 exposure are in Asia, Africa, South America, and the Middle East.
In Africa, outdoor and indoor air pollution was responsible for approximately 0.4 and 0.7 million premature deaths, respectively, in 2019 and remains a major challenge [5]. Nigeria, a country in West Africa, has a population of 218 million with a growth rate of 2.4% as of 2022 [6]. In the West African region, a variety of anthropogenic activities emit harmful substances into the air, resulting in a decrease in air quality and negative impacts on human well-being. PM2.5 emitted from various sources, including burning of fossil fuels for vehicle usage and generation of electricity, open burning of biomass for agriculture, and open waste burning, as well as industrial activities, poses health risks and contributes to a high number of premature deaths [7,8,9,10]. Particularly in rural regions, people rely on biomass fuels, such as wood, crop leftovers, and dung for cooking and heating [11]. The combustion of these materials, particularly in cooking stoves with low combustion efficiency, results in the emission of significant quantities of PM2.5, which contaminate outdoor environments and pose a significant risk to indoor air quality. Moreover, the Sahel region and specific areas of North Africa are frequently subjected to the occurrence of dust storms during the Harmattan season (dry season). Further, specific regions in southern and central Africa often experience seasonal wildfires that can significantly elevate PM2.5 concentrations [2].
Comprehensive strategies involving government policies, technological advancements, and public awareness campaigns are required to address and mitigate air pollution in Africa, presenting a significant environmental challenge that can affect the realization of the United Nations Sustainable Development Goals (SDGs). Specifically, a detailed understanding of the impact of air pollution on the progress toward achieving SDG target 3.9.1, which seeks a notable decrease in fatalities and illnesses caused by air pollution, is required. Additionally, it hinders the advancement of SDG target 7.1.2, which attempts to ensure universal access to clean energy for residential purposes, and SDG target 11.6.2, which aims to mitigate the environmental consequences of urban areas by enhancing air quality [12]. The spatial–temporal variations in PM2.5 concentrations and their controlling factors, such as sources and transportation, must be understood to achieve these goals. However, in many countries in Africa, including Nigeria, continuously operating monitoring stations for PM2.5 are very limited [13]. The sparse distribution of monitoring stations hinders the accurate assessment of air pollution levels across different areas, particularly in densely populated areas where pollution sources may significantly vary.
In Nigeria, several observational studies on the sources of PM2.5 have been conducted in specific cities and seasons based on the chemical analyses of aerosol samples. Odu-Onikosi et al. [14] have analyzed a series of chemical compositions, including ions, elemental carbon (EC), organic carbon, and trace elements, in PM2.5 collected at six sites in Lagos from August 2020 to July 2021. Based on chemical mass balance (CMB) analyses, they report that fine soil and carbonaceous materials (EC and organic matter) are the major sources of PM2.5, with fraction ranges of 24.7–36.3% and 28.4–46.0%, respectively. Further, they observe that the fractions of secondary production of inorganics (ammonium sulfate and ammonium nitrate) are relatively low (from 7.3 to 11.9%) at the six study sites. A review paper by Abulude et al. [15] reports that the major sources of PM in Nigeria are soil dust, biomass/biofuel burning, transportation, industrial activities, sea spray, and photochemical secondary production. Ezeh et al. [16] have estimated fractions of sources of PM2.5 in six cities (Aba, Abuja, Lagos, Kano, Maiduguri, and Port-Harcourt) collected in September and October 2009 based on the positive matrix factorization (PMF) analysis of trace elements. Reported soil dust (42%), biomass burning (24%), petroleum product combustion (15%), and industrial emission (5%) are the major sources. Abulude et al. [17] have conducted a study in Akure, which is also our study region, based on principal component analysis (PCA) of trace elements in PM2.5 collected from January to October 2018. They have reported that vehicular activities, biomass burning, and soil dust are major sources of PM2.5.
Additionally, several studies have reported concentration levels and seasonal and/or diurnal variations in PM2.5 in Nigeria. Awokola et al. [18] have reported season and diurnal variations in PM2.5 concentrations in sub-Sahara Africa, including seven sites in three cities (Enugu, Anambra, and Lagos) in the south part of Nigeria from February 2020 to January 2021, using a low-cost PM monitor (PurpleAir II SD). They have reported annual means for PM2.5 from 48 to 78 µg/m3, with high levels occurring during the dry season. Ezeh et al. [19] have collected PM2.5 samples from December 2010 to November 2011 at three different sites in industrial, high-density residential, and low-density residential areas in Logos and reported the seasonal patterns at each site. Popoola et al. [20] have reported seasonal and diurnal variations in PM2.5 concentrations in Lagos, Nigeria, and Yaoundé, Cameroon, over 12 months between June 2021 and May 2022 using low-cost air quality monitors (AQMesh). They have reported high levels of PM2.5 during the dry season (December to February) at both sites with similar annual average values (26 and 28 µg/m3 at Lagos and Yaoundé, respectively). In averaged diurnal variations, large morning peaks at approximately 7:00 and relatively small evening peaks at approximately 19:00 are observed. Owoade et al. [21] have used low-cost sensors (Alphasense OPC-N2) to measure the PM at five sites in Ile-Ife, southwest Nigeria, over eight weeks from June to July 2018. High PM2.5 and PM10 concentrations have been observed during nighttime likely due to accumulation in the shallow nocturnal boundary layer; however, no clear morning and evening peaks related to traffic and/or cooking activities have been observed in the wet season. Abulude et al. [22] have analyzed the PM data obtained and distributed by the Center for Atmospheric Research at National Space Research and Development Agency over 5–7 months at five sites in different states (Lagos, Osun, Delta, Kebbi, and Federal Capital Territory) in Nigeria. The reported mean concentrations of PM2.5 range from 62 to 86 µg/m3, and the highest mean value is observed in Lagos.
As some of the above-mentioned literature studies have been conducted using low-cost sensors, low-cost optical PM sensors have been applied for air pollution monitoring in areas where high-density monitoring using standard instruments is difficult [23]. These sensors can be deployed in large numbers across different locations because of their affordability, accessibility, and portability, providing a dense network of monitoring stations and enabling a high spatial resolution of air quality data. However, year-round continuous network measurements of PM2.5 at city levels (at the scale of a few to several tens of kilometers) in Nigeria are still very limited. This research aims to examine the spatiotemporal variations in PM2.5 in a city, Akure, in southwestern Nigeria, based on multi-year continuous observations using low-cost PM2.5 sensors at six different sites. The obtained PM2.5 mass concentrations are compared with standard values set by organizations such as the WHO to evaluate the potential risks to human health. Additionally, by analyzing the seasonal and diurnal variations, as well as site-to-site variations, possible factors controlling PM2.5 mass concentrations in this region have been discussed.
2. Materials and Methods
2.1. Study Area
The observations of PM2.5 were conducted at six sites in Akure, a city in southwestern Nigeria and the capital and largest city in Ondo State. Akure is located at 5°12′0″ E and 7°15′0″ N, with a population of 744,000 as of 2023 [24]. Akure is likely to face significant air pollution challenges because of rapidly increasing population and industrial activities, requiring the implementation of mitigating strategies and measures to improve air quality. A map illustrating the location of six observation sites, namely Sites A (7.211° N, 5.175° E), B (7.225° N, 5.172° E), C (7.268° N, 5.252° E), I (7.268° N, 5.254° E), J (7.267° N, 5.254° E), and K (7.263° N, 5.258° E), is shown in Figure 1. The names of sites are defined based on the starting time of observations in this region, and the data of other sites (i.e., Sites D to H) in other cities in Nigeria will be reported elsewhere.
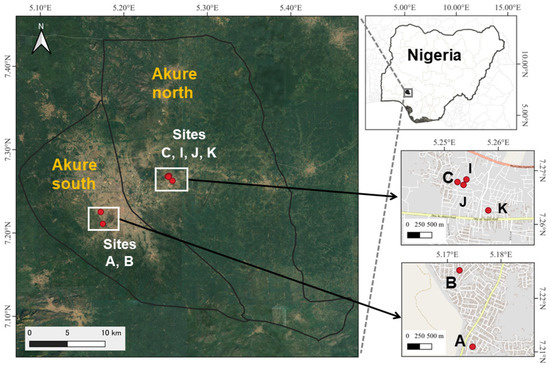
Figure 1.
A map illustrating the location of the six observation sites (A, B, C, I, J, and K) in Akure, Ondo State, Nigeria. Gray shades in the expanded views on the right represent the urban and residential areas.
Sites A and B are located in urban residential areas in Akure south. Sites C, I, J, and K are located in Oba-lle town in Akure north (a suburban area approximately 5 km east of the city center of Akure), involving residential, bare land, and agricultural areas [25]. Most of the buildings are one- or two-story houses in both areas. Compared with the residences around Sites A and B, those around Sites C, I, J, and K are less urbanized and have larger gardens; therefore, significant outdoor combustion activities for cooking using solid fuels and waste treatments are carried out.
Climatologically, Akure is characterized by a tropical wet and dry climate with distinct rainy and dry seasons. The wet season is typically from April to October, whereas the dry season, or Harmattan season, is from November to March [7,26]. Annual rainfall can reach up to approximately 1200 mm. In the north, rain only falls from June to September in the range of 500–750 mm, and the mean annual temperature varies between 21 °C and 27 °C throughout the year. The highest temperatures occur during the dry season and vary slightly from the coast to inland areas [27].
2.2. PM2.5 Measurements
In this work, PM2.5 mass concentration data originally obtained from May 2020 at Sites A, B, and C and from January 2021 at Sites I, J, and K up to September 2022 were analyzed. Photographs of PM2.5 sensors installed at six observation sites are shown in Figure 2. The timeframe (longer than one year) facilitated the evaluation of seasonal variation in addition to diurnal variation. The P-sensors (Industrial Hygiene Device Calibration, Inc., Tokyo, Japan) involving a palm-sized optical PM2.5 sensor developed by Panasonic Corporation and Nagoya University in Japan [28] and a data logging system were employed to monitor PM2.5 mass concentration. Approximately 6 months of data can be stored in this data logging system, if average time is selected as 5 min.
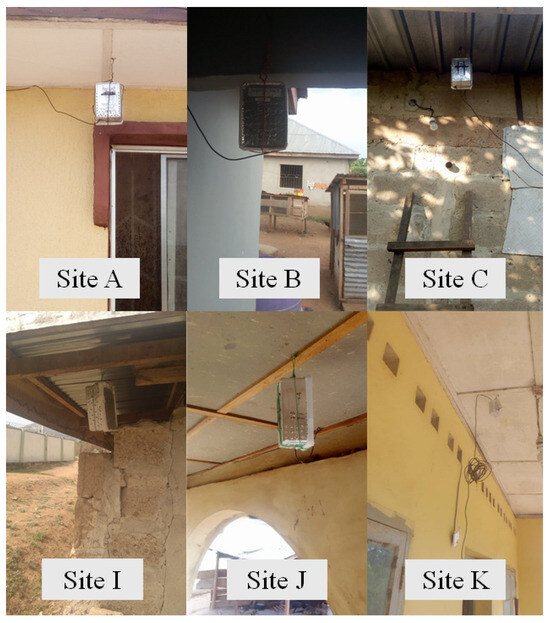
Figure 2.
Photographs of PM2.5 sensors installed at six observation sites.
This PM2.5 sensor was reported to have good accuracy (typically within 25%) and linearity based on laboratory experiments and filled comparison with beta ray attenuation monitors (BAMs) at several sites in Japan and other countries, such as Vietnam and India [28,29,30]. The sensors were calibrated at Nagasaki University in Japan by comparing the BAM instrument to ensure the accuracy and reliability of the PM2.5 measurements conducted in the study. Note that comparison with reference instruments was not performed at Akure, and therefore, potential influence of the difference in the situations between Nagasaki and Akure on the performance of the sensors cannot be ruled out. In addition, the PM2.5 sensor could potentially overestimate the PM2.5 mass concentrations under high-relative-humidity conditions (typically >70% for the sensor used in this study) [28]. This potential interference should be negligibly small in the dry season, whereas uncertainties in the absolute values in the wet season would be relatively high. In our previous study, good agreement between the outputs of the PM2.5 sensors and the BAMs was observed in different locations and seasons in Japan, Vietnam, and India [28,29,30], suggesting enough reason for the usage of this PM2.5 sensor in different situations.
The P-sensors were deployed at six distinct outdoor locations in urban and suburban residential areas in Akure City, as described above. These sensors were utilized to measure the 5 min averaged concentrations of PM2.5. However, the data logging often stopped at several sites because of an unstable power supply.
2.3. Backward Trajectory of Airmass and Fire Spot Data
A Hybrid Single-Particle Lagrangian Integrated Trajectory (HYSPLIT) model developed by the NOAA was used to calculate backward trajectories to determine how air pollutants move and where they might be coming from [31]. The model simulates the movement of an air parcel by wind advection using gridded meteorology data. The Global Data Assimilation System (GDAS) re-analysis data were applied in the model, and the 72 h backward trajectories of the air mass 500 m above Akure were calculated every 12 h from May 2020 to September 2022. After that, cluster analysis was conducted using the trajectories for the wet season (April–October) and dry season (November–March) to identify the main pathways of air masses that would influence the observed PM2.5 concentration.
Fire count data obtained by the Moderate Resolution Imaging Spectroradiometer (MODIS), a crucial component of NASA’s Earth Observing Satellites, Terra and Aqua, were used to characterize open burning activities, such as grass/shrub burning for clearing before farming, crop residue burning after harvesting, outdoor burning activity for cooking and waste treatment, and natural forest burning [32]. The fire incidents in Nigeria were acquired from MODIS collection 6.1 in the Fire Information for Resource Management System (FIRMS) (https://www.earthdata.nasa.gov/learn/find-data/near-real-time/firms, accessed on 1 April 2023) during the study period.
3. Results and Discussion
3.1. Seasonal Variation in PM2.5 Concentration
Figure 3 shows the results of the statistical analyses for hourly PM2.5 data concentrations at Sites A, B, and C from May 2020 to September 2022 and at Sites I, J, and K from January 2021 to September 2022. The whisker-box plots for daily PM2.5 data across all sites are shown in Figure 4, and numerical values are listed in Table S1 in the Supplementary Materials. The observed PM2.5 levels were significantly high during the dry season from November to March at all six sites, often exceeding hazardous levels (over 350 μg/m3), particularly at Sites C, I, J, and K (Figure 3). In contrast, the PM2.5 concentrations were considerably low during the wet season, with an average (±standard deviation (SD)) of 19.6 (±16.4) μg/m3 compared with those in the dry season (76.5 (±60.8) μg/m3). The highest monthly average PM2.5 concentration of 97.7 (±68.0) μg/m3 was observed in February, whereas the lowest of 16.5 ± 21.5 μg/m3 was observed in September. The monthly average value significantly decreased from February to March (46% decrease) and March to April (53% decrease) and showed a significant increase from October to November (67% increase) and November to December (147% increase). To confirm the statistical difference in the PM2.5 concentrations between dry and wet seasons, a t-test was employed, and it was found that the difference was statistically significant at the 0.05 level.
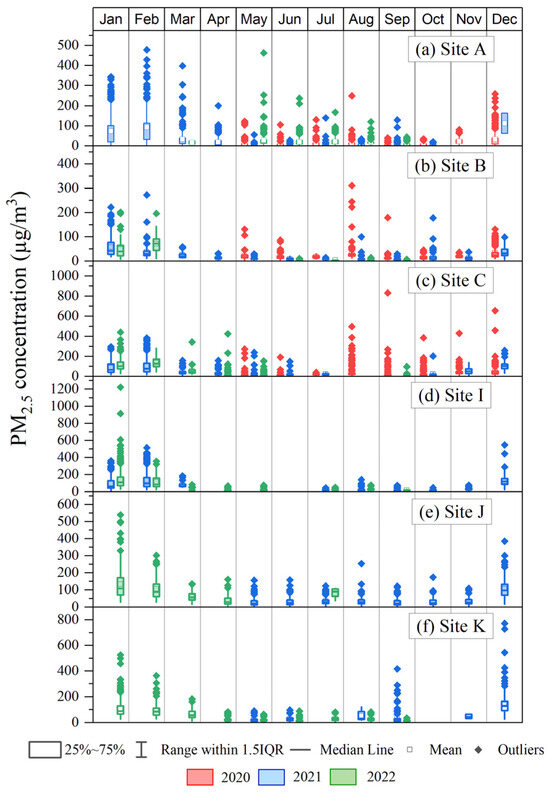
Figure 3.
Whisker-box plots for hourly PM2.5 concentration data in each month at all studied sites, A, B, C, I, J, and K. The red, blue, and green boxes represent the data in 2020, 2021, and 2022, respectively, and circles represent the outliers (data outside 1.5 times the interquartile range (IQR) of the third quartile).
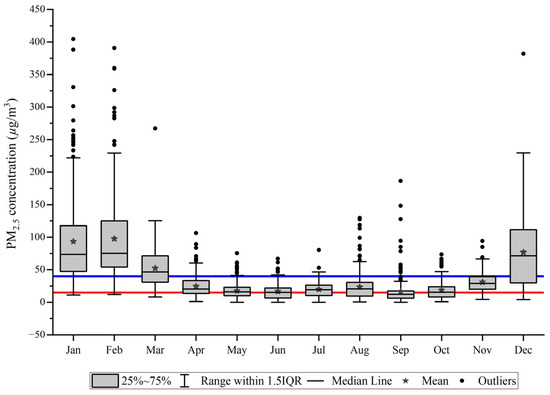
Figure 4.
Whisker-box plots for daily PM2.5 data for all data at all sites. The stars and circles represent the mean values in each month and outliers, respectively. The blue and red lines are the 24 h National Ambient Air Quality Standards of Nigeria (40 µg/m3) and the 24 h WHO global air quality guidelines (15 µg/m3), respectively.
This seasonal trend aligned with findings from previous studies in Nigeria. In Lagos, the PM2.5 levels ranged from 28.0 to 30.9 μg/m3 between February and October 2010 across different sites (residential, heavy traffic, marine, and industrial), with the dry season having the highest levels [33]. A similar trend was observed in the cities of Abuja and Benin, where the monthly mean PM2.5 concentrations increased from October and reached their peak in January, ranging from 31 to 105 μg/m3. Further, the concentration was 2–3 times higher in the dry season than in the wet season [34]. Popoola et al. [20] have reported high PM2.5 concentrations from December to February in Lagos. This seasonal pattern is not limited to the major cities. A country-wide assessment across seven sites in Enugu, Anambra, and Lagos in south Nigeria reported higher levels during the dry season than during the wet season. The consistently high PM2.5 concentrations during the dry season were likely due to a combination of factors, including seasonal variations in emission, transportation, and deposition processes, as is discussed in the next section.
The annual average concentration was calculated to be 41.0 μg/m3 from monthly averaged values for all the studied sites. This value was approximately twice the Nigerian national air quality standard annual value (20 μg/m3), nearly eight-fold the WHO air quality guideline level (5 μg/m3), and slightly higher than interim target 1 (35 μg/m3) of WHO [35]. This value (41.0 μg/m3) was near the lower end of the annual mean values (from 40 to 135 μg/m3) at six sites in Logos from August 2020 to July 2021 [14], although it was higher than the annual average value from June 2021 and May 2022 at an urban site in Lagos (26 µg/m3) [20]. This suggested greater contributions of local emission at a specific industrial area in Lagos compared with our studied sites in Akure. Our result is slightly lower than the previously reported annual means at seven sites in Enugu, Anambra, and Lagos in south Nigeria from February 2020 to January 2021 (from 48 to 78 µg/m3) [18]. Further, it is lower than the eight-month average values from October 2021 to July 2022 in Abuja and Benin cities in Nigeria (49.6 and 49.4 µg/m3, respectively) [34].
3.2. Seasonal Variation in Air Mass Trajectory and Fire Spots
To examine the potential causes of the observed seasonal variations in PM2.5 concentration in Akure, the seasonal variation in air mass trajectories was analyzed. Figure 5 shows the 72 h backward trajectories of air mass 500 m above Akure in each month from May 2020 to September 2022, and the cluster means of the backward trajectories in the dry and wet seasons are shown in Figure 6. The seasonal pattern of the transport pathways of air mass to Akure showed notable variability between the dry and wet seasons. Specifically, from December to February, a significant fraction of air mass originated from the north and northwest. Conversely, in the wet season, almost all air mass came from the ocean in a southeastern direction (Figure 5). As shown in Figure 6, in the wet season, all four clusters of trajectories came from the south or southwest. In contrast, in the dry season, one cluster with fractions of 15% came from the north of Nigeria, and the other cluster with the highest fraction (39%) had a considerably short mean trajectory from the northeast. This suggested the stagnation of air mass around the observation site, which potentially led to the accumulation of pollutants near the surface.
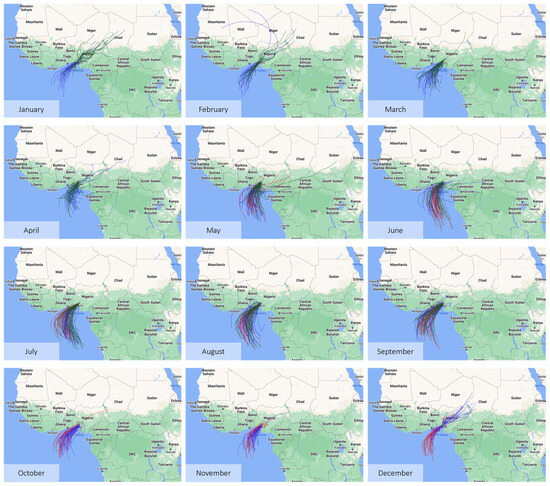
Figure 5.
The 72 h backward trajectories from 500 m above Akure starting at 0:00 local time of each day in 2020 (red), 2021 (blue), and 2022 (green).
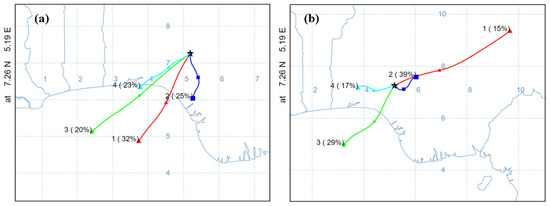
Figure 6.
Cluster means of 72 h backward trajectories from 500 m above Akure in the (a) wet (April to October) and (b) dry (November to March) seasons from 2020 to 2022.
The Harmattan season in Nigeria, which typically continues from November to February, is characterized by prevailing dry and dusty wind that travels through West Africa. Further, this season is characterized by an increased effect of long-range transport from the Sahara Desert to West African countries [36,37,38]. Several studies in Nigeria also support the above-mentioned seasonal pattern. Orogade et al. [7] have conducted a 7-day backward trajectory analysis in Kaduna in the North of Nigeria. They have found that the high concentrations of fine (PM2.5) and coarse (PM2.5–10) PM observed during the Harmattan periods were likely influenced by the long-range transport of air masses from the Sahara Desert. Moreover, recently, Lala et al. [34] employed the HYSPLIT model to track backward trajectories and identify potential source locations of PM in Abuja and Benin cities. Their findings highlight the important role of the regional and transboundary transport of particles, which, driven by the strong Harmattan wind, would cause high dust particle levels in Nigeria during the dry season.
In addition to the transportation of dust particles originating from the Sahara Desert, it is necessary to consider the local and/or regional sources from other activities. To examine the seasonal variation in open burning activities, the number of fire spots in Nigeria detected by the MODIS was plotted, as shown in Figure 7, and the seasonal variations in the number of fire spots in 2020, 2021, and 2022 are shown in Figure S1. For the three years, a high number of fire spots was observed during dry seasons, with the highest in January. The season pattern of open burning was found to be similar to that for PM2.5 concentration (Figure 4). Further, a strong connection between the observed monthly averaged PM2.5 concentrations and the number of fire spots was observed with Person’s correlation coefficient of 0.942 (Figure S2). Therefore, local and/or regional emissions of carbonaceous particles emitted through open burning activities, such as grass/shrub burning for clearing before farming, crop residue burning after harvesting, outdoor burning activity for cooking and waste treatment, and natural forest burning, potentially contribute to the observed high PM2.5 concentration during the dry season.
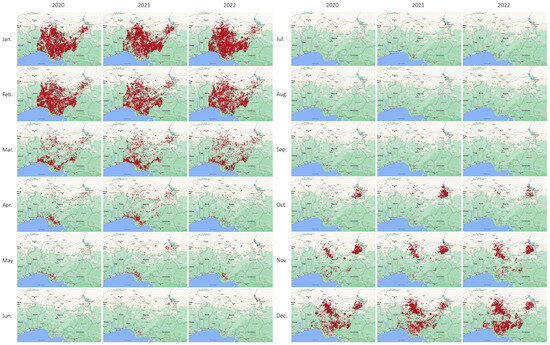
Figure 7.
The number of fire spots detected by MODIS in each month from January 2020 to December 2022.
Furthermore, meteorological conditions, such as precipitation, temperature, relative humidity, and wind speed/direction, in and around the studied area would also affect the temporal variations in PM2.5 through modification of emission and deposition of PM2.5 as well as physical and chemical processes (e.g., chemical reactions and gas/particle partitioning) in the atmosphere.
These results are consistent with several literature studies on the source apportionment of PM2.5 in Nigeria, using receptor modeling techniques, including PMF, CMB, and PCA, to quantify the contributions of each PM2.5 source. The literature studies in Nigeria consistently highlight that soil dust and biomass/biofuel burning particles are the main sources of PM2.5 in Nigeria. Odu-Onikosi et al. [14] have reported that fine soil and carbonaceous materials account for 24.7–36.3% and 28.4–46.0%, respectively, of PM2.5 collected at six sites in Lagos from August 2020 to July 2021. Orogade et al. [7] have reported that continental dust and local soil account for 18% and 29%, respectively, of PM2.5 collected in Kaduna in northwest Nigeria from March to August 2013 and November 2013 to February 2014. Ezeh et al. [16] have reported that soil dust and biomass burning particles account for 42% and 24% (on average), respectively, of PM2.5 in six cities (Aba, Abuja, Lagos, Kano, Maiduguri, and Port-Harcourt) in September and October 2009. In addition to continental/soil dust and carbonaceous particles from biomass/biofuel combustions, transport, industrial activities, sea spray, and photochemical secondary production can have significant contributions, as summarized in the review by Abulude et al. [15]. Orogade et al. [7] have reported that residual oil has a significant contribution in Kaduna and Abulude et al. [17] have reported that vehicular activities, in addition to biomass burning and soil dust, can be a significant source of PM2.5, which was collected from January to October 2018 in an urban area in Akure.
Additionally, the accumulation of locally or regionally emitted PM2.5 under stagnant conditions during dry seasons (Figure 6) would cause high concentrations of PM2.5, and greater wet deposition and less emission of local dust under wet soil and weaker wind conditions would also contribute to less PM2.5 concentrations during the wet season.
3.3. Site-To-Site and Diurnal Variations in PM2.5 Concentration
Figure 8 shows the whisker-box plots for daily PM2.5 concentrations for the dry and wet seasons, respectively, at each site (A, B, C, I, J, and K), and numerical values are listed in Table S2. During both dry and wet seasons, less urbanized sites (C, I, J, and K) showed higher PM2.5 levels than more urbanized sites (A and B). An analysis of variance (ANOVA), a common statistical test to assess the difference between the means of more than two groups, was conducted (SPSS, Windows version 21.0) to examine the statistical difference in the PM2.5 concentrations among sites. Throughout the year, the PM2.5 levels at Sites C, I, J, and K, as well as those at Sites A and B, were not statistically different at the p-value of 0.05. However, Sites C, I, J, and K had higher values than Sites A and B, and the difference was statistically significant at the p-value of 0.05. This result suggests the significant contributions of local emissions at less urbanized sites (C, I, J, and K) to PM2.5 levels at these sites.
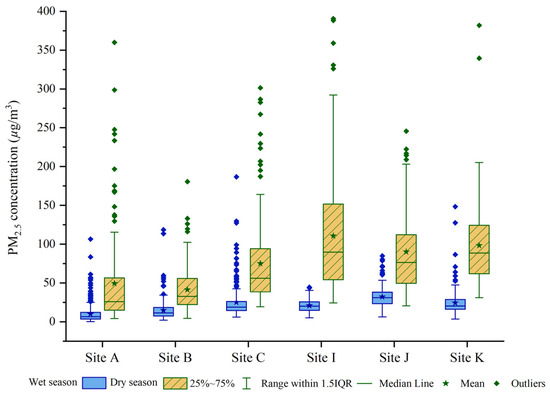
Figure 8.
Whisker-box plots for the daily PM2.5 concentrations for the wet and dry seasons at each site (A, B, C, I, J, and K).
Figure 9a shows the averaged diurnal variations in the PM2.5 concentration across the study sites for data throughout the year. Differences were observed between the more urbanized sites (A and B) and the less urbanized sites (C, I, J, and K). At the less urbanized sites, high peaks were typically observed in the morning at approximately 9:00 (60.6–69.5 µg/m3) and in the evening at approximately 21:00 (50.4–77.6 µg/m3), and the minimum value was observed between 1:00 and 4:00. Conversely, the diurnal variations at the more urbanized sites, A and B, showed considerably small enhancements during morning and evening hours, suggesting the low contributions of local emission sources in these areas.
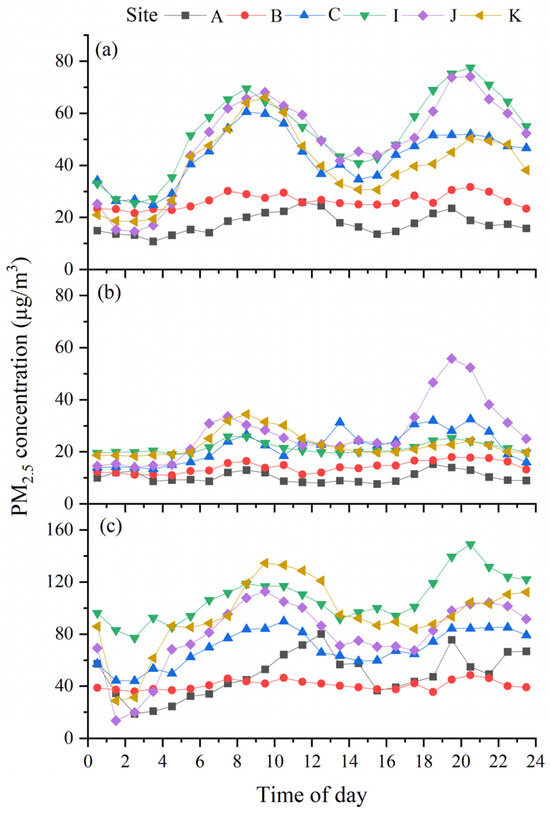
Figure 9.
The daily variations in the PM2.5 concentration across the study sites: (a) all season; (b) the wet season; (c) the dry season.
At less urbanized sites (C, I, J, and K), the maximum enhancements of the PM2.5 concentration during typical morning (and evening) peak hours between 5:00 and 12:00 (and between 18:00 and 24:00) from the minimum values between 1:00 and 4:00 were calculated to be 36–53 (27–59) µg/m3 for all year data. If the same procedures are adopted for all year data at Sites A and B, maximum enhancements during morning (and evening) peak hours were calculated to be 8–15 (10–13) µg/m3. The significant enhancements of PM2.5 concentrations at less urban sites during morning and evening hours may be due to the high usage of solid fuels, such as wood and charcoal, for cooking. Further, other causes including waste combustion activities and local dust emissions from unpaved roads in less urbanized areas potentially contributed to the observed differences.
We assumed that the enhancement of the PM2.5 concentrations during morning (and evening) peak hours from the minimum values between 1:00 and 4:00 were due to local emissions in the morning (and evening). Thus, the fractions of local emissions during the morning (and evening) peaks were roughly estimated at each site. The average fraction of local emissions at the less urbanized sites, C, I, J, and K, during morning (and evening) peak hours between 5:00 and 12:00 (and between 18:00 and 24:00) were estimated to be 51% (50%), 58% (62%), 75% (77%), and 65% (59%), respectively. The hourly maximum fractions were 59% (52%), 63% (67%), 78% (80%), and 72% (63%), respectively. The observed site-to-site variations in the fractions among sites in the less urbanized sites may be due to the difference in the combustion activities around each site and distance from the local sources. For all year data, the fractions of local emissions during morning and evening hours are similar, 62% and 62%, respectively. However, the relative fractions are considerably dependent on seasons and sites, as will be discussed later. Note that the estimation of the fraction of local emission during morning and evening peaks potentially contains systematic uncertainties if regional background concentrations have large diurnal variations. However, enough small diurnal variations observed at more urbanized sites (A and B), compared with the magnitude of enhancement at less urbanized sites (C, I, J, and K), support the reasonableness of the rough estimation for the less urbanized sites.
Figure 9b,c show the averaged diurnal variations in PM2.5 concentrations during wet and dry seasons. Regional background PM2.5 levels were higher in the dry season than in the wet season because of the transportation of PM2.5, such as Saharan dust and biomass burning particles from other areas, as discussed in Section 3.2. Additionally, the magnitudes of enhancement of the PM2.5 concentrations during morning and evening hours are greater during the dry season than during the wet season at less urbanized sites.
The maximum enhancements of PM2.5 concentration at less urbanized sites (C, I, J, and K) during the typical morning (and evening) peak hours between 5:00 and 12:00 (and between 18:00 and 24:00) from minimum values between 1:00 and 4:00 are calculated to be 6–20 (5–42) µg/m3 and 42–106 (41–91) µg/m3 for wet and dry seasons, respectively. The seasonal variations in the meteorological conditions and emission flux can be considered as potential causes of the considerable enhancement of PM2.5 during the dry season compared with the wet season. During the dry season, the accumulations of locally emitted PM2.5 under stagnant air conditions would occur frequently, considering that the highest fraction (39%) of the cluster of backward trajectories has a very short mean trajectory from the northeast (Figure 6). Additionally, the high open burning of solid fuel outside for cooking and the high emission of local dust from unpaved roads under dry conditions may have contributed to the observed high enhancement during the dry season.
Interestingly, even for the less urbanized sites (C, I, J, and K) located within 1 km, each site showed different characteristics on the relative magnitude of enhancements between morning and evening peaks in each season. In the wet season, Sites I and K showed higher peaks in the morning than in the evening; however, Sites C and J showed high peaks in the evening (Figure 9b). In the dry season, only Site I showed a high peak in the evening (Figure 9c). Differences in the diurnal patterns and relative contributions of local emission sources, such as solid fuel and garbage combustions and road dust emission, and their seasonal variations at each site would contribute to these observed characteristics. However, it was difficult to clarify the specific reasons.
Several previous studies highlighted the diurnal variation in PM2.5 at different locations in Nigeria. Awokola et al. [18] have reported the annual averages of diurnal variations at seven sites in three cities (Enugu, Anambra, and Lagos) in south Nigeria. The morning peak between 6:00 and 8:00 and the evening peak between 20:00 and 22:00 were observed at most of the sites. However, no clear morning peak was observed at the Awka site in Anambra, and no clear evening peak was observed at the Bariga site in Lagos. The enhancement of PM2.5 concentrations in the morning and evening hours was highly variable, approximately from 0 to 30 µg/m3 and from 0 to 55 µg/m3, respectively, when compared with the minimum values between 1:00 and 4:00. Additionally, Popoola et al. [20] reported the annual average of the diurnal variations at a site in Lagos. They have reported the appearance of large morning peaks, with maximum enhancement of approximately 20 µg/m3 at around 7:00, and small evening peak maximum enhancement of approximately 3 µg/m3 at around 19:00. The ranges of enhancements in the morning and evening peaks estimated in the present studies at Akure were 34–53 and 26–60 µg/m3, respectively, for less urbanized sites and 7–8 and 5–10 µg/m3, respectively, for more urbanized sites. These values were consistent with their previously reported values in the different cities in Nigeria.
A few previous studies conducted multi-site observations of PM2.5 levels at the city level. Wambebe and Duan [39] have measured PM2.5 concentration at 20 locations in Abuja city from August to September in 2018. Significantly high averaged concentrations were found at two sites in a business area (62.6 and 70.2 µg/m3), one site in a market area (60.1 µg/m3), and one site in a transport services area (58.3 µg/m3). These concentrations were higher than those at another 16 sites in residential, commercial, business, commercial/business, and office areas (ranging from 15.3 to 32.4 µg/m3). Ezeh et al. [19] have reported higher annual averaged PM2.5 mass concentrations at the sites in industrial and high-density residential areas (91 and 98 µg/m3, respectively) than those at the site in low-density residential areas (41 µg/m3) in Lagos. Both in the present study and previous studies, large site-to-site variations in PM2.5 concentrations were observed even in the city. The results suggest that local sources in the city significantly contribute to the spatial–temporal variation in PM2.5 levels in the city.
4. Conclusions
This study utilized low-cost PM2.5 sensors to enable continuous multi-year observations at six sites in Akure, the capital city of Ondo State in Nigeria, which can help to understand the spatial–temporal variations in PM2.5 within the city. At all studied sites, seasonal variations in PM2.5 were observed, with significantly high values observed during the dry season and a lower value during the wet season. The annual average concentration of PM2.5 across these sites was measured to be 42.8 μg/m3, which surpassed both the Nigerian national air quality standard (20 μg/m3) and the WHO air quality guideline level (5 μg/m3). Hourly PM2.5 levels often exceeded hazardous levels (over 350 μg/m3) in the dry season.
From the analysis of the seasonal variations in the air mass trajectories and number of fire spots, the transport of Saharan dust and the accumulation of PM2.5 originating from local/regional open burning activities would cause high PM2.5 concentrations during the dry season. Additionally, site-to-site variations in PM2.5 were observed, with higher concentrations at less urbanized sites (Sites C, I, J, and K) than at other sites (Sites A and B). This was likely due to the high local emissions from solid fuel combustion, waste burning, and unpaved road dust. Moreover, diurnal patterns showed special morning and evening peaks at the less urbanized sites, accounting for an estimated 51–75% and 50–77% of local emissions during morning and evening peak hours, respectively. The high enhancements of PM2.5 during morning and evening hours at less urbanized sites were observed during the dry season. This was likely due to the accumulations of locally emitted PM2.5 under stagnant air conditions because the highest fraction (39%) of the cluster of backward trajectories had a very short mean trajectory during the dry season.
It is suggested that the influence of local emission is a key factor in controlling the diurnal variation, as well as the daily mean, of the PM2.5 concentration at each site. This finding will be useful when designing targeted strategies for reducing air pollutants by addressing the local sources of pollution in addition to adopting broad regional measures. Increasing sensor density and spatial coverage will be crucial for obtaining a comprehensive understanding of PM2.5 pollution inside cities in Nigeria. The findings of this study will contribute to the understanding of air pollution dynamics in Nigeria and help in identifying potential sources of PM2.5 pollution in the study area. Further, it will inform policymakers and stakeholders about the need for targeted interventions to reduce pollution levels in cities like Akure and similar urban areas in West Africa.
Supplementary Materials
The following supporting information can be downloaded at: https://www.mdpi.com/article/10.3390/atmos15070867/s1, Table S1: Monthly mean of PM2.5 mass concentrations for all site data obtained in the present study; Table S2: Seasonal mean of PM2.5 mass concentrations at each site obtained in the present study; Figure S1: Seasonal variation of number of fire spots over Nigeria detected by MODIS from 2020 to 2022; Figure S2: Scatter plot of monthly mean of PM2.5 concentrations at all sites and number of fire spots in Nigeria observed by MODIS.
Author Contributions
Conceptualization, T.N. and F.O.A.; sensor preparation and calibration, T.N. and Y.M.; observation and data collection, F.O.A., M.M.N., A.A. and S.D.O.; data curation and analysis, S.S. and T.N.; visualization, S.S. and K.K. (Kenta Kanegae); discussion; S.S., T.N. and K.K. (Kazuaki Kawamoto); writing, S.S. and T.N.; funding acquisition, T.N. All authors have read and agreed to the published version of the manuscript.
Funding
This research was supported by Leading Initiative for Excellent Young Researchers and the Grant-in-Aid for Scientific Research (KAKENHI 21KK0187), MEXT, Japan, the Grant for Environmental Research Projects from the Sumitomo Foundation, and the Nagasaki University WISE Programme.
Institutional Review Board Statement
Not applicable.
Informed Consent Statement
Not applicable.
Data Availability Statement
Data available upon request.
Acknowledgments
The authors express their appreciation to K. Arasaki (Nagasaki University) for their support on sensor preparation and data analyses, and to P. Nakayama and H. Nakayama (Nagasaki University) for their advice.
Conflicts of Interest
The authors declare no conflicts of interest.
Correction Statement
This article has been republished with a minor correction to resolve errors in the manufacturer. This change does not affect the scientific content of the article.
References
- Feng, S.; Gao, D.; Liao, F.; Zhou, F.; Wang, X. The health effects of ambient PM2.5 and potential mechanisms. Ecotoxicol. Environ. Saf. 2016, 128, 67–74. [Google Scholar] [CrossRef]
- Pai, S.J.; Carter, T.S.; Heald, C.L.; Kroll, J.H. Updated World Health Organization Air Quality Guidelines Highlight the Importance of Non-anthropogenic PM2.5. Environ. Sci. Technol. Lett. 2022, 9, 501–506. [Google Scholar] [CrossRef]
- McDuffie, E.E.; Martin, R.V.; Spadaro, J.V.; Burnett, R.; Smith, S.J.; O’Rourke, P.; Hammer, M.S.; van Donkelaar, A.; Bindle, L.; Shah, V.; et al. Source sector and fuel contributions to ambient PM2.5 and attributable mortality across multiple spatial scales. Nat. Commun. 2021, 12, 3594. [Google Scholar] [CrossRef]
- Southerland, V.A.; Brauer, M.; Mohegh, A.; Hammer, M.S.; van Donkelaar, A.; Martin, R.V.; Apte, J.S.; Anenberg, S.C. Global urban temporal trends in fine particulate matter (PM2.5) and attributable health burdens: Estimates from global datasets. Lancet Planet. Health 2022, 6, 139–146. [Google Scholar] [CrossRef]
- Fisher, S.; Bellinger, D.C.; Cropper, M.L.; Kumar, P.; Binagwaho, A.; Koudenoukpo, J.B.; Park, Y.; Taghian, G.; Landrigan, P.J. Air pollution and development in Africa: Impacts on health, the economy, and human capital. Lancet Planet. Health 2021, 5, 681–688. [Google Scholar] [CrossRef]
- World Bank. World Development Indicators, Nigeria. 2024. Available online: https://databank.worldbank.org/source/world-development-indicators (accessed on 8 May 2024).
- Orogade, S.A.; Kayode, O.O.; Philip, K.H.; Donatus, B.A.; Abubakar, U.I.; Charles, A.O. Source Apportionment of Fine and Coarse Particulate Matter in Industrial Areas of Kaduna, Northern Nigeria. Aerosol Air Qual. Res. 2016, 16, 1179–1190. [Google Scholar] [CrossRef]
- Etchie, T.O.; Etchie, A.T.; Adewuyi, G.O.; Pillarisetti, A.; Sivanesan, S.; Krishnamurthi, K.; Arora, N.K. The gains in life expectancy by ambient PM2.5 pollution reductions in localities in Nigeria. Environ. Pollut. 2018, 236, 146–157. [Google Scholar] [CrossRef]
- Simwela, A.; Xu, B.; Mekondjo, S.S.; Morie, S. Air Quality Concerns in Africa: A Literature Review. Int. J. Sci. Res. Publ. 2018, 8, 588–594. [Google Scholar] [CrossRef]
- Akinwumiju, A.S.; Ajisafe, T.; Adelodun, A.A. Airborne Particulate Matter Pollution in Akure Metro City, Southwestern Nigeria, West Africa: Attribution and Meteorological Influence. J. Geovis. Spat. Anal. 2021, 5, 1–17. [Google Scholar] [CrossRef]
- Kim, K.H.; Jahan, S.A.; Kabir, E. A review of diseases associated with household air pollution due to the use of biomass fuels. J. Hazard. Mater. 2011, 192, 425–431. [Google Scholar] [CrossRef]
- WHO. Air Quality, Energy and Health. 2023. Available online: https://www.who.int/teams/environment-climate-change-and-health/air-quality-and-health/policy-progress/sustainable-development-goals-air-pollution (accessed on 20 October 2023).
- Martin, R.V.; Brauer, M.; van Donkelaar, A.; Shaddick, G.; Narain, U.; Dey, S. No one knows which city has the highest concentration of fine particulate matter. Atmos. Environ. 2019, 3, 100040. [Google Scholar] [CrossRef]
- Odu-Onikosi, A.; Herckes, P.; Fraser, M.; Hopke, P.; Ondov, J.; Solomon, P.A.; Popoola, O.; Hidy, G.M. Tropical Air Chemistry in Lagos, Nigeria. Atmosphere 2022, 13, 1059. [Google Scholar] [CrossRef]
- Abulude, F.O.; Fagbayide, S.D.; Akinnusotu, A.; Elisha, J.J.; Makinde, O.E. Particulate matter and source identification: A case study of Nigeria. Eng. Appl. Sci. Res. 2019, 46, 151–169. [Google Scholar] [CrossRef]
- Ezeh, G.C.; Abiye, O.E.; Obioh, I.B. Elemental analyses and source apportionment of PM2.5 and PM2.5–10 aerosols from Nigerian urban cities. Cogent Environ. Sci. 2017, 3, 1323376. [Google Scholar] [CrossRef]
- Abulude, F.O.; Abulude, I.A.; Ezeh, G.C.; Acha, S. Source Identification and Pollution Factors of Elements in PM2.5 Samples Obtained in Akure, Ondo State, Nigeria. Aerosol Sci. Eng. 2021, 5, 307–317. [Google Scholar] [CrossRef]
- Awokola, B.; Okello, G.; Johnson, O.; Dobson, R.; Ouédraogo, A.R.; Dibba, B.; Ngahane, M.; Ndukwu, C.; Agunwa, C.; Marangu, D.; et al. Longitudinal Ambient PM2.5 Measurement at Fifteen Locations in Eight Sub-Saharan African Countries Using Low-Cost Sensors. Atmosphere 2022, 13, 1593. [Google Scholar] [CrossRef]
- Ezeh, G.C.; Obioh, I.B.; Asubiojo, O.I.; Onwudiegwu, C.A.; Nuviadenu, C.K.; Ayinla, S.B. Airborne fine particulate matter (PM2.5) at industrial, high- and low-density residential sites in a Nigerian megacity. Toxicol. Environ. Chem. 2018, 100, 326–333. [Google Scholar] [CrossRef]
- Popoola, O.A.M.; Alani, R.; Assah, F.; Lawanson, T.; Tchouaffi, A.K.; Mapa-Tassou, C.; Blanche, N.; Odekunle, D.; Unuigboje, R.; Onifade, V.A.; et al. Assessment of the Temporal and Seasonal Variabilities in Air Pollution and Implications for Physical Activity in Lagos and Yaoundé. Atmosphere 2023, 14, 1693. [Google Scholar] [CrossRef]
- Owoade, O.K.; Abiodun, P.O.; Omokungbe, O.R.; Fawole, O.G.; Olise, F.S.; Popoola, O.O.M.; Jones, R.L.; Hopke, P.K. Spatial-temporal Variation and Local Source Identification of Air Pollutants in a Semi-urban Settlement in Nigeria Using Low-cost Sensors. Aerosol Air Qual. Res. 2021, 21, 200598. [Google Scholar] [CrossRef]
- Abulude, F.O.; Abulude, I.A. Monitoring Air Quality in Nigeria: The Case of Center for Atmospheric Research-National Space Research and Development Agency (CAR-NASRDA). Aerosol Sci. Eng. 2021, 5, 478–498. [Google Scholar] [CrossRef]
- Karagulian, F.; Barbiere, M.; Kotsev, A.; Spinelle, L.; Gerboles, M.; Lagler, F.; Redon, N.; Crunaire, S.; Borowiak, A. Review of the Performance of Low-Cost Sensors for Air Quality Monitoring. Atmosphere 2019, 10, 506. [Google Scholar] [CrossRef]
- United Nations. World Population Prospects 2022. 2024. Available online: https://population.un.org/wpp/ (accessed on 8 May 2024).
- Aremu, O.; Bello, E.; Aganbi, B.; Aremu, P.; Machoko, J. Monitoring and Analysis of Urban Heat Island using Remote Sensing Data—A Case Study of Akure, Ondo State, Nigeria. Int. J. Environ. Sci. Nat. Resour. 2017, 4, 153–161. [Google Scholar] [CrossRef]
- Dimari, G.A.; Hati, S.S.; Waziri, M.; Maitera, O.N. Pollution Synergy from Particulate Matter Sources: The Harmattan Fugitive Dust and combustion Emission in Maiduguri Metropolis Nigeria. Eur. J. Sci. Res. 2008, 23, 465–471. [Google Scholar]
- World Bank Group. Climate Change Knowledge Portal for Development Practitioners and Policy Makers, Climate Change Knowledge Portal. 2024. Available online: https://climateknowledgeportal.worldbank.org/country/nigeria (accessed on 8 May 2024).
- Nakayama, T.; Matsumi, Y.; Kawahito, K.; Watabe, Y. Development and evaluation of a palm-sized optical PM2.5 sensor. Aerosol Sci. Technol. 2018, 52, 2–12. [Google Scholar] [CrossRef]
- Ly, B.T.; Matsumi, Y.; Vu, T.V.; Sekiguchi, K.; Nguyen, T.T.; Pham, C.T.; Nghiem, T.D.; Ngo, I.H.; Kurotsuchi, Y.; Nguyen, T.H.; et al. The effects of meteorological conditions and long-range transport on PM2.5 levels in Hanoi revealed from multi-site measurement using compact sensors and machine learning approach. J. Aerosol Sci. 2021, 152, 105716. [Google Scholar] [CrossRef]
- Singh, T.; Matsumi, Y.; Nakayama, T.; Hayashida, S.; Patra, P.K.; Yasutomi, N.; Kajino, M.; Yamaji, K.; Khatri, P.; Takigawa, M.; et al. Very high particulate pollution over northwest India captured by a high-density in situ sensor network. Sci. Rep. 2023, 13, 13201. [Google Scholar] [CrossRef]
- Stein, A.F.; Draxler, R.R.; Rolph, G.D.; Stunder, B.J.B.; Cohen, M.D.; Ngan, F. NOAA’s HYSPLIT Atmospheric Transport and Dispersion Modeling System. Bull. Am. Meteorol. Soc. 2015, 96, 2059–2077. [Google Scholar] [CrossRef]
- Justice, C.O.; Giglio, L.; Korontzi, S.; Owens, J.; Morisette, J.T.; Roy, D.; Descloitres, J.; Alleaume, S.; Petitcolin, F.; Kaufman, Y. The MODIS fire products. Remote Sens. Environ. 2002, 83, 244–262. [Google Scholar] [CrossRef]
- Owoade, O.K.; Fawole, O.G.; Olise, F.S.; Ogundele, L.T.; Olaniyi, H.B.; Almeida, M.S.; Ho, M.D.; Hopke, P.K. Characterization and source identification of airborne particulate loadings at receptor site-classes of Lagos Mega-City, Nigeria. J. Air Waste Manag. Assoc. 2013, 63, 1026–1035. [Google Scholar] [CrossRef]
- Lala, M.A.; Onwunzo, C.S.; Adesina, O.A.; Sonibare, J.A. Particulate matters pollution in selected areas of Nigeria: Spatial analysis and risk assessment. Case Stud. Chem. Environ. Eng. 2023, 7, 100288. [Google Scholar] [CrossRef]
- World Health Organization. WHO Global Air Quality Guidelines: Particulate Matter (PM2.5 and PM10), Ozone, Nitrogen Dioxide, Sulfur Dioxide and Carbon Monoxide. 2021. Available online: https://apps.who.int/iris/handle/10665/345329 (accessed on 26 April 2024).
- Sunnu, A.; Afeti, G.; Resch, F. A long-term experimental study of the Saharan dust presence in West Africa. Atmos. Res. 2008, 87, 13–26. [Google Scholar] [CrossRef]
- Jenkins, G.S.; Diokhane, A.M. WRF prediction of two winter season Saharan dust events using PM10 concentrations: Boundary versus initial conditions. Atmos. Environ. 2017, 167, 129–142. [Google Scholar] [CrossRef]
- Léon, J.F.; Akpo, A.B.; Bedou, M.; Djossou, J.; Bodjrenou, M.; Yoboué, V.; Liousse, C. PM2.5 surface concentrations in southern West African urban areas based on sun photometer and satellite observations. Atmos. Chem. Phys. 2021, 21, 1815–1834. [Google Scholar] [CrossRef]
- Wambebe, N.M.; Duan, X. Air Quality Levels and Health Risk Assessment of Particulate Matters in Abuja Municipal Area, Nigeria. Atmosphere 2020, 11, 817. [Google Scholar] [CrossRef]
Disclaimer/Publisher’s Note: The statements, opinions and data contained in all publications are solely those of the individual author(s) and contributor(s) and not of MDPI and/or the editor(s). MDPI and/or the editor(s) disclaim responsibility for any injury to people or property resulting from any ideas, methods, instructions or products referred to in the content. |
© 2024 by the authors. Licensee MDPI, Basel, Switzerland. This article is an open access article distributed under the terms and conditions of the Creative Commons Attribution (CC BY) license (https://creativecommons.org/licenses/by/4.0/).