Abstract
The formation of low-pressure systems (LPSs) over the eastern Atlantic Ocean, near the coast of West Africa, is an exceptional meteorological/climatological feature that can lead to the development of hurricanes. The upper level diffluence induced by the Tropical Easterly Jet (TEJ) plays a crucial role in the formation of LPSs over the eastern Atlantic Ocean, off the coast of West Africa. However, the exact influence of the enhanced TEJ and diffluence in relation to cyclogenesis remains unclear. An active precipitation period over the Indian subcontinent and Africa induces an intensification of the TEJ, African Easterly Jet, and the bifurcation of diffluence off the coast of Africa. Over the past five years (2019–2023), a delayed correlation has been observed between the formation of LPSs over the eastern Atlantic Ocean (7.5° N–20° N, 15° W–41° W), the TEJ over the Indian subcontinent (approximately 2 to 3 days), and the AEJ over Africa (approximately 1 day). This correlation is further linked to the bifurcation of diffluence at the 200 mb level.
1. Introduction
The study of monsoons and their intricate interactions has fascinated scientists for millennia. From Aristotle’s musings on winds and clouds to modern-day meteorology [1], we have come a long way in unraveling the secrets of atmospheric circulation. The formation of low-pressure systems (LPSs), according to Gray’s conditions [2], requires five fundamental factors: (1) warm Sea surface temperatures to provide energy; (2) high humidity in the mid-troposphere to supply moisture; (3) low vertical wind shear to allow the system to organize; (4) pre-existing low-level disturbances to initiate the process; and (5) sufficient Coriolis force to enable the system to spin. These conditions together create an environment conducive to the development of the initial stage of a cyclone. Sea surface temperature (SST) acts as a source of energy in the development of tropical storms. Keeping global warming in the background as a fact, sea surface temperatures (SSTs) are warm enough to provide the energy needed for low-pressure systems to form [3]. The most notable circulation features, e.g., developed upper-level 200 hPa easterly winds and decreased vertical wind shear in the tropical Atlantic region are linked with the positive phases of the sea surface temperature anomaly (SSTA) of the tropical Atlantic Ocean [4]. These conditions are well required to kick start an active Atlantic tropical storm summer season. In the era of global warming, the precedence of winds (850 mb to 200 mb) and wind shear play an influential role in the generation of transient low-pressure systems in the tropical Atlantic [5]. There are various factors influencing eastern Atlantic tropical cyclogenesis, including the strong West African Monsoon’s (WAM) influence on atmospheric instability and vertical wind shear [6,7].
The present work explores the nexus of jet streams, monsoons, and LPSs over the eastern Atlantic; namely three jet streams, subtropical jet stream (~30 N, ~200 mb), Tropical Easterly Jet (~8 N, ~200 mb, [8]), and African jets streams (confined ~5 N at ~600 mb), which have different locations and levels over the west African region, have a possible link with low-pressure formations, off the coast of Africa [9]. The formation of LPSs over the eastern Atlantic Ocean, particularly off the coast of West Africa, has long intrigued meteorologists due to its significant implications for regional weather patterns and global climate dynamics [10]. These LPSs, often associated with intense rainfall events and potential tropical cyclone development, have been subjected to extensive study in recent years.
The Tropical Easterly Jet (TEJ) is a planetary-scale easterly flow and semi-permanent feature of the Indian summer monsoon in the upper troposphere [11]. For the rainfall distribution over the Indian region by the successive movement of the Indian summer monsoon from south to north and in the generation of a low-pressure system over the northern Indian Ocean, the TEJ plays a pivotal role [12,13]. The TEJ, a prominent feature of the Asian and African monsoon systems, has been identified as a key driver in the genesis and intensification of these LPSs. The upper level diffluence induced by the TEJ creates favorable conditions for the development of cyclonic circulations over the eastern Atlantic, leading to the formation of LPSs. Diffluence and divergence at 200 mb are being used quite often, with both indicating outflow, in general in this work. Approximately 60% of tropical cyclones and 85% of intense hurricanes in the Atlantic originate from tropical easterly waves [14].
In this manuscript, we aim to elucidate the intricate relationship between the TEJ, African Easterly Jet (AEJ), and the formation of LPSs over the eastern Atlantic Ocean. Specifically, we investigate the temporal and spatial variability of the TEJ and its influence on the genesis of LPSs during the peak monsoon months, with a focus on September.
The eastern Atlantic Ocean, off the coast of West Africa, is a breeding ground for low-pressure systems (LPSs) during the Northern Hemisphere’s summer months (June–September) [15]. Most of the LPSs are formed off the coast of Africa where two contrasting air masses of hot, dry air from the desert (known as the Harmattan), and cool, wet air of the Atlantic Ocean (known as a monsoon) interact with jet streams. These LPSs play a crucial role in global atmospheric circulation and regional weather patterns, influencing tropical cyclone development in the Atlantic basin and subsequent precipitation events over the Americas [16]. The upper-level atmospheric flow, particularly the Tropical Easterly Jet (TEJ), is known to be a key driver of LPS formation in this region [17]. The TEJ is a zonally oriented jet stream characterized by strong easterly winds typically located between 15° N and 20° N in the upper troposphere [11].
This study investigates the interplay between the TEJ, the African Easterly Jet (AEJ), and active Indian and African monsoon phases in influencing LPS formation over the eastern Atlantic Ocean during the September months from 2019 to 2023. The AEJ, another prominent easterly jet stream located north of the equator over Africa, also plays a role in atmospheric circulation patterns over West Africa [18]. The mid-level African Easterly Jet forms due to the heating of the West African landmass, creating a temperature and moisture gradient between the Gulf of Guinea and the Sahara Desert, which in turn generates vertical wind shear to maintain thermal wind balance. Both TEJ and AEJ are part of the easterly winds at slightly different latitudes and quite different heights. Thus, they remain a central part of the general wind shear over western Africa to off the coast of Africa. Active phases of the Indian subcontinent summer monsoons are characterized by enhanced precipitation over these regions and are known to be linked to the strength and position of the Tibetan anticyclone [11,19]. Obviously, an excited Tibetan anticyclone will provide strength to its outer limbs known as upper-level easterly jet streams.
The present research work does not undermine the role of the Sahara Air Layer (SAL) in the formation or mitigation of low-pressure systems. Wu et al. [20] examined the effects of the SAL on Atlantic tropical cyclones with and without dust. They found that if the SAL is over the northwest quadrant, then it will help in enhancing the hurricane; otherwise, it tries to suppress the convection. However, most of such studies do not reflect anything on the genesis of the low-pressure systems.
Previous research tried to establish the role of the TEJ in inducing upper-level diffluence (areas of diverging winds) over the eastern Atlantic, which can favor LPS development [19]. However, the precise influence of a strengthened TEJ and the associated diffluence patterns on cyclogenesis (the formation of LPSs) remain as areas of active investigation. This study aims to address this gap by analyzing the following:
- The influence of easterly jet streams on LPS development.
The relationship between TEJ intensity and LPS formation over the eastern Atlantic during the September months (2019–2023).
- The potential link between active Indian and African monsoon phases and LPS formation over the eastern Atlantic.
By analyzing data from the September months over the past five years, this study seeks to improve our understanding of the complex interplay between upper-level tropospheric easterly jet streams, monsoon activity, and LPS formation in the eastern Atlantic region.
2. Materials and Methods
Daily wind data, including u-component and v-component, as well as wind climatology, were obtained from the NCEP (National Center for Environmental Prediction, https://psl.noaa.gov/data/gridded/data.ncep.reanalysis.html, accessed on 13 May 2024, reanalysis for the years 2019 to 2023. Information on tropical cyclones and hurricanes, such as origin, name, duration, latitudes, and longitudes, was synthesized from the Tropical Cyclone Reports (TCRs) of the National Hurricane Center (NHC) available at NHC https://www.nhc.noaa.gov/data/tcr/index.php, accessed on 13 May 2024. Our research focused on tracking systems in the eastern Atlantic and western Africa, monitoring the progression from African waves to low-pressure systems (Table 1). This table simply provides information on the generation of African waves and the formation of LPSs. According to climatology, the number of hurricanes is at the maximum in the month of September. Thus, we chose to pay attention to the features of diffluence, vorticity, and winds in the month of September. Additionally, data on active days of the Indian summer monsoon (ISM) from 2019 to 2023 were collected from the Indian Meteorological Department (IMD, https://mausam.imd.gov.in/imd_latest/contents/rainfall_time_series.php, accessed on 13 May 2024).

Table 1.
Total number of low-pressure systems over selected box (7.58° N–20° N, 15° W–41° W) over Atlantic Ocean.
In Figures 5–10, Day-0 to Day-3 denotes the following: A case of the Indian summer monsoon (ISM) active spell during 11–17 September 2021. Day-0, Day-1, Day-2, and Day-3 are considered the durations of 11–17 September 2021, 12–18 September 2021, 13–19 September 2021, and 14–20 September 2021, respectively. Likewise, we considered this procedure for all active days (listed in Table 2) for Day-0 to Day-3. We created Figures 5–10 by averaging the active days of 5 years from Table 2, and those are called composite figures.

Table 2.
Summer monsoonal rainfall days in 5 years (2019–2023, September months).
3. Results
Our analysis focuses on the September months of the years 2019 to 2023, utilizing the above-mentioned reanalysis and observational datasets to examine the behavior of the Tropical Easterly Jet (TEJ) over the Indian subcontinent, African Easterly Jet (AEJ) over western Africa, and the occurrence of LPSs over the eastern Atlantic. It is important to note that it has been shown [21,22,23,24] that a large number of low-pressure systems originated from 8N to 20N and off the coast of Africa.
Figure 1 shows the area of study (red box, 7.5° N–20° N, 15° W–41° W) while the dots show the first day of the initiation location of the low-pressure system or a wave off the coast of Africa. These dots are 20 in total and 13 of those belong to September, 2 to August, 1 to July, 2 to June, and 1 to the October months colored accordingly in the figure. Most of the tropical depressions lasted for ~4 days, while their initial waves [25] were generated 1 to 5 days prior, sometimes over the ocean, off the coast of Africa (Table 1). Considering the case of Rose (TS), the wave was generated over the Atlantic Ocean on 16 September 2021, while Rose (TS) was generated on 19 September 2021 (3 days later) and lasted for 4 days (19–22 September 2021) as shown in Table 2. The intensity of these transients (temporary disturbances in the atmospheric flow) was quite shallow, initiated with ~1009 mb to 1005 mb mean sea level pressure. This region falls in the exit vicinity of the African Easterly Jet at ~600 mb and the Tropical Easterly Jet (TEJ) at ~200 mb. These easterly jet streams at the middle troposphere to upper troposphere facilitate the formation of West African waves, which produce tropical storms, and later on, a few of those develop into hurricanes in the Atlantic Ocean.
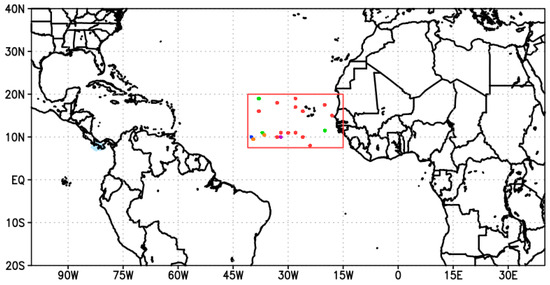
Figure 1.
The region of interest in the study (red box, 7.5° N–20° N, 15° W–41° W) with the genesis location of a low-pressure system off the coast of Africa. The genesis location of the LPS is shown in orange, blue, green, red, and purple for June, July, August, September, and October, respectively.
However, it is becoming imperative to investigate the climatological aspect of winds, divergence, and their intensity at lower and upper tropospheric levels for the September months. Figure 2a,b comprise the winds as the streamlines and the shaded part as the divergence and vorticity at two levels of 200 mb and 850 mb. The climatological winds in the box reached 10 m/s and more at 200 mb (Figure 2a). The path of the TEJ and its existing locations are shaded from orange to dark orange in Figure 2a, where the streamlines are near to each other. From Bay of Bengal to off the coast of Africa, the TEJ is shown by the hand-drawn yellow curve, which is bifurcating over the region of cyclogenesis (Figure 2a, red box). This yellow curve is considered from the Indian region to off the coast of Africa to let readers know the path all the way throughout, which is a part of the TEJ. The exiting location of the TEJ is situated in the red box (Figure 2a), which is the region of interest. Apparently, this box is also the center of anticyclonic circulation at 200 mb. The divergence and anticyclone in this box lead to diffluence at 200 mb. In contrast, Figure 2b shows the lower-level convergence over western Africa which extends off the coast of Africa. Thus, in the September months, off the coast of Africa appears to be conducive for the germination of a low-pressure system in tandem with positive vorticity over a huge portion over India. Active precipitation spells and upper tropospheric outflow over the Indian subcontinent, Africa, and the eastern Atlantic Ocean help in intensification and thus perhaps in bifurcation of the TEJ, off the African coast.
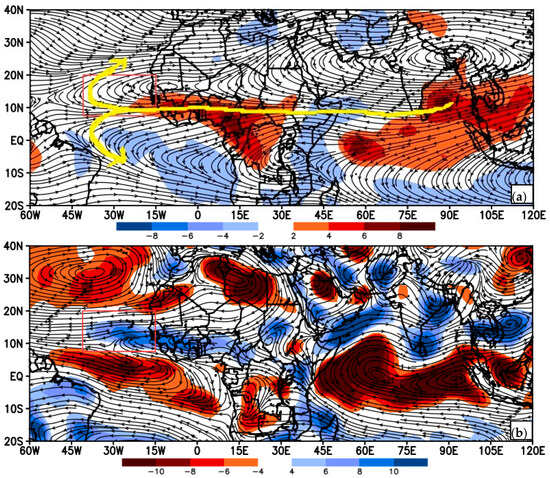
Figure 2.
Streamlines for September climatology (1981–2010): (a) divergence (200 mb, s−1) and (b) vorticity (850 mb, s−1). The red box is the region of study and area of diffluence as mentioned in Figure 1. The bifurcation of the TEJ is shown by yellow curves over the region of interest. In all figures, 15 E means 15° E.
Low-pressure systems have their own characteristics, e.g., winds are inspired by pressure systems and accompanied by rainfall. All the panels in Figure 3 are corresponding to the composite of September LPS 2019–2023. Figure 3a is a wind (as streamlines) and divergence (shaded) composite of all low-pressure systems from Table 1 for the whole September month from 2019 to 2023 at 200 mb. Over the Indian region, a robust anticyclone along with its elongated southern limb over the west Pacific Ocean, the Indian Ocean, and East Africa to off the coast of Africa can be observed. The strength and weakness of the Tibetan anticyclone (TA) and its limbs depend on the active-break cycle of the ISM and vice versa [26]. Here, we embark on the southern and western elongated limb of the TA at 200 mb, which is called the TEJ, responsible for the generation of LPSs in the east Atlantic Ocean. Next, the support for the formation of LPSs comes from the AEJ at 600 mb. A positive vorticity along with the AEJ is evident in Figure 3b. In Figure 3c, we tried to look for the cyclogenesis at 850 mb off the coast of Africa, which is seen over the selected box. The gaining strength and eastward movement of Azores High play a significant role in the strengthening of cyclogenesis over the east Atlantic Ocean [27].
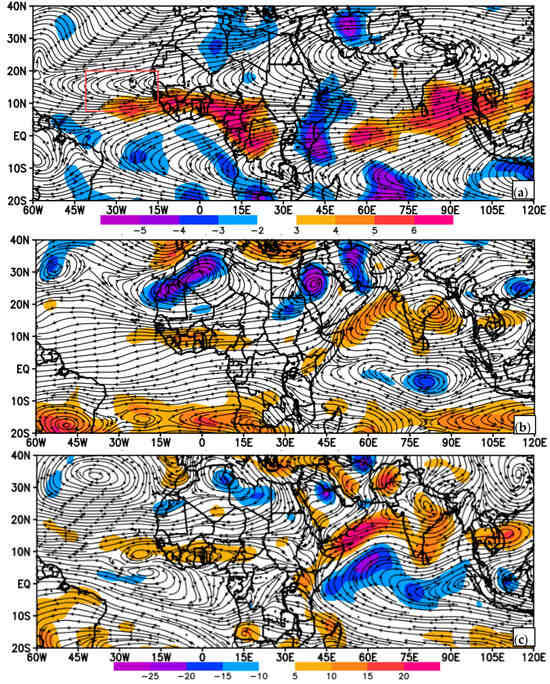
Figure 3.
(a) Diffluence (200 mb, s−1) and (b,c) vorticity (600 mb and 850 mb, s−1) for the composite of low-pressure systems (LPSs) of the September months during 2019–2023 over a selected region.
The TEJ, an upper-level easterly wind belt, emerges as a key player in LPS formation. Its diffluence patterns are critical, but their impact on cyclogenesis remains elusive. For cyclogenesis, we examine the strength of the TA excited by rainfall activity over the Indian region. Therefore, we constructed, as in Figure 4, a composite of all active days of ISMs for September from 2019 to 2023 (Table 2). A well-defined monsoon flow is observed over the Indian Ocean to the Indian landmass (Figure 4b). An active TA-like flow (Figure 3a) is observed here, which extends its south-west limb up off the coast of Africa. A positive divergence at 200 mb (Figure 4a) over the Indian region and off the coast of Africa is an indication of upper tropospheric outflow of the winds in association with a low-level vorticity at 850 (Figure 4b). Many other features like well-organized Azores High and Saharan High are observed in these two figures, Figure 3c and Figure 4b.
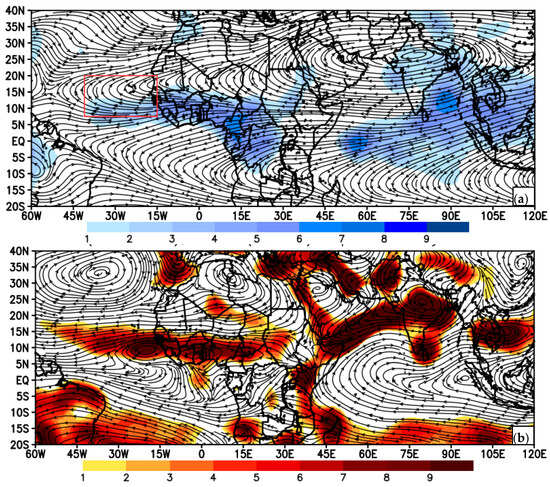
Figure 4.
Streamlines (a) and diffluence (200mb, s−1) in blue shade, (b) vorticity (850, s−1) in red to brown shade, for composite of active spell days of Indian summer monsoon in September months during 2019–2023.
Even though vorticity and streamlines for LPS composites and ISM active days seem to be similar in many of their characteristics, they are not. There is a requirement to find out if there is any lag and lead association between upper tropospheric wind flow and surface cyclogenesis. Figure 5 shows the streamline and divergence at 200 mb, a composite of ISM active days from Day-0 to Day-3. The explanation of Day-0 to Day-3 is explained in the datasets and Methods section. As the days progress from Day-0 to Day-3, the divergence off the coast of Africa intensifies in Figure 5a–d, while TA weakens over the Indian region in a week or so sometimes. In the region of interest, divergence over off the coast of Africa is concentrated over a smaller region (Figure 5d) than Figure 5a. Figure 5 shows the upper-level divergence at 200 mb for 4 days from the composite of active spell days of the Indian summer monsoon in September 2019–2023. It is visible in each of the four panels that there are positive values up to 6 s−1 over the central western coast of Africa, and off the eastern coast of India. Typically, upper-level divergence is a sign of vertical motion, hence these two areas are likely to see active weather occur in their areas. Over the past five years, we have observed a distinct temporal relationship. The magnitude of correlation between diffluence over the region of interest and the TEJ over the Indian region (20° N–35° N, 70° E–100° E) increases from Day-0 to Day-2 sometime up to Day-3 from 0.1 to 0.2. LPS formation in the eastern Atlantic Ocean correlates with the TEJ over the Indian subcontinent (approximately 2 to 3 days later) and Africa (approximately 1 day later). The 200 mb level diffluence plays a crucial role in this connection. From Day-0 to Day-3, the Azores High is weakened and shifted eastward leading to less stabilization of the atmosphere. The counterpart of diffluence and positive vorticity at the lower level should be a decisive sign of the formation of an LPS in Figure 6.
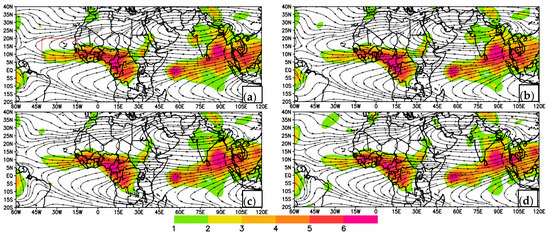
Figure 5.
Divergence (200 mb, s−1) for (a) Day-0, (b) Day-1, (c) Day-2, and (d) Day-3 from the composite of active spell days (Table 2) of the Indian summer monsoon in September during 2019–2023. Here, Day-0 to Day-3 is based on Table 2, which denotes the following: From Table 2, consider a case of the Indian summer monsoon (ISM) active spell during 11–17 September 2021. Day-0, Day-1, Day-2, and Day-3 will be 11–17 September 2021, 12–18 September 2021, 13–19 September 2021, and 14–20 September 2021, respectively. In a similar way, the other figures, Figure 6, Figure 7, Figure 8, Figure 9 and Figure 10, are created for Day-0 to Day-3.
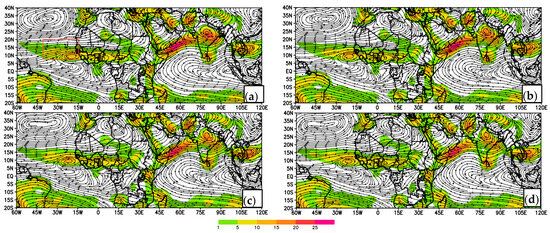
Figure 6.
Vorticity (850 mb, s−1) for (a) Day-0, (b) Day-1, (c) Day-2, and (d) Day-3 from composite of active spell days (Table 2) of Indian summer monsoon in September during 2019–2023. Day-0, Day-1, Day-2 and Day-3 will be 11–17 September 2021, 12–18 September 2021, 13–19 September 2021, and 14–20 September 2021.
Next, convergence at 850 mb shows the exact correspondence of the TA from Day-0 to Day-3 in Figure 6a–d. Figure 6 shows the vorticity values at 850 mb for 4 days of composite. Across these 4 days, there is a region in central and eastern India and a small region off the western coast of Africa (inside the study region) that have positive vorticity values. The largest region of positive vorticity is between India and Africa, with values around 25 s−1. Vorticity at 850 mb (Figure 6) and diffluence at 200 mb, all inside the box (Figure 5), are complementary to each other.
African waves generally move from east to west. Figure 7 is the Hovmöller diagram (averaged over 8° N–20° N) for the propagation of meridional waves at 850 mb. Each of the panels in this figure shows the month of September during the years 2019–2023. The blue dot shows when the genesis/wave of the low-pressure system forms from the African easterly wave (Table 2). Each of these dots is between 15° W and 30° W and is also associated with an area of positive values greater than or equal to five. The date varies at which the low-pressure system forms. The year 2019 did not have a blue dot on its image. It also does not have the same distinctive diagonal lines that the following years have, especially in 2023 where the blue dot is. In all these panels, a wave propagation from the Indian region (east) to off the coast of Africa (west) is evident.
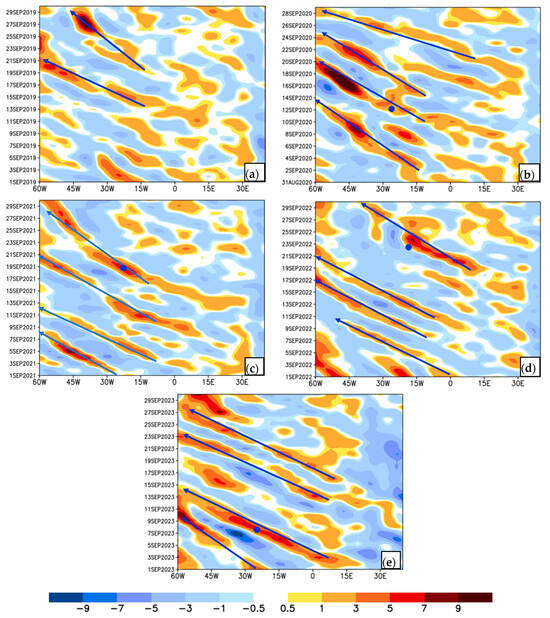
Figure 7.
A Hovmöller diagram for the propagation of meridional waves (based on the V-component of wind) at 850 mb averaged over 8° N–20° N (a–e) from 2019 to 2023. The blue dots show the date and location of the genesis of the low-pressure system (LPS, Table 1) in that year. The blue arrows indicate the direction of easterly waves from the Indian and African regions to off the coast of Africa.
Special Case of LPSs and Active ISMs
Let us examine a case of a hurricane, which originated off the coast of Africa and can be related to an active rainfall day of the Indian summer monsoon (ISM). We focused on the genesis of Hurricane Sam, which began as an African wave on 19 September 2021, at coordinates (9° N, 19° W), and was later on converted into a full-flegded hurricane. Figure 8a illustrates this major hurricane with a red line. Before Sam’s formation in the eastern Atlantic Ocean, there was an active ISM spell from 11 to 17 September 2021.
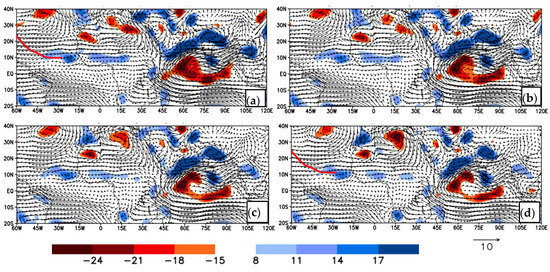
Figure 8.
Wind vectors and vorticity (850 mb, shaded, s−1) for the development of an African wave [later named as Sam (a major hurricane)], on 19 September 2021, at (9° N, 19° W) off the coast of Africa along with the Indian summer monsoon (ISM) active spell during 11–17 September 2021, on (a) Day-0 (11–17 September), (b) Day-1 (12–18 September), (c) Day-2 (13–19 September), and (d) Day-3 (14–20 September). Major Hurricane Sam is shown in the red line.
Figure 8 presents four panels corresponding to Day-0 (11–17 September), Day-1 (12–18 September), Day-2 (13–19 September), and Day-3 (14–20 September). A well-defined wave emerged on Day-3, which eventually led to the genesis of major Hurricane Sam on September 19. The circulation pattern at the lower troposphere is organized on September 19 as compared to previous days. Next, let us look at the diffluence at 200 mb in Figure 9. Initially, in Figure 9a–d, there is an enhancement of diffluence from Day-0 to Day-3 over the eastern Atlantic Ocean. Figure 9 shows a high intensity of divergence off the coast of Africa on Day-3, corresponding to this event (Sam, a major hurricane in 2021). From Day-0 to Day-3, the TA strengthened, and the divergence has enhanced over the eastern Atlantic Ocean. This sequence from Figure 5, Figure 6, Figure 7, Figure 8 and Figure 9 indicates roughly two to three days of lag between active ISM days and the origin of the low-pressure system associated with the tropical Atlantic (TA). Diffluence is well spread on Day-3 in Figure 9d, which can help in inducing LPSs at the surface level. Diffluence combines the noticeable features of Figure 8d and Figure 9d well, and a complete picture of the genesis of a wave is revealed.
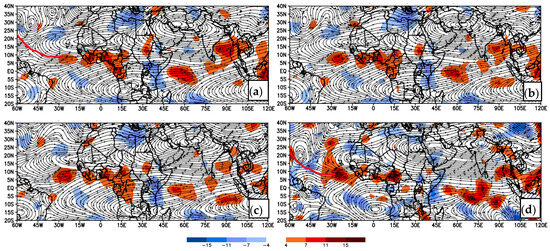
Figure 9.
Wind vectors and divergence (200 mb, shaded, s−1) for the development of an African wave [later named as Sam (a major hurricane)], on 19 September 2021, at (9° N, 19° W) off the coast of Africa along with the Indian summer monsoon (ISM) active spell during 11–17 September 2021, on (a) Day-0 (11–17 September), (b) Day-1 (12–18 September), (c) Day-2 (13–19 September), and (d) Day-3 (14–20 September). A major hurricane is shown in the red line.
Next, we investigate the association between the African Easterly Jet (AEJ) and low-pressure systems (LPSs). The African Easterly Jet instigates wave instability, African waves, and cyclogenesis over western Africa and off the coast of Africa [28]. Figure 10 illustrates the active days of West African rainfall from Day-0 to Day-1. The correlation between diffluence over the region of interest and the TEJ over the West African region increases from Day-0 to Day-1 from 0.1 to 0.2. Figure 10b shows the strength of the LPS with a one-day lag, which is shown by the blue color (positive vorticity) just off the coast of Africa. A small wave of a low-pressure system can trigger the generation of a tropical disturbance. These disturbances are well supported by the high-pressure systems at mid-latitude and surrounding areas.

Figure 10.
Streamline and vorticity (600 mb, shaded, s−1) for the generation of an African wave on 19 September 2021, at (9° N, 19° W) off the coast of Africa along with the West African Monsoon (WAM) active spell during 18–27 September 2021, on (a) Day-0 (18–27 September) and (b) Day-1 (19–28 September). A major hurricane is shown in the red line.
Our findings reveal a consistent delayed correlation (2–3 days) between the intensification of the Tropical Easterly Jet (TEJ) over the Indian subcontinent and Africa and the subsequent formation of LPSs off the coast of West Africa. Additionally, our results underscore the role of upper-level atmospheric diffluence, particularly at the 200 mb level, influencing the genesis and propagation of LPSs. The bifurcation of diffluence off the coast of Africa is identified as a crucial factor affecting the spatial distribution and intensity of LPSs over the surface of the eastern Atlantic.
4. Conclusions and Discussion
In conclusion, our study underscores the importance of the Tropical Easterly Jet (TEJ), African Easterly Jet (AEJ), and upper-level diffluence in driving the formation of a wave and low-pressure systems over the eastern Atlantic Ocean. The observed delayed correlation between the TEJ and LPS formation suggests potential teleconnections between the Asian and African monsoon systems and the tropical dynamics of the Atlantic basin. Active Indian summer monsoon rainfall spells and active West African summer monsoons promote the formation of wave and low-pressure systems with a lag of around 2 to 3 days through TEJ and a 1-day lag through AEJ, respectively. These findings contribute to a better understanding of the complex interactions between regional monsoon circulations and global atmospheric dynamics, with implications for weather forecasting, climate modeling, and the prediction of extreme weather events in the Atlantic and Indian Ocean basins. Further research is warranted to elucidate the mechanisms underlying these relationships and their potential implications for future climate variability and change. This knowledge can also contribute to more accurate weather forecasting and improve our ability to predict extreme weather events associated with these LPSs.
On the individual point, low-pressure systems, Indian summer monsoons, and African summer monsoons have their own variability in space and time. Natural variability of various ocean basins, e.g., North Atlantic Oscillations (NAOs), Atlantic Multi-decadal Oscillations (AMOs), Indian Ocean (IOD), Pacific Decadal Oscillations (PDOs), and El Nino–Southern Oscillation (ENSO) have an influence on the intensity and structure of monsoons [29] and hurricanes. In our study, 2019–2020 and 2021–2022 were El Nino and La Nina years. How the ENSO and other climate controllers control ISMs, ASMs, and hurricanes together is the point of further investigation. In the next research assignment, we will consider a modeling approach for their mutual interaction (monsoons and remote controllers) on the genesis of low-pressure systems.
As a point of discussion, the intensity of the TEJ might push the difference and bifurcation over our study region further west. Next, the decrease in the strength of the TEJ during the Asian summer monsoon might affect the genesis of tropical hurricanes over off the coast of Africa and the Indian region as well [30]. The instability of mean flow areas likely provides a more favorable environment for wave intensification. This factor should be considered alongside sea surface temperature, vertical shear, precipitation, the role of Saharan air, and other large-scale forcings that influence the development and frequency of tropical cyclones.
Author Contributions
Conceptualization, V.K. and D.K.S.; methodology, V.K. and D.K.S.; software, V.K.; validation, D.K.S., K.S. and S.G.; formal analysis, V.K.; investigation, D.K.S., K.S. and S.G; resources, V.K. and D.K.S.; data curation, V.K.; writing—original draft preparation, V.K. and K.S.; writing—review and editing, D.K.S., K.S. and S.G.; visualization, V.K.; supervision, V.K.; project administration, V.K.; funding acquisition, V.K. All authors have read and agreed to the published version of the manuscript.
Funding
This research received no external funding.
Data Availability Statement
All the datasets are available online and free of cost. The datasets have the link to those websites in the manuscript.
Acknowledgments
We acknowledge UIW for their support with computing machines.
Conflicts of Interest
The authors declare no conflicts of interest.
References
- Aristotle. (350 B.C.). Meteorology. In This Ancient Work, Aristotle Begins to Describe the Links between Heating, Evaporation, and the Forces Driving Winds—A Foundation for Our Understanding of Monsoons; Available online: https://classics.mit.edu/Aristotle/meteorology.html (accessed on 17 July 2024).
- Gray, W.M. Global View of the Origin of Tropical Disturbances and Storms. Mon. Weather. Rev. 1968, 96, 669–700. [Google Scholar] [CrossRef]
- Trenberth, K.E.; Fasullo, J.T. Water and energy budgets of hurricanes: Case studies of Ivan and Katrina. J. Geophys. Res. Atmos. 2007, 112, 1–11. [Google Scholar] [CrossRef]
- Mo, K.; Bell, G.D.; Thiaw, W.M. Impact of Sea Surface Temperature Anomalies on the Atlantic Tropical Storm Activity and West African Rainfall. J. Atmos. Sci. 2001, 58, 3477–3496. [Google Scholar] [CrossRef]
- Aiyyer, A.R.; Thorncroft, C. Climatology of Vertical Wind Shear over the Tropical Atlantic. J. Clim. 2006, 19, 2969–2983. [Google Scholar] [CrossRef]
- Hernandez-Carrascal, J.A.; Ramos-Rodríguez, L.E.; Triana, M.A. The Impact of West African Monsoon Forcing on Eastern Atlantic Tropical Cyclones. Atmosphere 2023, 14, 622. [Google Scholar]
- Martinez-Alvarado, O.M.; Emanuel, K.A.; Bryan, G.H. Environmental Control of Eastern Atlantic Tropical Cyclogenesis. J. Clim. 2021, 34, 5233–5252. [Google Scholar]
- Flohn, H. Investigations on the tropical easterly jet. Bonn. Meteorol. Abh. 1964, 4, 1–83. [Google Scholar]
- Carlson, T.B. Synoptic histories of three African disturbances that developed into Atlantic Hurricanes. Mon. Wea. Rev. 1969, 97, 256–276. [Google Scholar] [CrossRef]
- Thorncroft, C.D.; Hodges, K.I. African easterly wave variability and its relationship to Atlantic tropical cyclone activity. J. Clim. 2001, 14, 1166–1179. [Google Scholar] [CrossRef]
- Krishnamurti, T.N.; Bhalme, H.N. Oscillations of a monsoon system. Part I. Observational aspects. J. Atmos. Sci. 1976, 33, 1937–1954. [Google Scholar] [CrossRef]
- Kumar, V.; Krishnamurti, T.N. Mesoscale modeling for the rapid movement of monsoonal isochrones. Atmos. Sci. Lett. 2015, 17, 78–86. [Google Scholar] [CrossRef]
- Fahad, A.A.; Reale, O.; Molod, A.; Sany, T.A.; Ahammad, M.T.; Menemenlis, D. The Role of Tropical Easterly Jet on the Bay of Bengal’s Tropical Cyclones: Observed Climatology and Future Projection. J. Clim. 2023, 36, 5825–5840. [Google Scholar] [CrossRef]
- Wang, Z. Tropical cyclones and hurricanes|tropical cyclogenesis. In Book Encyclopedia of Atmospheric Sciences, 2nd ed.; Gerald, R.N., John, P., Fuqing, Z., Eds.; Academic Press: Cambridge, UK, 2015; pp. 57–64. [Google Scholar]
- Kerns, B.W.; Chen, S.S. A 3D analysis of convection in the tropical cyclogenesis environment of pre-Hurricane Felix (2007). J. Atmos. Sci. 2013, 70, 2533–2555. [Google Scholar]
- Goldenberg, S.B.; Shapiro, L.J. Physical mechanisms for the association of El Niño and West African rainfall with Atlantic major hurricane activity. J. Clim. 1996, 9, 1169–1187. [Google Scholar] [CrossRef]
- Chen, T.C.; van Loon, H. Interannual variation of the tropical easterly jet. Mon. Weather. Rev. 1987, 115, 1739–1759. [Google Scholar] [CrossRef]
- Cook, K.H. Generation of the African Easterly Jet and its role in determining West African precipitation. J. Clim. 1999, 12, 116. [Google Scholar] [CrossRef]
- Krishnamurti, T.N.; Krishnamurti, R.; Das, S.; Kumar, V.; Jayakumar, A.; Simon, A. A Pathway Connecting the Monsoonal Heating to the Rapid Arctic Ice Melt. J. Atmos. Sci. 2015, 72, 5–34. [Google Scholar] [CrossRef]
- Wu, L.; Su, H.; Zeng, X.; Posselt, D.J.; Wong, S.; Chen, S.; Stoffelen, A. Uncertainty of Atmospheric Winds in Three Widely Used Global Reanalysis Datasets. J. Appl. Meteor. Climatol. 2024, 63, 165–180. [Google Scholar] [CrossRef]
- Krishnamurti, T.N.; Karmakar, N.; Misra, V.; Nag, B.; Sahu, D.; Dubey, S.; Haddad, Z. The role of upper level diffluence in the Tropical Easterly Jet in the formation of the recent strongest Atlantic hurricanes. Earth ArXiv 2018, 1, 1–13. [Google Scholar] [CrossRef]
- Pytharoulis, I.; Thorncroft, C. The Low-Level Structure of African Easterly Waves in 1995. Mon. Wea. Rev. 1999, 127, 2266–2280. [Google Scholar] [CrossRef]
- Carlson, T.N. Some remarks on African disturbances and their progress over the tropical Atlantic. Mon. Wea. Rev. 1969, 97, 716–726. [Google Scholar] [CrossRef]
- Hopsch, S.B.; Thorncroft, C.D.; Hodges, K.; Aiyyer, A. West African Storm Tracks and Their Relationship to Atlantic Tropical Cyclones. J. Clim. 2007, 20, 2468–2483. [Google Scholar] [CrossRef]
- Burpee, R.W. Characteristics of North African easterly waves during the summers of 1968 and 1969. J. Atmos. Sci. 1974, 31, 1556–1570. [Google Scholar] [CrossRef]
- Gadgil, S.; Joseph, P.V. On breaks of the Indian monsoon. J. Earth Syst. Sci. 2003, 112, 529–558. [Google Scholar] [CrossRef]
- Prezerakos, N.G.; Flocas, H.A. The formation of a dynamically unstable ridge at 500 hPa as a precursor of surface cyclogenesis in the central Mediterranean. Met Appl. 2016, 3, 101–111. [Google Scholar] [CrossRef]
- Wu, C.M.-L.; Reale, O.; Schubert, S.D.; Suarez, M.J.; Thorncroft, C.D. African Easterly Jet: Barotropic Instability, Waves, and Cyclogenesis. J. Clim. 2012, 25, 1489–1510. [Google Scholar] [CrossRef]
- Lüdecke, H.-J.; Müller-Plath, G.; Wallace, M.G.; Lüning, S. Decadal and multidecadal natural variability of African rainfall. J. Hydrol. Reg. Stud. 2021, 34, 100795. [Google Scholar] [CrossRef]
- Rao, B.R.S.; Rao, D.V.B.; Brahmananda, V. Rao Decreasing trend in the strength of Tropical Easterly Jet during the Asian summer monsoon season and the number of tropical cyclonic systems over Bay of Bengal. Geo. Phy. Lett. 2004, 31, L14103. [Google Scholar] [CrossRef]
Disclaimer/Publisher’s Note: The statements, opinions and data contained in all publications are solely those of the individual author(s) and contributor(s) and not of MDPI and/or the editor(s). MDPI and/or the editor(s) disclaim responsibility for any injury to people or property resulting from any ideas, methods, instructions or products referred to in the content. |
© 2024 by the authors. Licensee MDPI, Basel, Switzerland. This article is an open access article distributed under the terms and conditions of the Creative Commons Attribution (CC BY) license (https://creativecommons.org/licenses/by/4.0/).