Article

Three-Dimensional Lightning Characteristics Analysis over the Tibetan Plateau Based on Satellite-Based and Ground-Based Multi-Source Data

1
Key Laboratory of Radiometric Calibration and Validation for Environmental Satellites, National Satellite Meteorological Center (National Center for Space Weather), China Meteorological Administration, Beijing 100081, China
2
Key Laboratory of Lightning, China Meteorological Administration, Beijing 100081, China
3
Innovation Center for FengYun Meteorological Satellite (FYSIC), Beijing 100081, China
4
Jiangxi Meteorological Observatory, Nanchang 330096, China
5
Key Laboratory of Climate Change Risk and Meteorological Disaster Prevention of Jiangxi Province, Nanchang 330096, China
6
State Key Laboratory of Severe Weather & CMA Key Laboratory of Lightning, Chinese Academy of Meteorological Sciences, Beijing 100081, China
7
Jiangxi Meteorological Data Center, Nanchang 330096, China
*
Authors to whom correspondence should be addressed.
Atmosphere 2024, 15(7), 854; https://doi.org/10.3390/atmos15070854
Submission received: 8 June 2024 / Revised: 15 July 2024 / Accepted: 16 July 2024 / Published: 19 July 2024
(This article belongs to the Section Atmospheric Techniques, Instruments, and Modeling)

Abstract

:
Based on the data from the Chinese national ground-based (LFEDA: Low-frequency E-field Detection Array) and satellite-based lightning-detection systems (LMI: Lightning Mapping Imager), the spatial and temporal distribution statistical properties of all types of lightning over the Tibetan Plateau in the summer of 2022 and 2023 are analyzed, and were compared with those in Hainan, which are under quite different geographical conditions. The discrepancy between ground-based and space-borne lightning detection was also discussed. The main results show the following: (1) the characteristics of lightning activities over the Tibetan Plateau based on multi-source data: Most of the high-value lightning areas were located in the transition zone between lower and higher terrain; the diurnal variation of lightning activity was significant, and the most active period concentrated around 15:00 LST (Local Standard Time, the same below). In addition, lightning activities were significantly increased at 21:00 and 0:00, which was related to the unique topography and night rain phenomenon of the plateau. In terms of lightning types, the number of IC (Intra-Cloud) lightning was more than that of CG (Cloud-to-Ground). The study of IC changes is of great significance to the early warning of the plateau DCSs. The spatial distribution of IC at different altitudes was quite different. (2) Comparison of lightning activities between the Tibetan Plateau and Hainan: The hourly variation of lightning activities in Nagqu showed a single peak, while that in Hainan was characterized by a primary peak and a secondary peak, affected by the enhancement of the boundary stream in the low latitude and altitude area of China. At the peak of convection, the lightning activities in Nagqu were less than 1/3 of that in Hainan. However, the duration of high-frequency lightning activities in Nagqu (15–19:00) was about 2 h longer than that in Hainan (15–17:00), which may be related to the fact that the Tibetan Plateau is located in the west of China, where the sunset is later, and solar radiation and convective activities last longer. (3) Analysis of features of LMI: LMI has more advantages in IC detection; LMI has higher detection efficiency for the lightning in the range of 4–6 KM altitude, which is partly related to the stronger convective process and the higher proportion of IC. This work will provide deeper understanding of the characteristics of all types of lightning over the Tibetan Plateau, to reveal the indication significance of lightning for DCSs, and help to promote the development of Chinese satellite-based lightning-detection technology, the optimization of subsequent instruments and the fusion application of ground-based and satellite-based lightning data.

1. Introduction

Located in the southwestern region of China, the Tibetan Plateau is the roof of the world, with the Himalayas and the Kunlun Mountains on its southern and northern edges, respectively [1], the Altun Mountains, the Qilian Mountains, the Pamir Plateau, and the Karakoram Mountains in the west, the Qinling Mountains and the Hengduan Mountains in the east, between 26°00′~39°47′ N and 73°19′~104°47′ E. Except for the Qinghai Lake Basin, Qaidam Basin, and the Yarlung Zangbo River valley [2], the terrain is lower than 3000–3500 m, the rest of the region is above 4000 m (Figure 1).
The climate of the Tibetan Plateau shows characteristics such as strong radiation, low temperature, and low accumulated temperature [3], and the temperature decreases with the increase in altitude and latitude. Under the combined effect of the strong plateau dynamics and heat, the Tibetan Plateau is colder, drier and has higher wind speed than other surrounding regions at the same latitude [4]. The severe convection over the plateau is usually characterized by a small spatial scale, short life history, and often occurs suddenly [5]. Many studies have shown that extreme weather has occurred frequently on the Tibetan Plateau in the past 40 years [6]. Strong thunderstorms, strong winds, heavy precipitation, and high temperatures, etc., have increased significantly in most areas of the Tibetan Plateau, and derivative disasters (such as landslides, debris flows, glacial lake outbursts and collapses, and so on) increase simultaneously [7]. As a key indicator of Deep Convective systems (DCSs) [8], lightning activity research has been the focus of study for the distribution and evolution of convective activities over the Tibetan Plateau. In the context of global warming, the average temperature in the central and western regions of the Tibetan Plateau has shown a rising trend in the past five years [9], and the corresponding convective and lightning activities are also gradually increasing [10]. Thunderstorms in the plateau have the characteristics such as a shorter lifetime, frequent ground flash, smaller ascending and descending airflow, and lower height of small solid particles (ice crystals, snow particles, etc.) [11]. These unique characteristics are very different from those in the central and eastern land regions of China (CELR). Therefore, the study of lightning activity on the Tibetan Plateau is a very meaningful scientific endeavor.
Lightning is an indicator and driving factor of climate change [12]. Multi-source lightning data, including ground-based and satellite-based lightning-detection data, provides abundant data for the study of global lightning meteorology. In the past, lightning observation data such as the WWLLN (World-Wide Lightning Location Network), the CGLLS (Cloud-to-Ground Lightning Location System), and the low-orbit satellite-based LIS (Lightning Imaging Sensor) boarded on the TRMM (Tropical Rainfall Measuring Mission) [13] were commonly used. Based on these data, people have a preliminary understanding of the lightning activity over the Tibetan Plateau. The representative results are as follows: In Nagqu, the CG lightning is obviously less than the IC lightning, and both positive CG and negative CG went through a longer-lasting intra-cloud discharge before a stepped leader process [14]; the lightning density in the plateau was much smaller than that in CELR, and the distribution was uneven [15]. High-density lightning was located near Nagqu and northeastern Qinghai, and the lightning density showed obvious seasonal and diurnal variations features: From May to September is the time of concentrated lightning outbreak on the plateau, and most of the lightning activities occurred in June and July [16]. The peak of daily lightning activity was between 15:00 and 17:00 LST [17]; the lightning activity appeared earlier in the eastern and southern parts of the plateau, and later in the western, northern, and central parts of the plateau [18]. Lightning activities on the plateau were highly sensitive to atmospheric circulation background changes [19].
It is difficult to comprehensively understand the characteristics of lightning activities over the Tibetan Plateau, due to the uneven distribution of ground-based lightning-detection networks [20] (especially in the western part of the plateau, where the altitude is high, the population is sparse, the terrain conditions are complex, the weather conditions are bad, and the continuous power supply is limited), and the limitation of the orbital period of LEO (Low Earth Orbit) satellites [21]. In recent years, China has made great progress in the field of ground-based and space-borne lightning observation, and has acquired much new and valuable observational data, which effectively made up for the above shortcomings. For ground-based lightning detection, the Chinese Academy of Meteorological Sciences, the China Meteorological Administration (CMA), has successively constructed three sets of LFEDA (Low-frequency E-field Detection Array) network in Guangzhou, Nagqu (Tibet) and Hainan [22]. Based on capturing the rapid electric field change pulse signal generated during lightning discharge, it can realize the recognition of lightning, and the three-dimensional (3D) shape of a lightning channel can be described; the lightning positioning accuracy is better than 100 m [23]. It has the ability of 3D detection of total lightning (IC and CG) with high accuracy. For satellite-based lightning detection, China launched a new generation of geostationary satellite, the Fengyun 4A (FY-4A) in 2016, carrying China’s first self-developed lightning imager, the LMI (Lightning Mapping Imager), which realized the unified and continuous observation of all types of lightning occurring in China and its surrounding areas for the first time [24]. These new data will enhance our understanding of the features of unique lightning activities over the Tibetan Plateau and will provide important information for the study of local DCSs [25] and their far-reaching effects on climate and weather.
Based on the reliable and valuable LFEDA (ground-based) data and LMI data (satellite-based), the spatio-temporal 3D characteristics of lightning activities over the Tibetan Plateau in summer 2022 and 2023 were analyzed in this paper. Furthermore, the lightning activity in Nagqu was compared with that of the Hainan area in southern China, and the differences between the satellite-based and ground-based multi-source lightning detection are discussed; the sensitivity of LMI to altitude is also studied in this paper. This work contributes to deepening the understanding of the characteristics of lightning activities over the Tibetan Plateau and its indicator significance for regional strong convections. The work of this paper is also beneficial to the optimization of subsequent space-based lightning-detection instruments, and to promote the fusion application of multi-source lightning observation data in the future.

2. Materials and Methods

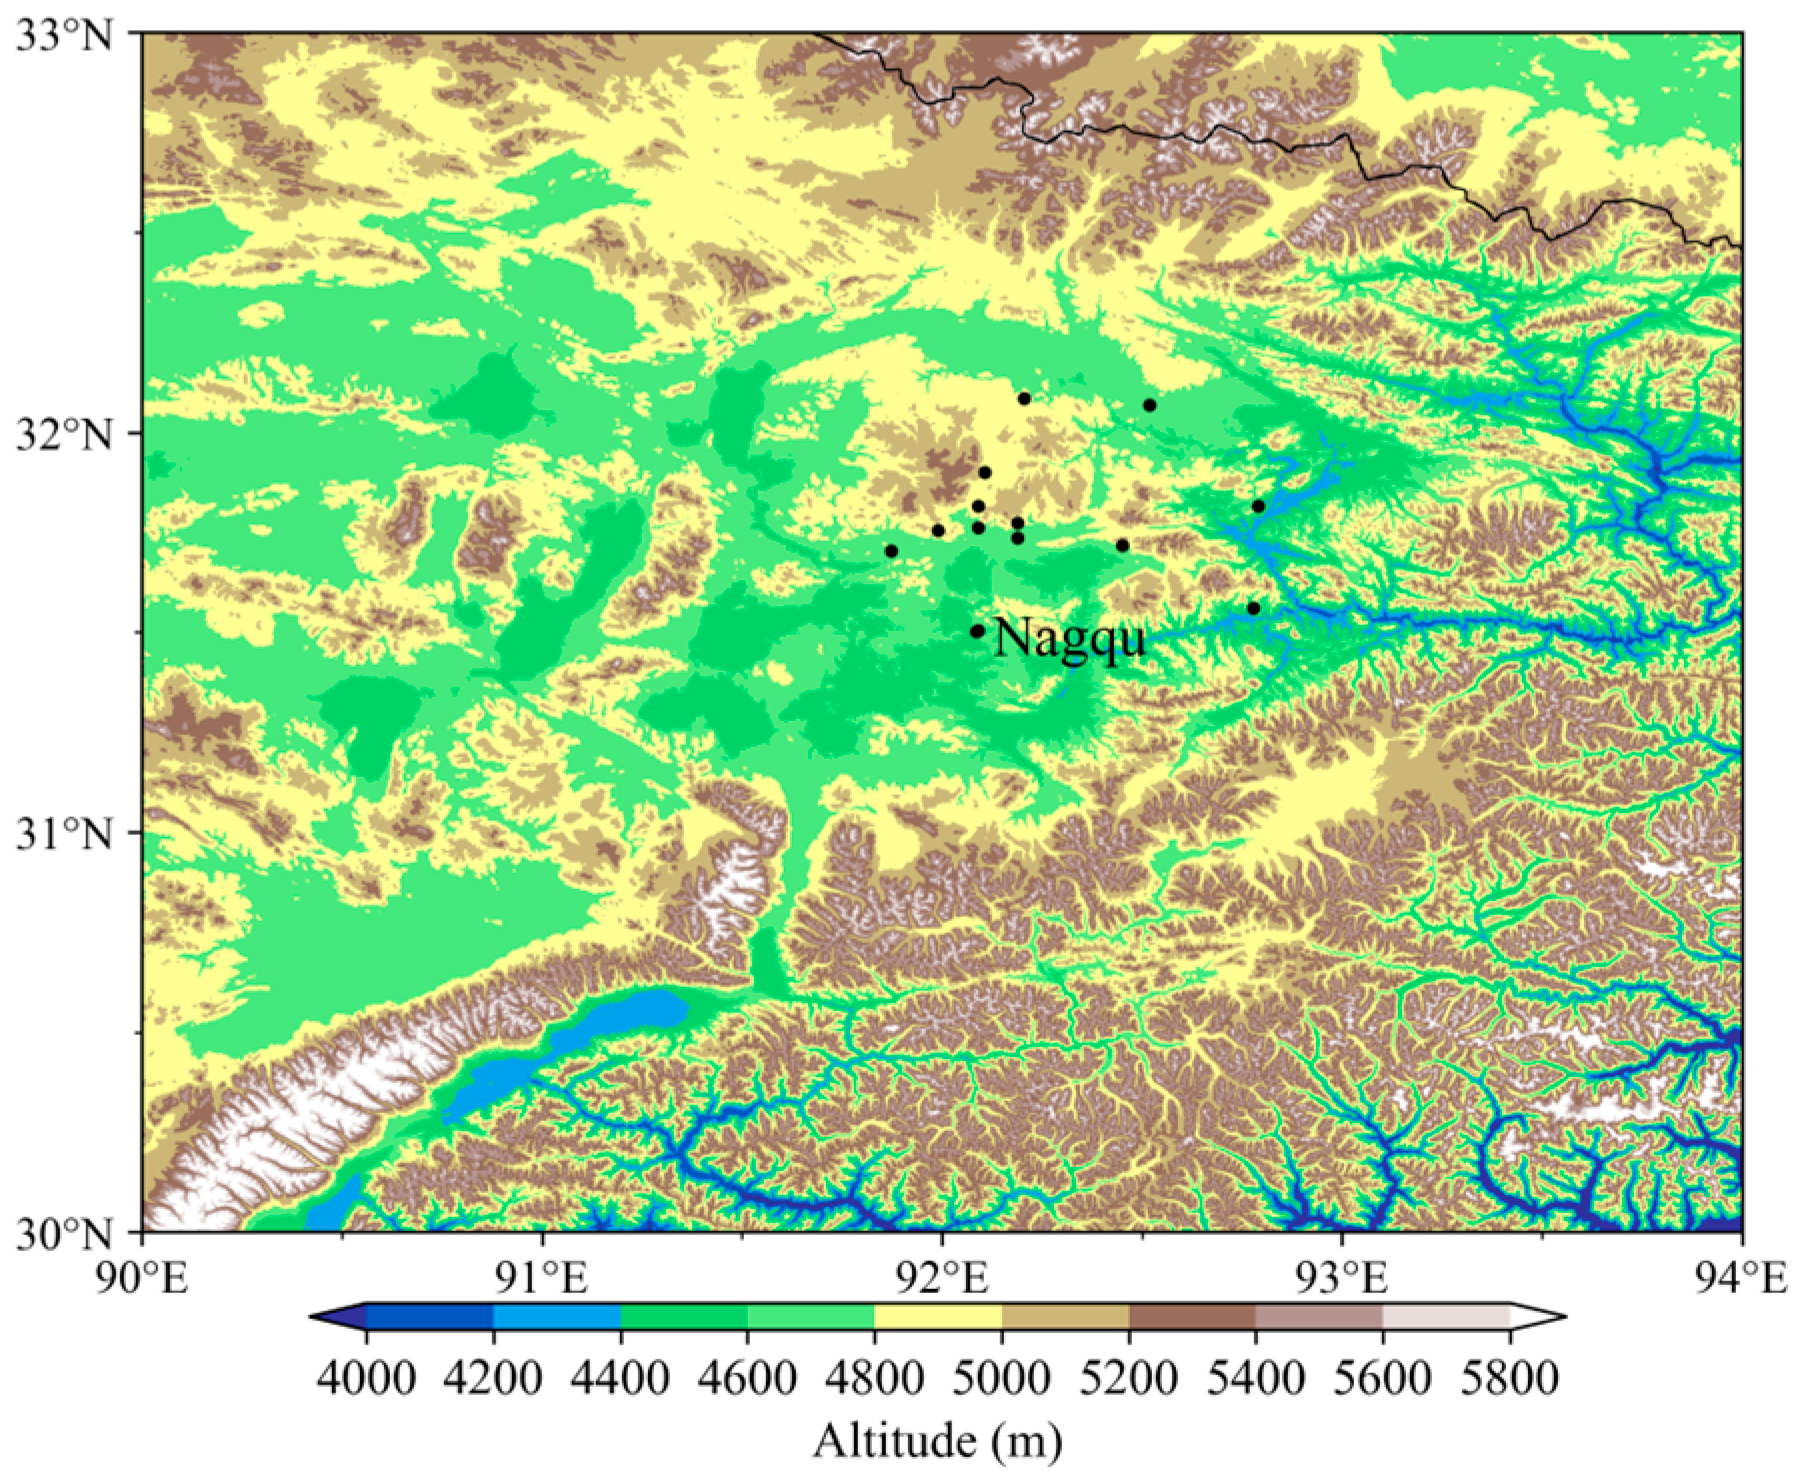
Nagqu is in the central Tibetan Plateau. Figure 1 shows the spatial distribution of altitude around Nagqu. The terrains of the city are relatively low, below 4800 m, but the surrounding areas rise to more than 5000 m to 5200 m quickly, especially in the southwest area, which rises even higher than 5800 m. Around the center of Nagqu, the observation area is in 90–94° E, 30–33° N. The average, minimum, and maximum altitudes in this area are 4.9 km, 4.1 km, and 5.8 km, respectively.

2.1. LFEDA Data

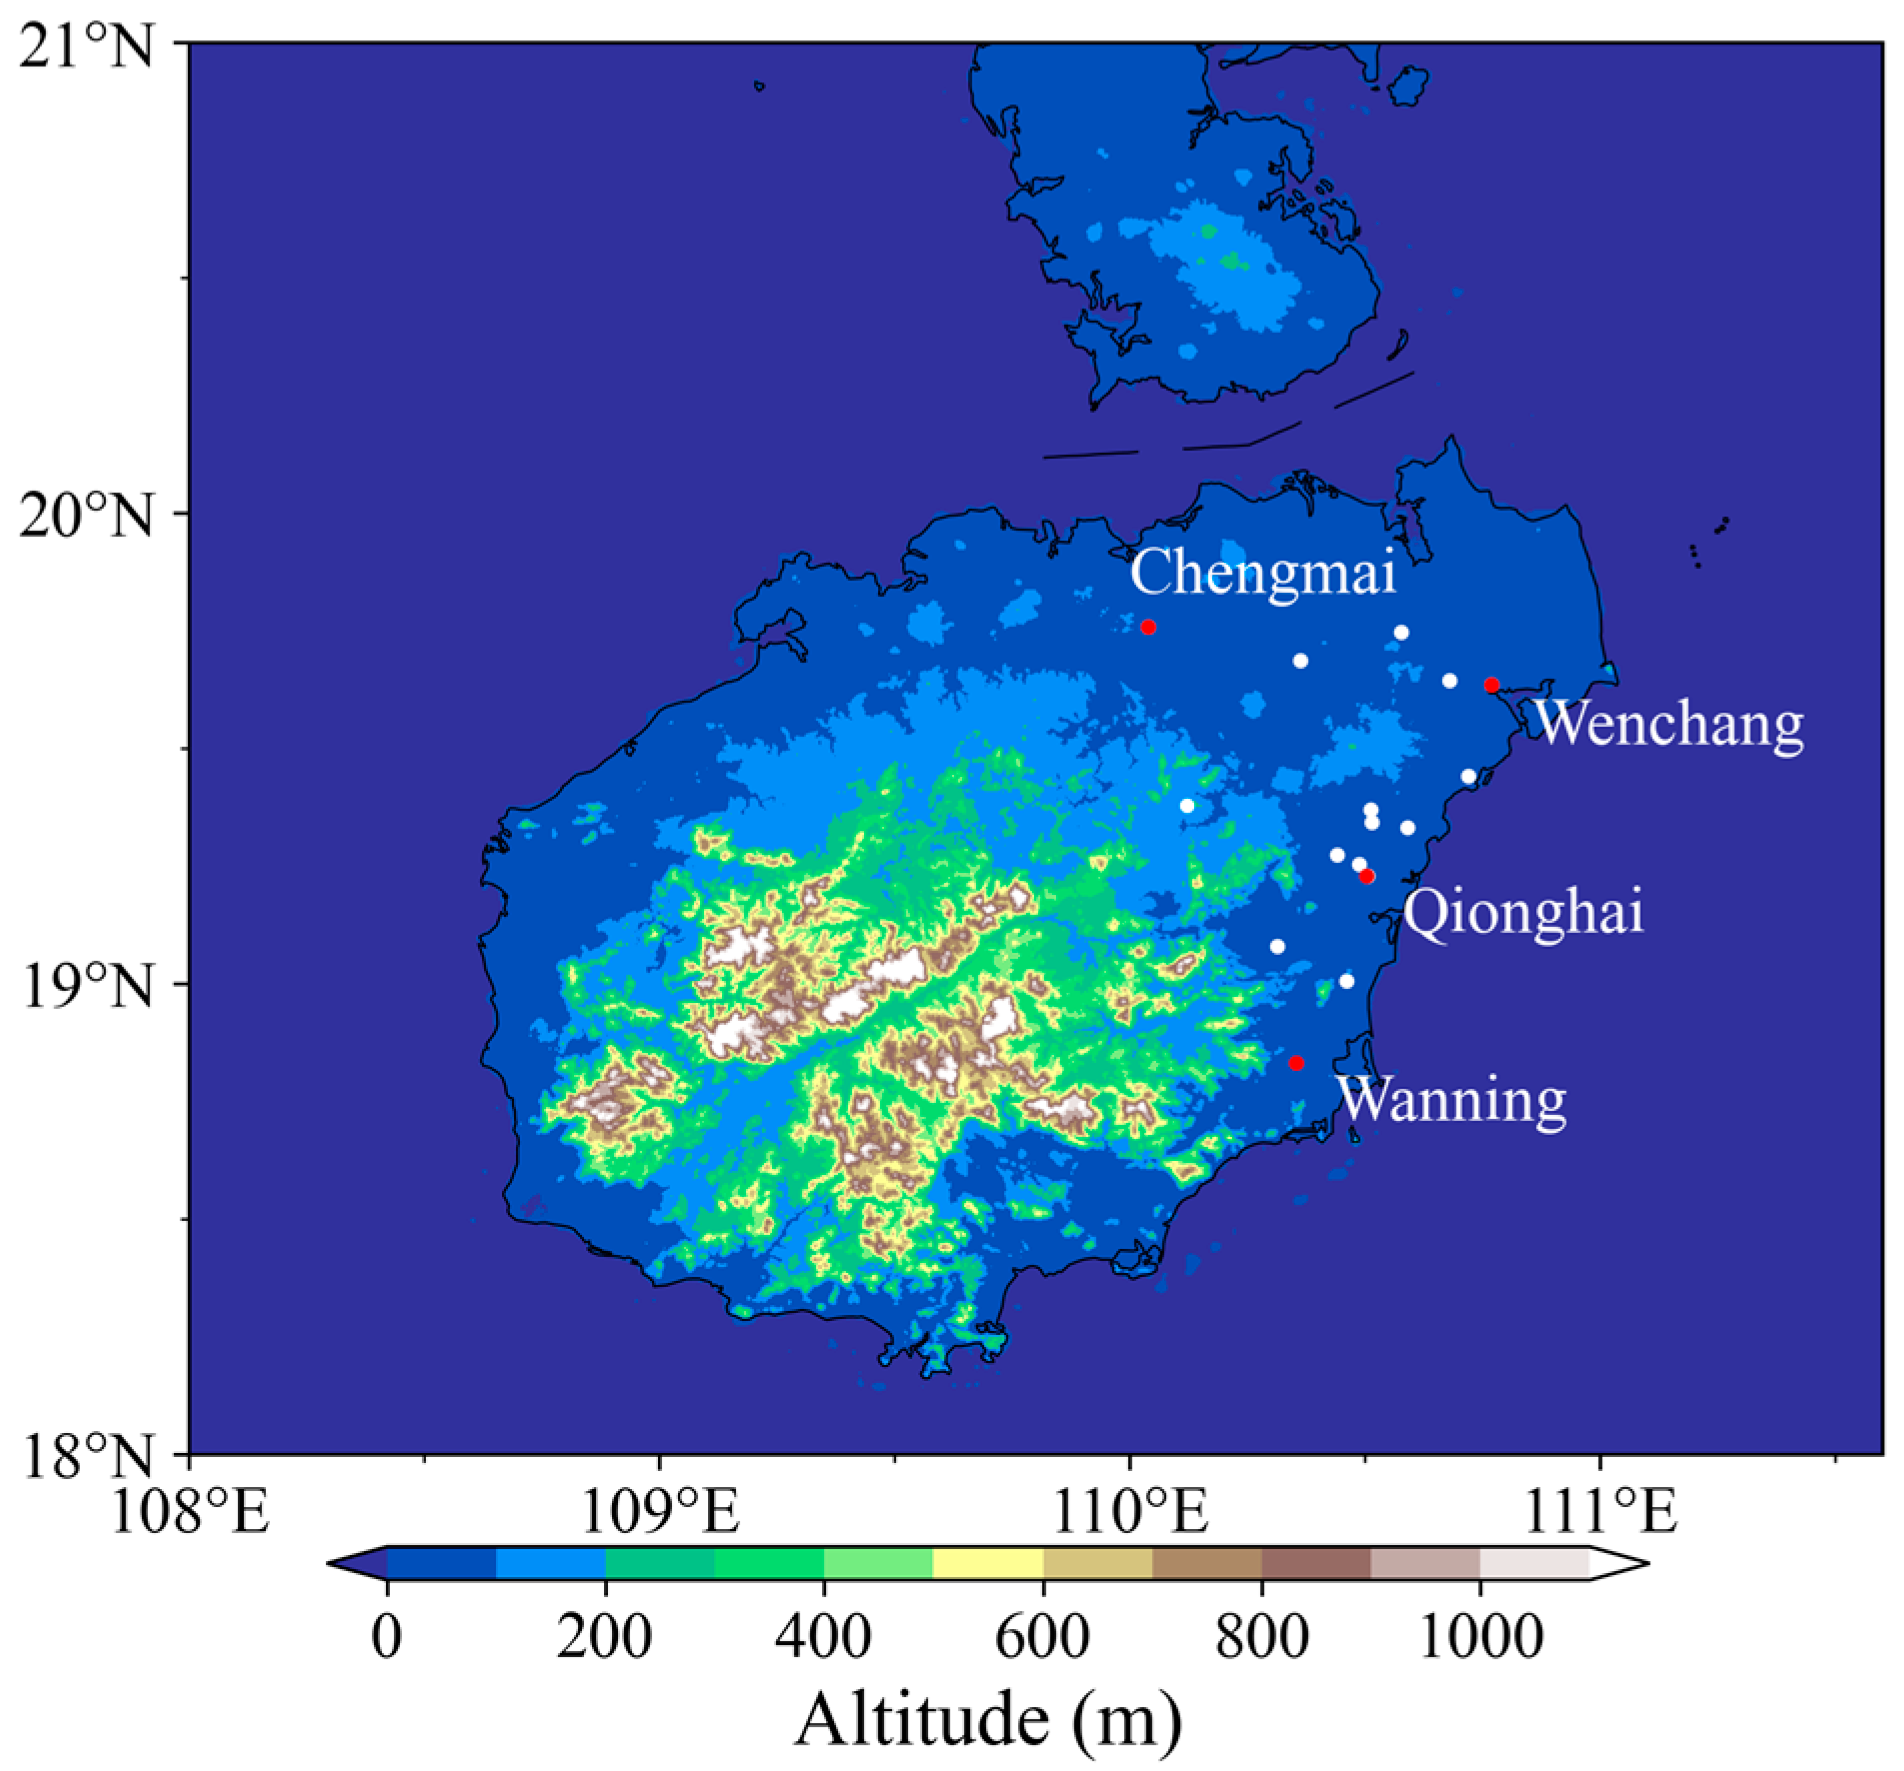
To obtain 3D information on total lightning, the data of the LFEDA was selected for analysis. The Chinese Academy of Meteorological Sciences has built three sets of ground-based LFEDA-detection networks in Guangdong, Hainan, and Nagqu (Tibet), respectively. The baseline range of the network is 6-60 km, and the antenna sensitivity is about 1 V·m−1. Through waveform matching, pulse recognition, pulse matching, and other methods, based on GPS synchronization technology and TOA (Time of Arrival) algorithm, the high-precision (better than 100 m) recognition and location of lightning pulse discharge processes is realized, and it has a 3D channel-positioning capability [26]. At the same time, it is easy to apply, due to the amount of data being small. The position of the LFEDA networks are shown in Figure 2 (black dot), Nagqu, and Figure 3 (black dot), Hainan, respectively. In the northern region of Nagqu, in the hinterland of the plateau, 13 three-dimensional lightning detectors were mainly located; in the northeast of Hainan, 15 LFEDA three-dimensional lightning detectors have been deployed, mainly concentrated in the areas of Qionghai, Wanning, Wenchang, and Chengmai city, which basically covered the main frequency bands of the IC and CG lightning discharge processes.

2.2. LMI Data

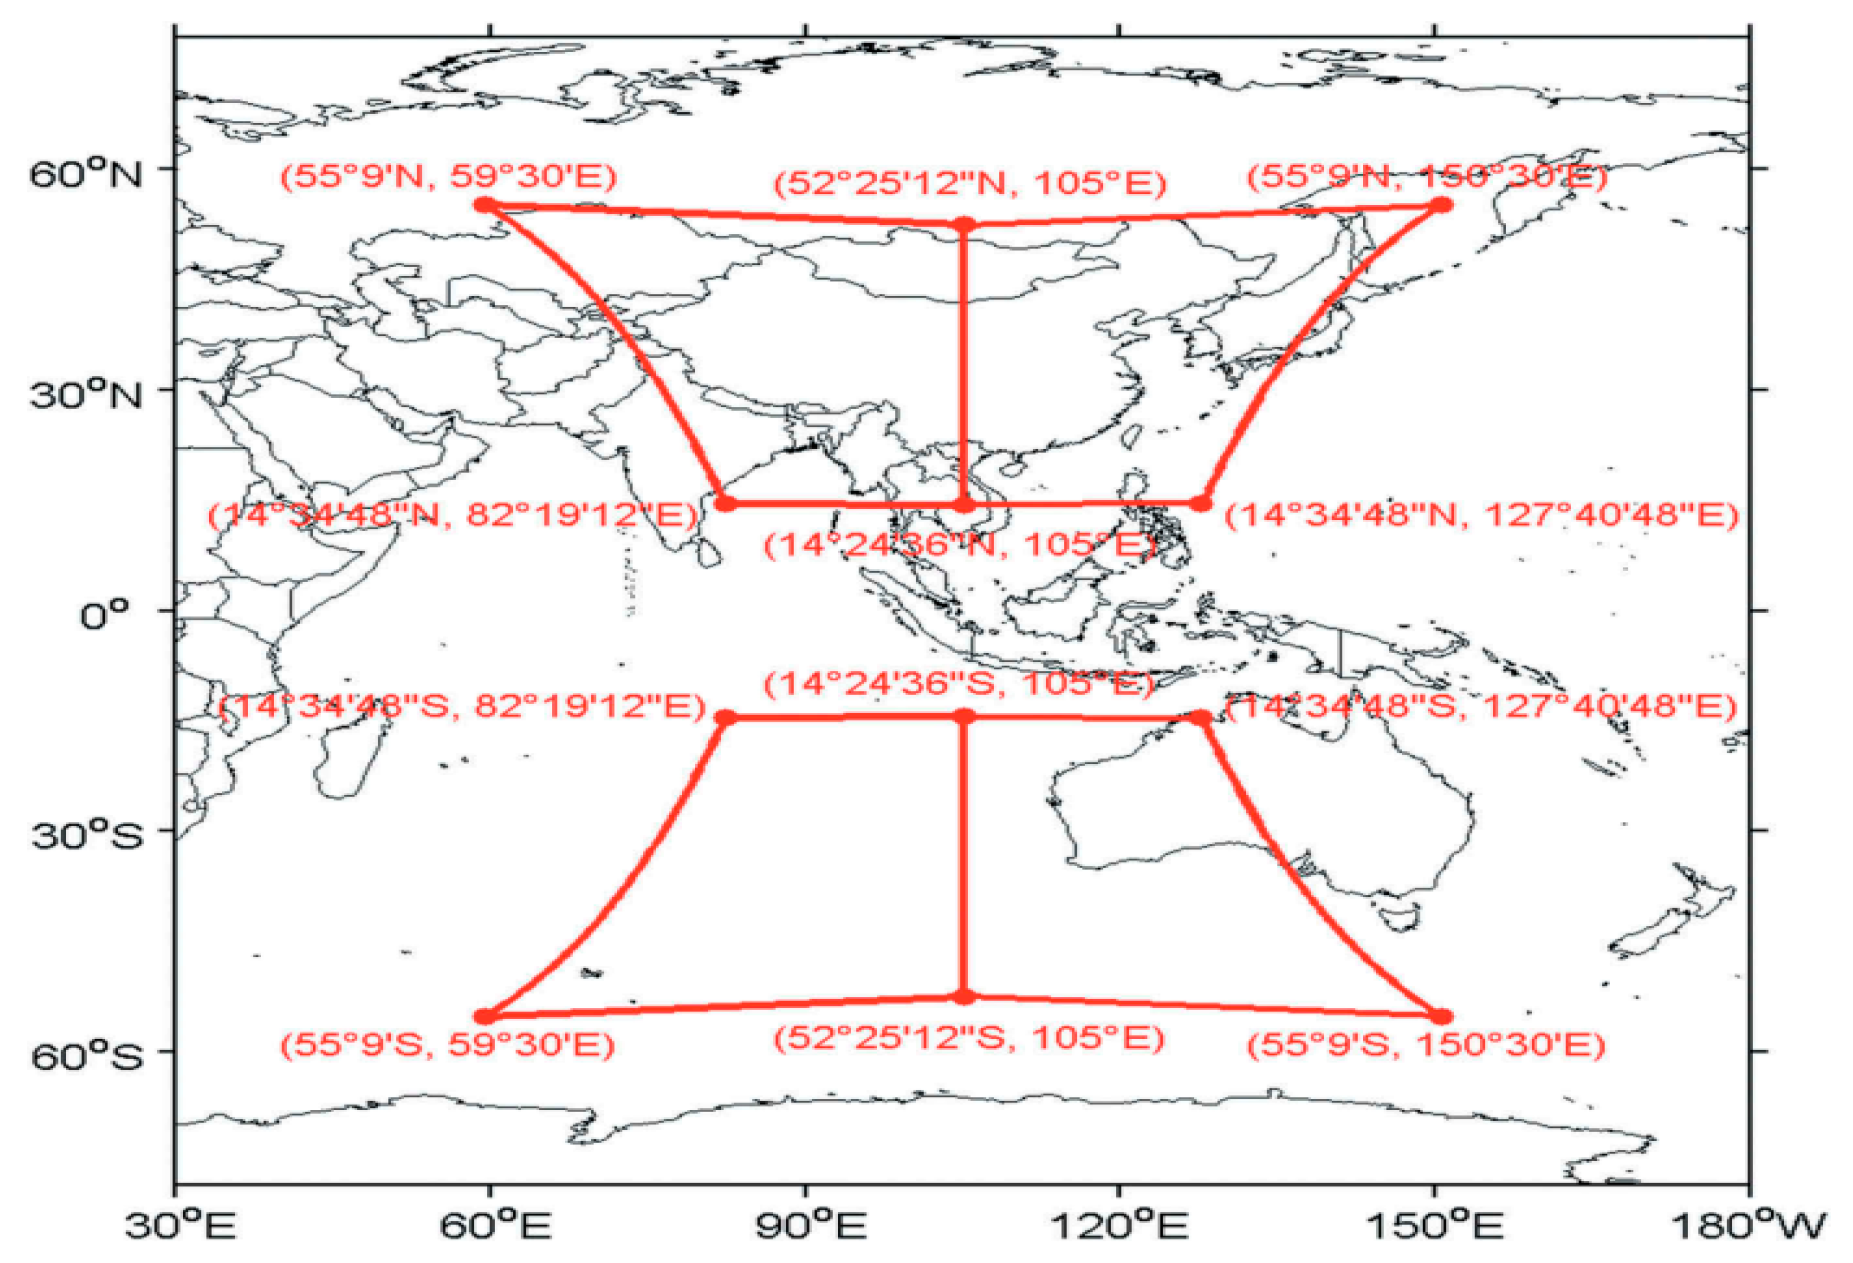
LMI, China’s first geostationary orbit satellite-based lightning observation payload, boarded on the FengYun-4A satellite, which launched at the end of 2016. The optical pulses accompanied by lightning discharge processes were detected by the CCD (Charge Coupled Device) of LMI; through the comparison with the background noise, the recognition of lightning was realized. Its field of view (FOV) is shown in Figure 4 [27]. According to its design requirements, LMI has two platform changes per year. It observes the northern hemisphere from the spring equinox to the autumnal equinox each year. From mid-March to mid-September, it can continuously detect the total lightning (IC and CG) occurring in most of the inland and surrounding sea areas of China [28]. LMI data include 3 categories. The basic output unit is “event”, while “group” and “flash” are processed based on “event” through different clustering algorithms. LMI L2 the level description of the lightning data shared for the common user, i.e., the raw data are processed in 2 levels before being distributed and shared. So, we choose LMI L2 “group” data to analyze, which has a clear physical meaning and can better reflect the occurrence of lightning [29]. From Figure 4, it can be seen that the Tibetan Plateau is located at the edge of the effective detection area of the satellite, while Hainan is located near the satellite directly underneath, so the detection efficiency (70.19%) is lower in the former [30], and it can be greater than 90%, as designed around the satellite directly underneath [31].
All the lightning data have been strictly quality-controlled. In the study, to match the satellite-based LMI lightning data, the data from June to September in 2022 and 2023 were employed. This period is also the active period of lightning activities on the plateau.
After collecting all the LMI and LEFDA data of the last 5 years, we extracted the temporal overlap, i.e., both for the same period, so that comparisons could be carried out. Both the LMI and LFEDA data are dated between June and September 2022–2023, and they are quality controlled with the method mentioned in the previous references [23,24,28]. However, since the LFEDA data of Hainan cover only the year 2022, when comparing the lightning activity characteristics of Nagqu and Hainan, we simultaneously took the period from June to September 2022, and abandoned the data of 2023. When analyzing the spatial distribution of lightning, we projected the data onto the same grid (0.1° E × 0.1° N), thus allowing comparisons to be made.

3. Results

3.1. Characteristics of Lightning Activities over the Tibetan Plateau Based on LMI Group Data

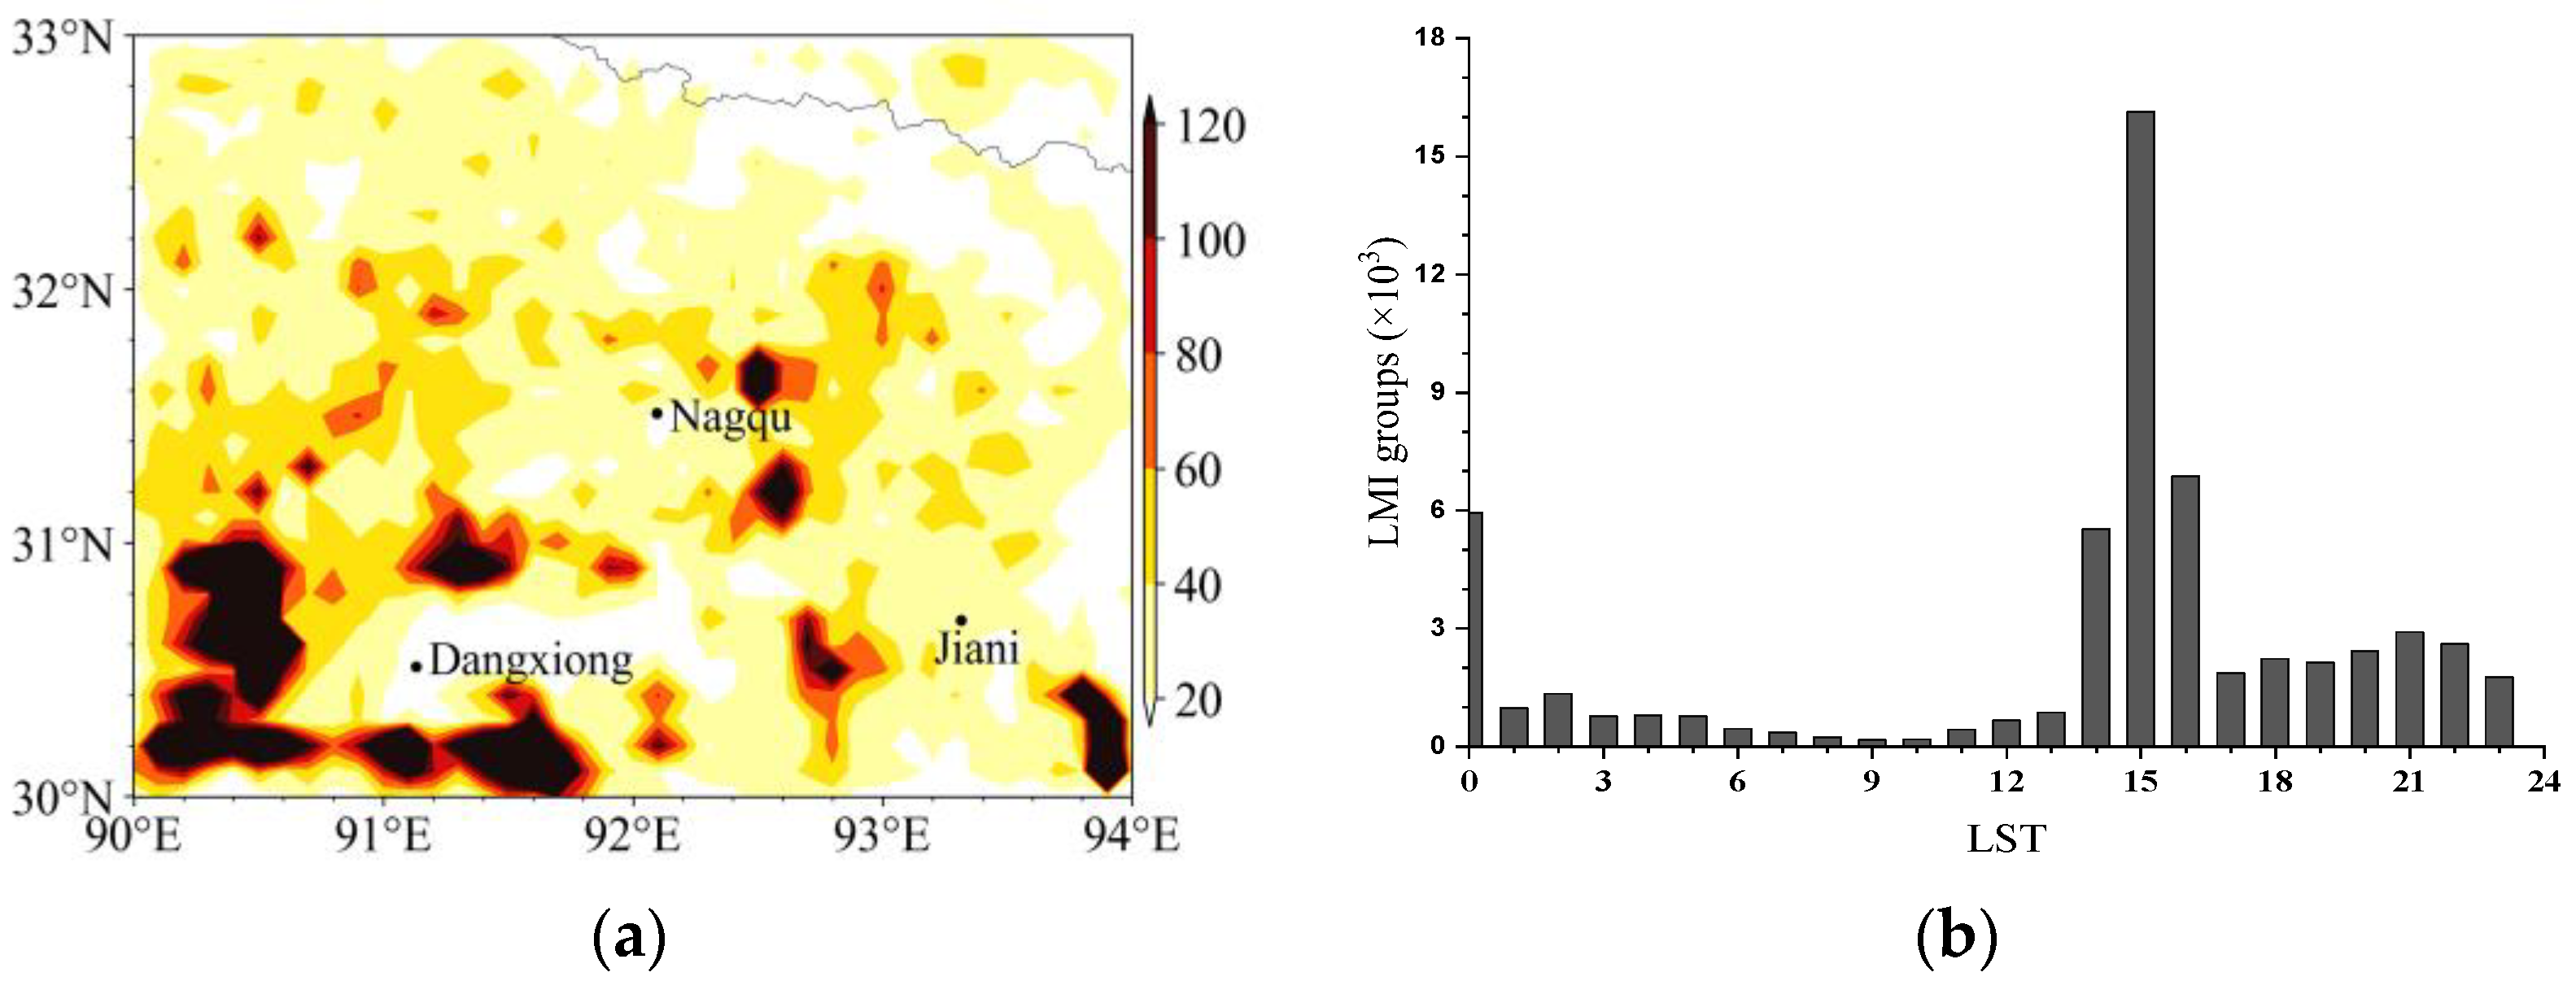
The study area is divided into 0.1° E × 0.1 °N statistical grid boxes. Figure 5a shows the distribution of LMI group data in each grid box. This figure demonstrates that Nagqu, Dangxiong, and Jiali in the hinterland of the Tibetan Plateau were the areas with more lightning; the maximum value is 2047. Compared with the topographic feature, most of the high-value lightning areas were located in the transition zone between the lower and higher terrain, which is the place near the valley and the hillside below 5100 m; the water vapor in these areas is more abundant, which is conducive to the updraft movement [32], so it is more favorable to the formation and development of convective precipitation and lightning.
The hourly LMI group data variation is shown in Figure 5b. The diurnal variation of lightning activity is significant and has a distinct peak characteristic, the most active period concentrated around 15:00 LST (the same below), the second peak at 0:00, and the weakest time around 9:00, indicating that the influence of temperature and solar radiation on lightning activity is very prominent; particularly, lightning activities were significantly increased at 21:00 and 0:00, which was related to the unique topography [33] and the night rain phenomenon of the plateau [34].
The phenomenon of night rain on the Tibetan Plateau is caused by the special terrain and atmosphere conditions of the plateau. In the evening, the ground surface temperature begins to drop, and the cold and heavy air on the hillside starts to slide, gradually lifting the warm and moist air in the valley, resulting in the rapid formation of clouds above the condensation height [35], and the updraft cannot support the growing water droplets; then, the night rain in the valley begins to appear. Nagqu is in a river valley (Figure 1). During the daytime, under the effect of strong radiation, the clouds evaporate; while, at night, the clouds begin to cool due to the lack of the heat provided by the sun, making the atmosphere less stable, which is very conducive to the formation of convection and night rain. In addition, there are lots of mountains around Nagqu, and the valley wind circulation further promotes the convergence rise [36], further enhances the occurrence of night rain, and contributes to the increase in lightning activities.

3.2. Three-Dimensional Characteristics of Lightning Activities over the Tibetan Plateau Based on LFEDA Data

In the study area, LFEDA has observed 5.8 × 10⁵ CG and 6.6 × 10⁵ IC, respectively. The latter was much more than the former. Furthermore, LFEDA can provide the information of lightning height, so it is very helpful to analyze the characteristics of lightning activity at different altitudes.

3.2.1. Temporal Variation Characteristics of IC and CG over the Tibetan Plateau

In terms of lightning types, as shown in Figure 6, the temporal variation statistical characteristics of the IC and CG over the Tibetan Plateau are generally consistent, and the number of IC is generally more than that of CG. Both kinds of lightning activity are relatively calm in the morning, start to increase rapidly in the afternoon (12:00), reach a peak at 16:00 (about 2 h earlier than eastern China), and begin to decrease quickly at night (20:00). Before 16:00, there are more Ics than CGs; while after 16:00, they are closer in frequency. It is highly correlated with local temperature variation trends.

3.2.2. Spatial Distribution Characteristics of IC and CG around Nagqu

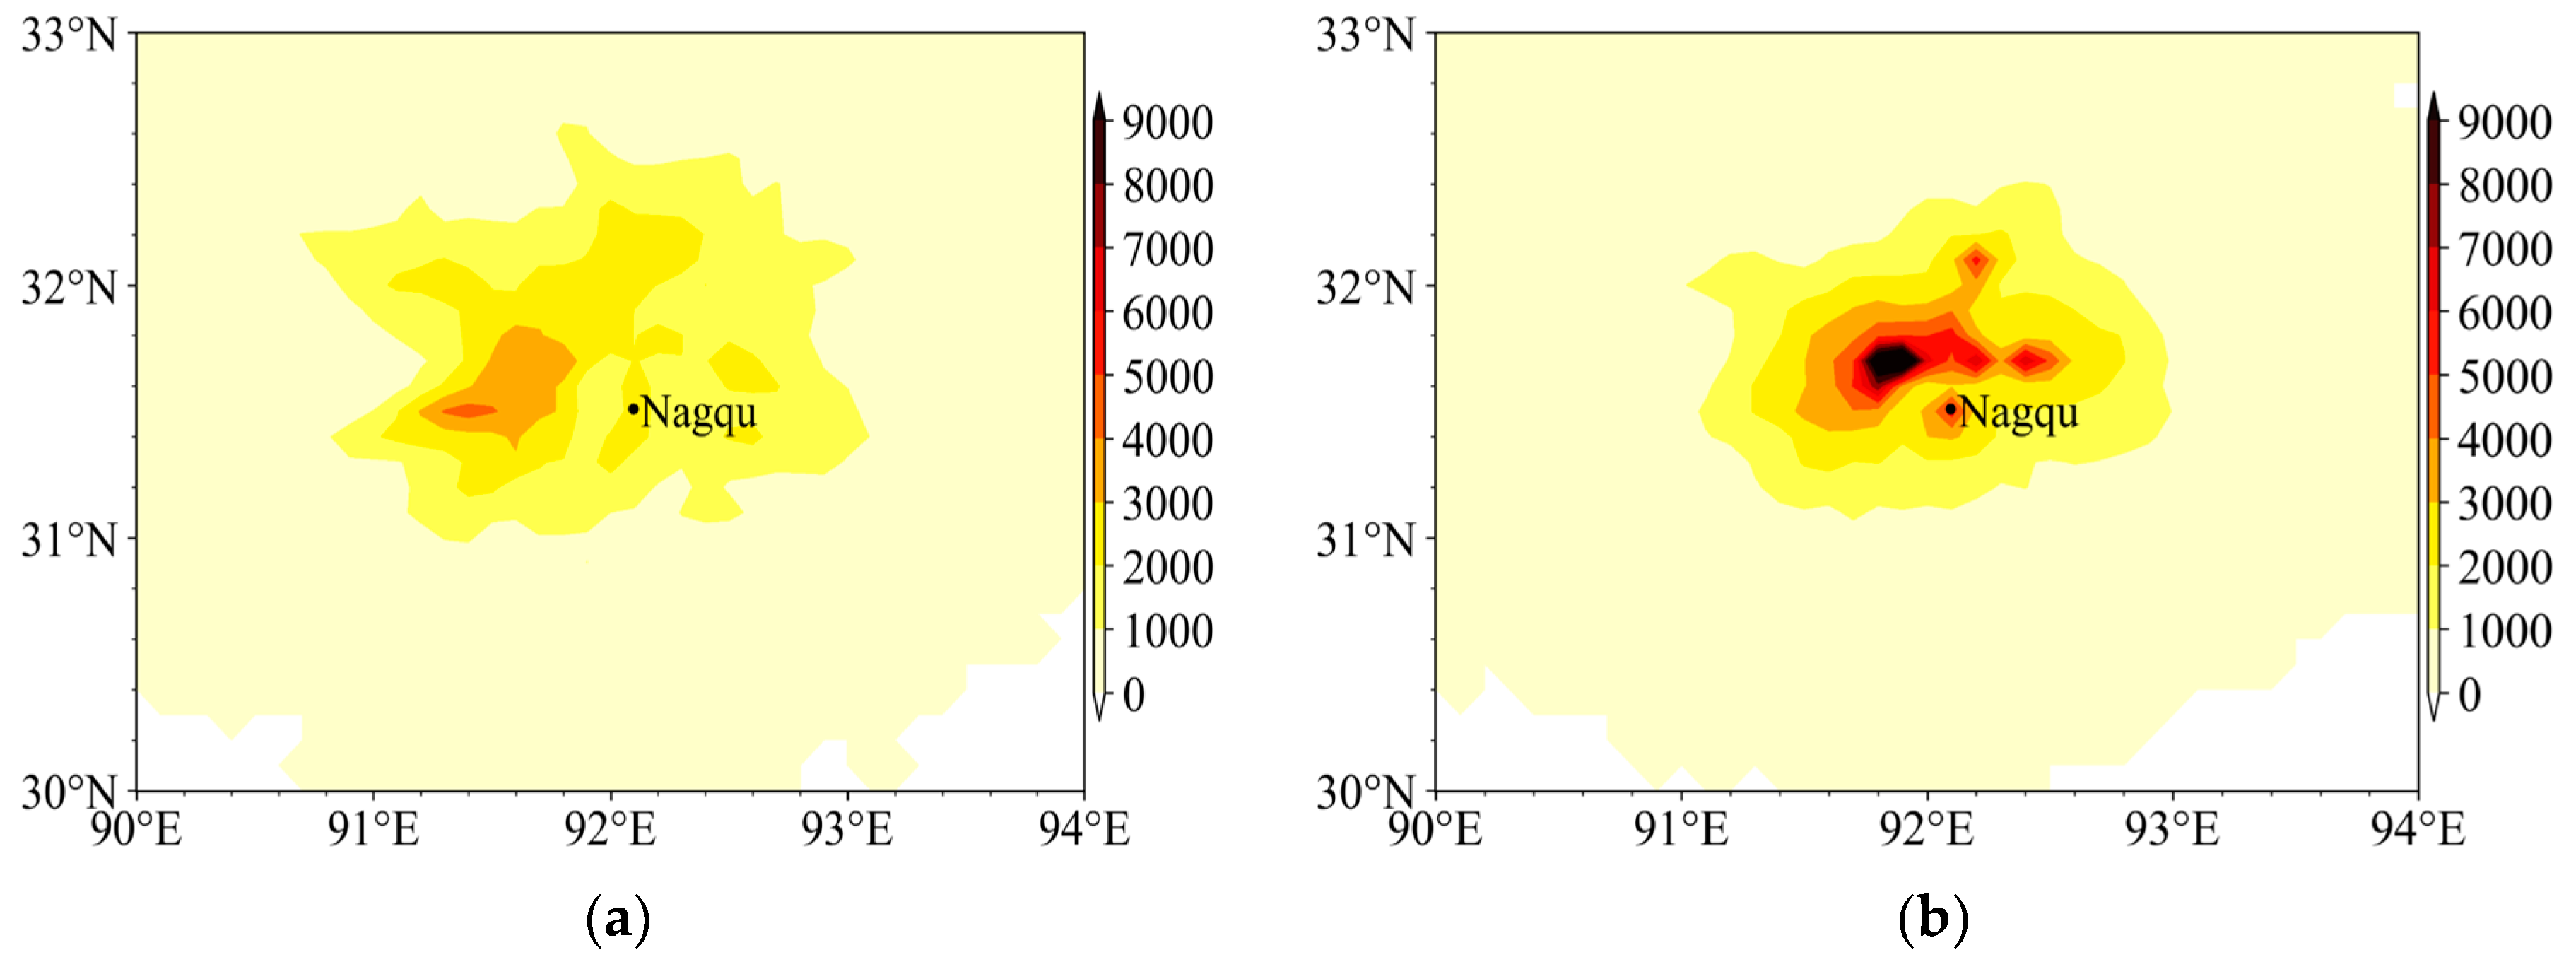
The spatial distribution of IC (Figure 7a) and CG (Figure 7b) around Nagqu is shown in Figure 7. The spatial distributions of the two kinds of lightning are basically similar, both are larger in the west and north of Nagqu City, and smaller in the other areas. Ics are more widely distributed. The area of large IC numbers (more than 2000 times) is much greater than that of CGs. Therefore, the monitoring of IC can reflect the development of DCSs in the plateau more comprehensively [37].
The above characterization of the two types of lightning in the Nagqu region does not differentiate between the number of thunderstorm processes and their intensity during that period, and thus only reflects the local characteristics of the total spatial distribution and temporal variations of the two types of lightning during the warm season in two years.

3.2.3. The Variation Characteristics of IC with Altitude

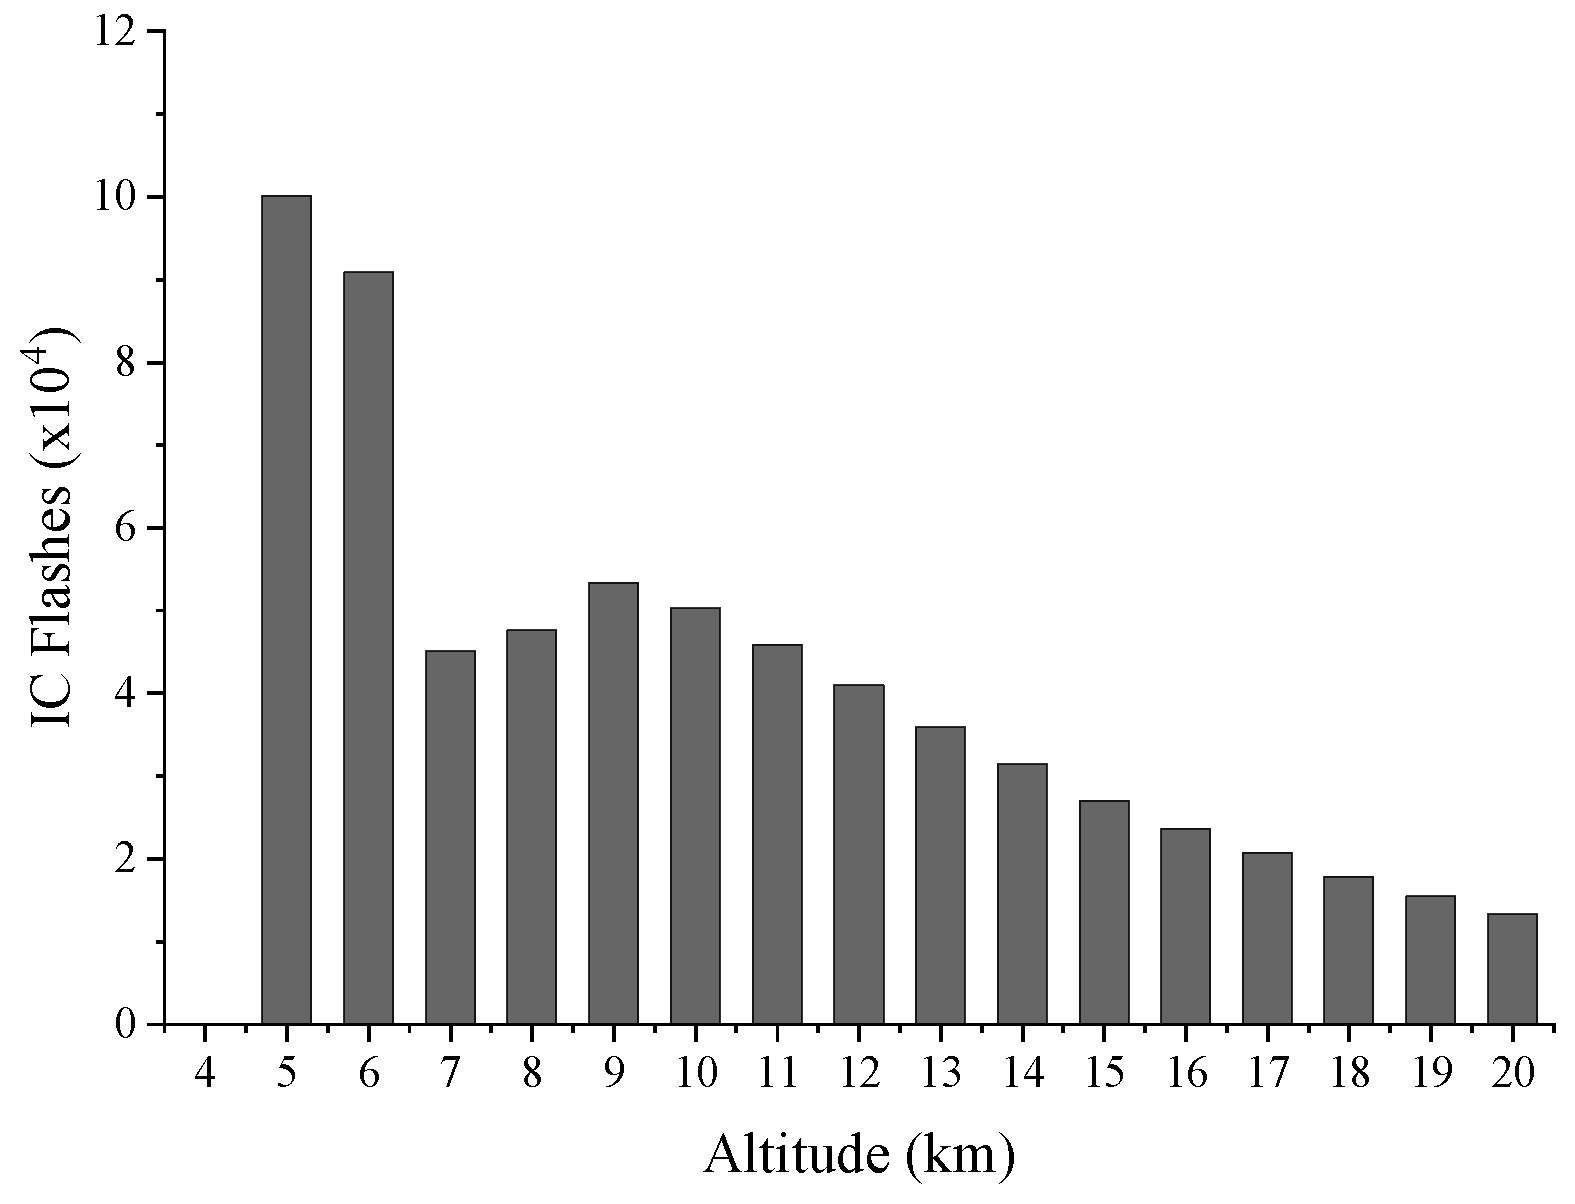
Thanks to the lightning height information provided by the LFEDA, statistical results of number of ICs at different altitudes are shown in Figure 8. It can be found that ICs occurred mostly at low altitudes; the maximum lightning frequency was 1.0 × 10⁵ in the range of 4–5 km, followed by 9.1 × 10⁴ in the range of 5–6 km. The number of ICs above 19 km was the least, only 1.3 × 10⁴. The turning point of IC change from more to less was 8–9 km, and the number of ICs in this height range was 5.3 × 10⁴.

3.2.4. Comparison of Lightning Activity Characteristics between Nagqu and Hainan Area

A comprehensive study of the LFEDA network lightning-monitoring data in Hainan and Nagqu can compare the difference of 3D lightning activity characteristics in high and low latitudes and altitudes in China. It is helpful to carry out fine research and early warning of lightning activities in different regions. In this paper, the data from both networks in 2022 were employed; the analysis region (108–111.6° E, 18–21° N), which covers the entire Hainan Province and has the similar area as Nagqu region, is mentioned above (both are 1.3 × 10⁵ km2, approximately).
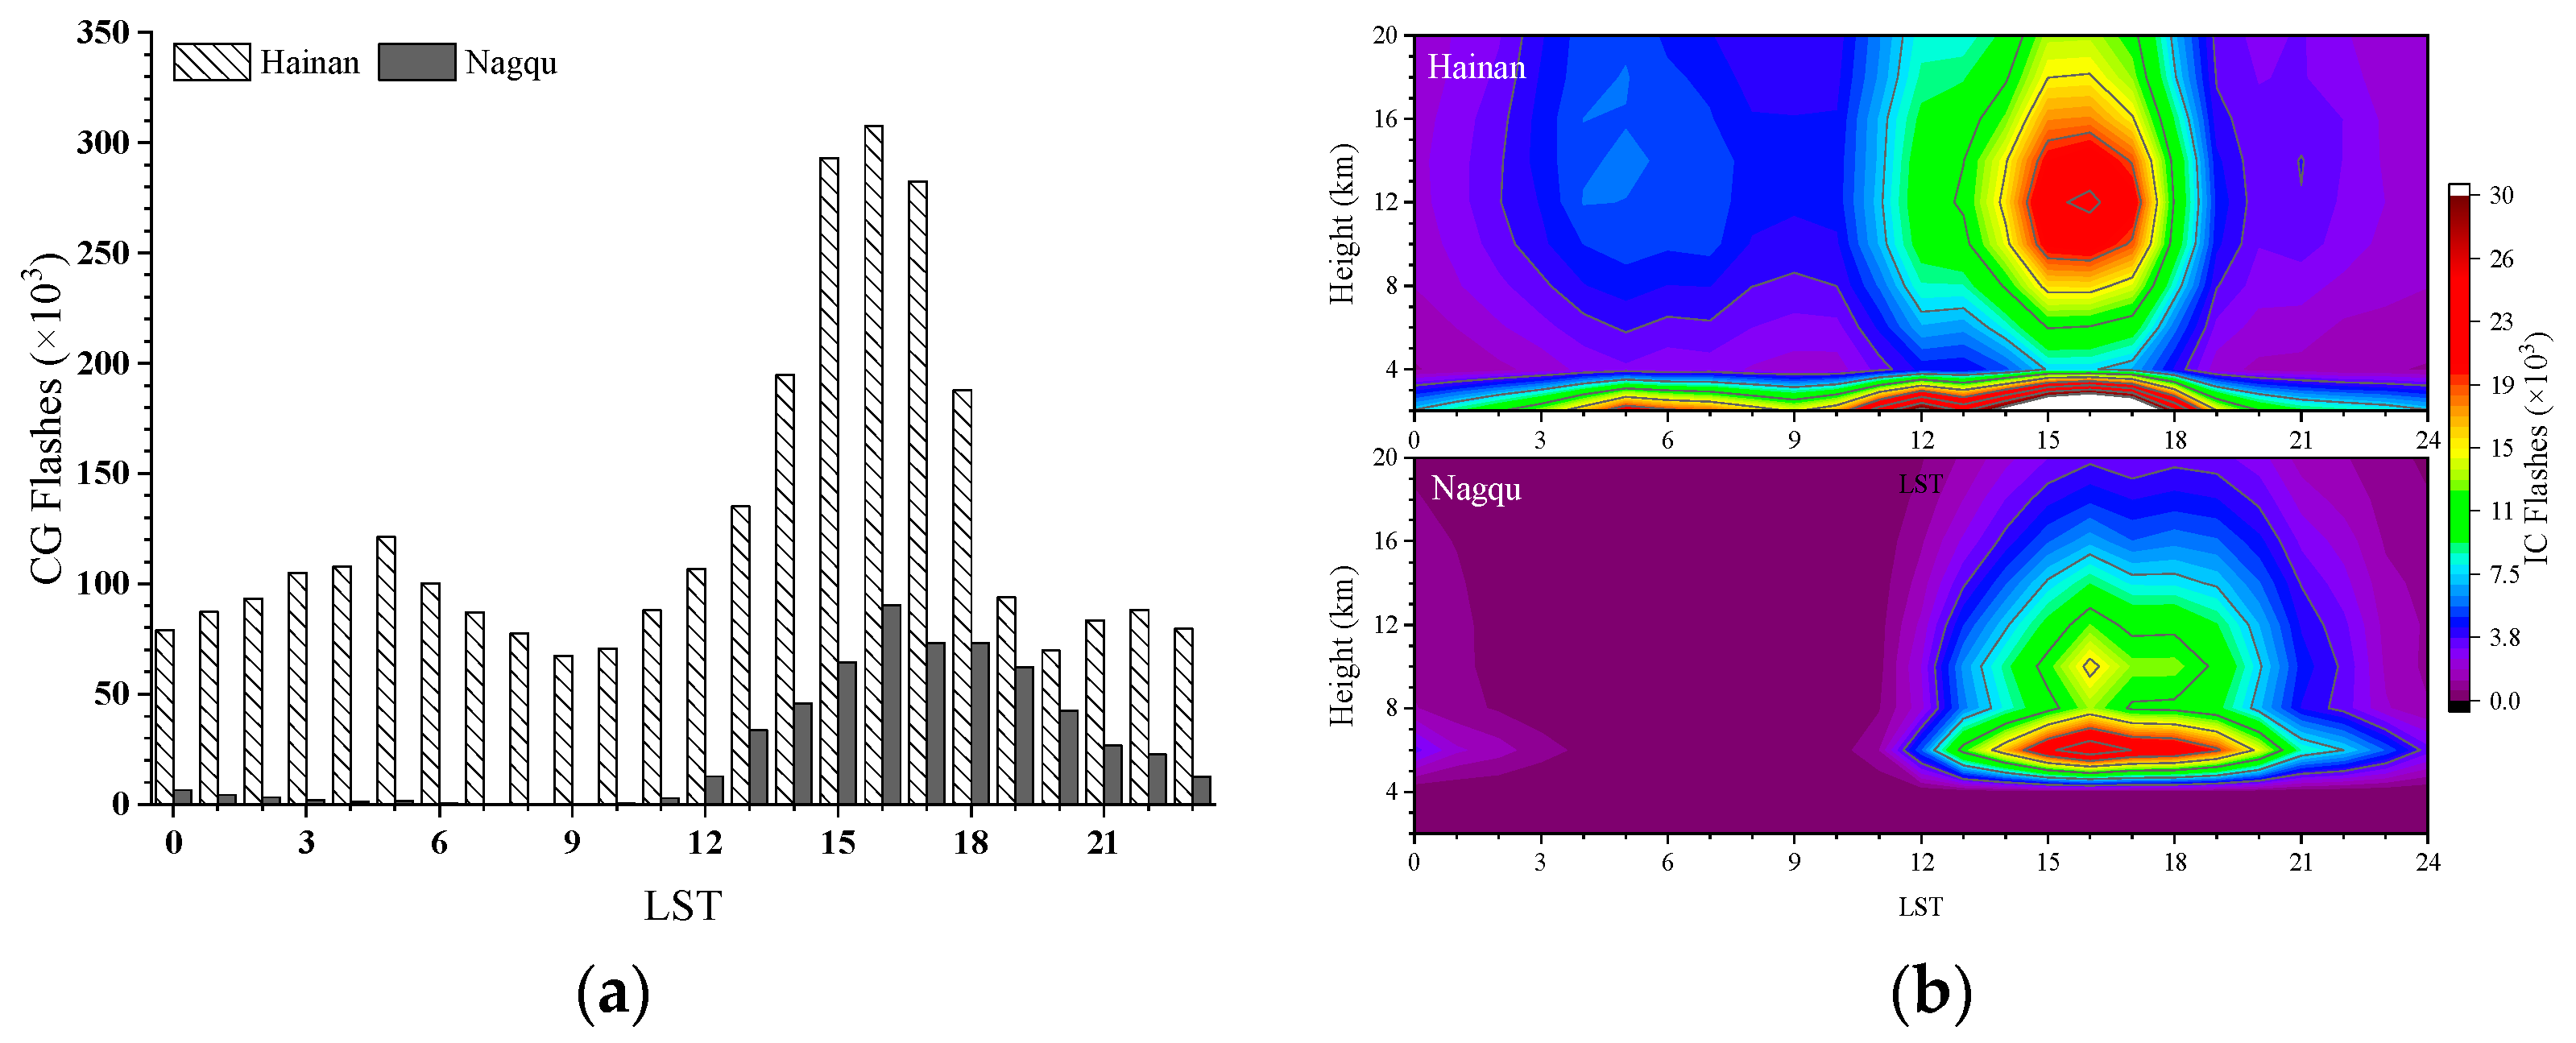
Figure 9 shows the hourly variation characteristics of CGs (Figure 9a) and ICs at different heights (Figure 9b) in the two places.
It can be seen from Figure 9a that the hourly variation of lightning activities in Nagqu showed a single peak (CGs are most active around 16:00 in the afternoon and are calmest in the morning), while that in Hainan was characterized by a primary peak and a secondary peak (around 16:00 and 5:00, respectively), more affected by the enhancement of the boundary stream in the Hainan area of China. At the peak of convection, CGs in the Nagqu area were less than 1/3 of that in Hainan area.
The high value of ICs in Hainan was mostly located in the altitude of 8–16 km above sea level, and it was more widely distributed; however, the high value of ICs in Nagqu was mainly concentrated near the altitude of 6 km, and the range is relatively small. The IC in the Hainan area was more intense than that in Nagqu area, which indirectly reflected that the convection in the low latitude and altitude area was more vigorous [38]. However, the duration of high-frequency lightning activities in Nagqu (16–18:00) was about 1 h longer than that in Hainan (15–17:00), which may be related to the fact that the Tibetan Plateau is located in the west of China, where the sunset is later [39].

3.3. Analysis of Detection Features of LMI

The ground-based LFEDA network lightning-detection data are compared with the satellite-borne LMI lightning-detection data, and the features of the LMI are analyzed. Considering the characteristics of the sample data in the study area and the previous sensitivity tests [38], the time/space consistency analysis window for LFEDA data and LMI data was set to 2 min/33 km [40].
Taking the lightning data detected by ground-based LFEDA in Nagqu as the “true value” for comparison, when ICs were detected by LFEDA, 1007 ICs were also detected by LMI synchronously, accounting for 6.4%; while for CGs, the value was 160, accounting for only 1.1% (as shown in Table 1). Therefore, LMI has more advantages in IC detection, which is more conducive to the identification of Convective Initiation (CI).
Compared with the ground-based LFEDA network, the overall DE of LMI in Nagqu is not high, mainly because 2022 and 2023 are at the end of LMI’s life [41], the on-orbit detection performance has gradually decreased; meanwhile, Nagqu located in the middle of the Tibetan Plateau, which is at the edge of LMI FOV, so the spatial accuracy has also declined.
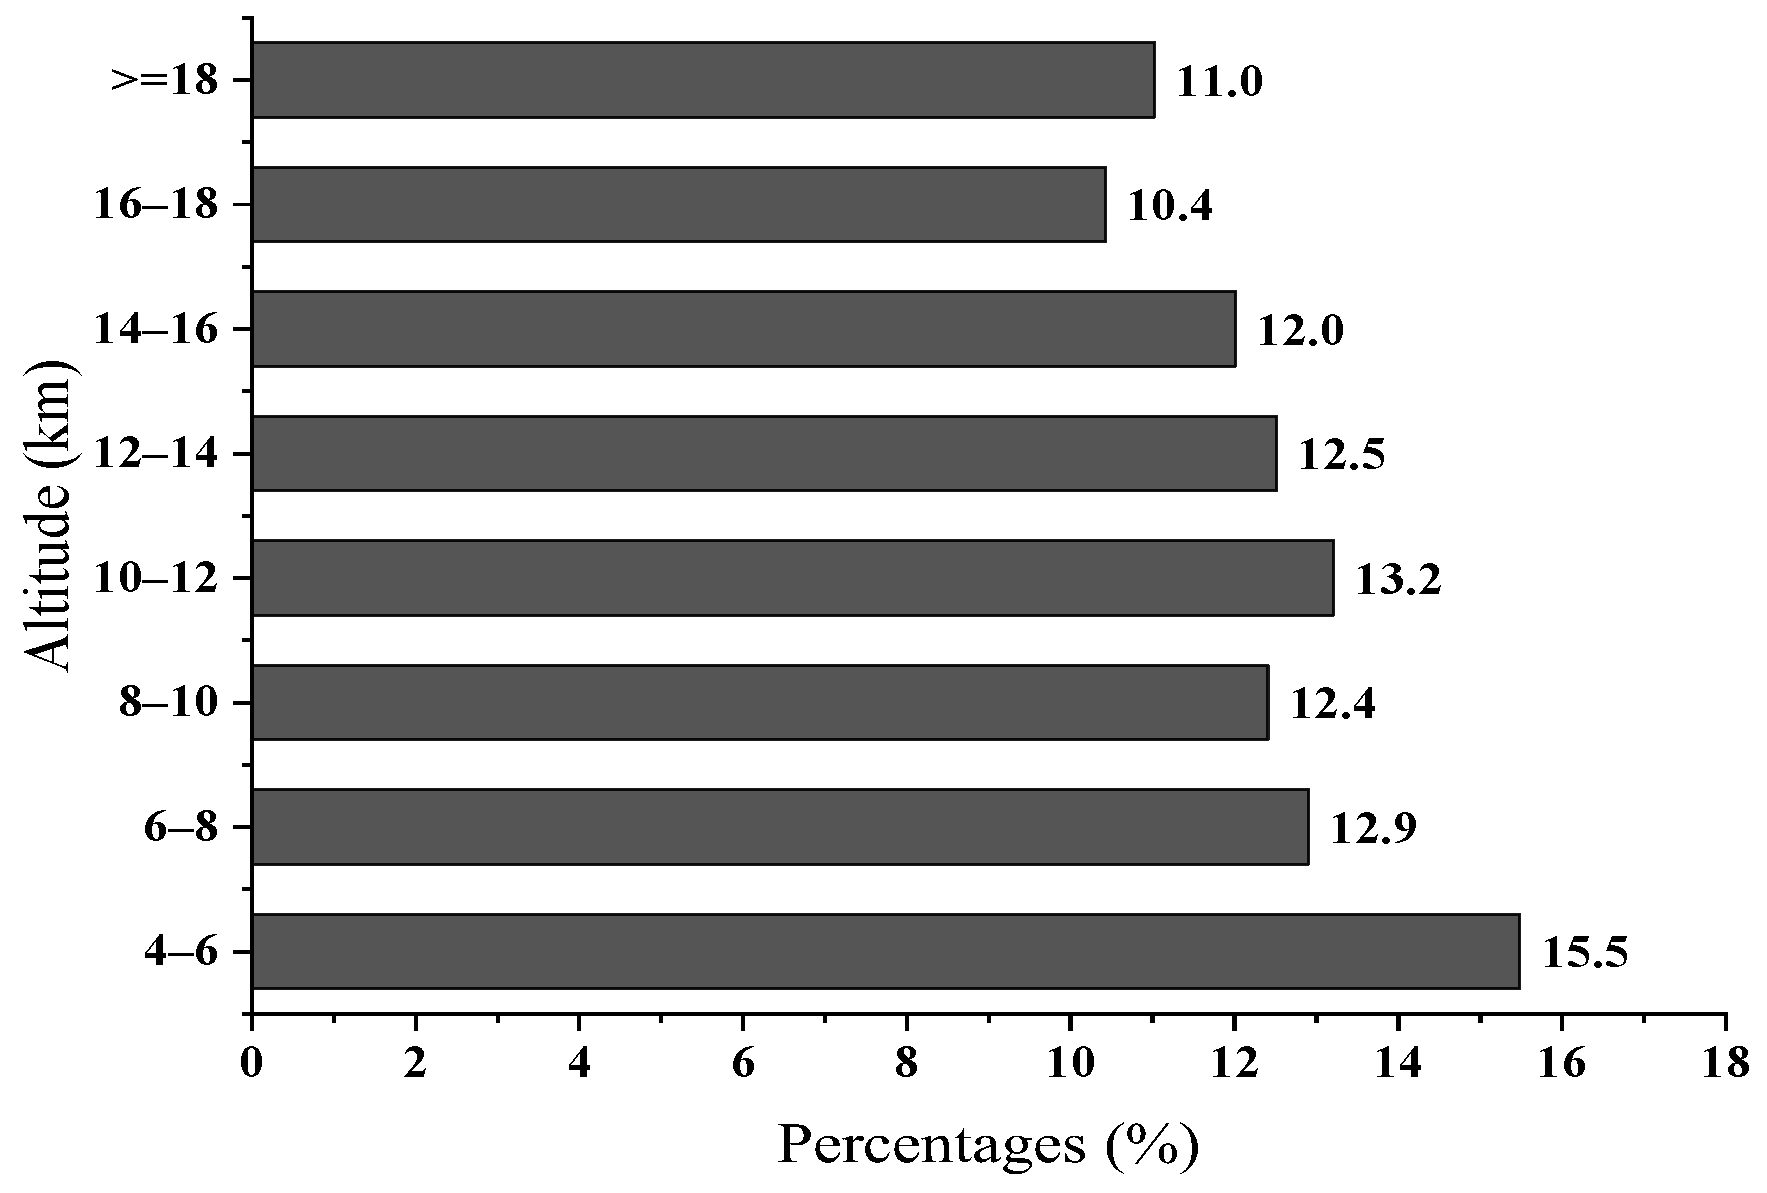
Based on the 3D lightning information provided by the LFEDA network, the detection efficiency of LMI at different altitudes was evaluated in this paper (taking Nagqu as an example), which was rarely involved in previous studies. It will promote the fine performance evaluation of LMI and the development of subsequent payload technology. Figure 10 illustrates that LMI has higher detection efficiency for the lightning in the range of 4–6 KM altitude (156 LMI data were successfully matched with the LFEDA data, accounting for 15.5%), which is partly related to the stronger convective process and the higher proportion of IC.

4. Discussions and Conclusions

In this study, 2 years (in the summer of 2022 and 2023) of Chinese high-precision ground-based 3D lightning data (LFEDA) and China’s first acquired satellite-borne lightning data (LMI) are analyzed comprehensively to investigate all types of lightning (IC and CG) activities over the Tibetan Plateau, and its difference from the lower latitudes (Hainan, China). In addition, the characteristics of different lightning-detection systems are also discussed. Our main conclusions are presented below.
(1)
Characteristics of all types of lightning activities over the Tibetan Plateau: Nagqu, Dangxiong, and Jiali in the hinterland of the Tibetan Plateau were the three major centers of lightning activities, more lightning appeared in the transition zone between lower and higher terrain, where the convections were more intense; the diurnal variation of lightning activity is significant, the most active period concentrated around 15:00 LST, the second peak was at 0:00, and the weakest time was in the morning, indicating that the influence of temperature and solar radiation on lightning activity is very prominent, and it is closely related to the unique topography and night rain phenomenon of the plateau. In terms of lightning types, the number of IC was greatly more than that of CG. Therefore, the study of IC change is of very important scientific meaning and practice value for the early warning of the plateau DCSs. The spatial distribution of IC at different altitudes is quite different, more ICs occurred at low altitudes.
(2)
Comparison of lightning activities between the Nagqu and Hainan area: the hourly variation of lightning activities in Nagqu showed a single peak, while that in Hainan was characterized by double peaks, affected by the enhancement of boundary stream in the low latitude or altitude area of China. Lightning activities and convections in Nagqu were less than 1/3 of that in Hainan. The IC in the Hainan area was more intense than that in the Nagqu area, which indirectly reflected that the convection in the low latitude tropical area was more vigorous. However, the duration of high-frequency lightning activities in Nagqu (15–19:00) was about 2 h longer than that in Hainan (15–17:00), which may be related to the fact that solar radiation and convective activities last longer over the Tibetan Plateau.
(3)
Analysis of features of LMI: LMI has more advantages in IC detection; LMI has higher detection efficiency for the lightning in the range of 4–6 KM altitude, which is partly related to the stronger convective process and the higher proportion of IC.
The work of this paper will help to provide a deeper understanding of the features of all types of lightning over the Tibetan Plateau and the differences from the lower latitudes, which contribute to researching the significance of the early warning of DCSs in different places. Moreover, it helps to promote the progress of Chinese satellite-based lightning-detection technology, the optimization of subsequent instruments, and the fusion application of ground-based and satellite-based lightning data. Soon, new generation of lightning-detection payload (as LMI’s successor) will onboard the Fengyun-4C, which will provide richer satellite-based lightning-detection data, and the 3D ground-based LFEDA network is also being upgraded, so further research is needed to explore more detailed characteristics and evolvement rules of lightning activities and convections over the Tibetan Plateau and other regions with different longitudes and latitudes.

Author Contributions

Conceptualization, J.Z.; methodology, J.Z.; software, S.Z.; validation, D.Z.; formal analysis, J.Z.; investigation, J.Z.; resources, J.Z.; data curation, S.Z.; writing—original draft preparation, J.Z.; writing—review and editing, J.Z.; visualization, S.Z; supervision, D.Z.; project administration, J.Z.; funding acquisition, J.Z.; manuscript revision, Z.Y. All authors have read and agreed to the published version of the manuscript.

Funding

This research was jointly funded by the National Natural Science Foundation of China (Grant No. 42205137), the Open Grants of Key Laboratory of Lightning (No. 2023KELL-B010) and Shanghai Typhoon Research Foundation (TFJJ202209).

Institutional Review Board Statement

Not applicable.

Informed Consent Statement

Not applicable.

Data Availability Statement

The satellite-based lightning-detection data—Lightning Mapping Imager (LMI) data—were obtained from the National Satellite Meteorological Center (NSMC), the China Meteorological Administration (CMA). The ground-based 3D LFEDA lightning-detection data were provided by the Chinese Academy of Meteorological Sciences (CAMS), the China Meteorological Administration (CMA). A variety of meteorological observation data were collected by the CMA.

Acknowledgments

We are grateful to Lin Zhu of the NSMC for her constructive suggestions on the satellite data’s processing and analysis. Valuable comments from anonymous reviewers resulted in significant improvements in this manuscript. We also express our sincere thanks to them.

Conflicts of Interest

The authors declare that they have no known competing financial interests or personal relationships that could have appeared to influence the work reported in this paper.

References

  1. Yu, Z.S.; Kang, S.C.; Jiang, J.Y. Spatial and Temporal Variations of the Night-Rain Rate during Summer over the Tibetan Plateau. J. Mt. Sci. 2011, 29, 627–632. [Google Scholar]
  2. Qie, X.S.; Zhang, G.S.; Kong, X.Z.; Zhang, Y.J.; Wang, H.B. Observation on the summer lightning discharge in the northeastern Verge of Qinghai-Xizang Plateau. Plateau Meteorol. 2003, 22, 209–220. (In Chinese) [Google Scholar]
  3. Luo, Y.L.; Zhang, R.H.; Qian, W.M.; Luo, Z.Z.; Hu, X. Intercomparison of Deep Convection over the Tibetan Plateau–Asian Monsoon Region and Subtropical North America in Boreal Summer Using CloudSat/CALIPSO Data. J. Clim. 2014, 24, 2164–2177. [Google Scholar] [CrossRef]
  4. Xue, X.Y.; Ren, G.Y.; Sun, X.B.; Ren, Y.Y. Climatological characteristics of meso-scale and micro-scale strong convective weather events in China. Clim. Environ. Res. 2019, 24, 199–213. (In Chinese) [Google Scholar]
  5. Zheng, D.; Zhang, Y.J.; Zhang, Y.; Yao, W.; Wang, F.; Lyu, W.T.; Meng, Q.; Fan, X.P.; Ma, Y.; Yang, J. Lightning and deep convective activities over the Tibetan Plateau. Earth Sci. 2020, 7, 487–488. [Google Scholar] [CrossRef] [PubMed]
  6. Zhang, Y.H.; Yan, J.Z.; Cheng, X. Advances in impact of climate change and human activities on wetlands on the Tibetan Plateau. Acta Ecol. Sin. 2023, 43, 2180–2193. [Google Scholar]
  7. Williams, E.; Guha, A.; Boldi, R.; Christian, H.; Bechler, D. Global lightning activity and the hiatus in global warming. J. Atmos. Sol.-Terr. Phys. 2019, 189, 27–34. [Google Scholar] [CrossRef]
  8. Fan, P.L.; Zheng, D.; Zhang, Y.J.; Gu, S.Q.; Zhang, W.J.; Yao, W.; Yan, B.W.; Xu, Y.B. A performance evaluation of the World-Wide Lightning Location Network (WWLLN) over the Tibetan Plateau. J. Atmos. Ocean. Technol. 2018, 35, 927–939. [Google Scholar] [CrossRef]
  9. Xu, W.X. Thunderstorm Climatologies and Their Relationships to Total and Extreme Precipitation in China. J. Geophys. Res. Atmos. 2020, 125, e2020JD033152. [Google Scholar] [CrossRef]
  10. Zhu, J.; Zhi, S.; Ren, S. Characteristics of Lightning Activities over the Tibetan Plateau Based on Satellite Detection and Its Circulation Background Analysis. Atmosphere 2023, 14, 1765. [Google Scholar] [CrossRef]
  11. Guo, F.X.; Wang, M.F.; Huang, Z.C.; Li, Y.; Mu, Y.; Lian, C.; Zeng, F. The Model Analysis of Lightning Charge Structure Characters and Attributions over Qinghai-Tibetan Plateau. Plateau Meteorol. 2018, 37, 911–922. [Google Scholar]
  12. Wei, Q.; Zhou, W.; Xie, Y.X.; Zhang, W.; Duan, H. Study on the relationship between lightning and temperature and humidity in Sichuan. Meteorol. Hydrol. Mar. Instrum. 2023, 4, 40–44. [Google Scholar]
  13. Wen, H.; Zhang, W.J.; Lyu, W.T.; Li, P. Preliminary Observations from the China Fengyun-4A Lightning Mapping Imager and Its Optical Radiation Characteristics. Remote Sens. 2020, 12, 2622. [Google Scholar] [CrossRef]
  14. Qing, M.; Penglei, F.; Dong, Z.; Yijun, Z.; Wen, Y. Relationships between cloud-to-ground lightning and radar parameters at Naqu of the Qinghai-Tibet Plateau. J. Appl. Meteor. Sci. 2018, 29, 524–533. [Google Scholar]
  15. Hui, L.; Zhou, Y.J.; Yan, Z.T. The Characteristics of Thunderstorms and Their Lightning Activity on the Qinghai-Tibetan Plateau. Adv. Meteorol. 2022, 91, 214. [Google Scholar] [CrossRef]
  16. Qie, X.S.; Toumi, R.; Yuan, T. Lightning Activities on the Tibetan Plateau as Observed by the Lightning Imaging Sensor. J. Geophys. Res. Atmos. 2003, 108, 4551. (In Chinese) [Google Scholar] [CrossRef]
  17. Qie, X.S.; Yuan, T.; Xie, Y.R.; Ma, Y.M. Spatial and temporal distribution of lightning activities over the Tibetan plateau. Chin. J. Geophys. 2004, 47, 997–1002. (In Chinese) [Google Scholar]
  18. Gao, P.; Wu, T.; Wang, D. Initial Results of Long-term Continuous Observation of Lightning Discharges by FALMA in Chinese Inland Plateau Region. Atmosphere 2021, 12, 514. [Google Scholar] [CrossRef]
  19. Qie, X.S.; Toumi, R.; Zhou, Y.Y. Lightning activity on the central Tibetan Plateau and its response to convective available potential energy. Chin. Sci. Bull. 2003, 48, 296–299. [Google Scholar] [CrossRef]
  20. Zhao, Y.; Zhang, Y.J.; Dong, W.S.; Zhang, H.F.; Chen, C.P.; Zhang, T. Preliminary analysis of characteristics of lightning in the Nagqu area of the Qinghai-Xizang plateau. Chin. J. Geophys. 2004, 47, 405–410. (In Chinese) [Google Scholar]
  21. Yang, J.; Zhang, Z.Q.; Wei, C.Y.; Lu, F.; Guo, Q. Introducing the new generation of Chinese Geostationary Weather Satellites, Fengyun-4. Bull. Am. Meteorol. Soc. 2017, 98, 1637–1659. [Google Scholar] [CrossRef]
  22. Zou, M.; Zhang, Y.; Fan, Y.; Wang, J.; Zhang, H. Performance Evaluation of LMI Based on Low-Frequency Three-Dimensional Total Lightning Flash Location Data. Remote Sens. 2024, 16, 244. [Google Scholar] [CrossRef]
  23. Shi, D.D.; Zheng, D.; Zhang, Y.; Zhang, Y.; Huang, Z.; Lu, W.; Chen, S.D.; Yan, X. Low-frequency E-field Detection Array (LFEDA)-Construction and preliminary results. Sci. China Earth Sci. 2017, 60, 1896–1908. [Google Scholar] [CrossRef]
  24. Cao, D.J.; Lu, F.; Zhang, X.H.; Yang, J. Lightning Activity Observed by the FengYun-4A Lightning Mapping Imager. Remote Sens. 2021, 13, 4922–4941. [Google Scholar] [CrossRef]
  25. Li, Y.; Liu, Y.B.; Chen, Y.; Chen, B.J. Characteristics of Deep Convective Systems and Initiation during Warm Seasons over China and Its Vicinity. Remote Sens. 2021, 13, 4289. [Google Scholar] [CrossRef]
  26. Zhang, Y.; Wang, J.X.; Zheng, D.; Lyu, W.; Zhang, Y.; Fan, Y. Progress of Observation and Study on CMA_FEBLS Low Frequency Three-Dimensional Total Lightning Flash Detection Technology in the Last Decade. J. Trop. Meteorol. 2021, 37, 298–308. (In Chinese) [Google Scholar]
  27. Hui, W.; Guo, Q. Preliminary characteristics of measurements from Fengyun-4A Lightning Mapping Imager. Remote Sens. 2021, 42, 4922–4941. [Google Scholar] [CrossRef]
  28. Liu, R.X.; Lu, Q.F.; Chen, M.; Zhang, Y.; Hui, W.; Li, X.Q. Quality assessment of FY-4A lightning data in inland China. J. Trop. Meteorol. 2020, 26, 286–299. [Google Scholar]
  29. Mach, D.M. Geostationary Lightning Mapper clustering algorithm stability. J. Geophys. Res. Atmos. 2020, 125, e2019JD031900. [Google Scholar] [CrossRef]
  30. Huang, F.X. Lightning Imaging Sensor on FY-4 Meteorological Satellite: Mission and Challenge. Meteorol. Sci. Technol. 2007, 35, 35–42. [Google Scholar]
  31. Kang, N.; Guo, Y.; Hui, W.; He, X.W.; Peng, Y. Single-Event-Upset Protection on FPGA Loaded in Lightning Mapping Imager of FY-4A Satellite. Meteorol. Sci. Technol. 2020, 48, 68–75. [Google Scholar]
  32. Wu, X.; Yuan, T.; Qie, K.; Luo, J. Geographical distribution of extreme deep and intense convective storms on Earth. Atmos. Res. 2020, 235, 104789. [Google Scholar] [CrossRef]
  33. Xia, R.D.; Zhang, D.L.; Wang, B. A 6-yr cloud-to-ground lightning climatology and its relationship to rainfall over central and eastern China. J. Appl. Meteorol. Climatol. 2015, 54, 2443–2460. [Google Scholar] [CrossRef]
  34. Duan, C.F.; Cao, W.; Miao, Q.L.; Liu, K. Spatial Distribution of Night Rainfall in Summer over China. J. Nat. Resour. 2013, 28, 1935–1944. (In Chinese) [Google Scholar]
  35. Yang, Z.Y.; Duan, W.S.; Sun, J.h. Climatic characteristics of night rain in Yunnan Province. Torrential Rain Disaster 2021, 40, 160–166. [Google Scholar]
  36. Wang, J.S.; Jiang, X.; Zhang, X.D. Characteristics of temporal and spatial variations of nocturnal precipitation in China. J. Nanjing Univ. 2022, 58, 750–765. (In Chinese) [Google Scholar]
  37. Srivastava, A.; Tian, Y.; Qie, X.S.; Wang, D.; Sun, Z.; Yuan, S.; Wang, Y.; Chen, Z.; Xu, W.; Zhang, H. Performance assessment of Beijing Lightning Network (BLNET) and comparison with other lightning location networks across Beijing. Atmos. Res. 2017, 197, 76–83. [Google Scholar] [CrossRef]
  38. Wang, D.F.; Qie, X.S.; Yuan, S.F.; Sun, Z.L.; Chen, Z.X.; Li, J.L. Spatial and Temporal Distribution of Lightning Activity and Contribution of Thunderstorms with Different Lightning-Producing Capabilities in Beijing Metropolitan Region. Chin. J. Atmos. Sci. 2020, 44, 225–238. (In Chinese) [Google Scholar]
  39. Yuan, T.; Qie, X.S. Seasonal variation of lightning activities and related meteorological factors over the central Qinghai-Xizang Plateau. Acta Meteor. Sin. 2005, 63, 123–127. [Google Scholar]
  40. Zhu, J. Comparison of the Satellite-Based Lightning Imaging Sensor (LIS) against the Ground-Based National Lightning Monitoring Network. Prog. Geophys. 2018, 33, 541–546. (In Chinese) [Google Scholar]
  41. Hui, W.; Huang, F.X.; Liu, R.X. Characteristics of lightning signals over the Tibetan Plateau and the capability of FY-4A LMI lightning detection in the Plateau. Int. J. Remote Sens. 2020, 41, 4605–4625. [Google Scholar] [CrossRef]
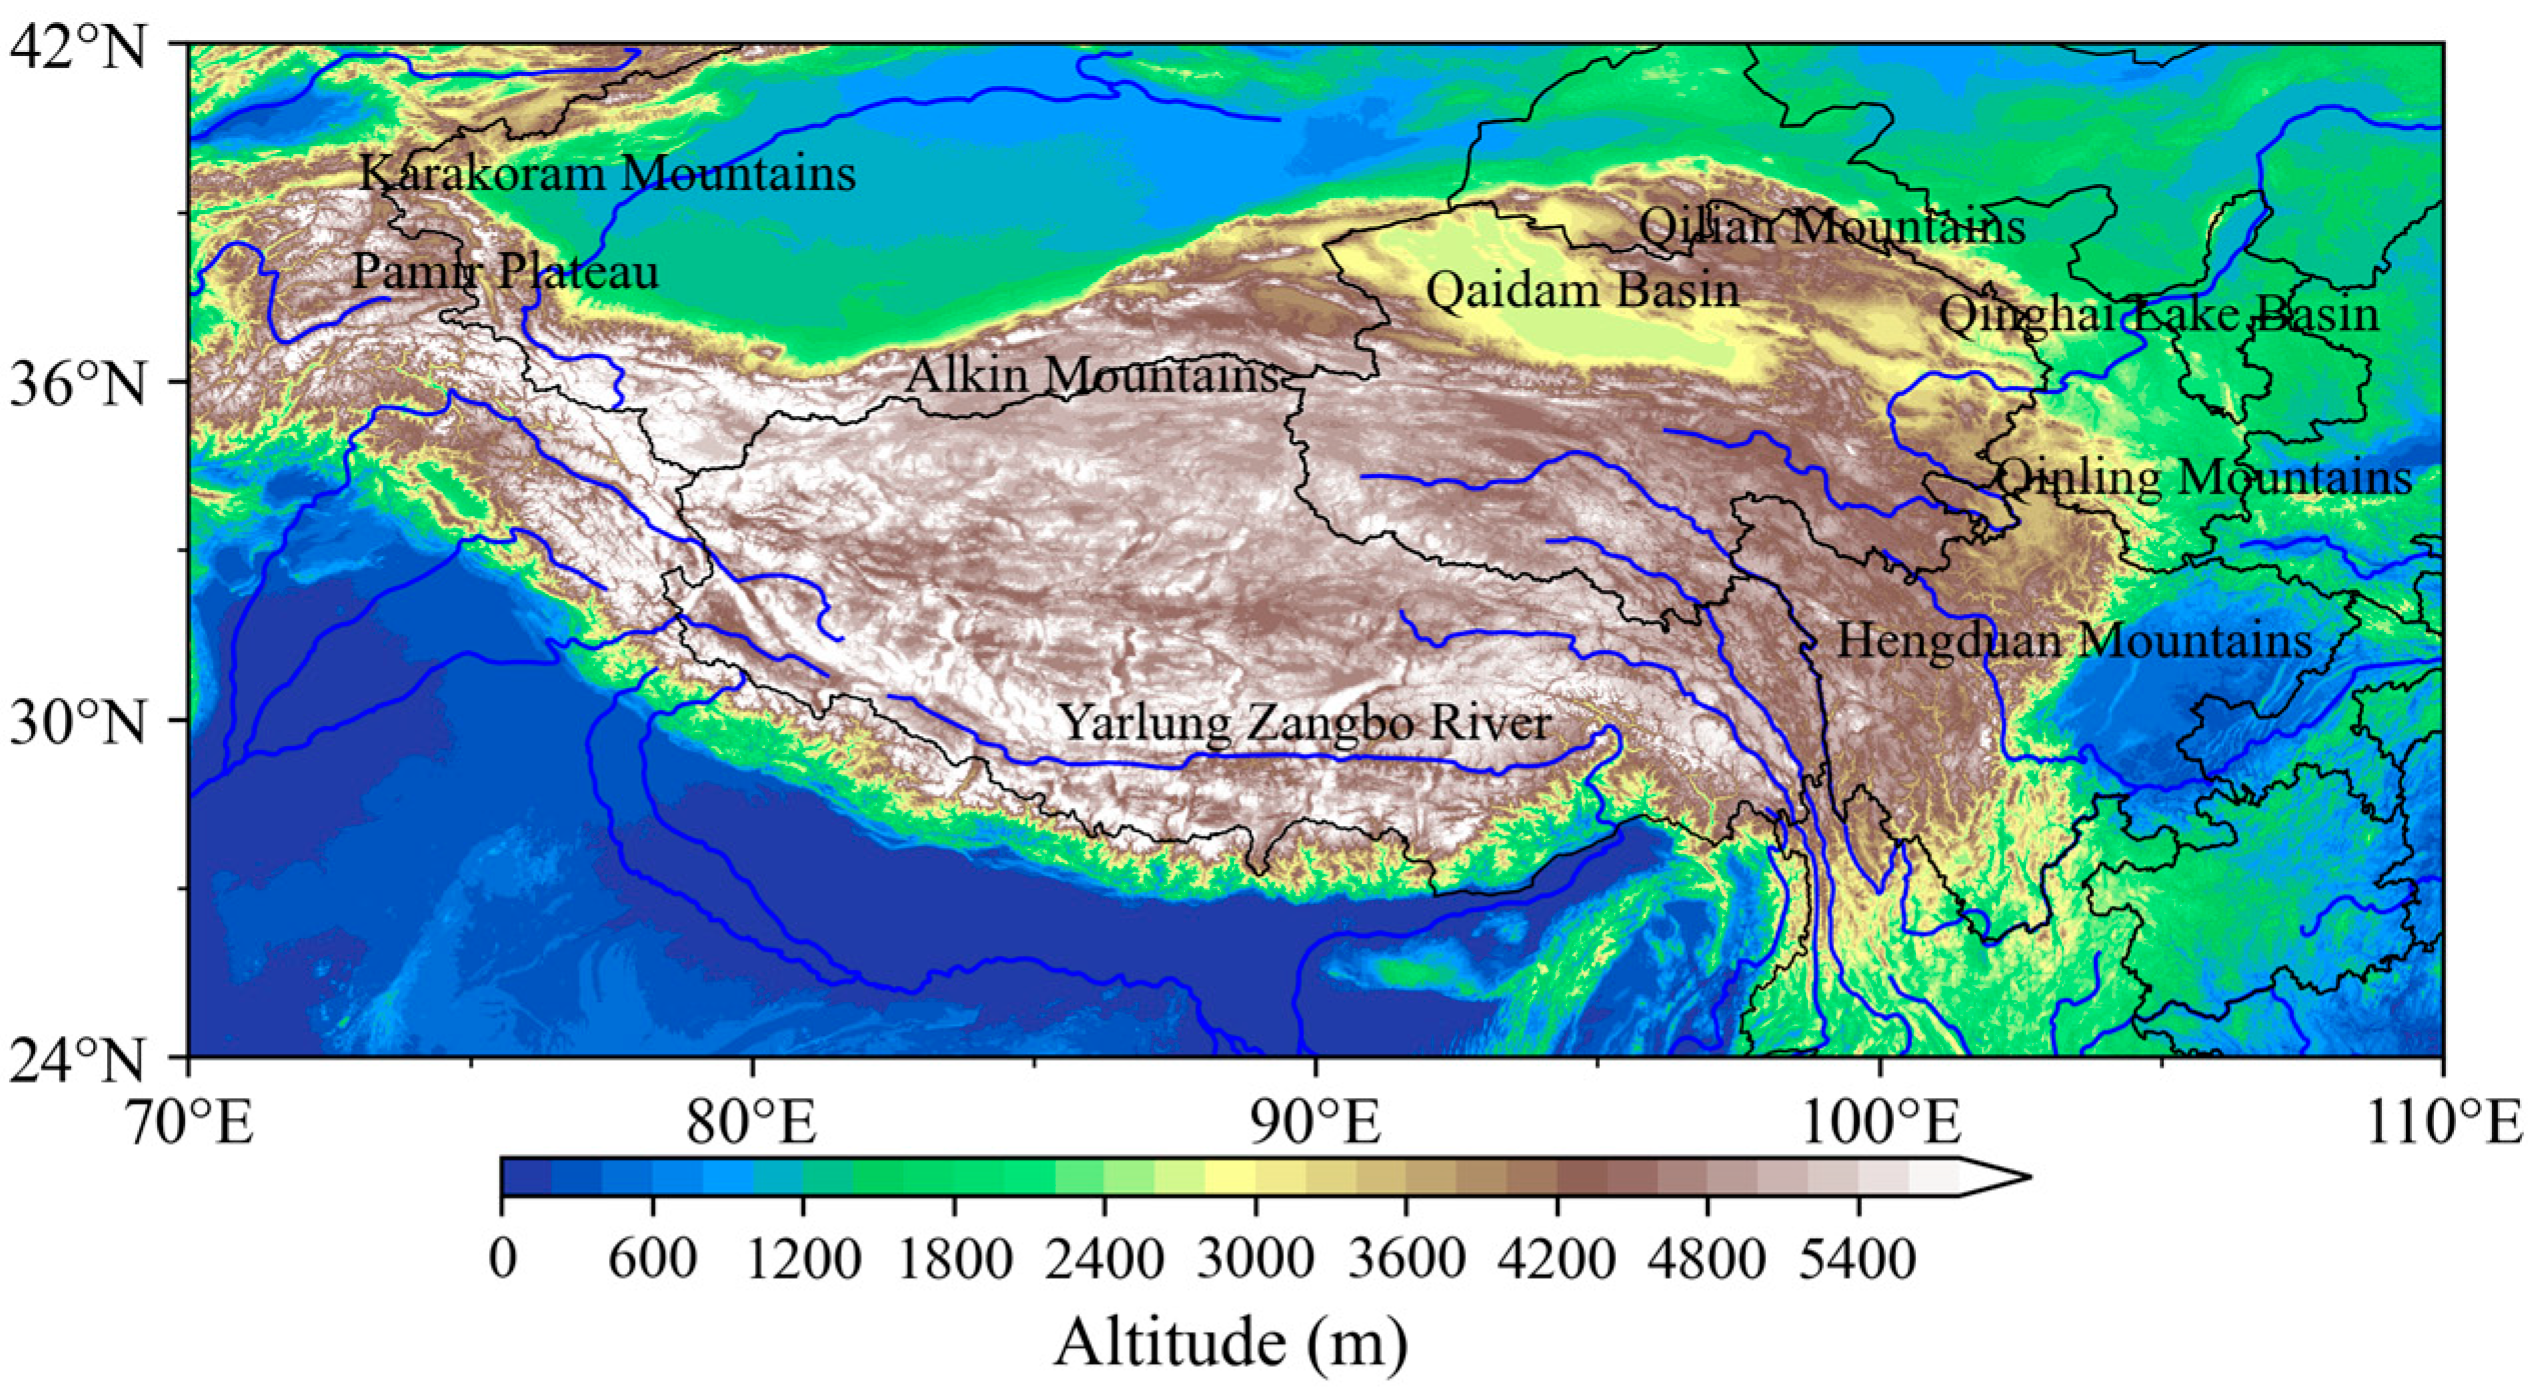
Figure 1. Topographic features of the Tibetan Plateau.
Atmosphere 15 00854 g001
Figure 2. Topographic features of Nagqu (fill in color) and the position of LFEDA network around Nagqu (black dot).
Atmosphere 15 00854 g002
Figure 3. Topographic features of Hainan (fill in color) and the position of LFEDA network in Hainan (red dots red dots are the locations where place names are mentioned in the text, the white dots are where other detection equipment is available.).
Atmosphere 15 00854 g003
Figure 4. Field of view (FOV) of FY-4A/LMI.
Atmosphere 15 00854 g004
Figure 5. Spatial distribution of LMI data density (a) and hourly LMI data variation over the Tibetan Plateau (b).
Atmosphere 15 00854 g005
Figure 6. Temporal variation characteristics of IC and CG over the Tibetan Plateau.
Atmosphere 15 00854 g006
Figure 7. Spatial distribution of IC ((a): IC) and CG ((b): CG) around Nagqu.
Atmosphere 15 00854 g007
Figure 8. Statistical results of IC numbers at different altitudes over the Tibetan Plateau.
Atmosphere 15 00854 g008
Figure 9. The hourly variation characteristics of CGs (a) and ICs at different heights (b) in Hainan and Nagqu.
Atmosphere 15 00854 g009
Figure 10. Percentage of times when lightning is detected at different altitudes by both LMI and LFEDA lightning (Nagqu).
Atmosphere 15 00854 g010
Table 1. Statistics of detection efficiency (DE) of different types of lightning by LMI.
Detection NetworkNumber and Percentage of Flashes
IC DetectedCG Detected
LMI1007160
LFEDA (true value)15,78815,063
DE of LMI6.4%1.1%
Disclaimer/Publisher’s Note: The statements, opinions and data contained in all publications are solely those of the individual author(s) and contributor(s) and not of MDPI and/or the editor(s). MDPI and/or the editor(s) disclaim responsibility for any injury to people or property resulting from any ideas, methods, instructions or products referred to in the content.