Article

Temporal and Spatial Variation Characteristics of the Ecosystem in the Inner Mongolia Section of the Yellow River Basin

1
Inner Mongolia Territorial Space Planning Institute, Hohhot 010013, China
2
College of Resources and Environmental Economics, Inner Mongolia University of Finance and Economics, Hohhot 010070, China
3
Resource Utilization and Environmental Protection Coordinated Development Academician Expert Workstation in the North of China, Inner Mongolia University of Finance and Economics, Hohhot 010070, China
4
College of Grassland, Resources and Environment, Inner Mongolia Agricultural University, Hohhot 010018, China
*
Authors to whom correspondence should be addressed.
Atmosphere 2024, 15(7), 827; https://doi.org/10.3390/atmos15070827
Submission received: 23 May 2024 / Revised: 3 July 2024 / Accepted: 8 July 2024 / Published: 10 July 2024

Abstract

:
As one of the most vital ecological regions in China, the well-being of the Inner Mongolia section of the Yellow River Basin directly hinges upon comprehending the variations in its ecosystem. The current research puts emphasis on the analysis of single-factor ecological indicators within the Mongolian section of the Yellow River and lacks summarization and analysis regarding the overall state of the ecosystem within the Mongolian section of the Yellow River. This study, using methods such as remote sensing interpretation and model simulation, combined with ground surveys, analyzes the macrostructure, quality status, service functions, and driving factors of the ecosystem in the Inner Mongolia section of the Yellow River Basin from 2000 to 2020. The results indicate that (1) in 2020, the ecosystem structure in the Inner Mongolia section of the Yellow River Basin was predominantly composed of forest, grassland, and other types of systems. (2) From 2000 to 2020, the Normalized Difference Vegetation Index (NDVI), Fractional Vegetation Cover (FVC), and net primary productivity (NPP) all showed increasing trends in the Inner Mongolia section of the Yellow River Basin, with NPP showing a slightly greater increase compared to the NDVI and FVC. (3) Over the past two decades, the overall rate of decrease in the wind erosion modulus per unit area was 1.675 t hm−2. (4) An analysis of the drivers of ecosystem changes revealed that while climate change has exerted an influence, human activities have likewise had a substantial effect on the ecosystem over the past 20 years. This study contributes to a comprehensive understanding of the current status and changes in the ecosystem, providing a decision-making basis for subsequent ecological protection and management projects.

1. Introduction

The protection and restoration of ecosystem are key elements of the United Nations Sustainable Development Goals (SDGs 2030) [1], which are crucial for stabilizing the climate [2] and promoting economic development [3]. The Yellow River Basin serves as a vital ecological barrier and economic zone in China, playing a pivotal role in China’s ecological security and socio-economic development [4,5]. In 2019, China designated the ecological protection and high-quality development of the Yellow River Basin as a major national development strategy [6,7] and highlighted this in the report of the 20th National Congress of the Communist Party of China as a critical aspect of regional coordinated development [8].
The Inner Mongolia section of the Yellow River Basin is located at the northernmost point [9], comprising one-sixth of the river’s total length and one-fifth of its total basin area. This section is a critical water conservation and replenishment area for the Yellow River, carrying significant ecological functions [10,11]. It is the only area in the Inner Mongolia Autonomous Region included in the national priority development plan and is also a crucial zone for ecological protection and environmental management within the region. Soil erosion is severe in the Yellow River Basin [12]. According to the “2020 Yellow River Basin Soil Conservation Bulletin”, the Inner Mongolia section accounts for 25.54% of the total soil erosion area of the Yellow River Basin, ranking it first among all provinces traversed by the Yellow River [13]. To fundamentally improve the ecological environment of the Inner Mongolia section of the Yellow River Basin, since 2000, China and the Inner Mongolia Autonomous Region have initiated a series of ecological protection and management projects, such as converting farmland back into forests and grasslands [14], making significant contributions to national and regional sustainable development [15].
Numerous scholars have conducted in-depth studies on the ecological environment of the Inner Mongolia section of the Yellow River Basin. These studies primarily focus on the response of vegetation cover to factors such as climate [13,16,17], spatiotemporal variations in evapotranspiration [18,19], and the connections between water quality, water quantity, and the eco-economy [20]. Other areas of focus include changes in landscape patterns and drivers of ecological risks [21,22]. The results showed that the ecological environment indices in the Mongolian section of the Yellow River basin showed a certain upward trend. Additionally, soil issues in the Inner Mongolia section of the Yellow River Basin have also emerged as a significant research direction, such as the spatiotemporal evolution and driving mechanisms of soil erosion and the soil quality evaluation of typical man-made forests [11]. However, these studies primarily analyze single-factor ecological indicators of the Inner Mongolia section of the Yellow River Basin and lack a comprehensive summary and analysis of the overall state of the ecosystem in the region, which is essential for a scientific, accurate, and comprehensive understanding of the entire ecosystem. Previously, there was a pressing need to understand whether the ecological protection and management projects implemented over the past 20 years in the Inner Mongolia section of the Yellow River Basin were effective. Questions arose regarding how the regional ecosystem has changed and the state of various driving factors. Studying the temporal and spatial changes in and characteristics of the regional ecosystem is essential in understanding the progress of regional ecological conservation and management projects. Consequently, this article attempts to analyze changes in the types and quality of the ecosystem in the Inner Mongolia section of the Yellow River Basin from 2000 to 2020. It examines the spatiotemporal patterns of wind prevention, sand fixation, and soil conservation and analyzes the driving factors affecting changes in the regional ecosystem. This study aims to provide a scientific and comprehensive understanding of the ecological effects following the implementation of ecological projects in the region and to offer a solid basis for the accurate and effective continuation of ecological protection and management projects in the area.

2. Materials and Methods

2.1. Study Area

Inner Mongolia is one of the provinces and regions through which the Yellow River Basin flows, situated at the upper part of the river. Its unique geographical location encompasses an area of 151,900 km2, accounting for 19.1% of the total area of the Yellow River Basin, and holds a pivotal role in bridging the western and eastern, as well as the northern and southern, parts of the basin. The Inner Mongolia section of the Yellow River Basin spans seven leagues and cities, covering a land area of 310,000 km2, which constitutes 26.27% of Inner Mongolia. Geographically, it extends from 103°11′ E to 113°5′ E longitude and from 37°20′ N to 43°29′ N latitude, stretching 815 km east to west and about 700 km north to south. The basin traverses between the Kubuqi and Ulan Buh deserts (Figure 1), flowing northward until it meets the Yin Mountains, and then turns eastward and southward, forming a large “several character bend” between the southern foothills of the Yin Mountains and the Ordos Plateau. The region features diverse natural landscapes, including grasslands, wetlands, rivers, lakes, deserts, and gobi, making it an important ecological barrier for the Yellow River Basin.

2.2. Data Sources (Table 1)

Data sources and parameters.
Table 1. Data sources and parameters.
Data TypeSpatial ScaleTemporal ResolutionFormat
Land Use/Cover Data1:100,000 maShapefile
Imagery2~15 mdRaster
Meteorological Data44 Monitoring SitesdTxt
DEM30 m-Raster
NDVI30 m8dRaster
Basic Geographic Data1:250,000 m-Shapefile

2.3. Ecosystem Types and Spatiotemporal Change Analysis

The ecosystem types were classified into six categories: cultivated land, forest land, grassland, wetland, artificial surfaces, and other types (Table 1). Based on remote sensing imagery data from 2010 and 2020, obtained from TM/ETM+ and environmental satellites with a spatial resolution of 30 m, the images underwent precise geometric correction and stretching processing. Subsequent interpretation of these images through remote sensing techniques produced spatial distribution data for various ecosystem types across multiple periods. Validation of these data was conducted using the kappa coefficient in conjunction with field verifications. Statistical analysis of the spatial data on ecosystem types was then performed to comprehensively assess the spatiotemporal trends in the six ecosystem types.

2.4. Ecosystem Quality and Spatiotemporal Change Analysis

NDVI data for the Inner Mongolia section of the Yellow River Basin, from the years 2000 to 2020, were collected using MODIS with a 250 m × 250 m resolution (MOD13Q1). These data underwent format conversion and resampling processes to derive annual NDVI datasets. The NDVI was used to calculate the vegetation cover, utilizing the following formula:
F c = N D V I N D V I s o i l N D V I ν e g N D V I s o i l
where F c represents the Fractional Vegetation Cover; N D V I ν e g is the NDVI value for pure vegetation pixels; and N D V I s o i l is the NDVI value for pixels with no vegetation cover. The values for pure vegetation and completely bare soil pixels are identified using data on the ecosystem types.
The net primary productivity (NPP) of vegetation was calculated using the CASA model [23]. The calculation process is as follows:
N P P = A P A R ( t ) × ε ( t )
A P A R = F P A R × P A R
where N P P represents the net primary productivity of vegetation; A P A R is the absorbed photosynthetically active radiation; F P A R denotes the fraction of photosynthetically active radiation; P A R stands for photosynthetically active radiation.
ε t = ε × T 1 t × T 2 t × W t
where ε t represents the efficiency with which vegetation converts absorbed photosynthetically active radiation into organic carbon; ε denotes the maximum light use efficiency; T 1 and T 2 , respectively, represent the inhibitory effects of environmental temperature on light utilization; W is the moisture stress coefficient affecting light utilization; and all of these are dimensionless parameters.
From the research documents and meteorological data, information such as the total solar radiation and sunshine duration for the study area is obtained. Using these data, P A R is calculated based on the pixel latitude and longitude. The Simple Ratio index is then calculated using the NDVI. The F P A R is derived from the relationship between the photosynthetically active radiation and the SR index.
F P A R = S R S R m i n × F P A R m a x F P A R m i n S R m a x S R m i n + F P A R m i n
R = N I R / R E D = ( 1 + N D V I ) / ( 1 N D V I )
where F P A R represents the fraction of photosynthetically active radiation, which is independent of vegetation type. F P A R m a x and F P A R m i n are, respectively, set at 0.950 and 0.001; S R m i n and S R m a x are values dependent on vegetation type, defined as the 5th and 95th percentile NDVI values for each specific vegetation type; N I R and R E D represent the reflectance in the near-infrared and red bands, respectively.

2.5. Ecosystem Service Change Analysis

2.5.1. Wind Prevention and Sand Fixation

Considering regional climate conditions, surface roughness, soil erodibility, crust factor, and vegetation cover, the modified Wind Erosion Equation (RWEQ) is used to quantitatively assess the soil wind erosion modulus in the area [24].
Q w i n d = 2 X S 2 Q m a x e x s 2
Q m a x = 109.8 W F × E F × S C F × K × C O G
S = 150.71 ( W F × E F × S C F × K × C O G ) 0.3711
where Q w i n d represents the soil wind erosion modulus; X denotes the actual length of the unit plot; S is the length of the critical plot; Q m a x indicates the maximum transportable sand by wind force; W F is the climate factor; E F represents the soil erodibility factor; S C F denotes the soil crust factor (dimensionless); K is the surface roughness factor (dimensionless); and C O G represents the vegetation factor (dimensionless). The soil erodibility factor is calculated using a specific equation [25].
The wind and sand fixation capacity of an ecosystem is measured through quantitative analysis of the ecosystem’s wind and sand fixation services. The service amount for wind and sand fixation can be determined by the difference in soil erosion under conditions with no vegetation cover compared to conditions with vegetation cover:
Q w i n d = 2 X S 2 Q m a x e x s 2
S L s v = S L s S L ν
where S L s v represents the wind and sand fixation service amount; S L s denotes the potential soil erosion amount under conditions with no vegetation cover; S L ν indicates the actual soil erosion amount under conditions with vegetation cover.

2.5.2. Soil Retention

The estimation of soil water erosion in the region is conducted using the modified Universal Soil Loss Equation (RUSLE). In the equation:
A = R × K × L × S × C × P
where A represents the amount of soil erosion per unit area; R denotes the erosive power of precipitation factor; K is the soil erodibility factor; L is the slope length factor; S is the slope steepness factor; C represents the vegetation cover factor; P is the soil conservation practice factor; and all the above factors are dimensionless. This study utilizes data obtained from the China Meteorological Data Sharing Service Network (https://data.cma.cn/, accessed on 16 December 2023). The erosive power of precipitation factor is calculated using the daily rainfall erosivity model developed by [26]. The soil erodibility factor is estimated using the nomograph method, based on the soil attribute table and spatial data attached to a 1:1,000,000 soil type map. Slope length and slope steepness factors are derived using methods by McCool [27], with digital elevation data (DEM) of a 90 m resolution obtained from the USGS (https://www.usgs.gov/, accessed on 28 December 2023). The vegetation cover factor is calculated using the method by [28], and the soil conservation practice factor is determined using a method based on slope.
To quantify the soil conservation capacity of the ecosystem, a quantitative analysis of the ecosystem’s soil retention service is conducted. The soil conservation service amount can be measured by the difference between the soil loss under conditions of extreme ecosystem degradation and the soil loss under the current conditions:
A C = A D A R
A D = R × K × L × S × C D × P
A R = R × K × L × S × C R × P
A C = R × K × L × S × C D C R × P
where A C represents the soil retention amount; A D denotes the soil loss under conditions of extreme ecosystem degradation; A R indicates the soil loss under the current ecosystem conditions. From the above formula, it is evident that the difference between A D and A R is solely attributed to factor C , which represents the vegetation cover factor.

2.6. Analysis of the Driving Force Factors

The trend analysis method is employed to analyze the interannual variations and trends in meteorological elements such as temperature and precipitation [29]:
S = i = 1 n m i X i 1 n i = 1 n m i i = 1 n X i i = 1 n m i 2 1 n ( i = 1 n m i ) 2
where S represents the slope of change; X i denotes the observed values of temperature and precipitation; m i is the ordinal number of the year.
According to the human disturbance index evaluation method [30], the impact of human activities on the regional ecosystem is assessed by assigning values to different ecosystem levels, resulting in a graded disturbance index (Table 2):
To calculate the overall human disturbance index for a specific region, a weighted summation based on the proportion of each ecosystem type is performed. This yields a value between 0 and 3, which is subsequently normalized to a range from 0 to 1, quantifying the disturbance level across the area. The computation is executed as follows:
D = ( i = 0 3 A i × P i ) 3 / i = 1 n P i
where D represents the disturbance index; A i denotes the disturbance grading index for the i th level of ecosystem disturbance; P i indicates the percentage of the area that corresponds to the i th level of disturbance grading; areas where ecosystems with no vegetation cover or a sparse vegetation distribution exceed 95% are directly excluded from the calculation.

3. Results

3.1. Ecosystem Macrostructure and Changes

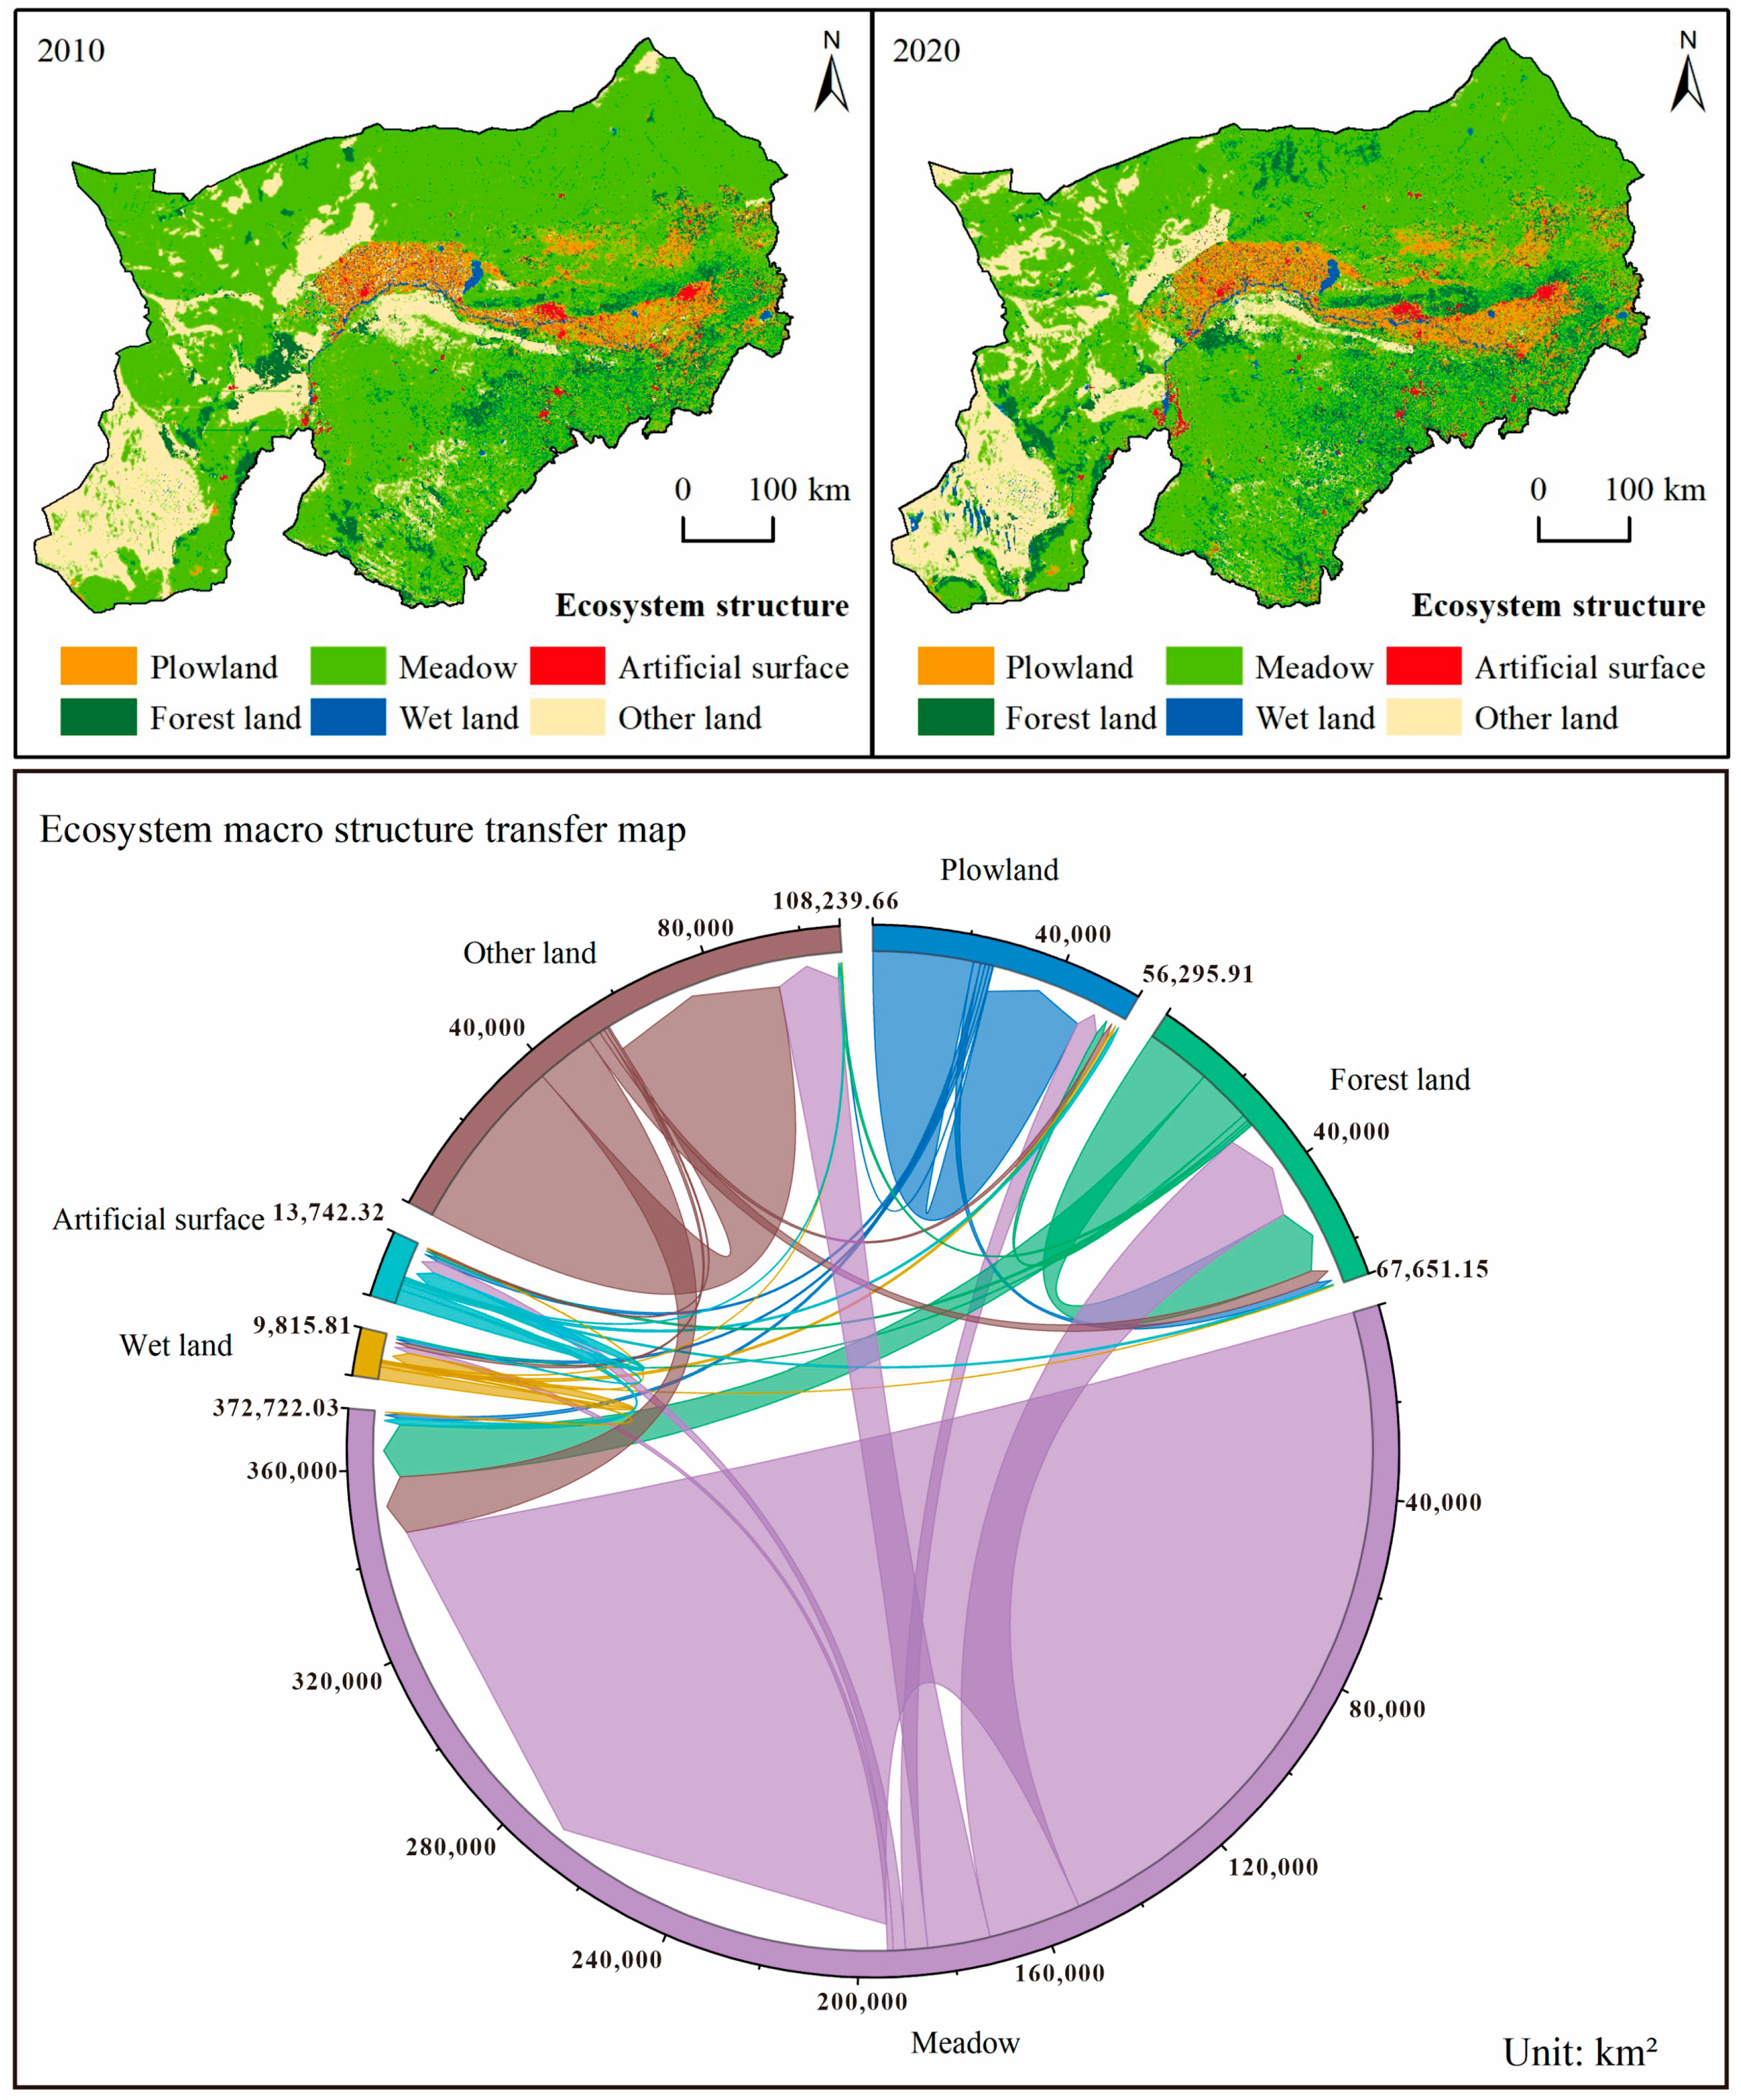
The results indicate that in 2020, the ecosystem structure (Table 2) of the Inner Mongolia section of the Yellow River Basin was predominantly composed of forest and grassland areas, along with other types of systems (Figure 2, Table 3). Grassland areas accounted for approximately 57.44% of the total ecosystem structure area, distributed across most of the Inner Mongolia section of the Yellow River Basin. Other types of areas made up 16.87% of the region, primarily located in the western and some central parts of the study area. Forested areas comprised 12.56% of the land, mainly concentrated in the central and western regions. The remaining land cover types each accounted for less than 10% of the area; cultivated land represented 9.56%, primarily found in the Hetao Plain, the Tumochuan Plain, and the northern foothills of the Yin Mountains; artificial surfaces accounted for 2.87%; and wetlands covered 0.70% of the area.
From 2010 to 2020, the area of forest land in the Inner Mongolia section of the Yellow River Basin experienced a net increase of 10,300 km2 (Table 4). Within this category, 14,200 km2 was transferred out, predominantly into meadow, with meadows accounting for 82.52% of the transferred-out area. Conversely, 24,500 km2 was transferred into forest land, primarily from meadow, which constituted 81.12% of the incoming transfers. During the same period, meadow areas saw a net decrease of 14,900 km2. Out of this, 41,000 km2 was transferred out, mainly into forest land and for other land uses, while 26,100 km2 was transferred in, predominantly from forest land. Wetland areas netted an increase of 1271.64 km2. The area transferred out was 1516.62 km2, mainly into plowland and for other land uses, representing 67.25% of the total transferred-out area. The area transferred in amounted to 2788.26 km2, primarily from meadow. Plowland experienced a net increase of 4398.36 km2, with 7531.50 km2 transferred in and 3133.14 km2 transferred out. Artificial surface areas saw a net increase of 1718.53 km2, with 4244.11 km2 transferred in and 2525.58 km2 transferred out. Other land uses decreased by a net 2781.85 km2, primarily undergoing conversions into meadow. This reflects significant dynamism in land cover changes within the region, highlighting substantial interactions between different land use types during this decade.

3.2. Ecosystem Quality and Changes

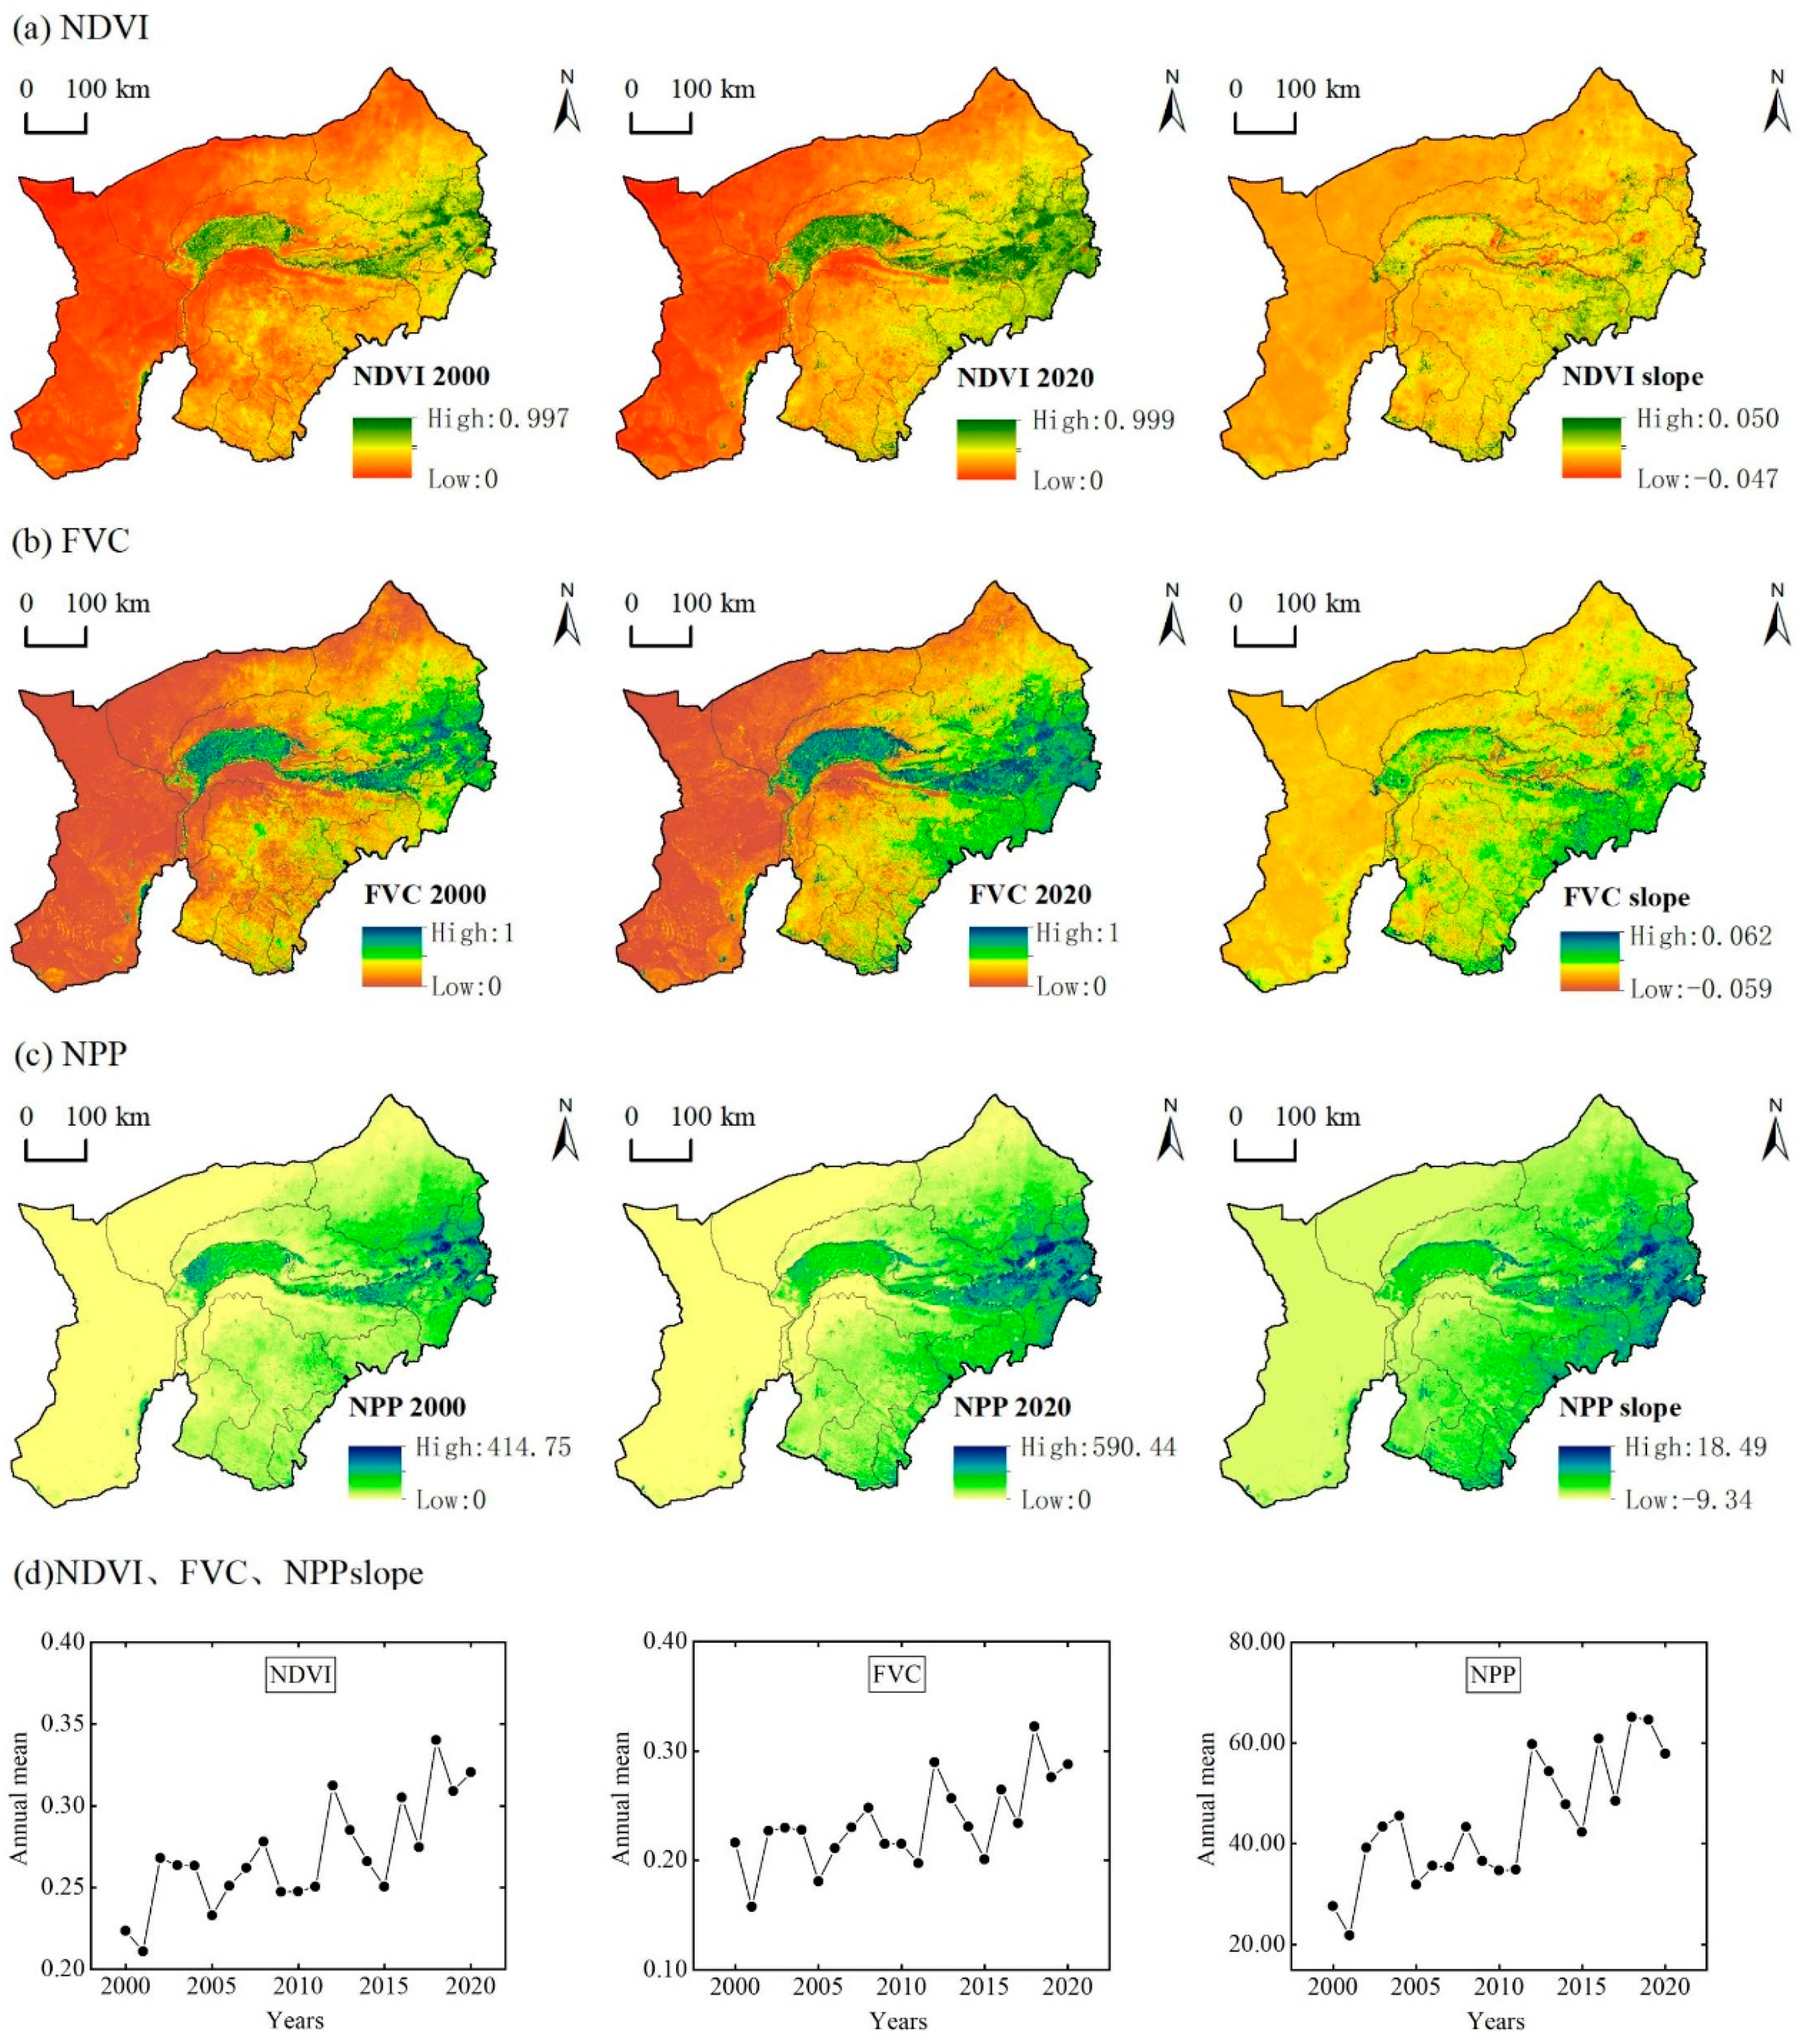
From 2000 to 2020, the Inner Mongolia section of the Yellow River Basin exhibited increasing trends in the NDVI, FVC, and NPP, with NPP showing a slightly greater increase compared to the NDVI and FVC (Figure 3). When considering the sub-basin perspective, both the Hexi Desert region and the Bayan Nur Mountain High Plateau showed relatively smaller averages and growth rates for these indicators over the years (Table 5). During this period, the average NDVI for the Inner Mongolia section was 0.27, showing a slight overall increasing trend, with an annual growth rate of 0.004. The NDVI average was highest in the Dahei River basin, at 0.57, with the fastest annual increase observed on the right bank above Wubao, at 0.010. All the sub-basins displayed a gradual increasing trend in the NDVI between 2000 and 2020. The average vegetation cover in the region was 23.42%, with the Dahei River basin having the highest average vegetation cover at 62.42%. The right bank above Wubao also showed the highest annual increase in vegetation cover at 0.012. Over the past 20 years, the average vegetation productivity in the Inner Mongolia section of the Yellow River Basin was 44.36 g C m−2, overall exhibiting an increasing trend, with an annual growth rate of 1.577 g C m−2 per year. The Dahei River basin and the southeastern mountains and hills of the Ulanqab ranked at the top in terms of their average annual net primary productivity and its growth rate, with average values of 187.52 g C m−2 per year and 145.36 g C m−2 per year, respectively. The Northwest Shanxi Tributary basin showed the highest growth rate in net primary productivity at 6.045 g C m−2 per year.

3.3. Analysis of Key Ecosystem Services and Changes

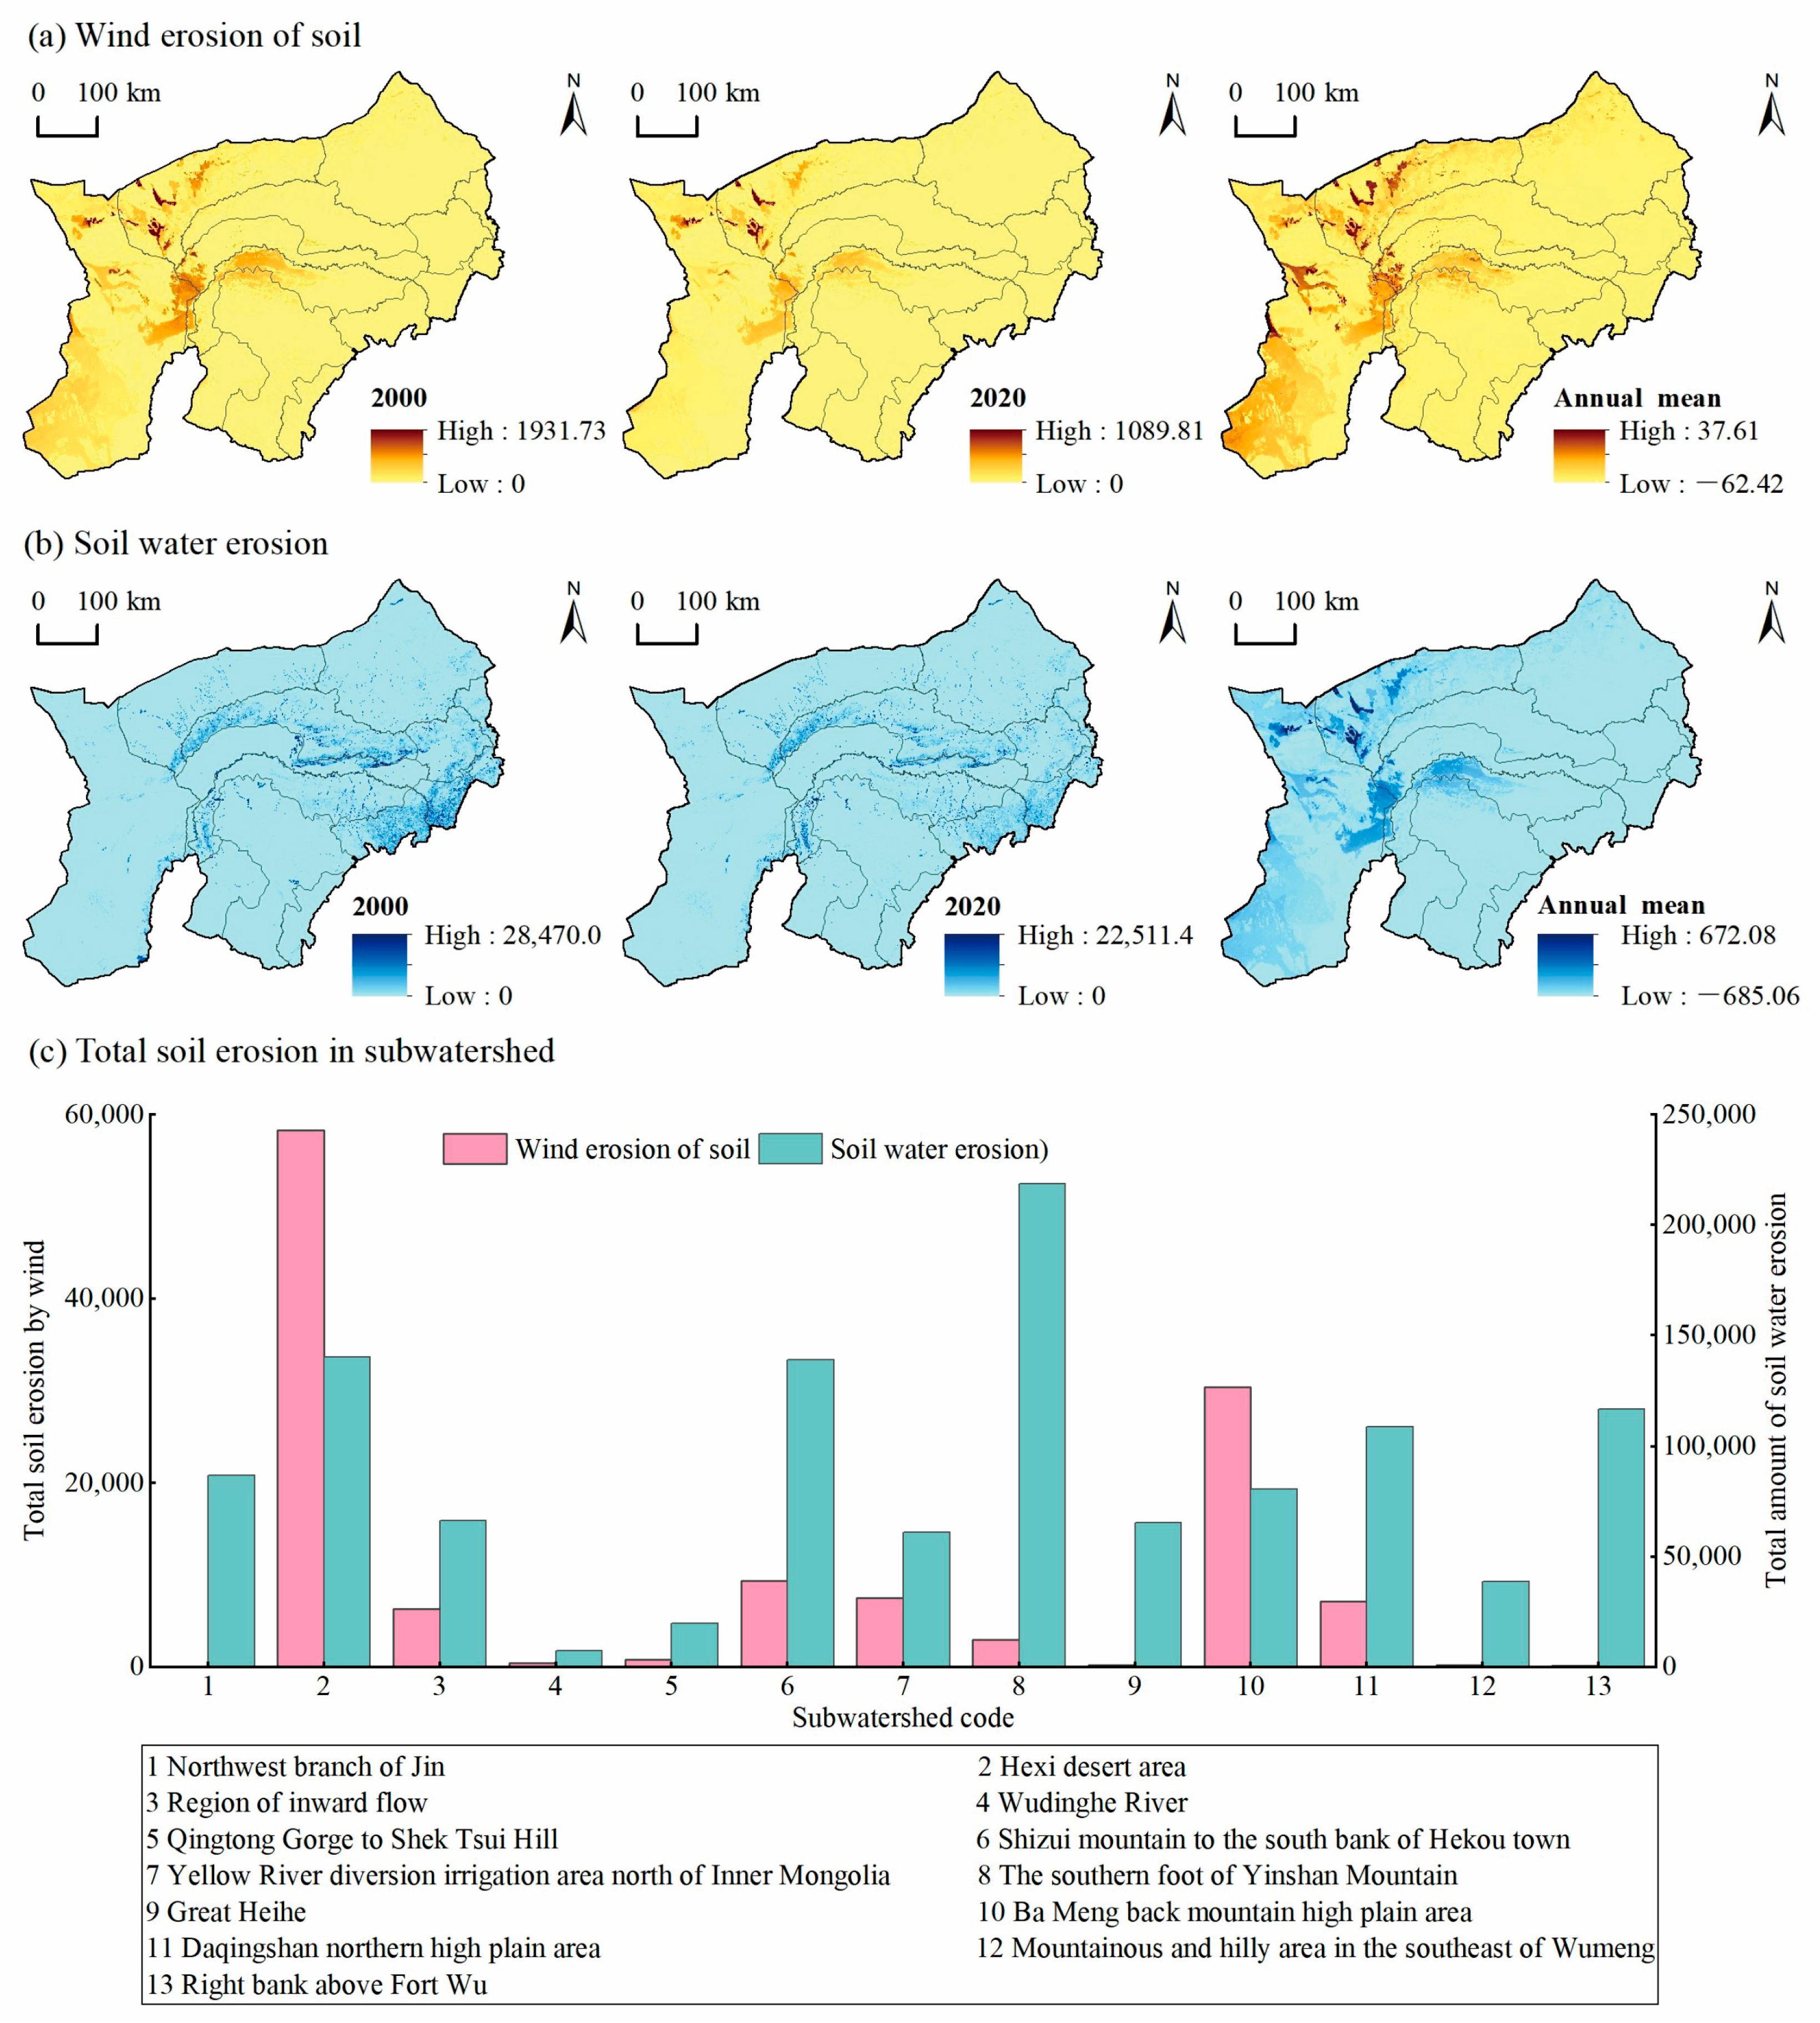
From 2000 to 2020, both the unit soil wind erosion modulus and the soil water erosion modulus in the Inner Mongolia section of the Yellow River Basin exhibited a decreasing trend. Over these two decades, the average unit soil wind erosion modulus was 39.48 t hm−2 (Table 6, Figure 4), with the Bayan Nur Mountain High Plateau area recording the highest rate at 88.51 t hm−2, followed by the Hexi Desert region at 74.09 t hm−2, and the lowest rate recorded in the Northwest Shanxi Tributary at 0.45 t hm−2. The rate of decrease in the soil wind erosion modulus per unit area showed a gradual decline, with an overall reduction rate of 1.675 t hm−2. The Hexi Desert region and the Bayan Nur Mountain High Plateau area saw the most significant reductions in the unit area wind erosion modulus, decreasing by 3.511 t hm−2 and 3.335 t hm−2, respectively.
From 2000 to 2020, the actual amount of soil wind erosion in the Inner Mongolia section of the Yellow River Basin averaged 961,414.81 million tons, with the Hexi Desert region experiencing the highest actual erosion at 58,319.58 million tons and the Northwest Shanxi Tributary experiencing the lowest at 24.62 million tons. These data underscore the effectiveness of the soil conservation and erosion control measures implemented over the years in reducing soil erosion across different sub-regions of the basin.
From 2000 to 2020, the average long-term soil wind erosion in the Inner Mongolia section of the Yellow River Basin was reported at 367.25 t hm−2. Specifically, the Northwest Shanxi Tributary exhibited the highest unit area water erosion modulus at 1585.86 t hm−2, while the Wuding River presented the lowest value at 102.04 t hm−2. Over these two decades, the unit area water erosion modulus across the Inner Mongolia section demonstrated a general downward trend, decreasing at a rate of 2.774 t hm−2 per year. Notably, significant declines exceeding 10 t hm−2 were observed in the Northwest Shanxi Tributary, above Wubao on the right bank, and in the Dahei River basin, with respective rates of 44.430 t hm−2, 26.655 t hm−2, and 11.153 t hm−2.
Conversely, four river basins, including the Qingtongxia to Shizuishan area, exhibited an upward trend in their water erosion rates. The Qingtongxia to Shizuishan area itself experienced an increase in the water erosion modulus rate of 2.073 t hm−2, while the other three basins saw increases of less than 1 t hm−2 each. Overall, the actual amount of water erosion averaged 114,962,336 million tons across the entire period. The highest actual water erosion was recorded in the Yinshan Southern Foothills, amounting to 218,639.03 million tons. Other regions, including the Hexi Desert, the Qingtongxia to Shizuishan area, above Wubao on the right bank, and the northern high plateau of Daqing Mountain also recorded actual water erosion figures exceeding 100,000 million tons. The smallest actual water erosion was found in the Wuding River basin, at 7459.77 million tons. These extensive data highlight the variability and severity of soil erosion across different sub-regions of the Inner Mongolia section of the Yellow River Basin, reflecting the impact of both natural conditions and implemented erosion control measures.

3.4. Analysis of Drivers of Ecosystem Changes

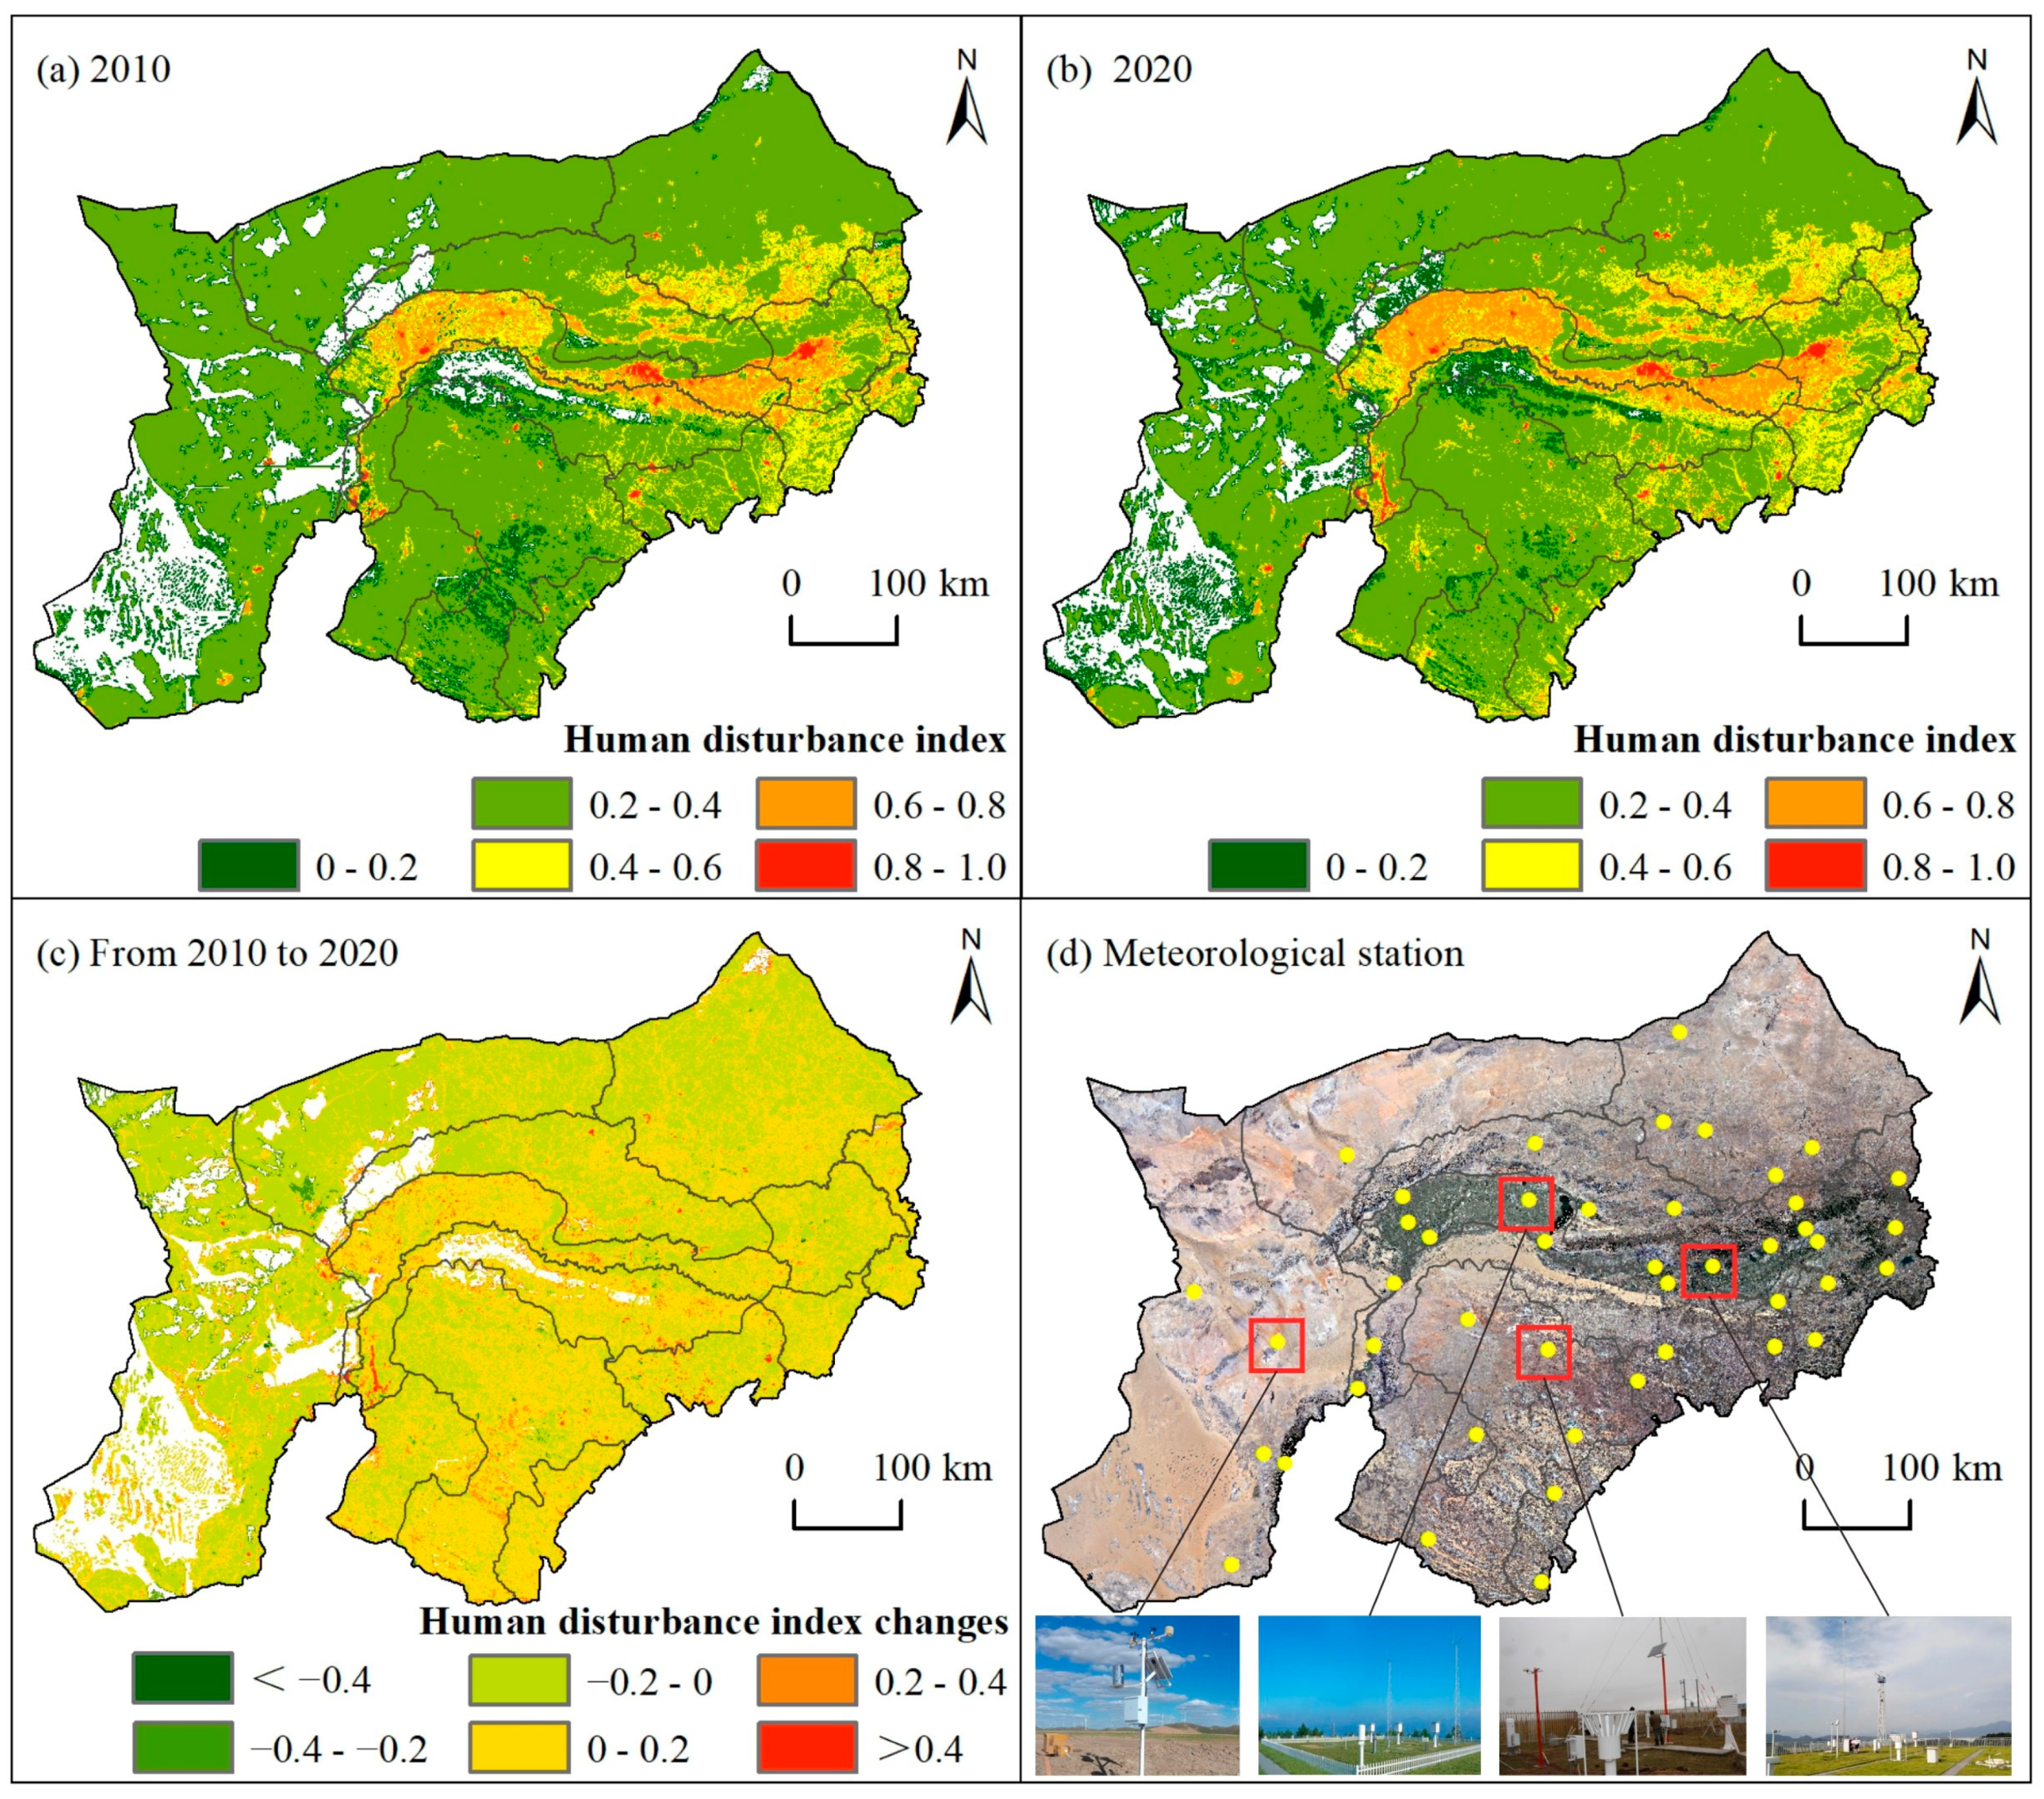
From 2010 to 2020, the average annual temperature in the Inner Mongolia section of the Yellow River Basin exhibited a slight increasing trend, with a change slope of 0.023 °C per year. Among the regions, the Hexi Desert region recorded the highest average annual temperature at 8.603 °C, while the Bayan Nur Mountain High Plateau area showed the largest increase in the trend at 0.029 °C per year. The total annual precipitation generally displayed an increasing trend, with a change slope of 2.462 mm per year. Among these, the area above Wubao on the right bank reported the highest average annual precipitation and the largest change trend, at 224.751 mm and 3.865 mm per year, respectively. Over the past decade, the human disturbance index in the Inner Mongolia section of the Yellow River Basin overall showed an increasing trend (Figure 5, Table 7). Compared to 2010, the human disturbance index in 2020 had increased by 0.012. This increase was particularly noticeable in the region from Shizuishan to Hekouzhen Southern Bank and the North Yellow River Diversion Irrigation Area, where the human disturbance index over the last ten years increased by 0.047. Only in the Hexi Desert region did the human disturbance index decrease, by 0.013.

4. Discussion

Previous research on the Inner Mongolia section of the Yellow River Basin has largely focused on localized ecological restoration and resource management. There has been less emphasis on comprehensive studies analyzing the overall ecosystem conditions in the region. Given this context, the primary strength of this study lies in its holistic approach to the region. It integrates the Water Resources Department’s sub-basin classification standards to systematically analyze changes in various ecosystem indicators. The research conducts a comprehensive analysis of the ecosystem’s quantity, quality, services, and influencing factors.

4.1. Ecosystem Quantity and Variation

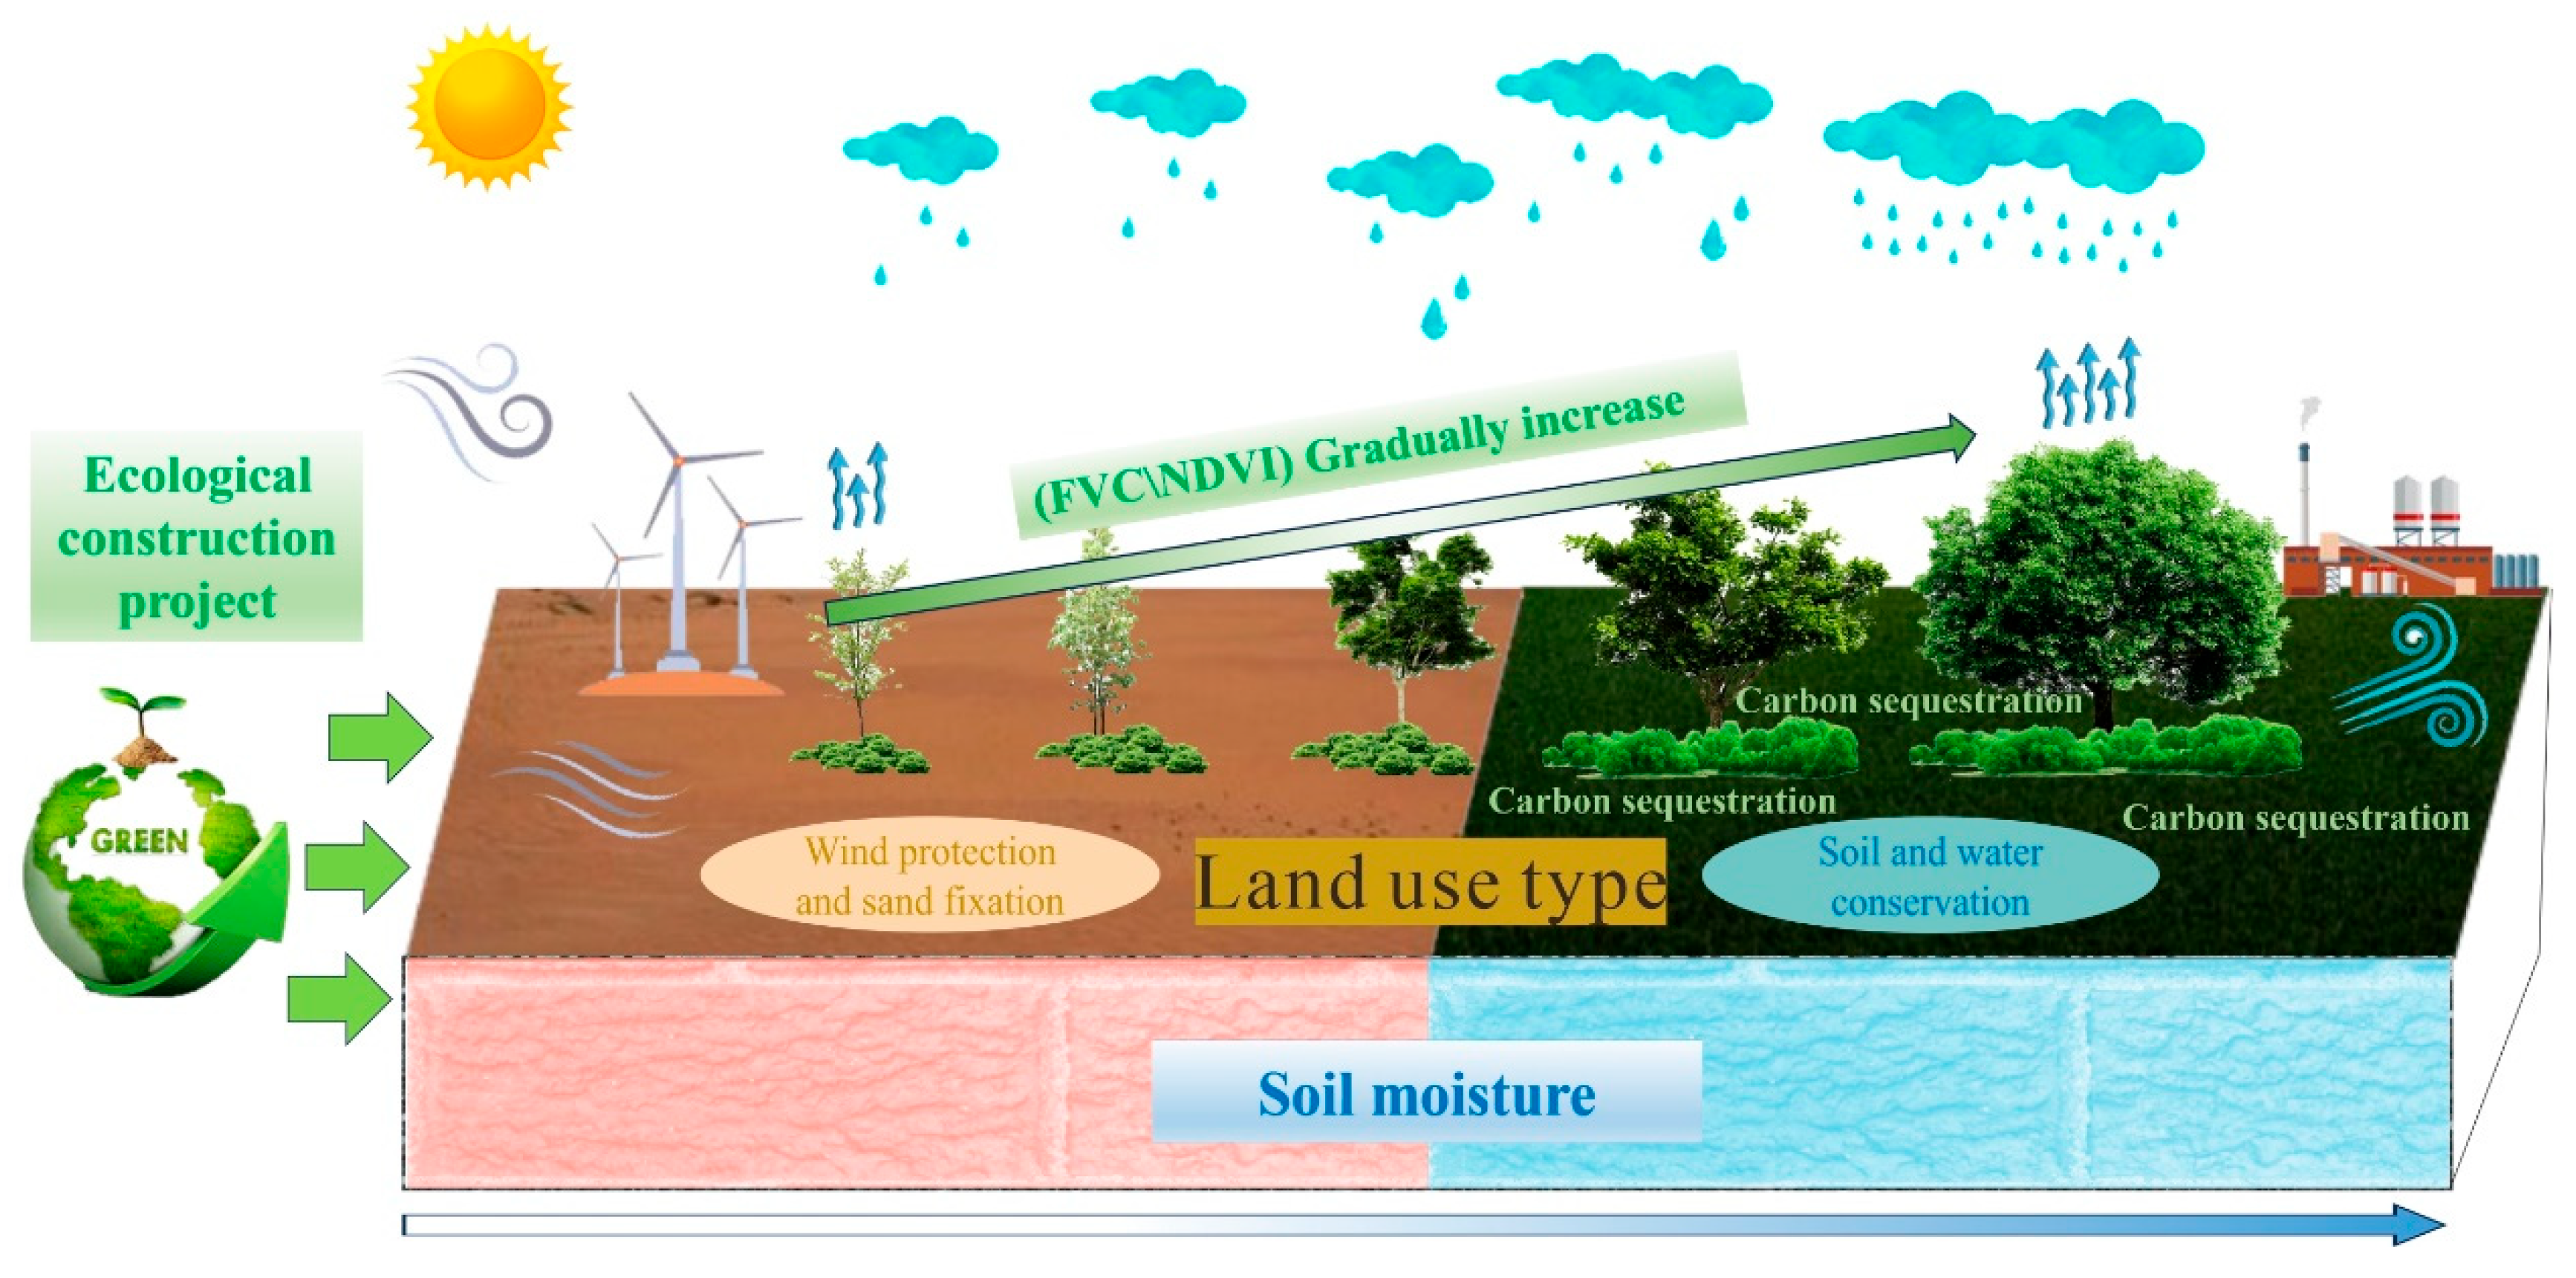
With the rapid development of society (Figure 6), the acceleration of urbanization, and increasing emphasis on ecological conservation, changes in various ecosystem are inevitable [31,32]. Observing the changes in land categories within the Inner Mongolia section of the Yellow River Basin from 2010 to 2020, there was an increase in forest land, cultivated land, artificial surfaces, and wetland, in descending order of the area increase. Conversely, the areas that decreased the most were grasslands and other land uses. In recent years, through the effective implementation of projects such as the Three-North Shelter Forest Program and the returning farmland to forest policy, there has been a rapid increase in forest land in the region. Initiatives related to food security strategies and ecological safety barriers may also have contributed to the increases in cultivated land and wetland areas. The central and eastern parts of the Inner Mongolia section of the Yellow River Basin, being the economic development center of the Inner Mongolia Autonomous Region, have seen a rapid increase in artificial surfaces due to economic development. Grasslands, being the most easily converted and vulnerable ecosystem type [33,34], experienced the largest decrease in area, marking it as the land use type with the most significant reduction over the past decade. Although a significant portion of these grasslands was converted into forest land (10.27%), a considerable area (6.83%) was converted for other land uses. Grasslands hold crucial ecological service functions [35,36], and preserving this ecosystem type is vital for the overall healthy development of the regional ecosystem. Other land types, including sandy and saline–alkaline lands, which are typical in the Inner Mongolia section of the Yellow River Basin, cover large areas and are extensively distributed. The reduction in these other land types indicates that the ecological projects implemented in recent years have started to show positive results, with considerable success achieved in controlling and managing sandy areas and saline–alkaline lands [37].

4.2. Ecosystem Quality and Change

From an ecosystem quality perspective, between 2000 and 2020, the Inner Mongolia section of the Yellow River Basin saw increasing trends in the NDVI, FVC, and NPP. These upward trends are significantly related to the increases in the areas of forest land, cultivated land, and wetlands. The areas above Wubao on the right bank and the Northwest Shanxi Tributary sub-basins have leading averages and growth trends in the NDVI and FVC, indicating that ecological restoration projects in these sub-basins have been implemented more smoothly. In contrast, the Hexi Desert region and the Bayan Nur Mountain High Plateau area, characterized by extensive deserts and sandy lands, exhibit lower values for the NDVI, FVC, and NPP. These findings are consistent with zonal laws, reflecting the natural conditions and challenges inherent in these regions [16].

4.3. Ecosystem Key Services and Changes

Soil wind erosion and water erosion are among the most severe environmental challenges in the Inner Mongolia section of the Yellow River Basin [6]. In recent years, the implementation of ecological projects has significantly enhanced the region’s capabilities for windbreak and sand fixation, as well as soil and water conservation [37,38]. However, these issues still pose substantial threats to the sustainable development of the area’s ecosystem [39]. The main areas affected by wind erosion in the Inner Mongolia section of the Yellow River Basin are the Bayan Nur Mountain High Plateau area and the Hexi Desert region. These sub-basins contain deserts or sandy lands, serving as the primary sources of sandstorms in the region, and exhibit higher average unit area wind erosion moduli. The trend of decreasing wind erosion moduli is more pronounced in the Hexi Desert region compared to the Bayan Nur Mountain High Plateau area, indirectly indicating that the former’s ecosystem capabilities for windbreak and sand fixation have improved more significantly in recent years. Soil water erosion predominantly occurs in the Northwest Shanxi Tributary and the area above Wubao on the right bank, located in the southeastern part of the Inner Mongolia section of the Yellow River Basin. These areas receive more annual precipitation compared to other sub-basins, resulting in higher unit area water erosion moduli. However, these regions rank among the top in terms of their trends of decreasing water erosion moduli, which indicates that their soil and water conservation capabilities have also significantly improved.

4.4. Ecosystem Change Drivers

Analysis of the drivers behind ecosystem changes from 2000 to 2020 in the Inner Mongolia section of the Yellow River Basin indicates that both temperature and precipitation have shown upward trends, with the increase in precipitation being more pronounced than that of temperature. Spatially, the sub-basins in the central region exhibited a slightly higher trend in temperature increase, with the annual average temperature changes exceeding 0.025 °C per year. Except for the Hexi Desert region and the Bayan Nur Mountain High Plateau area, other regions experienced an annual increase in precipitation exceeding 2.6 mm. The gradual shift towards a warmer and more humid climate in the Inner Mongolia section of the Yellow River Basin in recent years, likely due to extreme global climate change, could contribute to the observed rise in temperature and precipitation [40]. This has led to improved vegetation cover in some parts of the study area, such as the Mu Us Sandy Land. The increase in the human disturbance index indicates that human activities have intensified, disrupting the regional ecosystem and hindering natural vegetation recovery, For example, the water level of many small lakes in the study area has dropped seriously or even disappeared, and natural waters have become bare land or saline–alkali land. In the Hexi Desert region, where most of the landscape comprises desert with minimal human presence, the human disturbance index has decreased. In other regions, due to projects such as the development of the western area in recent years, increased human activity has led to a rise in the human disturbance index [41]. Most of the areas of human activity are areas with a suitable climate and other conditions, and human activity is also the most important factor that changes the regional ecosystem structure. According to the research results, with a change in climate, the climate of most of the regions in the study area has become more suitable for human activities, and human activities will also lead to changes in the structure and quality of the regional ecosystem. In terms of the feedback on regional climate, the relationship between climate and human activities is mutual influence and mutual restriction.
Over the past 20 years, the spatiotemporal characteristics of the ecosystem in the Inner Mongolia section of the Yellow River Basin have shown positive development trends, with a more optimized macrostructure, improved quality conditions, and enhanced service functions.

5. Conclusions

This study reveals positive trends in the ecosystem of the Mongolian section of the Yellow River Basin from 2000 to 2020. The net increase in forest areas was the largest, and the net decrease in grassland areas was the largest. The conversion rate between forest and grassland is significant. In recent years, various ecological protection and environmental management measures have significantly reduced other land uses. The wind erosion modulus and water erosion modulus showed decreasing trends, and the water erosion modulus decreased more significantly. The wind erosion modulus per unit area of each sub-basin showed a decreasing trend. The climate in the study area showed a warm and humid trend, and the temperature and precipitation generally increased.
Our study provides a basis for developing targeted ecological conservation strategies that prioritize maintaining a healthy ecosystem and minimizing human disturbance.

Author Contributions

Conceptualization, J.Y. and W.C.; methodology, W.C. and Q.L.; software, Y.W. and R.Y.; validation, H.Z., L.J. and J.H.; formal analysis, J.H.; investigation, Q.L.; resources, J.H.; data curation, Q.L.; writing—original draft preparation, J.Y. and Q.L.; writing—review and editing, Y.W.; visualization, L.J.; supervision, Y.W.; project administration, H.Z.; funding acquisition, Y.N. All authors have read and agreed to the published version of the manuscript.

Funding

This research was funded by the National Natural Science Foundation of China (42061069); a program for improving the Scientific Research Ability of Youth Teachers of Inner Mongolia Agricultural University (BR230108); and Key technology and application of ecological quality diagnosis and integrated management of “Beautiful Inner Mongolia” (2019GG010) and Research on the Spatial Resilience Pattern and Implementation Path Application of Inner Mongolia’s Yellow River Basin.

Institutional Review Board Statement

Not applicable.

Informed Consent Statement

Not applicable.

Data Availability Statement

The data presented in this study are available on request from the corresponding author; the data are not publicly available due to privacy.

Acknowledgments

We would like to express our gratitude to the editor and anonymous reviewers for their thorough review and valuable suggestions, which greatly improved our paper in all aspects.

Conflicts of Interest

The authors declare no conflicts of interest.

References

  1. Gao, L.; Bryan, B.A. Finding Pathways to National-Scale Land-Sector Sustainability. Nature 2017, 544, 217–222. [Google Scholar] [CrossRef]
  2. Mirzabaev, A.; Wuepper, D. Economics of Ecosystem Restoration. Annu. Rev. Resour. Econ. 2023, 15, 329–350. [Google Scholar] [CrossRef]
  3. Vignieri, S. The Benefits of Ecosystem Restoration. Science 2020, 368, 1201–1203. [Google Scholar] [CrossRef]
  4. Xin, Y.; Liu, X. Coupling Driving Factors of Eco-Environmental Protection and High-Quality Development in the Yellow River Basin. Front. Environ. Sci. 2022, 10, 951218. [Google Scholar] [CrossRef]
  5. Bai, X.; Zhang, Z.; Li, Z.; Zhang, J. Spatial Heterogeneity and Formation Mechanism of Eco-Environmental Quality in the Yellow River Basin. Sustainability 2023, 15, 10878. [Google Scholar] [CrossRef]
  6. Chi, W.; Wang, Y.; Dang, X.; Wu, X.; Luo, Q. Temporal Variation and Spatial Pattern of Soil Erosion in the Yellow River Basin. J. Desert Res. 2023, 43, 305–317. [Google Scholar]
  7. Qiu, M.; Zuo, Q.; Wu, Q.; Yang, Z.; Zhang, J. Water Ecological Security Assessment and Spatial Autocorrelation Analysis of Prefectural Regions Involved in the Yellow River Basin. Sci. Rep. 2022, 12, 5105. [Google Scholar] [CrossRef] [PubMed]
  8. Chen, F.; Huang, H.; Yang, G.; Li, X. Research on the Dynamic Change of the Ecological Environment and Its Influencing Factors in the Yellow River Basin Based on Remote Sensing Ecological Index. J. Desert Res. 2023, 43, 252–262. [Google Scholar]
  9. Hou, Y.; Xie, Z.; Tian, Y.; Jiang, J.; Liang, Y.; Wang, Q.; Fang, Q.; Xu, T.; Zhang, Y.; Li, H.; et al. Evolution Trend of Water Quality in the Lnner Mongolia Section of the Yellow River from 2003 to 2020. Environ. Sci. 2023, 1–12. [Google Scholar] [CrossRef]
  10. Gao, W.; Zhang, S.; Rao, X.; Lin, X.; Li, R. Landsat TM/OLI-Based Ecological and Environmental Quality Survey of Yellow River Basin, Inner Mongolia Section. Remote Sens. 2021, 13, 4477. [Google Scholar] [CrossRef]
  11. Li, T.; Zhang, Q.; Wang, G.; Singh, V.P.; Zhao, J.; Sun, S.; Wang, D.; Liu, T.; Duan, L. Ecological Degradation in the Inner Mongolia Reach of the Yellow River Basin, China: Spatiotemporal Patterns and Driving Factors. Ecol. Indic. 2023, 154, 110498. [Google Scholar] [CrossRef]
  12. Xu, J.; Wang, H.; Zhao, K.; Li, Z. Evaluation of Provincial Carbon-Neutral Capacities in the Yellow River Basin Using DPSIR. Sci. Rep. 2022, 12, 18180. [Google Scholar] [CrossRef] [PubMed]
  13. Tian, M.; Feng, C.; Wang, S.; Tian, Y.; Niu, X. Ecological Restoration of the Yellow River Basin in the Last 70 Years and Systematic Restoration Thinking. J. Environ. Eng. Technol. 2023, 13, 1787–1797. [Google Scholar] [CrossRef]
  14. Feng, X.; Fu, B.; Piao, S.; Wang, S.; Ciais, P.; Zeng, Z.; Lü, Y.; Zeng, Y.; Li, Y.; Jiang, X.; et al. Revegetation in China’s Loess Plateau Is Approaching Sustainable Water Resource Limits. Nat. Clim. Chang. 2016, 6, 1019–1022. [Google Scholar] [CrossRef]
  15. Bryan, B.A.; Gao, L.; Ye, Y.; Sun, X.; Connor, J.D.; Crossman, N.D.; Stafford-Smith, M.; Wu, J.; He, C.; Yu, D.; et al. China’s Response to a National Land-System Sustainability Emergency. Nature 2018, 559, 193–204. [Google Scholar] [CrossRef] [PubMed]
  16. Deng, X.; Hu, S.; Zhan, C. Attribution of Vegetation Coverage Change to Climate Change and Human Activities Based on the Geographic Detectors in the Yellow River Basin, China. Environ. Sci. Pollut. Res. Int. 2022, 29, 44693–44708. [Google Scholar] [CrossRef] [PubMed]
  17. Liu, T.; Zhang, Q.; Li, T.; Zhang, K. Dynamic Vegetation Responses to Climate and Land Use Changes over the Inner Mongolia Reach of the Yellow River Basin, China. Remote Sens. 2023, 15, 3531. [Google Scholar] [CrossRef]
  18. Zhang, X.; Wang, G.; Xue, B.; Wang, Y.; Wang, L. Spatiotemporal Variation of Evapotranspiration on Different Land Use/Cover in the Inner Mongolia Reach of the Yellow River Basin. Remote Sens. 2022, 14, 4499. [Google Scholar] [CrossRef]
  19. Jiang, X.; Wang, G.; Wang, Y.; Yao, J.; Xue, B.; A, Y. A Hybrid Framework for Simulating Actual Evapotranspiration in Data-Deficient Areas: A Case Study of the Inner Mongolia Section of the Yellow River Basin. Remote Sens. 2023, 15, 2234. [Google Scholar] [CrossRef]
  20. Hu, H.; Tian, G.; Wu, Z.; Xia, Q. Cross-Regional Ecological Compensation under the Composite Index of Water Quality and Quantity: A Case Study of the Yellow River Basin. Environ. Res. 2023, 238, 117152. [Google Scholar] [CrossRef]
  21. Yun, J.; Liu, H.; Xu, Z.; Cao, X.; Ma, L.; Wen, L.; Zhuo, Y.; Wang, L. Assessing Changes in the Landscape Pattern of Wetlands and Its Impact on the Value of Wetland Ecosystem Services in the Yellow River Basin, Inner Mongolia. Sustainability 2022, 14, 6328. [Google Scholar] [CrossRef]
  22. Zhang, H.; Zhang, J.; Lv, Z.; Yao, L.; Zhang, N.; Zhang, Q. Spatio-Temporal Assessment of Landscape Ecological Risk and Associated Drivers: A Case Study of the Yellow River Basin in Inner Mongolia. Land 2023, 12, 1114. [Google Scholar] [CrossRef]
  23. Potter, C.S.; Randerson, J.T.; Field, C.B.; Matson, P.A.; Vitousek, P.M.; Mooney, H.A.; Klooster, S.A. Terrestrial Ecosystem Production: A Process Model Based on Global Satellite and Surface Data. Glob. Biogeochem. Cycles 1993, 7, 811–841. [Google Scholar] [CrossRef]
  24. Chi, W.; Zhao, Y.; Kuang, W.; He, H. Impacts of Anthropogenic Land Use/Cover Changes on Soil Wind Erosion in China. Sci. Total Environ. 2019, 668, 204–215. [Google Scholar] [CrossRef] [PubMed]
  25. Fryrear, D.W.; Krammes, C.A.; Williamson, D.L.; Zobeck, T.M. Computing the Wind Erodible Fraction of Soils. J. Soil Water Conserv. 1994, 49, 183–188. [Google Scholar]
  26. Zhang, W.; Xie, Y.; Liu, B. Rainfall Erosivity Estimation Using Daily Rainfall Amounts. Sci. Geogr. Sin. 2002, 22, 705–711. [Google Scholar]
  27. McCool, D.K.; Foster, G.R.; Mutchler, C.K.; Meyer, L.D. Revised Slope Length Factor for the Universal Soil Loss Equation. Trans. ASAE 1989, 32, 1571–1576. [Google Scholar] [CrossRef]
  28. Cai, C.; Ding, S.; Shi, Z.; Huang, L.; Zhang, G. Study of Applying USLE and Geographical Information System lDRlSl to Predict Soil Erosion in Small Watershed. J. Soil Water Conserv. 2000, 2, 19–24. [Google Scholar] [CrossRef]
  29. Ren, S.; Li, Y.; Peichl, M. Diverse Effects of Climate at Different Times on Grassland Phenology in Mid-Latitude of the Northern Hemisphere. Ecol. Indic. 2020, 113, 106260. [Google Scholar] [CrossRef]
  30. Zhao, G.; Liu, J.; Kuang, W.; Ouyang, Z.; Xie, Z. Disturbance Impacts of Land Use Change on Biodiversity Conservation Priority Areas across China: 1990–2010. J. Geogr. Sci. 2015, 25, 515–529. [Google Scholar] [CrossRef]
  31. Wu, C.; Chen, B.; Huang, X.; Dennis Wei, Y.H. Effect of Land-Use Change and Optimization on the Ecosystem Service Values of Jiangsu Province, China. Ecol. Indic. 2020, 117, 106507. [Google Scholar] [CrossRef]
  32. Yuan, Y.; Wang, M.; Zhu, Y.; Huang, X.; Xiong, X. Urbanization’s Effects on the Urban-Rural Income Gap in China: A Meta-Regression Analysis. Land Use Policy 2020, 99, 104995. [Google Scholar] [CrossRef]
  33. Fang, J.; Xiong, K.; Chi, Y.; Song, S.; He, C.; He, S. Research Advancement in Grassland Ecosystem Vulnerability and Ecological Resilience and Its Inspiration for Improving Grassland Ecosystem Services in the Karst Desertification Control. Plants 2022, 11, 1290. [Google Scholar] [CrossRef]
  34. Nandintsetseg, B.; Boldgiv, B.; Chang, J.; Ciais, P.; Davaanyam, E.; Batbold, A.; Bat-Oyun, T.; Stenseth, N.C. Risk and Vulnerability of Mongolian Grasslands under Climate Change. Environ. Res. Lett. 2021, 16, 034035. [Google Scholar] [CrossRef]
  35. Yang, S.; Hao, Q.; Liu, H.; Zhang, X.; Yu, C.; Yang, X.; Xia, S.; Yang, W.; Li, J.; Song, Z. Impact of Grassland Degradation on the Distribution and Bioavailability of Soil Silicon: Implications for the Si Cycle in Grasslands. Sci. Total Environ. 2019, 657, 811–818. [Google Scholar] [CrossRef]
  36. Bardgett, R.D.; Bullock, J.M.; Lavorel, S.; Manning, P.; Schaffner, U.; Ostle, N.; Chomel, M.; Durigan, G.; Fry, E.L.; Johnson, D.; et al. Combatting Global Grassland Degradation. Nat. Rev. Earth Environ. 2021, 2, 720–735. [Google Scholar] [CrossRef]
  37. Chi, W.; Wang, Y.; Lou, Y.; Na, Y.; Luo, Q. Effect of Land Use/Cover Change on Soil Wind Erosion in the Yellow River Basin since the 1990s. Sustainability 2022, 14, 12930. [Google Scholar] [CrossRef]
  38. Zhao, H.; Feng, S.; Dang, X.; Meng, Z.; Chen, Z.; Gao, Y. Wind Regime and Sand Transport in the Mid-Course of Ten Tributaries of the Yellow River, Inner Mongolia of China. Front. Environ. Sci. 2023, 11, 123392. [Google Scholar] [CrossRef]
  39. Tian, T.; Yang, Z.; Guo, J.; Zhang, T.; Wang, Z.; Miao, P. Spatiotemporal Evolution of Soil Erosion and Its Driving Mechanism in the Mongolian Section of the Yellow River Basin. Land 2023, 12, 801. [Google Scholar] [CrossRef]
  40. Xie, J.; Lu, Z.; Xiao, S.; Yan, C. The Latest Desertification Process and Its Driving Force in Alxa League from 2000 to 2020. Remote Sens. 2023, 15, 4867. [Google Scholar] [CrossRef]
  41. Tseng, S.-W. Analysis of Energy-Related Carbon Emissions in Inner Mongolia, China. Sustainability 2019, 11, 7008. [Google Scholar] [CrossRef]
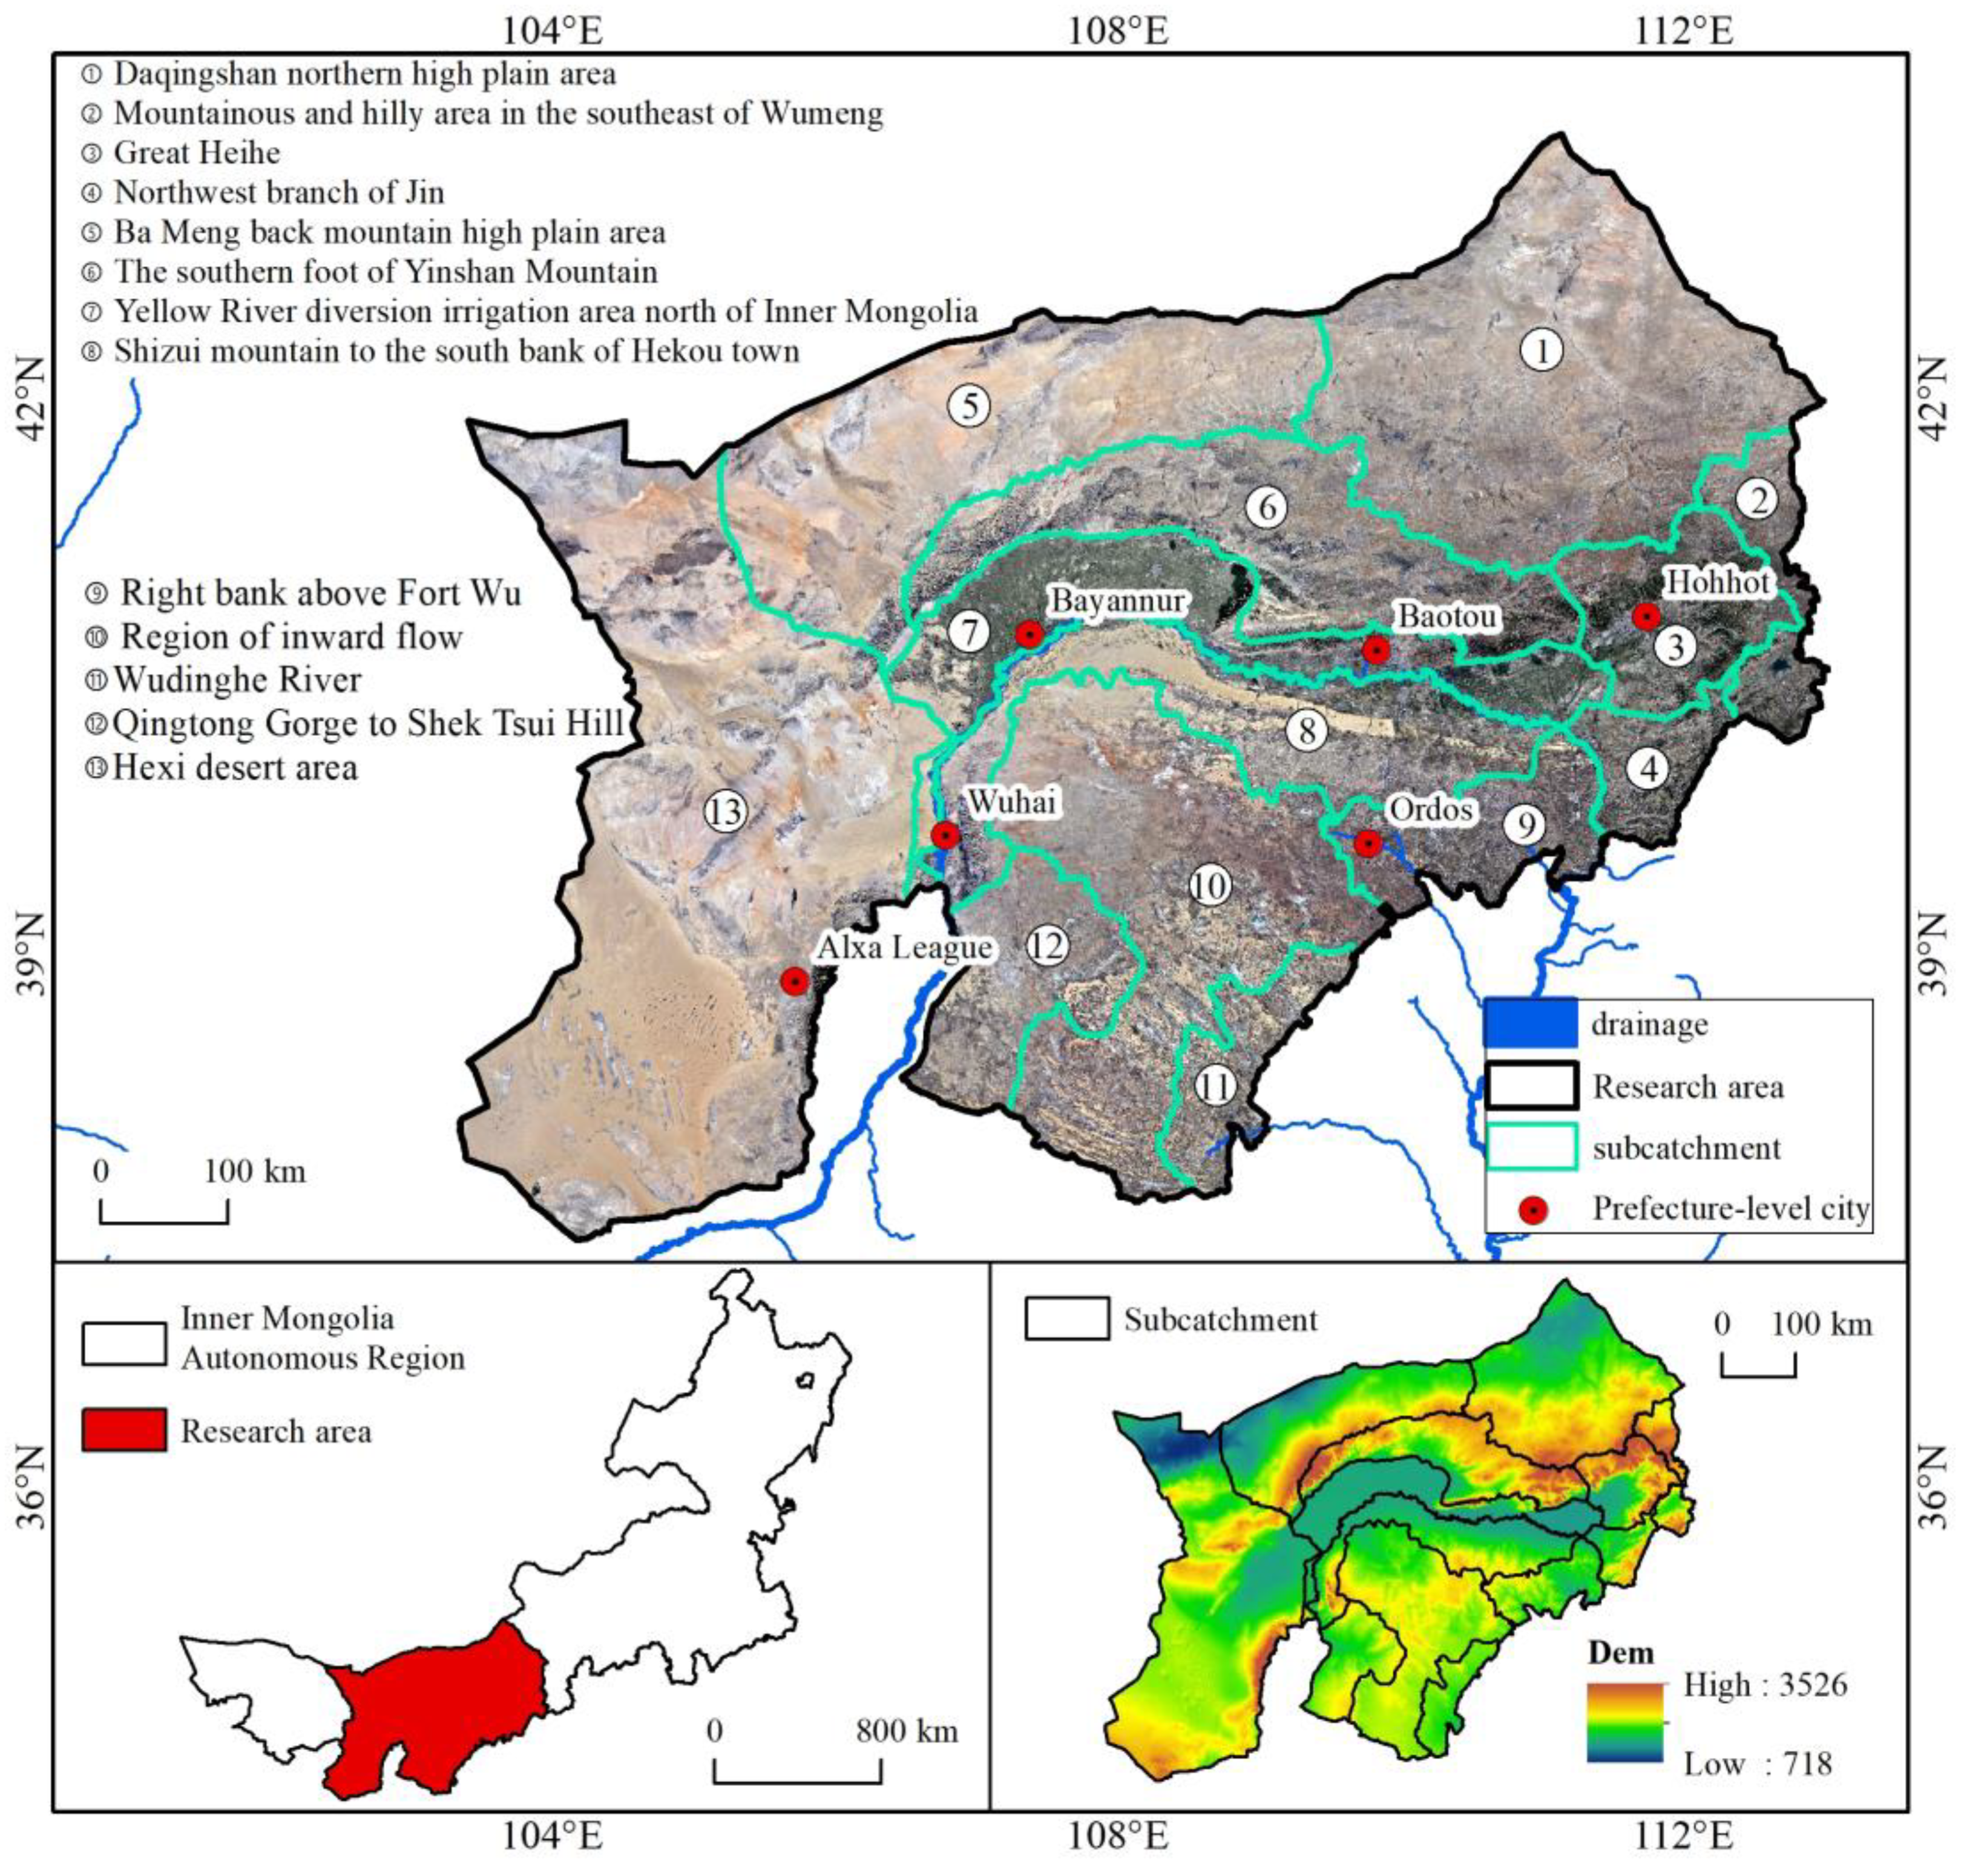
Figure 1. Research location map.
Atmosphere 15 00827 g001
Figure 2. Changes in the macrostructure of the ecosystem from 2010 to 2020.
Atmosphere 15 00827 g002
Figure 3. Status of and changing trends in ecosystem quality.
Atmosphere 15 00827 g003
Figure 4. Variation trends in soil wind and water erosion and total erosion in sub-basins.
Atmosphere 15 00827 g004
Figure 5. Changes in human disturbance index and data from meteorological stations.
Atmosphere 15 00827 g005
Figure 6. Regional ecosystem services and changes.
Atmosphere 15 00827 g006
Table 2. Human disturbance index classification.
CategoryNatural UnutilizedNaturally RegeneratedAnthropogenically RegeneratedAnthropogenic Non-Renewable
Ecosystem
Type
Other landForest Land,
meadow,
wetland
PlowlandArtificial surface
Disturbance Grading Index0123
Table 3. Ecosystem composition characteristics in 2010 and 2020.
YearStatistical IndicatorForest LandMeadowWetlandPlowlandArtificial SurfaceOther Land
2010Area (km2)28,469.52192,236.68 3669.90 25,070.00 5905.01 54,606.32
Proportion (%)9.18%62.02%1.18%8.09%1.91%17.62%
2020Area (km2)38,857.36177,690.01 2176.98 29,568.01 8868.52 52,186.76
Proportion (%)12.56%57.44%0.70%9.56%2.87%16.87%
Table 4. Ecosystem transfer matrix during 2010–2020.
Type (2010)Type (2020)
Forest Land
(km2)
Meadow (km2)Wetland (km2)Plowland (km2)Artificial Surface (km2)Other Land (km2)
Forest Land14,477.2011,687.93117.401220.10516.83621.66
Meadow19,877.41152,429.161160.334304.772486.2613,205.27
Wetland66.89265.282966.5509.93164.59509.93
Plowland1409.02392.28544.6122,653.76691.2196.02
Artificial Surface375.631321.57160.29483.853118.43184.24
Other Land2774.6112,420.66805.631012.85385.2237,919.59
Table 5. Average values and change trends in ecosystem quality indicators in Mongolia section of the Yellow River Basin from 2000 to 2020.
Basin/Sub-RegionNDVIFVCNPP
AverageSlopeAverage %Slope (% a−1)AverageSlope
Northwest Shanxi Tributary0.51 0.009 54.46 0.010 137.57 6.045
Hexi Desert Region0.13 0.002 5.04 0.002 2.50 0.087
Endorheic Area0.29 0.005 26.03 0.005 45.68 1.929
Wuding River0.34 0.007 33.12 0.008 67.56 3.430
Qingtongxia to Shizuishan0.28 0.005 24.55 0.006 39.64 1.623
Shizuishan to Hekouzhen Southern Bank0.29 0.005 25.690.006 43.76 1.831
North Yellow River Diversion Irrigation Area in Inner Mongolia0.51 0.006 54.80 0.007 103.37 2.605
Yinshan Southern Foothills0.30 0.004 27.49 0.004 53.41 1.612
Dahei River0.57 0.007 62.42 0.007 187.52 5.697
Bayan Nur Mountain High Plateau0.14 0.001 6.98 0.001 2.50 0.072
Northern Daqing Mountain High Plateau0.28 0.004 24.90 0.004 45.13 1.430
Ulanqab Southeastern Mountain and Hill Area0.50 0.006 53.31 0.006 145.36 4.725
Above Wubao Right Bank0.41 0.010 41.43 0.012 84.40 4.677
Overall Average0.27 0.004 23.42 0.004 44.36 1.577
Table 6. Statistics on and changes in wind and sand fixation and soil conservation from 2000 to 2020.
Basin/Sub-RegionUnit Area Wind Erosion ModulusWind Erosion Unit Area Water Erosion ModulusActual Water Erosion
AverageSlope(10,000 tons)AverageSlope(10,000 tons)
Northwest Shanxi Tributary0.45 −0.034 24.62 1585.86 −44.430 86,672.44
Hexi Desert Region74.09 −3.511 58,319.58 178.31 0.098 140,361.30
Endorheic Area16.79 −0.611 6281.72 177.45 0.525 66,408.47
Wuding River6.12 −0.152 447.39 102.04 −1.010 7459.77
Qingtongxia to Shizuishan6.35 −0.365 792.87 159.13 2.073 19,858.04
Shizuishan to Hekouzhen Southern Bank44.25 −1.464 9367.30656.33 −1.770 138,925.75
North Yellow River Diversion Irrigation Area in Inner Mongolia36.43 −1.566 7483.84 296.51 −5.112 60,912.55
Yinshan Southern Foothills11.97 −0.468 2923.69 895.17 −2.955 218,639.03
Dahei River1.91 −0.052 210.61 594.23 −11.153 65,559.37
Bayan Nur Mountain High Plateau88.51 −3.335 30,341.62 234.97 0.579 80,550.20
Northern Daqing Mountain High Plateau16.27 −0.661 7139.57 248.11 −0.806 108,875.08
Ulanqab Southeastern Mountain and Hill Area2.95 −0.068 181.05 634.21 −7.868 38,856.92
Above Wubao Right Bank1.03 −0.059 105.25 1145.70 −26.655 116,655.48
Overall Average39.48 −1.675 961,414.81 367.25 −2.774 1,149,623.36
Table 7. Driving factors and statistics of ecosystem change during 2010–2020.
Basin/Sub-RegionHuman Disturbance IndexTemperature (°C)Precipitation (mm)
20102020ChangeAverageSlopeAverageSlope
Northwest Shanxi Tributary0.4390.4420.0025.8150.022373.8963.562
Hexi Desert Region0.2070.194−0.0138.6030.020139.5811.191
Endorheic Area0.2920.3230.0307.7300.018303.1712.762
Wuding River0.3220.3540.0328.3360.012382.0753.112
Qingtongxia to Shizuishan0.3100.3330.0248.2690.012263.4582.660
Shizuishan to Hekouzhen Southern Bank0.3170.3640.0477.4280.023271.5442.902
North Yellow River Diversion Irrigation Area in Inner Mongolia0.5010.5470.0477.6170.026214.1782.602
Yinshan Southern Foothills0.3300.3430.0135.3020.028251.7113.284
Dahei River0.4660.4690.0034.5380.027313.5123.225
Bayan Nur Mountain High Plateau0.2910.2930.0026.7970.029137.1181.785
Northern Daqing Mountain High Plateau0.3590.3680.0094.9020.027217.5643.217
Ulanqab Southeastern Mountain and Hill Area0.4300.4490.0194.1650.024326.4072.709
Above Wubao Right Bank0.3830.4020.0197.1090.026390.3853.865
Overall Average0.3120.3240.0127.0140.023224.7512.426
Disclaimer/Publisher’s Note: The statements, opinions and data contained in all publications are solely those of the individual author(s) and contributor(s) and not of MDPI and/or the editor(s). MDPI and/or the editor(s) disclaim responsibility for any injury to people or property resulting from any ideas, methods, instructions or products referred to in the content.