Article

Diversity Analysis of Fungi Distributed in Inhalable and Respirable Size Fractions of Aerosols: A Report from Kuwait

1
Environment and Life Science Research Centre, Kuwait Institute for Scientific Research, Safat 13109, Kuwait
2
Department of Biochemistry and Medical Genetics, University of Manitoba, Winnipeg, MB R3B 2E9, Canada
3
Department of Microbiology, Faculty of Medicine, Kuwait University, Jabriya 24923, Kuwait
*
Author to whom correspondence should be addressed.
Atmosphere 2024, 15(7), 806; https://doi.org/10.3390/atmos15070806
Submission received: 15 May 2024 / Revised: 25 June 2024 / Accepted: 3 July 2024 / Published: 4 July 2024

Abstract

:
Fungi are an important part of the atmospheric ecosystem yet an underexplored group. Airborne pathogenic fungi are the root cause of hypersensitive and allergenic states highly prevalent in Kuwait. Frequent dust storms in the region carry them further into the urban areas, posing an occupational health hazard. The fungal population associated with the respirable (more than 2.5 µm) and inhalable (2.5 µm and less) fractions of aerosols is negligibly explored and warrants comprehensive profiling to pinpoint tAhe health implications. For the present investigation, aerosol was collected using a high-volume air sampler coupled with a six-stage cascade impactor (Tisch Environmental, Inc) at a rate of 566 L min−1. The samples were lysed, DNA was extracted, and the internal transcribed regions were sequenced through targeted amplicon sequencing. Aspergillus, Penicillium, Alternaria, Cladosporium, Fusarium, Gleotinia and Cryptococcus were recorded in all the size fractions with mean relative abundances (RA%) of 17.5%, 12.9%, 12.9%, 4.85%, 4.08%, 2.77%, and 2.51%, respectively. A weak community structure was associated with each size fraction (ANOSIM r2 = 0.11; p > 0.05). The Shannon and Simpson indices also varied among the respirable and inhalable aerosols. About 24 genera were significantly differentially abundant, as described through the Wilcoxon rank sum test (p < 0.05). The fungal microbiome existed as a complex lattice of networks exhibiting both positive and negative correlations and were involved in 428 functions. All the predominant genera were pathogenic, hence, their presence in inhalable fractions raises concerns and poses an occupational exposure risk to both human and non-human biota. Moreover, long-range transport of these fungi to urban locations is undesirable yet plausible.

1. Introduction

Fungi are an integral part of the aerosol microbiome. Some of them are major pathogens and allergens, making a positive correlation between airborne fungi and respiratory illnesses [1]. Exposure to fungal aerosols has led to incidences of nasal and pharyngeal mucous membrane irritations, skin dryness, itchy eyes, breathlessness, wheezing, headache, fatigue and at times fatal illnesses [2]. Records of allergenic rhinitis and bronchial asthma have been reported at a higher frequency in the past few decades. This has raised a worldwide concern and several international societies such as the European Academy of Allergy and Clinical Immunology, the European Respiratory Society and the World Allergy Organization have called for the identification of these fungal communities [3].
Most of the studies so far have looked at airborne fungi in urban settings because the human population globally is concentrated in cities [1]. Even though long-range transport of the finer particles carrying fungi to metropolitan areas from distant locations is known [4,5], reports on fungal biomes from non-urban settings are relatively scarce. In addition to this, fungi from agricultural lands are aerosolized and cause occupational health hazards to the farmers upon inhalation [6,7]. Not only humans but also animals are at risk of inhaling these fungi. Fungi such as Aspergillus sp. and Penicillium were found in rural and residential areas of Ho Chi Minh City, Vietnam [8]. Fungi pollen and plant detritus accounted for 24–33% of organic fraction and 11–15% of the total mass of particulate matter in PM10 in an agricultural town in California, USA [9]. Hence, the characterization of the air mycobiome of non-urban areas remains an important area of investigation.
With the advancement in next-generation sequencing technologies, there has been significant progress in the assessment of microbial communities [10,11]. The targeted amplicon sequencing allows for mapping the entire taxonomic profile within a complex matrix [12,13,14]. Although the low biological content in air samples makes the entire process challenging, the high-precision master mixes make it possible to capture even the tiniest load [15,16]. Continental-scale distributions of dust-associated fungi were detected through targeted metagenomic sequencing [4]. Further, it is not known if these exist in a free-floating form or as a bioaerosol conjugate. These are the questions that need further investigation.
Kuwait is reported to have a high dust loading of a maximum of 1400 mg m−3 [17]. Dust-associated fungi are linked to higher incidences of allergies in the population [18,19]. In Kuwait, the non-urban locations observe a heavy dust fall-out and winds locally known as Toz transmit the bioaerosol-laden dust to the urban areas. Besides the occupational risk, increased pollen counts have been directly correlated with higher hospital admissions in Kuwait [20]. Few attempts have been made previously to characterize the dust-associated microbes; however, these studies mainly concentrated on the bacterial communities [13]. The presence of fungi in inhalable size fractions might lead to serious health implications. In the present investigation, we explored the mycobiome of six aerosol-sized fractions collected from an agricultural (non-urban setting) area and characterized through fungal ITS sequencing to study its diversity and distribution in the inhalable (2.5 µm and less) and respirable (more than 2.5 µm) aerosol fractions.

2. Materials and Methods

2.1. Sampling Site

Kuwait at the northeastern edge of the Arabian Peninsula, is a hyper-arid country bordering Iraq to the north and Saudi Arabia to the south. Because of its hyper-aridity, low vegetation cover, scarce precipitation, and frequent sandstorms, Kuwait forms part of the regional wind corridor, resulting in the transboundary transport of dust and associated microbial population into and from Kuwait. Considering the dominant northwest–southeast wind direction in Kuwait, a site in Abdally (30.05 N 47.71 E; 21 m above sea level) was selected where the air mass from the north enters Kuwait. A 1.2 m tall high-volume air sampler (HVAS) equipped with a six-stage cascade impactor, from Tisch Environment (Cleves, OH, USA), was placed on a private farm in the Abdally region and a 24 h integrated sample was collected. The agricultural farm, where the sampler was placed, grows vegetables like tomato, cucumber, spinach, lettuce, and capsicum in the greenhouse only. The sample details have been provided in Supplementary Table S1. Meteorological parameters such as temperature, humidity, wind speed, pressure and visibility on the date of sample collection were retrieved from the Kuwait Meteorological Centre.

2.2. DNA Isolation and Amplicon Polymerase Chain Reactions

Whole genomic DNA was isolated from the collected aerosol-impregnated filters, employing the Wizard® Genomic DNA Purification kit (Promega, Madison, WI, USA) [13]. In general, DNA yield was low, as quantified through the Qubit ds HS DNA assays on a Qubit 3.0 (Invitrogen, Waltham, MA, USA). The ITS1 and ITS2 primers ligated with Illumina adapters (Supplementary Table S2) were used to amplify the targeted region from the isolated DNA [12]. The polymerase chain reaction (PCR) was assembled in a volume of 25 μL (2.5 μL of template DNA; 12.5 μL of 2× KAPA HiFi HotStart ReadyMix, Kapa Biosystems, Boston, MA, USA; 5 μL each of forward and reverse primer). A known concentration of Saccharomyces cerevisiae (1 ng/μL) was run along with the samples to rule out PCR inhibition, and negative control (nuclease-free water) was used to check for cross-contamination. The reaction was carried out in Veriti Thermal Cyclers (Applied Biosystems, Grand Island, NY, USA) with initial activation of the DNA polymerase at 95 °C for 3 min, followed by 35 cycles each for 30 s at 95 °C, 55 °C, and 72 °C with a final extension step at 72 °C for 5 min. The PCR products were visualized on 1.8% agarose gel at 8 V/cm for 1 h. Gel images were documented using the gel documentation system (Chemidoc MP, BioRad, Hercules, CA, USA). Only the positive bands were processed for further downstream analysis.

2.3. Targeted Amplicon (ITS3-ITS4) Sequencing and Analysis

DNA sequencing libraries were prepared from the PCR products as described in Al Salameen et al. [12]. The NEBNext Ultra DNA library preparation kit (New England BioLabs, Évry-Courcouronnes, France) was used for this purpose and the kit protocol was followed throughout the library construction step. The library quantification and quality estimation were carried out in Agilent 2200 TapeStation (Santa Clara, CA, USA). The prepared library was sequenced in Illumina HiSeq 2500 (San Diego, CA, USA) with 2 × 250 cycle chemistry. The raw reads were demultiplexed and quality-checked using FastQC (version 0.11.8). In-house PERL scripts were used to trim the primers. The reads were merged to yield contigs between 350 and 450 bp using the FLASH program (version 1.2.11). Chimera removal was carried out through the de novo chimera removal tool available in UCHIME (version 11) and implemented in VSEARCH. Pre-processed reads from all samples were pooled and clustered into operational taxonomic units (OTUs) based on their sequence similarity by the Uclust program (similarity cutoff = 0.97) available in QIIME (Version 1.9.1) queried against the Greengenes 13_8 taxonomy classifier [21]. OTUs with less than 5 reads were removed, and the remaining OTUs (~2200) were selected for subsequent analysis [12].

2.4. Taxonomic Profiling and Diversity Analysis

All the data visualization and statistical analysis were performed in the web version of MicrobiomeAnalyst2 [22]. OTUs of ≥ 2 counts, sample prevalence of 20%, and inter-quartile range of 10% were chosen for taxonomic classification. The median abundances of the filtered genera (Wilcoxon rank test (p < 0.05) was presented on a differential tree. The core fungal microbiome was generated on genera exhibiting a sample prevalence > 20% and RA > 0.01. Observed and Shannon indices were estimated as indicators of alpha diversity. Pairwise comparisons of both indices were carried out through ANOVA (analysis of variance) at a p-value cut-off set <0.05 [23]. The permutational multivariate analysis of variance (PERMANOVA) and analysis of similarities (ANOSIM) statistical approaches on Bray–Curtis distances were applied for the principal coordinate analysis (PCoA) [24]. The SPARCC correlation network analysis employed Spearman’s correlation test (threshold 0.3, 100 permutations) [25]. A microbial dysbiosis index was also calculated between the six size ranges [26]. Filtered OTUs from QIIME were run through the FunFun tool [27] to obtain a functional profile of each OTU and were visualized through the Microbiome Analyst v 2.0. Simple linear regression between the environmental variables and relative abundances was performed in the GraphPad Prism 10. The sequences generated in this investigation have been deposited to the National Centre for Biotechnology Information under the accession numbers SRR23991706 and SRR23991728.

3. Results

3.1. Meteorological Factors

Environmental parameters are supposed to affect the overall microbial diversity. Hence, temperature, humidity, air pressure and visibility were recorded for the sampling period (Figure 1). November and February were colder and the humidity was higher compared to other sampling days. The wind speed was 14.20 ± 4.6 km/h, 7.71 ± 1.25 km/h, 12.5 ± 5.10 km/h, 30.29 ± 7.57 km/h and 16.29 ± 5.94 km/h on 14 November 2017, 5 February 2018, 24 July 2018, 6 August 2018 and 9 September 2018, respectively. The dominant wind direction was southeast on all the sampling days except on 6 August 2018 where the wind rose in a northwest direction. Visibility was high around 10 km on all the sampling days except 6 August 2018 (6 ± 3.2 km). The barometric pressure was ~1020 mbar during November and February sampling; however, it was ~1000 mbar during July, August and September sampling days. The average aerosol loading with each size fraction was 0.01 ± 0.01 gm (Stage 1), 0.01 ± 0.00 gm (Stage 2), 0.02 ± 0.01 gm (Stage 3), 0.02 ± 0.01 gm (Stage 4), 0.01 ± 0.01 gm (Stage 5) and 0.36 ± 0.15 gm (Stage 6). As evident from the above values, the highest aerosol loading was recorded in the Stage 6 filter on all sampling days.
A total of 30 samples were processed for PCR amplification; despite the known ambiguity in air sample integrity, 23 produced clear bands of ca. 500 bp size. In addition, the forceful impact of air particulate matter by the high-volume samples further compromises the biological entirety. Therefore, the samples without an amplification product were excluded from the study. High-quality libraries of 23 samples were successfully sequenced. Targeted amplicon sequencing produced paired-end reads ranging from 212,151 to 852,198 (Supplementary Table S3). The total data produced was 5.4 GB (average 236 Mb per sample). The mean GC content of each sample was 52.7% and the Phred score was 35. Only 2.8% of sequences had a score < Q10. Approximately, 84% (>Q30) of data were usable for downstream processing. Chimera removal and operational taxonomic unit (OTU) picking from the consensus sequences (3,260,711) resulted in 131,998 OTUs. Further filtering (<5 reads) yielded 7548 OTUs. An additional cut-off of removing OTUs in less than 2 samples returned 393 OTUs that were used for taxonomic profiling and statistical analysis.

3.2. Taxonomic Composition, Core Fungal Mycobiome and Dominant Fungal Genera in Six-Size Fractions

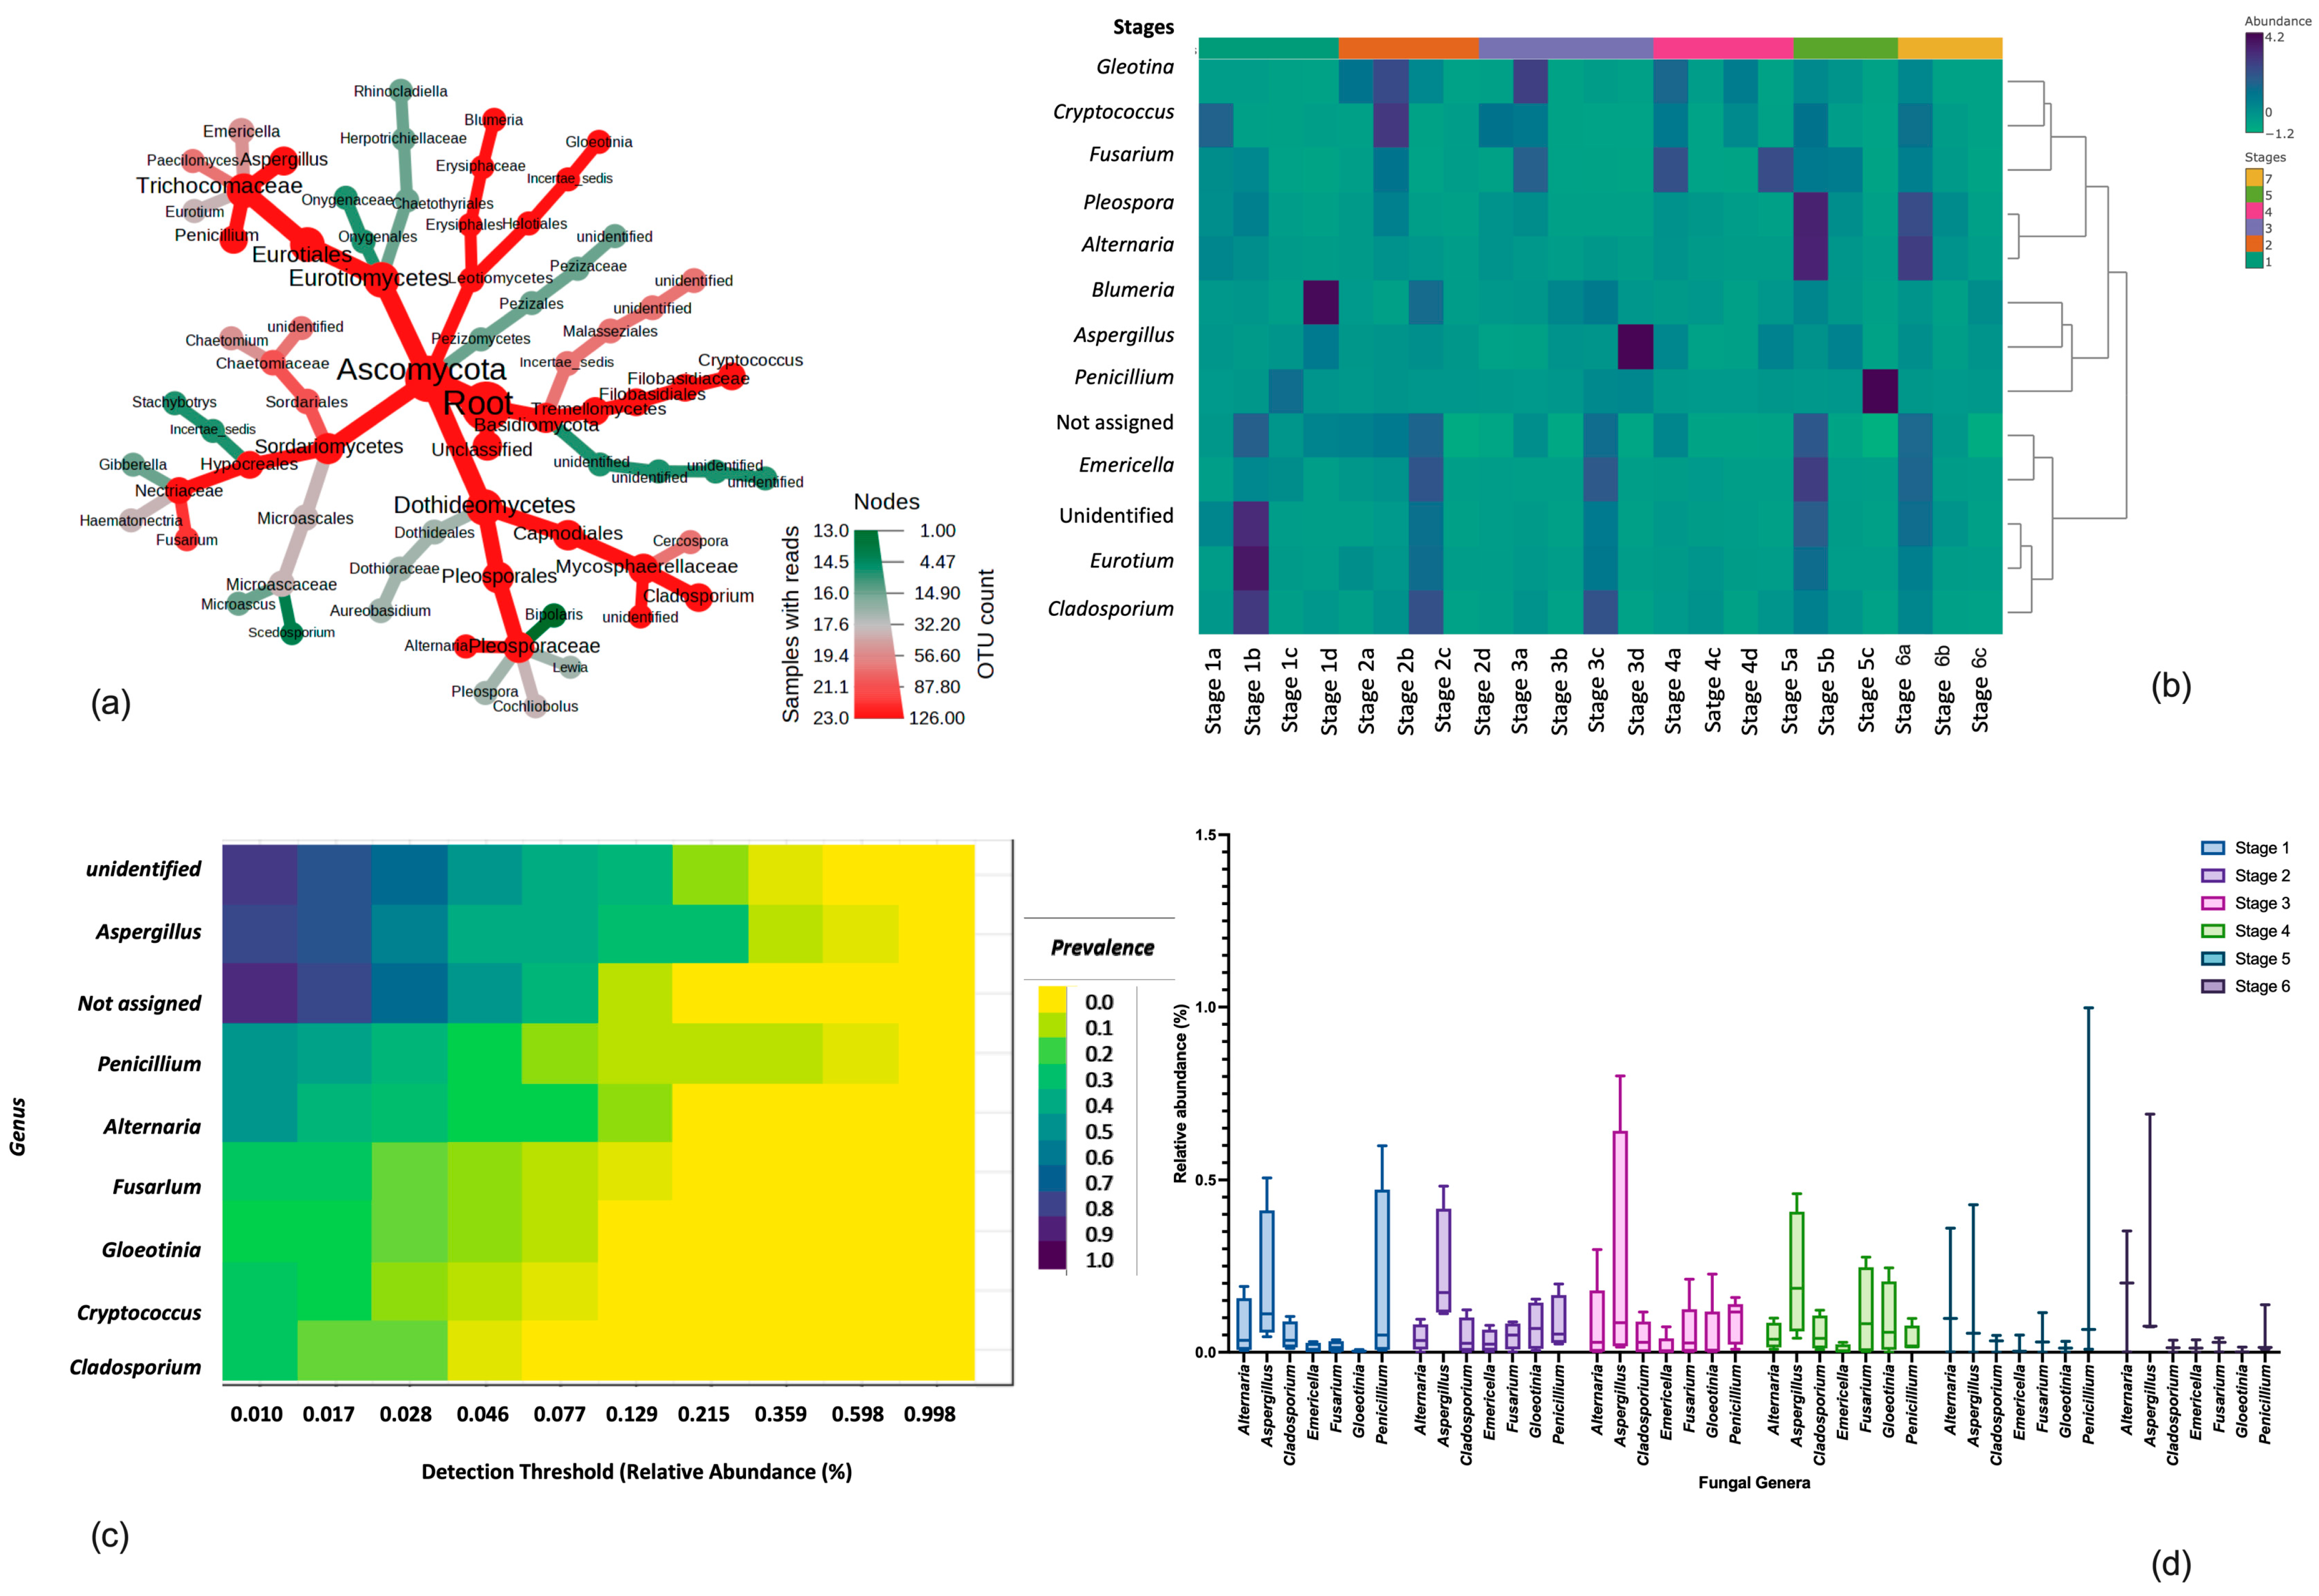
Binning of sequences against the GreenGenes database was carried out to obtain a genus-level classification of the fungal domain. The fungal community was largely represented by the phyla Ascomycota (90.68%). Two other phyla recorded in low abundances were Basidiomycota (3.5%) and Zygomycota (0.001%). These phyla branched into the major classes of Eurotiomycetes, Sordariomycetes, and Dothideomycetes, and further classified into order Eurotiales, Erysiphales, Haloniales, Malassezials, Filobasiosidiales, Capnodiales, Pleosporales, and Hypocreales. The highly prevalent families were Trichomaceae, Erisiphaceae, Mycosphaerellaceae, Pleosporaceae and Nectriaceae (Figure 2a). In total, 50 classified genera were identified (Supplementary Table S4). Although a significant proportion (23.82%) of genera remained unclassified and unassigned, the most common genera were Aspergillus (17.5%), followed by Penicillium (12.9%), Alternaria (12.9%), Cladosporium (4.85%), Fusarium (4.08%), Gloeotinia (2.77%), Emericella (2.63%) and Cryptococcus (2.51%). The remaining were categorized as rare fungi with RA% < 0.5%. The RA% of the recorded genera varied in all the samples and among the size fractions (Figure 2b). The classified seven genera formed a part of the core mycobiome, recording their presence in >50% of samples with a prevalence ranging from 0.1 to 1.0, where 0.1 is 10% and 1.0 is 100% (Figure 2c).
Our observations on the genera distribution in different size fractions revealed that the dominant genera were consistent in all the size fractions, but their RA% varied (Supplementary Table S5). Log10 of relative abundances of seven dominant genera are plotted on the y-axis of Figure 2d. Among the seven selected genera, the mean abundances of Alternaria, Aspergillus, Fusarium, Gloeotinia and Penicillium varied widely as compared to Cladosporium and Emericella. For example, Alternaria was 0.07, 0.04, 0.08, 0.05, 0.15 and 0.18 in Stages 1, 2 3, 4, 5 and 6, respectively. Similarly, Aspergillus was 0.19, 0.24. 0.28, 0.22, 0.16 and 0.28 from Stages 1–6. The RA % recorded for Fusarium were 0.02, 0.05, 0.06, 0.11, and 0.05. In the case of Gloeotinia the RA% were 0.00 (stage 1), 0.07 (stage 2), 0.05 (stage 3), 0.09 (stage 4), 0.01 (stage 5), and 0.01 (stage 6). Penicillium was high in Stage 1 (0.18) and Stage 5 (0.36), and low in Stages 2 (0.08), 3 (0.09), 4 (0.04), and 6 (0.05). Cladosporium was slightly stable with RA% of 0.05, 0.04, 0.04, 0.05, 0.03, and 0.02 with descending order of size fractions. A similar trend was followed by Cryptococcus, exhibiting RA% of 0.01, 0.03, 0.02, 0.01, 0.02, and 0.02 from Stages 1 to 6. We compared the RA% of dominant genera individually in different size fractions by one-way analysis of variance (ANOVA) and found none of the pairs to be significant (p > 0.05). This suggests that the dominant fungal forms are consistently present in all the size fractions with minimal variations in their RA %, which is most likely attributed to the complex interactions with other genera with RA < 0.01%.

3.3. Differential Abundance between Different Size Fractions

To further confirm this hypothesis, we conducted differential abundance testing, employing the Wilcoxon sum test on median abundances of all the detected genera. We found that several low abundances (median diff RA% ranging from −0.002 to 0.003; mean diff RA% ranging from −0.002 to 0.003) in taxa varied (Wilcoxon p, 0.05) between different size fractions (Table 1). None of the phyla varied among the sizes. The single class, Saccharomycetes, differed between Stages 2–4 and 2–1. At the order level, Incertae sedis (1-4) and Saccharomycetales (2-3) were differentially abundant. The families of Glomerellaceae, Clavicipitaceae, Hypocreaceae, and Incertae sedis were variable between Stages 1–4, 5–4; 5–4, 5–3; 2–4; and 2–1, 2–3, respectively. The genera Glomerella (1-4, 5-4), Pseudallescheria (3-1), Beauveria (5-4; 5-3), Trichoderma (2-4) and Candida (2-1, 2-3) exhibited differential abundance. The species of Colletotrichum gloeosporioides (1-4; 5-4), Candida sp_F15 (1-4), Cercospora capsica (6-4), Pseudallescheria fimeti (3-1), Chaetomium sp_CBS_123294 (3-1) and Beauveria bassiana (5-4; 5-3) were also different between the size fractions. Except for Stage 4, none of the taxa differed between 1–6, 2–6, 3–6, and 5–6. Importantly the unidentified and unassigned genera cannot be ignored that did not receive any classification and might be some cryptic forms with functions not yet known. The findings were corroborated by hierarchical clustering analysis (Supplementary Figure S1).

3.4. Species Richness and Community Structure of the Mycobiomes

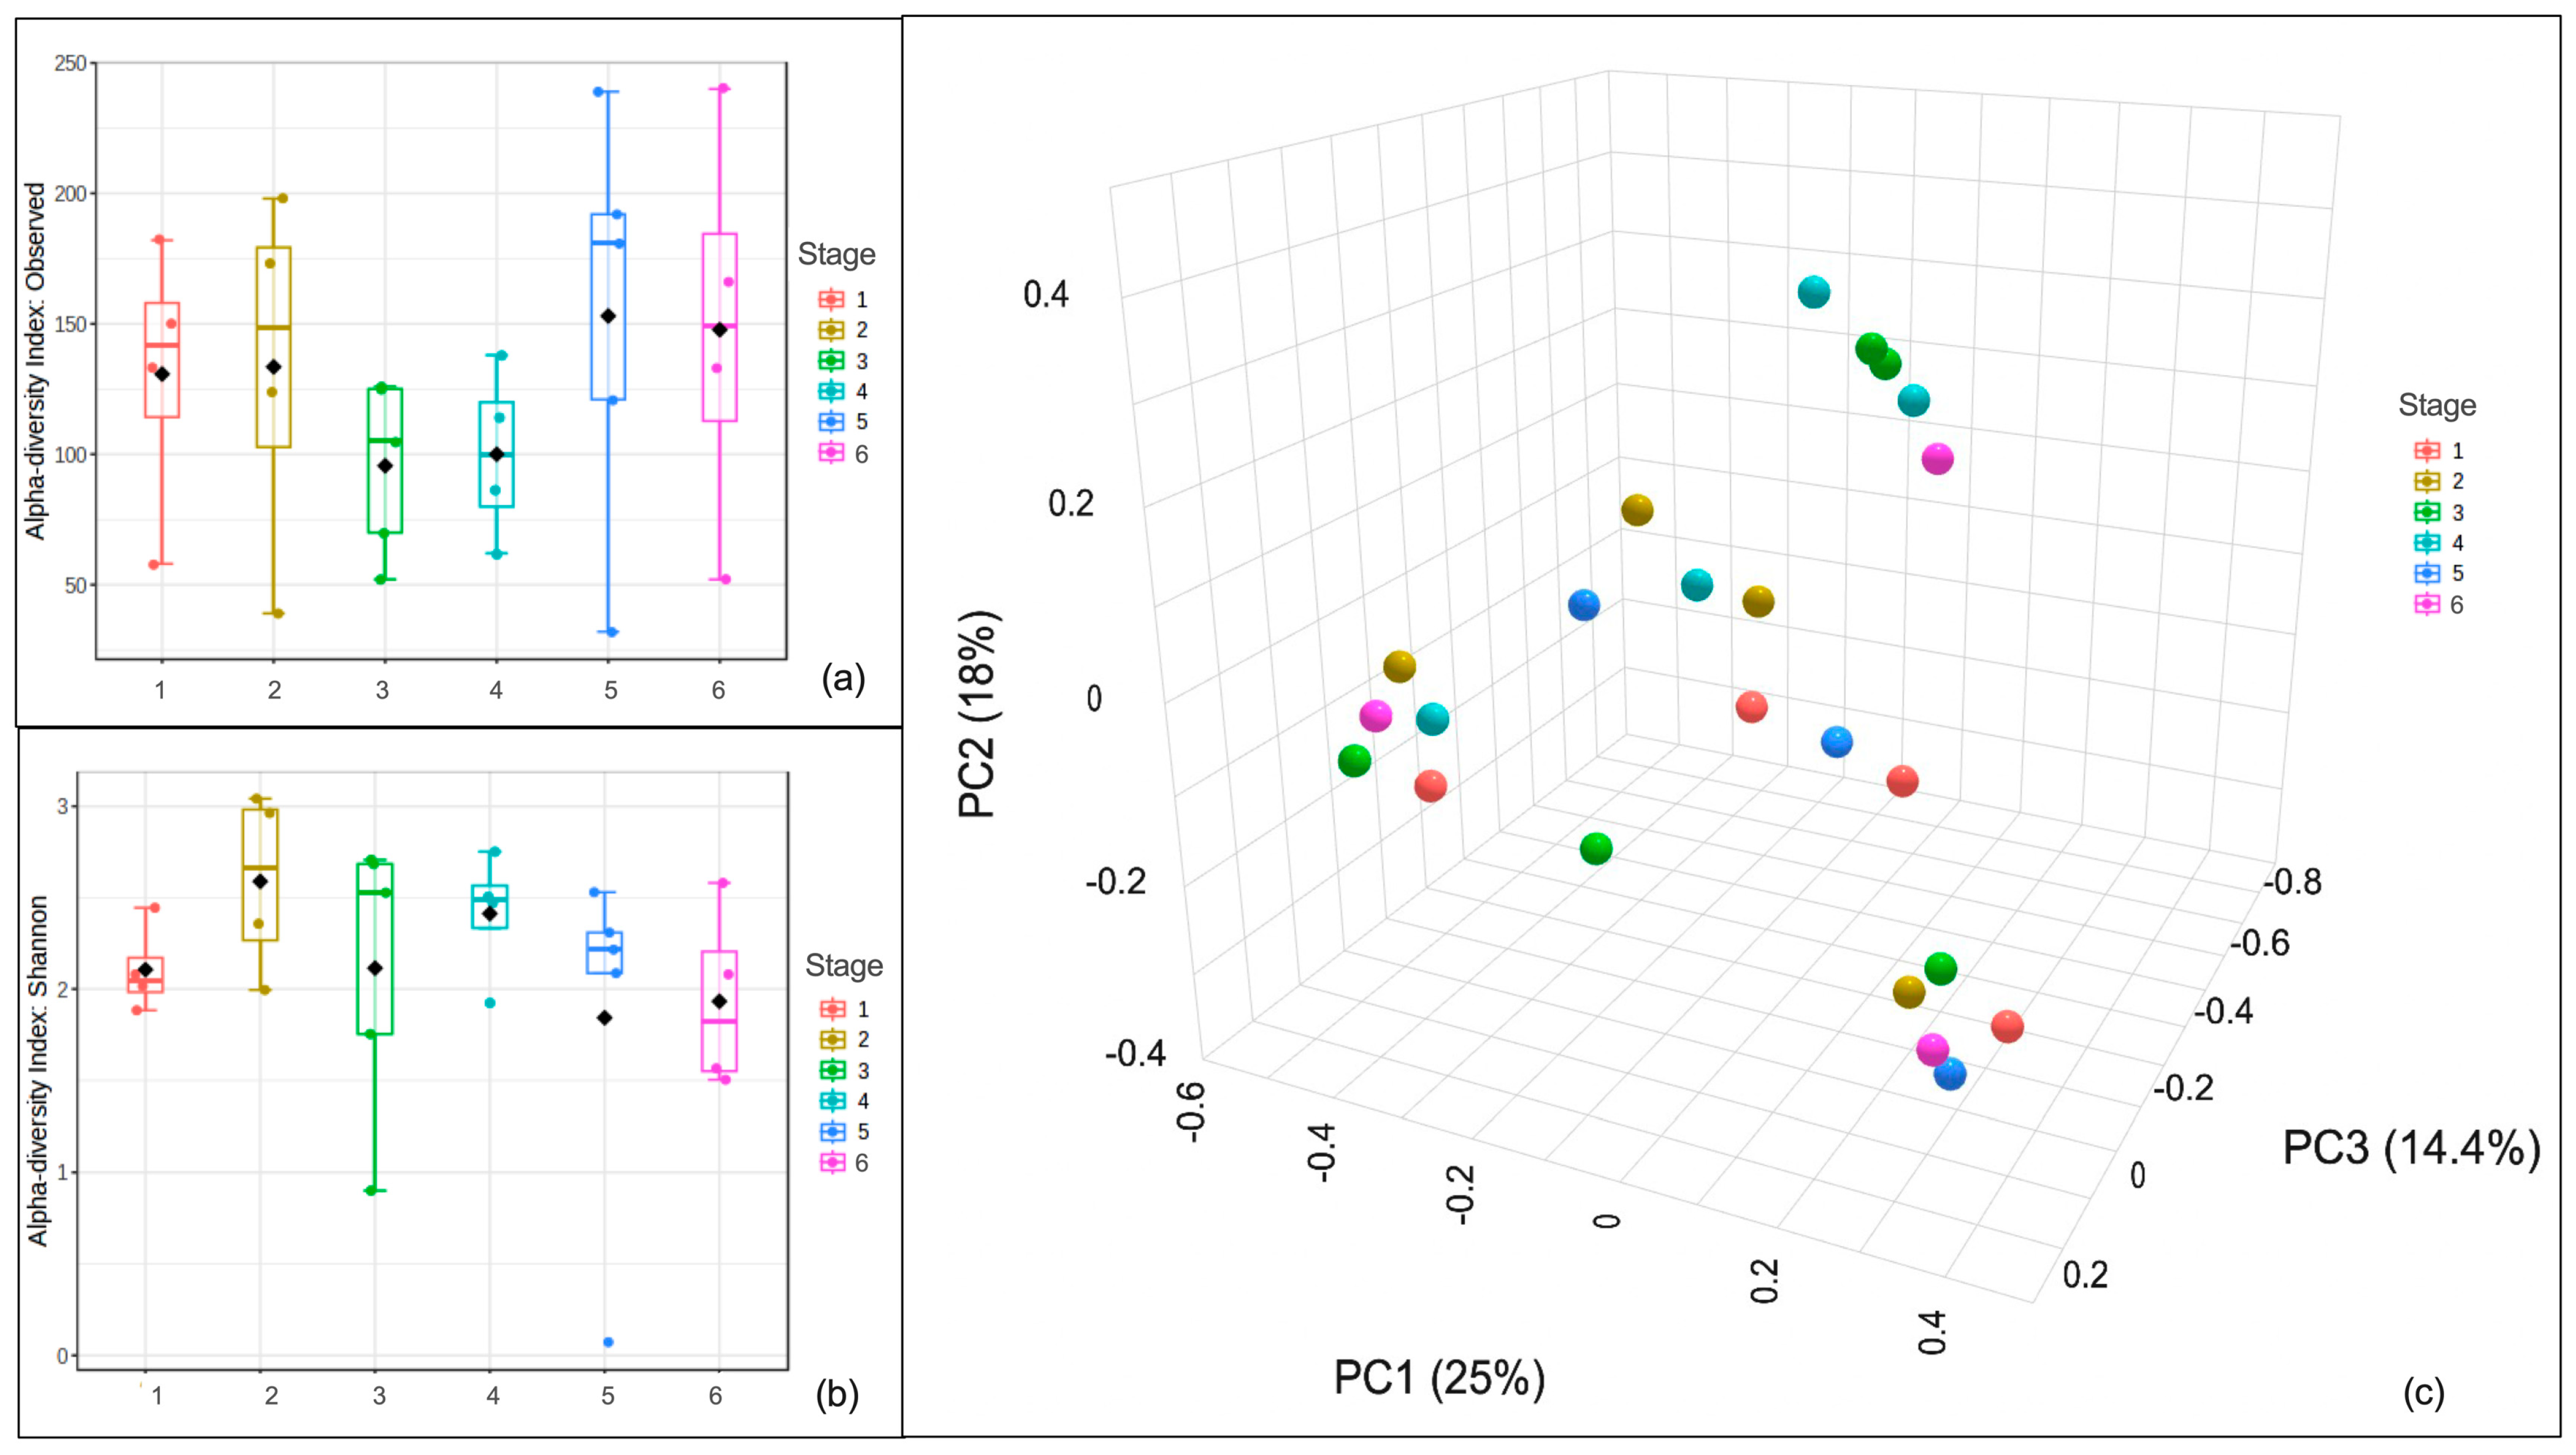
The samples were checked for the species richness (observed OTUs) and evenness (the Shannon index) in the six size fractions through the alpha diversity analysis. The highest number of observed OTUs was recorded in Stage 5 (n = 180) (Figure 3a). This was followed by Stages 6 (n = 150) and 2 (n = 150). Slightly smaller numbers were recorded in Stage 1 (n= 145). The lowest numbers were found in Stages 3 (n = 105) and 4 (n = 100). The evenness in descending order was Stage 2 (2.6) > Stage 3 (2.5), Stage 4 (2.5) > Stage 5 (2.25) > Stage 1 (2.1) and Stage 6 (1.9). Pairwise ANOVA returned non-significant p values (p > 0.05) (Figure 3b). The Goods coverage of all the alpha diversity indices ranged between 98 and 99%. The beta diversity analysis distributed the samples into four groups. The variations across the first, second and third axes were 25%, 18% and 14.4%, respectively (Figure 3c). The permutational analysis of variance (PERMANOVA) returned an F-value equivalent to 0.42 and an R2 coefficient of 0.111 (p = 0.997). Similarly, the analysis of similarity (ANOSIM) also recorded an R2 < 0.1 (p < 0.995). This suggests the difference between the groups was weak and no community structure was present specific to the size fraction. Although four overlapping clusters were recorded, all were adjoined mixes of the six-size fractions. Samples were collected all the year round and the clusters are most likely due to temporal variations.

3.5. Correlation Analysis

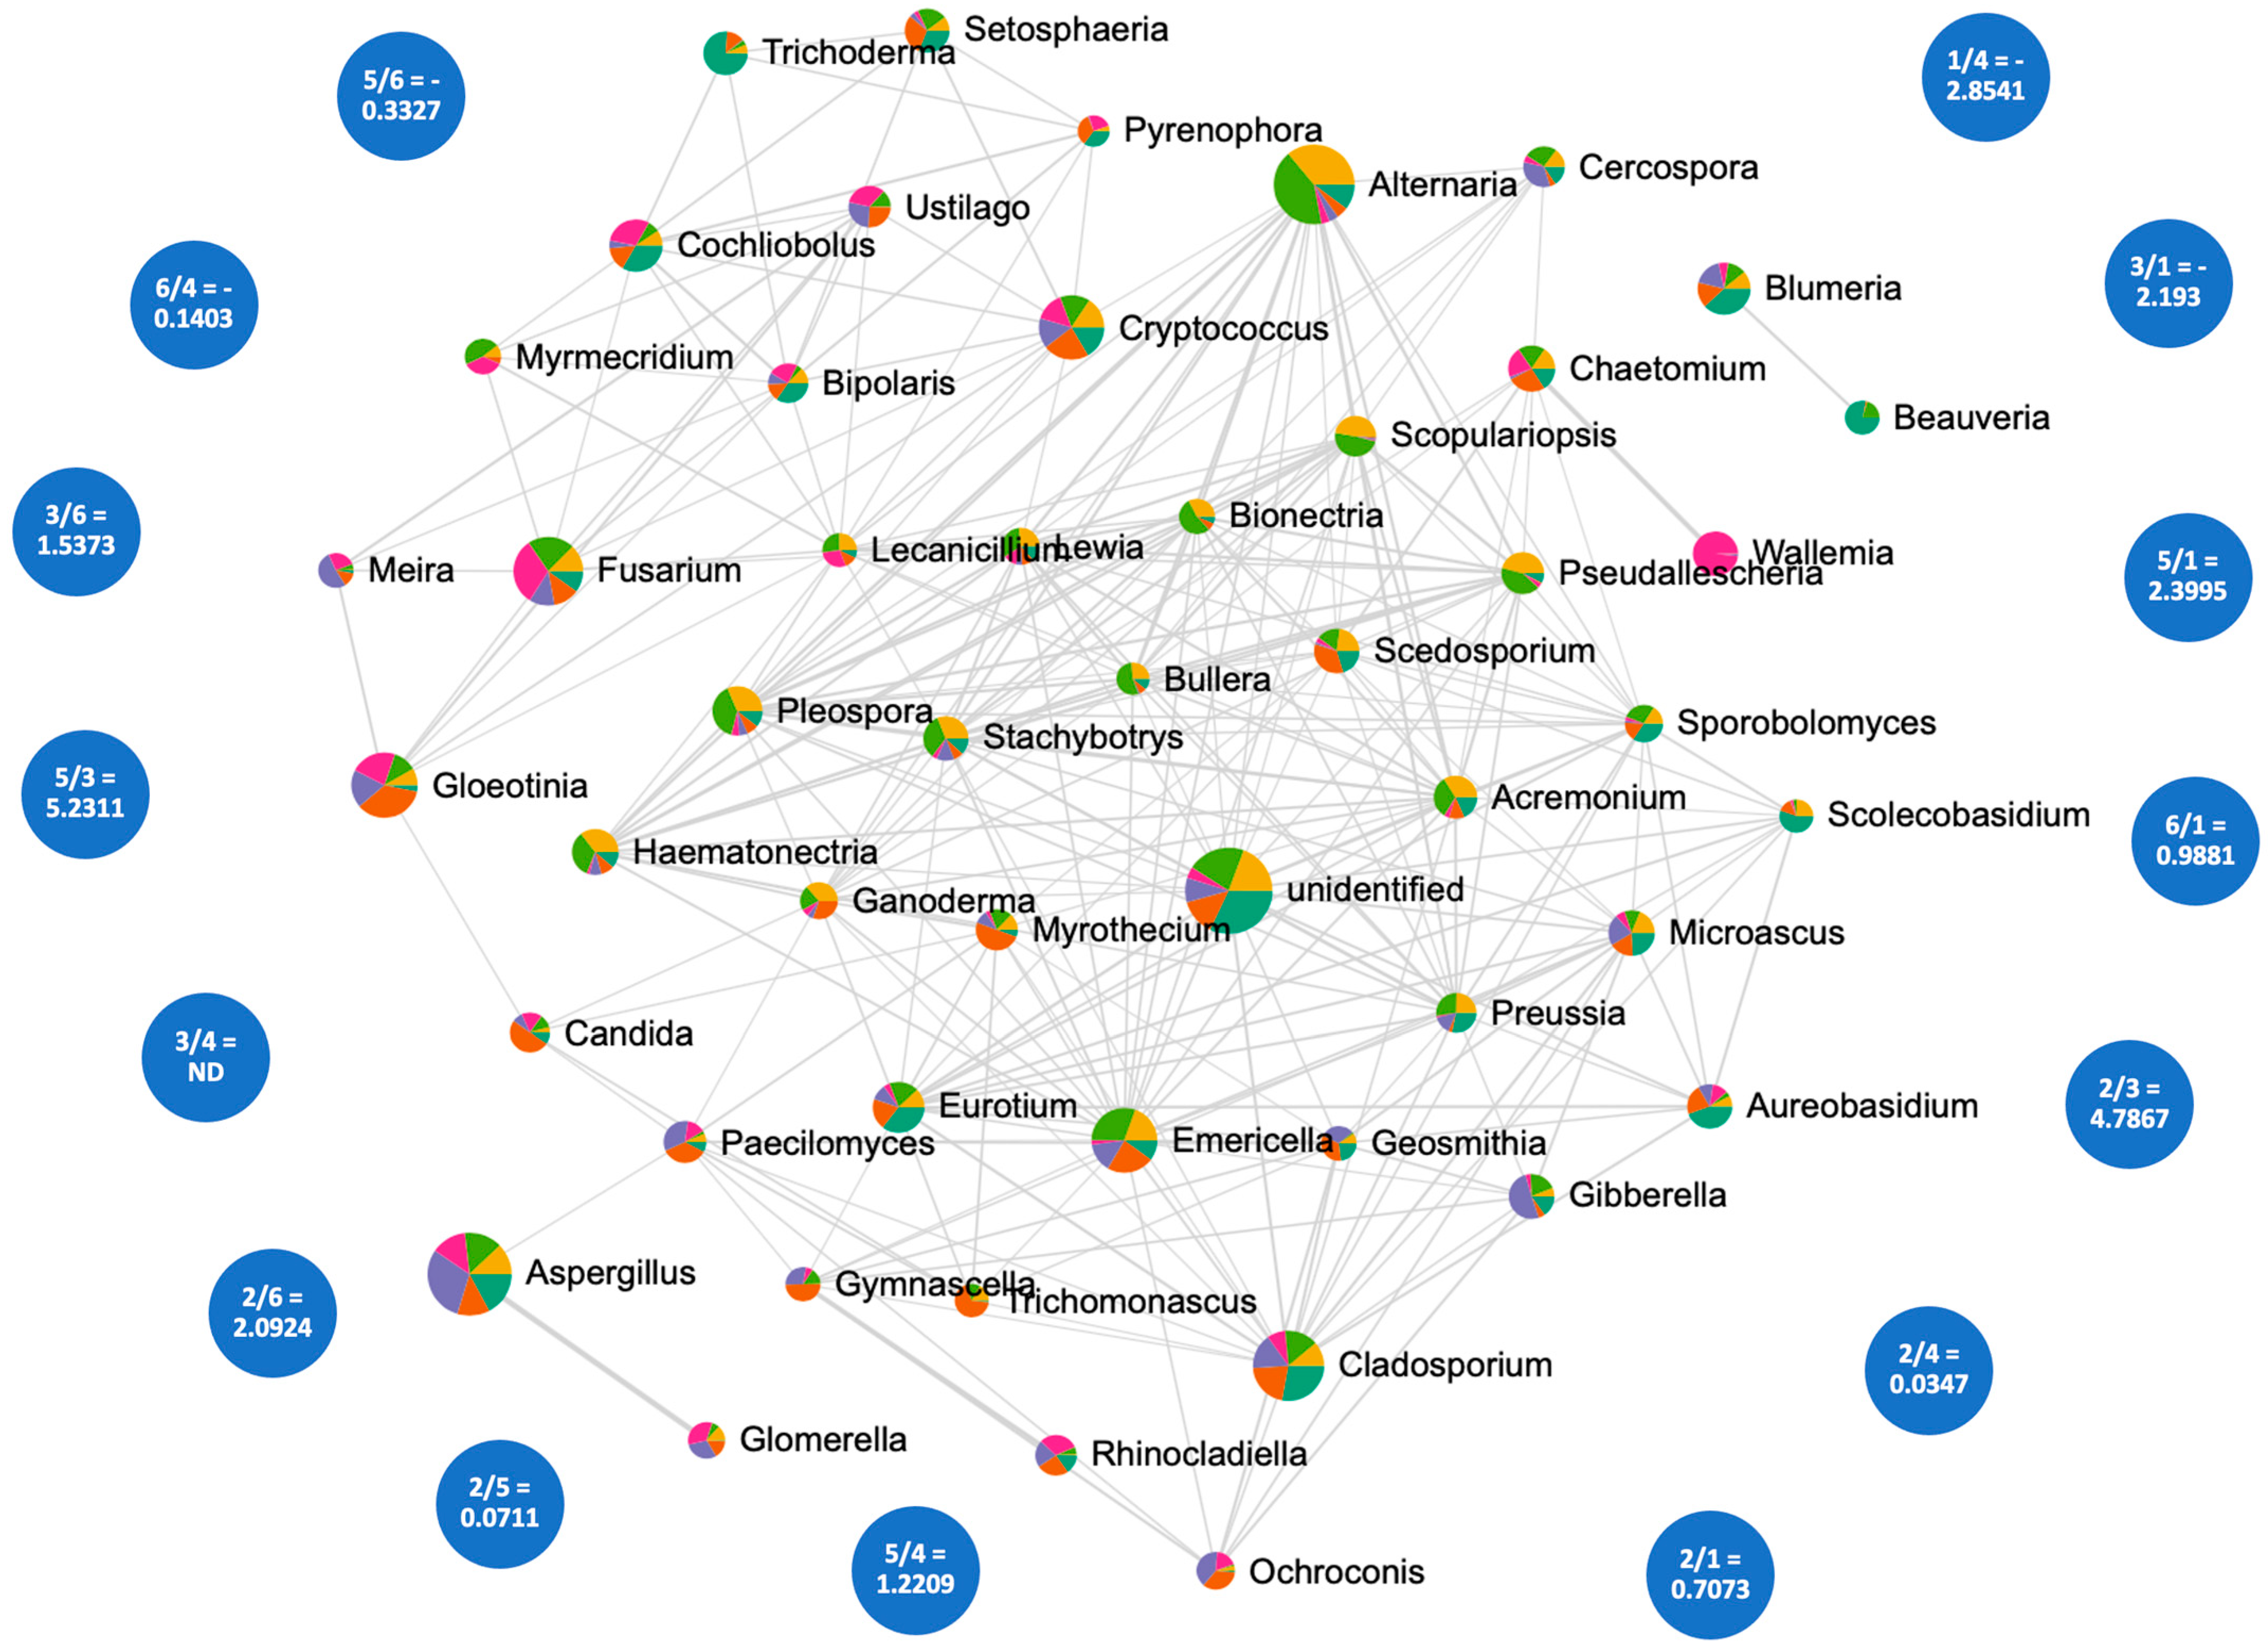
The SPARCC (permutation-100; p < 0.05; correlation threshold 0.3; algorithm, Spearman rank correlation) analysis returned an intricate lattice of the network (Figure 4). As evident from the network, both the dominant and rare (RA < 0.01) genera interacted with each other in all the size fractions. The microbial dysbiosis index (MI) between the size fraction varied between −2.19 and 2.3. Maximum MI was recorded for 5/3 (5.23) followed by 2/3 (4.78) > 1/4 (2.85) > 5/1 (2.39) > 2/6 (2.09) >3/6 (1.53) > 5/4 (1.22) > 6/1(0.98) > 2/1(0.70) > 2/5 (0.07) 2/4 > (0.03) > 5/6 (−0.33) > 1/4 (−2.85) > 3/1 (−2.19) > 6/4 (−0.14) and 3/4 (ND).
We further studied the correlation of seven dominant genera and found each to be involved in positive and negative correlations with some rare forms (Figure S2). Alternaria (Figure S2a) was positively correlated with 18 (r2 >0.3 to 0.9; p < 0.05) genera and negatively with 7 (r2 > −0.3 to −0.45; p < 0.05). Aspergillus (Figure S2b) was in positive relation with 4 genera (r2 > 0.3 to 0.5; p < 0.05) and negative with 21 (r2 > −0.35 to −0.52; p < 0.05). Cladosporium (Figure S2c) had an affirmative correlation (r2 > 0.3 to 0.75; p < 0.05) with 17 and negative with 8 (r2 > −0.2 to −0.42; p < 0.05). Cryptococcus (Figure S2d) was equally positive and negative with 13 (r2 > 0.3 to 0.5; p < 0.05) and 12 (r2 > −0.3 to −0.4; p < 0.05) genera, respectively. There were 10 (r2 > 0.3 to 0.8; p < 0.05) genera with a positive relationship with Fusarium (Figure S2e), whereas 15 (r2 > −0.3 to −0.42; p < 0.05) exhibited negative associations. Gleotinia (Figure S2f) was positive with 17 (r2 > 0.3 to 0.7; p < 0.05) and negative with 8 (r2 > −0.2 to −0.3; p < 0.05). The single genera Penicillium (Figure S2g) exhibited only negative correlations with all 25 genera (r2 > −0.2 to −0.48; p < 0.05). Our results of random forest trees were in agreement with the correlation pattern search (Figure S2h). The important features identified through this analysis are mainly the rare forms except Fusarium and Penicillium.

3.6. Comparisons between Respirable and Inhalable Fractions of Air

We further compared the differences between the respirable (Stage 1–4, representing size range >2.5 µm) and inhalable fractions (Stages 5 and 6, representing particle size 2.5 µm and smaller). The differential abundance testing returned 24 taxa to be significantly variable (Figure 5a). At the class level, Agaricomycetes were different between respirable and inhalable fractions, whereas, in orders Polyporales, Tremellales, and Chaetothyriales, they were very similar, with p values < 0.05. The families of Bionectriaceae, Incerta sedis, Trichomonascaceae, Tremellaceae, Ganodermataceae and Herpotrichiellaceae were variable between the inhalable and respirable fractions at p < 0.05. Similarly, the genera Myrmecridium, Trichomonascus, Bullera, Ganoderma, and Rhinocladiella were significantly different. Among the species, Myrmecridium schulzeri, Candida tropicals, Trichomonascus ciferrii, Bullera globispora, Ganoderma sp., Rhinocladiella sp., Bionectria ochroleuca and Fusarium oxysporium exhibited differential p values (<0.05). The observed alpha diversity was higher in the inhalable fraction, whereas richness (the Shannon index) was more in respirable fraction (Figure 5b,c). Pairwise comparisons by ANOVA returned significant p-values (p < 0.05) for both the alpha diversity indices. The community structure grouping through the beta diversity analysis distributed the samples into two admixed clusters. One sample each from the respirable and inhalable fraction appeared farther from its counterparts. The variations along the first, second and third axes were 45.5%, 21.2% and 11.8%, respectively (Figure 5d). The ANOSIM (R2) was estimated as 0.099 (p = 0.181), indicating a weak grouping.

3.7. Functional Annotations of Fungal Forms

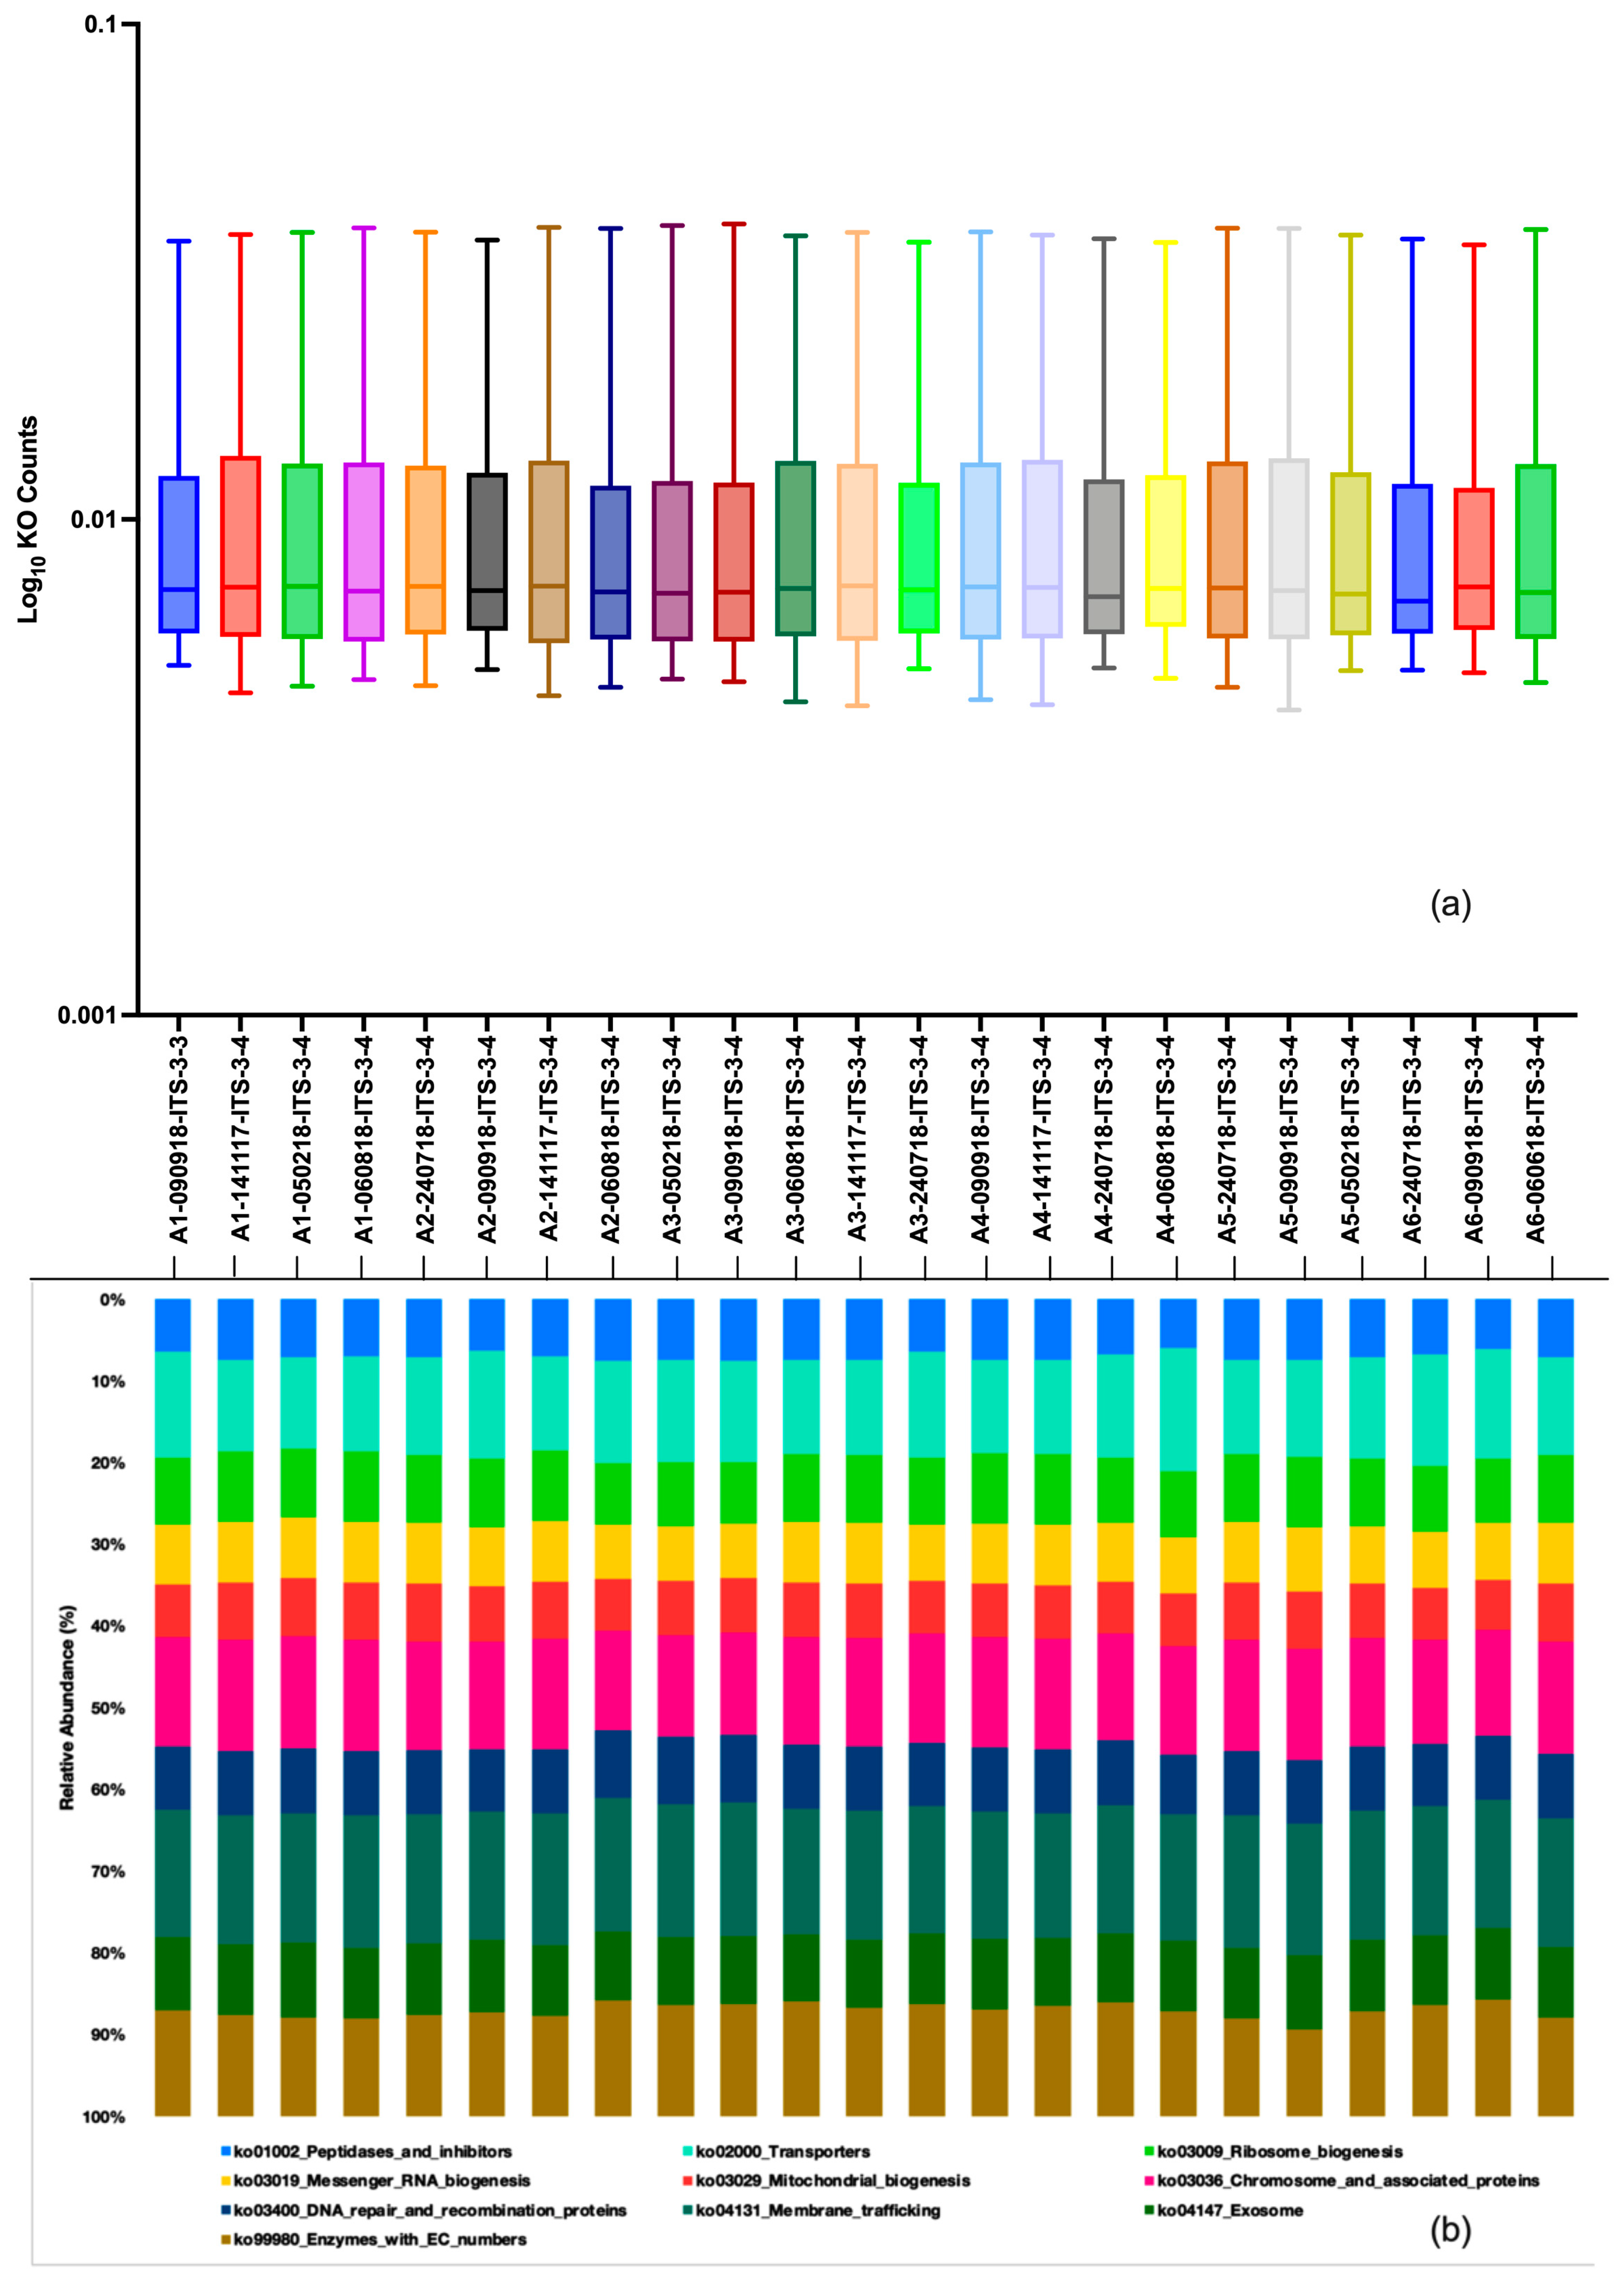
The functional profile of the fungal OTUs was derived from the FunFun tool 0.1.14. Alignment against the SILVA database returned 428 Kyoto Encyclopedia of Genes and Genomes (KEGG) orthologies (KOs). The relative abundances of all the KOs were plotted on a log scale (Figure 6a). The levels were comparable between the samples. The dominant pathways (n = 10) are shown on the bar chart. These pathways were ko01002 (peptidases and inhibitors), ko02000 (transporters), ko03009 (ribosome biogenesis), ko03019 (messenger RNA biogenesis), ko03029 (mitochondrial biogenesis), ko03036 (chromosome and associated proteins), ko03400 (DNA repair and recombination proteins), ko04131 (membrane trafficking), ko04147 (exosome), and ko99980 (enzymes with EC numbers) (Figure 6b).

3.8. Multivariate Analysis between Environmental Parameters and Fungal OTUs

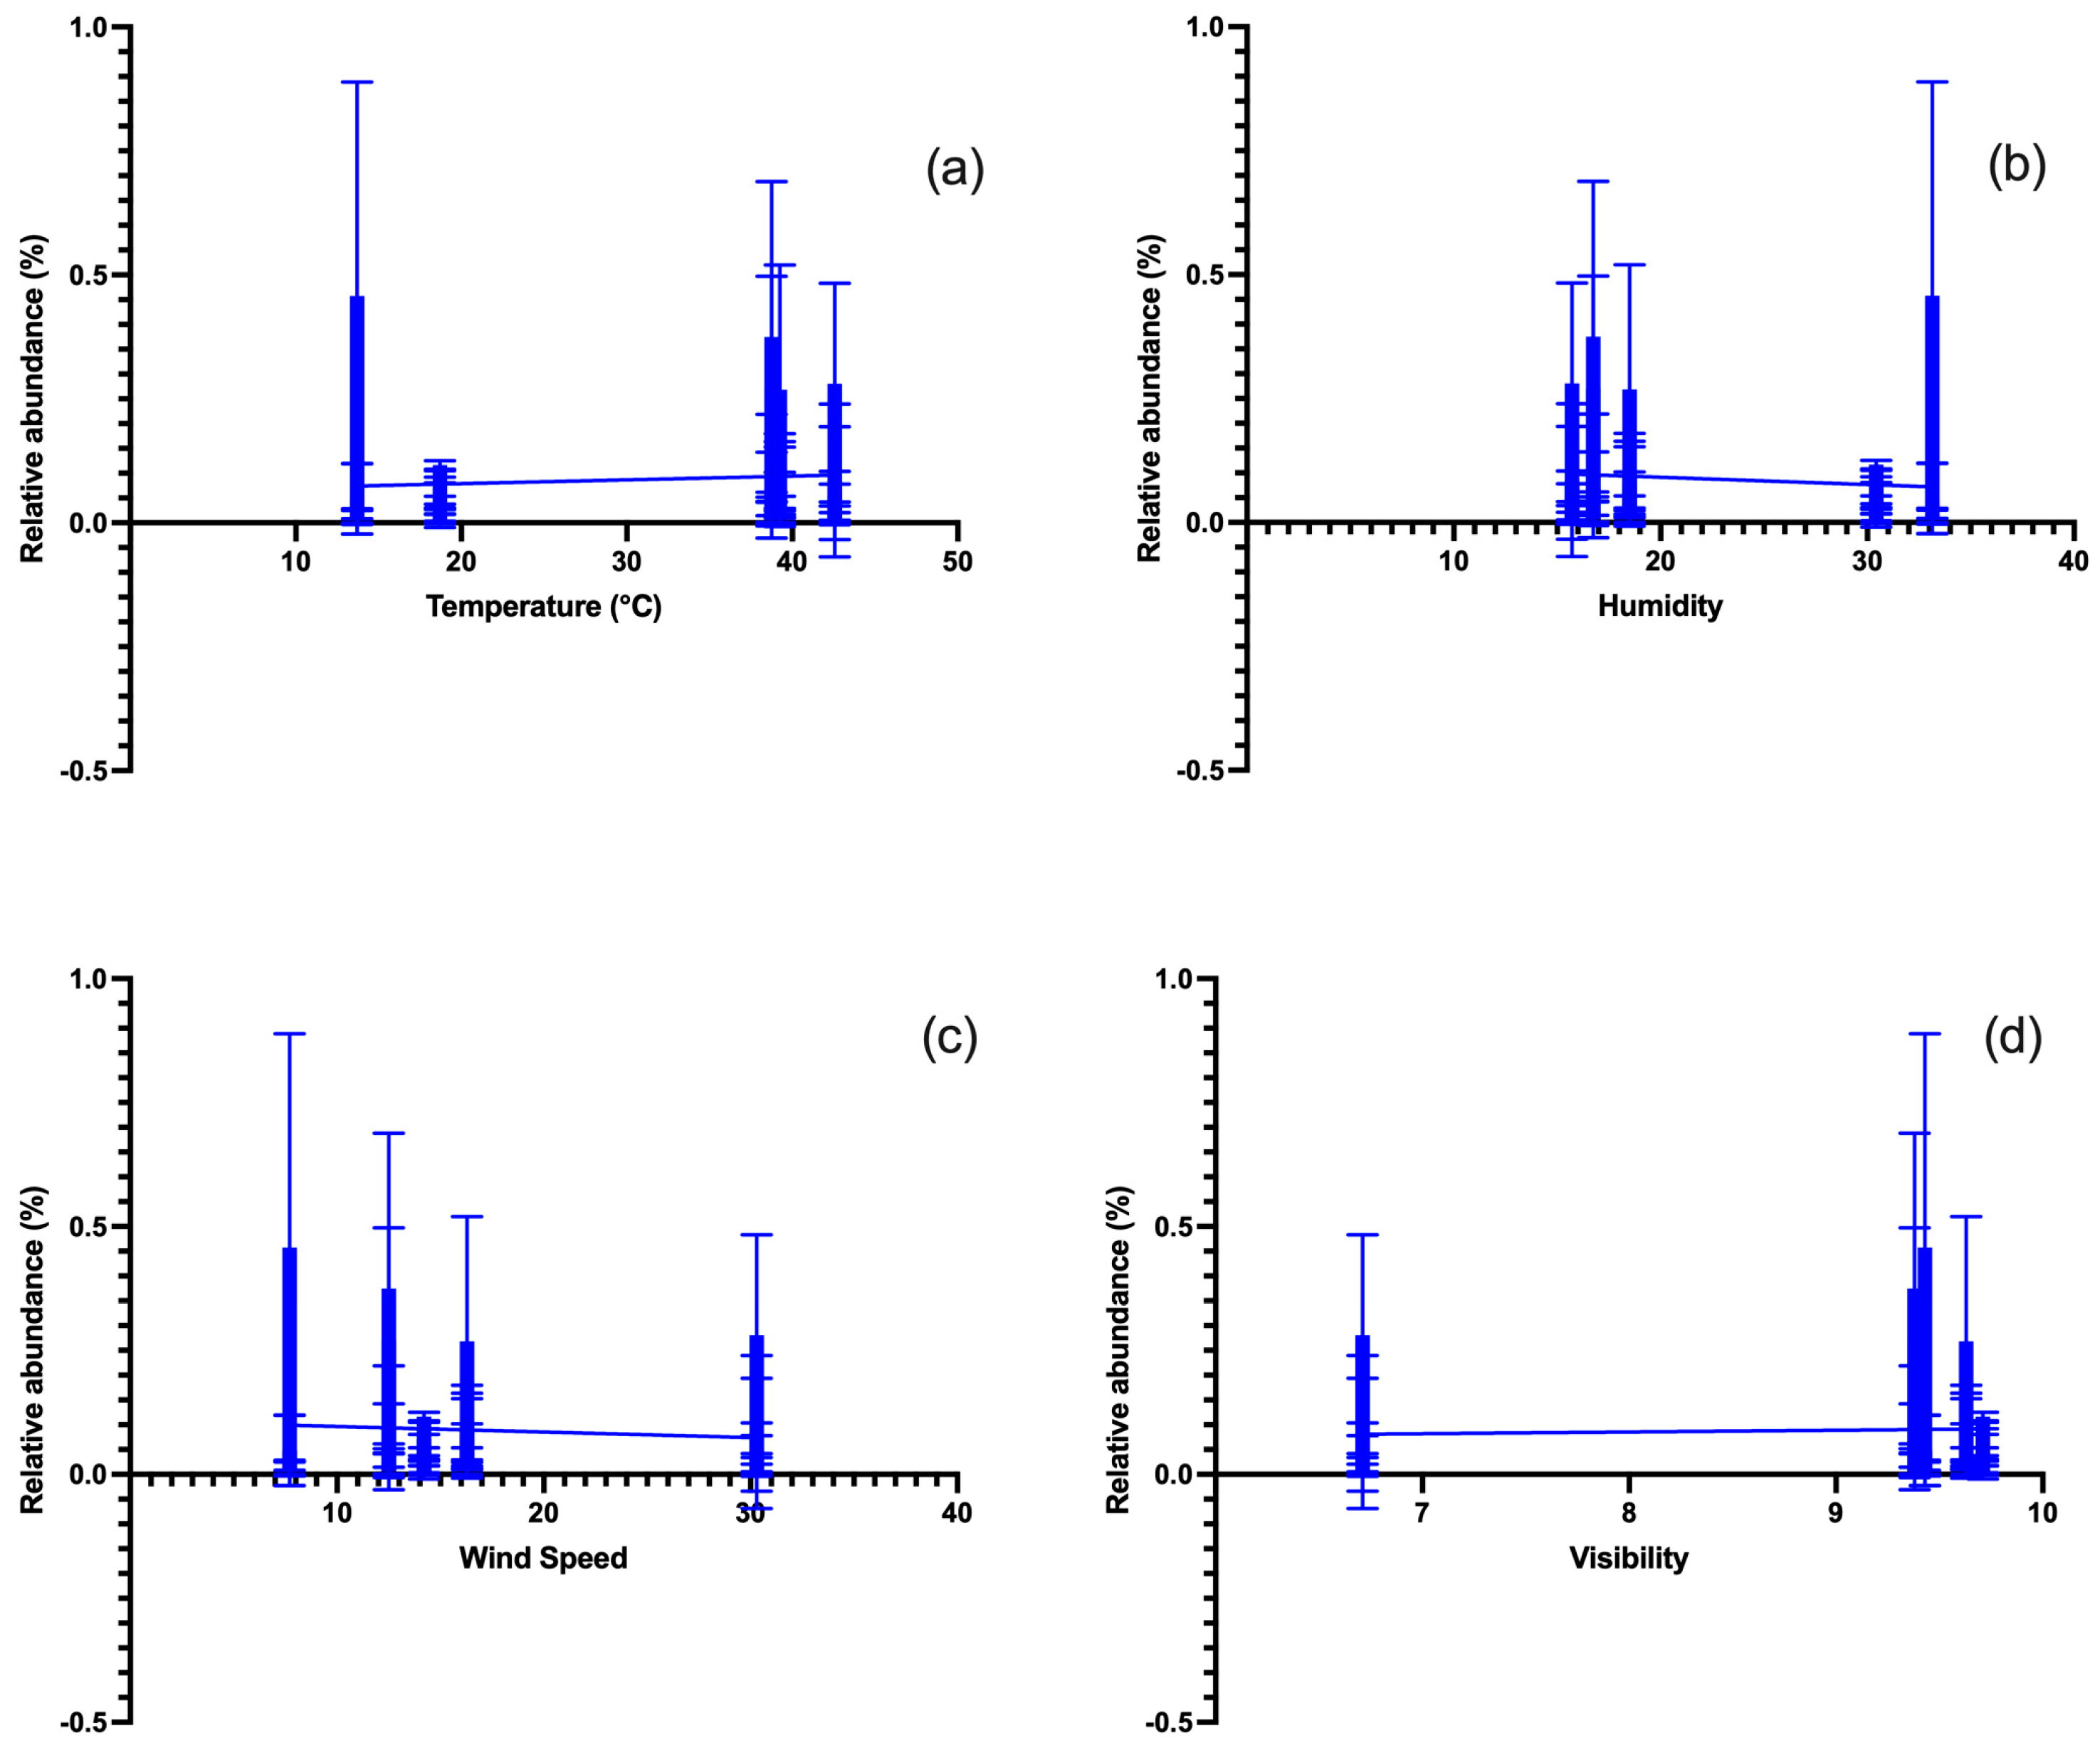
Simple linear regression analyses between the environmental variables such as temperature, humidity, wind speed and visibility showed weak and non-significant relationships (Figure 7a–d). The r2 values for each environmental variable were 0.003 (temperature), 0.001 (relative humidity), 0.001 (wind speed) and 0.103 (visibility) at p < 0.05.

4. Discussion

Fungi are the second largest microorganisms and eukaryotes with approximately 1.5–5.0 million species identified so far [28]. However, fungal mycobiome research has recently picked up momentum as compared to bacterial microbiomes [29]. Fungal exposures have also been associated with rhinitis, asthma, bronchopulmonary mycoses, fungal sinusitis, and hypersensitive pneumonia [30]. It therefore becomes very important to characterize the airborne fungal population as inhalation is most likely a potent route of exposure to the human body. The findings of the present investigation add important information to the limited knowledge base of fungal diversity in aerosols. Fungi presence in the inhalable air fractions opens up interesting avenues for further research.
Diverse fungal species were identified from a remote location, where the dominant phyla were Ascomycota, whereas in an urban location, Basidiomycota were prevalent [31]. In another study, the sampling site was amidst an agricultural farm and aerosolization of soil, though wind was considered the source of these fungi in the air [32]. Further classification at the genera level recorded the reasonable abundance of unidentified taxa. This is quite expected as limited species of fungi have been classified to date [28] and all the sequences that do not find a match in the database are binned under the unassigned category. Rapid progress is being made towards molecular identification, with technologies available to sequence the entire genomes at a single-cell level with great potential to overcome this gap [33]. Nevertheless, the roles of unassigned fungal genera cannot be ignored in human health implications. Environmental factors have been known to shape air microbial communities; however, this was not the case in the present study. Similar observations were recorded in our previous study, where seasonality played a limited role in shaping the fungal community structure [12]. A limitation of the study is the point sampling in five-time intervals in an open area in high wind conditions; hence, we think comparisons across the samples are not very useful. Nevertheless, the diversity captured is of immense importance and similarity in trends further underpins the robustness of the data.
The fungal genera of Aspergillus > Penicillium > Alternaria > Cladosporium > Fusarium > Cryptococcus were in good agreement with previous studies from Kuwait [12,19], Jordan [34], Saudi Arabia and Qatar [35]. All these countries have similar environmental milieu and are within similar geographical settings. The aerosols are carried by the Toz winds across the region. Back trajectory modelling provides insight into the assemblage coming from a specific direction; once a large database is developed, it would effectively predict the fungal communities arriving in Kuwait. Many species of the recorded genera are known human pathogens. From a health perspective, it is also important to test the metabolic status of the dominant genera. Intriguingly, two pathogenic fungal species Fusarium cocciciocola and Aspergillus brasilensis have been reported under similar environmental regimes previously. Vitte and the team jointly called these genera the allergy-causing fungal exposomes [36]. Our analysis of functional OTUs provides further evidence that peptidases are essential components of fungal defence–attack systems [37] and are the most dominant KEGG pathway. The dominance of peptidases and transporters is suggestive of their roles in producing proteins for the survival of fungi inside the host. These pathways were also reported in bacteria [38], copepods [39], nematodes [40] and algae [41]. Other pathways of transporters, ribosome biogenesis, messenger RNA biogenesis, mitochondrial biogenesis, chromosome and associated proteins, DNA repair and recombination proteins, membrane trafficking, and exosomes can be linked with cell division, protein synthesis and transport of metabolites under environmental stress [42,43,44].
More concerning was the presence of all these pathogenic forms in all the size fractions, with slight variations in RA% between the cascade stages. We speculate an unignorable occupational risk to the farmers and field labourers. It is important to highlight that Kuwait has one of the highest dust loadings in the world [17,19,45,46]. An association between dust storms and asthma-related hospital admissions have been observed in Kuwait [18,20,47]. Similar genera were reported in the ambient aerosols of the urban city [12,48]. We also recorded its presence in inhalable indoor aerosols of public hospitals [14]. Metabolically active Fusarium and Aspergillus were also isolated from the presently collected aerosols. These fungi-laden aerosols are constantly inhaled by healthcare workers and residents. Whether they are at unprecedented risk remains a question worthy of further investigation.
Parallel to other studies, a weak ANOSIM (r2 = 0.11) was recorded between the six size fractions [12]. This was corroborated by our observations of differential abundance analysis. We also noticed that all the dominant genera were in positive and negative correlation with numerous other fungal genera with RA < 0.1. The minimal variations in alpha and beta diversity indices are thus justified. These fungi also interact with other micro- and macro-organisms, especially viruses and bacteria [13,49,50,51]. It is also noteworthy that the microbial consortium is responsible for a diseased or healthy state. A typically enriched MD index > 2.0 suggestive of an expressive diseased condition was recorded between Stages 1–5, 1–4, 1–3, 2–3, and 2–6 [26]. Inhalation of aerosols of these size fractions might be expressed in a dysbiosis state. Deeper investigations into these emerging contaminants are prudent.

5. Conclusions

Fungi typical to atmospheric habitat were recorded in both inhalable and respirable aerosol fractions. All the dominant forms were opportunistic pathogens and exhibited differential abundances in all the size fractions across the samples. Humans and other biotic communities are continually exposed to these fungi. However, if these fungi pose an occupational risk is worthy of further investigation. The interaction of fungal consortia within the size fraction with other microbial communities is likely to be expressed in a diseased state and is possibly the reason behind the enhanced allergic prevalence in the country.

Supplementary Materials

The following supporting information can be downloaded at https://www.mdpi.com/article/10.3390/atmos15070806/s1. Figure S1: Hierarchical clustering; Figure S2: Correlation pattern of dominant genera. (a) Alternaria, (b) Aspergillus, (c) Cladosporium, (d) Fusarium, (e) Gleotinia, (f) Cryptococcus, and (g) Penicillium. The left-hand side panel lists the genus names. The squared boxes on the right-hand side panel represent the stages. The colour of each box varies according to the RA of respective genera in a particular stage/size fraction. A scale for the colour coding is provided beside the coloured boxes. The x-axis displays the Spearman’s correlation coefficients (r2). The red bars denote positive correlations, and the negative correlations are shown in blue bars. (h) Random forest trees; Table S1: Sample collection dates and positive amplification profiles; Table S2: Primers used for fungal ITS region amplification; Table S3: Raw sample reads; Table S4: Taxonomic profile and core microbiome; Table S5: Relative abundance of seven dominant genera.

Author Contributions

Conceptualization, N.H. and S.U.; methodology, N.H. and S.U.; software, N.H. and M.W.K.; validation, N.H.; M.K. and M.B.; formal analysis, M.B. and W.A.A.-F.; investigation, W.A.A.-F. and M.K.; resources, M.B.; data curation, M.W.K.; writing—original draft preparation, N.H.; writing—review and editing, N.H. and S.U.; visualization, N.H. and M.W.K. All authors have read and agreed to the published version of the manuscript.

Funding

This research received no external funding, and the APC was funded by the Kuwait Institute for Scientific Research.

Institutional Review Board Statement

Not applicable.

Informed Consent Statement

Not applicable.

Data Availability Statement

The sequences generated in this investigation have been deposited to the National Centre for Biotechnology Information under the accession numbers SRR23991706 to SRR23991728.

Acknowledgments

The authors are thankful to Faiz Shirshikhar for the sample collection.

Conflicts of Interest

The authors declare no conflicts of interest.

References

  1. Adhikari, A.; Sen, M.M.; Guptabhattacharya, S.; Chanda, S. Airborne viable, non-viable, and allergenic fungi in a rural agricultural area of India: A 2-year study at five outdoor sampling stations. Sci. Total Environ. 2004, 326, 123–141. [Google Scholar] [CrossRef] [PubMed]
  2. Cox, C.S.; Wathes, C.M. Bioaerosols Handbook; CRC Press: Boca Raton, FL, USA, 1995. [Google Scholar]
  3. D’Amato, G. Effects of climatic changes and urban air pollution on the rising trends of respiratory allergy and asthma. Multidiscip. Respir. Med. 2019, 6, 28. [Google Scholar] [CrossRef] [PubMed]
  4. Barberán, A.; Ladau, J.; Leff, J.W.; Pollard, K.S.; Menninger, H.L.; Dunn, R.R.; Fierer, N. Continental-scale distributions of dust-associated bacteria and fungi. Proc. Natl. Acad. Sci. USA 2015, 112, 5756–5761. [Google Scholar] [CrossRef] [PubMed]
  5. Sadyś, M.; Skjøth, C.; Kennedy, R. Back-trajectories show export of airborne fungal spores (Ganoderma sp.) from forests to agricultural and urban areas in England. Atmos. Environ. 2014, 84, 88–99. [Google Scholar] [CrossRef]
  6. Singh, A.B.; Singh, A.; Pandit, T. Respiratory diseases among agricultural industry workers in India: A cross-sectional epidemiological study. Ann. Agric. Environ. Med. 1999, 6, 115–126. [Google Scholar] [PubMed]
  7. Younis, F.; Salem, E. Respiratory health disorders associated with occupational exposure to bioaerosols among workers in poultry breeding farms. Environ. Sci. Pollut. Res. 2020, 27, 19869–19876. [Google Scholar] [CrossRef] [PubMed]
  8. Hai, V.D.; Hoang, S.M.T.; Hung, N.T.Q.; Ky, N.M.; Gwi-Nam, B.; Ki-hong, P.; Chang, S.W.; Bach, Q.-V.; Nhu-Trang, T.-T.; Nguyen, D.D. Characteristics of airborne bacteria and fungi in the atmosphere in Ho Chi Minh City, Vietnam—A case study over three years. Int. Biodeterior. Biodegrad. 2019, 145, 104819. [Google Scholar] [CrossRef]
  9. Chow, J.C.; Yang, X.; Wang, X.; Kohl, S.D.; Hurbain, P.R.; Chen, L.A.; Watson, J.G. Characterization of Ambient PM10 Bioaerosols in a California Agricultural Town. Aerosol Air Qual. Res. 2015, 15, 1433–1447. [Google Scholar] [CrossRef]
  10. Goodwin, S.; McPherson, J.D.; McCombie, W.R. Coming of age: Ten years of next-generation sequencing technologies. Nat. Rev. Genet. 2016, 17, 333–351. [Google Scholar] [CrossRef]
  11. Slatko, B.E.; Gardner, A.F.; Ausubel, F.M. Overview of Next-Generation Sequencing Technologies. Curr. Protoc. Mol. Biol. 2018, 122, e59. [Google Scholar] [CrossRef]
  12. Al Salameen, F.; Habibi, N.; Uddin, S.; Al Mataqi, K.; Kumar, V.; Al Doaij, B.; Al Amad, S.; Al Ali, E.; Shirshikhar, F. Spatio-temporal variations in bacterial and fungal community associated with dust aerosol in Kuwait. PLoS ONE 2020, 15, e0241283. [Google Scholar] [CrossRef]
  13. Habibi, N.; Uddin, S.; Al Salameen, F.; Behbehani, M.; Shirshikhar, F.; Razzack, N.A.; Shajan, A.; Hussain, F.Z. Collection of Bacterial Community Associated with Size Fractionated Aerosols from Kuwait. Data 2021, 6, 123. [Google Scholar] [CrossRef]
  14. Habibi, N.; Uddin, S.; Behbehani, M.; Al Salameen, F.; Razzack, N.A.; Zakir, F.; Shajan, A.; Alam, F. Bacterial and Fungal Communities in Indoor Aerosols from Two Kuwaiti Hospitals. Front. Microbiol. 2022, 13, 955913. [Google Scholar] [CrossRef] [PubMed]
  15. Núñez, A.; Amo de Paz, G.; Rastrojo, A.; García, A.M.; Alcamí, A.; Gutiérrez-Bustillo, A.M.; Moreno, D.A. Monitoring of airborne biological particles in outdoor atmosphere. Part 2: Metagenomics applied to urban environments. Int. Microbiol. 2016, 19, 69–80. [Google Scholar] [PubMed]
  16. Núñez, A.; de Paz, G.A.; Rastrojo, A.; Ferencova, Z.; Gutiérrez-Bustillo, A.M.; Alcamí, A.; Moreno, D.A.; Guantes, R. Temporal patterns of variability for prokaryotic and eukaryotic diversity in the urban air of Madrid (Spain). Atmos. Environ. 2019, 217, 116972. [Google Scholar] [CrossRef]
  17. Uddin, S.; Habibi, N.; Fowler, S.W.; Behbehani, M.; Gevao, B.; Faizuddin, M.; Gorgun, A.U. Aerosols as Vectors for Contaminants: A Perspective Based on Outdoor Aerosol Data from Kuwait. Atmosphere 2023, 14, 470. [Google Scholar] [CrossRef]
  18. Thalib, L.; Al-Taiar, A. Dust storms and the risk of asthma admissions to hospitals in Kuwait. Sci. Total Environ. 2012, 433, 347–351. [Google Scholar] [CrossRef]
  19. Al-Awadhi, J.M. Dust fallout characteristics in Kuwait: A case study. Kuwait J. Sci. Eng. 2005, 32, 135. [Google Scholar]
  20. Khadadah, M. The cost of asthma in Kuwait. Med. Princ. Pract. 2013, 22, 87–91. [Google Scholar] [CrossRef]
  21. Caporaso, J.G.; Kuczynski, J.; Stombaugh, J.; Bittinger, K.; Bushman, F.D.; Costello, E.K.; Fierer, N.; Gonzalez Peña, A.; Goodrich, J.K.; Gordon, J.I.; et al. QIIME allows analysis of high-throughput community sequencing data. Nat. Methods 2010, 7, 335–336. [Google Scholar] [CrossRef]
  22. Dhariwal, A.; Chong, J.; Habib, S.; King, I.L.; Agellon, L.B.; Xia, J. MicrobiomeAnalyst: A web-based tool for comprehensive statistical, visual and meta-analysis of microbiome data. Nucleic Acids Res. 2017, 45, W180–W188. [Google Scholar] [CrossRef] [PubMed]
  23. Segata, N.; Izard, J.; Waldron, L.; Gevers, D.; Miropolsky, L.; Garrett, W.S.; Huttenhower, C. Metagenomic biomarker discovery and explanation. Genome Biol. 2011, 12, R60. [Google Scholar] [CrossRef] [PubMed]
  24. Anderson, M.J.; Walsh, D.C.I. PERMANOVA, ANOSIM, and the Mantel test in the face of heterogeneous dispersions: What null hypothesis are you testing? Ecol. Monogr. 2013, 83, 557–574. [Google Scholar] [CrossRef]
  25. Watts, S.C.; Ritchie, S.; Inouye, M.; Holt, K.E. FastSpar: Rapid and scalable correlation estimation for compositional data. Bioinformatics 2018, 35, 1064–1066. [Google Scholar] [CrossRef] [PubMed]
  26. Soares, R.C.; Camargo-Penna, P.H.; de Moraes, V.C.S.; De Vecchi, R.; Clavaud, C.; Breton, L.; Braz, A.S.K.; Paulino, L.C. Dysbiotic bacterial and fungal communities not restricted to clinically affected skin sites in Dandruff. Front. Cell. Infect. Microbiol. 2016, 6, 157. [Google Scholar] [CrossRef] [PubMed]
  27. Krivonos, D.V.; Konanov, D.N.; Ilina, E.N. FunFun: ITS-based functional annotator of fungal communities. Ecol. Evol. 2023, 13, e9874. [Google Scholar] [CrossRef] [PubMed]
  28. Blackwell, M. The Fungi: 1, 2, 3… 5.1 million species? Am. J. Bot. 2011, 98, 426–438. [Google Scholar] [CrossRef]
  29. Huffnagle, G.B.; Noverr, M.C. The emerging world of the fungal microbiome. Trends Microbiol. 2013, 21, 334–341. [Google Scholar] [CrossRef]
  30. Baxi, S.N.; Portnoy, J.M.; Larenas-Linnemann, D.; Phipatanakul, W.; Barnes, C.; Baxi, S.; Grimes, C.; Horner, W.E.; Kennedy, K.; Larenas-Linnemann, D.; et al. Exposure and health effects of fungi on humans. J. Allergy Clin. Immunol. Pract. 2016, 4, 396–404. [Google Scholar] [CrossRef]
  31. Fröhlich-Nowoisky, J.; Pickersgill, D.A.; Després, V.R.; Pöschl, U. High diversity of fungi in air particulate matter. Proc. Natl. Acad. Sci. USA 2009, 106, 12814–12819. [Google Scholar] [CrossRef]
  32. Egidi, E.; Delgado-Baquerizo, M.; Plett, J.M.; Wang, J.; Eldridge, D.J.; Bardgett, R.D.; Maestre, F.T.; Singh, B.K. A few Ascomycota taxa dominate soil fungal communities worldwide. Nat. Commun. 2019, 10, 2369. [Google Scholar] [CrossRef]
  33. Szoboszlay, M.; Schramm, L.; Pinzauti, D.; Scerri, J.; Sandionigi, A.; Biazzo, M. Nanopore is preferable over Illumina for 16S amplicon sequencing of the gut microbiota when species-level taxonomic classification, accurate estimation of richness, or focus on rare taxa Is required. Microorganisms 2023, 11, 804. [Google Scholar] [CrossRef] [PubMed]
  34. Abu-Dieyeh, M.H.; Barham, R.; Abu-Elteen, K.; Al-Rashidi, R.; Shaheen, I. Seasonal variation of fungal spore populations in the atmosphere of Zarqa area, Jordan. Aerobiologia 2010, 26, 263–276. [Google Scholar] [CrossRef]
  35. Al-Barakah, F.; Radwan, S.; Modaihsh, A. Seasonal and spatial variation of microbial contents in falling dust in Riyadh city, Saudi Arabia. Int. J. Curr. Microbiol. Appl. Sci. 2014, 3, 647–656. [Google Scholar]
  36. Vitte, J.; Michel, M.; Malinovschi, A.; Caminati, M.; Odebode, A.; Annesi-Maesano, I.; Caimmi, D.P.; Cassagne, C.; Demoly, P.; Heffler, E.; et al. Fungal exposome, human health, and unmet needs: A 2022 update with special focus on allergy. Allergy 2022, 77, 3199–3216. [Google Scholar] [CrossRef]
  37. Dunaevsky, Y.; Popova, V.; Semenova, T.; Beliakova, G.; Belozersky, M. Fungal inhibitors of proteolytic enzymes: Classification, properties, possible biological roles, and perspectives for practical use. Biochimie 2014, 101, 10–20. [Google Scholar] [CrossRef]
  38. Habibi, N.; Uddin, S.; Al-Sarawi, H.; Aldhameer, A.; Shajan, A.; Zakir, F.; Abdul Razzack, N.; Alam, F. Metagenomes from coastal sediments of Kuwait: Insights into the microbiome, metabolic functions and resistome. Microorganisms 2023, 11, 531. [Google Scholar] [CrossRef]
  39. Habibi, N.; Uddin, S.; Behbehani, M.; Khan, M.W.; Razzack, N.A.; Shirshikhar, F. The transcriptome profile of the marine Calanoid copepod Parvocalanus crassirostris isolated from Kuwait territorial waters and generations cultured under different ocean acidification scenarios. Reg. Stud. Mar. Sci. 2023, 67, 103231. [Google Scholar] [CrossRef]
  40. Gahoi, S.; Singh, S.; Gautam, B. Genome-wide identification and comprehensive analysis of Excretory/Secretory proteins in nematodes provide potential drug targets for parasite control. Genomics 2019, 111, 297–309. [Google Scholar] [CrossRef]
  41. Barney, B.M.; Vogel, E.; Mancipe, N.C. Algal Strain and Methods for Producing Simple Sugars. U.S. Patent 11932889, 19 March 2024. [Google Scholar]
  42. Jornayvaz, F.R.; Shulman, G.I. Regulation of mitochondrial biogenesis. Essays Biochem. 2010, 47, 69–84. [Google Scholar]
  43. Niessing, D. RNA-Binding proteins in fungi and their role in mRNA localization. In RNA-Binding Proteins; Lorkovic, Z., Ed.; Landes Bioscience: Austin, TX, USA, 2012; Volume 81, pp. 81–94. [Google Scholar]
  44. Hessvik, N.P.; Llorente, A. Current knowledge on exosome biogenesis and release. Cell. Mol. Life Sci. 2018, 75, 193–208. [Google Scholar] [CrossRef] [PubMed]
  45. Uddin, S.; Al-Ghadban, A.N.; Gevao, B.; Al-Shamroukh, D.; Al-Khabbaz, A. Estimation of suspended particulate matter in Gulf using MODIS data. Aquat. Ecosyst. Health Manag. 2012, 15, 41–44. [Google Scholar] [CrossRef]
  46. Neelamani, S.; Al-Dousari, A. A study on the annual fallout of the dust and the associated elements into the Kuwait Bay, Kuwait. Arab. J. Geosci. 2016, 9, 210. [Google Scholar] [CrossRef]
  47. Qasem, J.A.; Nasrallah, H.; Al-Khalaf, B.N.; Al-Sharifi, F.; Al-Sherafyee, A.; Almathkouri, S.A.; Al-Saraf, H. Meteorological factors, aeroallergens and asthma-related visits in Kuwait: A 12-month retrospective study. Ann. Saudi Med. 2008, 28, 435–441. [Google Scholar] [CrossRef] [PubMed]
  48. Al-Salameen, F.; Habibi, N.; Uddin, S.; Al-Mataqi, K.; Al-Doaij, B.; Al-Amad, S.; Ali, E. Characterization and Identification of Microorganisms Associated with Airborne Dust in Kuwait; Kuwait Institute for Scientific Research: Safat, Kuwait, 2020. [Google Scholar] [CrossRef]
  49. Behbehani, M.; Carvalho, F.P.; Uddin, S.; Habibi, N. Enhanced Polonium Concentrations in Aerosols from the Gulf Oil Producing Region and the Role of Microorganisms. Int. J. Environ. Res. Public Health 2021, 18, 13309. [Google Scholar] [CrossRef] [PubMed]
  50. Habibi, N.; Uddin, S.; Al-Salameen, F.; Al-Amad, S.; Kumar, V.; Al-Otaibi, M.; Razzack, N.A.; Shajan, A.; Shirshikar, F. SARS-CoV-2, other respiratory viruses and bacteria in aerosols: Report from Kuwait’s hospitals. Indoor Air 2021, 31, 1815–1825. [Google Scholar] [CrossRef]
  51. Habibi, N.; Uddin, S.; Behbehani, M.; Abdul Razzack, N.; Hussain, F.Z.; Shajan, A. SARS-CoV-2 in hospital air as revealed by comprehensive respiratory viral panel sequencing. Infect. Prev. Pract. 2022, 4, 100199. [Google Scholar] [CrossRef]
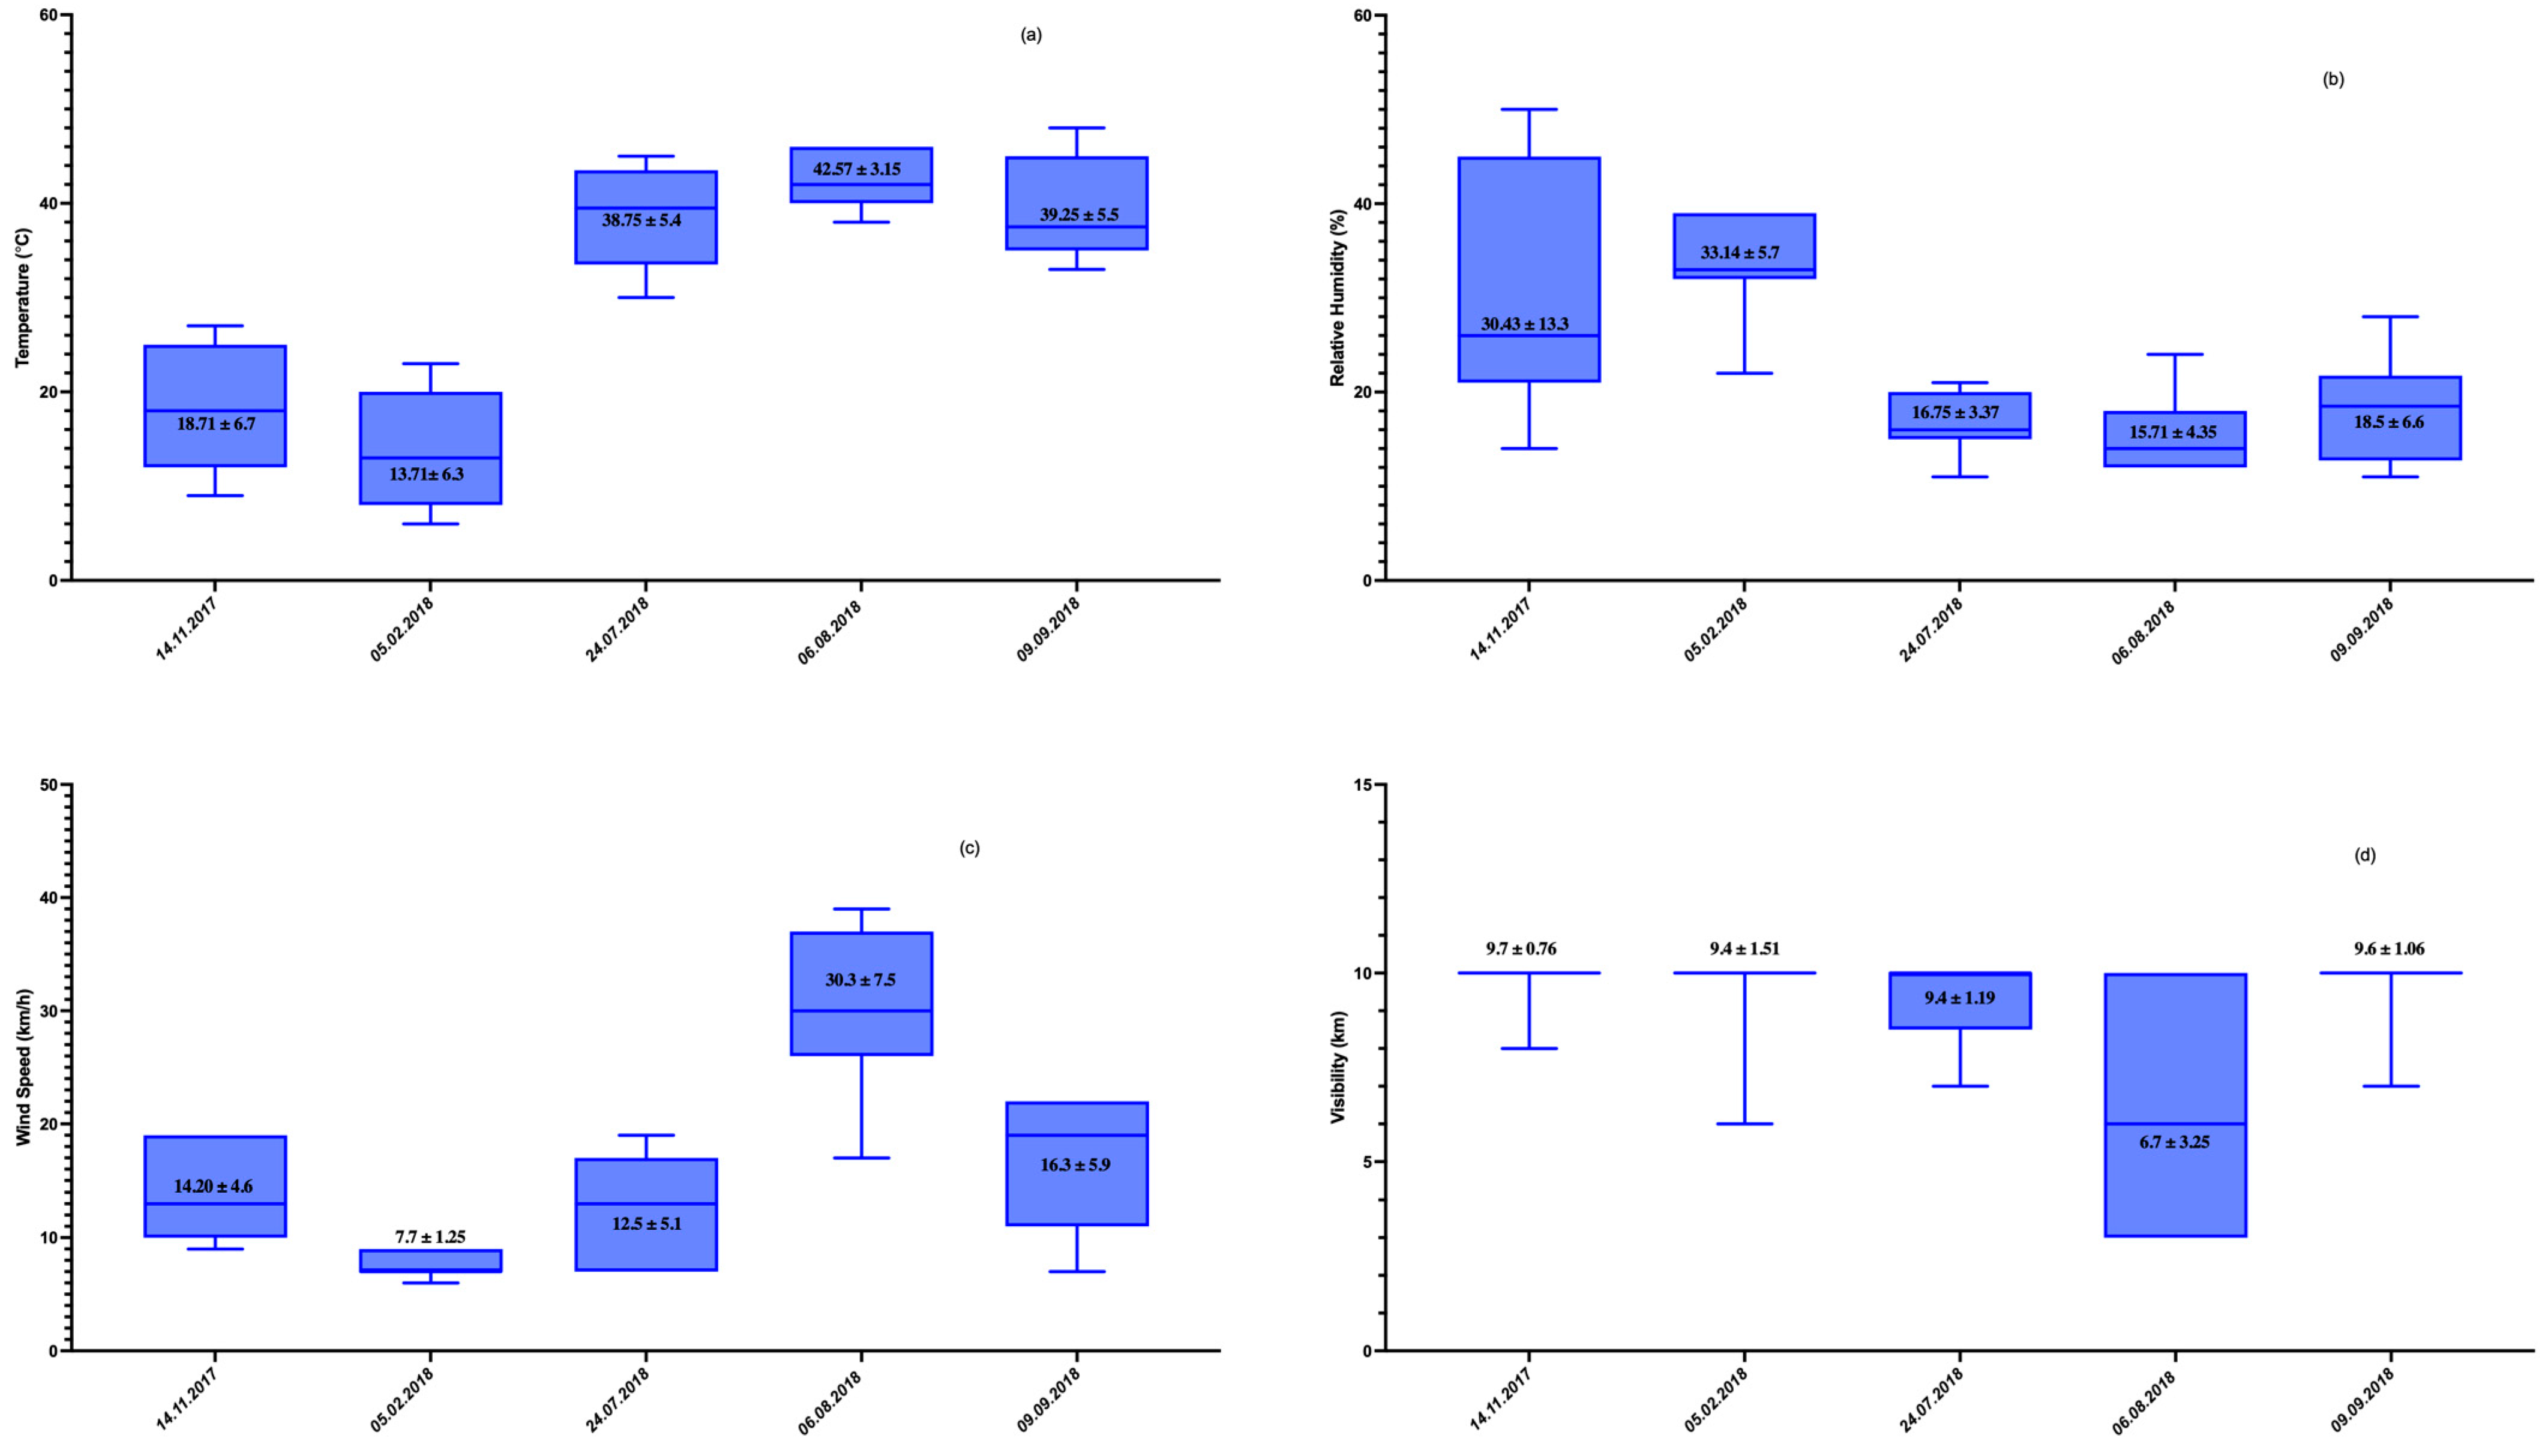
Figure 1. Meteorological factors prevailing during the 24 h of sampling. (a) Temperature, (b) relative humidity, (c) wind speed, and (d) visibility. The boxes represent the interquartile range. The values in the boxes correspond to the mean ± SD.
Atmosphere 15 00806 g001
Figure 2. Taxonomic profiles of fungi present in aerosol collected from a remote location in Kuwait. (a): Heat tree showing the taxonomic composition; colors of the nodes represent abundance, a scale to which has been provided on the right-hand side panel. (b): Correlation map of abundances of dominant genera; the suffices a-d denote the different dates of sample collection. (c): Core fungal biome of aerosols. (d) Relative abundances of dominant genera in different size fractions of aerosols.
Atmosphere 15 00806 g002
Figure 3. Alpha and beta diversity analysis. (a) Observed alpha diversity, (b) Shannon alpha diversity, The x-axis shows the stages and the corresponding alpha diversity indices are plotted on the y-axis. (c) principal coordinate analysis (PCoA) on Bray Curtis distances. The nodes are coloured according to the stage. A colour scale has been provided as a panel at the right-hand side.
Atmosphere 15 00806 g003
Figure 4. Correlation pattern of fungal genera. The multi-colored nodes represent the RA of each genus in seven size fractions. The blue circles at the outer edge exhibit the MI index between each size fraction.
Atmosphere 15 00806 g004
Figure 5. Variations between the fungal communities of inhalable and respirable fractions. (a) Differential abundance tree based on non-parametric Wilcoxon sum test. (b) Alpha diversity analysis based on observed OTUs. (c) Alpha diversity analysis based on the Shannon index. The pairwise comparisons were performed through ANOVA (p < 0.05). (d) principal coordinate analysis (PCoA) on Bray Curtis distances between the samples. The nodes are coloured according to the inhalable (I) and respirable (R) fractions. A colour code to the same has been provided on the right-hand side.
Atmosphere 15 00806 g005
Figure 6. FunFun-based functional prediction of ITS3-ITS4 sequences. (a) Log10 counts of total KEGG orthologies; (b) predominant KEGG pathway.
Atmosphere 15 00806 g006
Figure 7. Simple linear regression between relative abundances of dominant fungal genera and environmental variables. (a) Temperature, (b) humidity, (c) wind speed, and (d) visibility.
Atmosphere 15 00806 g007
Table 1. Differentially abundant taxa across six size fractions of air.
Taxa RankTaxa NameStagesLog2 Median RatioMedian diff RA %Mean diff RA %Wilcoxon (p)
OrderIncertae sedis14−7.04−0.002−0.0020.029
FamilyGlomerellaceae14−5.71−0.001−0.0010.029
GenusGlomerella14−5.71−0.001−0.0010.029
SpeciesColletotrichum gloeosporioides14−5.71−0.001−0.0010.029
SpeciesCandida sp_F1514-Inf−0.000−0.0000.021
SpeciesCercospora capsici64Inf0.0000.0000.044
GenusPseudallescheria31-Inf−0.000−0.0000.042
SpeciesPseudallescheria fimeti31-Inf−0.000−0.0000.042
SpeciesChaetomium sp_CBS_12329431-Inf−0.000−0.0000.042
FamilyGlomerellaceae54-Inf−0.001−0.0010.050
FamilyClavicipitaceae54Inf0.0000.0000.032
GenusGlomerella54-Inf−0.001−0.0010.050
GenusBeauveria54Inf0.0000.0000.032
SpeciesColletotrichum gloeosporioides54-Inf−0.001−0.0010.050
SpeciesBeauveria bassiana54Inf0.0000.0000.032
FamilyClavicipitaceae53Inf0.0000.0000.017
GenusBeauveria53Inf0.0000.0000.017
SpeciesBeauveria bassiana53Inf0.0000.0000.017
ClassSaccharomycetes241.070.0020.0030.029
OrderSaccharomycetales241.070.0020.0030.029
FamilyHypocreaceae24Inf0.0010.0010.027
GenusTrichoderma24Inf0.0010.0010.027
ClassSaccharomycetes213.050.0030.0030.029
OrderSaccharomycetales213.050.0030.0030.029
FamilyIncertae sedis214.300.0020.0030.029
GenusCandida214.300.0020.0030.029
FamilyIncertae sedis232.840.0010.0020.037
GenusCandida232.840.0010.0020.037
FamilyHypocreaceae25Inf0.0010.0010.050
GenusTrichoderma25Inf0.0010.0010.050
Stage 1 corresponds to >10.2 µm size fraction, Stage 2 is between >4.2 and 10.2 µm, Stage 3 ranges from >2.1 to 4.2 µm, Stage 4 represents >1.3–2.1 µm, Stage 5 is >0.69–1.3 µm and Stage 6 denotes the sizes between 0.39 and 0.69 µm.
Disclaimer/Publisher’s Note: The statements, opinions and data contained in all publications are solely those of the individual author(s) and contributor(s) and not of MDPI and/or the editor(s). MDPI and/or the editor(s) disclaim responsibility for any injury to people or property resulting from any ideas, methods, instructions or products referred to in the content.