Article

Low-Cost Sensor Monitoring of Air Quality Indicators during Outdoor Renovation Activities around a Dwelling House

Department of Applied and Nonlinear Optics, Institute for Solid State Physics and Optics, HUN-REN Wigner Research Centre for Physics, P.O. Box 49, H-1525 Budapest, Hungary
Atmosphere 2024, 15(7), 790; https://doi.org/10.3390/atmos15070790
Submission received: 22 April 2024 / Accepted: 28 June 2024 / Published: 30 June 2024

Abstract

:
A couple of air quality (AQ) parameters were monitored with two types of low-cost sensors (LCSs) before, during and after the garden fence rebuilding of a dwelling house, located at the junction of a main road and a side street in a suburban area of Budapest, Hungary. The AQ variables, recorded concurrently indoors and outdoors, were particulate matter (PM1, PM2.5, PM10) and some gaseous trace pollutants, such as CO2, formaldehyde (HCHO) and volatile organic compounds (VOCs). Medium-size aerosol (PM2.5-1), coarse particulate (PM10-2.5) and indoor-to-outdoor (I/O) ratios were calculated. The I/O ratios showed that indoor fine and medium-size PM was mostly of outdoor origin; its increased levels were observed during the renovation. The related pollution events were characterized by peaks as high as 100, 95 and 37 µg/m3 for PM1, PM2.5-1 and PM10-2.5, respectively. Besides the renovation, some indoor sources (e.g., gas-stove cooking) also contributed to the in-house PM1, PM2.5-1 and PM10-2.5 levels, which peaked as high as 160, 255 and 220 µg/m3, respectively. In addition, these sources enhanced the indoor levels of CO2, HCHO and, rarely, VOCs. Increased and highly fluctuating VOC levels were observed in the outdoor air (average: 0.012 mg/m3), mainly due to the use of paints and thinners during the reconstruction, though the use of a nearby wood stove for heating was an occasional contributing factor. The acquired results show the influence of the fence renovation-related activities on the indoor air quality in terms of aerosols and gaseous components, though to a low extent. The utilization of high-resolution LCS-assisted monitoring of gases and PMx helped to reveal the changes in several AQ parameters and to assign some dominant emission sources.

1. Introduction

Anthropogenic air pollutants have a considerable influence on atmospheric climate [1] and the health of the human population in terms of proven negative effects, such as asthma and COPD [2]. They also have an impact on the preservation of historic buildings and cultural heritage items on display [3]. Thus, accurate monitoring and setting up proper measures of air quality (AQ), as well as the assessment and future predictions of related health effects for the population, are important, especially for locations exposed to a heavy burden of anthropogenic pollution such as, for instance, densely travelled roads [4], industrial areas [5] and sites with building construction/renovation activities, where high levels of dust and various gases/aerosols are emitted into the ambient air.
Concerning the latter topics, studies mostly related to building renovation activities and the accompanying indoor air quality (IAQ) changes have been reported in the literature [6,7,8,9,10,11,12,13,14,15,16,17,18,19,20,21,22,23,24]. Several of the research works discussed a worsened IAQ due to refurbishment activities and the so-called sick building syndrome, for instance, in connection with educational buildings [6,7,8,9,10,11], hospitals [11,12], dwelling houses [11,13,14,15,16,17,18] and office buildings [11]. The related AQ problems are manifested in terms of increased indoor pollutant levels of CO [6,7], CO2 [6,7,13,15,16,19], PM2.5 [6,16,17,18], PM4 [15], PM10 [7,9,17,23], ultra-fine PM [12,18], total suspended PM [20], formaldehyde (HCHO) [7,14,16,19], BTEX [15], volatile organic compounds (VOCs) [7,8,11,13,14,15,16,17,19], semi-volatile organic compounds (SVOCs) [14], black carbon (BC) [18], water-soluble PM constituents (nitrate, sulphate, chloride, ammonium) [20], toxic metals (Pb [9,20], Cd, Cu, and Zn [9]), asbestos particles [9] and fungi [20]. A couple of the compiled pollution cases are connected to inefficient air exchange in the study area, particularly indoors, before, during and after the renovation, e.g., Refs. [6,13], indicating a higher risk of negative health effects on humans [6,7,8]. In addition, the accumulation of toxic metals in suspended particulate matter was observed during the renovation of the interior [9,10]. Preschool children were reported to be highly sensitive to household renovation [21,22], while the enhanced level of outdoor air pollution could cause the early development of pneumonia [22] and childhood asthma [23]. Another study reported a high indoor-to-outdoor (I/O) ratio of HCHO in the air, and the wooden furniture as the main indoor source [8]. Increasing the air ventilation rate with mechanical systems and/or using low-emission furnishing was the recommended solution to mend this problem [7]. Microorganisms and carbonaceous aerosols are additional indicators of the deteriorated IAQ, for instance, in kindergartens [24]. In addition, during interior renovation, fungi suspended with the ambient aerosols may also be present indoors, though their contribution was greater before renovation [12]. Whereas ultrafine and fine PM was present at 1.6–3.3-fold higher concentrations during the renovation of the building [12]. Valdoulakis et al. [25] extensively reviewed several key air pollutants affecting the indoor air quality in homes, including their sources and the related health effects on humans.
Research on low-cost sensors (LCSs) applied for indoor and outdoor air monitoring has gained increasing attention in the past decade [26,27,28]. This is partially due to their light-weight design and ease of use in field campaigns, mostly operating with battery-powered electricity. LCSs are generally less accurate than laboratory/research-grade devices; therefore, they require more frequent calibration and accuracy checks. Therefore, such measurement systems demand scrutiny of analytical performance and instrumental limitations under field and laboratory conditions, preferably against a calibrated, reference instrument, e.g., [29,30].
As one can conclude from the above literature survey, no study has been reported so far on the application of two types of LCSs for the indoor and outdoor air of individual dwelling houses with a garden, subjected to shorter/longer renovation/rebuilding of external items, such as the garden fence. These kinds of refurbishment activities consist of several construction stages, such as the removal of the old fence and the building of a new one, which incorporates technologies that may release large amounts of pollutants. Consequently, in this study, a couple of atmospheric air pollutants were monitored by the assistance of LCSs to gain better insight into the changes in outdoor and indoor air quality before, during and after the reconstruction activities of the garden fence and to predict its possible health effects on the people living around.

2. Materials and Methods

2.1. Description of the Sampling Site and Related Refurbishment Activities

The sampling site for the present investigation was selected at a dwelling house that is typical for the region, located at the junction of a nearby main road and a side street, in a suburban area of Pesterzsébet, a district in Budapest, Hungary. The main features of the local anthropogenic activities of the sampling area of interest are described in detail in Ref. [29]. Originally (before renovation), the garden of the house was separated from the side street by a gate (width: ≈1.0 m) and a porous (≈50% permeability) fence (≈13.3 m long section), built of limestone brick (style: running bond with gaps, respectively, wall width: 0.12 m and capped brick poles of 0.25 × 0.25 m), dating back to the early 1930s. Part of this fence also served as a wall of a small toolshed (≈1.6 m width), built of brick, located in the corner of the garden (length: ≈4.5 m). This wall was part of the railing on the side of the main road. The toolshed and the original (old) fence were about 1.75 m tall, measured at the streetside. An about 40-year-old chain link fence (height: 1.70 m, length: 18.2 m) and a car gate (width: ≈2.7 m) sealed off most of the garden side lying next to the main road. The dwelling house is situated ≈18.5 m off the main road (the closest lane), at the opposite side of the garden. Along the fence, the garden is planted with a couple of grapevines and various kinds of bushes (e.g., mint, cedar, lavender, rosemary) of similar height (1–1.5 m), in rows, with some gaps at the ends. This arrangement provides a low-height barrier against resuspended street dust and other air pollutants, expected to penetrate the garden from the street. In front of these plants, about 40 pine trees of different heights (ranging at 1–9 m) were grown; they served as an additional shield for filtering the resuspended ambient dust and air pollutants. The house was built in the 1930s, using the same type of brick as the garden fence. The house has plastered walls, which were supplied with energy-efficient thermal insulation in 2017. The entry door of the house to the garden is located at the SE side. This type of building is characteristic for the outskirts of the cities and the countryside too; thus, the presented background data could be applied as general models. An overview drawing of the sampling site is depicted in Figure 1.
The renewal of the garden fence was performed from 8 August till 11 September 2022, with intermissions on the weekends and on some workdays due to rainy/stormy weather. The masons usually worked on the site from 8 a.m. till 5 p.m., with a couple of short breaks (10–20 min), though in some instances they stayed till 6 p.m. to finalize one-on-one scheduled daily task. The renovation-related activities included the demolition of the former brick/grid fence and the toolshed, the cutting/demounting of the original iron posts and their replacement with new iron poles (e.g., applying an angle grinder with a cutting disc and the use of primer and topcoat paints, with thinners), the use of a temporary fence consisting of iron bars, concrete mixing, the construction of the concrete substructure (total fence plinth height: 0.8 m) along the entire length of the fence (29 m), the laying and concreting of prefabricated fence brick stones, the application of the primer and topcoat paint on the posts and the plinth, as well as setting up one new side gate for the garden. The description of the daily activities of the renovation-related work during the sampling campaign are compiled in Table S1 of the Supplementary File, while the meteorological conditions recorded at a nearby weather station near the sampling site are summarized in Figure S1.

2.2. Instrumentation and Methods

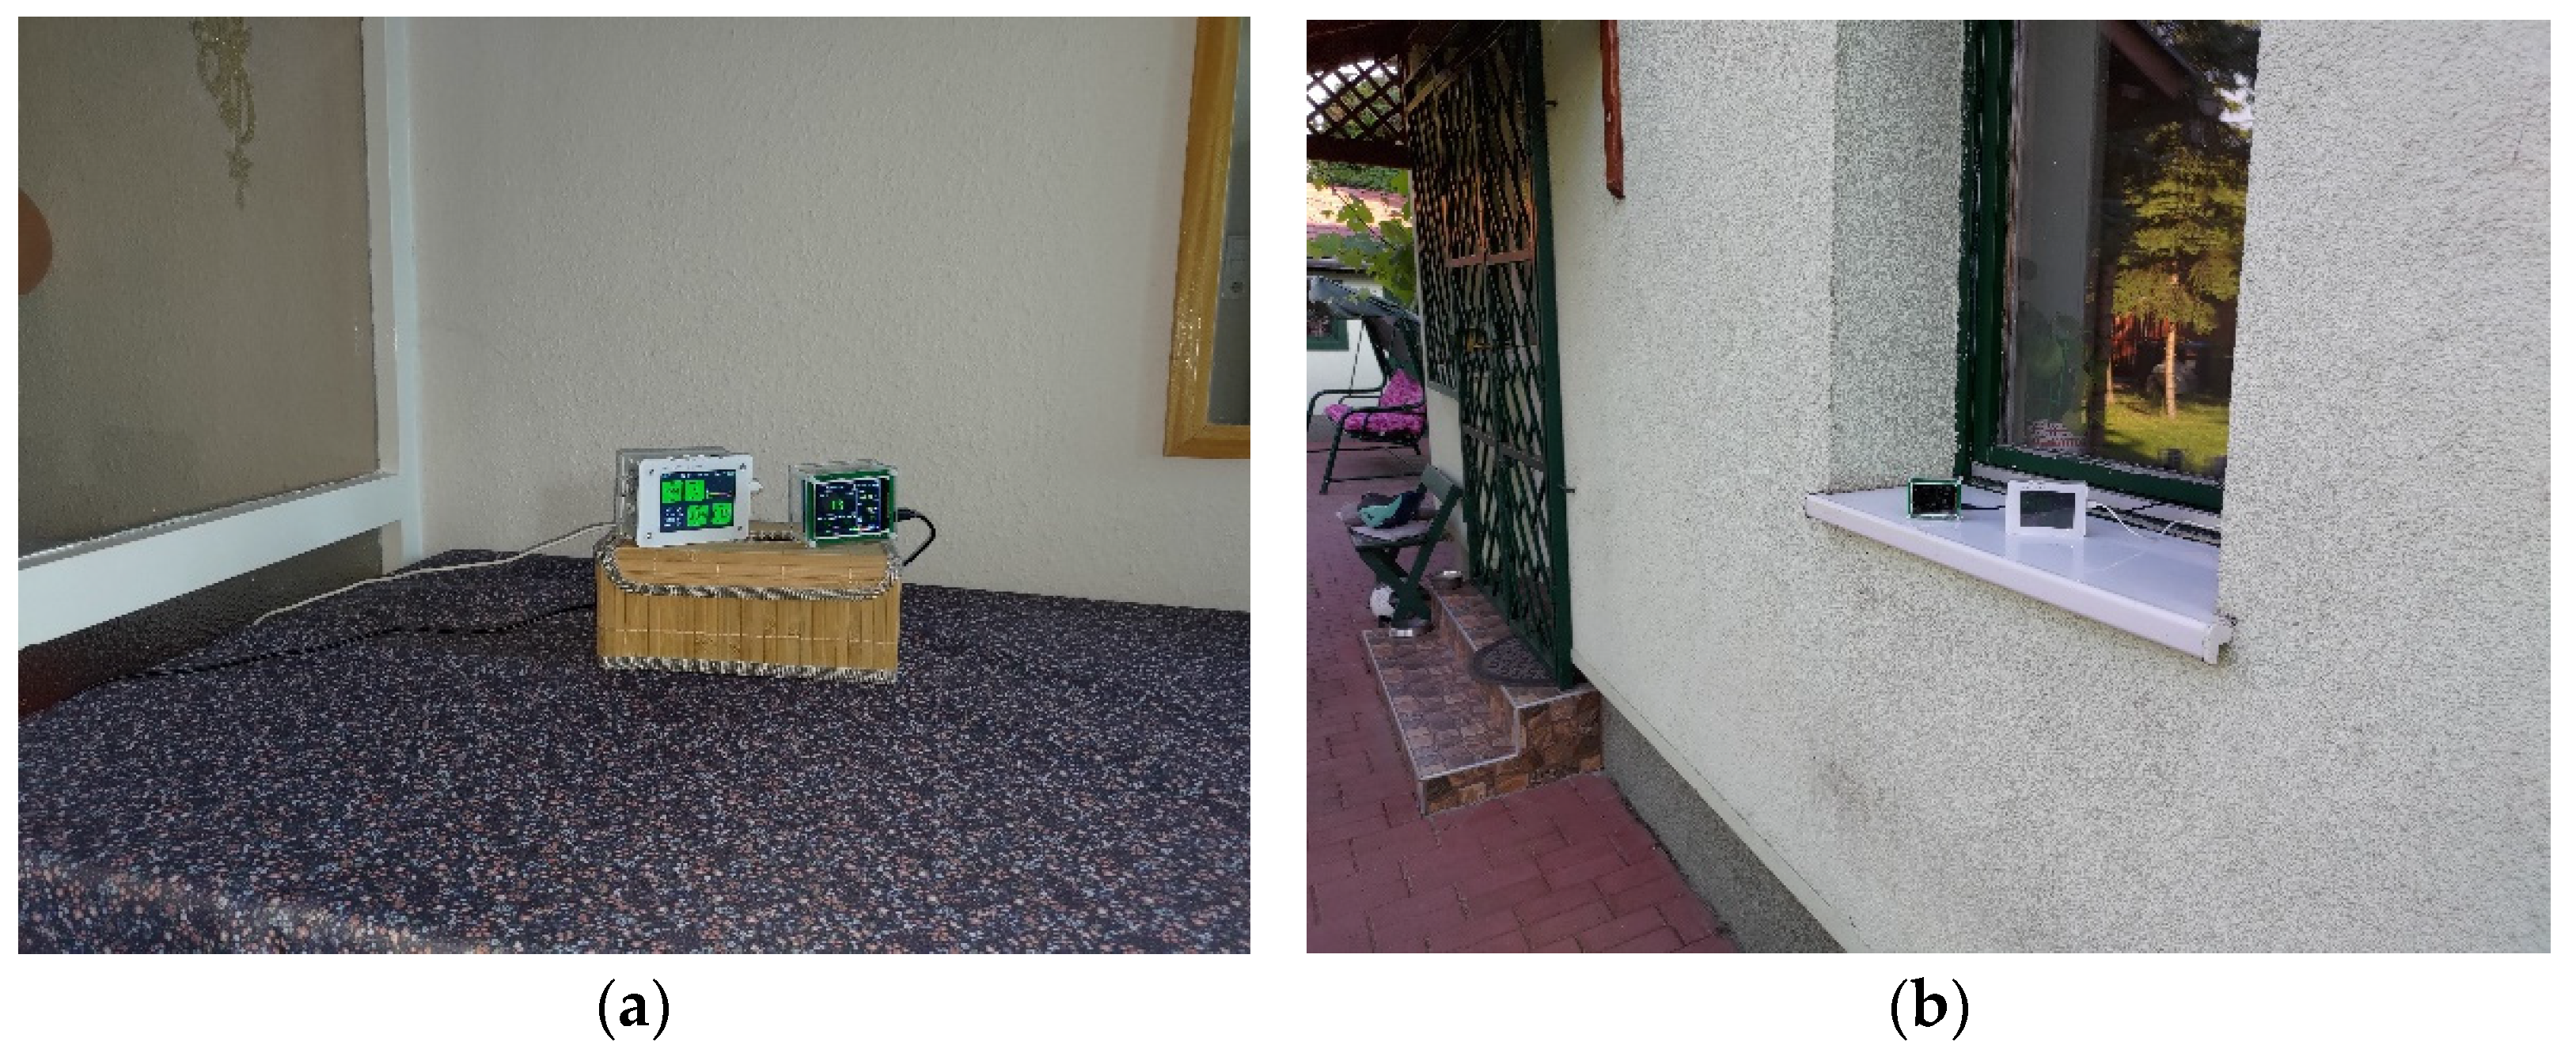
Two different designs of LCSs, i.e., Geekcreit® (China) model PM1.0/PM2.5/PM10, built with a PMS5003 Plantower PM sensor (herein referred to as GPM), and Bohu BH1 Models A3/B3 (Bohu IoT Enterprise, China) based on a Pando Technologies G7 sampler were utilized for the daily monitoring of indoor and outdoor air pollutants (Figure 2). Although both types of sensors were calibrated according to the manufacturer’s specification, they were additionally checked against a research-grade apparatus, as described in Refs. [29,30]. The outdoor sensors were deployed on a windowsill of the house, overlooking the garden (NE wall), while the indoor sensors were set up in the anteroom of the house, on a table, about 2.5 m from the entrance door. A living room and the kitchen open into the anteroom. The residents usually open the front door of the house more often in the summer period, due to the hot weather, and for airing the rooms. However, during the daily reconstruction-related activities, it was usually kept closed, similar to the windows of the house, in order to prevent the ingress of dust and aerosols. The ventilation rate of the building was assessed from the exponential decay curves of the ambient CO2 concentration, recorded in the anteroom during the sampling campaign. This method has already been well described in the literature, e.g., [31]. The calculation resulted in an average ventilation rate of 0.79 h−1 for evenings (open windows), which corresponds to an efficient indoor–outdoor air-exchange, while lower rates (0.25–0.45 h−1) were calculated for the daytime and at the end of the campaign (closed windows and doors).
The calibration of the BH1 sensors for the monitored gases was performed against analytical grade chemicals (37% HCHO, abs. EtOH, acetone, supplied by Merck) in a smoke chamber, while for CO2, stoichiometric reactions of commercial chemicals were applied as described in Ref. [32]. The sensitivity for the monitored PMx species was 1.0 µg/m3 for both sensor types. The limit of detection (LOD) of PMx acquired by the GPM and the BH1 sensors was presented in detail in Refs. [29,30], ranging about 1.5 µg/m3. For the gaseous components, the sensitivity of 1.0 ppm CO2, 0.001 mg/m3 HCHO and 0.01 mg/m3 VOCs could be realized with the applied BH1 sensors. The accuracy of the determinations for CO2, HCHO and VOCs was ±40 ppm, ±0.005 mg/m3 and ±0.1 mg/m3, respectively, according to the manufacturers’ reports.

2.3. Statistical Methods

For the evaluation of the monitoring data, Microsoft Excel© was applied throughout this study. First, the raw data were filtered for outlier values of PMx, some of these corresponding to the internal calibration cycles of the LCSs. The monitoring data, collected every second (GPM) and minute (BH1), were averaged to data of 5 min resolution for each LCS. The statistical data of various PMx and gaseous pollutants were calculated, including minimum, maximum, median, arithmetic mean, first and third quartiles. The average indoor–outdoor (I/O) ratios were calculated for each air pollutant. The Pearson’s correlation coefficient (R) was calculated for the indoor and outdoor monitoring data to reveal the relationship of the investigated air pollutants and microclimatic variables.

3. Results and Discussion

3.1. Indoor and Outdoor Aerosols, Microclimatic Variables and Their Ratios

3.1.1. Weekly Outdoor Aerosols and Microclimatic Variations

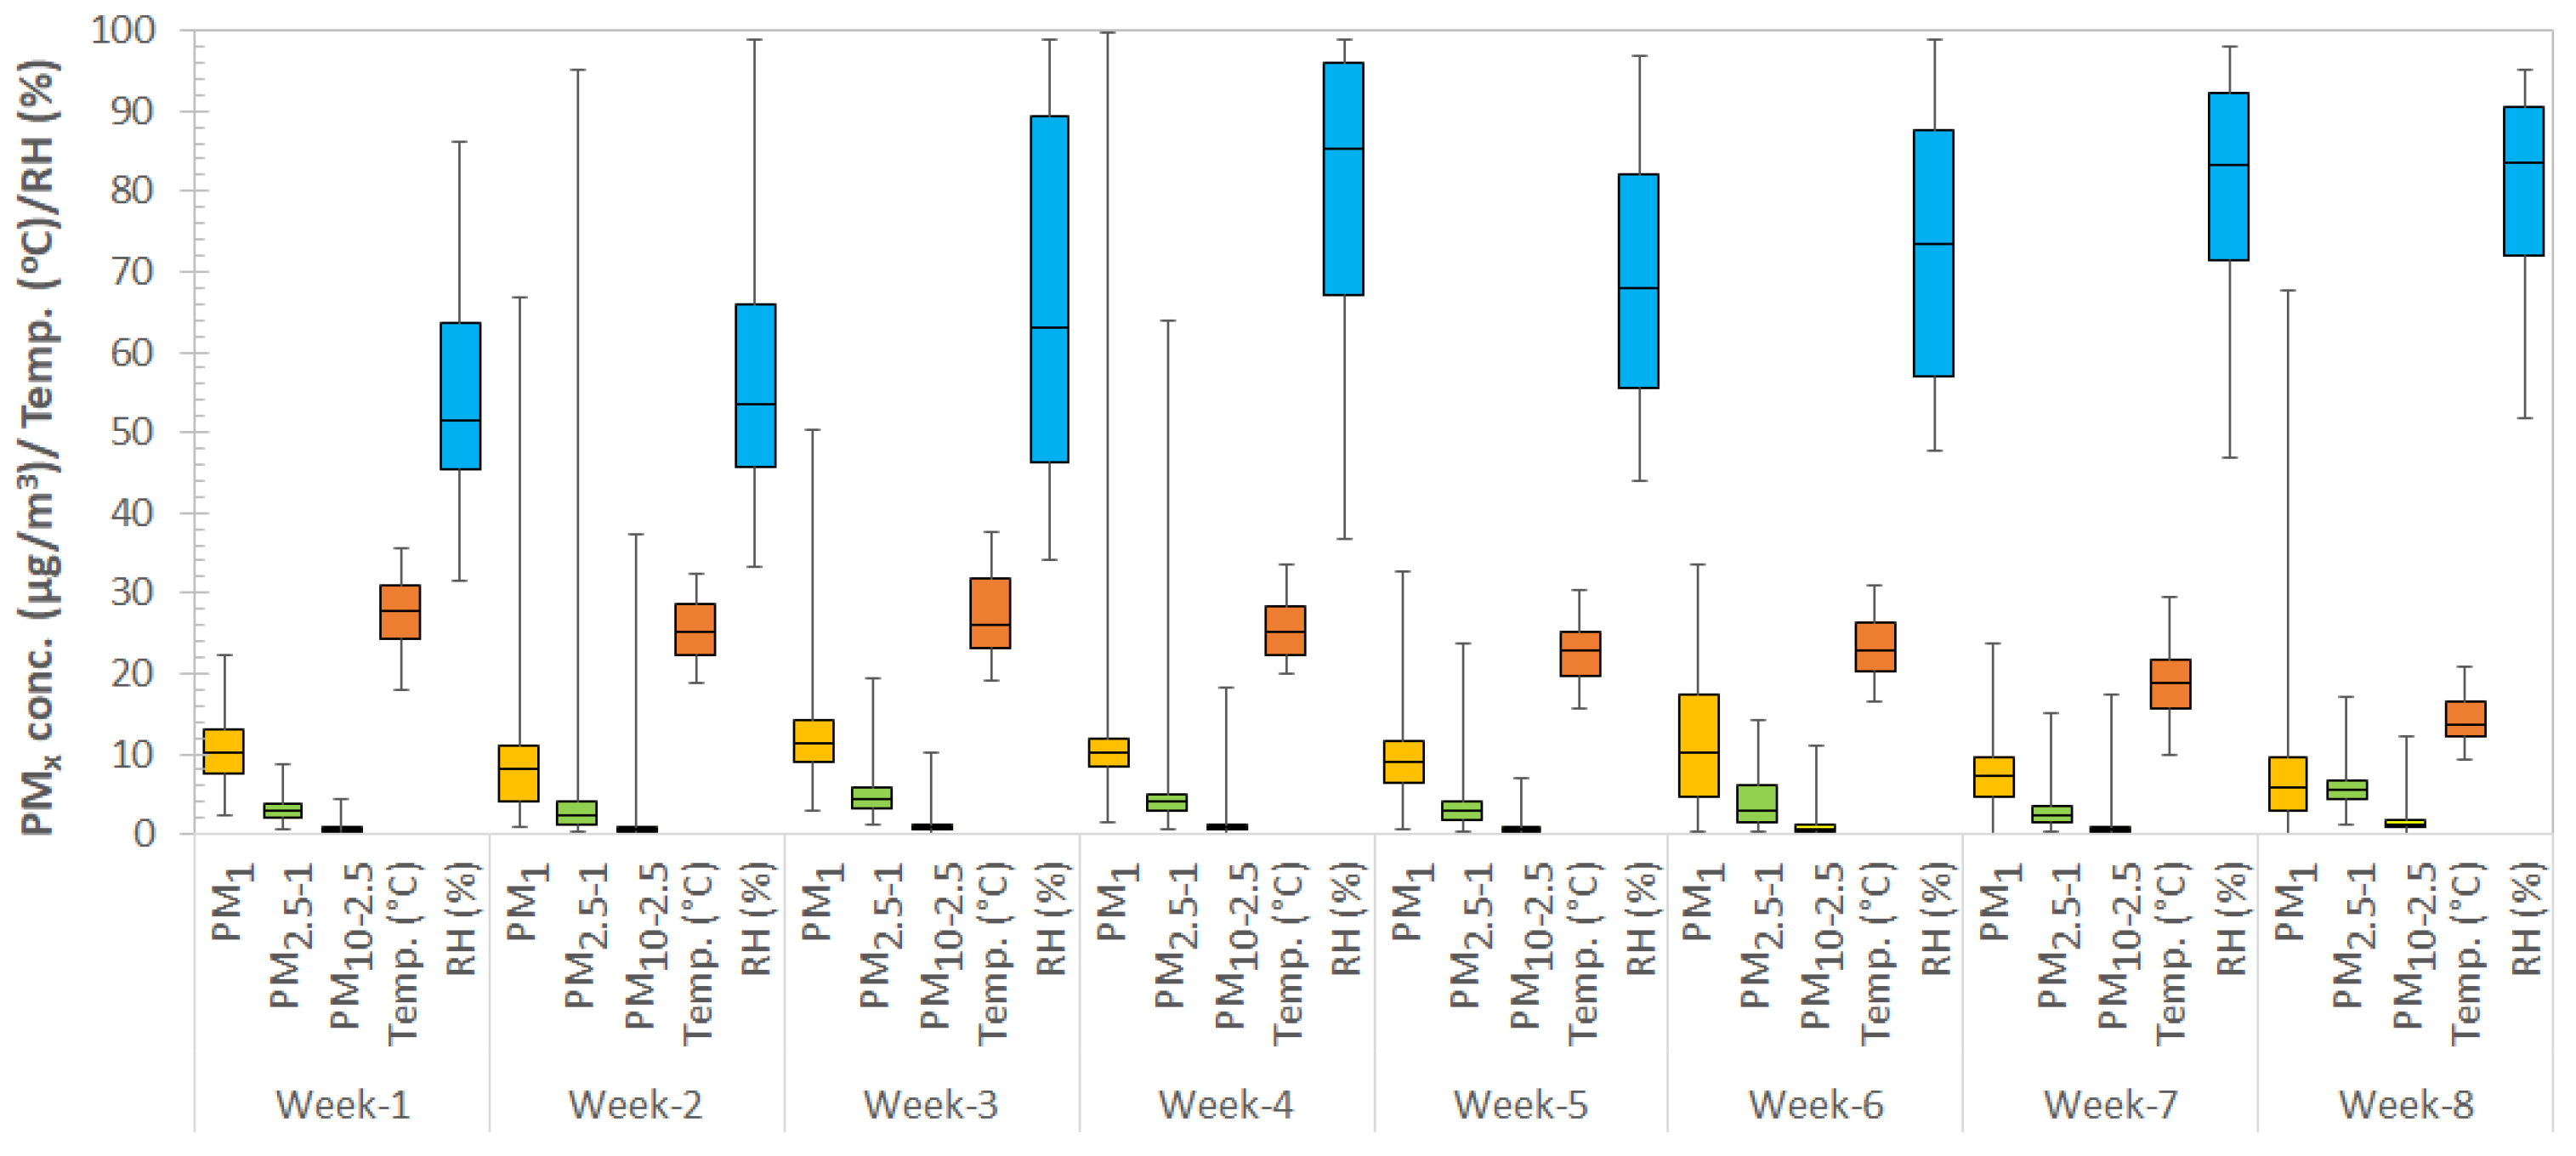
Changes in the weekly average concentrations of various PMx species and some of the microclimatic conditions were evaluated before (week 1), during (weeks 2–6) and after (weeks 7–8) the fence renovation (Figure 3). As seen, low levels of PM1, PM2.5-1 and PM10-2.5 could be observed for the week before the start of the renovation activity, with averages of 10.3, 3.0 and 0.6 µg/m3, respectively. The PMx did not show any increase on the subsequent week, when renovation started (week 2), resulting in values of 8.1, 2.9 and 0.6 µg/m3, respectively. However, as compared to the corresponding data of week 1, the peak concentrations of PM1, PM2.5-1 and PM10-2.5 showed a drastic increase of about 3-, 9- and 10-fold, respectively, during week 2, reaching values as high as 67, 95 and 37 µg/m3, respectively. This effect could be expected in the renovation area, which was mostly due to the demolition of the old brick fence and the toolshed, and the related emission of a larger amount of coarse and fine dust and aerosols. Nevertheless, the sharp pollution peaks contributed to the weekly average values only to a low extent.
As it can be seen in Figure 3, the subsequent period of the renovation (weeks 3–6) was also characterized by increased average levels of PM1, PM2.5-1 and PM10-2.5, falling within the ranges of 8.9–12, 3.1–4.7 and 0.7–1.5 µg/m3, respectively, with averages of 10.7, 4.1 and 1.1 µg/m3, respectively. Peak concentrations of PM1, PM2.5-1 and PM10-2.5 ranged from 33 to 100; 14 to 64; and 7 to 18 µg/m3, respectively. This time interval of the sampling campaign corresponds to the fence renovation activities (the construction of a substructure, laying of the bricks, using cement/adhesives). Week 7 of the sampling campaign, representing the period after the renovation activities, is characterized by considerably decreased average levels of PM1, PM2.5-1 and PM10-2.5, i.e., 7.6, 2.7 and 0.7 µg/m3, respectively. These data indicate that the resuspended and on-site-produced aerosol/dust was present at increased air levels and contributed to the pollution of the outdoor air around the dwelling house. On the other hand, the PMx data of week 8 already indicates the use of wood heating in nearby dwelling houses, due to the cold autumn weather. That week was characterized by enhanced average PM2.5-1 and PM10-2.5 levels, i.e., 5.6 and 1.6 µg/m3, respectively.
Before the start of the renovation (week 1), the average RH was about medium high (57%), but its average value started to increase gradually from the onset of the renovation (weeks 2–5). This could be due to the application of higher amounts of water in this area for the purpose of the reconstruction work (e.g., concrete production) and the hot summer weather, which contributed to the continuous evaporation of the water applied, and an increased RH. However, after a decrease (week 5), the RH showed an increase till week 7 (i.e., the period after the renovation) between 69% and 81%. The sampling campaign was featured with a rather modest air temperature (range: 18.5–27.8 °C, average: 24.4 °C), showing a gradual decrease on the final weeks of the renovation (weeks 5–6), due to arrival of slightly colder early autumn weather.

3.1.2. Weekly Indoor Aerosols and Microclimatic Parameters

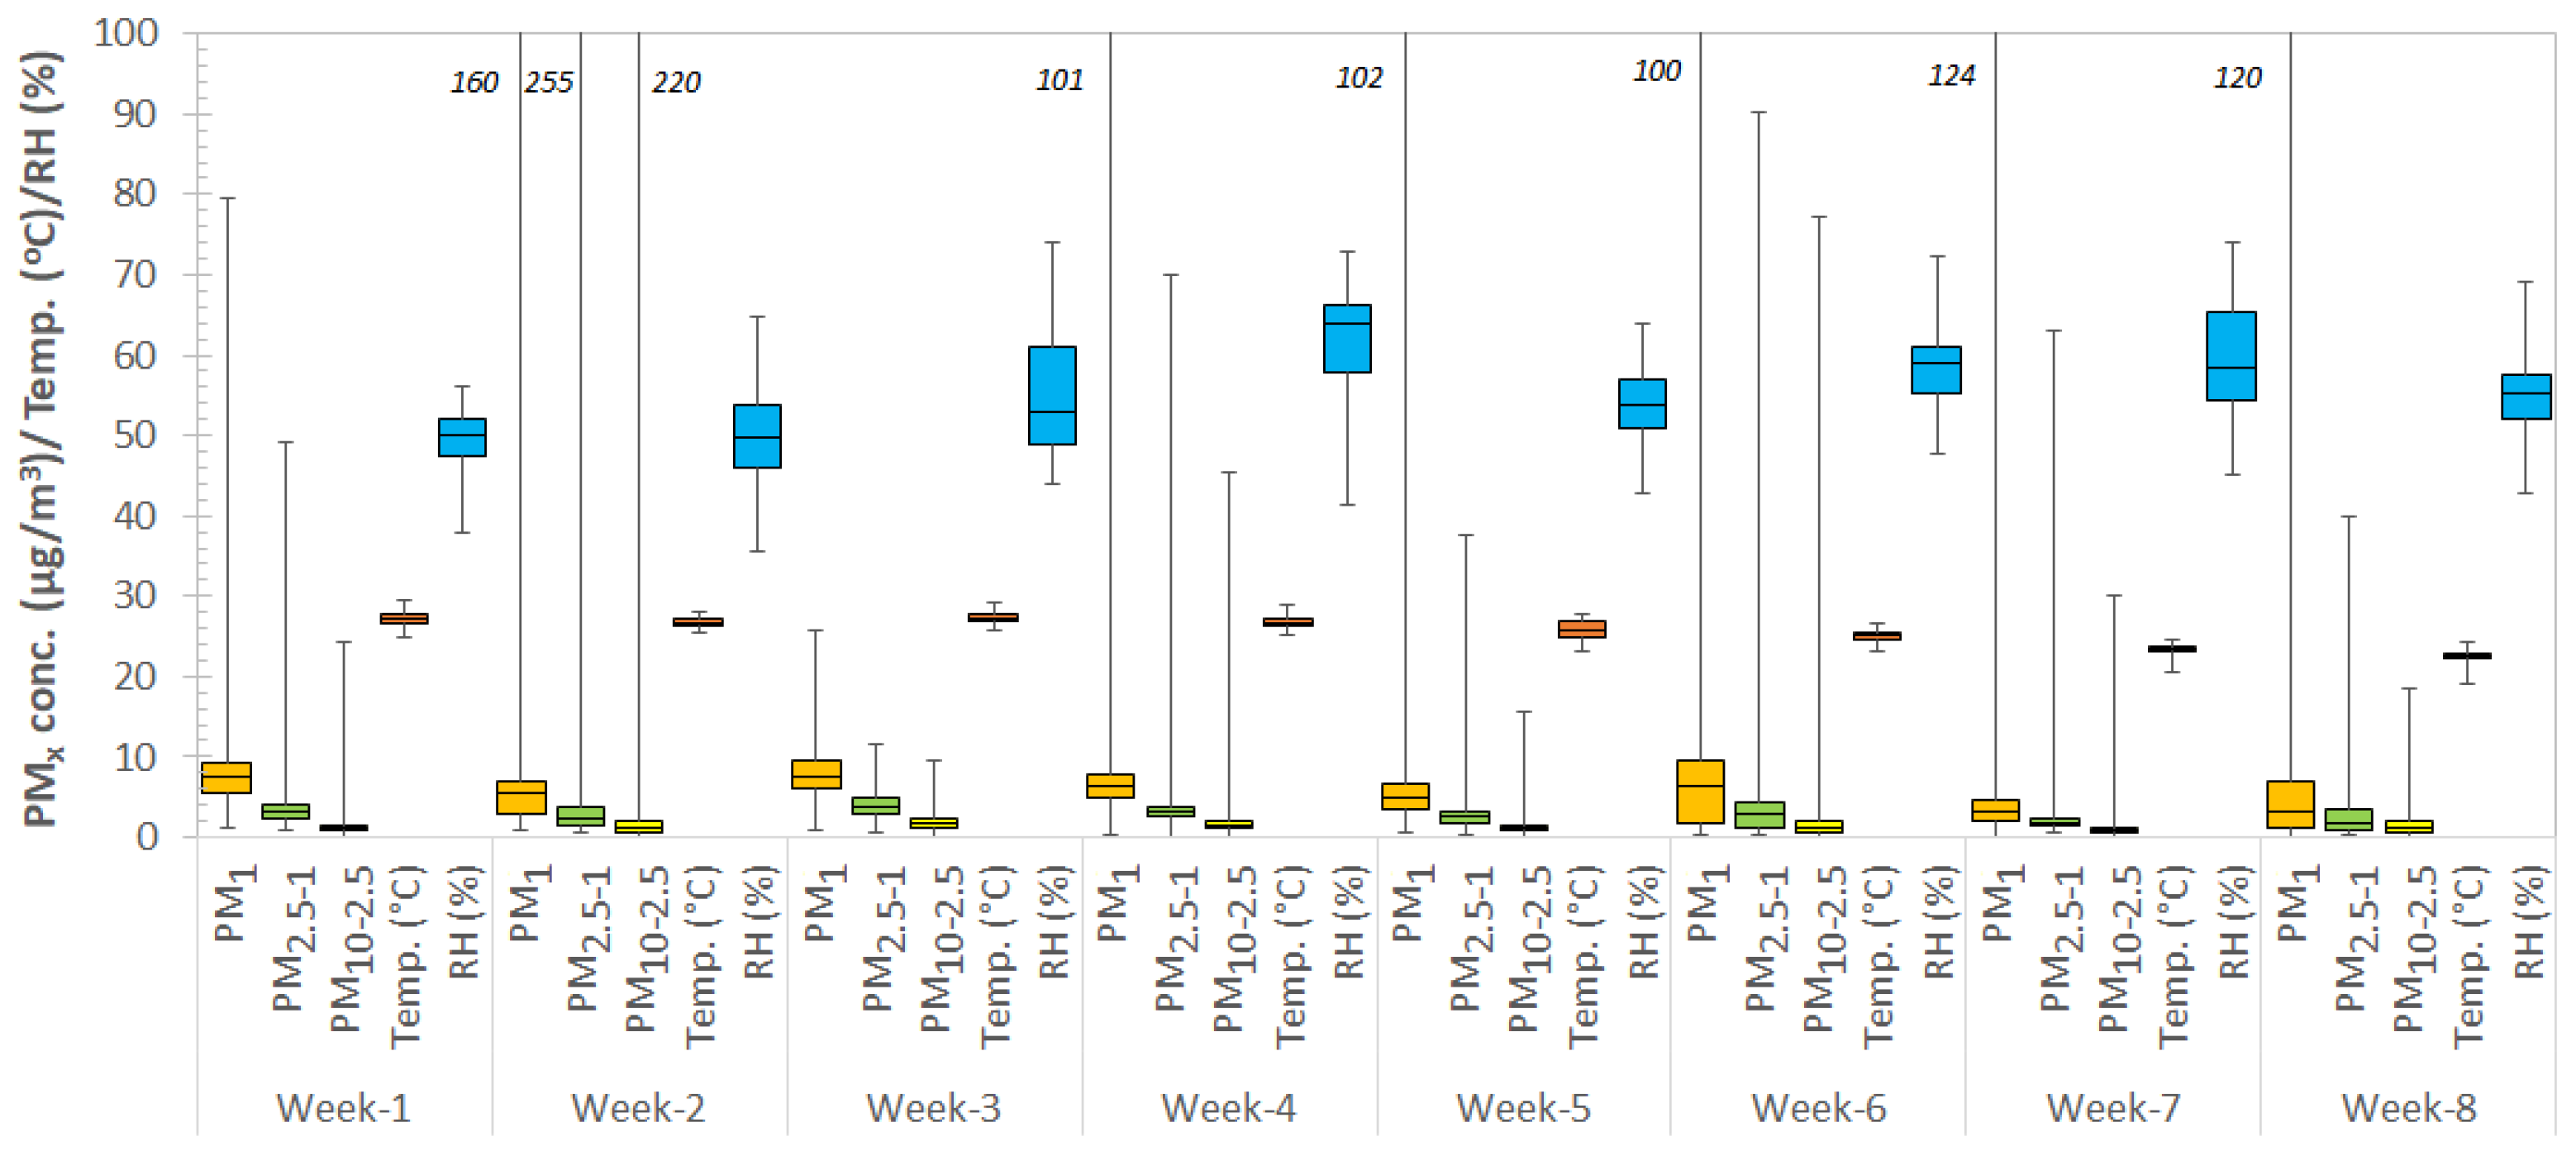
The weekly mean concentrations of the monitored PMx species and microclimatic conditions were evaluated similar to those of the outdoor air sampling, i.e., before (week 1), during (weeks 2–6) and after (weeks 7–8) the fence refurbishment (Figure 4). As can been seen, low concentrations of PM1, PM2.5-1 and PM10-2.5 could be observed for the week before the renovation activity, with averages of 7.7, 3.3 and 1.3 µg/m3, respectively. Of these variables, the mean value of PM1 and PM2.5-1 showed a small decrease to 6.2 and 3.2 µg/m3 in the week when renovation started (week 2), whereas the average of PM10-2.5 developed some increases, i.e., to 1.7 µg/m3, respectively. Interestingly, this sampling week was characterized by several lower and some large peaks of PM1, PM2.5-1 and PM10-2.5, reaching as high as 160, 255 and 220 µg/m3, respectively, as compared to the former values (week 1). These data, along with the increased coarse background PMx levels and higher weekly variance point towards some influence of the ongoing renovation activities on the indoor air quality.
As seen in Figure 4, the subsequent period of the refurbishment (weeks 3–6) could be characterized by rather fluctuating average levels of PM1, PM2.5-1 and PM10-2.5, in the ranges of 5.3–8.2 (average: 7.1), 2.6–4.1 (average: 3.6) and 1.2–2.1 (average: 1.8) µg/m3, respectively. However, week 7 of the sampling campaign, i.e., after the renovation activities, was characterized by significantly dropped average levels of PM1, PM2.5-1 and PM10-2.5, with 4.3, 2.1 and 1.1 µg/m3, respectively. For the reasons explained above, week 8 was already characterized by slightly enhanced average aerosol levels, e.g., 5.7, 2.9 and 1.7 µg/m3, for PM1, PM2.5-1 and PM10-2.5, respectively.
Hansen et al. [12] reported that suspended PM with lower aerodynamic diameters was present at considerably higher levels during a nearby building demolition in the outdoor air around a hospital than before, but only by low factors: ultrafine particles increased by 1.6-fold, particles ≥ 0.3 µm by 1.6-fold, particles ≥ 0.5 µm by 2.9-fold and particles ≥ 1 µm by 3.3-fold. However, no significant effects of the outdoor construction work on the indoor air quality were reported. On the other hand, the present results point towards an increase in the concentration of the indoor PMx in the dwelling house during the fence renovation, while their levels dropped quite quickly after finishing these activities.
With regard to the microclimatic data, recorded by means of the LCSs on the first two weeks of the sampling campaign, the average indoor RH level was moderate, with similar values, i.e., ≈49.7%. However, during the subsequent sampling weeks, it developed a slightly increasing and fluctuating trend, e.g., ranging from 54% to 62% (average: 58%). The weekly indoor air temperature showed high values at the beginning of the sampling campaign (average: 27 °C), but started to decrease on week 5 (from 25.9 to 23.4 °C, average: 24.8 °C), in response to the gradual seasonal cooling of the outdoor air.

3.1.3. Weekly Trends of Indoor–Outdoor PMx Ratios

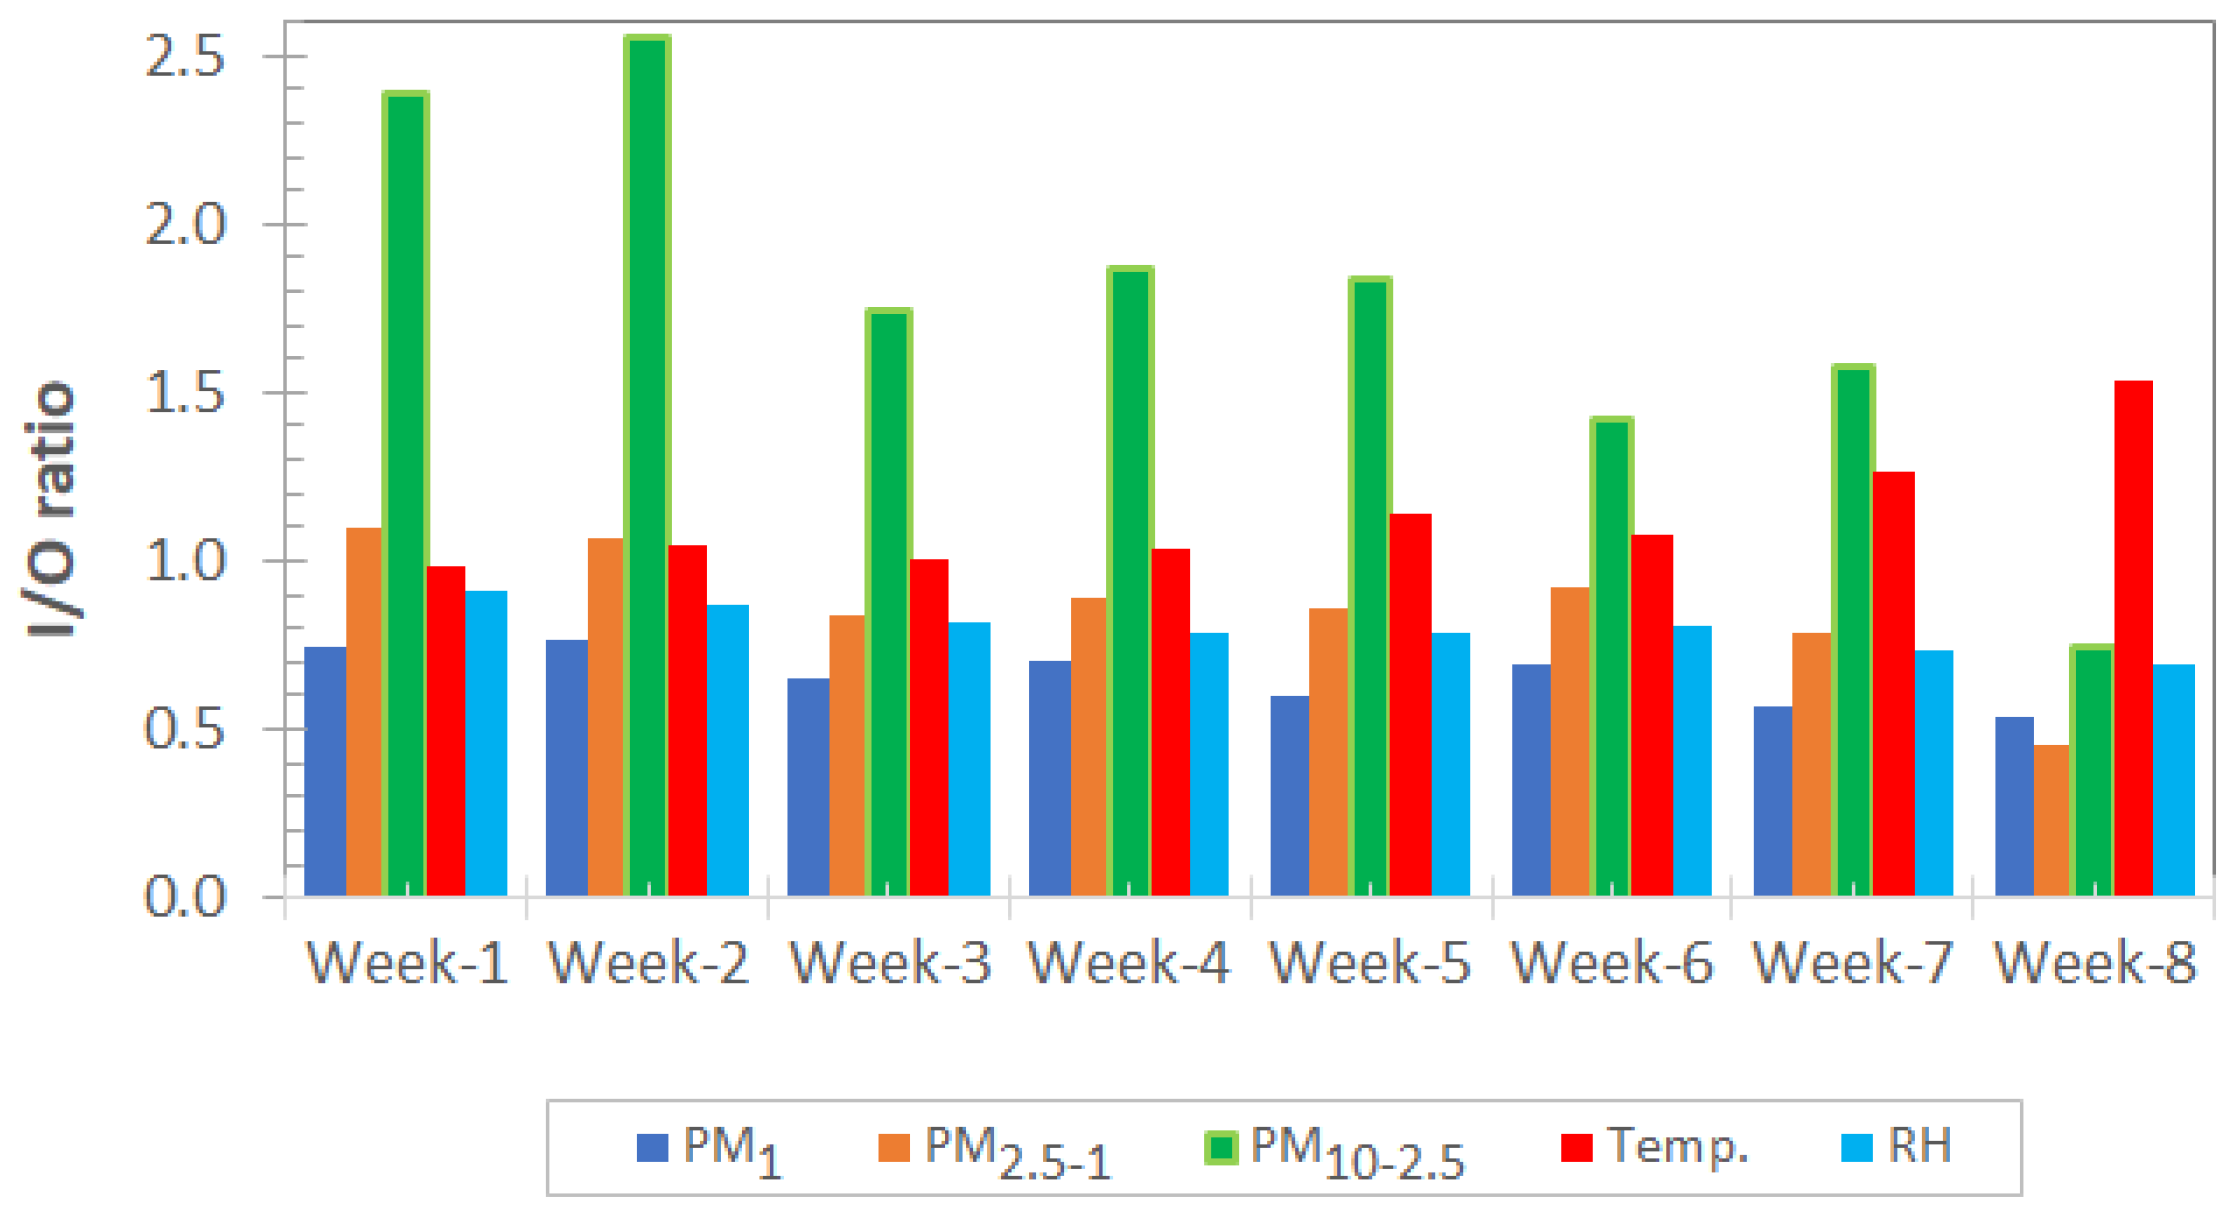
The weekly average I/O ratios for various PMx fractions are depicted in Figure 5. As one can see, the I/O ratio of PM1 was quite low, ranging from 0.6 to 0.8 (average: 0.7), showing that the fine aerosol was mostly originating from the outdoor air. This parameter featured a slightly fluctuating trend, and peaked on week 2, due in part to the rising influence of the fence renovation activity, and the related ingress of a large number of fine particulates indoors. Quite the opposite pattern could be observed for medium and coarse particles. Interestingly, I/O ratios for PM2.5-1 slightly higher than 1 could only be observed on week 1 and week 2 of the sampling campaign, i.e., about 1.1, pointing towards indoor sources of these particulates. On the other hand, starting from week 3, the I/O ratios of PM2.5-1 showed a gradually decreasing trend, with lower values (range: 0.79–0.92, average: 0.86), corresponding to outdoor sources of this aerosol fraction. Interestingly, the I/O ratio of the coarse aerosol (PM10-2.5) reached fairly high values during the whole sampling campaign, ranging from 1.4 to 2.6 (average: 1.9). These findings point towards the internal source of coarse aerosols, partly from cooking activities (related to the use of a gas stove) and/or resuspended dust/aerosol, or even the ingress of finer particles from outdoors and their efficient coagulation/accumulation in the indoor air.
The I/O ratios of the air temperature only slightly fluctuated from 1.0 to 1.3 (mean: 1.1). These data did not show any temporal pattern related to the outdoor renovation activities. However, the I/O ratios of the RH values ranged between 0.7 and 0.9 (average: 0.8). During the first two weeks of the campaign, slightly increased values for I/O RH were observed, pointing towards the lowered impact of the water content of the outdoor air. These data point towards the ingress of outdoor air with higher water content into the interior of the dwelling house during the renovation activities.

3.1.4. Weekly Outdoor Levels of Gaseous Components

The variation in the weekly average concentrations of the monitored gaseous species was evaluated before (week 1), during (weeks 2–6) and after (weeks 7–8) the renovation activities (Figure 6). As appears from the data, the weekly average air level of HCHO ranged around 0.01 mg/m3 before, during and after renovation (weeks 1–8) and demonstrated low variability for each week as well. However, larger HCHO maxima, ranging from 0.2 to 0.95 mg/m3, were observed on the fence renovation weeks. As with HCHO, the average air concentration of CO2 showed quite low fluctuation during the sampling weeks, ranging between 517 and 540 ppm (average: 530 ppm). This pollutant was characterized by variance of a medium degree, corresponding to a rather moderate motor vehicle traffic on the nearby main street.
The average weekly outdoor level of VOCs was about 0.02 mg/m3 for week 1. It showed a fluctuating pattern onwards in the next sampling weeks, peaking as high as 0.032 mg/m3 on week 3, but it decreased gradually on weeks 4–7, although a modest increase could be seen on week 8, with high fluctuations. In summary, the VOC levels varied over quite a large scale, with high peaks (e.g., 1.1 mg/m3) observed on weeks 2–3. This was mostly due to some of the painting/adhesive-related reconstruction activities and the use of thinners for the paints and on the iron support structure of the fence against weathering, as well as the painting on the plinth of the fence (primer and topcoat paints). Interestingly, on week 8, an outstandingly high VOC concentration of 2.5 mg/m3 could be observed, which was most likely due to wood burning in the neighborhood in the evening hours.

3.1.5. Weekly Indoor Levels of Gaseous Components

The variation in the weekly average concentrations of the gaseous species monitored indoors were assessed too (Figure 7). As it can be seen, the weekly mean CO2 level indoors was fluctuating between 540 and 645 ppm, with rather high variance for each sampling week. These levels are well below the recommended IAQ values summarized by the ASHRAE Standard (3500 or 5000 ppm) [33]. The indoor source of CO2 is predominantly cooking activities, related to emissions from combustion-based stoves (gas/coal/biomass stoves, e.g., [34]), and exhalation of occupants [15], each contributing to the indoor accumulation of this pollutant in contexts with sealed doors and windows or nonproper ventilation of the apartment. For instance, Sánka and Földváry [13] reported that the CO2 concentration ranged between 660 and 2050 ppm (mean: 1205 ppm) before the renovation of a residential building (block of flats). However, after the renovation to introduce energy-saving measures, significantly higher CO2 levels (range: 880–2770 ppm, mean: 1570 ppm) were recorded in several of the study apartments. This was mainly due to the lowered air-exchange rate of the building, i.e., 0.61 h−1 vs. 0.44 h−1, before and after the renovation, respectively. In addition, they reported a similarly enhanced indoor VOC concentration, i.e., 0.57 mg/m3 and 0.77 mg/m3, before and after renovation, respectively [13].
In this study, interestingly, the weekly average indoor VOC level was negligibly low, being only rarely detectable during the sampling campaign with the presently applied sensors. However, one high peak of VOCs was caught on week 8, reaching a concentration as high as 0.036 mg/m3, which was related to cooking activities in the morning. This observation is in line with the quite sharply increased CO2 concentration (range: 640–1080 ppm, average: 860 ppm) and the slightly increased PMx levels during this pollution episode, with PM1, PM2.5 and PM10 peaking at 40, 50 and 57 µg/m3, respectively. Moreover, indoor emissions of VOCs (range: 0.01–0.03 mg/m3, average: 0.02 mg/m3), whose source could not be identified, could also be observed on some occasions in week 8. They were not related to outdoor pollution, since the simultaneous monitoring with the LCSs could not detect VOCs in the outdoor air, but were likely due to some cleaning activities, which release higher levels of organics. The related literature reports on the sources of VOCs arising partly from various chemicals/materials (e.g., adhesives, paints, lacquers) of newly established/renovated buildings and partly from the occupants’ belongings and activities [14]. Overall, in the study dwelling house, the level of VOCs was found to be lower than the recommended IAQ value of the WHO (0.5 ppm).
The average weekly indoor HCHO level was rather high during the sampling campaign, ranging from 0.019 to 0.022 mg/m3, as compared to that observed for the outdoor air (cf. data of Section 3.1.4). In addition, broad fluctuations in the HCHO levels could be seen indoors, for instance, on week 6. On the other hand, it should be noted that this pollutant is primarily of indoor origin; its source is mostly related to adhesives used in wooden boards and furniture [8]. However, Dodson et al. [14] reported that besides occupants’ activities, building sources could contribute as well. The interior of the studied dwelling house is also most likely characterized by a mixed pattern of HCHO sources too, due to the predominant presence of furniture made of fiberboard and/or plywood, as well as the use of various cleaning agents and fragrances, in addition to daily cooking. Overall, the median indoor level of HCHO (0.020 mg/m3) was below the IAQ standard of the WHO (0.1 mg/m3, [35]). Similar mean/median values were documented for dwelling houses in Austria (0.025 mg/m3, n = 160) [36], France (0.0196 mg/m3, n = 567) [35], Arizona (0.021 mg/m3, n = 181) [37] and Quebec City, Canada (geometric mean: 0.0295 mg/m3, n = 91) [38]. On the other hand, the present HCHO data are twice higher than those reported for post-occupancy buildings in Boston (0.011 mg/m3) [14], but half of the average level found in Helsinki (0.041 mg/m3) [39].

3.1.6. Weekly Indoor-to-Outdoor Ratios for Gaseous Air Pollutants

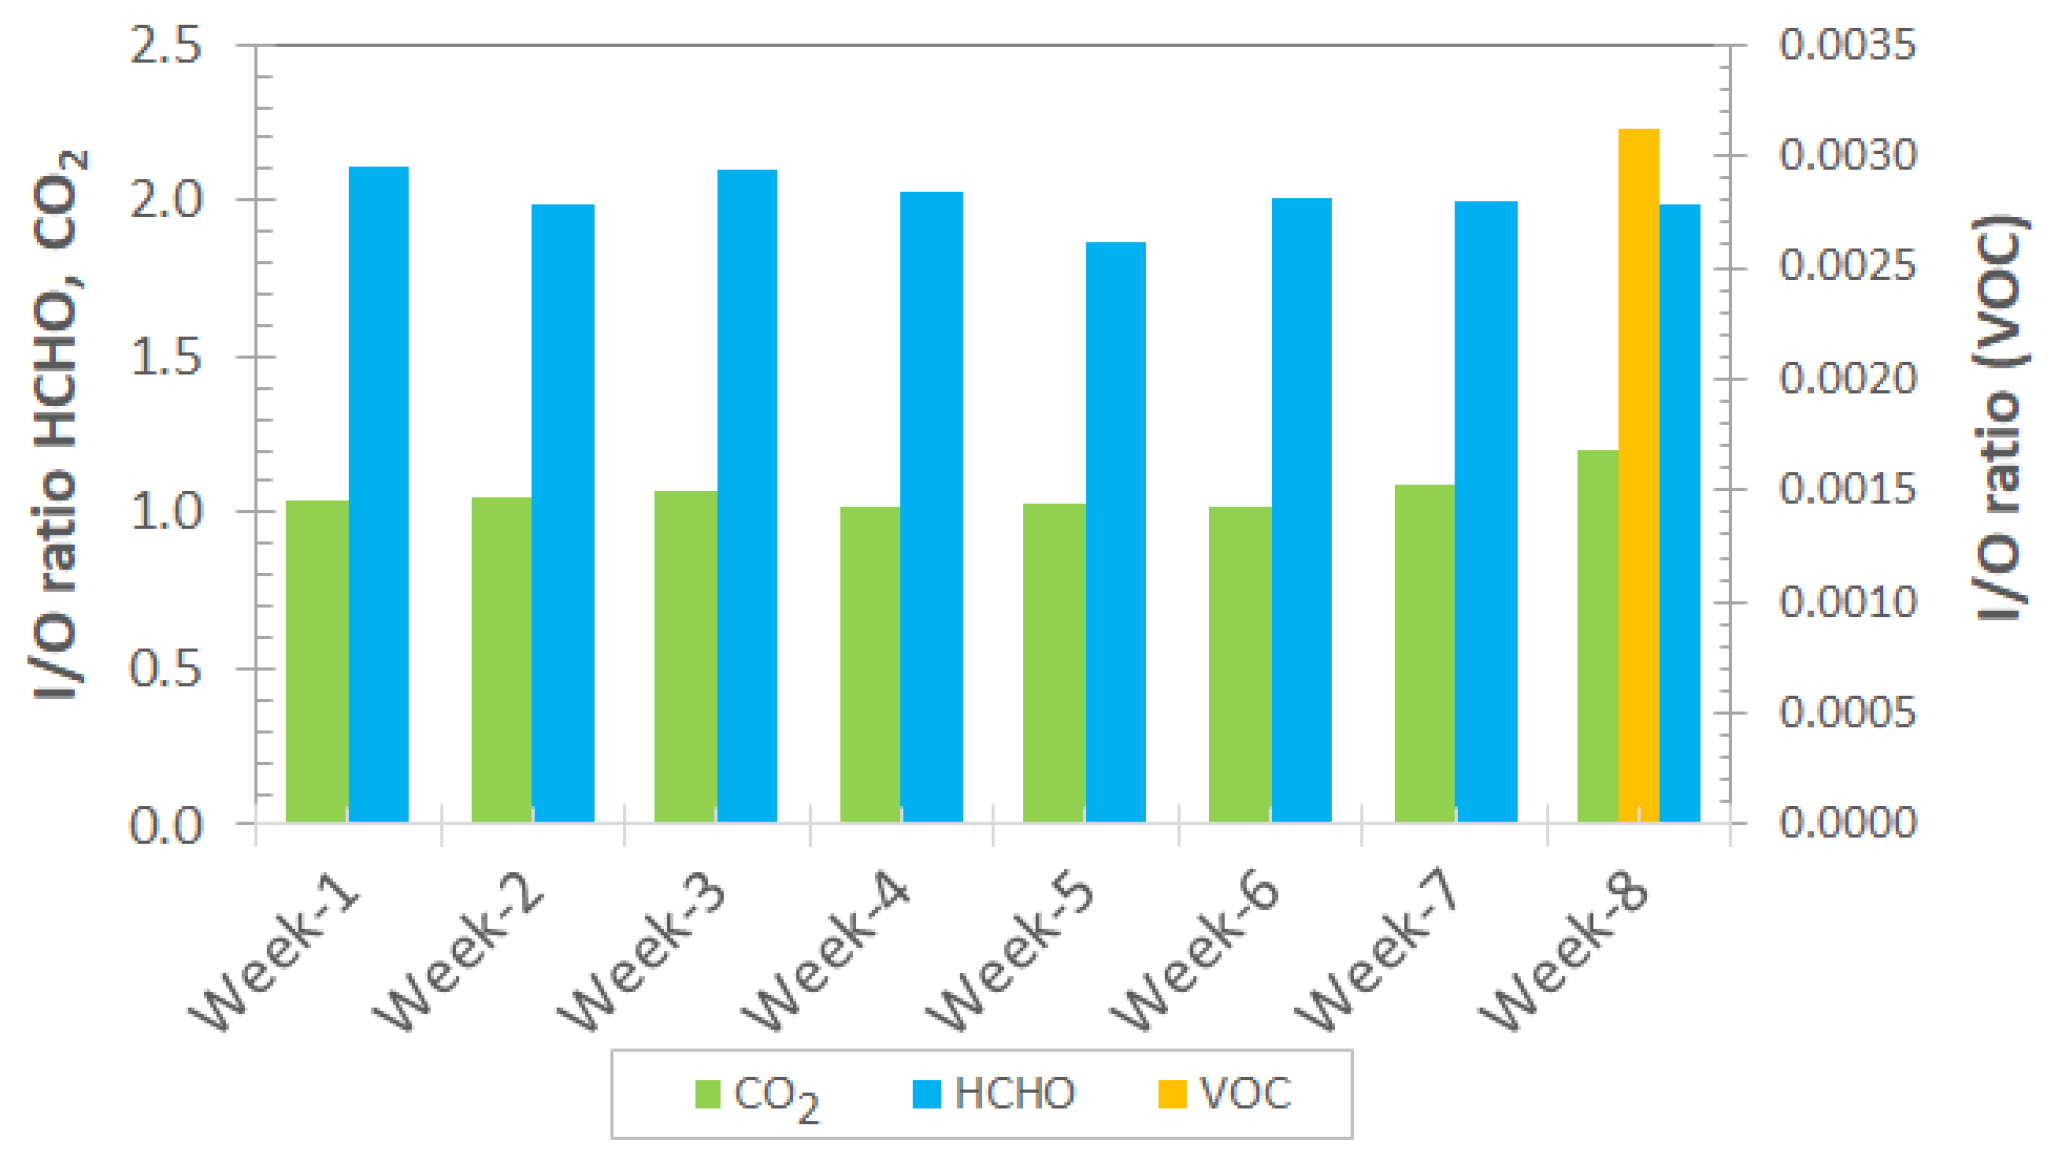
The weekly average I/O ratios for the monitored gases are depicted on Figure 8. As seen, the weekly average I/O ratio of CO2 ranged between 1.0 and 1.2, showing an increase in the first three weeks of the sampling period, followed by a decrease (weeks 4–5), and then another increase towards week 8. Similarly, the I/O ratio of HCHO developed a rather similar trend over the campaign weeks, fluctuating between 1.9 and 2.1. As expected, the VOC levels showed negligibly low I/O ratios, which was due to the low level of these species indoors, resulting in a rare detection frequency. The lower airing rates of the rooms also contributed to the less efficient introduction of fresh air, resulting in an ingress of VOCs too. Two of the monitored gaseous species (CO2 and HCHO) were mainly of indoor origin in the dwelling house, i.e., related to the usage of the gas stove for daily cooking activities (CO2, HCHO), the exhaling of residents (CO2) and/or the presence of plywood and fiberboard furniture (HCHO).

3.2. Over-Campaign Temporal Evolution of PMx and Gaseous Pollutants

3.2.1. Trends of Indoor and Outdoor PMx

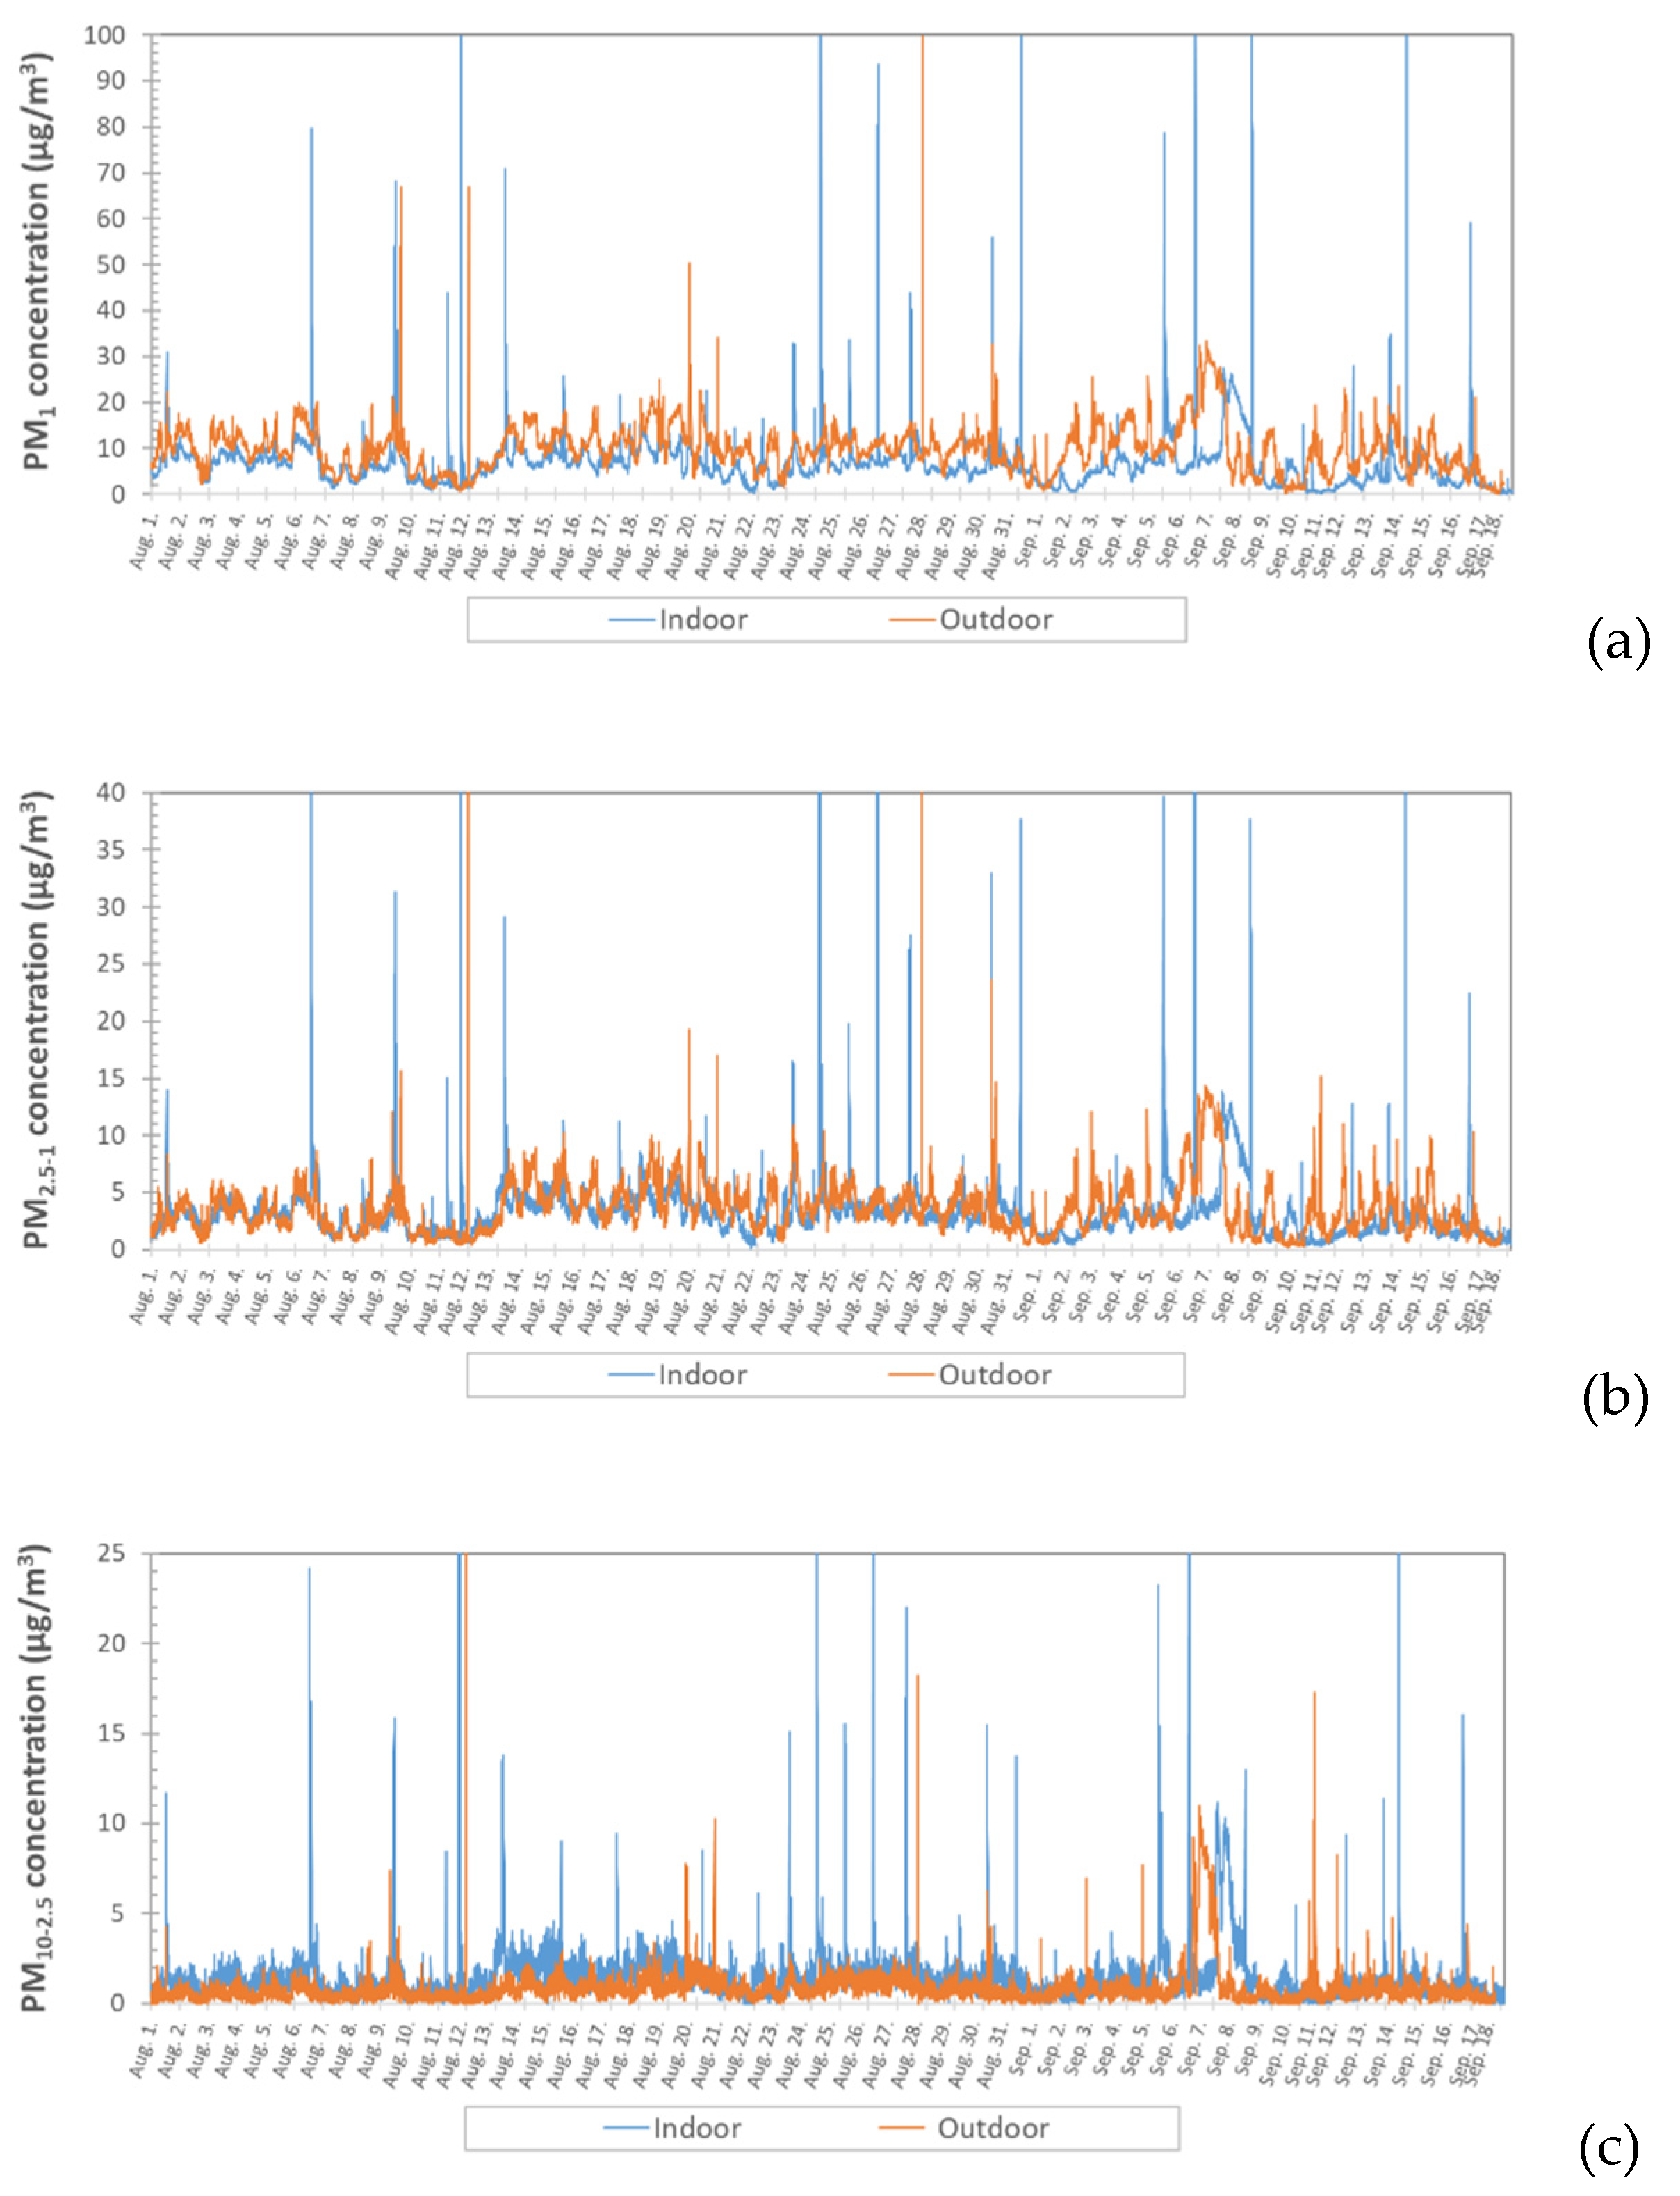
The temporal evolution of the indoor and outdoor PMx data is depicted in Figure 9a–c. As it appears, the first two weeks of the campaign could be characterized by high levels of outdoor PM1 and moderate levels of PM2.5-1 and PM10-2.5. At the middle of the week (10 and 12 August), there were some decreases in the overall PMx content in ambient air. On the other hand, enhanced background levels of PMx appeared on subsequent days and weeks, a couple of them featuring intensive peaks. A higher variability in the PMx concentrations could be seen from 6–8 September, indicating worsened air quality. Nevertheless, the overall PMx concentration began to fall after 9 September, on the last weekend of the refurbishment activities.
The temporal evolution of the indoor PMx concentration appears to follow that of the outdoor PMx regarding each aerosol fraction (Figure 9a–c). Nevertheless, the indoor air could be characterized by lower background PMx levels during the sampling campaign, whereas high peaks occurred more frequently indoors compared to the outdoor air. The high indoor peaks of PMx were mostly due to the daily cooking activities on the gas stove. As such, one of the most serious types of air pollution events was observed when using cooking oil in an open frying pan and encountering its accidental overheating and burning, which brought a significant contribution to the in-house aerosol levels.

3.2.2. Temporal Evolution of Gaseous Pollutants

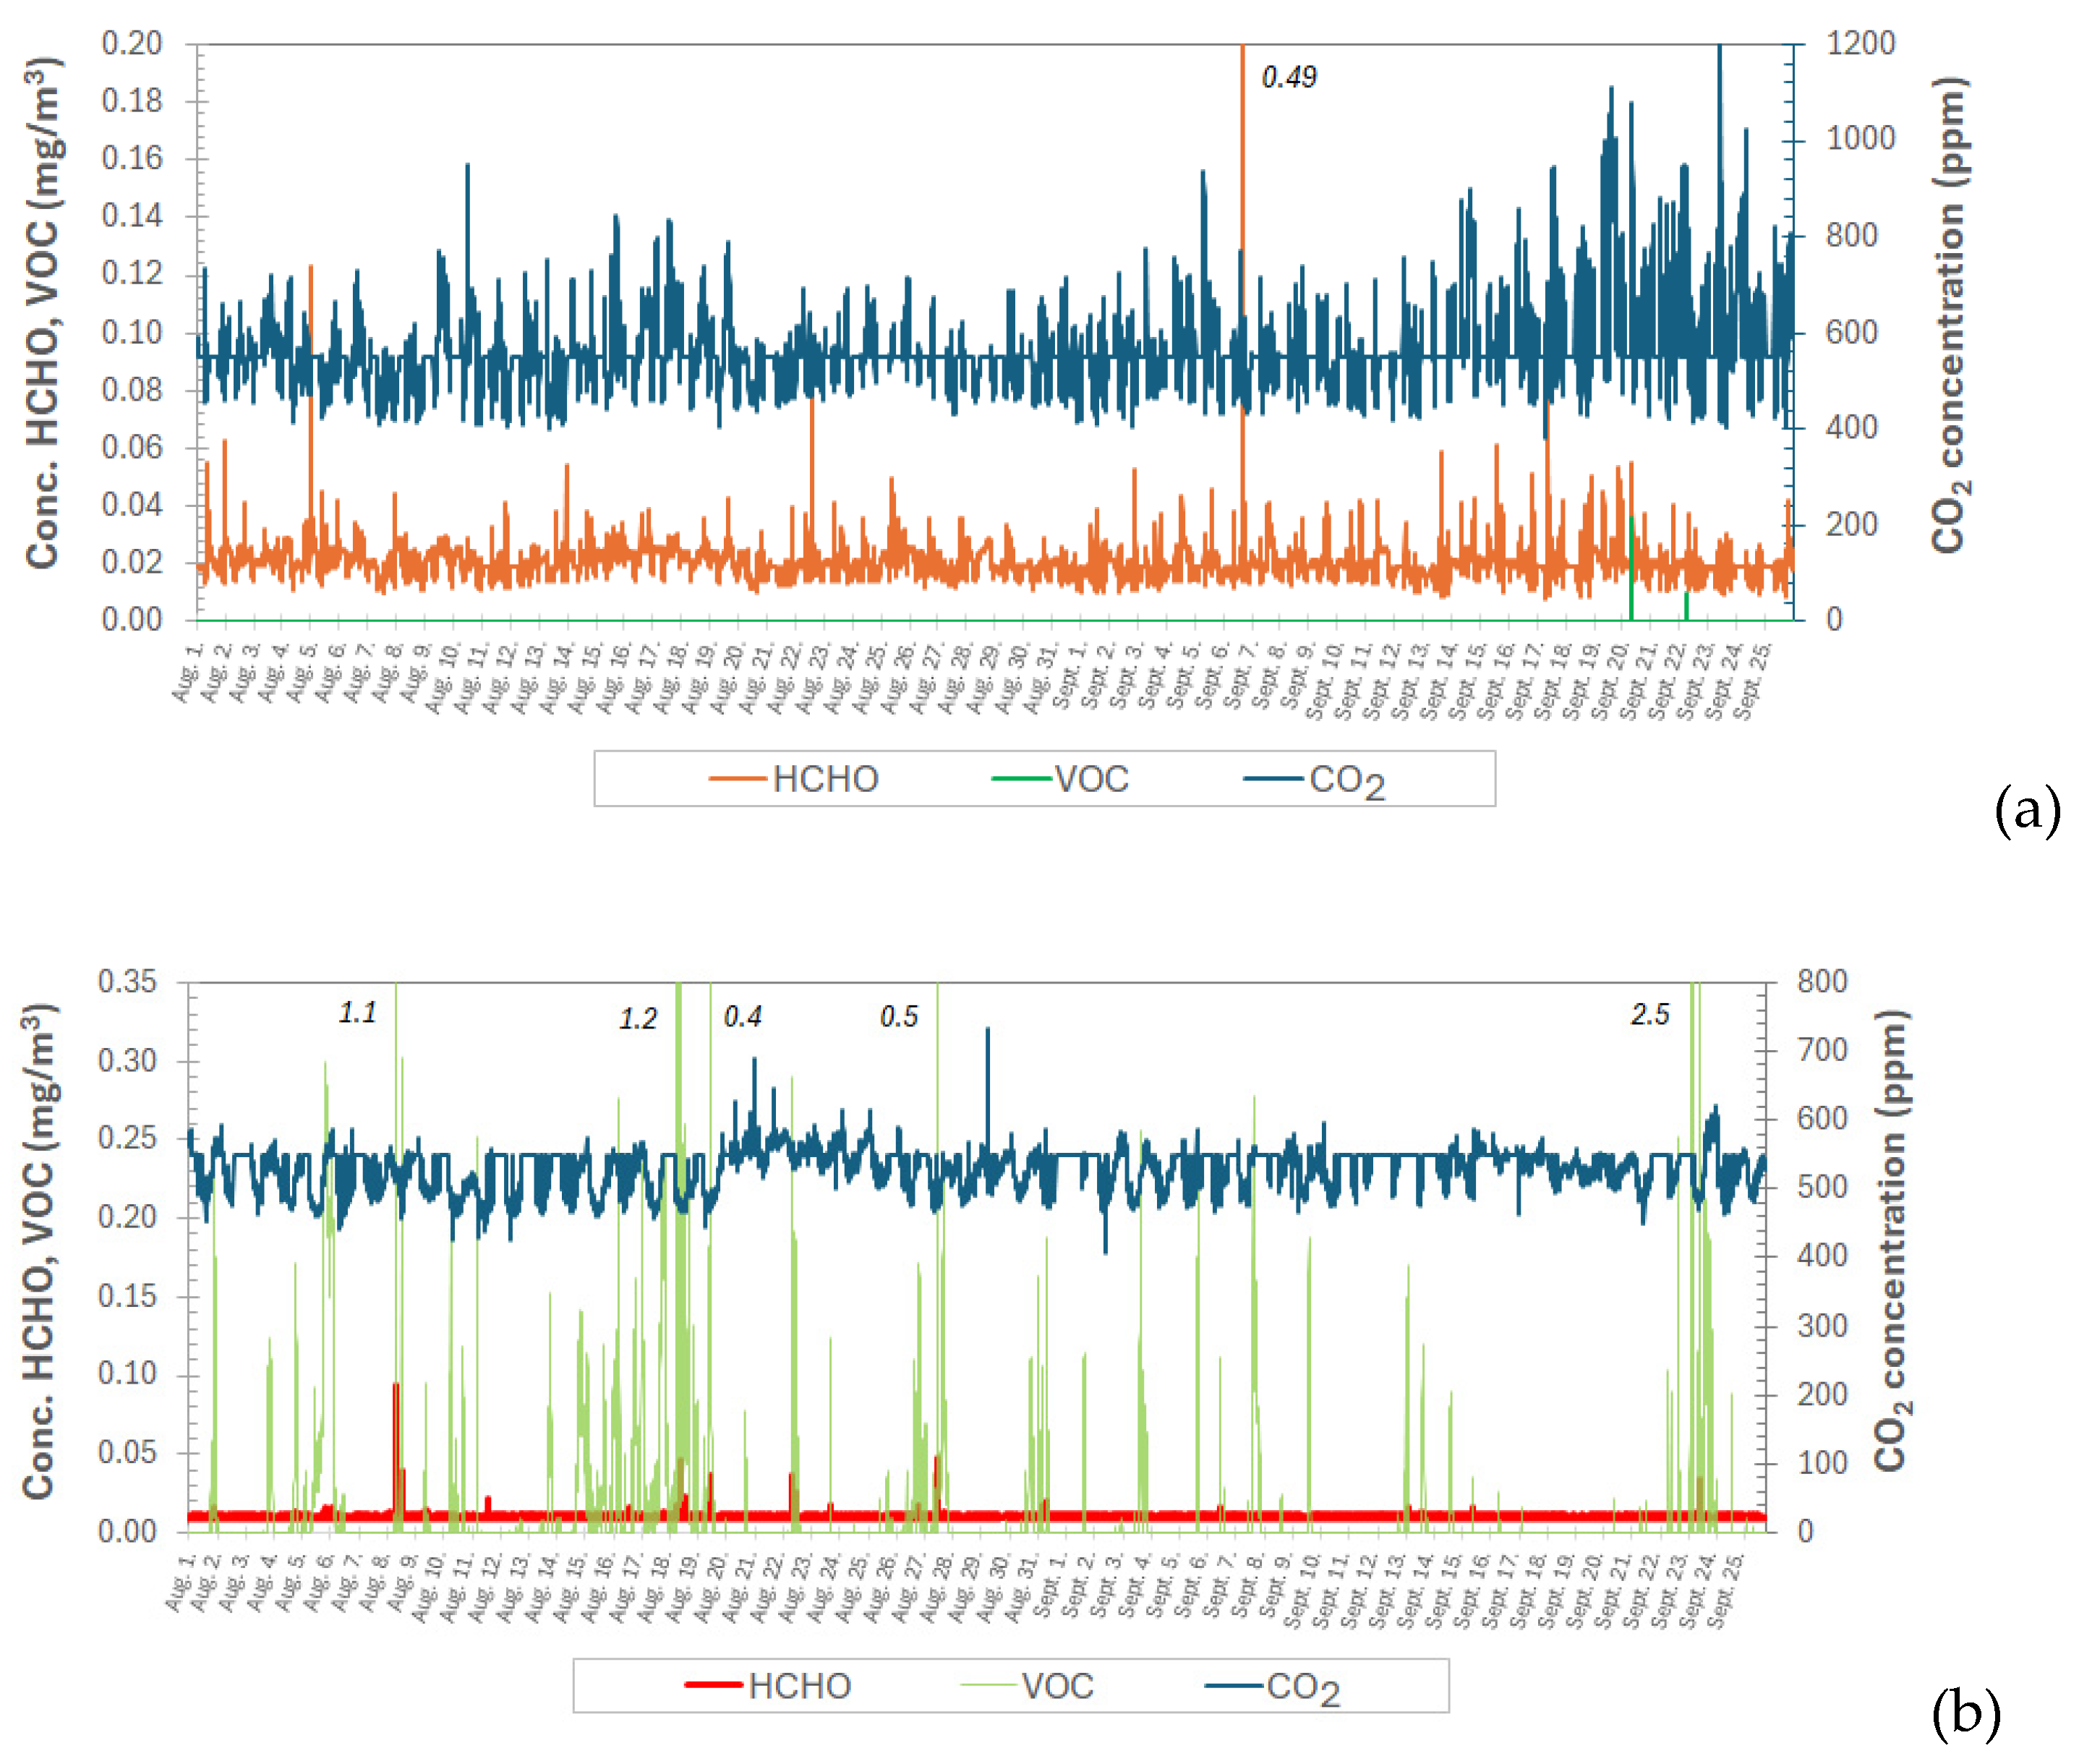
The temporal evolution of the monitored gaseous pollutants is depicted in Figure 10. As it appears, the indoor air concentration of CO2 shows a fluctuating pattern, i.e., around 550–600 ppm on average. Only a few CO2 maxima above 1000 ppm can be seen, whereas a large number of peaks appear between 800 and 1000 ppm. This air concentration was already considered as the safety level for people staying indoors and exposed to CO2 levels, as suggested in Ref. [40]. The observed relatively high peaks occurred usually during the last week of the sampling period, when the outdoor temperature dropped, and lower ventilation rates (0.25–0.39 h−1) for the dwelling house were observed due to the less frequent airing of the rooms.
The indoor HCHO level was observed to be fluctuating around 0.021 mg/m3 (range: 0.009–0.49 mg/m3), with several sharp peaks appearing on each week of the sampling. These peaks were rather due to indoor sources of varying intensities, e.g., furniture, adhesives and cooking activities. On the contrary, the outdoor air level of HCHO was mostly found to be low and rather constant, around 0.01 mg/m3 on average during the sampling campaign (Figure 10b). Only some occasional peaks of this pollutant were seen, reaching as high as 1.1–2.5 mg/m3 on weeks 2–4, each related to some fence construction activities, and on week 8, when some nearby wood burning activities occurred, as noted above.
The indoor VOC levels were low during the sampling campaign, mostly undetectable with the applied LCSs (Figure 10). However, some of the days at the end of the sampling campaign (e.g., week 8) were characterized by enhanced VOC concentrations, which reached values as high as 0.036 mg/m3. These maxima were mostly associated with gas stove-assisted cooking in the morning hours, when the indoor CO2 levels were also peaking, i.e., about 1000–1080 ppm. The average outdoor concentration of VOCs was 0.012 mg/m3, while peak concentrations occurred several times during the renovation-related work, especially on weeks 2–3, each related to the use of paints and corresponding thinners, and even on week 8, likely related to the use of wood/coal-fueled stoves for barbecues and/or domestic heating.

3.3. Correlation of Indoor and Outdoor PMx and Gaseous Pollutants

Pearson’s correlation coefficients calculated between indoor and outdoor data sets for the whole campaign showed only very weak or no correlations of the variables. Therefore, the most relevant air pollution episodes of the renovation (weeks 2–3) were evaluated for correlation (Table 1). As it can be seen, the indoor and outdoor PM1 and PM2.5-1 levels were weakly correlated with each other (R = 0.34–0.43) as expected on the base of the above findings. Much lower/no correlation was attained between the indoor or outdoor data of the finer fractions and PM10-2.5 (R = 0.13–0.22).
The indoor–outdoor data of HCHO and VOCs did not show any correlation. The indoor CO2 concentration was strongly negatively correlated with the air temperature (R = −0.67), while it showed a weak correlation with RH. However, the indoor and outdoor data of microclimatic variables (T, RH) were strongly correlated, with R values of 0.85 and 0.67, respectively. The indoor air temperature was anticorrelated fairly closely with outdoor RH, while the outdoor temperature showed weak correlation with the concentrations of most of the studied indoor pollutants (R = 0.30–0.32).
The correlation data of the outdoor variables are compiled in Table S2, while those of indoor data are listed in Table S3. For the outdoor variables, the fine, medium-size and coarse aerosol showed strong correlations with each other (R = 0.76–0.89). The air CO2 concentration featured some correlation with the RH (R = 0.67), but some negative correlation with the air temperature (R = −0.53). Interestingly, VOCs were loosely correlated with HCHO (R = 0.33), suggesting the latter compound is a partial degradation product. For the indoor air, the various PMx fractions were more strongly correlated (R = 0.84–0.94) than the outdoor PMx. Only a weak correlation between CO2 and HCHO was observed, pointing towards the possible source of HCHO from combustion/cooking activities. All these data point towards a low influence of outdoor air pollutants on the indoor AQ parameters.

3.4. Temporal Changes in Pollutants at a Nearby Air Quality Station

The weekly trends of PMx and CO concentrations, calculated from the hourly raw monitoring data of an official AQ station, are depicted in Figure 11. As it appears, the weekly average PM2.5 concentrations ranged between 6.0 and 9.1 µg/m3 (average: 7.3 µg/m3). Weeks 1, 2, 5 and 7 could see lower averages, while the other weeks were characterized by slightly higher concentrations. Apart from week 6 and week 8, the within-week variation of PM2.5 was low, manifested in the observed low variances. The weekly average PM10-2.5 levels ranged between 3.1 and 8.8 µg/m3 (average: 5.5 µg/m3, median: 4.5 µg/m3). Ostensibly, higher levels were experienced for the summer period (weeks 1–4). This generally high fluctuation was manifested in the enhanced variances (i.e., higher maxima), peaking on week 5 of the sampling campaign. Overall, it can be seen that the temporal evolution of the PMx levels indoors is in agreement with those observed outdoors at the sampling site, as background pollution.
Besides PMx, air CO levels were evaluated at the AQ station. This gas mostly stems from incomplete, high temperature combustion, such as biomass burning and vehicle exhaust emissions, and is an indicator of the extent of emissions for these types of nearby sources, similar to air CO2 levels. As seen, the average weekly CO level ranged from 322 to 461 µg/m3 (average: 395 µg/m3). Interestingly, its air concentration was small during the summer period (weeks 1–4), whereas a slightly rising level was observed during the autumn weeks, likely due to increased traffic nearby. A rather low fluctuation in the CO level was obtained (Figure 11). Overall, this indicates the smooth contributions of traffic on summer weeks, whereas around 25% increase in the CO level was obtained on the early autumn weeks of the sampling period.

4. Conclusions

This study reported on the indoor and outdoor levels of fine, medium-sized and coarse PM as well as some gaseous pollutants (CO2, HCHO, VOC) in a dwelling house, monitored concurrently during the reconstruction activities of the garden fence, performed for several weeks. The weekly average data for size-segregated aerosols indicate that the resuspended and on-site produced aerosol/dust was present at increased concentrations and contributed to the pollution of the outdoor air around the dwelling house. This enhanced aerosol burden was mostly due to the work processes related to the renovation, which involved the resuspension of dust, including the demolition of the old fence, excavation and substructure construction.
An enhancement in indoor PMx levels was observed during the fence renovation, but only to a small extent. These variables featured a decrease shortly after the finalization of the outdoor renovation activity. The indoor-to-outdoor concentration ratios indicate that the fine and medium-size aerosols were mostly of outdoor origin; their concentrations depended on the type of the renovation activity. However, the coarse aerosols were mostly of in-house origin, partly due to cooking activities and/or likely the coagulation of finer PM.
Among the studied gases, HCHO showed a rather small and constant outdoor concentration pattern, whereas its average indoor level was twice as high. Furthermore, indoor HCHO levels varied over a wide range due to some in-house emission sources, such as cooking on the gas stove, the presence of plywood/fiberboard furniture, fragrance and detergent use, etc. The outdoor CO2 concentration developed a similar smooth weekly trend, but with increased variability. However, the indoor CO2 level was rather dependent on the in-house emission sources, such as cooking duration, the number and length of stay of occupants and the room ventilation frequency. On the other hand, the outdoor VOC level changed over a broad range, demonstrating its dependence on reconstruction work, such as the use of paints and thinners for the new fence. Peak concentrations of the outdoor pollutants (e.g., PMx, VOC) were found to be better indices for the nearby reconstruction activities and related pollution episodes than the weekly average/median values, which showed only slight difference during the sampling period. The utilization of high-resolution low-cost sensors for monitoring gaseous pollutants and suspended particulate matter helped to reveal changes in several air pollutants/AQ parameters in fine temporal resolution and to assign some dominant emission sources.
Apart from CO2 and VOCs, some correlations of the pollutants were observed regarding indoor and outdoor data. Some of the PMx data were compared to those observed at a nearby official AQ station, reflecting a similar background air pollution pattern before, during and after the fence renovation activities, as observed in the outdoor air around the studied dwelling house.
Based on the observed PMx values and the gas pollutant levels, the fence renovation work posed a small health risk to the surrounding residents. It is to be noted that the air permeability of the new fence is lower than that of the old one, which may cause an alteration in the concentration of air pollutants via changing their ingress into the garden and indoors, which can have consequences for the health effects of the residents. This aspect of renovation-related pollution has not yet been exploited; thus, it remains for future research.

Supplementary Materials

The following SMs are available online at https://www.mdpi.com/article/10.3390/atmos15070790/s1, Figure S1: Summary of the meteorological conditions, Table S1: Timeline of the renovation activities, Table S2: Correlation coefficients of the outdoor air pollutants and microclimatic variables, Table S3: Correlation coefficients of the indoor air pollutants and microclimatic variables.

Funding

This research was partially supported by the Hungarian National Research Development and Innovation Fund under grant No. TKP2021-NVA-04.

Institutional Review Board Statement

Not applicable.

Informed Consent Statement

Not applicable.

Data Availability Statement

The research data are not publicly available due to file size limitations. The data presented in this study are available on request from the corresponding author.

Acknowledgments

The author thanks the owners/family members of the dwelling house for providing the opportunity to deploy the indoor and outdoor air sampling units, and for their patience and supportive attitude during the sampling campaign.

Conflicts of Interest

The author declares no conflicts of interest.

References

  1. IPCC. Climate Change 2021: The Physical Science Basis, Sixth Assessment Report; Cambridge University Press: Cambridge, UK, 2021. [Google Scholar]
  2. Dockery, D.W.; Speizer, F.E.; Stram, D.O.; Ware, J.H.; Spengler, J.D.; Ferris, B.G., Jr. Effects of inhalable particles on respiratory health of children. Am. Rev. Respir. Dis. 1989, 139, 587–594. [Google Scholar] [CrossRef] [PubMed]
  3. Spolnik, Z.; Bencs, L.; Worobiec, A.; Kontozova, V.; Van Grieken, R. Application of EDXRF and thin window EPMA for the investigation of the influence of hot air heating on the generation and deposition of particulate matter. Microchim. Acta 2005, 149, 79–85. [Google Scholar] [CrossRef]
  4. Stranger, M.; Krata, A.; Kontozova-Deutsch, V.; Bencs, L.; Deutsch, F.; Worobiec, A.; Naveau, I.; Roekens, E.; Van Grieken, R. Monitoring of NO2 in the ambient air with passive samplers before and after a road reconstruction event. Microchem. J. 2008, 90, 93–98. [Google Scholar] [CrossRef]
  5. Bencs, L.; Ravindra, K.; de Hoog, J.; Spolnik, Z.; Bleux, N.; Berghmans, P.; Deutsch, F.; Roekens, E.; Van Grieken, R. Appraisal of measurement methods, chemical composition and sources of fine atmospheric particles over six different areas of Northern Belgium. Environ. Pollut. 2010, 158, 3421–3430. [Google Scholar] [CrossRef] [PubMed]
  6. Zaeh, S.E.; Koehler, K.; Eakin, M.N.; Wohn, C.; Diibor, I.; Eckmann, T.; Wu, T.D.; Clemons-Erby, D.; Gummerson, C.E.; Green, T.; et al. Indoor air quality prior to and following school building renovation in a Mid-Atlantic school district. Int. J. Environ. Res. Public Health 2021, 18, 12149. [Google Scholar] [CrossRef] [PubMed]
  7. Yang, W.; Sohn, J.; Kim, J.; Son, B.; Park, J. Indoor air quality investigation according to age of the school buildings in Korea. J. Environ. Manag. 2009, 90, 348–354. [Google Scholar] [CrossRef] [PubMed]
  8. Ismaeel, W.S.E.; Alamoudy, F.O.; Sameh, R. How renovation activities may jeopardise indoor air quality: Accounting for short and long-term symptoms of sick building syndrome in educational buildings. Archit. Eng. Des. Manag. 2023, 19, 360–377. [Google Scholar] [CrossRef]
  9. Latif, M.T.; Baharudin, N.H.; Velayutham, P.; Awang, N.; Hamdan, H.; Mohamed, R.; Mokhtar, M.B. Composition of heavy metals and airborne fibers in the indoor environment of a building during renovation. Environ. Monit. Assess. 2011, 181, 479–489. [Google Scholar] [CrossRef] [PubMed]
  10. Latif, M.T.; Na, T.S.; Baharudin, N.H.; Srithawirat, T.; Mohamad, N.; Khan, M.F.; Sulaiman, F.R. Composition of trace metals in indoor dust during and after building renovation. Environ. Eng. Manag. J. 2018, 17, 1781–1790. [Google Scholar] [CrossRef]
  11. Reitzig, M.; Mohr, S.; Heinzow, B.; Knoppel, H. VOC emissions after building renovations: Traditional and less common indoor air contaminants, potential sources, and reported health complaints. Indoor Air 1998, 8, 91–102. [Google Scholar] [CrossRef]
  12. Hansen, D.; Blahout, B.; Benner, D.; Popp, W. Environmental sampling of particulate matter and fungal spores during demolition of a building on a hospital area. J. Hosp. Infect. 2008, 70, 259–264. [Google Scholar] [CrossRef] [PubMed]
  13. Sánka, I.; Földváry, V. Indoor air quality of residential building before and after renovation. Slovak J. Civ. Eng. 2017, 25, 1–6. [Google Scholar] [CrossRef]
  14. Dodson, R.E.; Udesky, J.O.; Colton, M.D.; McCauley, M.; Camann, D.E.; Yau, A.Y.; Adamkiewicz, G.; Rudel, R.A. Chemical exposures in recently renovated low-income housing: Influence of building materials and occupant activities. Environ. Int. 2017, 109, 114–127. [Google Scholar] [CrossRef] [PubMed]
  15. Kozielska, B.; Mainka, A.; Zak, M.; Kaleta, D.; Mucha, W. Indoor air quality in residential buildings in Upper Silesia, Poland. Build. Environ. 2020, 177, 106914. [Google Scholar] [CrossRef]
  16. Derbez, M.; Wyart, G.; Le Ponner, E.; Ramalho, O.; Riberon, J.; Mandin, C. Indoor air quality in energy-efficient dwellings: Levels and sources of pollutants. Indoor Air 2018, 28, 318–338. [Google Scholar] [CrossRef] [PubMed]
  17. Vilčekova, S.; Apostoloski, I.Z.; Mečiarová, Ľ.; Burdová, E.K.; Kiseľák, J. Investigation of indoor air quality in houses of Macedonia. Int. J. Environ. Res. Public Health 2017, 14, 37. [Google Scholar] [CrossRef]
  18. Omelekhina, Y.; Nordquist, B.; Alce, G.; Caltenco, H.; Wallenten, P.; Borell, J.; Wierzbicka, A. Effect of energy renovation and occupants’ activities on airborne particle concentrations in Swedish rental apartments. Sci. Total Environ. 2022, 806, 149995. [Google Scholar] [CrossRef] [PubMed]
  19. Awad, J.; Jung, C. Evaluating the indoor air quality after renovation at the greens in Dubai, United Arab Emirates. Buildings 2021, 11, 353. [Google Scholar] [CrossRef]
  20. Hameed, A.A.A.; Yasser, I.H.; Khoder, I.M. Indoor air quality during renovation actions: A case study. J. Envion. Monit. 2004, 6, 740–744. [Google Scholar] [CrossRef]
  21. Huang, C.; Zhang, J.L.; Sun, C.J.; Liu, W.; Zhang, Y.P.; Li, B.Z.; Zhao, Z.H.; Deng, Q.H.; Zhang, X.; Qian, H.; et al. Associations between household renovation and rhinitis among preschool children in China: A cross-sectional study. Indoor Air 2020, 30, 827–840. [Google Scholar] [CrossRef]
  22. Jiang, W.; Lu, C.; Miao, Y.F.; Xiang, Y.G.; Chen, L.; Deng, Q.H. Outdoor particulate air pollution and indoor renovation associated with childhood pneumonia in China. Atmos. Environ. 2018, 174, 76–81. [Google Scholar] [CrossRef]
  23. Deng, Q.H.; Lu, C.; Ou, C.Y.; Liu, W.W. Effects of early life exposure to outdoor air pollution and indoor renovation on childhood asthma in China. Build. Environ. 2015, 93, 84–91. [Google Scholar] [CrossRef]
  24. Rejc, T.; Kukec, A.; Bizjak, M.; Godič-Torkar, K. Microbiological and chemical quality of indoor air in kindergartens in Slovenia. Int. J. Environ. Health Res. 2020, 30, 49–62. [Google Scholar] [CrossRef] [PubMed]
  25. Vardoulakis, S.; Giagloglou, E.; Steinle, S.; Davis, A.; Sleeuwenhoek, A.; Galea, K.S.; Dixon, K.; Crawford, J.O. Indoor Exposure to Selected Air Pollutants in the Home Environment: A Systematic Review. Int. J. Environ. Res. Public Health 2020, 17, 8972. [Google Scholar] [CrossRef] [PubMed]
  26. Alfano, B.; Barretta, L.; Del Giudice, A.; De Vito, S.; Di Francia, G.; Esposito, E.; Formisano, F.; Massera, E.; Miglietta, M.L.; Polichetti, T. A review of low-cost particulate matter sensors from the developers’ perspectives. Sensors 2020, 20, 6819. [Google Scholar] [CrossRef]
  27. Giordano, M.R.; Malings, C.; Pandis, S.N.; Presto, A.A.; McNeill, V.F.; Westervelt, D.M.; Beekmann, M.; Subramanian, R. From low-cost sensors to high-quality data: A summary of challenges and best practices for effectively calibrating low-cost particulate matter sensors. J. Aerosol Sci. 2021, 158, 105833. [Google Scholar] [CrossRef]
  28. Rai, A.C.; Kumar, P.; Pilla, F.; Skouloudis, A.N.; Di Sabatino, S.; Ratti, C.; Yasar, A.; Rickerby, D. End-user perspective of low-cost sensors for outdoor air pollution monitoring. Sci. Total Environ. 2017, 607, 691–705. [Google Scholar] [CrossRef]
  29. Bencs, L.; Plósz, B.; Mmari, A.G.; Szoboszlai, N. Comparative Study on the Use of Some Low-Cost Optical Particulate Sensors for Rapid Assessment of Local Air Quality Changes. Atmosphere 2022, 13, 1218. [Google Scholar] [CrossRef]
  30. Bencs, L.; Nagy, A. A Smoke Chamber Study on Some Low-Cost Sensors for Monitoring Size-Segregated Aerosol and Microclimatic Parameters. Atmosphere 2024, 15, 304. [Google Scholar] [CrossRef]
  31. Cui, S.; Cohen, M.; Stabat, P.; Marchio, D. CO2 tracer gas concentration decay method for measuring air-exchange rate. Build. Environ. 2015, 84, 162–169. [Google Scholar] [CrossRef]
  32. Rivero, R.A.G.; Hernández, L.E.M.; Schalm, O.; Rodríguez, E.H.; Sánchez, D.A.; Pérez, M.C.M.; Caraballo, V.N.; Jacobs, W.; Laguardia, A.M. A Low-Cost Calibration Method for Temperature, Relative Humidity, and Carbon Dioxide Sensors Used in Air Quality Monitoring Systems. Atmosphere 2023, 14, 191. [Google Scholar] [CrossRef]
  33. ANSI/ASHRAE Standard 62.1-2007; Ventilation for Acceptable Indoor Air Quality. Addendum q to ANSI/ASHRAE Standard 62.1-2007; American Society of Heating, Refrigerating and Air-Conditioning Engineers, Inc.: Atlanta, GA, USA, 2010.
  34. Neumann, M.; Dlamini, W.N.; Sallah-Ud-Din, R.; Berekute, A.K.; Siregar, S.; Getnet, M.E.; Maulana, M.; Pan, W.C.; Lung, S.C.C.; Yu, K.P. Assessment of air pollution emitted during cooking using biomass and cleaner fuels in the Shiselweni region of Eswatini (Swaziland). Clean Technol. Environ. Policy 2024. [Google Scholar] [CrossRef]
  35. WHO (World Health Organization). WHO Guidelines for Indoor Air Quality: Selected Pollutants, 1st ed.; WHO Regional Office for Europe: Copenhagen, Denmark, 2010; Available online: https://www.who.int/publications/i/item/9789289002134 (accessed on 3 June 2024).
  36. Hutter, H.P.; Moshammer, H.; Wallner, P.; Tappler, P.; Kundi, M. Volatile organic compounds: Guidelines from the Austrian working group on indoor air. In Indoor Air 2005, Proceedings of the 10th International Conference on Indoor Air Quality and Climate, 4–9 September 2005, Beijing, China; Yang, X., Zhao, B., Zhao, R., Eds.; Volume 1–5, pp. 3519–3522.
  37. Gordon, S.M.; Callahan, P.J.; Nishioka, M.G.; Brinkman, M.C.; O’Rourke, M.K.; Lebowitz, M.D.; Moschandreas, D.J. Residential environmental measurements in the National Human Exposure Assessment Survey (NHEXAS) pilot study in Arizona: Preliminary results for pesticides and VOCs. J. Exposure Anal. Environ. Epidemiol. 1999, 9, 456–470. [Google Scholar] [CrossRef] [PubMed]
  38. Gilbert, N.L.; Gauvin, D.; Guay, M.; Héroux, M.E.; Dupuis, G.; Legris, M.; Chan, C.C.; Dietz, R.N.; Lévesque, B. Housing characteristics and indoor concentrations of nitrogen dioxide and formaldehyde in Quebec City, Canada. Environ. Res. 2006, 102, 1–8. [Google Scholar] [CrossRef] [PubMed]
  39. Jurvelin, J.; Vartiainen, M.; Jantunen, M.; Pasanen, P. Personal Exposure Levels and Microenvironmental Concentrations of Formaldehyde and Acetaldehyde in the Helsinki Metropolitan Area, Finland. J. Air Waste Manag. Assoc. 2001, 51, 17–24. [Google Scholar] [CrossRef]
  40. Morawska, L.; Allen, J.; Bahnfleth, W.; Bennett, B.; Bluyssen, P.M.; Boerstra, A.; Buonanno, G.; Cao, J.J.; Dancer, S.J.; Floto, A.; et al. Mandating indoor air quality for public buildings. Science 2024, 383, 1418–1420. [Google Scholar] [CrossRef]
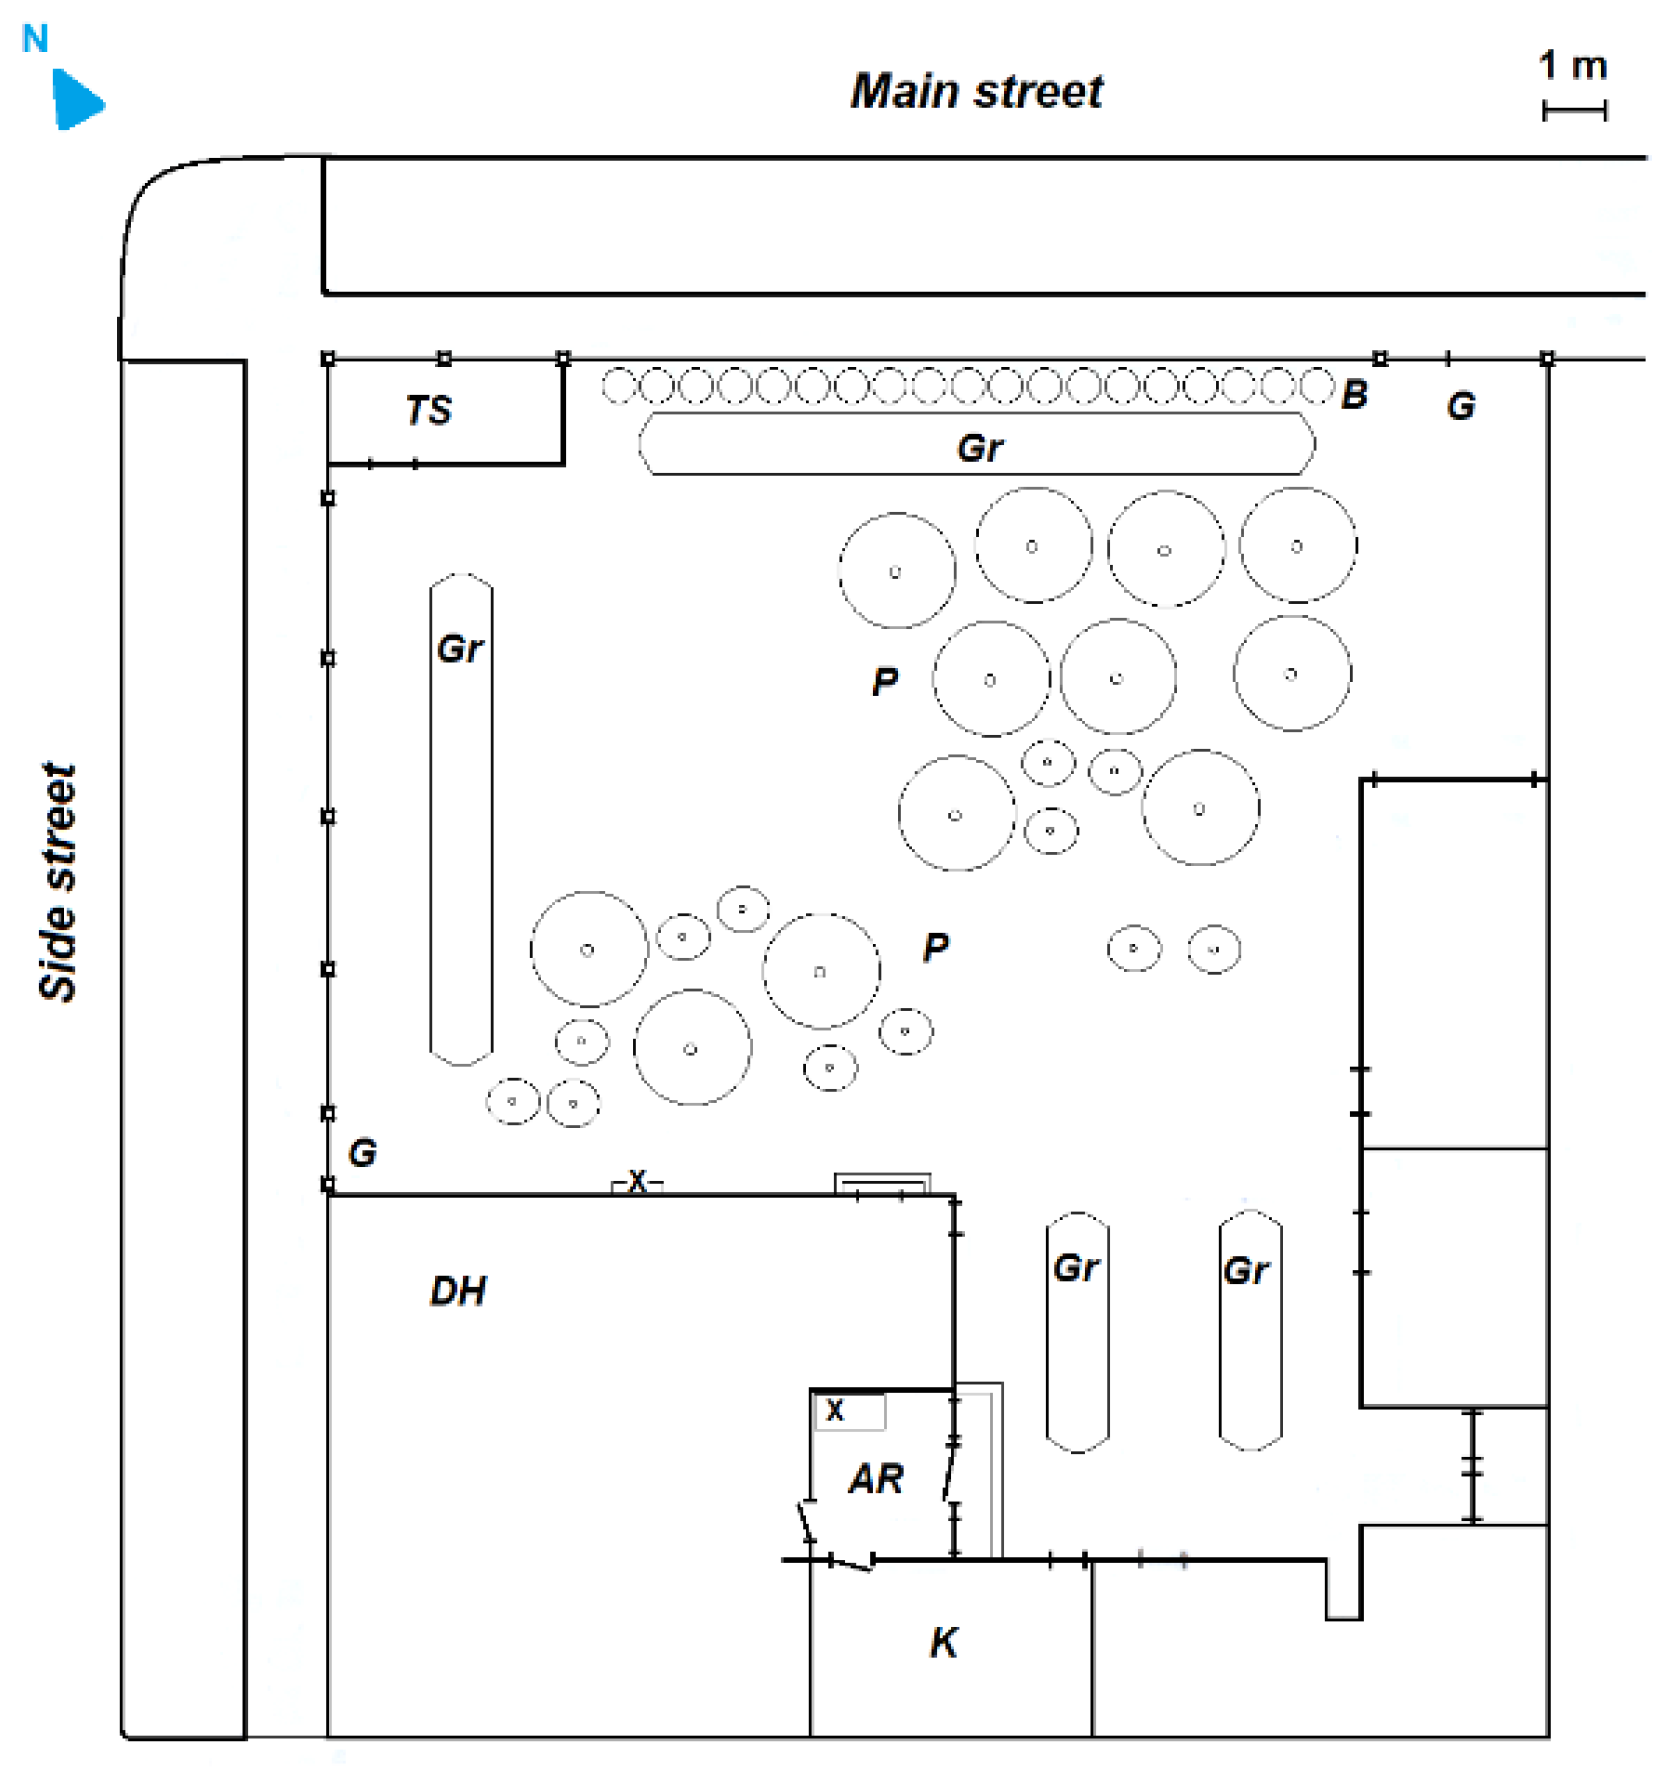
Figure 1. Scheme of the sampling/renovation area with the dwelling house, the garden and the old fence, with capped brick poles (squares); abbreviations: AR—anteroom, B—bushes, DH—dwelling house, G—gate, Gr—grapes, K—kitchen, P—pine trees, TS—toolshed, X—sampling points.
Atmosphere 15 00790 g001
Figure 2. Pictures of the GPM and BH1 sensors deployed at the indoor sampling point (anteroom) of the dwelling house (a) and the outdoor sampling point (b).
Atmosphere 15 00790 g002
Figure 3. Weekly trends of PMx and microclimatic data evaluated with 5 min resolution, outdoors at the sampling site with the GPM-sensor; n = 2040 for each week.
Atmosphere 15 00790 g003
Figure 4. Weekly trends of size-segregated aerosol concentrations and of microclimatic data indoors (anteroom of the dwelling house); n = 2040 for each week/variable.
Atmosphere 15 00790 g004
Figure 5. Weekly indoor–outdoor (I/O) ratios of PMx and microclimatic variables calculated for the sampling campaign; n = 2040 for each week.
Atmosphere 15 00790 g005
Figure 6. Variation in the weekly average concentrations of the monitored gaseous pollutants outdoors at the sampling site; resolution: 5 min, n = 2020 for each week; positive and negative error bars show maximum and minimum values, respectively.
Atmosphere 15 00790 g006
Figure 7. Changes in the weekly average air levels of the monitored gases, evaluated with 5 min resolution, indoors (anteroom); error bars denote fluctuations (SD), n = 2020 for each week.
Atmosphere 15 00790 g007
Figure 8. Trends of weekly average indoor-to-outdoor (I/O) ratios of the studied gaseous air pollutants, calculated for the sampling campaign; n = 2040 for each week.
Atmosphere 15 00790 g008
Figure 9. Temporal evolution of the indoor and outdoor PMx concentrations recorded with the GPM sensor during the sampling campaign; PM1 (a), PM2.5-1 (b) and PM10-2.5 (c).
Atmosphere 15 00790 g009
Figure 10. Temporal evolution of the concentrations of the monitored gaseous pollutants during the sampling campaign; indoors (a) and in the outdoor air (b).
Atmosphere 15 00790 g010
Figure 11. Weekly trends of PMx and CO levels evaluated from the data of an official air quality station on Gergely street (Kőbánya district, Budapest).
Atmosphere 15 00790 g011
Table 1. Indoor–outdoor correlation coefficients (R) for air pollutants and microclimatic variables for weeks 2–3 of the sampling campaign.
Indoor ParameterOutdoor Variable
PM1PM2.5-1PM10-2.5CO2HCHOVOCTRH
PM10.370.340.16−0.130.040.080.31−0.12
PM2.5-10.400.430.13−0.040.030.090.30−0.06
PM10-2.50.220.140.15−0.200.040.030.26−0.15
CO2−0.050.13−0.19−0.190.020.070.32−0.22
HCHO0.070.25−0.20−0.20−0.010.080.32−0.15
VOC--------
T0.010.10−0.18−0.670.050.110.85−0.66
RH0.500.500.220.450.060.11−0.150.67
Disclaimer/Publisher’s Note: The statements, opinions and data contained in all publications are solely those of the individual author(s) and contributor(s) and not of MDPI and/or the editor(s). MDPI and/or the editor(s) disclaim responsibility for any injury to people or property resulting from any ideas, methods, instructions or products referred to in the content.