Article

WRF-Chem Modeling of Tropospheric Ozone in the Coastal Cities of the Gulf of Finland

1
Atmospheric Physics Department, Saint Petersburg University, St. Petersburg 199034, Russia
2
Laboratory of Modeling of Middle and Upper Atmosphere, Russian State Hydrometeorological University, St. Petersburg 195196, Russia
3
SRC RAS—Scientific Research Centre for Ecological Safety of the Russian Academy of Sciences, St. Petersburg 197110, Russia
4
Physikalisch-Meteorologisches Observatorium Davos, World Radiation Centre, 7260 Davos, Switzerland
*
Author to whom correspondence should be addressed.
Atmosphere 2024, 15(7), 775; https://doi.org/10.3390/atmos15070775
Submission received: 26 May 2024 / Revised: 26 June 2024 / Accepted: 27 June 2024 / Published: 28 June 2024
(This article belongs to the Special Issue Measurement and Variability of Atmospheric Ozone)

Abstract

:
Ozone in the troposphere is a pollutant and greenhouse gas. Atmospheric models can add valuable information to observations for studying the spatial and temporal variations in tropospheric ozone content. The present study is intended to evaluate the variability in tropospheric ozone and its precursors near the Gulf of Finland with a focus on St. Petersburg (Russia) and Helsinki (Finland) in 2016–2019, using the WRF-Chem 3-D numerical model with a spatial resolution of 10 km, together with observations. The diurnal cycle of the near-surface ozone concentrations (NSOCs) in both cities is caused by the variability in NO2 emissions, planetary boundary layer height, and local meteorological conditions. The seasonal variations in NSOCs and tropospheric ozone content (TrOC) are caused by the variability in total ozone content and in ozone formation in the troposphere. The model reveals a VOC-limited regime in the ~0–1 km layer around St. Petersburg, Helsinki, and the Gulf of Finland and a pronounced NOx-limited regime in the 0–2 km layer in the forests of southern Finland, Karelia, some Russian regions, and the Baltic countries in July. The WRF-Chem model overestimates the measured NSOCs by 10.7–43.5% and the TrOC by 7–10.4%. The observed differences are mainly caused by the errors in chemical boundary conditions and emissions of ozone precursors and by the coarse spatial resolution of the modeling.

1. Introduction

Tropospheric ozone (O3) is one of the strongest photochemical oxidants harmful to human and animal health at elevated concentrations since ozone molecules have detrimental effects on organisms when they reach the respiratory system [1]. High concentrations of near-surface ozone (higher than the European standard of 70 µg m−3 averaged for 8 h) cause more than 20,000 premature deaths annually in 25 countries of the European Union [2]. Ozone molecules also have a negative effect on vegetation [3]. In the middle and upper troposphere, ozone is an important greenhouse gas as ozone molecules absorb longwave radiation. According to the Intergovernmental Panel on Climate Change (IPCC) [4], the total anthropogenic radiative forcing constitutes 1.96–3.48 W m−2, while the tropospheric ozone forcing is evaluated as 0.24–0.71 W m−2 or 4–20%. In [5], the decadal average tropospheric ozone radiative effect was estimated to be between 1.21 and 1.26 W m−2 for the 2008–2017 period. Moreover, tropospheric ozone contributes greatly to the oxidation efficiency of the atmosphere.
Tropospheric ozone concentrations have been monitored regularly for several decades [6]. Near-surface ozone concentrations are detected at hundreds of sites equipped with in situ measurement instruments; tropospheric ozone profiles are measured with ozonesondes, aircraft, and lidar instruments; and the free troposphere ozone content (TrOC) is determined by various ground-based and satellite instruments. On average, in Europe, a reduction in ozone precursor emissions in the 21st century has led to a reduction in extreme ozone surface levels at both urban and rural sites, but for TrOC, there are no consistent trends observed, i.e., ozone changes vary both spatially and seasonally [3]. Depending on the mean tropospheric state, local climate features, and intensity of ozone precursor emissions from anthropogenic and natural sources, the tropospheric ozone content can differ drastically in space and time. For example, monsoons, which occur seasonally near the tropics and affect the weather of coastal areas, cause significant changes in the seasonal and vertical variations in ozone content in the lower troposphere [7,8]. According to [9], dry deposition can be an important factor causing ozone loss in the lower troposphere. In addition, variations in the amount of NOx and hydrocarbon (e.g., volatile organic compounds or VOCs) molecules in the lower atmosphere cause complex seasonal and spatial patterns of the tropospheric ozone content, which complicates the regulation of ozone pollution [10].
Three-dimensional numerical modeling of the atmospheric composition on a regional scale is a valuable method for studying TrOC variability [11] because correlations between TrOC and small-scale phenomena (less than a few km) cannot be considered by global models. These phenomena include emissions of ozone precursors (NOx, VOC, CH4, CO, etc.) from many local sources [2] and physical processes in the Earth boundary layer, e.g., turbulent mixing [12]. The average lifetime of ozone molecules in the free troposphere is more than 20 days [13], whereas in the lower troposphere, it can be significantly shorter due to high concentrations of ozone precursors. Notwithstanding the development of regional numerical models of atmospheric composition in recent decades, differences between simulated and observed TrOC vary widely depending on the date, location, and period of the study. For example, a numerical regional model of weather forecasting and tropospheric content, WRF-Chem (Weather Research and Forecasting—Chemistry), reproduces near-surface ozone concentrations over European countries, with differences of up to 20% with respect to the observations [14,15]. Few studies have been dedicated to modeling the tropospheric ozone content in the vicinity of large Russian cities. In [16], the authors analyzed changes in tropospheric ozone over Siberia, focusing on anthropogenic emissions of ozone precursors from relatively large cities (Tomsk, Novosibirsk, etc.) and demonstrated that the model could be used to simulate the near-surface ozone concentrations under the background conditions of Siberian forests, with a correlation coefficient between observations and the modeled data of 0.6–0.7.
St. Petersburg is one of the largest industrial Russian cities, with a population of more than 5 million [17], several large power plants [18], industries [19], and more than one million private motor vehicles [20]. According to [21], the NOx (NO2 + NO) anthropogenic emissions of St. Petersburg constitute 77 ± 22 kt y−1. According to independent estimates, the NOx emissions of London, Paris, and Shanghai constitute ~113 [22], 132 [23], and 155 kt y−1 [24], respectively. Therefore, St. Petersburg is a large source of different pollutants, particularly ozone precursors. Helsinki is Finland’s largest city and is located in proximity to St. Petersburg (~330 km). Both St. Petersburg and Helsinki are located on the coast of the Gulf of Finland (Baltic Sea).
Regular measurements of the near-surface ozone concentrations (NSOCs) and TrOC in St. Petersburg, Russia, have been carried out at the Peterhof campus of St. Petersburg University (SPbU) since 2013 and 2009, respectively [25]. The concentrations of ozone and its precursors have been measured since 2005 at the SMEAR III (Station for Measuring Ecosystem–Atmosphere Relationships, https://www.atm.helsinki.fi/SMEAR/index.php/smear-iii (accessed on 1 January 2024)) station in Helsinki, Finland, [26]. The availability of observational data provides an opportunity to confirm findings on the TrOC variability near the Gulf of Finland, which can be achieved by 3D numerical modeling of the composition of the troposphere and lower stratosphere.
The aim of the study is to evaluate the diurnal, seasonal, and interannual variations in the tropospheric ozone content and the content of its precursors near the Gulf of Finland for the period of 2016–2019, focusing on St. Petersburg (Russia) and Helsinki (Finland) by using a 3D numerical model of the tropospheric composition WRF-Chem and complex observations. In Section 2, the main parameters of the WRF-Chem model simulation and the experimental data used for the analysis of the tropospheric ozone variability and validation of the model are described. In Section 3, an analysis of spatiotemporal tropospheric ozone variation based on numerical modeling and complex observations in St. Petersburg and Helsinki, as well as validation of the WRF-Chem model, is provided. The main findings of the study are provided in Section 4.

2. Materials and Methods

2.1. WRF-Chem Model

The WRF-Chem (Weather Research and Forecasting—Chemistry) [27] numerical model of the state and composition of the lower atmosphere at high spatial resolution is used in the study. The flowchart of the WRF-Chem model, which presents its main blocks, is shown in Figure 1. All these blocks are briefly described below.
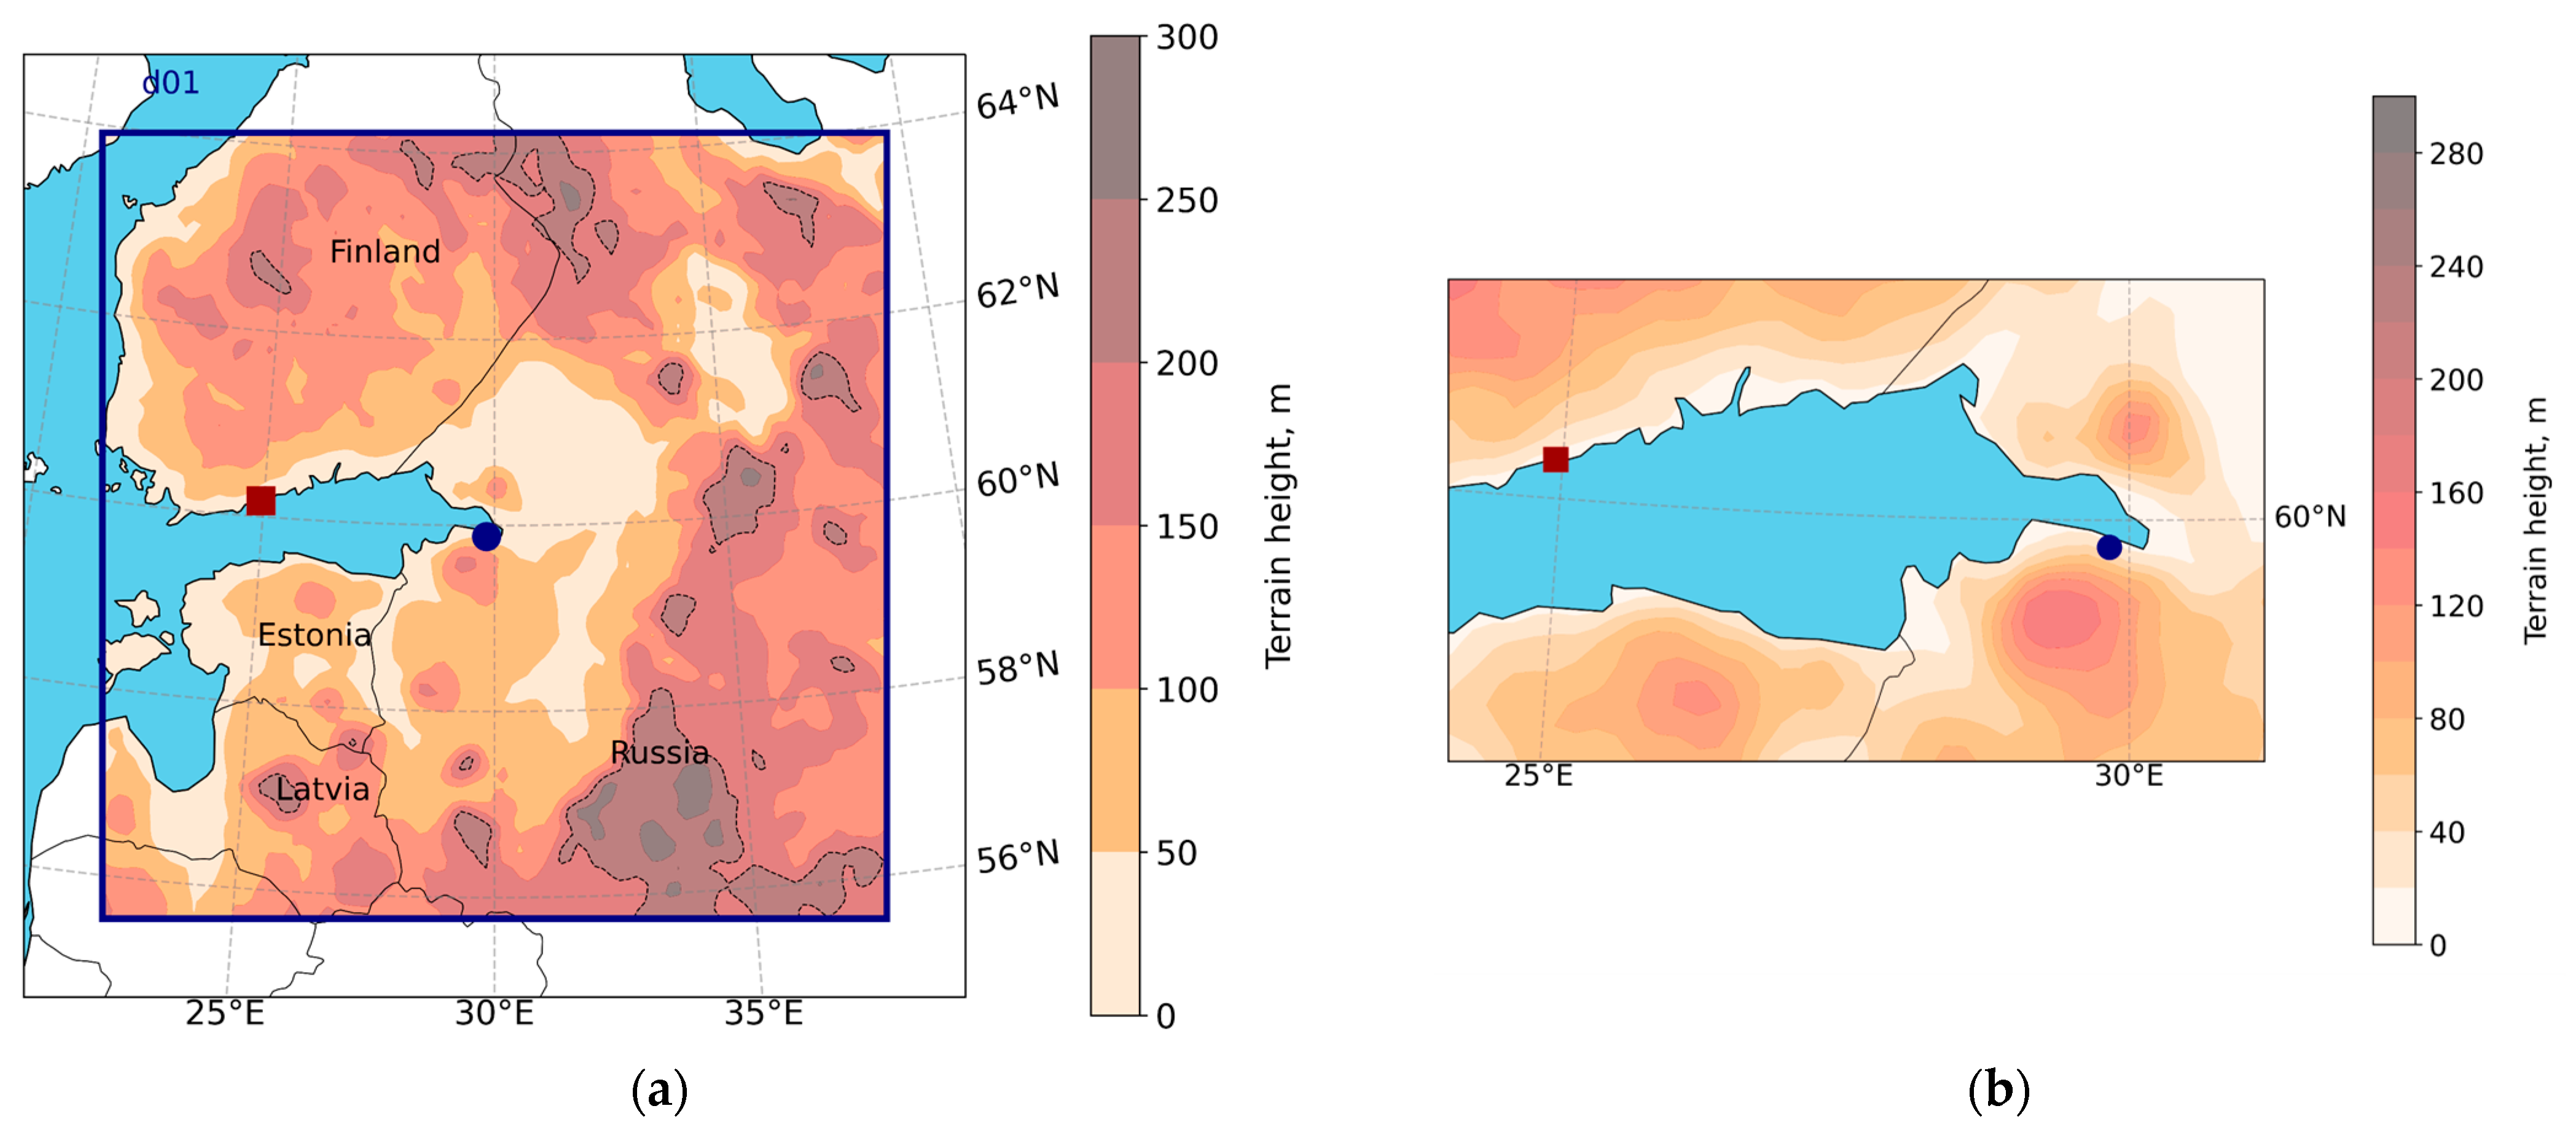
The modeling domain covers an area of 960 × 960 km2 (Figure 2), with a 10 km step for the 2016–2019 period. The period for model simulations was chosen based on the availability of TrOC satellite observations that are not provided in the current study but will be used in future analyses of TrOC spatial and temporal variability at the regional scale. Based on the period selected, a preliminary investigation of the quality of the WRF-Chem model was carried out. The modeling domain is centered at St. Petersburg (Russia) and covers the territories of western Russia, southern Finland, Estonia, Latvia, the Gulf of Finland and the Gulf of Riga of the Baltic Sea. As shown in Figure 2a,b, both cities in focus—Peterhof and Helsinki—are located on the coastline of the Gulf of Finland. The landscape is relatively flat with several low-height features (up to 250–300 m above sea level), which are located predominantly on the southeast and northeast sides of the modeling domain. Modeling was performed on 25 hybrid vertical levels from the surface up to 50 hPa (~20 km). The modeling time step was set as 60 s, and the modeled data output was 1 h. Table 1 contains all the main parameters of the WRF-Chem simulation. Table 2 demonstrates schemes of subgrid parametrizations of physical processes used in the WRF-Chem modeling.

2.1.1. Initial and Boundary Conditions

To set the initial and boundary meteorological conditions, the ERA5 reanalysis data [28] were used. The ERA5 data are available globally, with a 0.25° horizontal resolution on 137 hybrid vertical levels from the surface up to approximately 80 km. The meteorological boundary conditions were refreshed every 6 h. The ERA5 data were obtained by numerical modeling of the atmospheric state via the ECMWF Integrated Forecast System and 4DVAR assimilation of meteorological observations.
Data from the CAM-chem (Community Atmosphere Model with Chemistry) chemical transport model, which is a part of the NCAR (National Center for Atmospheric Research) CESM (Community Earth System Model) Earth system model [29], were used as chemical initial and boundary conditions. The data are available, with ~0.9° × 1.25° spatial resolution on 56 hybrid vertical levels from the surface up to ~45 km. The CAM-Chem data were obtained by nudging the MERRA-2 reanalysis data [29,30].

2.1.2. Sources of Gases and Aerosols

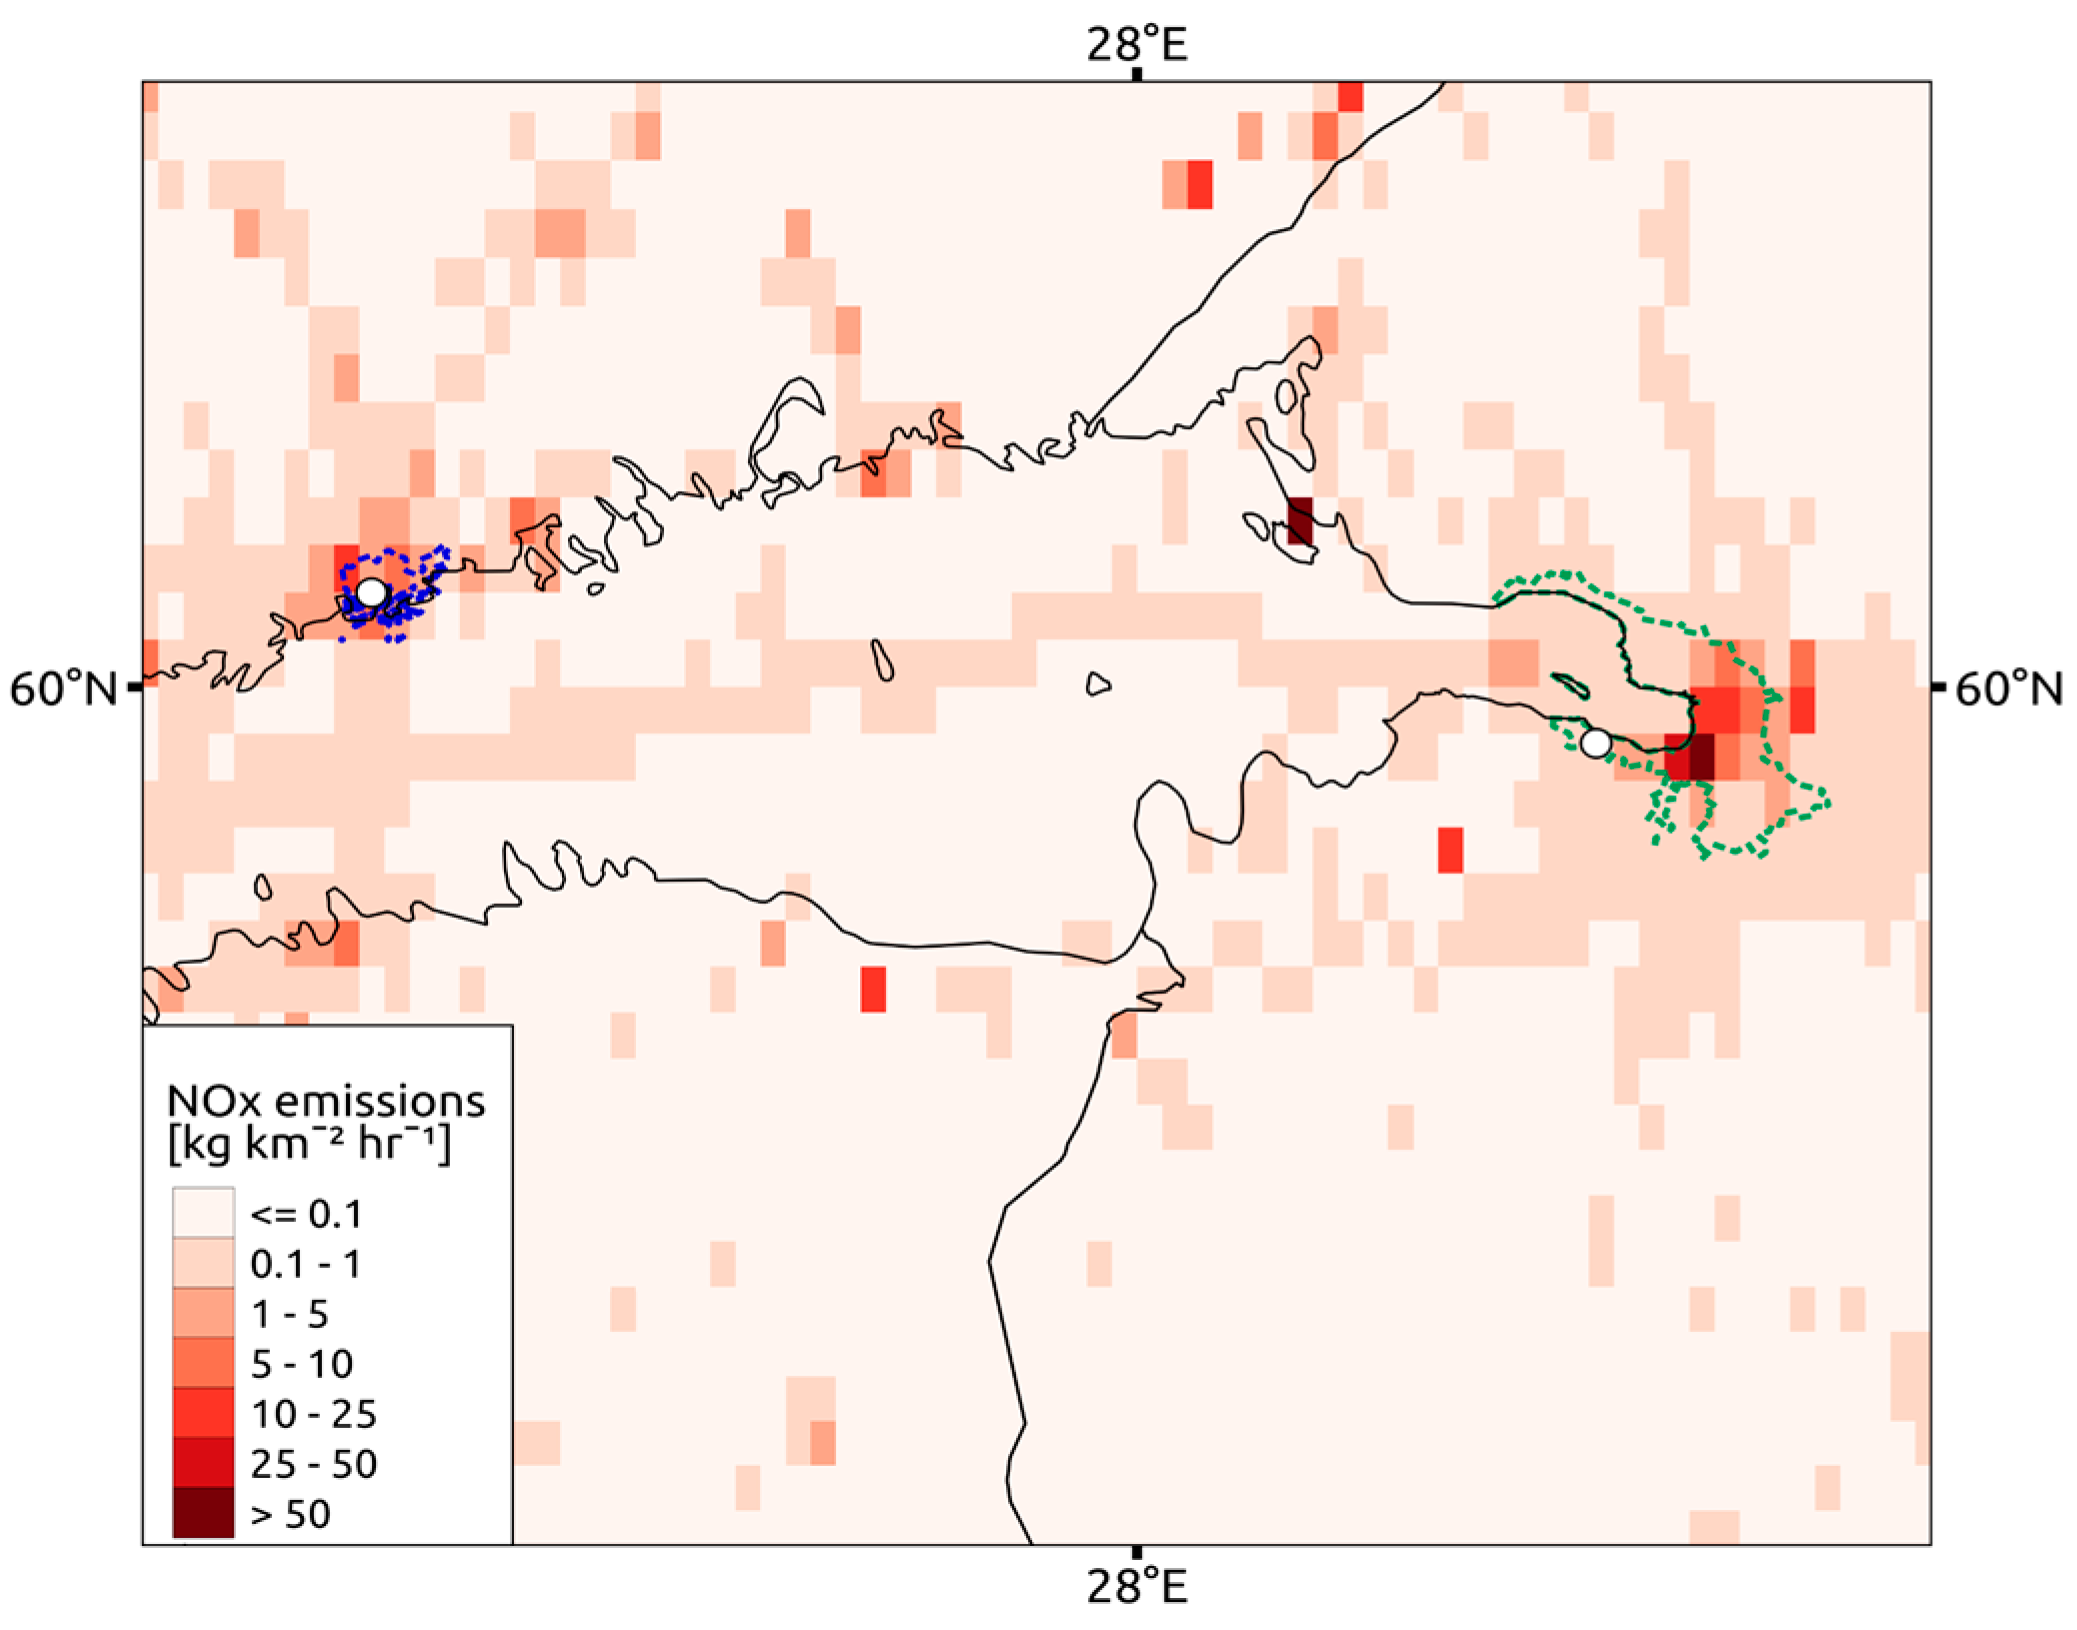
The EDGARv5.0 global inventory of anthropogenic emissions of gases and aerosols with 0.1° spatial resolution [31] was used to set anthropogenic emissions of some species (NOx, CO, SO2, PM2.5, PM10, VOCs, etc.). The EDGARv5.0 dataset covers 2015 only but includes monthly variability in emissions. Daily, weekly, and yearly changes in emissions were not considered in the current study. The data were set at the first WRF-Chem model level, which corresponded to approximately 50–70 m above ground level. Figure 3 depicts an example of NOx emissions from the EDGARv5.0 inventory for January 2015 in the territories of the two largest cities in the domain—St. Petersburg (green dotted border) and Helsinki (blue dotted border). According to the EDGAR data, NOx emissions from the territory of St. Petersburg are significantly greater than those from Helsinki. Several strong point emissions in Figure 3 can be attributed to stationary sources (power plants or industries).
The natural emissions of carbon-containing compounds, which are formed due to vegetation activity, were determined by MEGAN (Model of Emissions of Gases and Aerosols from Nature) [32], which is a part of the WRF-Chem model version used. To calculate biogenic emissions via MEGAN, data such as surface type, atmospheric conditions, and vegetation characteristics (e.g., leaf area index) were used. The spatial resolution of emissions calculated by MEGAN is ~1 km. The data of the global inventory FINN (The Fire INventory from NCAR) of 2.4 and 2.5 versions [33] were used to set the emissions resulting from biomass burning (e.g., wildfires). The FINN inventory is formed by using information on the locations of forest fires and surface type derived from satellite measurements by the Moderate Resolution Imaging Spectroradiometer (MODIS, onboard Terra and Aqua) and the Visible Infrared Imaging Radiometer Suite (VIIRS, onboard Suomi-NPP) instruments. The spatial resolution of the inventory is ~1 km. Finally, natural emissions of aerosols from sea surfaces and dust are calculated by the parametrizations described in [34,35], respectively, which are parts of the WRF-Chem model.
The processing of the emission data and the setting of initial and boundary conditions for the WRF-Chem simulation were carried out with software provided by the NCAR ACOM (Atmospheric Chemistry Observations and Modeling) lab. The software is available at https://www2.acom.ucar.edu/wrf-chem/wrf-chem-tools-community (accessed on 1 January 2024).
Table 2. Atmospheric processes and their parameterization schemes used in the WRF-Chem simulation.
ProcessScheme
Transfer of shortwave EM radiation in the atmosphereDudhia Shortwave Scheme [36]
Transfer of longwave EM radiation in the atmosphereRRTM Longwave Scheme [37]
Model of land surface layers’ interactionUnified Noah Land Surface Model [38]
Earth’s surface layer modelRevised MM5 Scheme [39]
Earth’s boundary layer modelYonsei University Scheme (YSU) [40]
Vertical transport and convective cloudsGrell–Freitas Ensemble Scheme [41]
Microphysics of cloudsMorrison 2–Moment Scheme [42]
Urban effectUrban Canopy Model [43] (Default Setup)

2.1.3. Chemical Transformation and Aerosol Dynamics

To simulate chemical transformations in the atmosphere by the WRF-Chem model, the MOZART (Model for Ozone and Related Chemical Tracers) scheme was used [44]. This scheme considers 157 gas-phase, 12 heterogeneous and 39 photolytic reactions describing the dynamics of the contents of 85 gases in the troposphere and lower stratosphere. The MOZART scheme describes all the main paths of ozone evolution in these atmospheric layers. The MOSAIC (Model for Simulating Aerosol Interactions and Chemistry) scheme [45] was used to simulate the dynamics of aerosols in the atmosphere, which is related to both the atmospheric state and gaseous composition.

2.2. Data for the Model Validation and Analysis

2.2.1. Local Measurements of Ozone and Its Precursors

St. Petersburg, Russia

Regular local measurements of NSOCs have been carried out at the SPbU site in Peterhof (59.88° N, 29.82° E) since 2013 [46]. Peterhof is a suburb of St. Petersburg and is located approximately 25 km to the west of the city center (Figure 2b). The SPbU site, which is mostly under background conditions, is surrounded mainly by mixed forests and fields, with access to the Gulf of Finland in the north. In contrast to the center of St. Petersburg, there are no significant stationary sources of ozone precursors in Peterhof, except for the ring road. The observations were conducted by a Thermo Scientific Model 49i gas analyzer 15 m above ground level. The instrument is based on the ability of molecules to absorb ultraviolet radiation. The random error of the NSOC measurements is ~0.5 µg m−3. The instrument was calibrated last time in 2017. The data are provided as hourly mean values.

Helsinki, Finland

Since the end of 2005, regular measurements of NSOC, NOx, CO and other gases have been carried out by scientists at the Finnish Meteorological Institute (FMI) and University of Helsinki (UHEL) in Helsinki [26] (Figure 2b). The measurements were performed by a TEI49 IR-absorption photometer (O3) and a chemiluminescence analyzer with a thermal converter TEI42S (NOx and NO) at the SMEAR III station on the territory of the Kumpula Campus (approximately 4 km northeast from the city center) at approximately 4 m above ground level. The data are available with a 1 h temporal resolution. The SMEAR III station is located in a semi-urbanized area of Helsinki surrounded by automobile roads, parks, gardens, and mainly administrative buildings. According to the EDGAR v5.0 anthropogenic emissions inventory [47] (Figure 3), SMEAR III is encircled by less powerful sources of NOx in comparison to the SPbU station (at least 2 times lower, for example, in January 2015). Therefore, it can be assumed that the biogenic influence on NSOC via emissions of volatile organic compounds (VOCs) is more significant in Helsinki than in St. Petersburg. All available observation data derived at the SMEAR III station are used in the study. However, only part of the data was checked by specialists (flag “CHECKED”) (https://smear.avaa.csc.fi/ (accessed on 1 January 2024)).

2.2.2. Tropospheric Ozone Measurements at St. Petersburg

Since 2009, the TrOC values have been measured at the SPbU station using a Bruker IFS 125HR Fourier spectrometer in Peterhof (FTIR method). The instrument measures the spectra of direct solar IR radiation, which is weakened by the atmosphere, in the range of 650–5400 cm−1. The number of observations depends on cloudiness, season, and time of day and constitutes approximately 70 days per year. The measured spectra were analyzed with PROFFIT9 software [48]. The TrOC values considered in the study are derived by integrating the retrieved ozone content profiles up to ~8 km (13 layers) in height. The details of the tropospheric ozone retrieval procedure can be found in [49,50].
In the present study, the observations, averaged hourly (833 values) and daily (248 values), are considered for the 2016–2019 period. According to [49], the mean systematic error of TrOC measurements based on all available data (2009–2022) is 3.9 ± 0.7%, with a random error of 1.9 ± 0.4%. Considering a smoothing error as well, the total uncertainty reaches ~10%. The TrOCs obtained by the FTIR method differ from the ozonesonde data by approximately 7%, which is close to the theoretical precision estimates [51]. The SPbU station in Peterhof and its measurements of atmospheric composition are included in the NDACC (Network for the Detection of Atmospheric Composition Change) observational network. The measurements are available at the NDACC archive (https://www-air.larc.nasa.gov/missions/ndacc/data.html# (accessed on 3 December 2023)) (St. Petersburg site). The process of preparing the modeled data for comparison with the integrated TrOCs obtained from the measurements is described in Appendix A [52].

2.2.3. Meteorological Measurements in St. Petersburg and Helsinki

The measurements of near-surface wind parameters and air temperature in St. Petersburg (Peterhof) and Helsinki (Kumpula) are used to verify how the WRF-Chem model simulates the main meteorological parameters that influence NSOCs. Regular meteorological observations started in Peterhof in 2018 on the roof of the Institute of Physics of the SPbU campus (~28 m above ground level) by a WXT536 weather station (https://www.campbellsci.com.au/wxt536 (accessed on 3 December 2023)) with an ~10 s data frequency. According to the instrument documentation, the air temperature accuracy (at 20 °C) constitutes 0.3 °C, the wind speed accuracy (at 10 m/s) is 3%, and the wind direction accuracy (at 10 m/s) is 3°.
In Helsinki, the measurements of the main meteorological parameters are performed at the SMEAR III station. The weather station is located on the roof of the Faculty of Physics (Physicum) of the University of Helsinki (~30 m above ground level). The wind speed and wind direction are measured by a Vaisala cup anemometer WAA141 and wind vane, while the air temperature is measured by a Pt1000 thermometer. The accuracies for wind speed and direction are approximately 0.1–0.5 m/s and 3°, respectively. The air temperature accuracy is ~0.3 °C. The data were obtained at the https://smear.avaa.csc.fi (accessed on 3 December 2023) site, with a 1 min temporal resolution. They cover the entire period of study from 2016 to 2019.

2.2.4. ERA5 Meteorological Reanalysis Data

The ERA5 meteorological reanalysis data [28] are used in this study to analyze the planetary boundary layer height (PBLH) in the area of the measurement stations in both cities. The ERA5 reanalysis data are the product of the combination of 3D numerical modeling and 4DVar assimilations of the measurements. The data are available globally, with a 1 h temporal resolution and 0.25° spatial resolution.

3. Results and Discussion

3.1. Analysis of the WRF-Chem Modeling in St. Petersburg and Helsinki

For the validation of the simulated data, hourly outputs were used in the modeling process. Therefore, all the observation data with time frequencies higher than 1 h were averaged hourly. Note that the WRF-Chem data output corresponds to the hourly output of the 1 min model simulation results (see Table 1). The modeled data were taken from the cell closest to the measurement sites.

3.1.1. Near-Surface Meteorological Parameters

Table 3 presents the differences (mean difference or MD, standard deviation of differences or SDD and Pearson correlation coefficient or CC) between the measurements and the WRF-Chem model for three meteorological parameters, near-surface air temperature, wind speed and direction, for 2018–2019 in St. Petersburg and for 2016–2019 in Helsinki. The equations for the statistical characteristics are given in Appendix B (A2, A3, A4). Modeled air temperature data were obtained from the first model level, which corresponded to 30–50 m above ground level. Wind parameters were derived from two diagnostic variables: wind speed and direction 10 m above ground level.
In general, the WRF-Chem model simulates the temporal variations in three meteorological parameters at St. Petersburg and Helsinki, with CCs of 0.95 for the near-surface air temperature and 0.73 and 0.77 for the wind speed and wind direction, respectively. In general, a better fit between the modeled and observed data was found for St. Petersburg. The model underestimates air temperature by 2.5 and 3.2 °C and overestimates wind speed by 0.7 and 2.2 m/s in St. Petersburg and Helsinki, respectively. Even though the MD for the near-surface wind direction is lower in Helsinki, the SDD is greater. In both cities, meteorological measurements were carried out near the surfaces of buildings. In the simulation, building effect parametrization was used with the default settings. This could be a reason why the model underestimates the near-surface air temperature in particular areas.
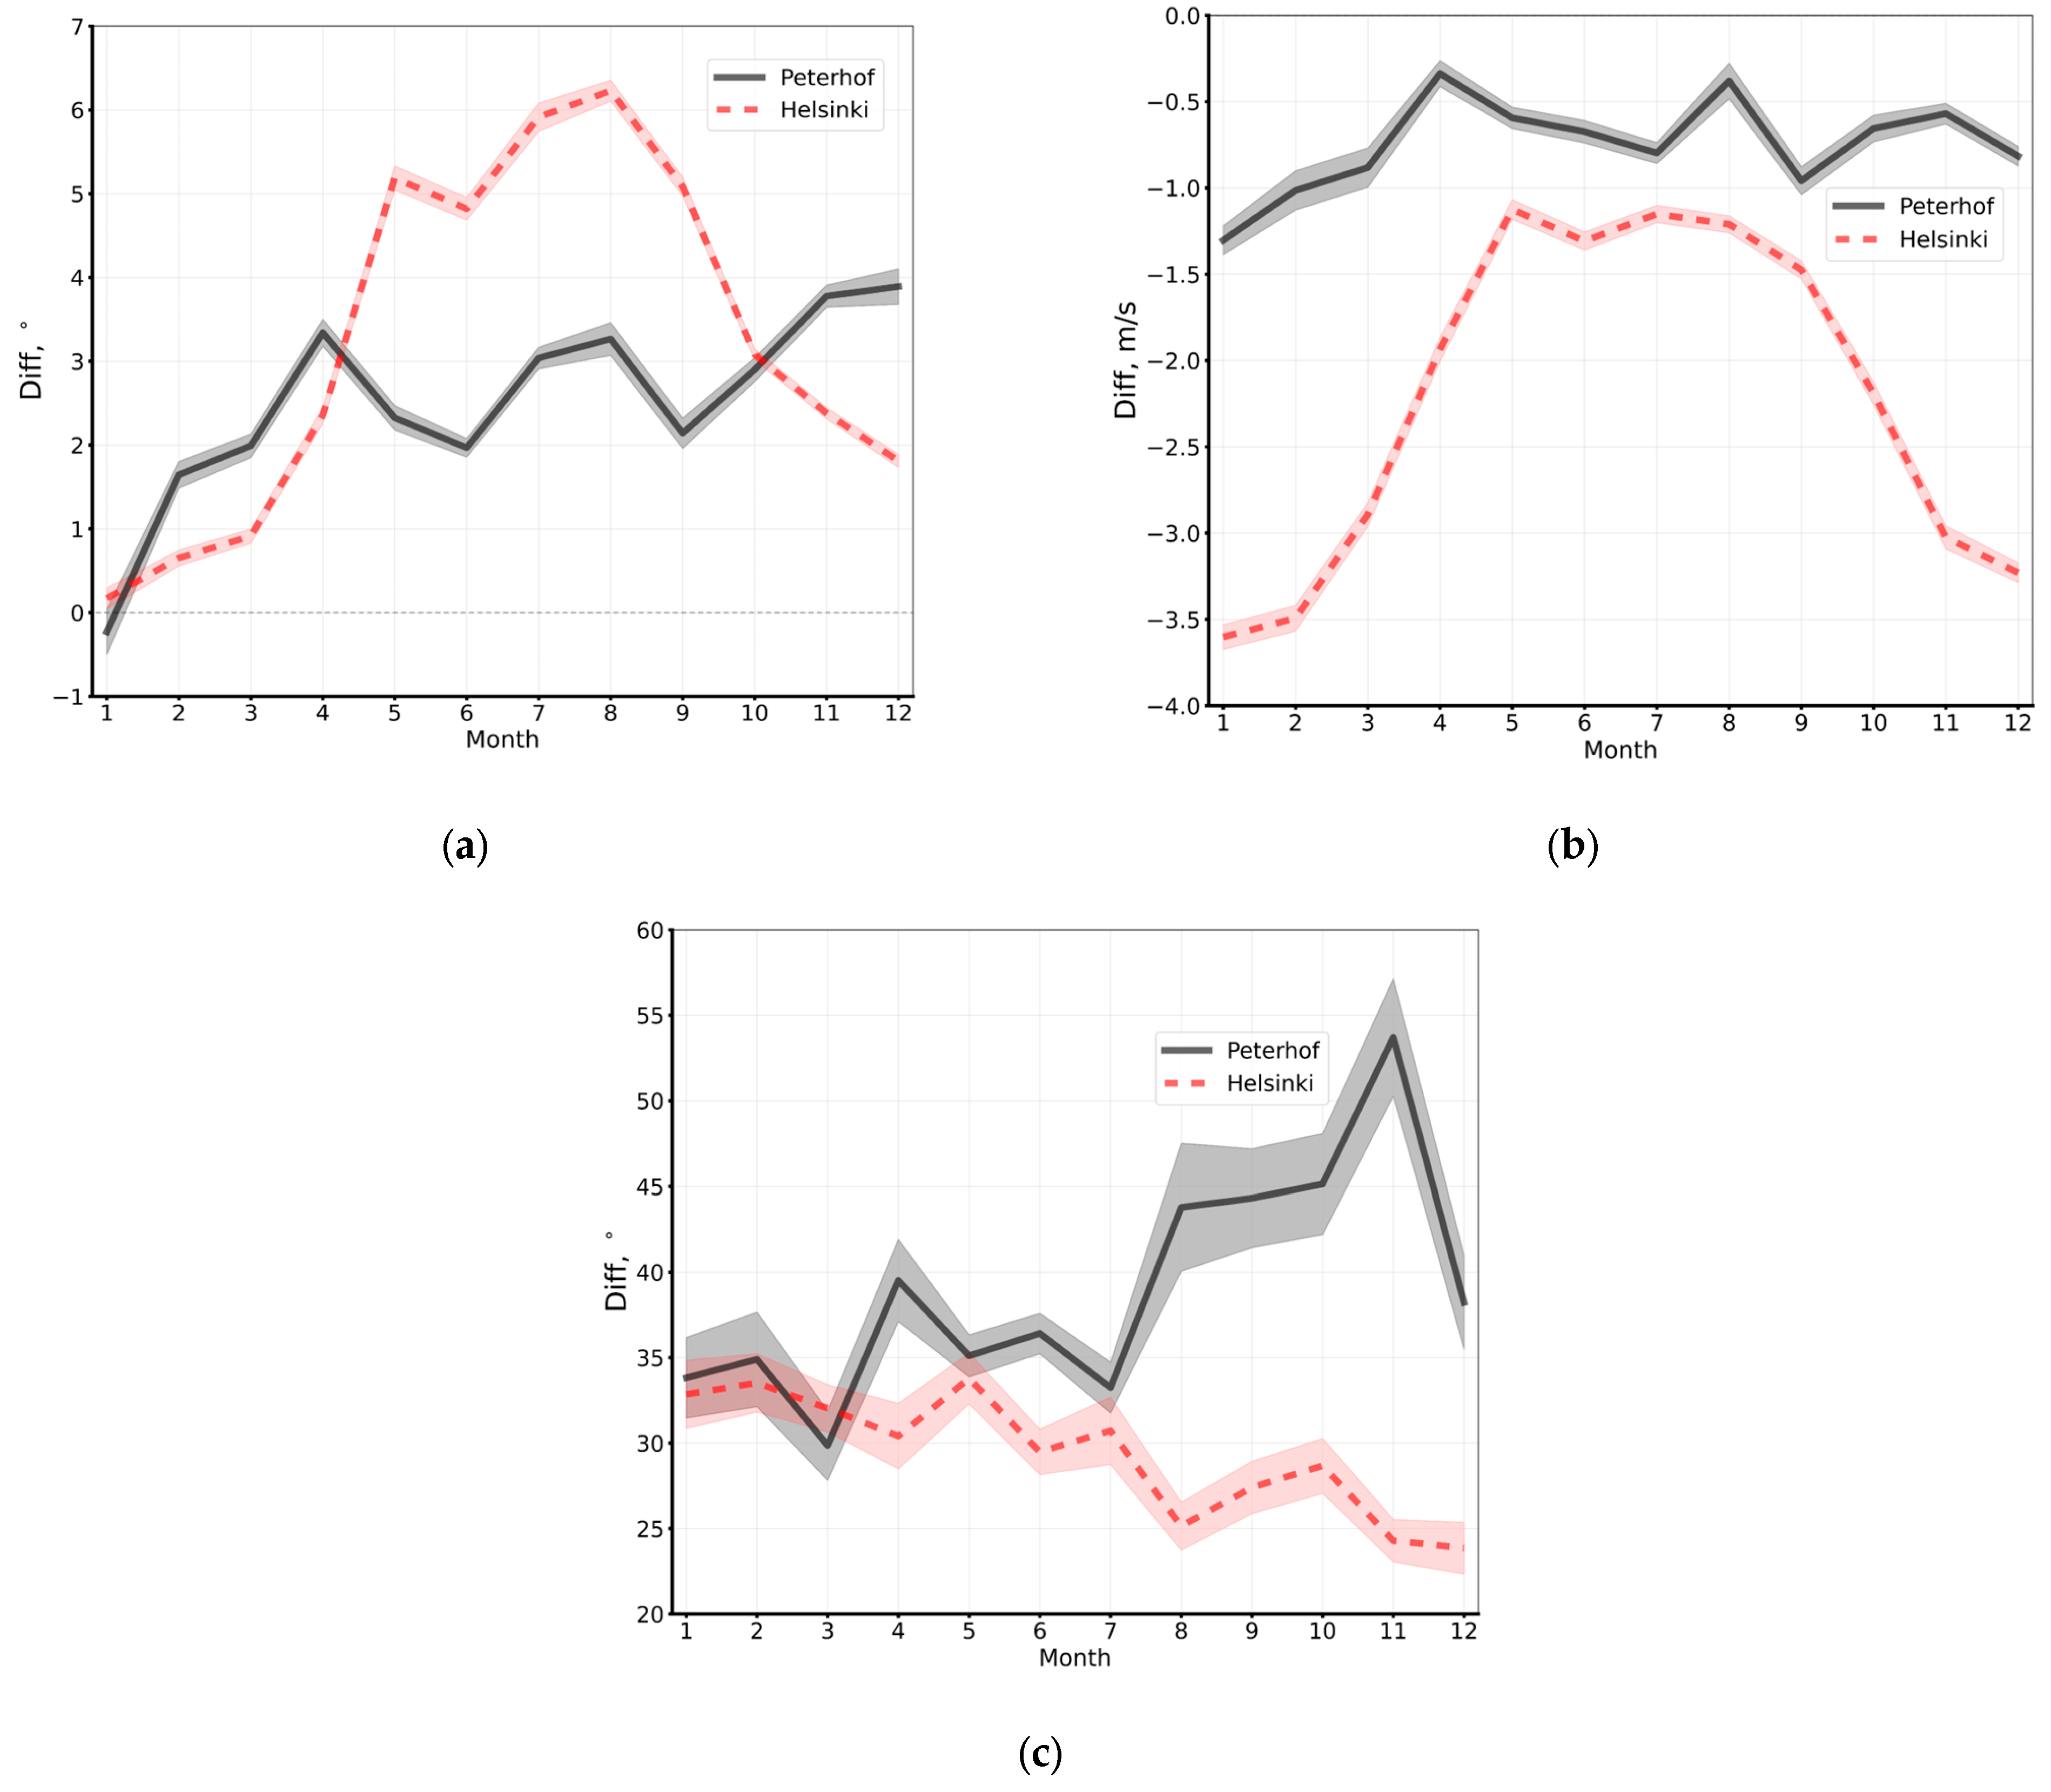
Figure 4 depicts the monthly mean differences between the three meteorological parameters according to the observations and modeling in St. Petersburg (black curve) and Helsinki (red curve). The colored shaded areas characterize the confidence intervals for each month calculated by the method described in Appendix B (Equation (A5)) [53]. A shorter period was analyzed in the case of St. Petersburg than in that of Helsinki (2018–2019 vs. 2016–2019), which was related to the availability of the data at the SPbU site. Even though there are other weather stations located in St. Petersburg, their data are not fully publicly available and therefore were not used in the study.
The mean differences between the measured and modeled near-surface air temperature and wind speed in Helsinki have a pronounced seasonal dependence (Figure 4a,b, red curve). It is characterized by an increase in air temperature MDs to August (from ~0 to 6 °C), followed by a decrease to December (from 6 to 2 °C). In contrast, for wind speed, MDs decrease until May (from 3.5 to 1 m/s) and then increase until December (~3 m/s). Wind direction MDs in Helsinki also show some kind of seasonal dependence, decreasing from the beginning to the end of a year by ~10°.
An increase in air temperature MD in warmer periods during a year obviously correlates with seasonal air temperature variations. The large MDs are probably related to more complex physical processes in the lower troposphere (in the planetary boundary layer and surface layer) and atmosphere–surface interactions (thermal and water exchange) during this period. In addition, the seasonal dependence of air temperature MDs can be related to the influence of the building heating effect, which was considered in the simplified form of the WRF-Chem simulation.
In St. Petersburg, the MDs for the meteorological parameters do not exhibit specific seasonal variations. This difference is likely related to the less complex landscape and more homogeneous type of surface in comparison to those in Helsinki. Assuming that the seasonal dependence of MDs in Helsinki is related to a simple consideration of the building effects in the modeling, the lack of MD seasonal dependence in St. Petersburg can be explained by differences in building effects at the stations and heights of the instruments above the rooftops. However, wind direction MDs demonstrate some kind of seasonal dependence, significantly increasing from July to November by ~20°. Finally, the monthly distribution of MDs at both stations can be influenced by the different sizes of the datasets.

3.1.2. Near-Surface Ozone Concentrations

The main characteristics of the differences between the observed and modeled hourly NSOC values in both cities are provided in Table 4. The confidence interval for the SDD was estimated as in [54] (Equation (A6) from Appendix B). According to the observations, the mean NSOC in St. Petersburg (Peterhof) on average was 8.5 µg m−3 lower than that in Helsinki (46.9 and 55.4 µg m−3); the standard deviations were 22–23 µg m−3.
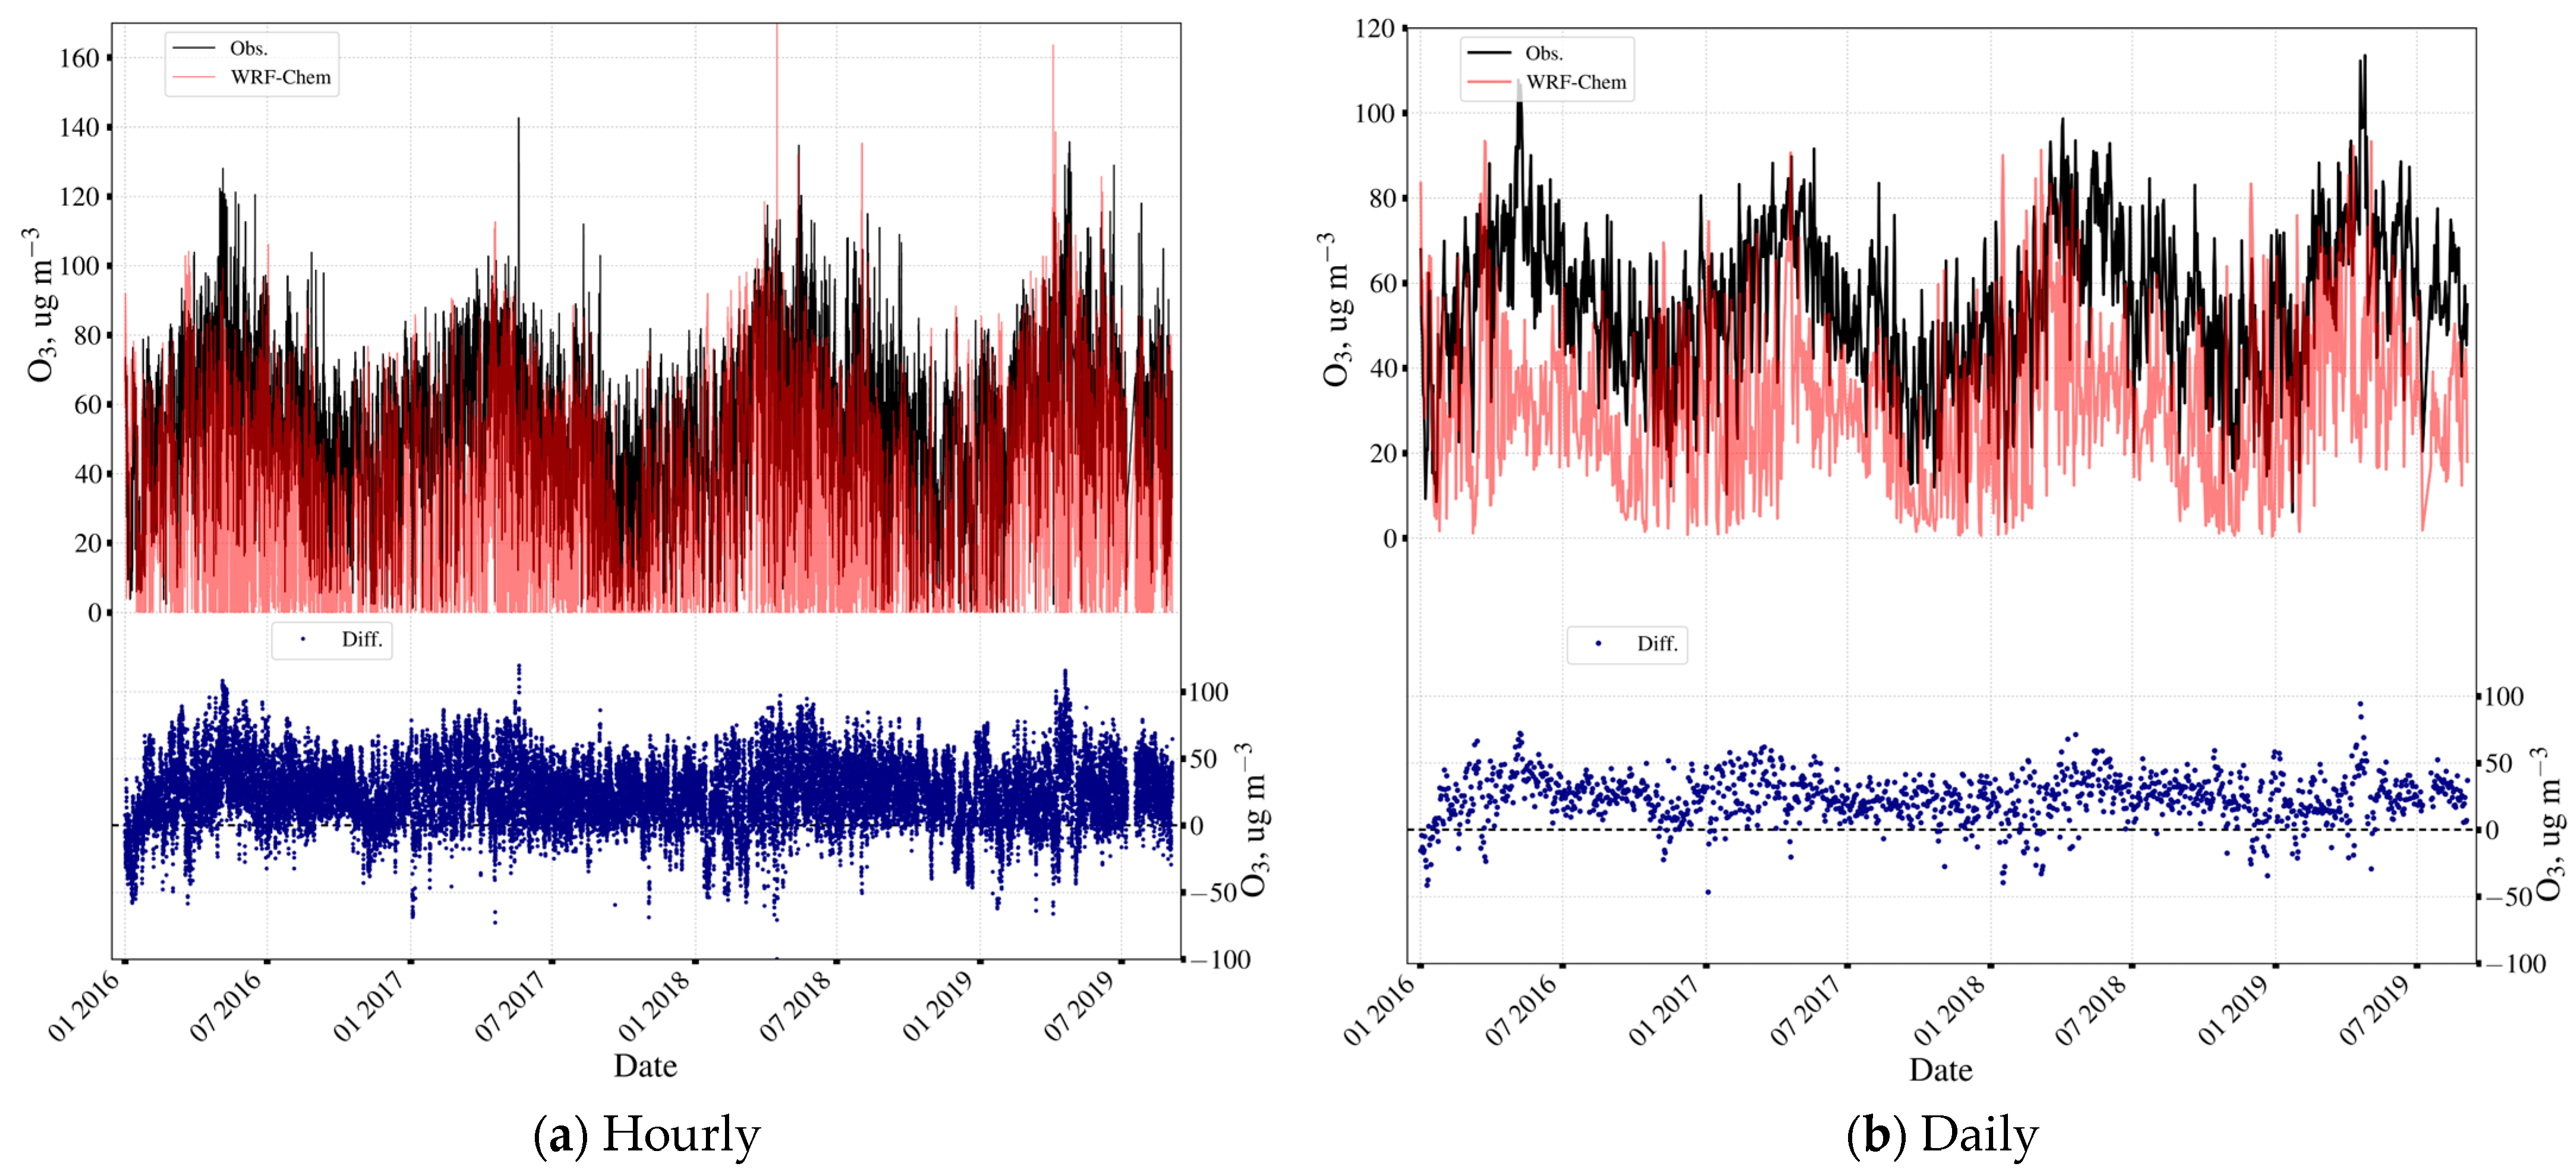
In general, the WRF-Chem model underestimates the hourly NSOC values at both stations (Figure A2 and Figure A3a in Appendix C [55]). The MD was significantly greater in Helsinki (Figure A3a) than in St. Petersburg (Figure A2a) (~43.5% vs. 10.7%). The SDD was greater in St. Petersburg than in Helsinki (60.4% vs. 42.6%). The MDs for NSOC at the SPbU station varied significantly during the day and constituted 0.6% of the total during a period of 6–18 h of local time and 19% during a period of 18–6 h. The MDs at the SMEAR III station in Helsinki varied from 31 to 58% during the day and night hours, respectively. The CCs between the modeled and observed NSOCs at both stations were between 0.44 and 0.52.
For the daily mean NSOC values (Figure A2 and Figure A3b, Table 5), the SDDs decreased at both stations (to 43.6% in St. Petersburg and 31.1% in Helsinki). The differences between the observed and modeled data in Helsinki increased in the second half of spring when the NSOC values reached their natural seasonal maximum. In St. Petersburg, the seasonal dependence of NSOC MDs was less pronounced. After daily averaging, the CCs between the observed and modeled NSOCs increased and reached 0.46 for St. Petersburg and 0.56 for Helsinki.

Diurnal Variations in NSOCs

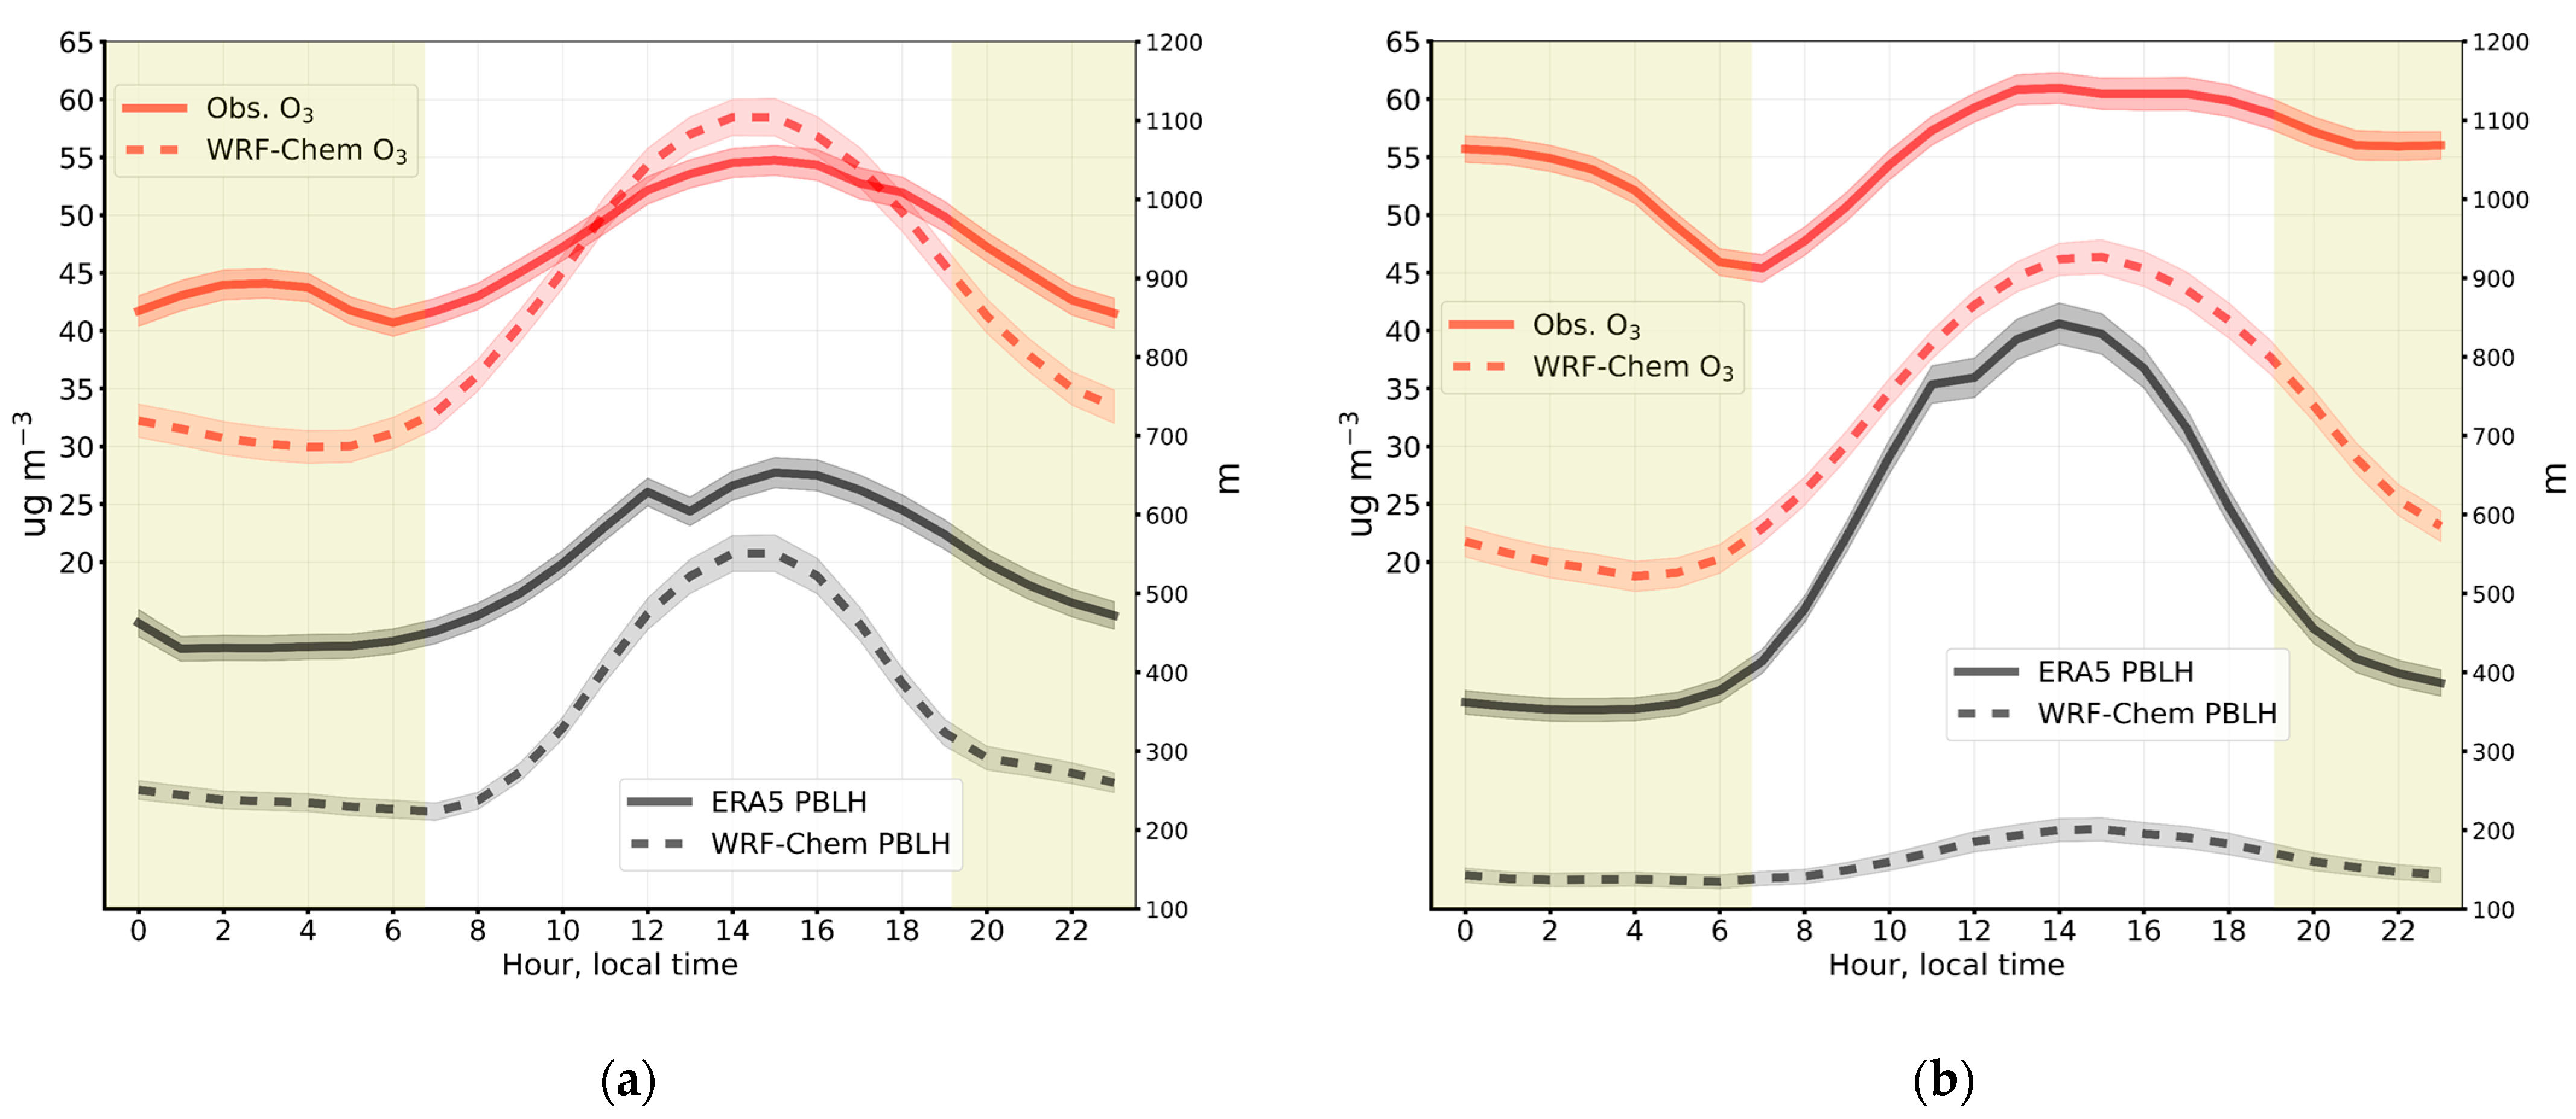
Figure 5 presents the mean diurnal NSOC and PBLH variations in St. Petersburg (a) and Helsinki (b) based on observations, WRF-Chem modeling and the ERA5 reanalysis. The data are provided in local time for both stations.
In St. Petersburg, the measured NSOCs slightly increased to 3 h (by less than 5 µg m−3 relative to the minimum), followed by a decrease to 6 h, an increase to 15 h (by ~15 µg m−3) and another decrease. In Helsinki, the afternoon NSOC maximum was also pronounced (by more than 20 µg m−3), while the night maximum was not well defined; this difference was likely related to the previous day’s evening–night decrease in the NSOC. The first NSOC minimum at 6 h at both stations is probably related to ozone depletion due to reactions with relatively large amounts of NOx molecules. In turn, NOx molecules are emitted to the atmosphere by transport during the morning rush hour. The negative (or inverse) correlation between the NSOC and NOx concentration can be explained by the occurrence of a VOC-limited regime (where VOC is a volatile organic compound). This regime occurs under conditions of high concentrations of NOx in the atmosphere and low concentrations of hydrocarbons [56]. The subsequent increase in NSOCs in Helsinki can be related to an increase in incoming solar radiation, which probably accelerates ozone formation from NO2 molecules. In addition, the increase in NSOCs can be influenced by stratospheric ozone intrusion, especially during conditions in the lower troposphere, with the active vertical mixing of air in the second half of a day [57].
The WRF-Chem model better simulated the diurnal NSOC variation in St. Petersburg than in Helsinki. However, in both cases, WRF-Chem did not reproduce the nighttime increase in NSOCs at either station. The amplitude of the diurnal NSOC variations according to the modeling was 15 µg m−3 greater than the measured values in both cities.
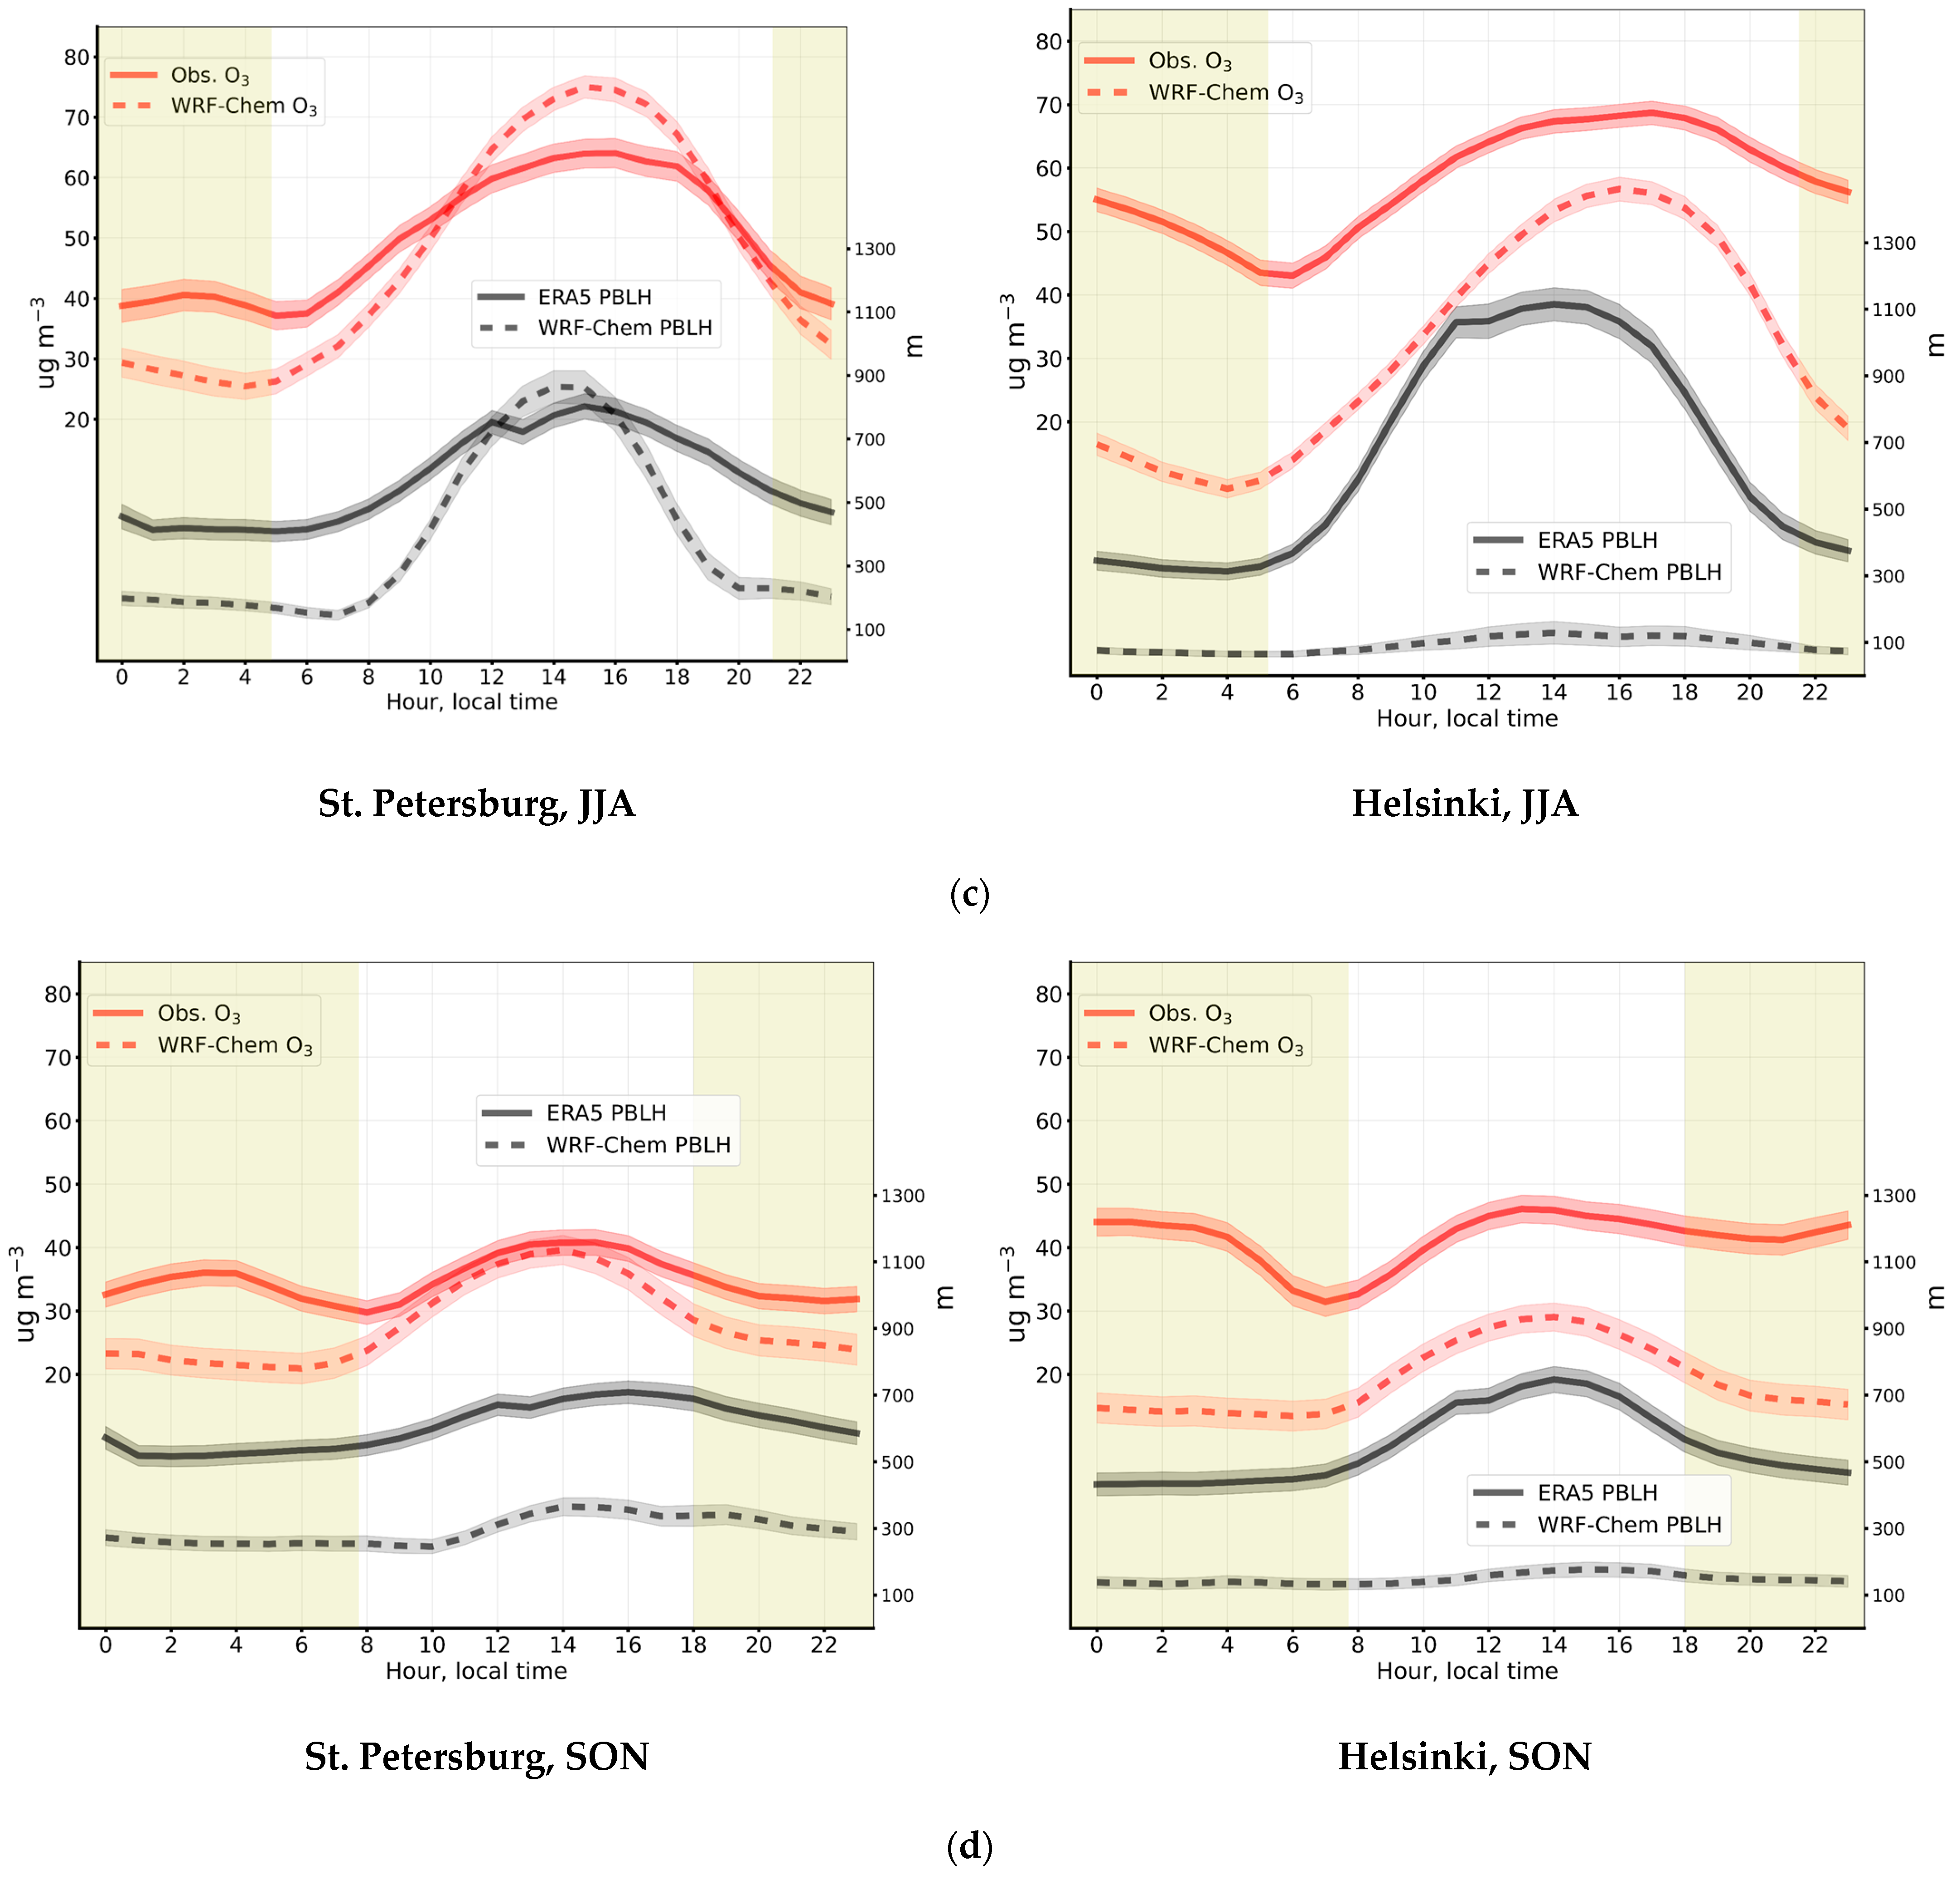
Figure 6 presents the same diurnal cycle of NSOCs and PBLH but for different seasons. The shape of the experimental NSOC diurnal distribution was the same during all seasons for both cities. It is characterized by small (during night hours) and large (after 13–14 h of local time) maxima. An increase in NSOCs during spring and summer with a more pronounced (higher amplitude) mean diurnal distribution was registered in both cities. Most similarities between the NSOC diurnal variations at both stations were found during cold periods—autumn and winter. However, there are significant differences in spring and summer. For example, in Helsinki, the night and afternoon maxima of NSOCs differ by approximately 10 µg m−3, while in St. Petersburg, they differ by 15–20 µg m−3. The differences in the diurnal variations in NSOCs between the two stations may be related to the predominance of different factors influencing the dynamics of ozone in the lower troposphere. The minimum occurrence of NSOCs at both stations (6–8 h of local time) during all the seasons is assumed to be related to precursor emissions (particularly NOx) due to morning transport activity.
The WRF-Chem model better simulates the seasonal behavior of the NSOC diurnal variations at the SPbU station. For instance, there is a pronounced systematic difference between the observed and modeled data at the SMEAR III station in Helsinki. This can be related to the overestimation of NOx emissions in the numerical experiment.
The NSOC night maximum is more pronounced at the SPbU station. It is obvious that the factor causing the night maximum was not considered properly in the WRF-Chem numerical experiment, which led to the complete absence of this NSOC feature in the model. A similar night maximum of NSOCs was registered at a station in the Brazilian city of São Paulo [58]. The authors could also not reproduce the night maximum of NSOC. In [59], the authors proposed that the NSOC night maximum could be due to the formation of ozone molecules by photolysis in the presence of artificial city lights.
An analysis of the mean diurnal variations in NSOCs in St. Petersburg on weekdays (Monday–Friday) and weekends (Saturday–Sunday) revealed that the ozone concentration increased by 3.4 µg m−3 on weekends (plots are not provided). This could be due to a decrease in NOx emissions from automobile transport. However, the NSOC night maximum was found both on weekdays and weekends. In addition, the mean diurnal variations in NSOCs on weekdays and weekends correlate well with CC = 0.95. In turn, diurnal variations in NSOCs in Helsinki during weekdays and weekends differed more significantly (with CC = 0.54). This can be explained by the larger differences in NOx emissions during the week. Nevertheless, the NSOC maximum was also registered during both periods of the week.
In [60], a similar NSOC night maximum was found at a coastal station located near the Gulf of Finland. The authors suggested that this phenomenon could be related to the diurnal variation in the PBLH. By analyzing more relevant data (up to 2019), the NSOC night maximum was also found at several stations in Finland [61]. In general, these stations were located close to the water surface of the Gulf of Finland. In addition, more pronounced night maxima were found in [61] during autumn and winter. The same was observed in the current study (Figure 6).
To test the hypothesis on the relationship between the NSOC night maximum and the variations in the PBLH, the PBLH values, taken from the ERA5 reanalysis and the WRF-Chem modeled data, were analyzed for St. Petersburg and Helsinki. Although it is assumed that the ERA5 data should represent the atmospheric state better than the free-run simulation, they are also based on 3D numerical modeling, with corresponding inaccuracies. According to [62], the ERA5 data on average overestimate the PBLH by 30–130 m relative to the radiosonde data. Figure 5 and Figure 6 show the mean and seasonal diurnal variations in the ERA5 PBLH together with the NSOC variations. The shaded areas on the left and right represent the periods during which there was no direct solar radiation due to large solar zenith angle values.
According to the ERA5 data, after ~8 h of local time, the diurnal variations in both the NSOCs and PBLH were relatively close to each other (Figure 5). The PBLH maximum occurred at 14–15 h local time at both stations (~650 m in St. Petersburg and 850 m in Helsinki), while the minimum PBLH occurred during night hours (~450 m in St. Petersburg and 350 m in Helsinki). The amplitude of the PBLH at the SMEAR III station in Helsinki was greater than that at the SPbU station in St. Petersburg (approximately 400 vs. 200 m). Considering the mean diurnal variations in the PBLH in Helsinki according to the ERA5 data in summer (Figure 6a,c), the NSOC night maximum was not pronounced. This probably means that a low PBLH is not the only reason for species accumulation in the near-surface layer, but that the daily PBLH amplitude can also influence this process. For instance, well-pronounced night maxima of NSOC in winter at both stations were registered by measurements (Figure 6a), while the ERA5 PBLH did not change significantly during the day (450–500 m).
From this analysis, three findings can be made. First, the diurnal NSOC variations in St. Petersburg and Helsinki could be related to the diurnal variations in the PBLH. Second, the NSOC night maximum and the NSOC diurnal variations themselves can be significantly influenced by local meteorological conditions. For example, according to the ERA5 data, the PBLHs in St. Petersburg and Helsinki differed by up to 40%, depending on the season. Finally, it is likely that the WRF-Chem model, with the settings chosen in the current study, simulates the state of the troposphere, particularly the vertical transport, during the nighttime worse than during the daytime.
The PBLH values at the measurement sites retrieved by the WRF-Chem model generally fit the ERA5 data only for St. Petersburg (Figure 5 and Figure 6, left). The model significantly underestimates the PBLH in Helsinki, completely missing its diurnal variation not only on average (Figure 5, right) but also in all seasons (Figure 6, right). An analysis of the spatial distribution of the PBLH by the WRF-Chem data demonstrated that a sharp influence of sea surface conditions spread throughout the territory of southern Helsinki, which was related to the coarse spatial resolution of the simulation (10 km). One of the simplest ways to address this issue is to average the modeled values from several neighboring cells. However, averaging can still produce modeled PBLH values that do not correspond to the variations in the PBLH at the station. In addition, an analysis of the modeled NSOC variations during 2019 before and after averaging revealed that neither the diurnal nor the seasonal cycles changed significantly. In future studies, the modeling of tropospheric ozone variations in the territories of coastal cities should be carried out at a finer spatial resolution (at least 5 km).

Seasonal Variations in NSOCs

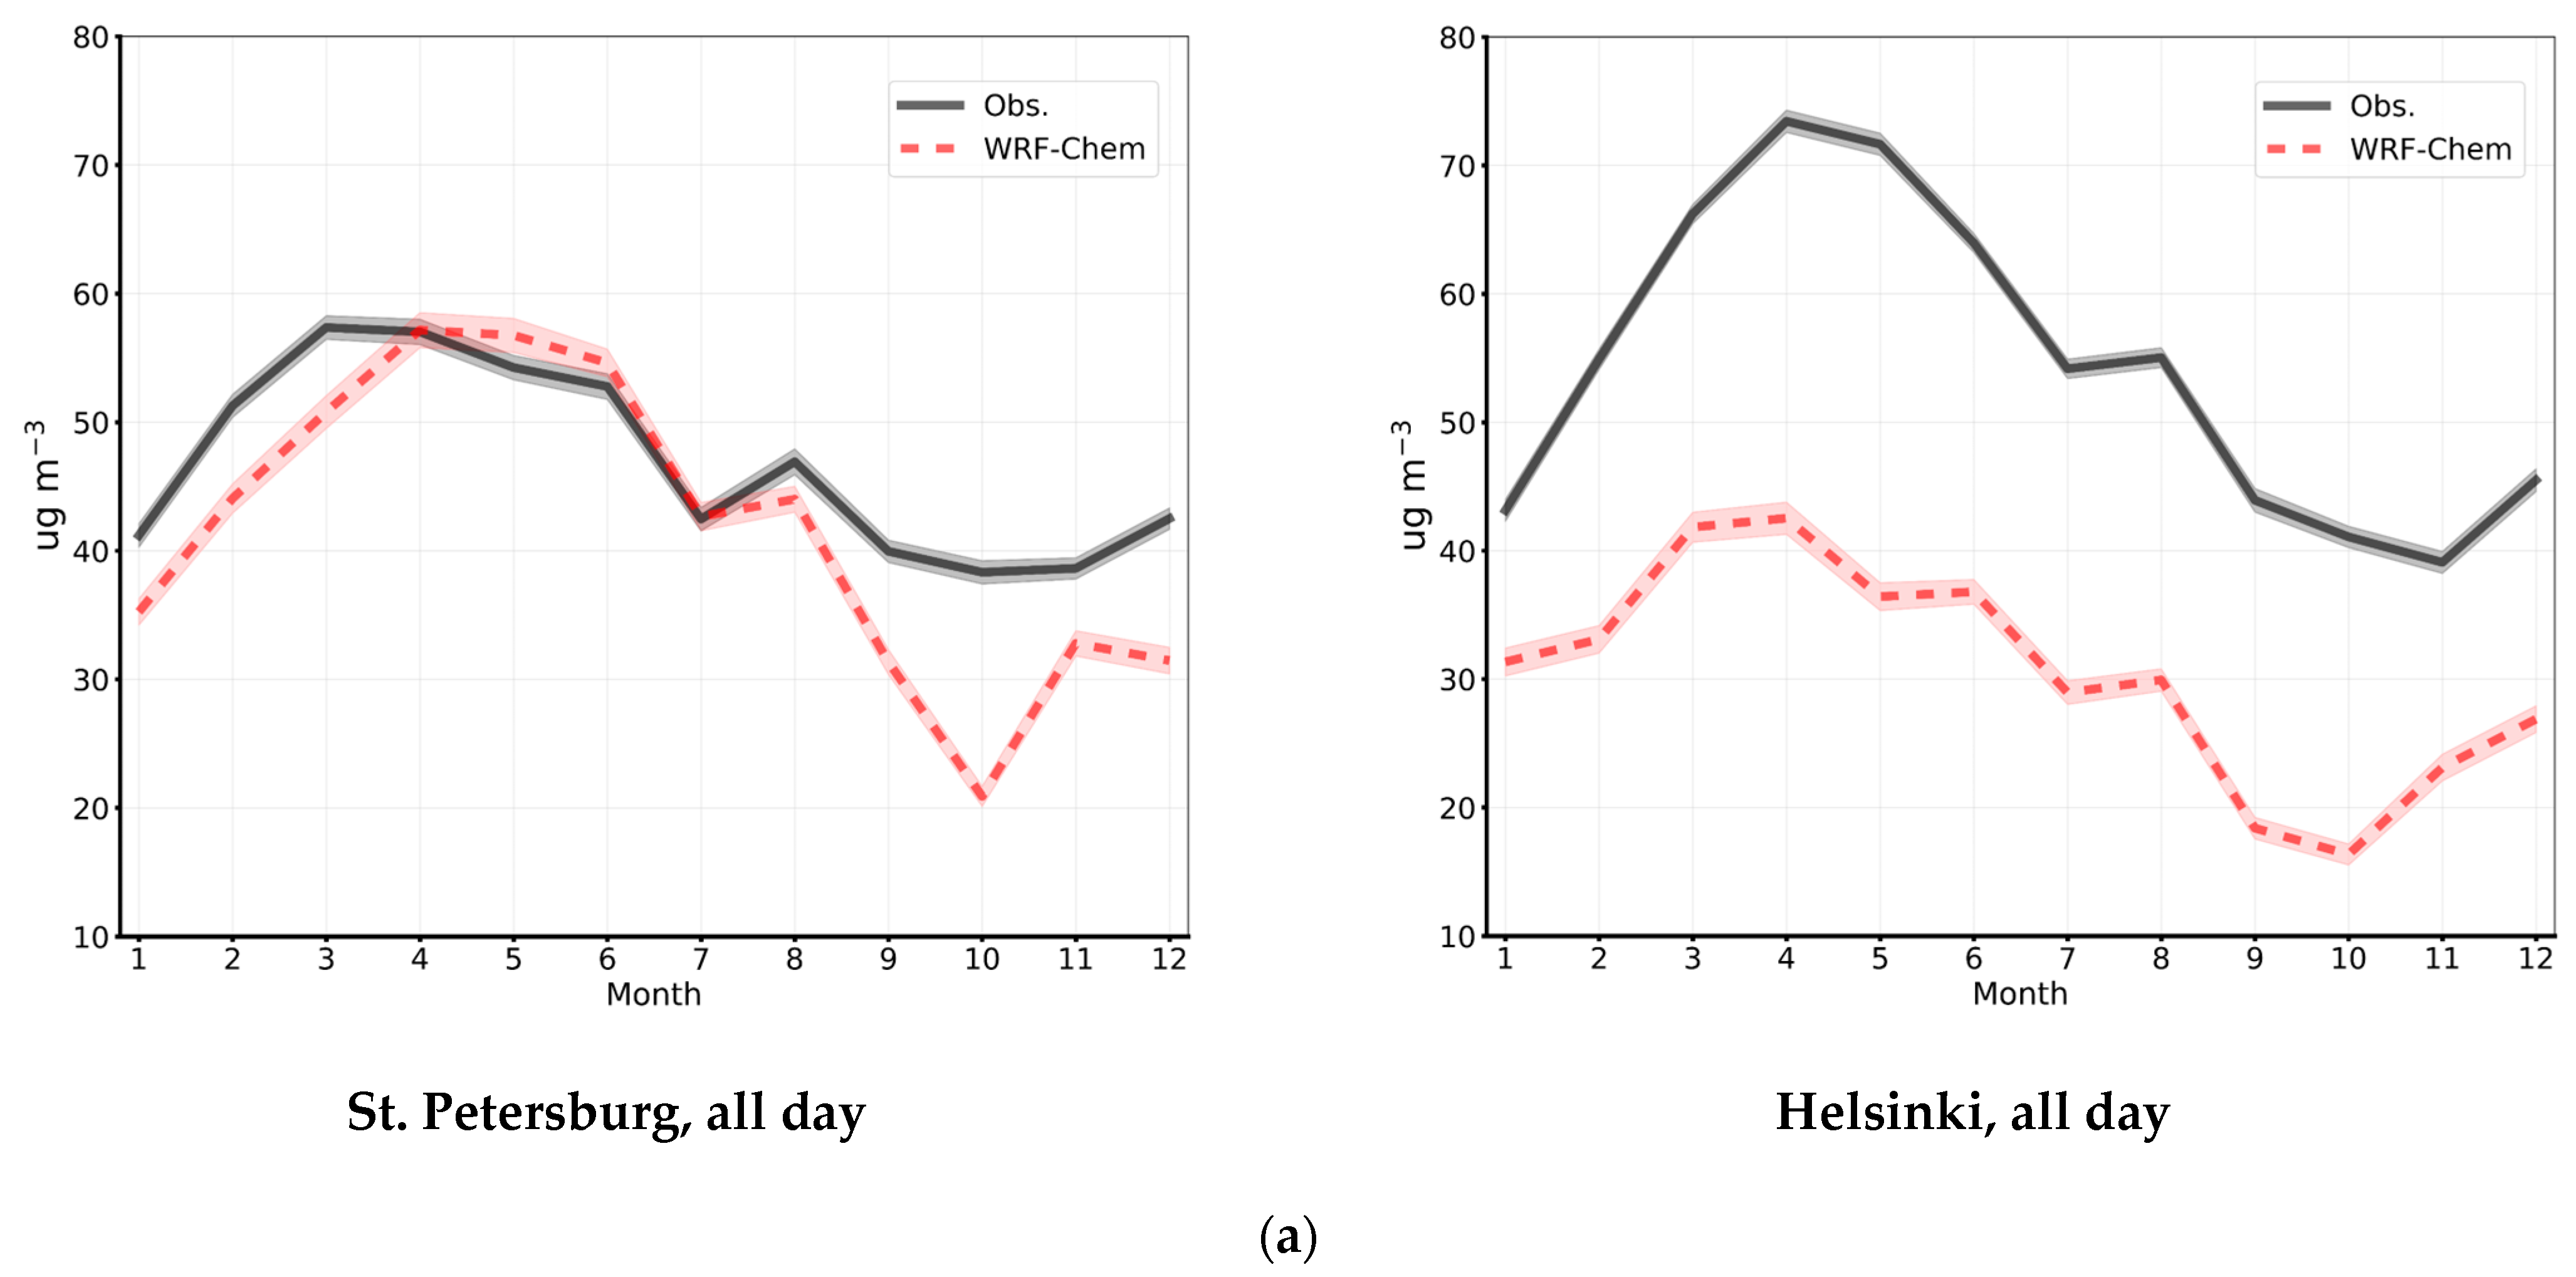
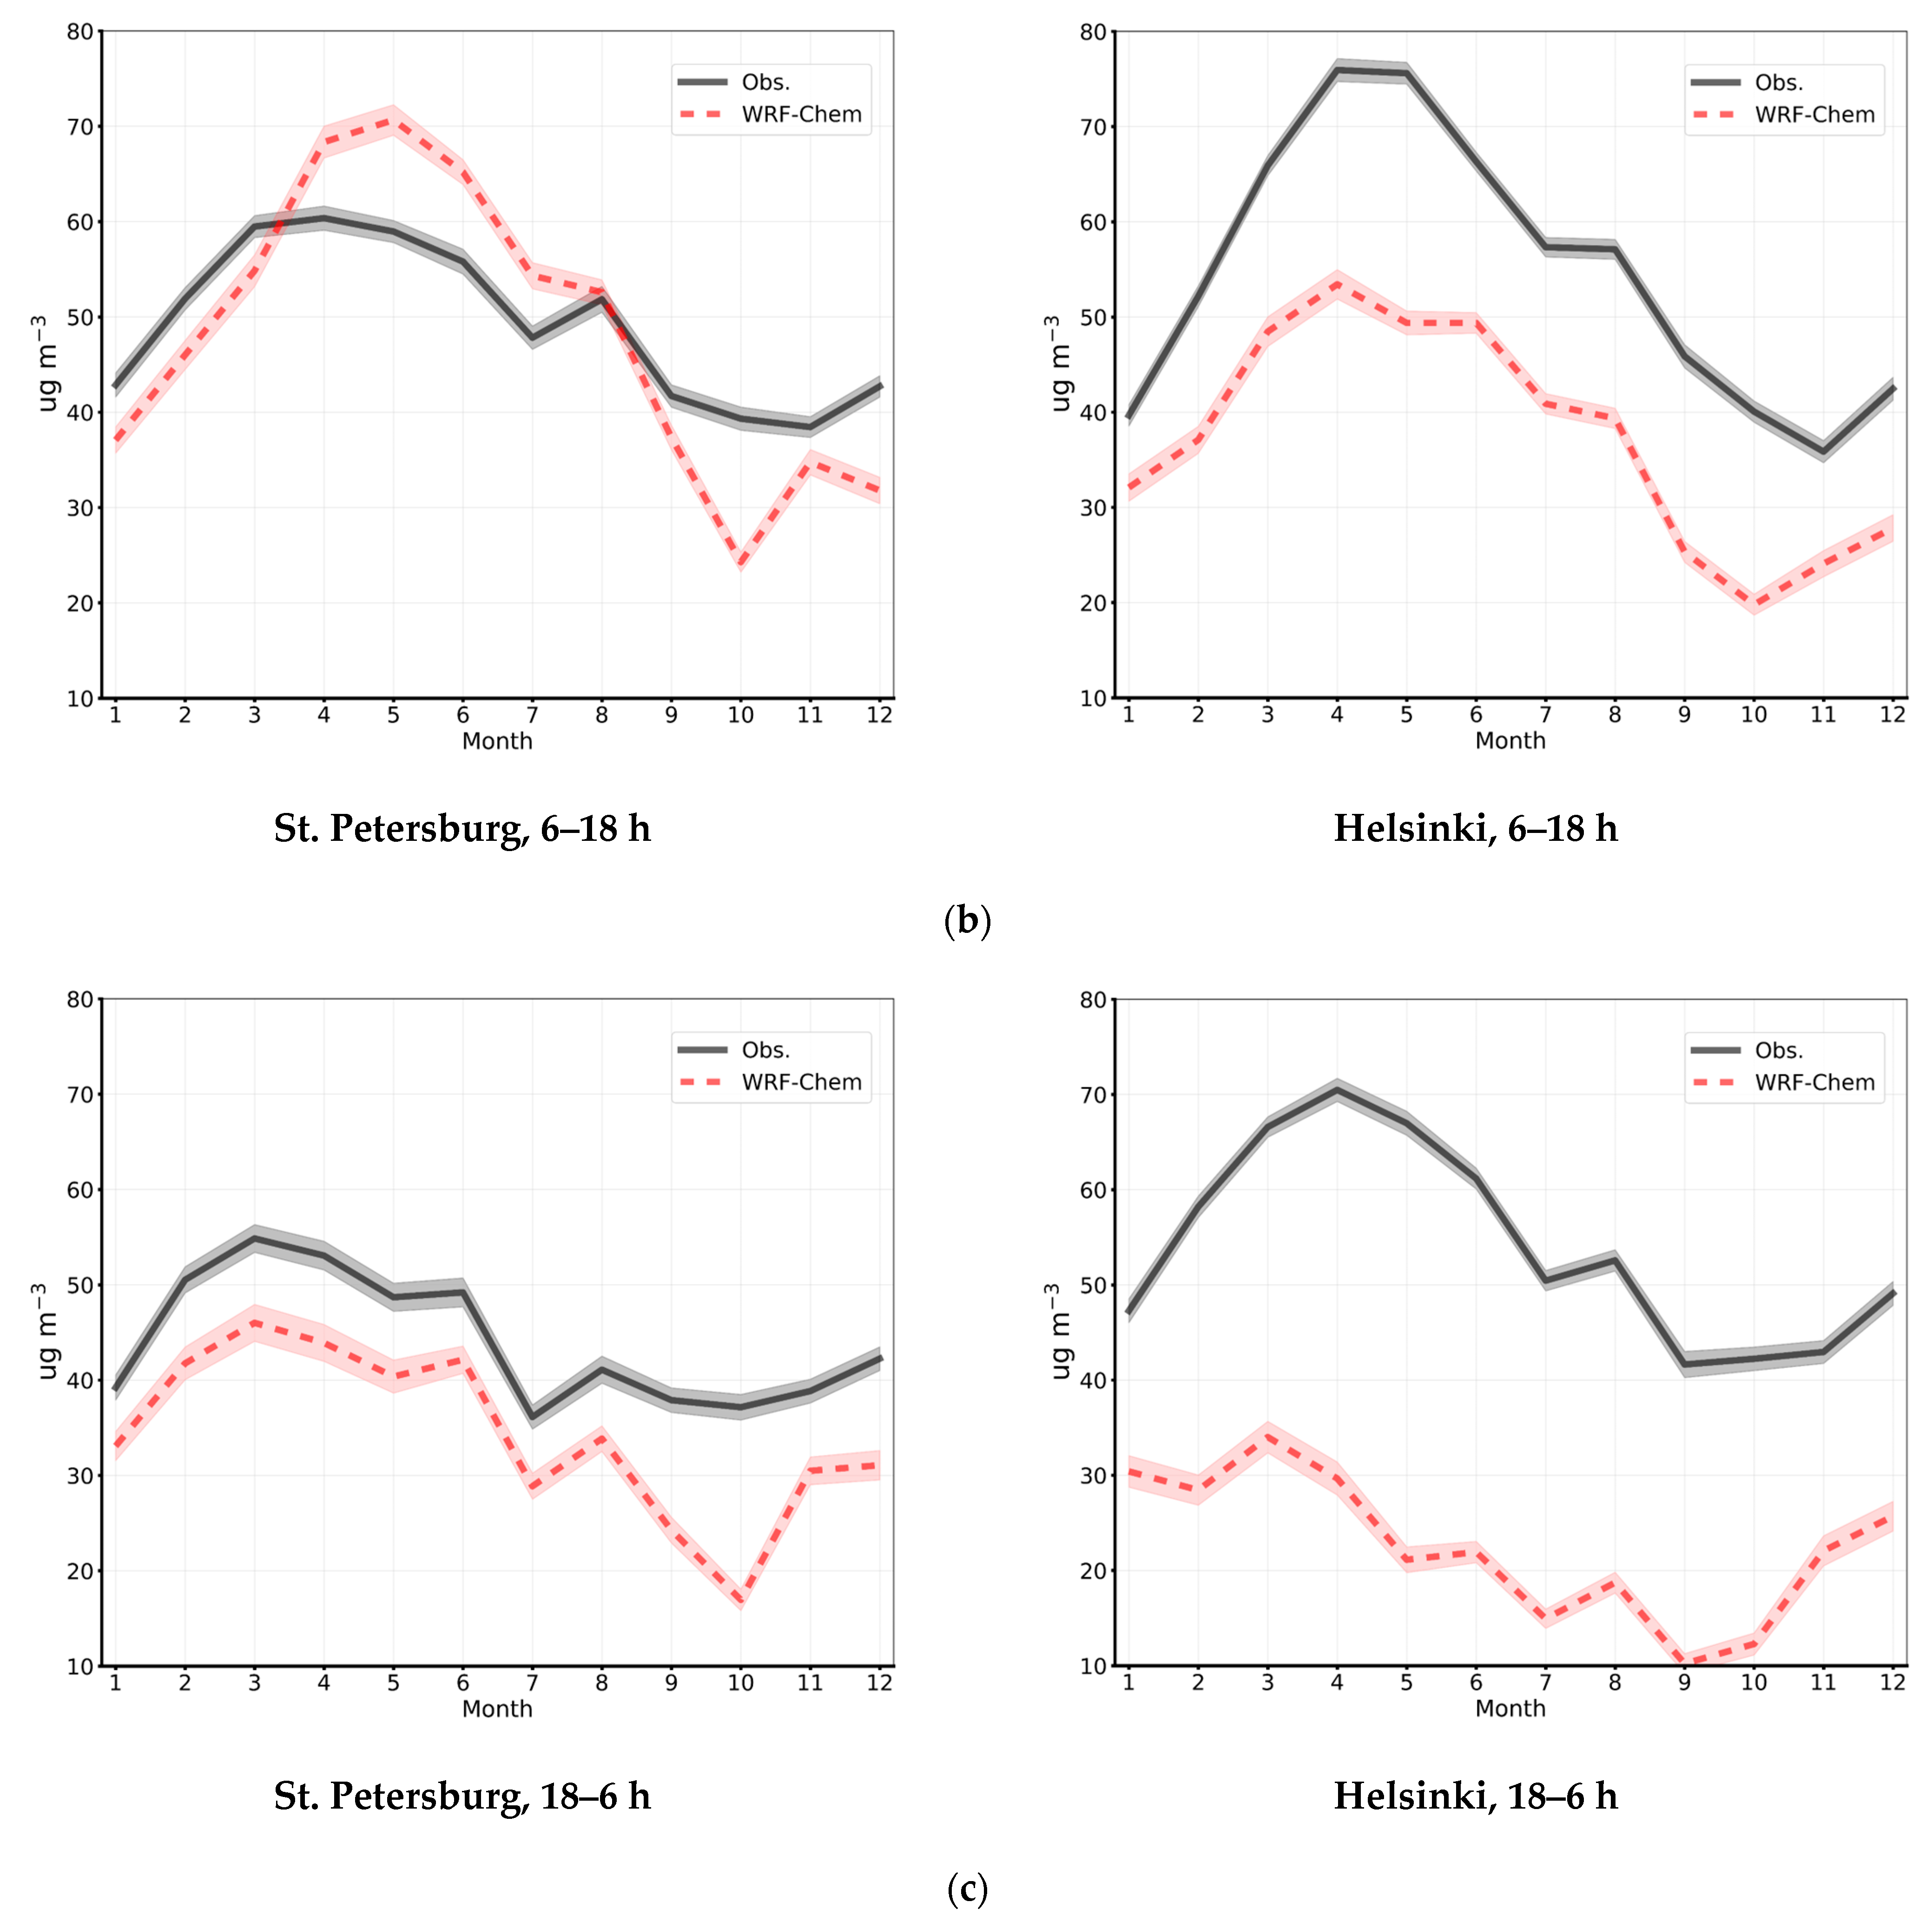
The mean seasonal variations in the measured NSOCs were significant, with the maximum occurring in April, followed by a decrease with a slight maximum in August (Figure 7a). This seasonal behavior can be explained by the seasonal cycle of the total ozone content caused by the Brewer–Dobson circulation and the variability in ozone formation near the surface, which depends on the insolation and temperature levels. The April maximum in Helsinki was ~10 µg m−3 greater than that in St. Petersburg. The WRF-Chem model better simulates the seasonal variations in NSOCs in St. Petersburg. The maximum differences between the observed and modeled NSOCs in St. Petersburg occurred in October. According to the modeling, a significant decrease can be seen in this month, which is not observed in the measurement data. The difference between the observations and modeling in Helsinki can be systematic and constitutes ~20–25 µg m−3 during a year. According to [63], such seasonal variations in NSOCs can be related to the influence of local and remote sources of ozone precursors. The same seasonal variations were found at the Hohenpeissenberg, Germany, (47.80° N, 11.01° E) and the Jungfraujoch, Switzerland, (46.55° N, 7.99° E) measurement stations.
An analysis of NSOC seasonal variations during the day (6–18 h) and night (18–6 h) (Figure 7b and c, respectively) demonstrated that maximal differences between the observations and modeled data occur during the night hours. This can be clearly seen in the case of Helsinki (Figure 7, right), where the differences vary from 10 to 20 µg m−3 during the day (Figure 7b) and from 30 to 40 µg m−3 during the night (Figure 7c). For the SPbU station (Figure 7 left), the differences are also greater during the nighttime (by 10 µg m−3) (Figure 7c).
The mean difference between the observed and modeled NSOCs at both stations may be related to the errors in chemical boundary conditions and emissions of ozone precursors. The study [14] demonstrated that by decreasing the ozone content on the boundaries of a modeling domain by 30%, the mean difference between the observed and modeled ozone content can be minimized by approximately 50%. The correction of the ozone content on the boundaries of the modeling domain can be carried out only after validations of the corrected data on the boundaries in a particular area. Without such validation, the correction of the boundary data can be carried out only hypothetically, even though the new modeling results will better fit the observed data. Due to the unavailability of observations at the boundaries of the modeling domain, the chemical boundary conditions were not corrected in the current study. In addition, the spatial resolution of the simulation may also influence the modeling results. For example, with a 10 km spatial resolution, it is impossible to determine the local features of an area (landscape, surface type, local air circulation patterns, etc.) that influence spatiotemporal variations in NSOCs and other atmospheric species.

3.1.3. Near-Surface NO2 Concentrations in Helsinki

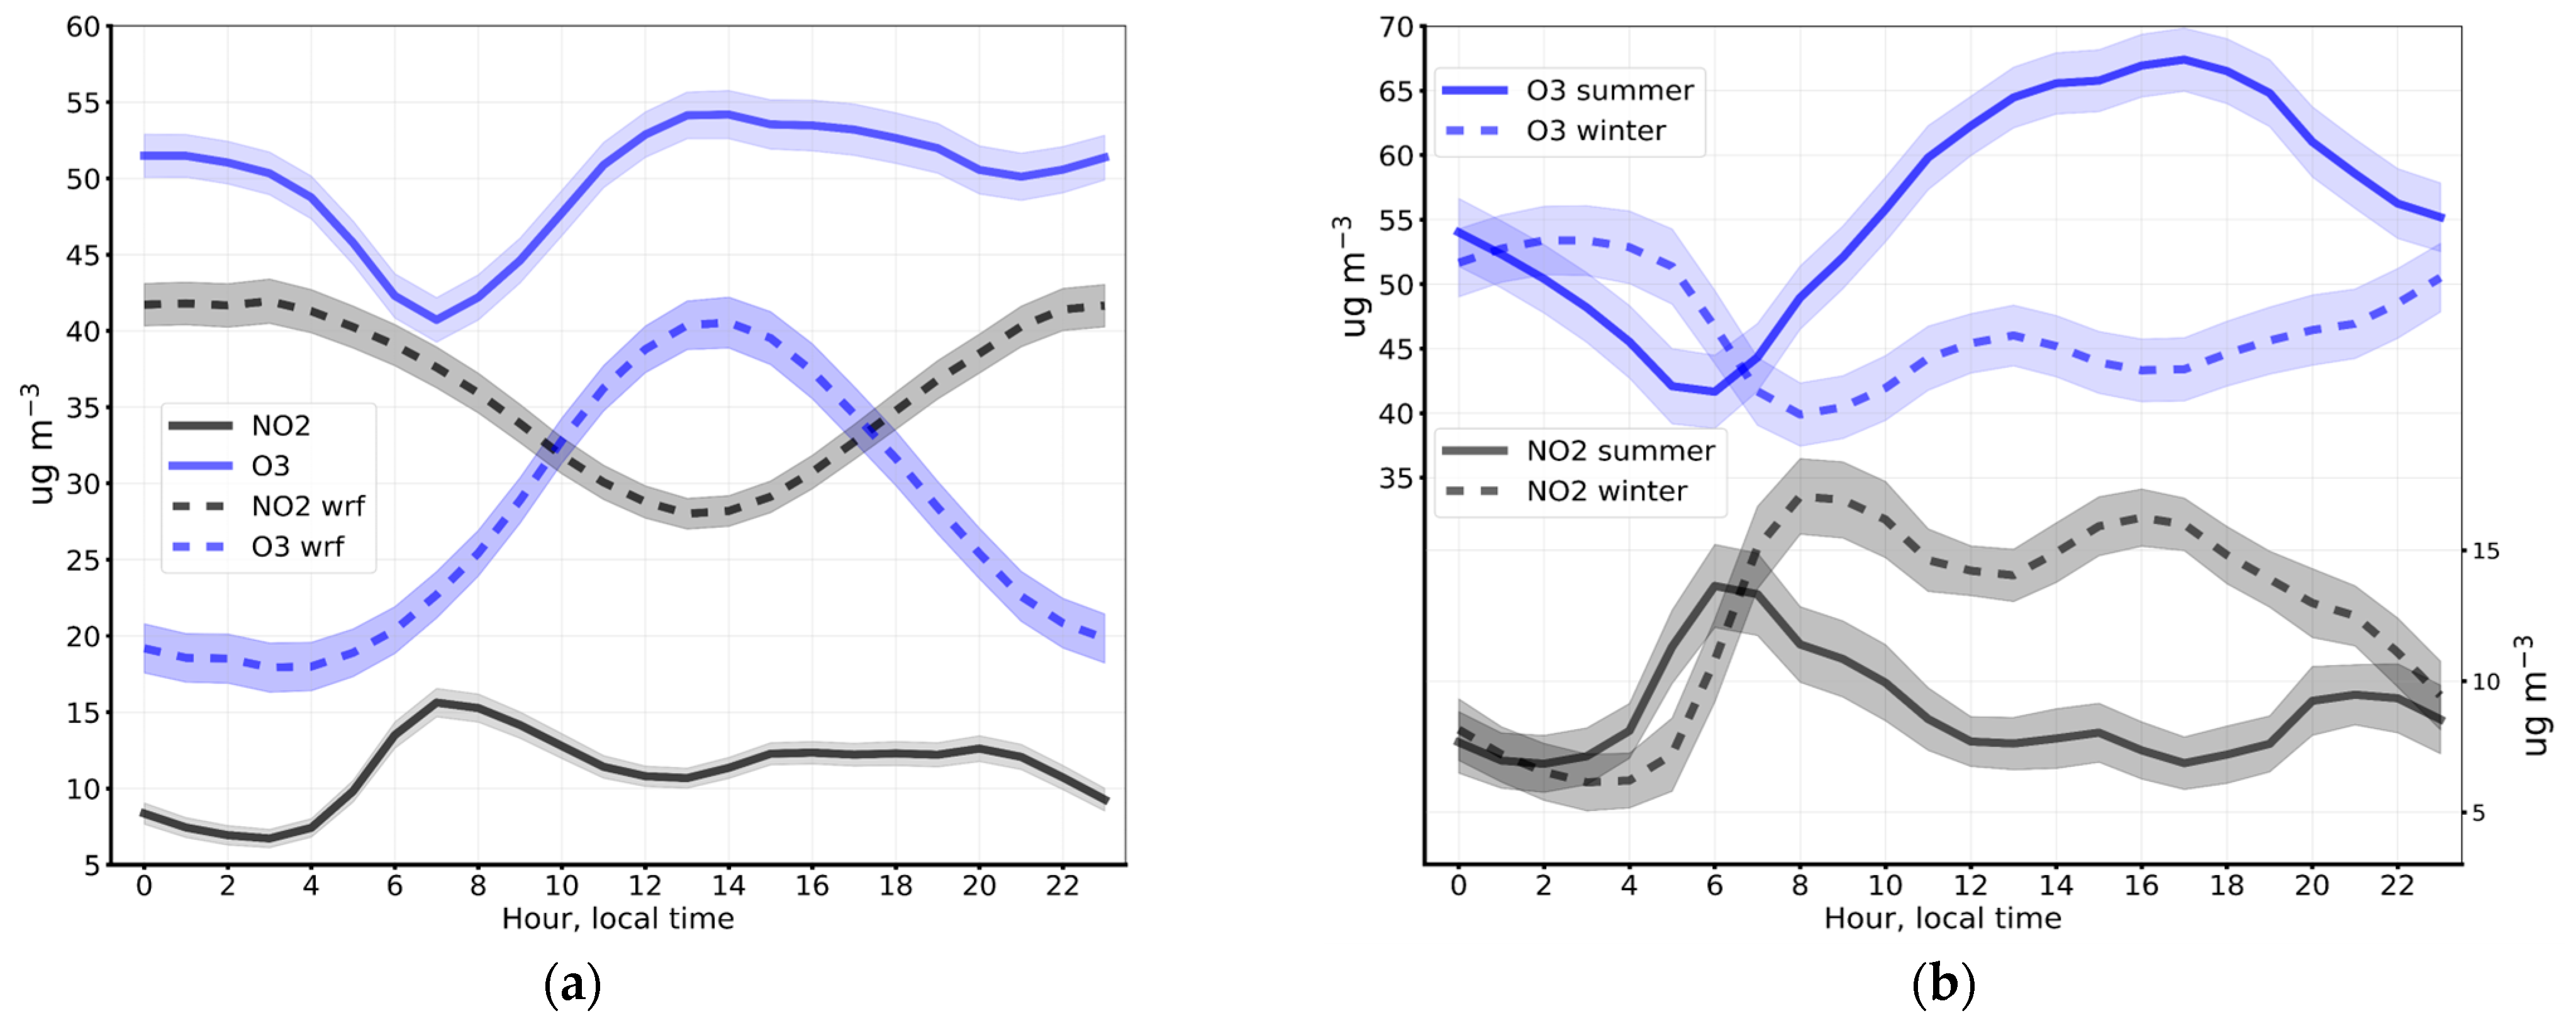
In addition to NSOCs, the near-surface concentrations of NO2, the major ozone precursor, were also measured at the SMEAR III station in Helsinki. Figure 8a depicts the mean diurnal variations in NSOCs and NO2 concentrations in Helsinki for 2016–2018, according to the observations and the WRF-Chem modeling. The period of comparison was shortened to 2018 since there were no temporary crossing data of NSOCs and NO2 that covered the entire 2019 period. The mean diurnal variations in NSOCs and NO2 significantly differ from the modeled data. The modeling overestimated the concentration of NO2 and underestimated the NSOCs (as was already demonstrated). The model did not reproduce the morning peak of NO2 (7 h of local time). The study [64] demonstrated that the diurnal and weekly variations in NOx emissions significantly influenced the agreement between the observed and modeled concentrations in the near-surface layer. In the present study, only monthly variations in the anthropogenic emissions of NOx and other species were considered, which could partially explain the differences between the observations and modeled data.
The observations demonstrated a significant negative correlation between the mean diurnal NSOCs and the concentration of NO2, with a CC of −0.54. This negative correlation could be related to the occurrence of the VOC-limited regime under relatively high concentrations of NO2 during the day [56]. The analysis of mean diurnal variation in NSOCs and NO2 concentrations in Helsinki in winter and summer by observations partially proved this finding (Figure 8b). During winter, when NOx emissions are expected to increase, the CC between the diurnal cycles of both gases is −0.97. The CC during summer is also high (−0.62). In general, the diurnal cycles of both gases varied oppositely except for a few periods when the correlation became positive (for example, 0–2 h and after 22 h). In addition, during summer, the increase in NSOCs after 6 h at the SMEAR III station in Helsinki was more pronounced than that in winter (a rise of more than 20 µg m−3 vs 5 µg m−3). This may be related to increased solar radiation and emissions of hydrocarbons (e.g., VOCs) in summer, which cause an increase in TrOCs [56].
An increase in the near-surface NO2 concentrations in the morning in Helsinki could be related to increased NO2 emissions from morning human activity (rush hour) [65]. The subsequent decrease in NO2 can be attributed to the decrease in NO2 anthropogenic emissions from motor vehicles, the increased photolysis of NO2 molecules due to an increase in incoming shortwave solar radiation and the intensified vertical mixing of air in the planetary boundary layer. The registered mean diurnal variations in the near-surface NO2 concentrations agree with the findings from [57].

3.1.4. Tropospheric Ozone Content in St. Petersburg

0–8 km Layer

Table 6 and Table 7 show the main differences between the TrOC observations and modeling results for the original and smoothed modeled TrOC. The TrOC values were calculated as an integral in the 0–8 km layer (more details are provided in the “Data and Methods” section). The MDs and SDDs between the hourly observed and modeled TrOC constitute −2.5 DU (−8.4%) and 3.3 DU (11.0%), respectively. By filtering the differences using the “three-sigma rule”, the MDs and SDDs decrease by 0.4% and 0.6%, respectively. The CCs between the data before and after filtering were 0.64 and 0.67, respectively.
After smoothing, the MD increased from 8.4 to 9.6%, while the SDD decreased from 11 to 10.5%. After the “3-sigma” filtration, the MD and SDD between the measurements and smoothed modeled data decreased to 9.4% and 9.9%, respectively. The CC was 0.64 and increased after filtering to 0.68. Note that filtering by the “Three-sigma rule” reduced the dataset volume by only ~1%.
The MDs for the original and smoothed daily averaged modeled data were −2.7 DU (−9.3%) and −3.1 DU (−10.4%), respectively. The SDDs slightly decreased after averaging (by 0.3–0.5%), whereas the CCs increased insignificantly (by 0.02–0.03). The similar differences between the hourly and daily average TrOC values obtained via the observations and model in St. Petersburg may be related to the non-pronounced diurnal cycle of the TrOC values.
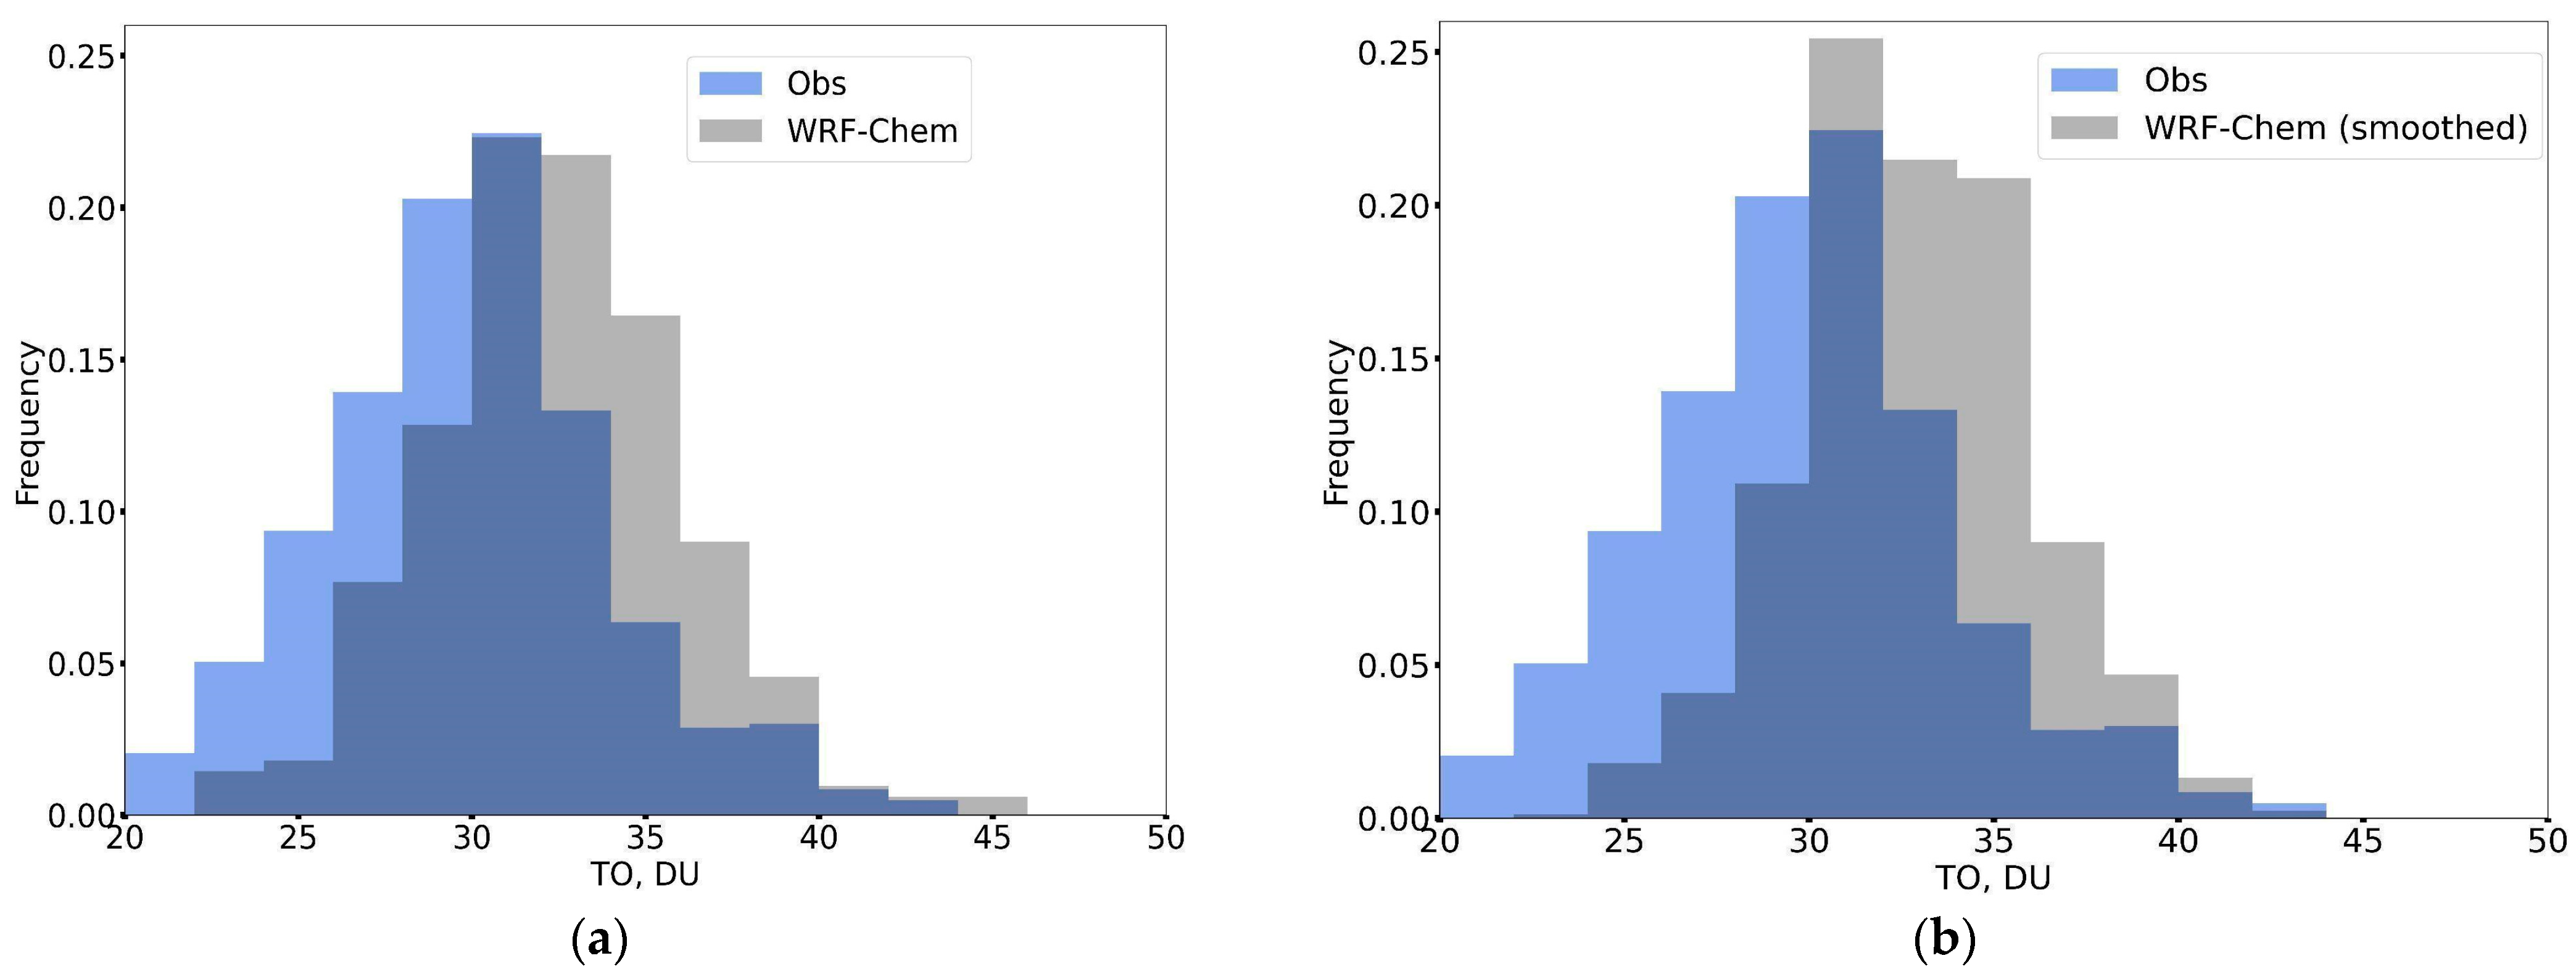
Figure 9 presents histograms of the TrOC distributions obtained via ground-based remote observations and WRF-Chem modeling. In general, the model overestimates the TrOC derived by the FTIR method. Smoothing of the modeled TrOC values by the FTIR averaging kernels slightly improved the agreement between the observed and modeled TrOC distributions in the right “tail” but worsened it in the left and in the center (Figure 9b).
The WRF-Chem model represents the main variability in the TrOC in St. Petersburg for the whole period considered. In particular, the model reproduces such TrOC features as spring maxima with the following decrease (see Figure A4 in Appendix C). A better agreement between the observed and modeled data was found for spring and summer, while a worse agreement was found for autumn and winter. In general, the model overestimates the TrOC in the 0–8 km layer relative to the observations. The differences between the observations and modeled data are seasonally dependent, with maximum values occurring during the autumn and winter months.
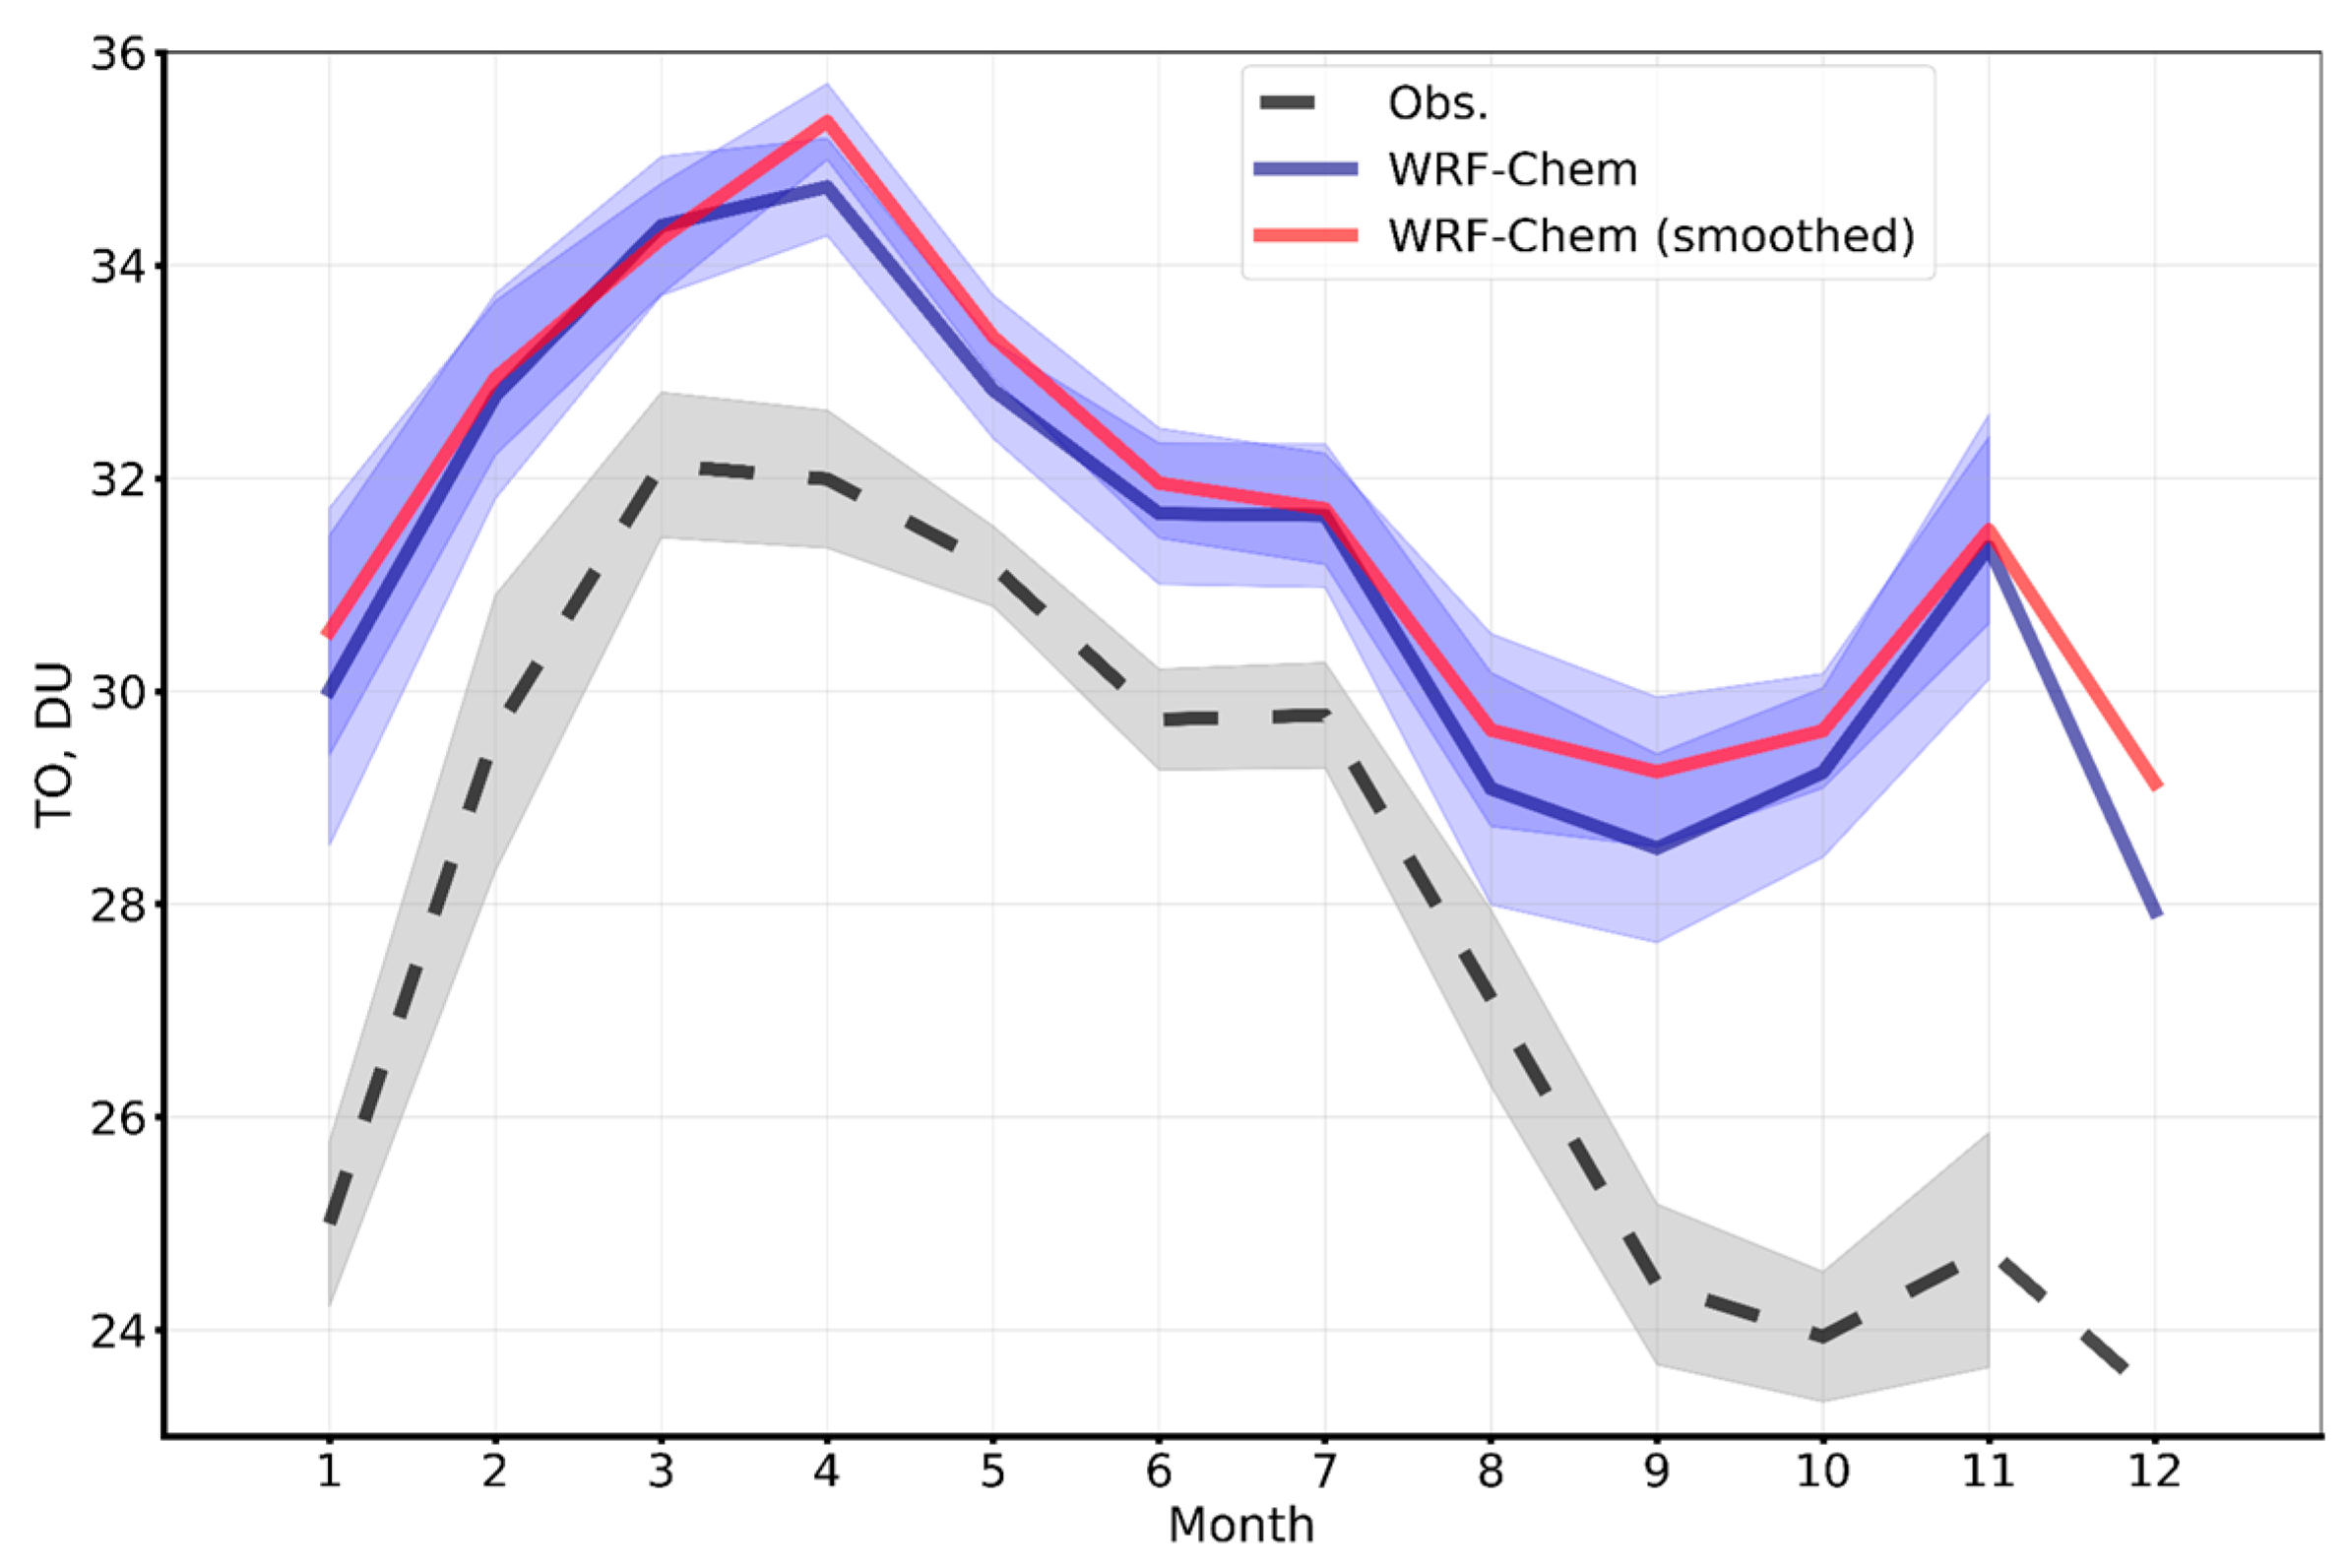
The TrOC in the 0–8 km layer shows pronounced seasonal variations, which can be seen by both the observations and the WRF-Chem model (Figure 10). An increase in the TrOC values appears in March–April, followed by a decrease to September–October with a slight plateau in the summer months. Both model datasets look very similar, with the largest differences occurring in April and August–September. Both model datasets overestimate the TrOCs with respect to the FTIR data, with maximal differences occurring from September–January (4–6.6 DU).
The overestimation of TrOC by the model during September–January could be related to inaccuracies in the inputs of chemical boundary conditions (horizontal and vertical), precursor emissions, and vertical transport in the troposphere. A study [66] demonstrated, by using the WRF-Chem model, that more than 70% of ozone variations in the 4–8 km altitude layer was determined by ozone transport from the stratosphere and horizontal advection. The lower difference between the modeled and observed data during February–August can be related to the greater sensitivity of the ozone content in the lower atmosphere to the vegetation emissions of volatile organic compounds (VOCs) during this period than to the transport of the gas from remote areas (e.g., boundary conditions).

Total Tropospheric Layer

In the next step, the agreement between the TrOC simulated by the WRF-Chem model and observations in a more vertically extended tropospheric layer was considered. The top boundary for TrOC integration was set at the tropopause height, which was retrieved from IASI satellite observations (https://iasi.aeris-data.fr/catalog/ (accessed on 1 January 2024)). The tropopause height values are available as an independent variable and are estimated from measured air temperature vertical profiles and a methodology proposed by the World Meteorological Organization (WMO). On average, the tropopause height was approximately 10 km in St. Petersburg for the 2016–2019 period.
Table 8 and Table 9 present the main characteristics of the differences between the hourly and daily averaged TrOC obtained by the FTIR method and the WRF-Chem model retrieved for the extended atmospheric layer for the original and smoothed modeled profiles, respectively. First, increasing the layer thickness caused an increase in the MD from 8–10 to 10–13%. These differences are likely related to modeling errors in the upper tropospheric ozone concentrations. As before, the smoothed modeled data had the maximal MDs (higher by 0.5–0.7%). Second, the SDDs between the observations and original modeled data increased from 10–11% to 12–13% and did not change significantly for the smoothed modeled data. Three-sigma filtering slightly reduced the SDD (by 0.1%). However, the increase in the integration layer thickness to the height of the tropopause led to an increase in the CCs from 0.64–0.68 to 0.72–0.76.
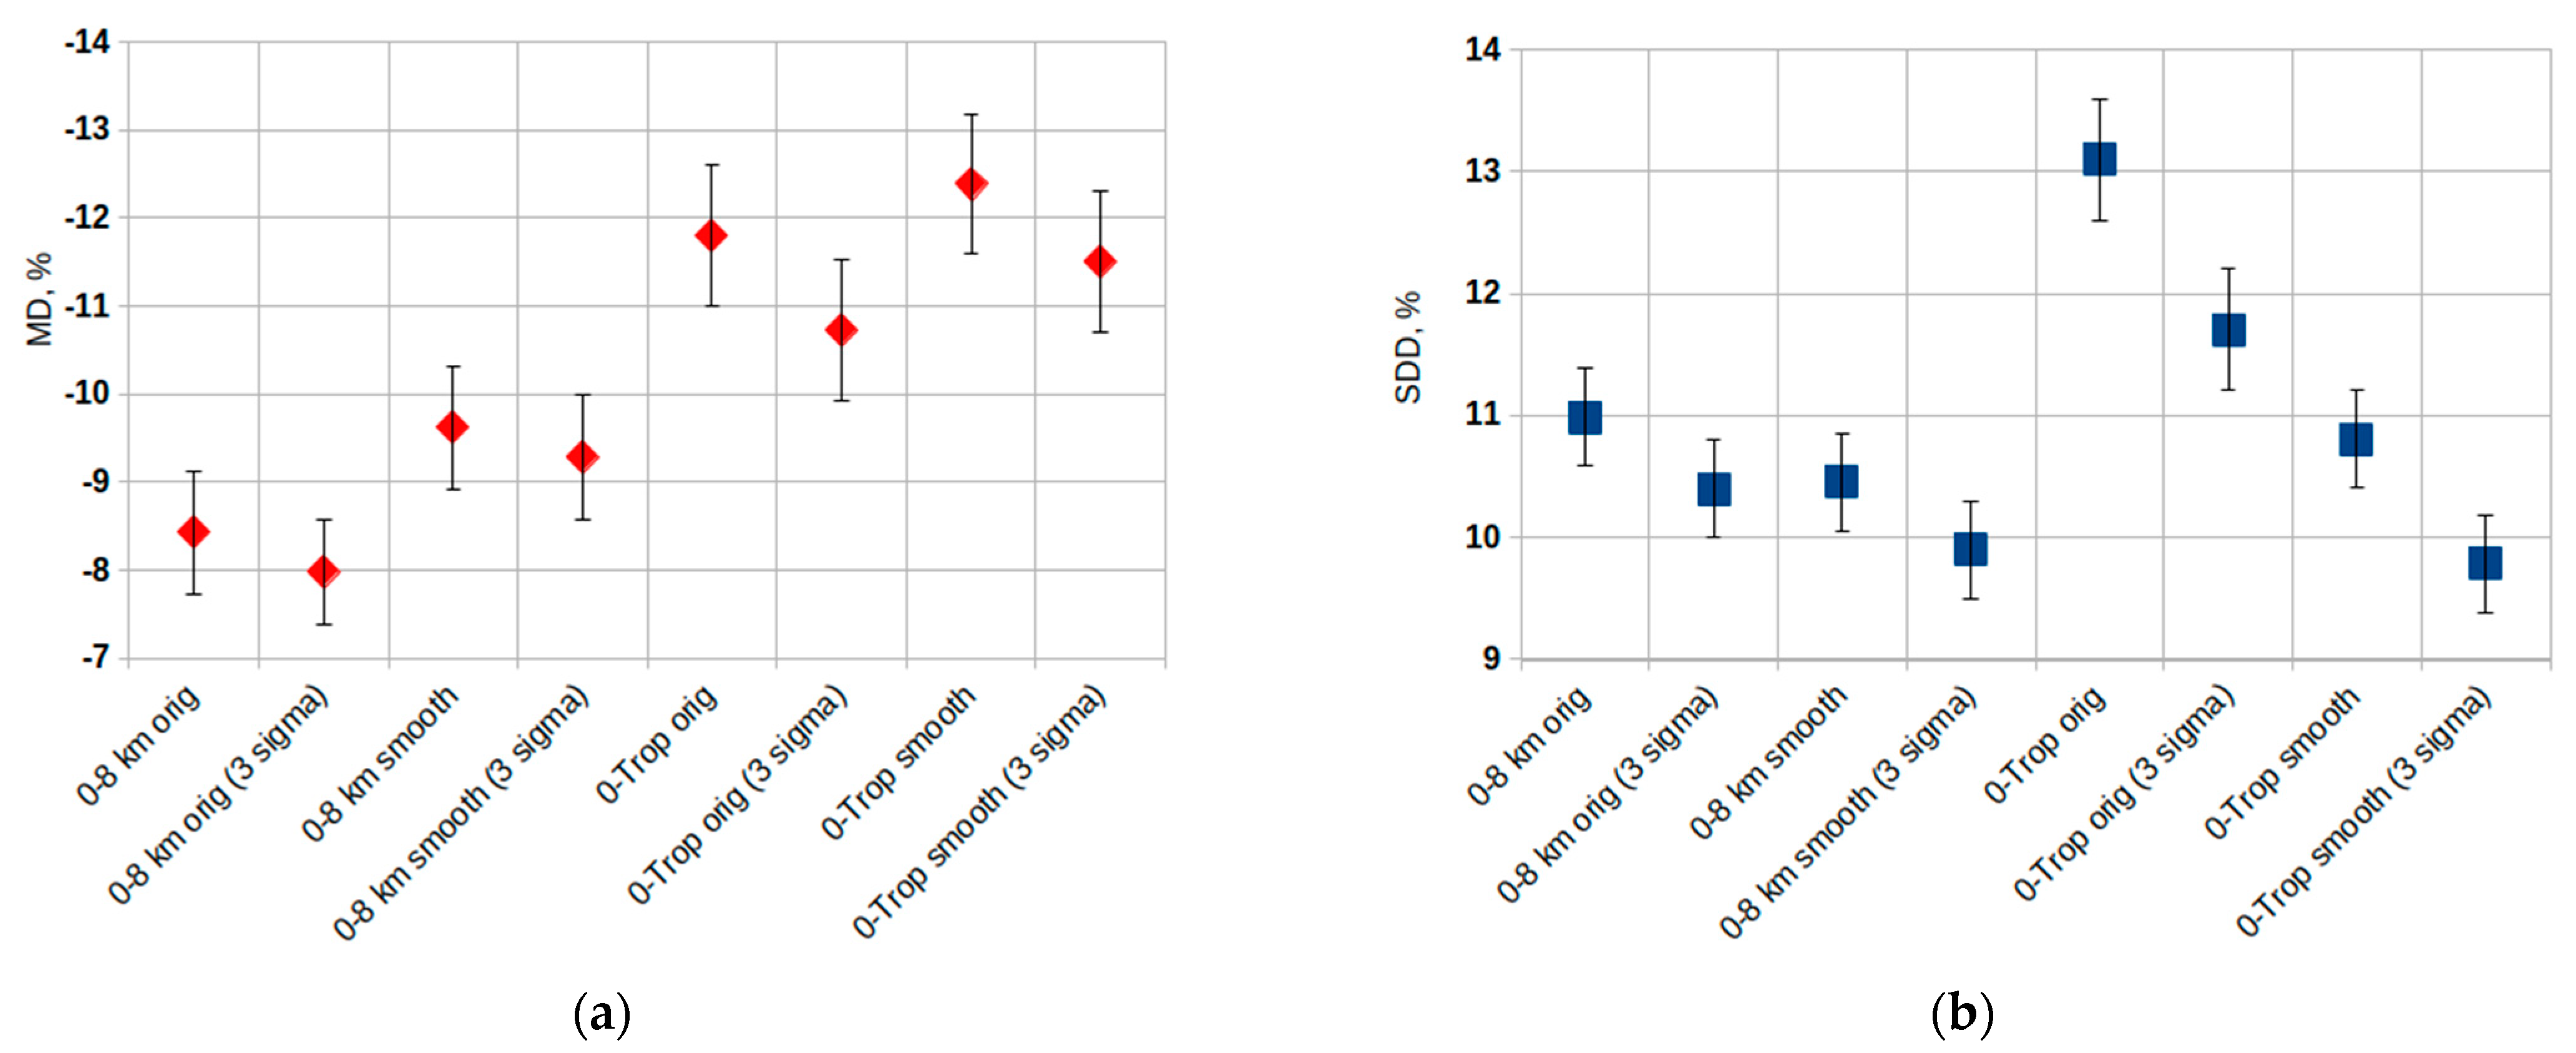
Figure 11 shows the MDs and SDDs between all the mentioned TrOC datasets, according to the ground-based observations and WRF-Chem modeling in Peterhof for 2016–2019. In general, the best fit between the measured and simulated TrOC was observed in the case of the integration in the 0–8 km layer, without smoothing the modeled data and after filtering by the “Three-sigma rule”. The worst agreement was found in the case of integration in the total tropospheric layer without smoothing and filtering. Even though smoothing increased the MDs (by ~1%), it decreased the SDDs (by ~1–2%).

3.2. Analysis of WRF-Chem Modeling near the Gulf of Finland

3.2.1. Zonal Distribution of Ozone and Its Precursors

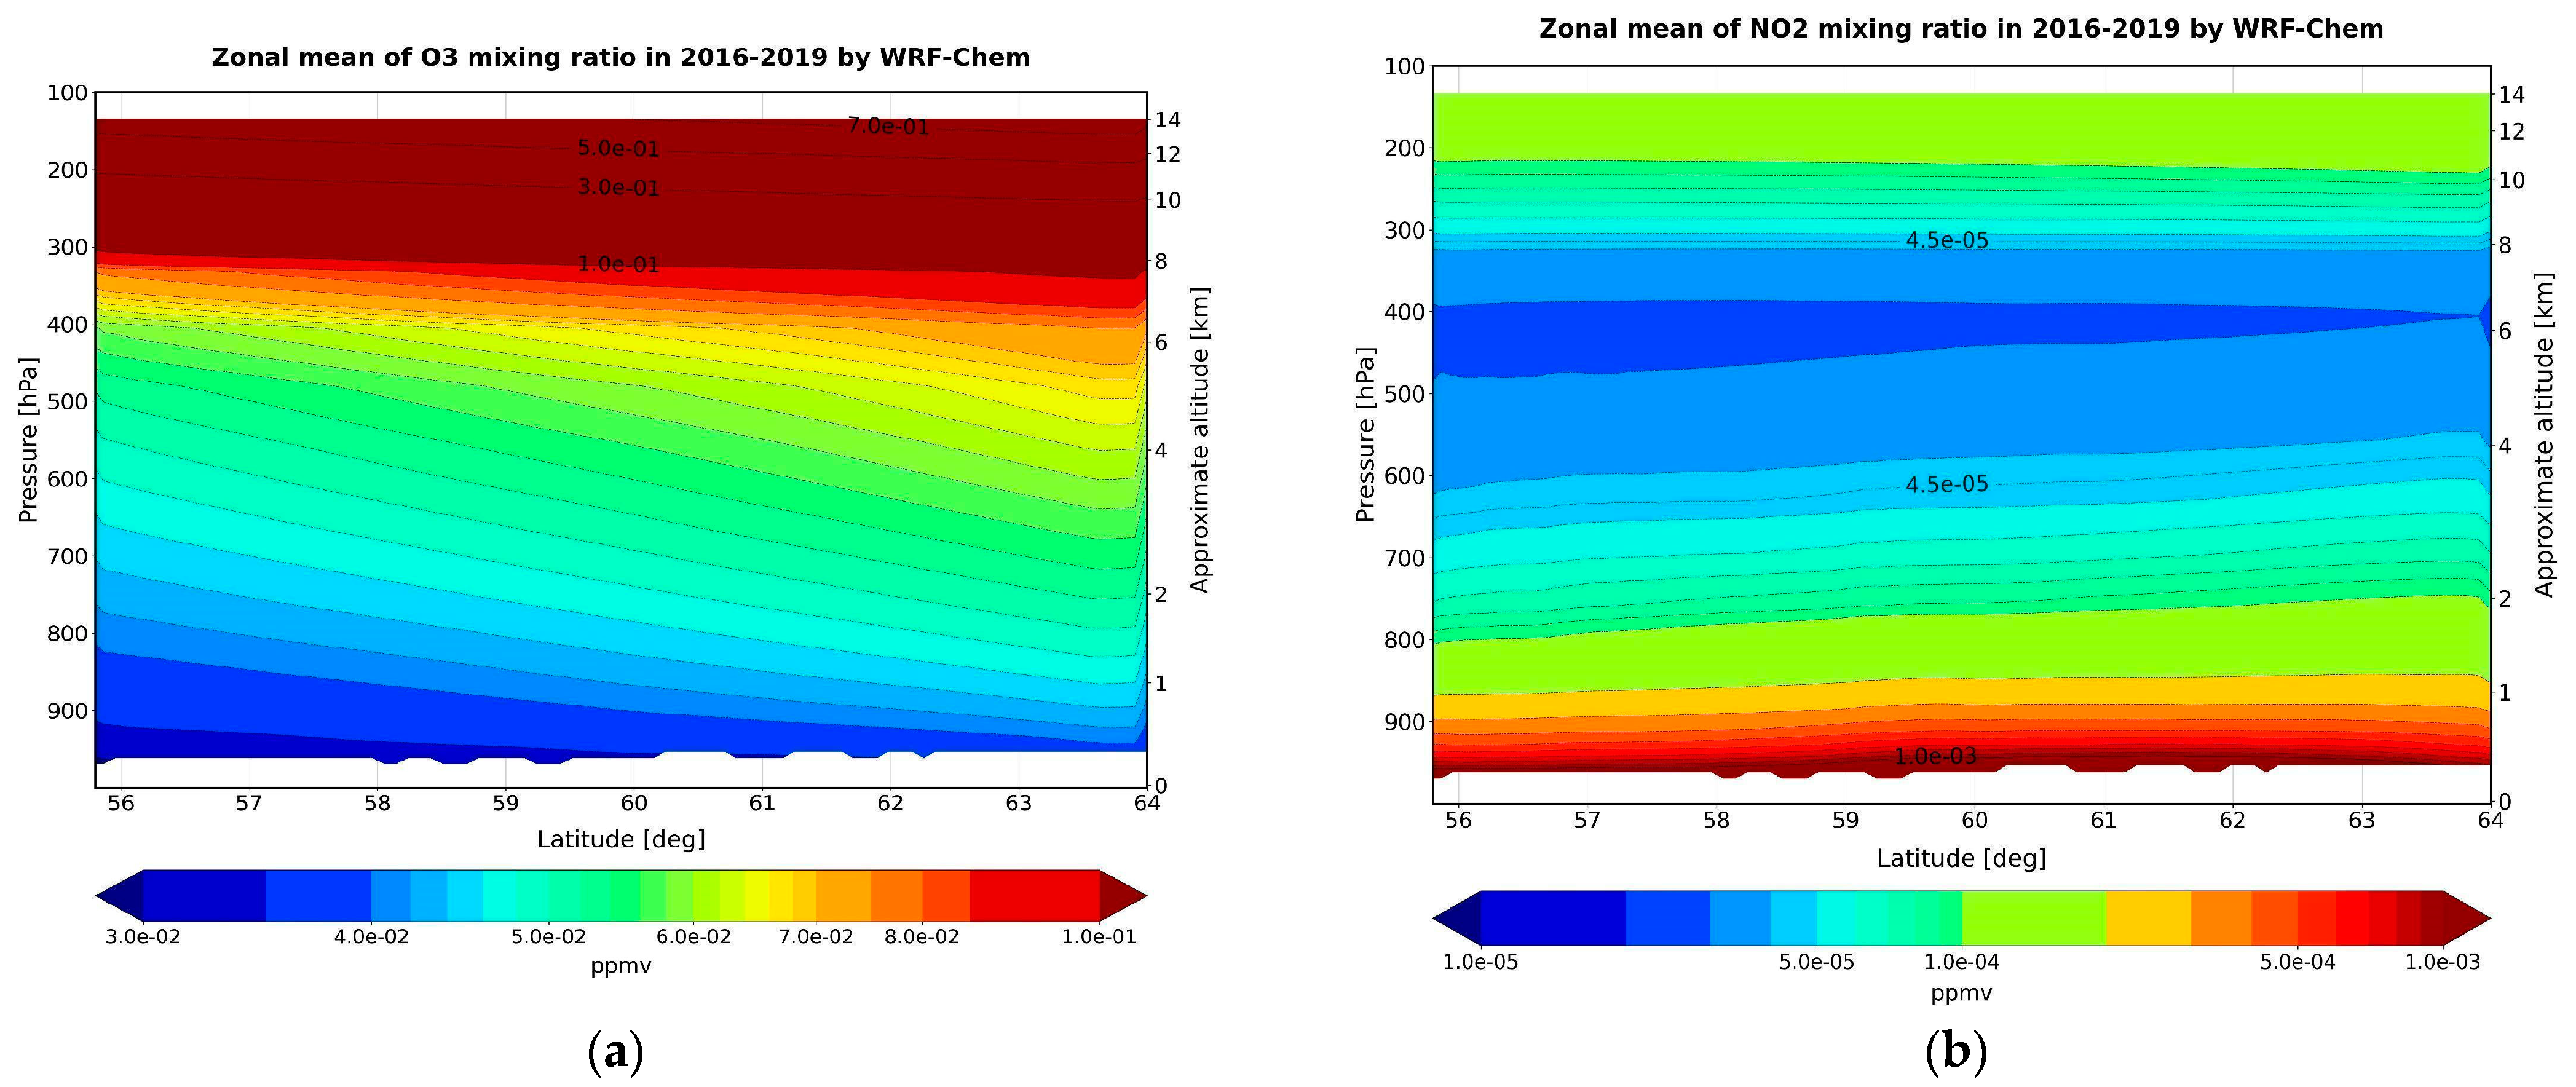
Figure 12 shows the mean zonal and vertical distributions of the ozone (a) and NO2 mixing ratios for the 2016–2019 period according to WRF-Chem modeling. These average data represent the whole modeling domain (Figure 2). To plot this and the following similar figures, the simulated data were linearly interpolated to the air pressure vertical coordinates.
The ozone mixing ratio increases from the surface, most significantly above 8 km (Figure 12a). The NO2 mixing ratio has pronounced stratification in the troposphere (Figure 12b), with the maximum in the layer from the surface to ~900 hPa (lower than 1 km), a decrease in the 600–400 hPa (~4–8 km) layer and an increase in the 200–100 hPa layer. In the study [67], a similar vertical distribution of NOx was obtained via aircraft measurements in the southeastern USA (25–40° N, 65–100° W). It is suggested that such a vertical distribution of NOx can be related to surface emissions (lower troposphere), the formation of NO molecules due to lightning, aircraft emissions and transport from the stratosphere (upper troposphere). In the present study, aircraft emissions of NOx were not used in the WRF-Chem model; therefore, the modeled increase in the mixing ratio of NO2 above ~8 km was likely caused by transport from the stratosphere and lightning activity. In turn, the decreased mixing ratio of NO2 in the 4–8 km layer could be related to the relatively short lifetime of the molecules (tens of days) in the lower troposphere due to their high chemical reactivity.
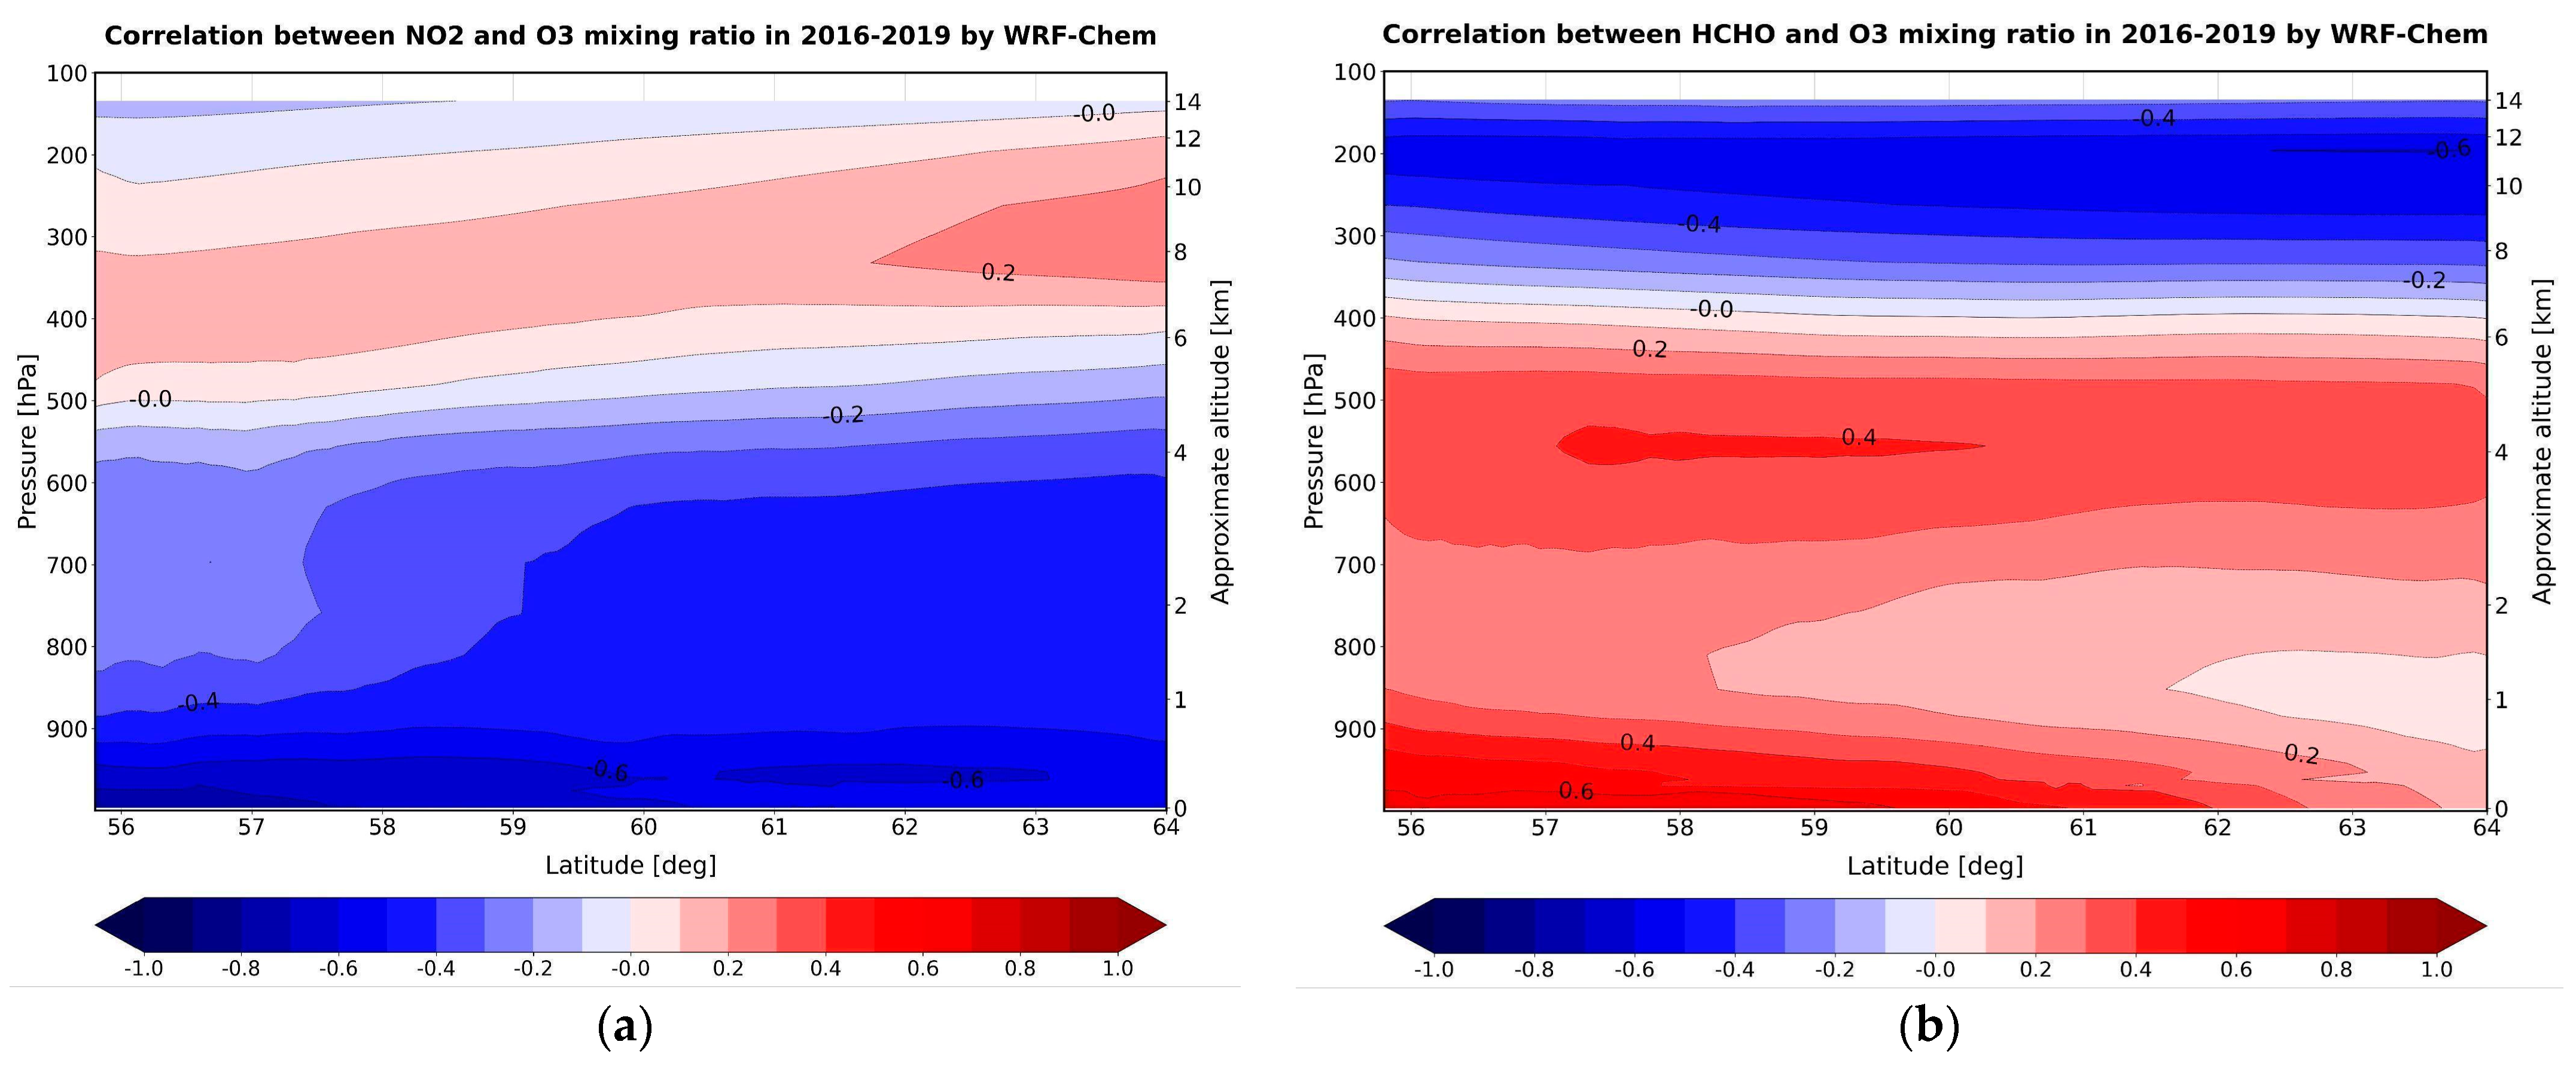
Figure 13 presents the zonal and vertical distributions of the CCs between O3 and NO2 (left) and between O3 and HCHO (right) for the 2016–2019 period. The choice of NO2 and HCHO is determined by their relation to ozone molecule formation and dissociation in the troposphere. The main sources of tropospheric ozone are reactions with NO2 and hydrocarbons [56]. In general, if NO2 molecules are emitted to the atmosphere by anthropogenic activity, the main sources of atmospheric HCHO are natural processes in vegetation and soil. HCHO molecules often form as products of HO2 from hydrocarbons, which is important for tropospheric ozone formation. The analysis of NO2 and HCHO mixing ratios in the troposphere can aid in understanding the main factors causing zonal changes in the ozone mixing ratio in the regions considered.
Model data demonstrate strong negative correlations (CC = 0.4–0.6) between O3 and NO2 in the layer from the surface up to 600 hPa (~4 km) (Figure 13a). Above ~4 km (6–12 km), the correlations became positive, but the CC was not significant (0.2). Most likely, the negative correlations below 4 km are determined by the occurrence of a VOC-limited regime [56]. In such a regime, NO2 molecules more frequently react with OH via Reaction (1), which is one of the main sinks of OH and NO2 in the troposphere due to the subsequent deposition of HNO3 with precipitation. Due to the decrease in the number of OH molecules, the number of HO2 molecules also decreases. Correspondingly, the rate of tropospheric ozone formation via Reactions (2) slows. A gradual decrease in the NO2 mixing ratio with height in the troposphere probably causes the occurrence of an opposite NOx-limited regime. This regime is characterized by positive correlations between the O3 and NO2 mixing ratios. The occurrence of the NOx-limited regime could be the reason for the positive correlations between the O3 and NO2 mixing ratios in the 6–12 km layer. In this case, the influence of Reaction (1) on the mixing ratio of HO2 and NO2 can be neglected relative to that of Reaction (3). Most likely, with increasing height, the generation of OH and HO2 molecules from H2O2 (4) dominates the process of H2O2 wet deposition due to a decrease in the liquid water content with height. These conditions should increase the probability of O3 molecule formation according to (2b) and (2c).
NO2 + OH + M → HNO3 + M
NO2 + h𝒱 → NO + O
HO2 + NO → OH + NO2
O2 + O + M → O3 + M
HO2 + HO2 → H2O2 + O2
H2O2 + h𝒱 → 2OH
H2O2 + OH → HO2 + H2O
In contrast, the correlation between HCHO and O3 (Figure 13b) is positive up to ~6 km and changes to negative above this level. The maximal CC was found in layers up to ~1 km (0.6) and 10–12 km (up to −0.6). No correlations (CC = 0) were found in the 1–2 km layer in the northern part of the area considered. This can be explained by the occurrence of a NOx-limited (or VOC-saturated) regime in this area, which is related to the increased content of hydrocarbons in the troposphere relative to NOx [56]. The negative correlation between the O3 and HCHO mixing ratios above ~12 km can be related to the increase in the number of NO2 molecules in this layer (Figure 12b) which, however, does not correspond to either the VOC-limited or NOx-limited regime.

3.2.2. Zonal Distribution of FNR

In [68,69], it was proposed that a relation between the HCHO and NO2 mixing ratios (formaldehyde-to-NO2 ratio or FNR) in the troposphere can be used to investigate variations in NSOCs. Usually, in such studies, the relationships between the integral contents of gases are analyzed (in the total atmosphere or troposphere). In the present study, the FNR parameter was calculated from the simulated data as a ratio of the vertical profiles of the HCHO and NO2 mixing ratios.
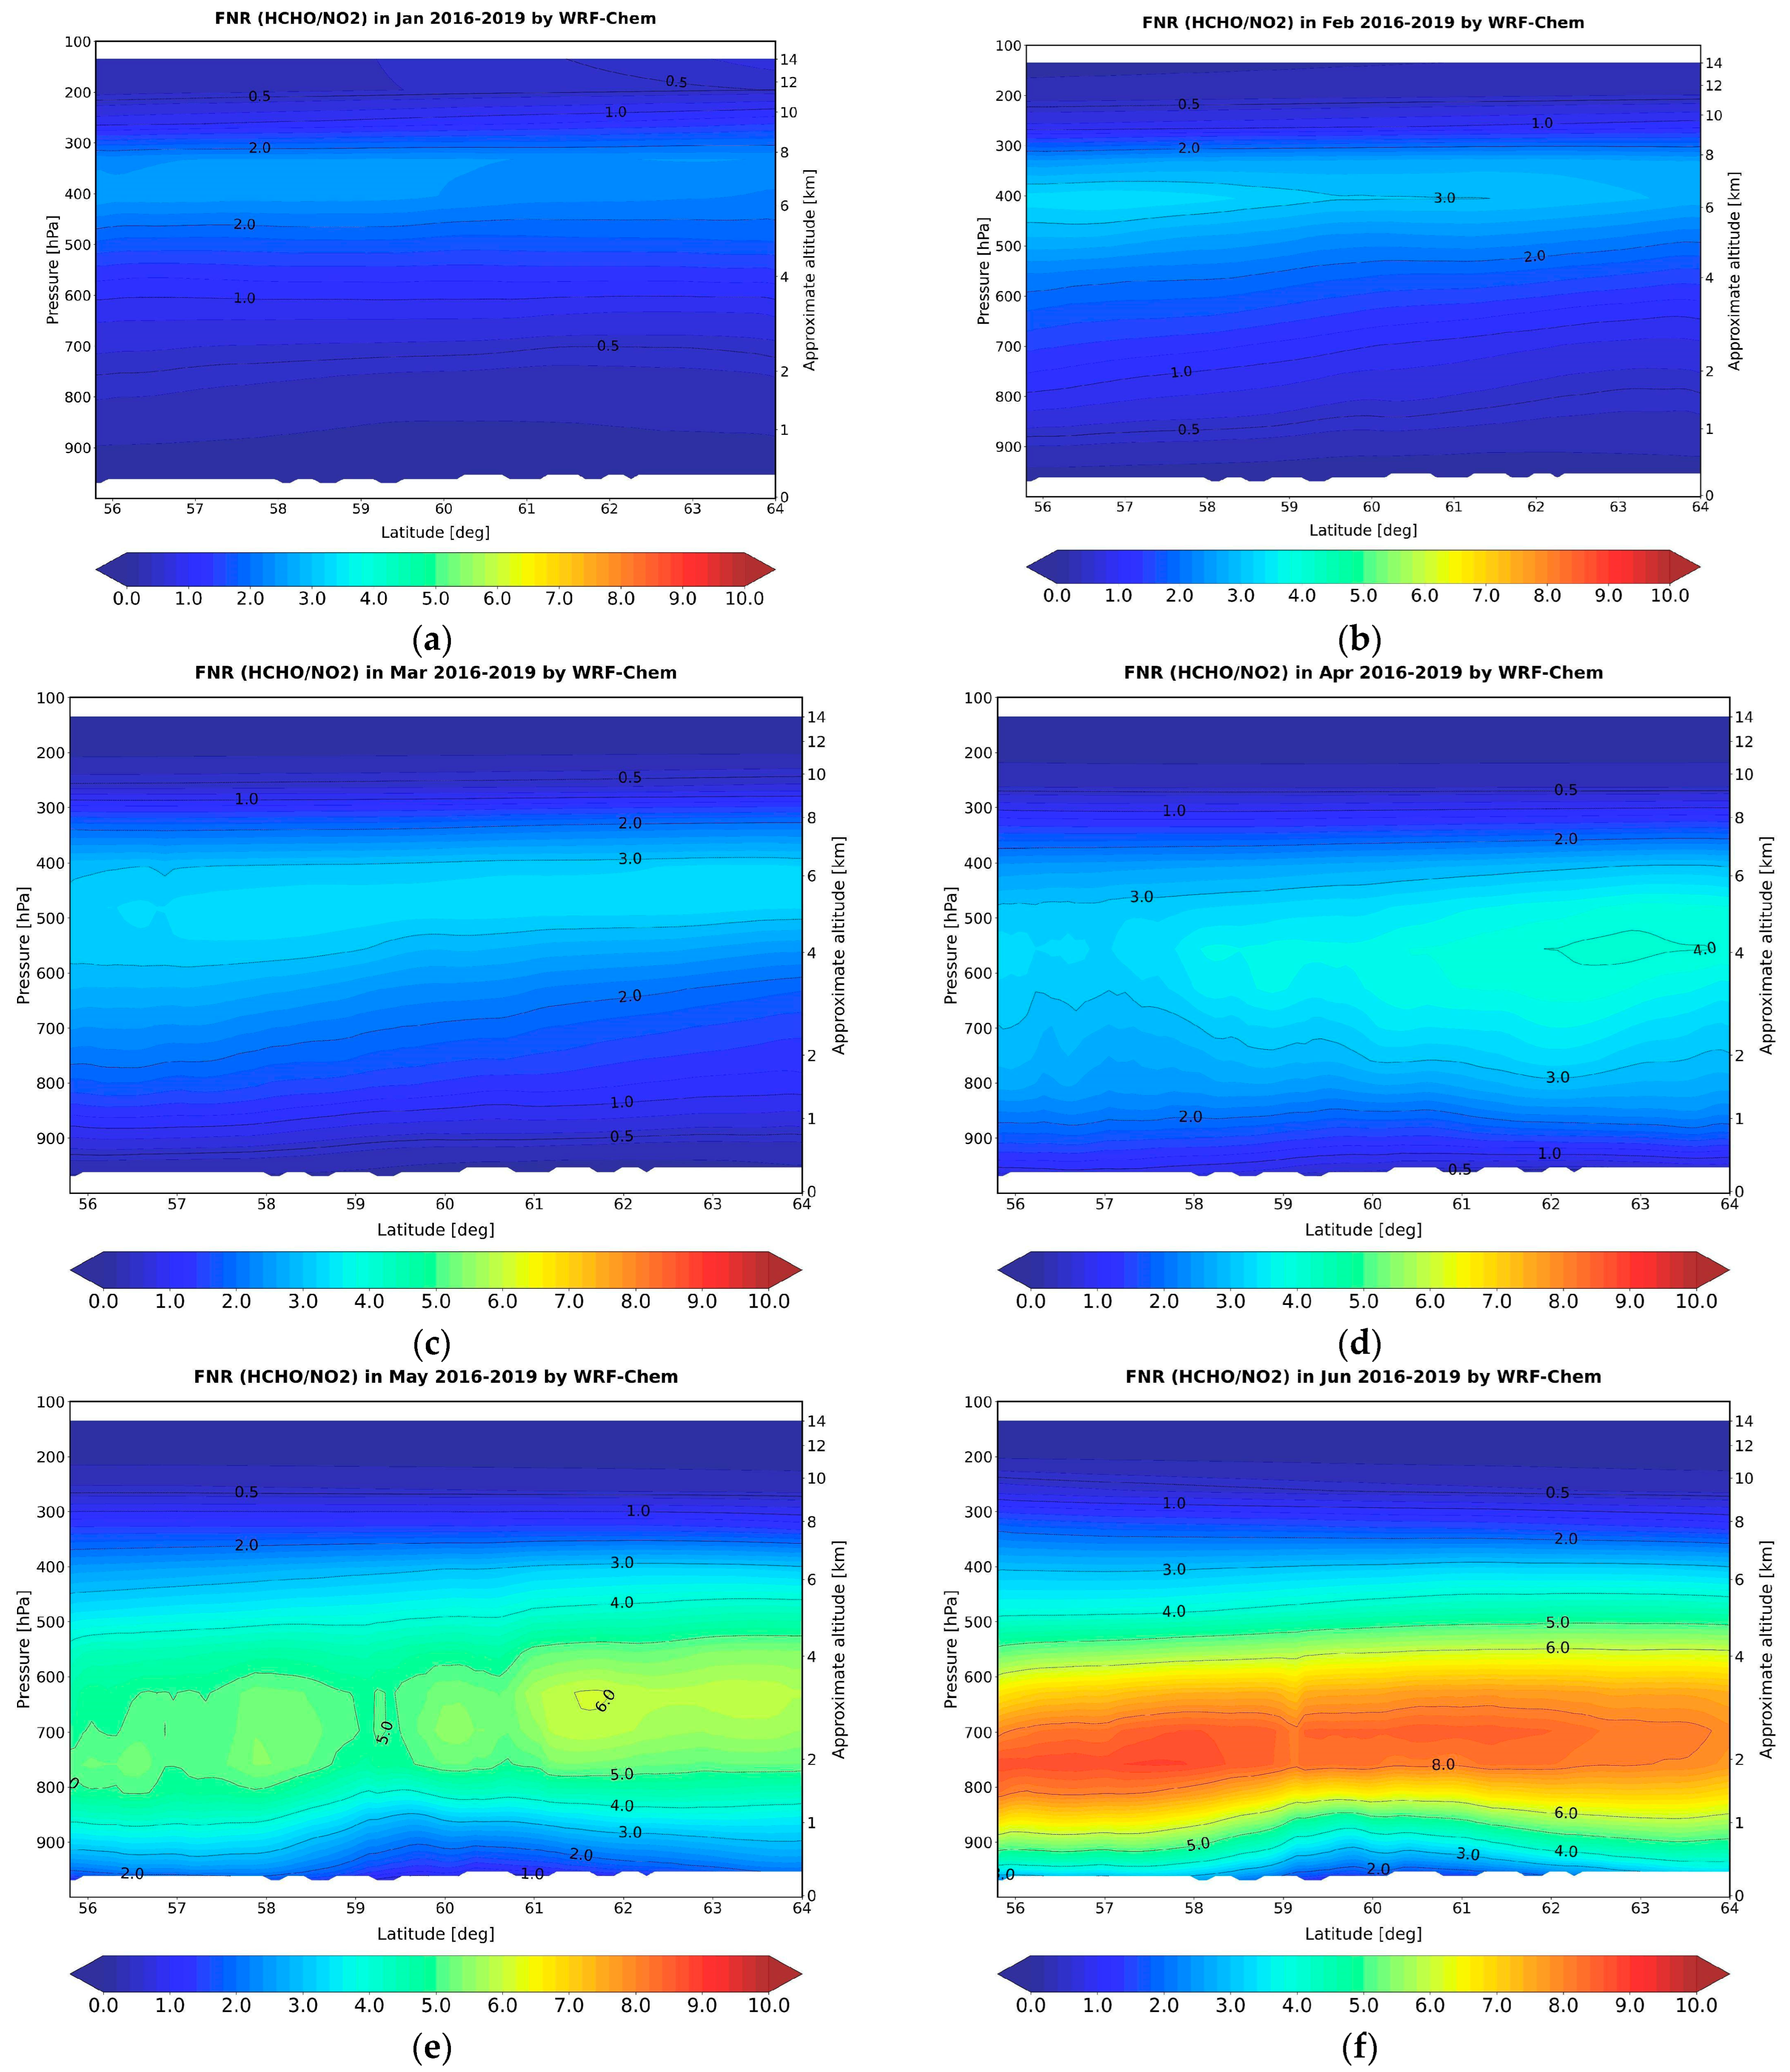
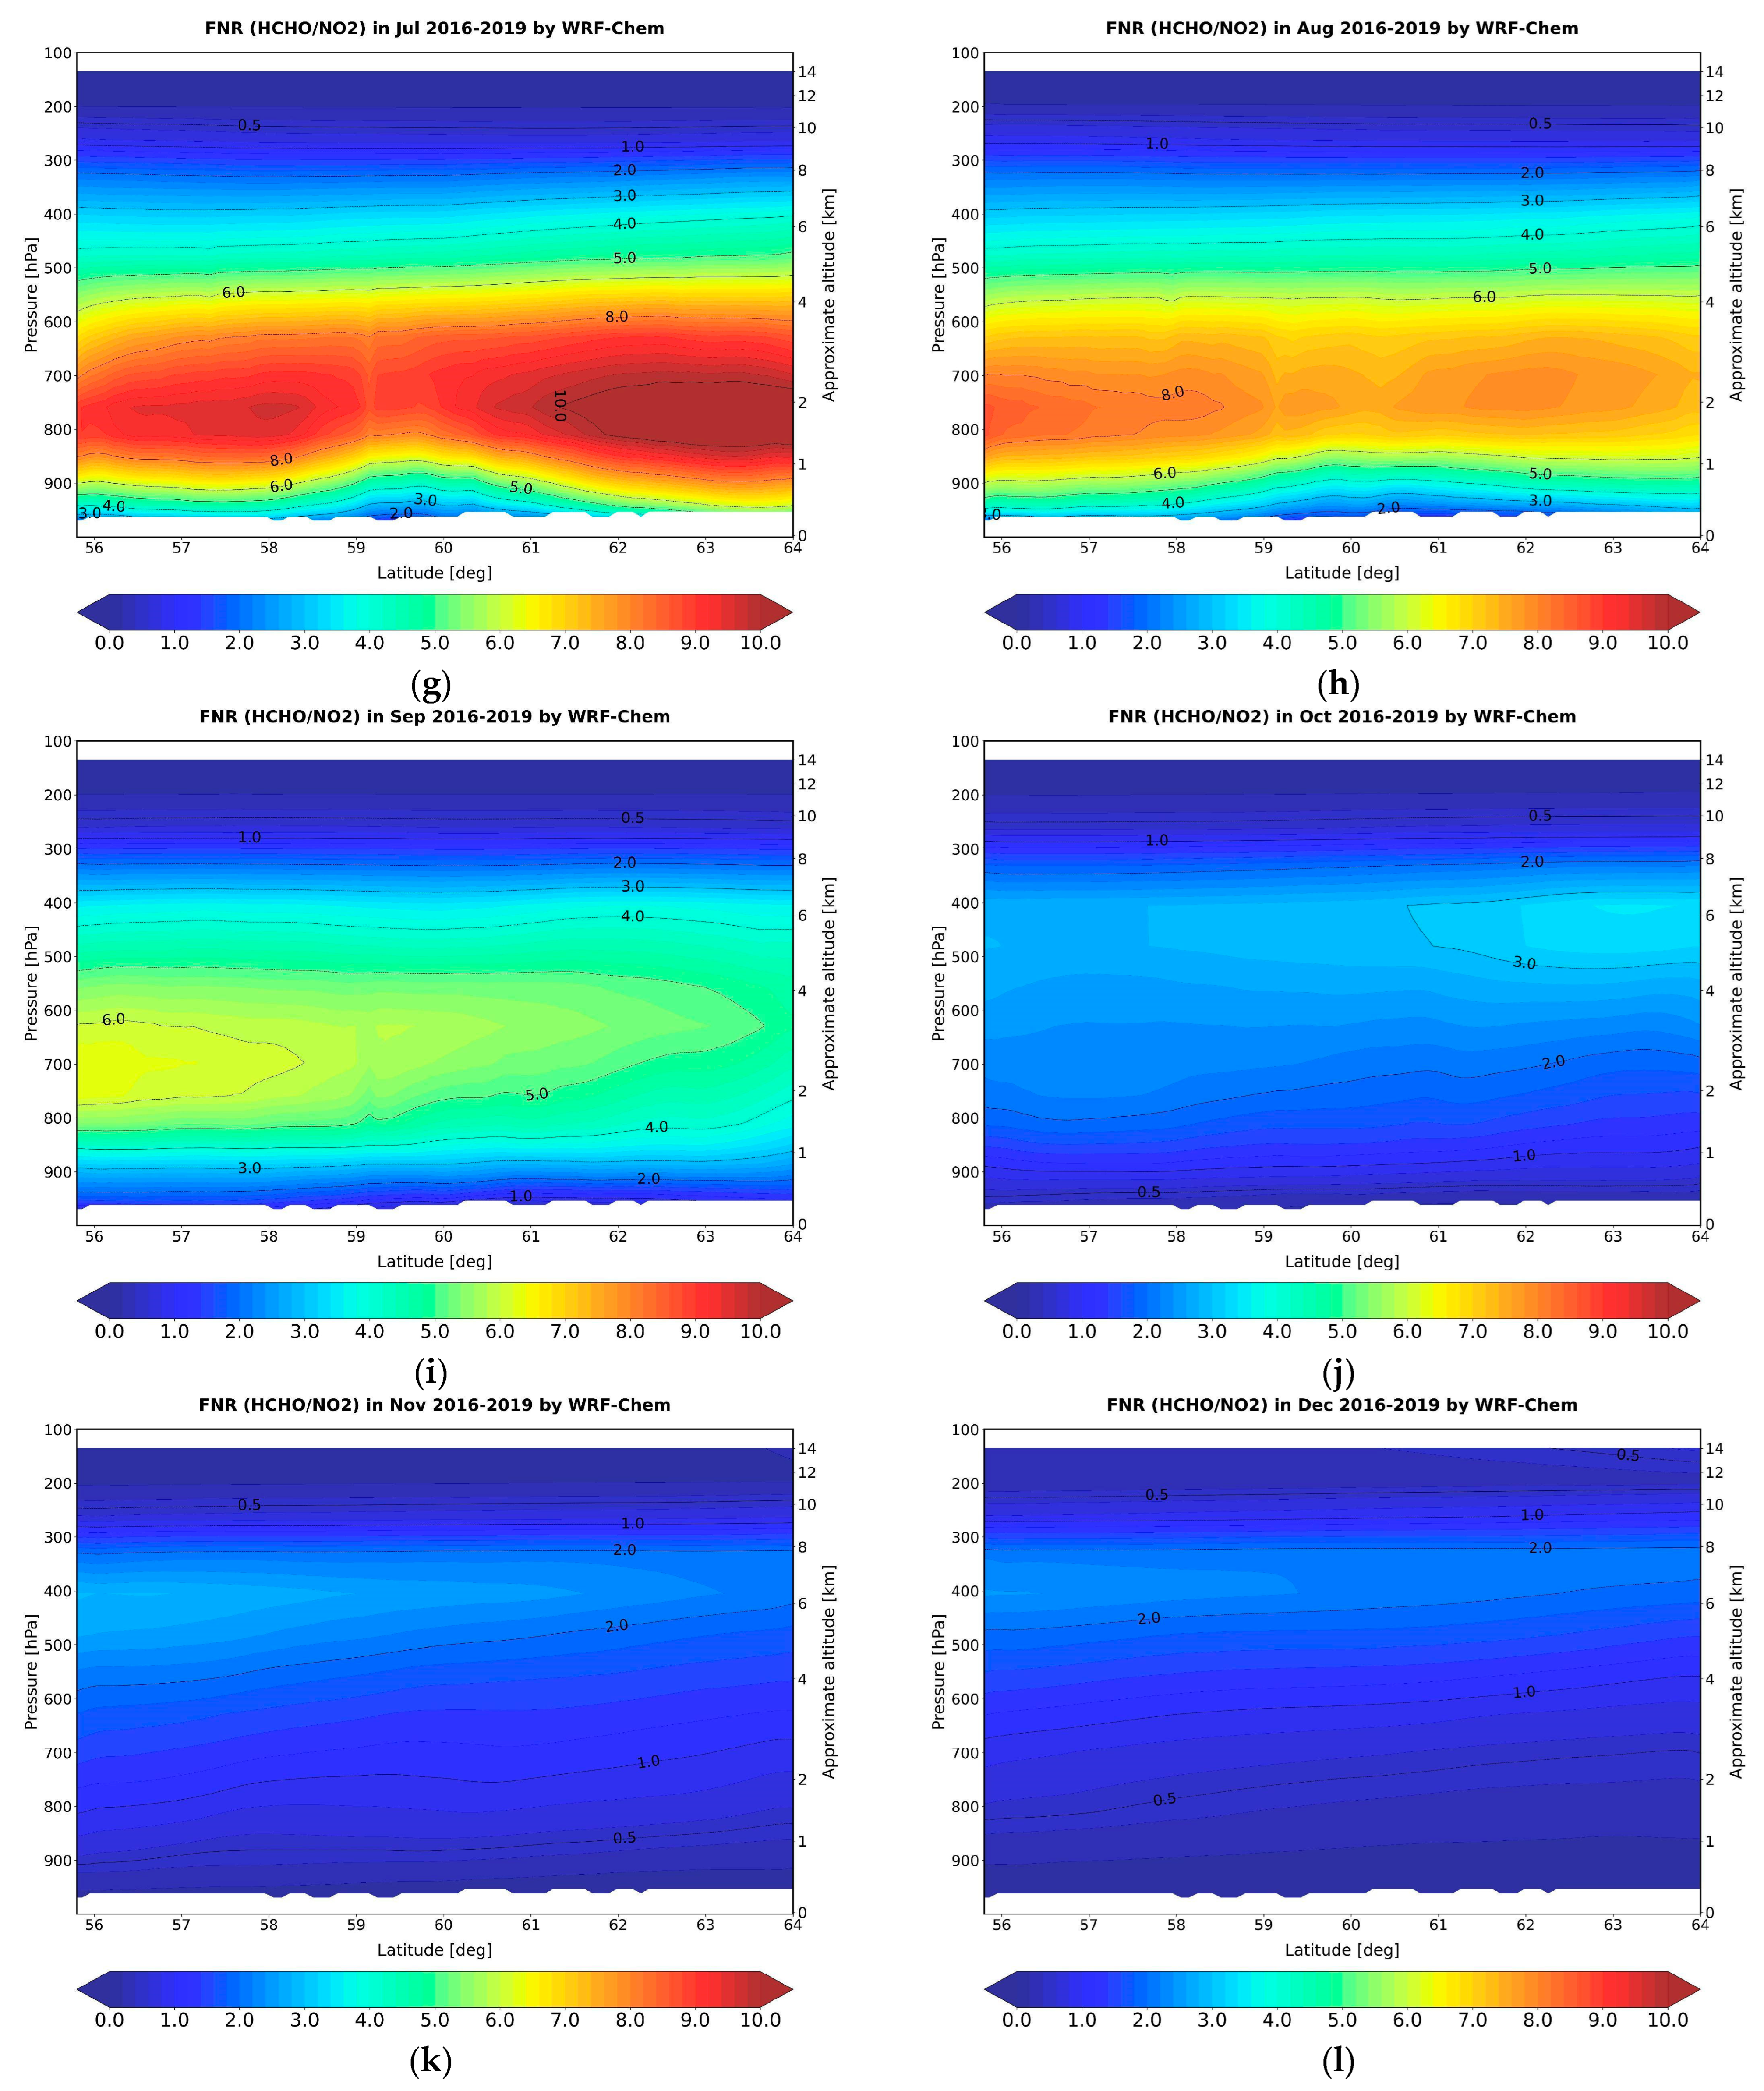
Figure 14 depicts the mean zonal distribution of the FNR values by month for the 2016–2019 period. In [68], FNR < 1 corresponds to the VOC-limited (or NOx-saturated) regime, while FNR > 1 characterizes the VOC-saturated (or NOx-limited) regime. However, in some studies, the FNR values were interpreted in a different way. For example, in [70], the VOC-limited regime was characterized by FNR < 1.5, and the VOC-saturated regime was characterized by FNR > 2.3. FNR values between 1.5 and 2.5 characterized the transitional state between the two regimes.
The FNR values have a significant seasonal dependence in the layer up to ~6 km. The FNR increases to July in the whole layer (Figure 14g) with the following decrease to a maximum at ~2 km. Most likely, such a spatiotemporal distribution of FNR is related to variations in the HCHO content in the troposphere. According to [71], the maximal HCHO concentration was registered in summer and was related to more effective photolysis and an increase in the natural emission of VOCs (e.g., isoprene). An analysis of the zonal distribution of the HCHO and NO2 mixing ratios in July and January (not provided) by the WRF-Chem model demonstrated that the increased FNR at ~2 km in July was caused by a significant decrease in NO2 (by ~10 times) at this height relative to that in the near-surface layer and by the increase in the HCHO content in summer.
The NOx-limited regime dominates in the 1–6 km layer from April to September (FNR > 2 reaching 10). Above this layer, the VOC-limited regime is predominant during all months. In July (Figure 14g), the center of the modeling domain is located in a “canyon”, where the VOC-limited regime occurs below 1 km and the NOx-limited regime occurs on the borders of this area above 1 km. It is likely that the VOC-limited regime occurring in the center of the modeling domain below 1 km is related to the anthropogenic emissions of NOx from the territory of St. Petersburg, the largest city in the area considered.

3.2.3. Vertical Correlations between Ozone and Its Precursors

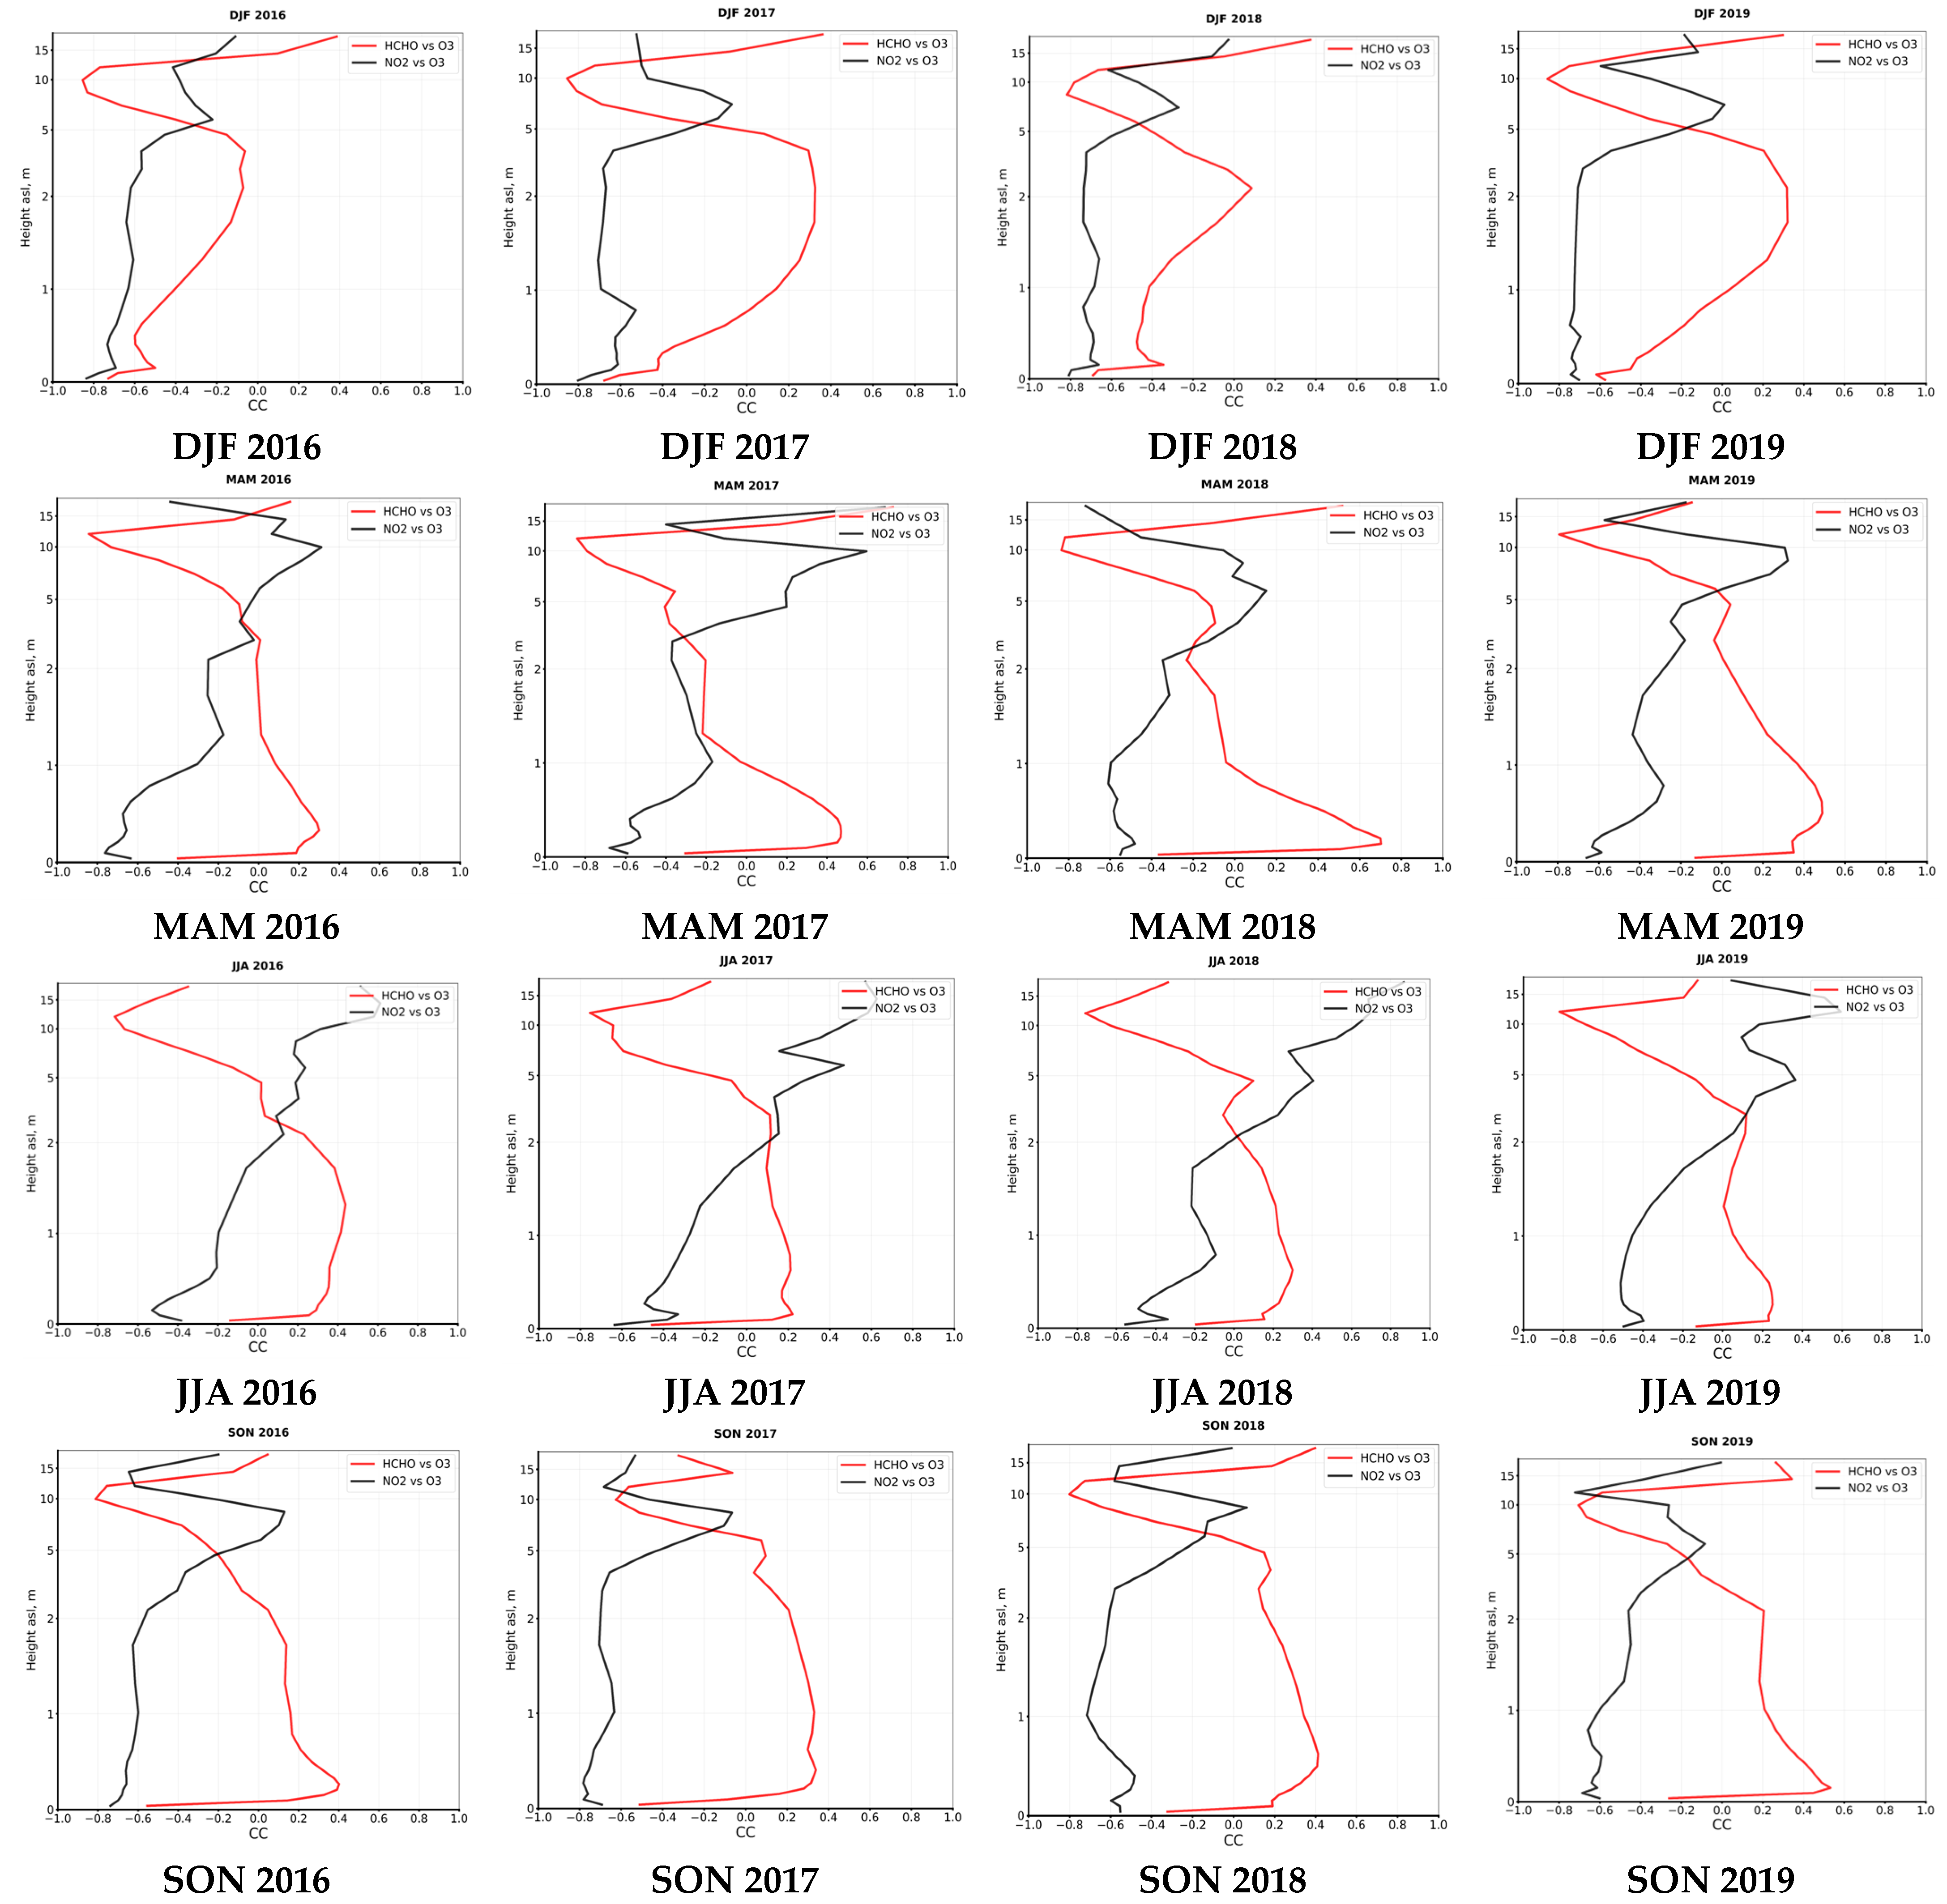
Figure 15 and Figure 16 show the seasonal distributions of the vertical CCs between the mixing ratios of O3 and its precursors (NO2 and HCHO) near the stations considered in St. Petersburg and Helsinki for the 2016–2019 period. Negative correlations are observed between the NO2 and O3 near-surface (below ~100 m) mixing ratios at the SPbU station (Figure 15). Below ~50 m, the correlations between the HCHO and O3 mixing ratios are also negative. It can be assumed that due to the relatively high mixing ratio of NO2, the VOC-limited regime dominates in the near-surface layer in St. Petersburg which is characterized by a negative correlation between the O3 and NO2 mixing ratios and a positive correlation between O3 and VOCs. Hence, the negative correlation between O3 and HCHO may be related to the extremely low mixing ratio of HCHO in the vicinity of St. Petersburg in the layer up to 50 m.
The correlations between the mixing ratio of HCHO and O3 in the layer from ~50 m to 1–2 km during spring, summer, and autumn change to positive values, which corresponds to the VOC-limited regime (for example, March–April–May 2019) and is probably related to the decrease in the NO2 mixing ratio with height. At the same time, the correlations between NO2 and O3 in spring and summer at the SPbU station changes significantly in this layer, from negative to almost zero or positive values (see, for example, June–July–August 2018) (Figure 15). This does not correspond to the classical VOC-limited regime and can be related to the sharp decrease in the NO2 mixing ratio with increasing height (see Figure 12). The correlations between the HCHO and O3 mixing ratios above 1–2 km at a particular height during all seasons are still positive, while the correlations between NO2 and O3 are negative. Above these heights, the correlations change their sign. Depending on the season and year, this height changes from 2 to 5–6 km.
Figure 14 shows that the VOC-limited regime (FNR < 1) dominates above 8 km in the whole modeling domain during all months. In turn, correlations between the gases in this layer depend on the season. For example, a positive correlation between NO2 and O3 and a negative correlation between HCHO and O3 can occur above 8 km in summer, which corresponds to the NOx-limited regime. Most likely, the small FNR values above 8 km in summer are caused by the low mixing ratio of HCHO in this layer (10–20 times greater than that in the near-surface layer) and the high mixing ratio of NO2. The latter can be related to the intensified summer production of NO2 from N2O in the stratosphere, followed by a decrease in the troposphere and summer lightning activity. Probably, due to the low mixing ratios of HCHO and other VOCs above 8 km, the mixing ratio of HOx is also small. This leads to a low rate of Reaction (4). In addition, due to the low mixing ratio of NOx, the rates of Reactions (2a) and (2c) are higher than that of Reaction (2b), slowing the loss of NO2 molecules via Reaction (1).
The profiles of the CC in Helsinki (Figure 16) have similar features to those of the profiles for St. Petersburg, particularly in the layer above 2 km. Below 2 km, the profiles differ significantly between the two stations to varying degrees, depending on the season and year. This can be related to differences in the mean PBLH (Figure 6) and the emissions of ozone precursors. In contrast to St. Petersburg, a negative correlation between the NO2 and O3 mixing ratios in Helsinki up to 2 km was observed, which occurred during the whole period of 2016–2019. As in St. Petersburg, there is a positive correlation between the HCHO and O3 mixing ratios below 1 km from spring to autumn. The differences in correlations between O3 and its precursors in layers up to 2 km in St. Petersburg and Helsinki could be related to the significantly different mixing ratios of these gases in these cities. According to the EDGARv5 anthropogenic emission inventory, NOx emissions from the territory of Helsinki are 10–100 times lower than the emissions of St. Petersburg (Figure 3). Most likely, the larger mean PBLH in Helsinki contributed to the relatively homogeneous NOx content in the planetary boundary layer relative to that in St. Petersburg. This, in turn, causes more linear vertical profiles of the CCs between NO2 and O3 in this layer in Helsinki.

4. Conclusions

WRF-Chem modeling in the region of the Gulf of Finland was used to investigate the variations in tropospheric ozone content during the period of 2016–2019. The focus was on two large cities, St. Petersburg (Russia) and Helsinki (Finland). The study revealed that by using the WRF-Chem model with a 10 km spatial resolution it is possible to reproduce the features of tropospheric ozone, such as diurnal, seasonal and interannual variations.
In general, the model, in the configuration used, overestimates the ozone content in the troposphere above St. Petersburg and Helsinki. The mean differences between the NSOCs in the two cities derived from ground-based observations and from the WRF-Chem model ranged from 10.7 to 43.5%, with a standard deviation varying from 42.6 to 60.4%. Such a wide range of differences can be related to the predominance of a particular ozone precursor, meteorological conditions at a particular station and the time scale of the NSOC data—hourly or daily. The main factors influencing the modeling of NSOCs are a lack of diurnal and weekly variations in the NOx emissions in the modeling setup and uncertainties in atmospheric transport modeling at night and in chemical boundary conditions. For example, the WRF-Chem model did not reproduce the NSOC night maximum in both cities. This can be related to the poor simulation of vertical mixing at night. In addition, the large differences in the NSOC values according to the measurements and modeling in Helsinki could be due to the uncertainties in the natural emissions set in the model. Even though the model represents the main temporal features of NSOCs in both cities, the differences between the modeled and observed values make it difficult to investigate, for example, the level of ozone pollution on the scale of one day or finer.
The mean differences in the TrOC derived by the FTIR method and the WRF-Chem model range from 7 to 10.4%, with a standard deviation of 11%. The reason for the worse agreement of the NSOC values relative to the TrOC values between the observations and modeling can be related to small-scale physical and chemical processes and factors (e.g., turbulent mixing in planetary boundaries and surface layers), which are more uncertain in modern 3D numerical models.
In general, the agreement between the tropospheric ozone content modeled data with a spatial resolution of 10 km and the complex ground-based observations over the Gulf of Finland is satisfactory at time scales of several days. The results of the study confirm that the validation of tropospheric ozone modeled data against observations is an unavoidable part of such research. In further investigations of the variations in tropospheric ozone near the territories of large cities, it is important to pay extra attention to setting the different temporal variations (daily, weekly, etc.) in ozone precursor emissions and to parametrizing processes in the Earth boundary layer.
The analysis of the mean zonal distribution of the vertical profiles of ozone and its precursors by the WRF-Chem model revealed that there were complex correlations between the species in the troposphere, which varied significantly in space and time. According to the model, the VOC-limited regime occurs in the ~0–1 km layer around St. Petersburg, Helsinki, and the Gulf of Finland. In turn, a pronounced NOx-limited regime occurs in the 0–2 km layer in July at northern (61–64° N) and southern (56–58° N) latitudes, which correspond territorially to the forests of southern Finland, Karelia, some Russian regions and the Baltic countries. Most likely, the VOC-limited regime in the territories of St. Petersburg and Helsinki is related to the higher emissions of NOx. In turn, the NOx-limited regime in the northern and southern territories could be related to the increase in seasonally dependent emissions of biogenic VOCs and the reduction in anthropogenic NOx emissions.

Author Contributions

Conceptualization, G.N. and Y.V.; methodology, G.N. and Y.V.; software, G.N., Y.V. and E.R.; validation, G.N., Y.V. and A.P.; formal analysis, G.N., Y.V. and A.P.; investigation, G.N., Y.V., D.I., A.P. and E.R.; resources, E.R.; data curation, Y.V., D.I. and E.R.; writing—original draft preparation, G.N. and Y.V.; writing—review and editing, G.N., Y.V., D.I., A.P. and E.R.; visualization, G.N., Y.V. and A.P.; supervision, G.N. and Y.V.; project administration, G.N. and Y.V.; funding acquisition, Y.V. and E.R. All authors have read and agreed to the published version of the manuscript.

Funding

This research was funded by the Russian Science Foundation, grant number 23-27-00166, https://rscf.ru/en/project/23-27-00166/ (accessed on 13 January 2024).

Institutional Review Board Statement

Not applicable.

Informed Consent Statement

Not applicable.

Data Availability Statement

The simulation data are available upon request to [email protected].

Acknowledgments

Measurements at the SPbU station in Peterhof were performed with the equipment of the SPbU “Geomodel” resource center. The authors are grateful to the team of scientists from the National Oceanic and Atmospheric Administration (NCAR), the University Corporation for Atmospheric Research (UCAR), the National Oceanic and Atmospheric Administration (NOAA) and the Air Force (AFWA), USA, who developed, are developing, and are distributing the numerical data free-of-charge model WRF-Chem. The authors are also grateful to scientists from the Finnish Meteorological Institute and the University of Helsinki for the publicly available observed data of near-surface O3 and NOx in Helsinki, Finland.

Conflicts of Interest

The authors declare no conflicts of interest.

Appendix A

Determination of Integrated Tropospheric Ozone Content by WRF-Chem
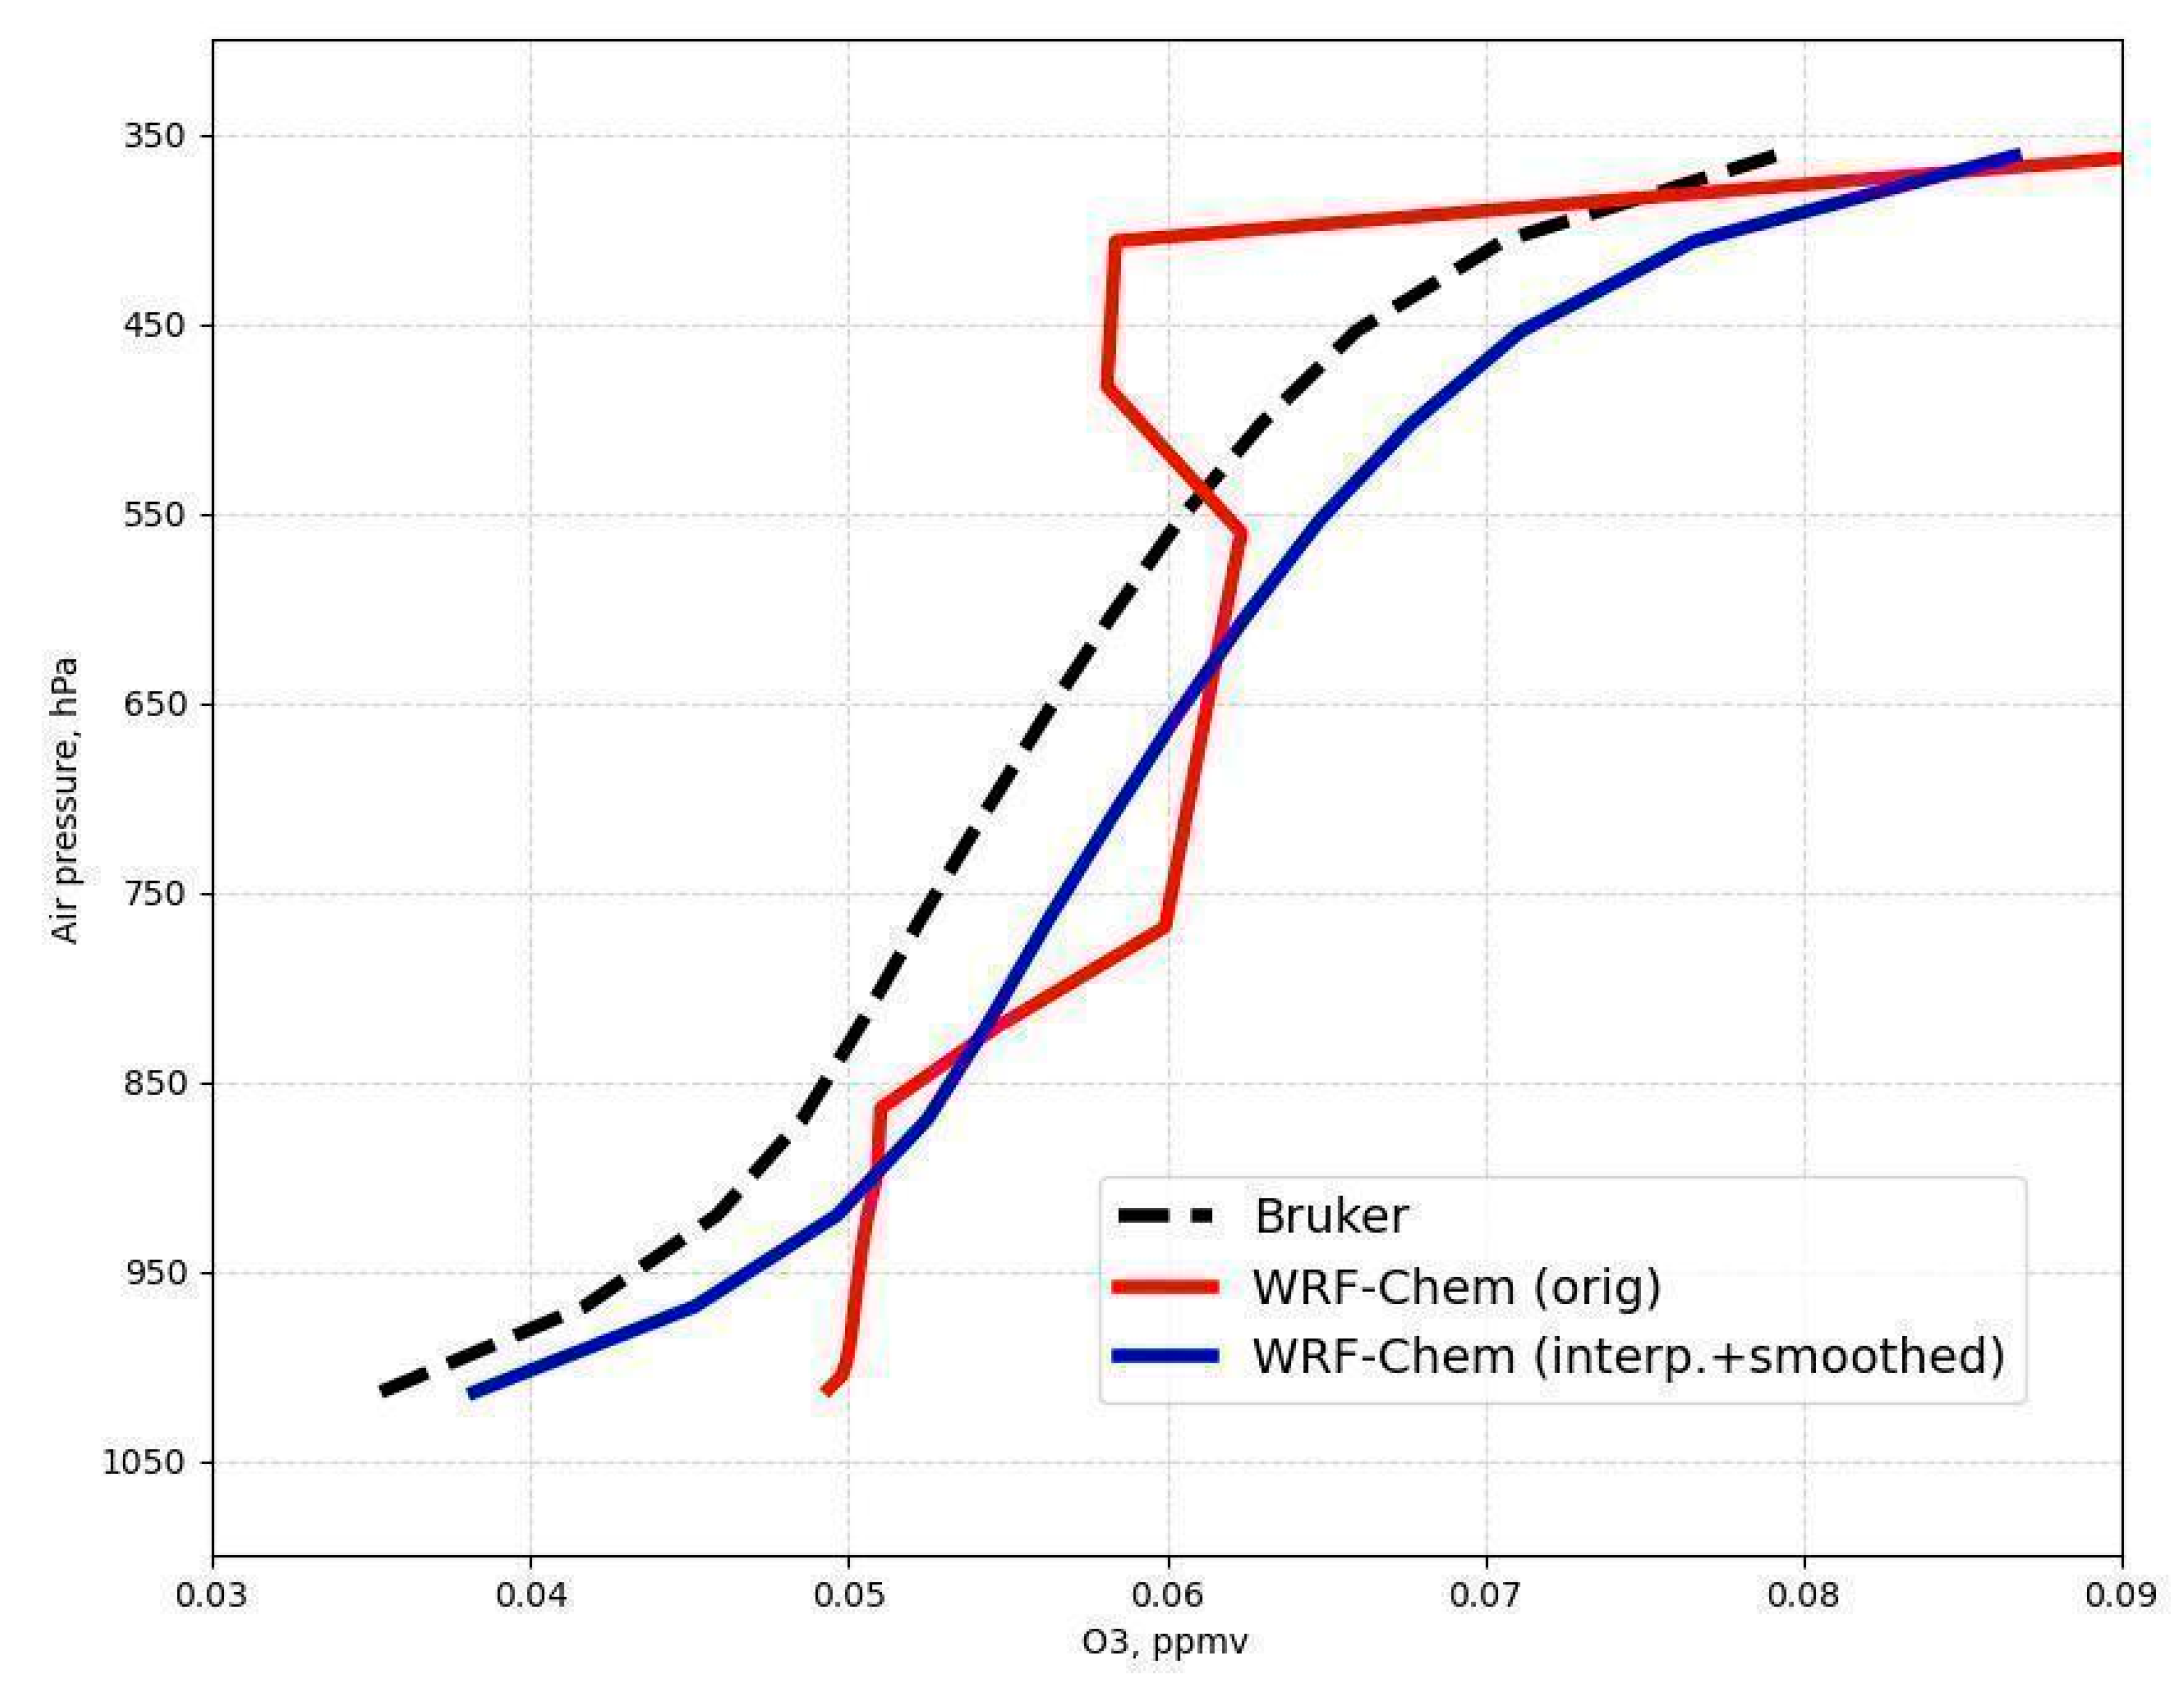
The WRF-Chem-modeled ozone content data are available as the volume mixing ratio (ppbv) at 25 vertical levels. To calculate the TrOC values, ozone profiles up to ~8 km were integrated via the trapezoidal rule.
The results of any measurement or modeling are characterized by spatial resolution. To correctly compare the data retrieved by methods with different spatial resolutions, the resolution must be uniform. In the present study, differences in the horizontal resolution of the methods used (modeling and measurements) are neglected since these differences may be smaller than the average spatial scale of the TrOC variations. The vertical resolution of the WRF-Chem ozone profile is finer than the resolution of the FTIR observations (hundred meters vs. kilometers). Therefore, to conform to the vertical resolutions of both methods, Equation (A1) can be used:
x = x a + A x x a
where A is an averaging kernel matrix of the ozone profile of FTIR observations; x a is the a priori ozone profile; x is the “true” ozone profile; and x is the retrieved ozone profile [52]. First, the modeled ozone profile ( x ) was interpolated linearly to the vertical levels of the observational data. Second, Equation (A1) was applied to derive a smoothed ozone vertical profile.
Figure A1 depicts the vertical profiles of the ozone content in the troposphere above St. Petersburg on 7 June 2017 at 10 UTC according to the FTIR observations and WRF-Chem modeling. The blue curve represents the smoothed modeled vertical profile of the ozone content.
Figure A1. Example of the ozone vertical profile above St. Petersburg on 7 June 2017 at 10 UTC by the ground-based observations and WRF-Chem modeling (before and after smoothing by (A1)).
Atmosphere 15 00775 g0a1

Appendix B

Appendix B.1. Statistical Characteristics

Below, the equations for calculating the mean differences (MDs), the standard deviations of differences (SDDs) and the Pearson correlation coefficients (CCs) are provided:
M D = n = 1 N O b s n M o d n   N
S D D   o f   M D = n = 1 N O b s n M o d n 2   N 1
C C = n = 1 N ( O b s n O b s n ¯ ) ( M o d n M o d n ¯ )   n = 1 N O b s n O b s n ¯ 2 n = 1 N M o d n M o d n ¯ 2
where N is the size of the dataset, O b s is the observational data and M o d is the modeled data.

Appendix B.2. Confidence Intervals

According to [53], confidence intervals at the 95% confidence level are provided for the mean values:
M D ± z S D D N
where z is a quintile of the normal distribution or Student’s number for the 95% confidence level and N is the size of the dataset.
The confidence intervals for the SDDs were estimated according to [54]:
S D D N 1 χ 1 < S D D < S D D N 1 χ 2
where χ 1 and χ 2 are the critical values of the χ 2 distribution.

Appendix C

Appendix C.1. Near-Surface Ozone Concentrations
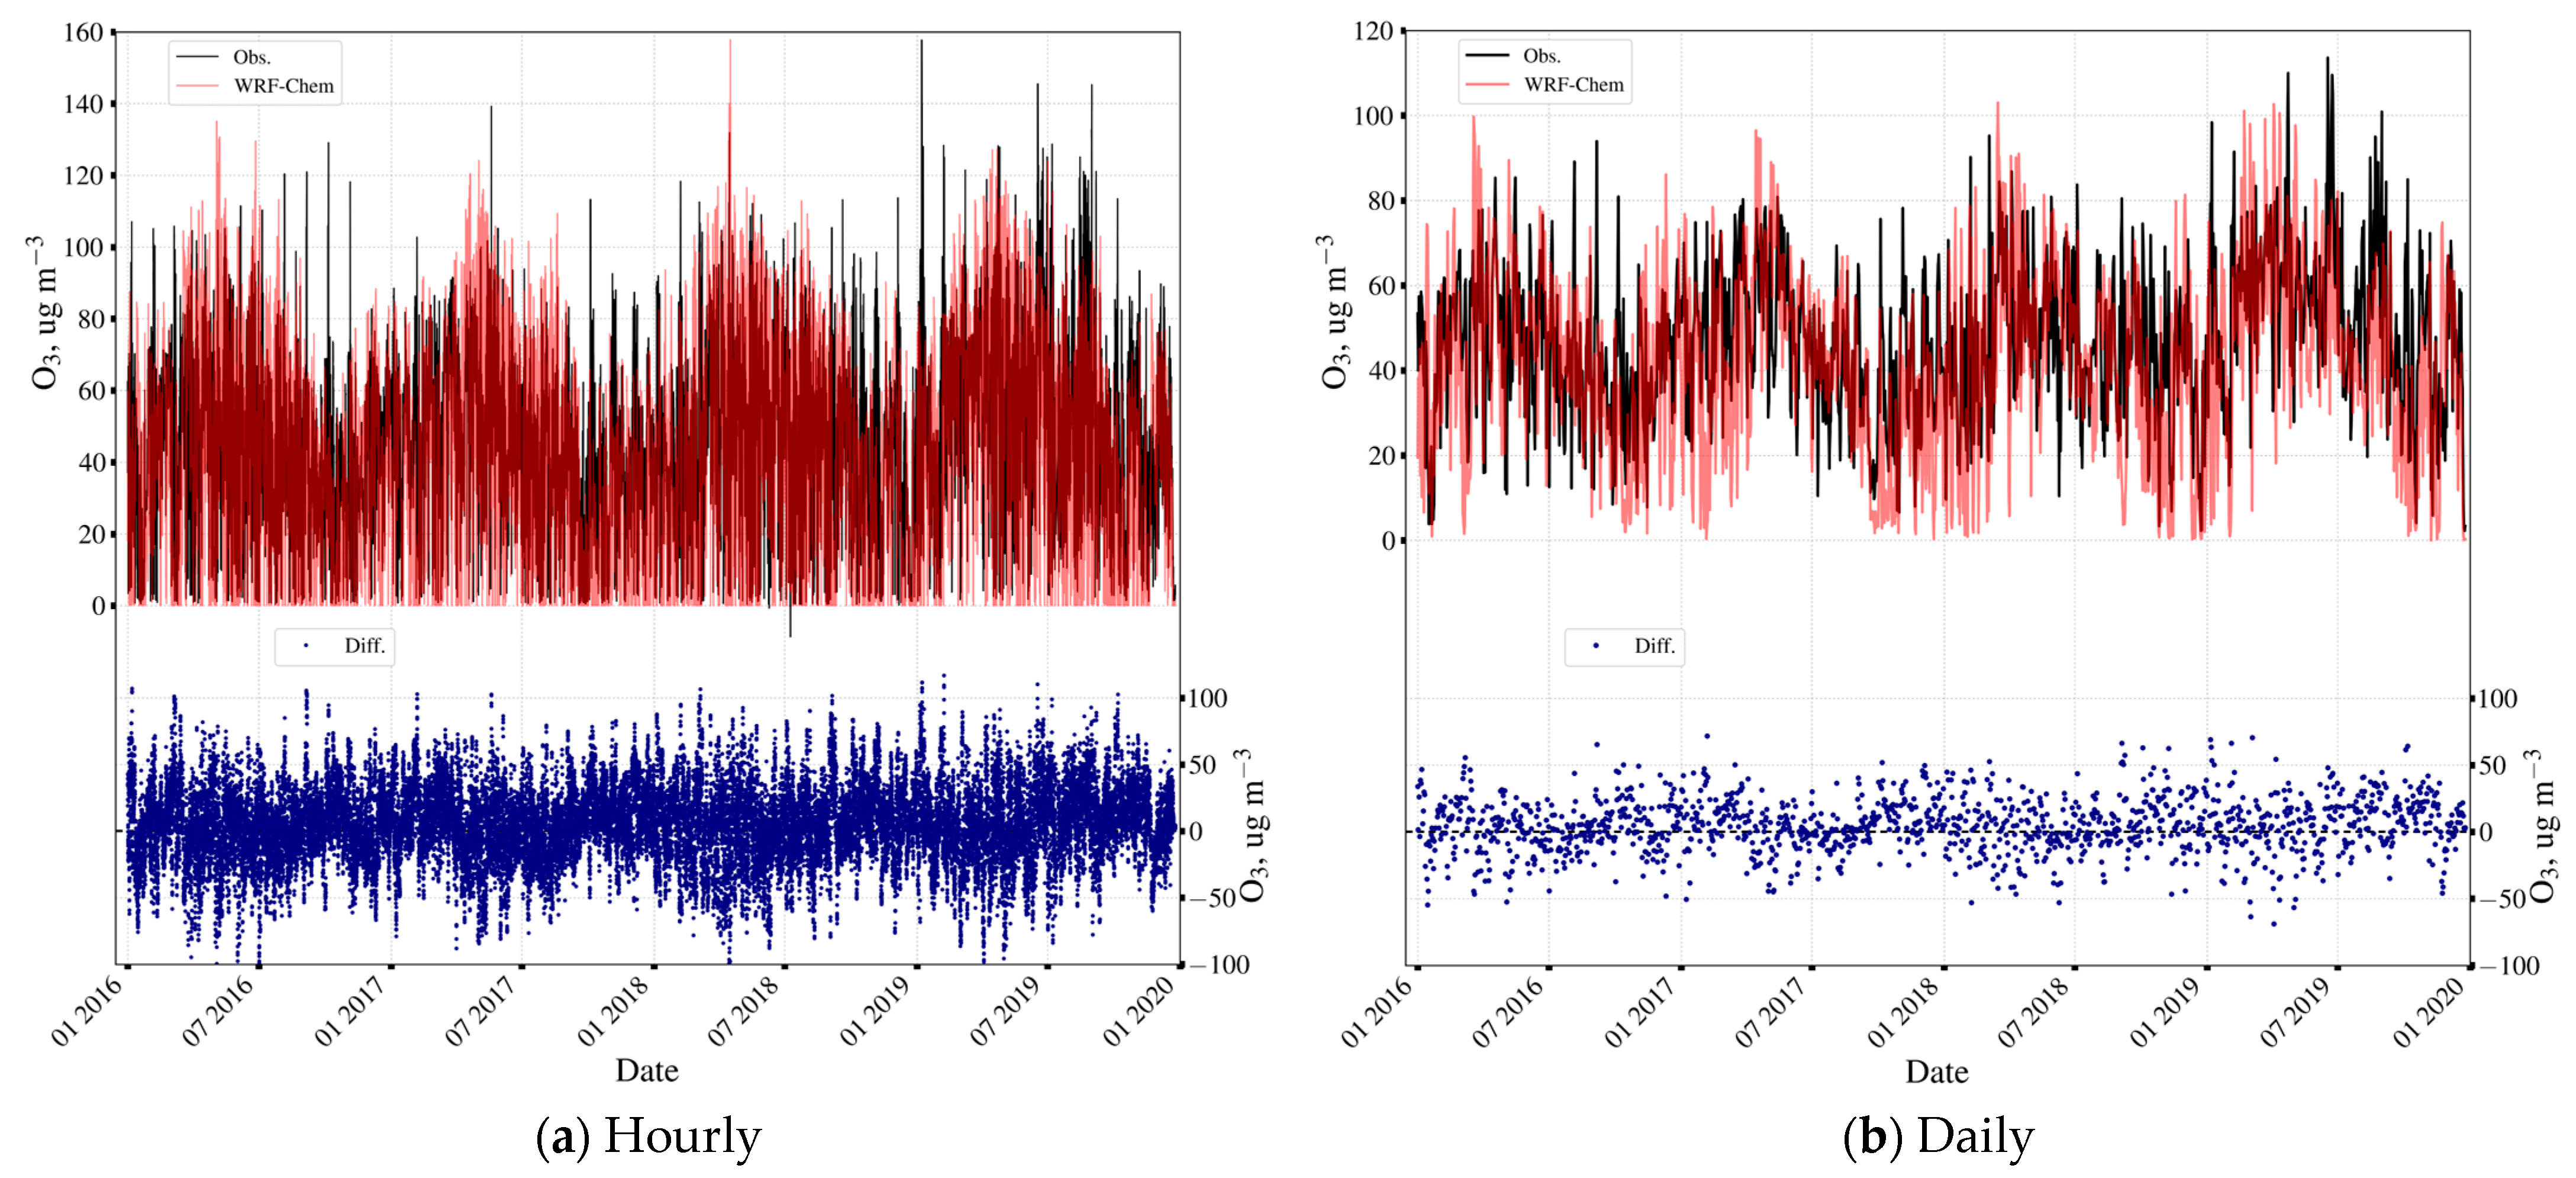
Figure A2 and Figure A3 demonstrate time series of NSOC in St. Petersburg (the SPbU station in the Peterhof campus) and Helsinki (the SMEAR III station in the Kumpula Campus) for 2016–2019 as hourly and monthly means by ground-based in situ measurements and WRF-Chem modeling. Original measurements at the SMEAR III and SPbU stations are available in ppbv and µg m−3, respectively. For further analysis, all concentrations were converted to µg m−3 by the basic understanding of moist air density provided in [55]. For the SMEAR III station, an expression for the density of dry air was used due to the lack of measured humidity data.
Figure A2. Time series of the hourly (a) and daily averaged (b) NSOCs at the SPbU station for 2016–2019 according to ground-based in situ measurements and WRF-Chem modeling and their differences (right scale).
Atmosphere 15 00775 g0a2
Figure A3. The same as in Figure A2 but for the SMEAR III station in Helsinki.
Atmosphere 15 00775 g0a3

Appendix C.2. Tropospheric Ozone Content in St. Petersburg

Figure A4. Time series of the hourly TrOC values in the 0–8 km layer at the SPbU station in St. Petersburg for the 2016–2019 period, according to the FTIR observations and the WRF-Chem model; the differences between the data are given below (right vertical axis).
Atmosphere 15 00775 g0a4

References

  1. Stanek, L.W.; Brown, J.S.; Stanek, J.; Gift, J.; Costa, D.L. Air pollution toxicology—A brief review of the role of the science in shaping the current understanding of air pollution health risks. Toxicol. Sci. 2011, 120 (Suppl. S1), S8–S27. [Google Scholar] [CrossRef] [PubMed]
  2. Amann, M.; Derwent, D.; Forsberg, B.; Hänninen, O.; Hurley, F.; Krzyzanowski, M.; de Leeuw, F.; Liu, S.J.; Mandin, C.; Schneider, J.; et al. Health Risks of Ozone from Long-Range Transboundary Air Pollution; World Health Organization, Regional Office for Europe: Copenhagen, Denmark, 2008; Available online: https://apps.who.int/iris/handle/10665/326496 (accessed on 13 January 2024).
  3. Mills, G.; Pleijel, H.; Malley, C.S.; Sinha, B.; Cooper, O.R.; Schultz, M.G.; Neufeld, H.S.; Simpson, D.; Sharps, K.; Feng, Z.; et al. Tropospheric Ozone Assessment Report: Present-day tropospheric ozone distribution and trends relevant to vegetation. Elem. Sci. Anthr. 2018, 6, 47. [Google Scholar] [CrossRef]
  4. Forster, P.; Storelvmo, T.; Armour, K.; Collins, W.; Dufresne, J.-L.; Frame, D.; Lunt, D.J.; Mauritsen, T.; Palmer, M.D.; Watanabe, M.; et al. The Earth’s Energy Budget, Climate Feedbacks, and Climate Sensitivity. In Climate Change 2021: The Physical Science Basis. Contribution of Working Group I to the Sixth Assessment Report of the Intergovernmental Panel on Climate Change; Masson-Delmotte, V., Zhai, P., Pirani, A., Connors, S.L., Péan, C., Berger, S., Caud, N., Chen, Y., Goldfarb, L., Gomis, M.I., et al., Eds.; Cambridge University Press: Cambridge, UK; New York, NY, USA, 2021; pp. 923–1054. [Google Scholar] [CrossRef]
  5. Pope, R.J.; Rap, A.; Pimlott, M.A.; Barret, B.; Le Flochmoen, E.; Kerridge, B.J.; Siddans, R.; Latter, B.G.; Ventress, L.J.; Boynard, A.; et al. Quantifying the tropospheric ozone radiative effect and its temporal evolution in the satellite era. Atmos. Chem. Phys. 2024, 24, 3613–3626. [Google Scholar] [CrossRef]
  6. Tropospheric Ozone Assessment Report (TOAR): Global Metrics for Climate Change, Human Health and Crop/Ecosystem Research. Available online: https://igacproject.org/activities/TOAR (accessed on 22 December 2023).
  7. Liao, Z.; Gao, M.; Zhang, J.; Sun, J.; Quan, J.; Jia, X.; Pan, Y.; Fan, S. Mixing-layer-height-referenced ozone vertical distribution in the lower troposphere of Chinese megacities: Stratification, classification, and meteorological and photochemical mechanisms. Atmos. Chem. Phys. 2024, 24, 3541–3557. [Google Scholar] [CrossRef]
  8. Chen, Z.; Xie, Y.; Liu, J.; Shen, L.; Cheng, X.; Han, H.; Yang, M.; Shen, Y.; Zhao, T.; Hu, J. Distinct seasonality in vertical variations of tropospheric ozone over coastal regions of southern China. Sci. Total Environ. 2023, 874, 162423. [Google Scholar] [CrossRef] [PubMed]
  9. Li, D.; Liu, Z.; Zhou, M.; Zhao, Y.; Zhang, L. The influence of dry deposition on surface ozone simulations under different planetary boundary layer schemes over eastern China. Atmos. Environ. 2024, 327, 120514. [Google Scholar] [CrossRef]
  10. Ren, J.; Guo, F.; Xie, S. Diagnosing ozone–NOx–VOC sensitivity and revealing causes of ozone increases in China based on 2013–2021 satellite retrievals. Atmos. Chem. Phys. 2022, 22, 15035–15047. [Google Scholar] [CrossRef]
  11. Seinfeld, J.H.; Pandis, S.N. Atmospheric Chemistry and Physics: From Air Pollution to Climate Change, 2nd ed.; John Wiley & Sons: New York, NY, USA, 2006; p. 1225. [Google Scholar]
  12. Wallace, J.; Hobbs, P. Atmospheric Science—An Introductory Survey, 2nd ed.; Elsevier Academic Press: Amsterdam, The Netherlands, 2006; p. 484. [Google Scholar]
  13. Young, P.J.; Archibald, A.T.; Bowman, K.W.; Lamarque, J.-F.; Naik, V.; Stevenson, D.S.; Tilmes, S.; Voulgarakis, A.; Wild, O.; Bergmann, D.; et al. Pre-industrial to end 21st century projections of tropospheric ozone from the Atmospheric Chemistry and Climate Model Intercomparison Project (ACCMIP). Atmos. Chem. Phys. 2013, 13, 2063–2090. [Google Scholar] [CrossRef]
  14. Georgiou, G.K.; Christoudias, T.; Proestos, Y.; Kushta, J.; Hadjinicolaou, P.; Lelieveld, J. Air quality modelling in the summer over the eastern Mediterranean using WRF-Chem: Chemistry and aerosol mechanism intercomparison. Atmos. Chem. Phys. 2018, 18, 1555–1571. [Google Scholar] [CrossRef]
  15. Romero-Alvarez, J.; Lupaşcu, A.; Lowe, D.; Badia, A.; Archer-Nicholls, S.; Dorling, S.; Reeves, C.E.; Butler, T. Sources of surface O3 in the UK: Tagging O3 within WRF-Chem. Atmos. Chem. Phys. 2022, 22, 13797–13815. [Google Scholar] [CrossRef]
  16. Thorp, T.; Arnold, S.R.; Pope, R.J.; Spracklen, D.V.; Conibear, L.; Knote, C.; Arshinov, M.; Belan, B.; Asmi, E.; Laurila, T.; et al. Late-spring and summertime tropospheric ozone and NO2 in western Siberia and the Russian Arctic: Regional model evaluation and sensitivities. Atmos. Chem. Phys. 2021, 21, 4677–4697. [Google Scholar] [CrossRef]
  17. Federal State Statistics Service. Available online: https://eng.rosstat.gov.ru/ (accessed on 13 January 2024).
  18. Official Site of St. Petersburg Administration. Actualization of the Scheme of St. Petersburg Heat Supply. Available online: https://www.gov.spb.ru/ (accessed on 13 January 2024).
  19. Urbanica: 250 the Largest Industrial Centeres of Russia. Available online: http://urbanica.spb.ru/research/ratings/250-krupnejshih-promyshlennyh-tsentrov-ros-2/ (accessed on 13 January 2024).
  20. Federal State Statistics Service: The Number of Personal Automobiles per per Capita. Available online: https://rosstat.gov.ru/bgd/regl/b11_14p/isswww.exe/stg/d01/05-17.htm (accessed on 13 January 2024).
  21. Ionov, D.V.; Makarova, M.V.; Kostsov, V.S.; Foka, S.C. Assessment of the NOx integral emission from the St. Petersburg megacity by means of mobile DOAS measurements combined with dispersion modelling. Atmos. Pollut. Res. 2022, 13, 101598. [Google Scholar] [CrossRef]
  22. Pommier, M. Estimations of the NOx emissions, NO2 lifetime and their temporal variation over three British urbanised regions in 2019 using the TROPOMI NO2 observations. Environ. Sci. Atmos. 2023, 3, 408–421. [Google Scholar] [CrossRef]
  23. Shaiganfar, R.; Beirle, S.; Denier van der Gon, H.; Jonkers, S.; Kuenen, J.; Petetin, H.; Zhang, Q.; Beekmann, M.; Wagner, T. Estimation of the Paris NOx emissions from mobile MAX-DOAS observations and CHIMERE model simulations during the MEGAPOLI campaign using the closed integral method. Atmos. Chem. Phys. 2017, 17, 7853–7890. [Google Scholar] [CrossRef]
  24. Wang, S.; Zhou, B.; Wang, Z.; Yang, S.; Hao, N.; Valks, P.; Trautmann, T.; Chen, L. Remote sensing of NO2 emission from the central urban area of Shanghai (China) using the mobile DOAS technique. J. Geophys. Res. 2012, 117, D13305. [Google Scholar] [CrossRef]
  25. Virolainen, Y.A.; Ionov, D.V.; Polyakov, A.V. Analysis of Long-Term Measurements of Tropospheric Ozone at the St. Petersburg State University Observational Site in Peterhof. Izv. Atmos. Ocean. Phys. 2023, 59, 287–295. [Google Scholar] [CrossRef]
  26. Järvi, J.; Hannuniemi, H.; Hussein, T.; Junninen, H.; Aalto, P.P.; Hillamo, R.; Mäkelä, T.; Keronen, P.; Siivola, E.; Vesala, T.; et al. The urban measurement station smear iii: Continuous monitoring of air pollution and surface–atmosphere interactions in helsinki, Finland. Boreal Environ. Res. 2009, 14, 86–109. [Google Scholar]
  27. Grell, G.A.; Peckham, S.E.; Schmitz, R.; McKeen, S.A.; Frost, G.; Skamarock, W.C.; Eder, B. Fully coupled ‘online’ chemistry in the WRF model. Atmos. Environ. 2005, 39, 6957–6976. [Google Scholar] [CrossRef]
  28. Hersbach, H.; Bell, B.; Berrisford, P.; Hirahara, S.; Horányi, A.; Muñoz-Sabater, J.; Nicolas, J.; Peubey, C.; Radu, R.; Schepers, D.; et al. The ERA5 global reanalysis. Q. J. R. Meteorol. Soc. 2020, 146, 1999–2049. [Google Scholar] [CrossRef]
  29. Emmons, L.K.; Schwantes, R.H.; Orlando, J.J.; Tyndall, G.; Kinnison, D.; Lamarque, J.; Marsh, D.; Mills, M.J.; Tilmes, S.; Bardeen, C.; et al. The Chemistry Mechanism in the Community Earth System Model version 2 (CESM2). J. Adv. Model. Earth Syst. 2020, 12, e2019MS001882. [Google Scholar] [CrossRef]
  30. Buchholz, R.R.; Emmons, L.K.; Tilmes, S. The CESM2 Development Team. CESM2.1/CAM-chem Instantaneous Output for Boundary Conditions. UCAR/NCAR—Atmospheric Chemistry Observations and Modeling Laboratory. Subset used Lat: 50 to 70, Lon: 20 to 40, June 1–15, January 15–31 2019, Accessed 12 April 2022. [CrossRef]
  31. Janssens-Maenhout, G.; Crippa, M.; Guizzardi, D.; Dentener, F.; Muntean, M.; Pouliot, G.; Keating, T.; Zhang, Q.; Kurokawa, J.; Wankmüller, R.; et al. HTAP_v2.2: A mosaic of regional and global emission grid maps for 2008 and 2010 to study hemispheric transport of air pollution. Atmos. Chem. Phys. 2015, 15, 11411–11432. [Google Scholar] [CrossRef]
  32. Guenther, A.; Karl, T.; Harley, P.; Wiedinmyer, C.; Palmer, P.I.; Geron, C. Estimates of global terrestrial isoprene emissions using MEGAN (Model of Emissions of Gases and Aerosols from Nature). Atmos. Chem. Phys. 2006, 6, 3181–3210. [Google Scholar] [CrossRef]
  33. Wiedinmyer, C.; Kimura, Y.; McDonald-Buller, E.C.; Emmons, L.K.; Buchholz, R.R.; Tang, W.; Seto, K.; Joseph, M.B.; Barsanti, K.C.; Carlton, A.G.; et al. The Fire Inventory from NCAR version 2.5: An updated global fire emissions model for climate and chemistry applications. Geosci. Model Dev. 2023, 16, 3873–3891. [Google Scholar] [CrossRef]
  34. Gong, S.L. A parameterization of sea-salt aerosol source function for sub- and super-micron particles. Glob. Biogeochem. Cycles 2003, 17, 1097. [Google Scholar] [CrossRef]
  35. LeGrand, S.L.; Polashenski, C.; Letcher, T.W.; Creighton, G.A.; Peckham, S.E.; Cetola, J.D. The AFWA dust emission scheme for the GOCART aerosol model in WRF-Chem v3.8.1. Geosci. Model Dev. 2019, 12, 131–166. [Google Scholar] [CrossRef]
  36. Dudhia, J. Numerical study of convection observed during the Winter Monsoon Experiment using a mesoscale two–dimensional model. J. Atmos. Sci. 1989, 46, 3077–3107. [Google Scholar] [CrossRef]
  37. Mlawer, E.J.; Taubman, S.J.; Brown, P.D.; Iacono, M.J.; Clough, S.A. Radiative transfer for inhomogeneous atmospheres: RRTM, a validated correlated–k model for the longwave. J. Geophys. Res. 1997, 102, 16663–16682. [Google Scholar] [CrossRef]
  38. Mukul Tewari, N.C.A.R.; Tewari, M.; Chen, F.; Wang, W.; Dudhia, J.; LeMone, M.; Mitchell, K.; Ek, M.; Gayno, G.; Wegiel, J.; et al. Implementation and verification of the unified NOAH land surface model in the WRF model. In Proceedings of the 20th Conference on Weather Analysis and Forecasting/16th Conference on Numerical Weather Prediction, Seattle, WA, USA, 12–16 January 2004; pp. 11–15. [Google Scholar]
  39. Jiménez, P.A.; Dudhia, J.; González-Rouco, J.F.; Navarro, J.; Montávez, J.P.; García-Bustamante, E. A revised scheme for the WRF surface layer formulation. Mon. Weather Rev. 2012, 140, 898–918. [Google Scholar] [CrossRef]
  40. Song-You, H.; Noh, Y.; Dudhia, J. A new vertical diffusion package with an explicit treatment of entrainment processes. Mon. Weather Rev. 2006, 134, 2318–2341. [Google Scholar]
  41. Grell, G.A.; Freitas, S.R. A scale and aerosol aware stochastic convective parameterization for weather and air quality modeling. Atmos. Chem. Phys. 2014, 14, 5233–5250. [Google Scholar] [CrossRef]
  42. Morrison, H.; Thompson, G.; Tatarskii, V. Impact of Cloud Microphysics on the Development of Trailing Stratiform Precipitation in a Simulated Squall Line: Comparison of One– and Two–Moment Schemes. Mon. Weather Rev. 2009, 137, 991–1007. [Google Scholar] [CrossRef]
  43. Chen, F.; Kusaka, H.; Bornstain, R.; Ching, J.; Grimmond, C.S.B.; Grossman-Clarke, S.; Loridan, T.; Manning, K.; Martilli, A.; Miao, S.; et al. The integrated WRF/urban modeling system: Development, evaluation, and applications to urban environmental problems. Int. J. Climatol. 2011, 31, 273–288. [Google Scholar] [CrossRef]
  44. Emmons, L.K.; Walters, S.; Hess, P.G.; Lamarque, J.-F.; Pfister, G.G.; Fillmore, D.; Granier, C.; Guenther, A.; Kinnison, D.; Laepple, T.; et al. Description and evaluation of the Model for Ozone and Related chemical Tracers, version 4 (MOZART-4). Geosci. Model Dev. 2010, 3, 43–67. [Google Scholar] [CrossRef]
  45. Zaveri, R.A.; Easter, R.C.; Fast, J.D.; Peters, L.K. Model for Simulating Aerosol Interactions and Chemistry (MOSAIC). J. Geophys. Res. 2008, 113, D13204. [Google Scholar] [CrossRef]
  46. Ionov, D.V.; Poberovskii, A.V. Variability of Nitrogen Oxides in the Atmospheric Surface Layer near Saint Petersburg. Russ. Meteorol. Hydrol. 2020, 45, 720–726. [Google Scholar] [CrossRef]
  47. Crippa, M.; Guizzardi, D.; Muntean, M.; Schaaf, E. EDGAR v5.0 Global Air Pollutant Emissions; European Commission: Brussels, Belgium, 2021; p. JRC122516. [Google Scholar]
  48. Hase, F.; Hannigan, J.W.; Coffey, M.T.; Goldman, A.; Höpfner, M.; Jones, N.B.; Rinsland, C.P.; Wood, S.W. Inter-comparison of retrieval codes used for the analysis of high-resolution, ground-based FTIR measurements. J. Quant. Spectrosc. Radiat. Transfer. 2003, 87, 25–52. [Google Scholar] [CrossRef]
  49. Virolainen, Y.A.; Timofeev, Y.M.; Poberovskii, A.V.; Eremenko, M.; Dufour, G. Evaluation of ozone content in different atmospheric layers using ground-based Fourier transform spectrometry. Izv. Atmos. Ocean. Phys. 2015, 51, 167–176. [Google Scholar] [CrossRef]
  50. Virolainen, Y.A.; Nerobelov, G.M.; Polyakov, A.V. Comparison of Satellite and Ground-Based Measurements of Tropospheric Ozone Columns in the Vicinity of St. Petersburg. Izv. Atmos. Ocean. Phys. 2023, 59, 411–420. [Google Scholar] [CrossRef]
  51. García, O.E.; Schneider, M.; Redondas, A.; González, Y.; Hase, F.; Blumenstock, T.; Sepúlveda, E. Investigating the long-term evolution of subtropical ozone profiles applying ground-based FTIR spectrometry. Atmos. Meas. Technol. 2012, 5, 2917–2931. [Google Scholar] [CrossRef]
  52. Rodgers, C.D. Inverse Methods for Atmospheric Sounding (Oxford) Series on Atmospheric, Oceanic and Planetary Physics; World Scientific: Singapore, 2000; p. 256. [Google Scholar]
  53. Dekking, F.M.; Kraaikamp, C.; Lopuhaä, H.P.; Meester, L.E. A Modern Introduction to Probability and Statistics. Springer Texts in Statistics; Springer: London, UK, 2005; p. 488. [Google Scholar] [CrossRef]
  54. Fadeeva, L.N.; Lebedev, A.V. Theory of Probability and Mathematical Statistics; American Mathematical Society: Providence, RI, USA, 2011; p. 496. [Google Scholar]
  55. Matveev, L.G. The Course of General Meteorology—Atmospheric Physics; Gidrometizdat: Saint Petersburg, Russia, 1984; p. 752. [Google Scholar]
  56. Jacob, D.J. Introduction to Atmospheric Chemistry; Princeton University Press: Princeton, NJ, USA, 1999; p. 264. [Google Scholar]
  57. Teinilä, K.; Aurela, M.; Niemi, J.; Kousa, A.; Petäjä, T.; Järvi, L.; Hillamo, R.; Kangas, L.; Saarikoski, S.; Timonen, H. Concentration variation of gaseous and particulate pollutants in the Helsinki city centre—Observations from a two-year campaign from 2013–2015. Boreal Environ. Res. 2019, 24, 115–136. [Google Scholar]
  58. Peralta, A.H.D.; Gavidia-Calderón, M.; Andrade, M.d.F. Future Ozone Levels Responses to Changes in Meteorological Conditions under RCP 4.5 and RCP 8.5 Scenarios over São Paulo, Brazil. Atmosphere 2023, 14, 626. [Google Scholar] [CrossRef]
  59. Shith, S.; Ramli, N.A.; Awang, N.R.; Ismail, M.R.; Latif, M.T.; Zainordin, N.S. Does Light Pollution Affect Nighttime Ground-Level Ozone Concentrations? Atmosphere 2022, 13, 1844. [Google Scholar] [CrossRef]
  60. Laurila, T. Effects of environmental conditions and transport on surface ozone concentrations in Finland. Geophysica 1996, 32, 167–193. [Google Scholar]
  61. Sillanpää, S.; Fung, P.L.; Niemi, J.V.; Kousa, A.; Kangas, L.; Zaidan, M.A.; Timonen, H.; Kulmala, M.; Petäjä, T.; Hussein, T. Long-term air quality trends of regulated pollutants in the Helsinki metropolitan area from 1994–2019 and its implications to the Air Quality Index. Boreal Environ. Res. 2022, 27, 61–79. [Google Scholar] [CrossRef]
  62. Li, X.; Dong, Y.; Zhang, Y.; Shi, Z.; Yao, J. Climatology of Planetary Boundary Layer Height over Jiangsu, China, Based on ERA5 Reanalysis Data. Atmosphere 2023, 14, 1330. [Google Scholar] [CrossRef]
  63. WMO. GAW Report No. 209. Guidelines for Continuous Measurements of Ozone in the Troposphere; WMO: Geneva, Switzerland, 2013. [Google Scholar]
  64. Kuhn, L.; Beirle, S.; Kumar, V.; Osipov, S.; Pozzer, A.; Bösch, T.; Kumar, R.; Wagner, T. On the influence of vertical mixing, boundary layer schemes, and temporal emission profiles on tropospheric NO2 in WRF-Chem—Comparisons to in situ, satellite, and MAX-DOAS observations. Atmos. Chem. Phys. 2024, 24, 185–217. [Google Scholar] [CrossRef]
  65. Pancholi, P.; Kumar, A.; Bikundia, D.S.; Chourasiya, S. An observation of seasonal and diurnal behavior of O3–NOx relationships and local/regional oxidant (OX = O3 + NO2) levels at a semi-arid urban site of western India. Sustain. Environ. Res. 2018, 28, 79–89. [Google Scholar] [CrossRef]
  66. Safieddine, S.; Boynard, A.; Coheur, P.-F.; Hurtmans, D.; Pfister, G.; Quennehen, B.; Thomas, J.L.; Raut, J.-C.; Law, K.S.; Klimont, Z.; et al. Summertime tropospheric ozone assessment over the Mediterranean region using the thermal infrared IASI/MetOp sounder and the WRF-Chem model. Atmos. Chem. Phys. 2014, 14, 10119–10131. [Google Scholar] [CrossRef]
  67. Shah, V.; Jacob, D.J.; Dang, R.; Lamsal, L.N.; Strode, S.A.; Steenrod, S.D.; Boersma, K.F.; Eastham, S.D.; Fritz, T.M.; Thompson, C.; et al. Nitrogen oxides in the free troposphere: Implications for tropospheric oxidants and the interpretation of satellite NO2 measurements. Atmos. Chem. Phys. 2023, 23, 1227–1257. [Google Scholar] [CrossRef]
  68. Martin, R.V.; Fiore, A.M.; Van Donkelaar, A. Space-based diagnosis of surface ozone sensitivity to anthropogenic emissions. Geophys. Res. Lett. 2004, 31, L06120. [Google Scholar] [CrossRef]
  69. Jin, X.; Fiore, A.M.; Murray, L.T.; Valin, L.C.; Lamsal, L.N.; Duncan, B.; Boersma, K.F.; De Smedt, I.; Abad, G.G.; Chance, K.; et al. Evaluating a space-based indicator of surface ozone-NOx-VOC sensitivity over midlatitude source regions and application to decadal trends. J. Geophys. Res. Atmos. 2017, 122, 10,439–10,461. [Google Scholar] [CrossRef] [PubMed]
  70. Chang, C.-Y.; Faust, E.; Hou, X.; Lee, P.; Kim, H.C.; Hedquist, B.C.; Liao, K.-J. Investigating ambient ozone formation regimes in neighboring cities of shale plays in the Northeast United States using photochemical modeling and satellite retrievals. Atmos. Environ. 2016, 142, 152–170. [Google Scholar] [CrossRef]
  71. Irie, H.; Yonekawa, D.; Damiani, A.; Hoque, H.M.S.; Sudo, K.; Itahashi, S. Continuous multi-component MAX-DOAS observations for the planetary boundary layer ozone variation analysis at Chiba and Tsukuba, Japan, from 2013 to 2019. Prog. Earth Planet Sci. 2021, 8, 31. [Google Scholar] [CrossRef]
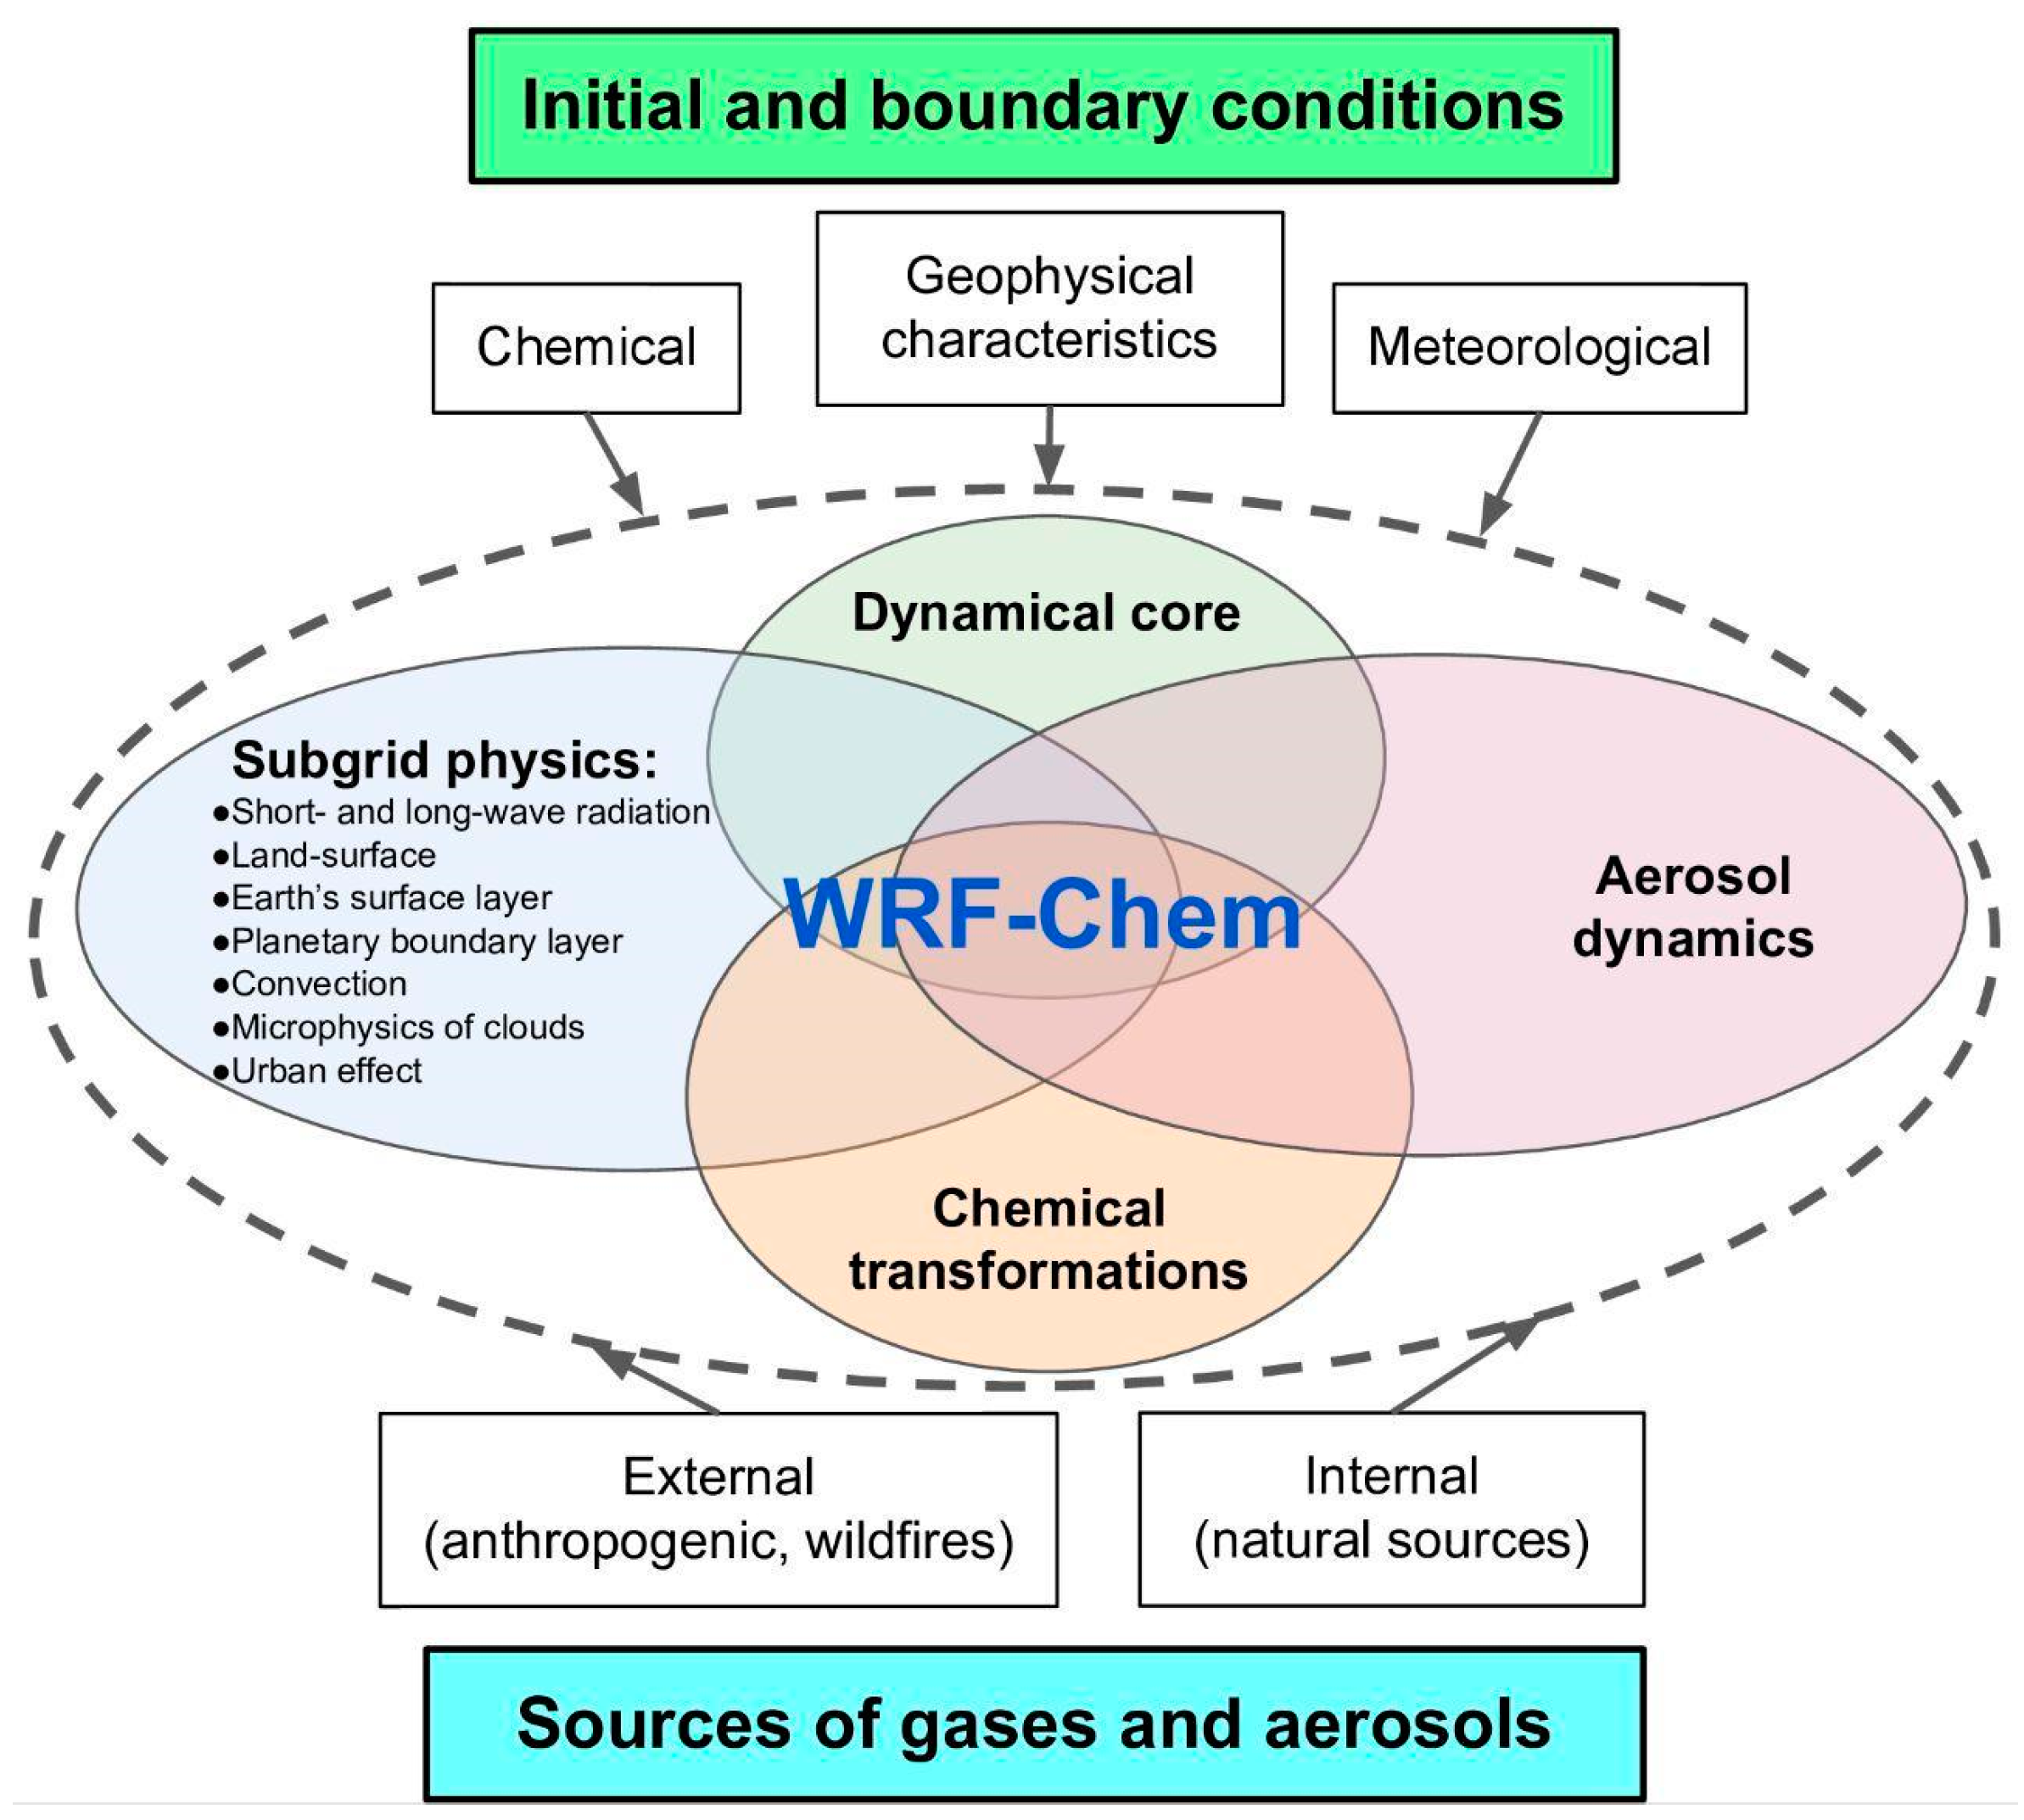
Figure 1. The flowchart of the WRF-Chem model.
Atmosphere 15 00775 g001
Figure 2. WRF-Chem modeling domain (a) with a magnified view of the Gulf of Finland (b) and terrain height in m above sea level; blue circle—Peterhof (St. Petersburg), red square—Helsinki; the different color divisions are shown in the figures.
Atmosphere 15 00775 g002
Figure 3. NOx anthropogenic emissions of St. Petersburg (green dotted line on the west) and Helsinki (blue dotted line on the east) in January 2015 according to EDGAR v5.0; white circles depict the locations of the measurement stations.
Atmosphere 15 00775 g003
Figure 4. Monthly mean differences between near-surface air temperature (a), wind speed (b) and wind direction (c) according to measurements and WRF-Chem modeling in St. Petersburg (2018–2019) and Helsinki (2016–2019); color shading depicts confidence intervals at the 95% confidence level.
Atmosphere 15 00775 g004
Figure 5. Mean diurnal variations in NSOC and PBLH in St. Petersburg (a) and Helsinki (b) for the 2016–2019 period according to observations (NSOC), WRF-Chem modeling (NSOC and PBLH) and the ERA5 reanalysis (PBLH); the yellowish shading indicates the average nighttime during a year (the Sun below the horizon).
Atmosphere 15 00775 g005
Figure 6. Mean diurnal variations in NSOC for different seasons (winter—(a), spring—(b), summer—(c) and autumn—(d)) in St. Petersburg (left) and Helsinki (right) for 2016–2019 according to ground-based observations and WRF-Chem modeling; color shading depicts confidence intervals at the 95% confidence level; DJF—winter, MAM—spring, JJA—summer, SON—autumn.
Atmosphere 15 00775 g006aAtmosphere 15 00775 g006b
Figure 7. The mean seasonal variations in NSOC in St. Petersburg (left) and Helsinki (right) for 2016–2019 during the all day (a), morning–afternoon (b) and evening–night (c) hours according to ground-based observations and WRF-Chem modeling; color shading depicts confidence intervals at the 95% confidence level.
Atmosphere 15 00775 g007aAtmosphere 15 00775 g007b
Figure 8. Mean diurnal variations in the near-surface concentrations of O3 and NO2 in Helsinki for 2016–2018 according to the observations and WRF-Chem modeling (a) and separately for summer and winter according to the observations only (b); color shading indicates the 95% confidence intervals.
Atmosphere 15 00775 g008
Figure 9. Histograms of the TrOC in the 0–8 km layer at the SPbU station in St. Petersburg for the 2016–2019 period obtained by hourly FTIR observations and the WRF-Chem model ((a)—original, (b)—smoothed).
Atmosphere 15 00775 g009
Figure 10. Seasonal variation in the TrOC in the 0–8 km layer at the SPbU station for the 2016–2019 period obtained by the FTIR method and the WRF-Chem model; color shading indicates the 95% confidence intervals.
Atmosphere 15 00775 g010
Figure 11. The MDs (a) and SDDs (b) between the hourly TrOC obtained via the FTIR method and the WRF-Chem model at St. Petersburg for the 2016–2019 period; the whiskers indicate the 95% confidence intervals.
Atmosphere 15 00775 g011
Figure 12. Vertical profiles of the mean zonal distributions of the O3 (a) and NO2 (b) mixing ratios for the 2016–2019 period according to WRF-Chem modeling.
Atmosphere 15 00775 g012
Figure 13. Zonal distribution of the vertical profiles of the correlation coefficients of O3 with NO2 (a) and with HCHO (b) for the 2016–2019 period according to WRF-Chem modeling.
Atmosphere 15 00775 g013
Figure 14. Mean zonal distribution of FNR (HCHO/NO2) for January–December (al) of 2016–2019 according to the WRF-Chem modeling.
Atmosphere 15 00775 g014aAtmosphere 15 00775 g014b
Figure 15. Vertical profiles of correlation coefficients between O3 and its precursors (NO2 and HCHO) at St. Petersburg for 2016–2019 according to the WRF-Chem modeling; DJF—winter, MAM—spring, JJA—summer, SON—autumn; the vertical axis has a logarithmic scale.
Atmosphere 15 00775 g015
Figure 16. The same as in Figure 15 but for Helsinki.
Atmosphere 15 00775 g016
Table 1. Main parameters of the WRF-Chem simulation; hor. res—horizontal resolution.
ParameterDescription
Horizontal extent and resolution960 × 960 km2, 10 km
Dynamical, chemical and
photochemical time steps
1, 10, 30 min
Vertical resolution25 hybrid levels,
from the surface up to 50 hPa
Initial and boundary conditionsMeteorologyERA5 reanalysis,
hor.res. 0.25°,
up to ~80 km on 137 hybrid levels
ChemistryCAM-chem model data,
hor.res. 0.9 × 1.25°,
up to ~45 km on 56 hybrid levels
Emission sourcesAnthropogenic emissionsEDGARv5.0 (2015),
hor.res. 0.1°,
monthly variation
Biogenic fluxesOnline biogenic model MEGAN,
hor.res. ~1 km
Biomass burningFINN database v.2.4 and 2.5,
hor.res. ~1 km
Dust and sea saltOnline dust and sea salt emission preprocessors
Chemistry schemeMOZART
Aerosol schemeMOSAIC
Simulation period and output frequency2016–2019, 1 h
Table 3. Statistical characteristics of the differences (MD, SDD, CC) between the near-surface air temperature, wind speed and wind direction obtained via measurements and WRF-Chem modeling in St. Petersburg (2018–2019) and Helsinki (2016–2019); confidence intervals at the 95% confidence level are provided for MD and SDD.
CityParameterMDSDDCC
St. Petersburg
(2018–2019)
Air temperature, °C2.5 ± 0.052.2 ± 0.020.97
Wind speed, m/s−0.7 ± 0.021.0 ± 0.0090.76
Wind direction, °38.2 ± 0.629.3 ± 0.60.75
Helsinki
(2016–2019)
Air temperature, °C3.2 ± 0.043.5 ± 0.020.93
Wind speed, m/s−2.2 ± 0.021.7 ± 0.0090.75
Wind direction, °9.7 ± 0.543.9 ± 0.20.78
Table 4. Differences between hourly averaged NSOC ground-based in situ measurements and WRF-Chem modeling in St. Petersburg and Helsinki for 2016–2019; values in % in the “MD” and “SDD” columns are provided with respect to measured mean values of NSOC; for all MDs and SDDs, confidence intervals are provided.
CityMD, µg/m3 (%)SDD, µg/m3 (%)CC
St. Petersburg5.0 ± 0.3 (10.7 ± 0.6)28.3 ± 0.15 (60.4 ± 0.3)0.44
Helsinki24.1 ± 0.3 (43.5 ± 0.5)23.6 ± 0.14 (42.3 ± 0.25)0.52
Table 5. The same as in Table 4 but for daily averaged NSOCs.
CityMD, µg/m3 (%)SDD, µg/m3 (%)CC
St. Petersburg5.1 ± 1.1 (10.8 ± 2.3)20.4 ± 0.16 (43.6 ± 1.2)0.48
Helsinki24.1 ± 0.9 (43.5 ± 1.6)17.1 ± 0.5 (31.1 ± 0.9)0.56
Table 6. Differences between the hourly and daily averaged TrOC in the 0–8 km layer in St. Petersburg for the 2016–2019 period obtained by FTIR measurements and the WRF-Chem model; values in % are given with respect to the mean FTIR data; confidence intervals at the 95% confidence level are provided for the mean values and SDDs.
Time ScaleNumber of PairsMD, DU (%)SDD, DU (%)CC
Hour833−2.5 ± 0.2 (−8.4 ± 0.7)3.3 ± 0.1 (11.0 ± 0.4)0.64
Hour (3σ)821−2.4 ± 0.2 (−7.0 ± 0.6)3.1 ± 0.1 (10.4 ± 0.4)0.67
Day248−2.7 ± 0.4 (−9.3 ± 1.4)3.1 ± 0.09 (10.5 ± 0.3)0.68
Day (3σ)244−2.6 ± 0.4 (−8.8 ± 1.4)2.9 ± 0.2 (10.0 ± 0.8)0.71
Table 7. The same as in Table 6 but for smoothed model profiles.
Time ScaleNumber of PairsMD, DU (%)SDD, DU (%)CC
Hour833−2.9 ± 0.2 (−9.6 ± 0.7)3.1 ± 0.1 (10.5 ± 0.4)0.64
Hour (3σ)821−2.8 ± 0.2 (−9.3 ± 0.7)3.0 ± 0.1 (9.9 ± 0.4)0.68
Day248−3.1 ± 0.4 (−10.4 ± 1.3)3.0 ± 0.01 (10.1 ± 0.3)0.69
Day (3σ)244−3.0 ± 0.4 (−10.1 ± 1.3)2.9 ± 0.2 (9.7 ± 0.7)0.71
Table 8. Differences between hourly and daily averaged ozone content in the whole tropospheric layer at the SPbU station for the 2016–2019 period obtained by the FTIR method and the WRF-Chem model; values in % are given with respect to the mean FTIR data; confidence intervals at the 95% confidence level are provided for mean values and SDDs.
Time ScaleNumber of PairsMD, DU (%)SDD, DU (%)CC
Hour833−4.5 ± 0.3 (−11.8 ± 0.8)5.0 ± 0.2 (13.1 ± 0.5)0.66
Hour (3σ)808−4.1 ± 0.3 (−10.7 ± 0.8)4.5 ± 0.2 (11.7 ± 0.5)0.70
Day248−4.8 ± 0.6 (−12.8 ± 1.6)4.8 ± 0.1 (12.8 ± 0.4)0.69
Day (3σ)239−4.4 ± 0.5 (−11.6 ± 1.3)4.3 ± 0.3 (11.4 ± 0.9)0.74
Table 9. The same as in Table 8 but for smoothed modeled profiles.
Time ScaleNumber of PairsMD, DU (%)SDD, DU (%)CC
Hour833−4.7 ± 0.3 (−12.4 ± 0.8)4.1 ± 0.2 (10.8 ± 0.4)0.72
Hour (3σ)807−4.4 ± 0.3 (−11.5 ± 0.8)3.8 ± 0.1 (9.8 ± 0.4)0.76
Day248−5.0 ± 0.5 (−13.3 ± 1.3)4.0 ± 0.1 (10.6 ± 0.3)0.75
Day (3σ)238−4.6 ± 0.5 (−12.3 ± 1.3)3.6 ± 0.3 (9.5 ± 0.7)0.79
Disclaimer/Publisher’s Note: The statements, opinions and data contained in all publications are solely those of the individual author(s) and contributor(s) and not of MDPI and/or the editor(s). MDPI and/or the editor(s) disclaim responsibility for any injury to people or property resulting from any ideas, methods, instructions or products referred to in the content.