1. Introduction
The ionosphere is the ionized portion of the Earth’s upper atmosphere, where a large number of free electrons is present, which affects the radio waves propagating through it. Modeling the electron density of the ionosphere has been a long-standing topic for researchers across the world. Due to the limitation of geographical location, it is difficult to deploy fixed ionospheric observation equipment at the sea, which leads to insufficient ionospheric observation data over sea areas. However, ship positioning and communication will be affected by ionospheric perturbation, so more ionospheric observation means are needed for the ocean region. By using AIS signals, we can obtain electron density information over the ocean area, which can provide auxiliary information for the improvement of the global electron density model, and long-term observations and research into ionosphere variation over ocean areas can also provide a guarantee for maritime communication.
Computerized ionospheric tomography (CIT) has been an effective method for reconstructing the three-dimensional structure of ionospheric electron density since Austen first introduced computerized tomography to ionospheric observation. They demonstrated the feasibility of computerized tomography in 2D electron density reconstruction by simulating STECs along a polar-orbiting satellite and five and three ground stations [
1]. Researchers have further developed this technique for electron density reconstruction in the ionosphere using various measured data to improve reconstruction quality [
2,
3,
4]. T. D. Raymund et al. validated the computerized tomography technique using measured data to reconstruct 2D electron density over a region with 57–73° latitude [
2]. P. A. Bernhard et al. proposed utilizing GPS satellite occultations and extreme ultraviolet (EUV) observations to provide horizontal integration path information, thereby enhancing the accuracy of CIT [
3]. J. Kong et al. proposed an improved CIT model by fusing 3D multisource ionospheric data to study the evolution of magnetic storms [
4]. In the early stage, only signals from polar-orbiting satellites could be used; therefore, the signal rays could only be in the latitude–altitude plane, and the electron density could only be reconstructed on the latitude–altitude plane. The three-dimensional CIT was not realized until the advent of global position satellites (GPSs), when the selection of ground station became more flexible [
5,
6,
7], and CIT has become more popular in ionospheric research since then. G. A. Hajj et al. conducted ionospheric imaging using a global positioning system (GPS) and low earth orbit (LEO) satellites [
5]. A new method based on a residual minimization training neural network (RMTNN) was reported by X. F. Ma et al. to reconstruct 3D electron density distribution using GPS and ionosonde observation data [
6]. More research about the development of voxel-based computerized ionospheric tomography (CIT) technology based on global navigation satellite system (GNSS) ground receivers was introduced by Lu W. et al. [
7].
Algebraic reconstruction technology (ART) [
2,
8] and multiplicative algebraic reconstruction technology (MART) [
9,
10] are voxel-based methods that always adopt iterative reconstruction algorithms, and both are widely used techniques in CIT [
11]. In both ART and MART iteration process, the coefficient matrix and the initial value of electron density are two main factors that can affect the achievement of CIT. From the point of view of the iterative formula, all attempts to achieve better 3D CIT are aimed at improving the rank of the coefficient matrix and the initial value.
The coefficient matrix is a matrix of interception length of every signal ray in every voxel within the reconstruction area, and it usually is low-ranked, which will cause the ill-posed problem in CIT [
12]. Numerous studies seeking to find more effective signal sources, except for the most-used GNSS signals received by the ground-based receivers, have been performed to raise the rank of the coefficient matrix to further improve the accuracy of CIT [
4]. H. Zhao utilized diverse data sources including tri-frequency beacon signals to improve the accuracy of CIT [
13]. C. Wang proposed that the use of PolSAR signal data can better reconstruct the electron density, and this method improves resolution and does not require extra ground-based receiving stations, which significantly reduces the cost of ionospheric detection [
14,
15]. A. C. Cushley investigated the use of shipborne AIS and airborne ADS-B data received by receivers loaded on GNSS to realize 2D CIT, which was a brand-new idea for effective signal sources [
16,
17]. Global navigation satellite system (GNSS) signals implemented by low-earth-orbit (LEO) satellite constellation signals were applied for ionospheric tomography by X. Ren to obtain more effective data for three-dimensional ionospheric electron density reconstruction [
18].
Inspired by the above researchers’ work on improving the rank of the coefficient matrix, we turn our attention to small-satellite constellations operating in low orbit. The number of global small-satellite launches has increased explosively in recent years, and small satellites have the advantage of being flexible and cost-effective [
19]. Moreover, small satellites that can be operated as constellations contain more than one small satellite to achieve more powerful functionality and broader coverage. Considering these advantages, we try to utilize a small-satellite system carrying AIS receivers as the signal source for 3D CIT over ocean areas.
As for the initial electron density applied in CIT, the electron density obtained using the international reference ionosphere (IRI) model [
20] is the most used for the ART and MART iteration algorithms. During the iteration process, the initial electron density value in the voxels without any traversing signal rays will remain unchanged during the iteration process both in ART and MART. Thus, in the CIT process, the reconstructed electron density in voxels without signal rays depends totally on the initial value. The weighted international reference ionosphere 1995 (IRI-95) is used as the initial guess to solve the sparse problem in the CIT process [
21]. E. Yavuz applied the electron density calculated by the total-least-squares (TLS) algorithm as the input of the ART to achieve more accurate results compared to the reconstruction result obtained by only ART or only TLS [
22]. Considering the advantage of the truncated singular value decomposition (TSVD) method for CIT—that no prior values are needed and whose result is an approximation of the real electron density—D. Wen combined TSVD and MART to solve the ill-posed problem in 3D CIT. They utilized the TSVD result as the initial value for the ART iteration [
23,
24]. C. Wang used the total electron content (TEC) obtained by the spaceborne full-polarization synthetic aperture radar (PolSAR) to correct the Empirical Canadian High Arctic Ionospheric Model (E-CHAIM), to improve the authenticity of the initial n
e for MART [
25]. With the develop of machine learning techniques, a neural network (NN) was applied by T. Hu to obtain high-precision initial ionospheric electron density for computerized ionospheric tomography (CIT), and better ionospheric electron density was reconstructed using IRI-2020 as the initial guess than using CIT [
26]. All these methods of optimizing the initial electron density improve the accuracy of CIT, and it can be inferred that the evaluation and optimization of initial electron density is necessary for CIT.
An adjustment factor
is proposed in this paper to evaluate and optimize the initial n
e obtained by the IRI-2020; this method is introduced and validated in
Section 2 and
Section 4, along with comparisons of CIT at different times with different
. The position of ships installing AIS and the small-satellite constellation orbit are discussed in
Section 3. The conclusions are drawn in
Section 5.
2. Methodology
Radon proved that a 2D continuous function can be reconstructed from the data of an infinite number of projections of that function, and this function can be expanded to 3D. Radon transformation and its inverse transformation theory laid the mathematical foundations of CIT [
27].
In the CIT process, the 3D electron density in the reconstructed area is regarded as the 3D continuous function, and the measured STEC along signal rays passing through the ionosphere is treated as the data of a number of projections in Radon transformation. The CIT process reconstructs the electron density corresponding to the inverse transformation of Radon transformation.
In this paper, the STEC along the small-satellite and AIS signal path can be written as:
where
is the electron density at the location
, and
is the step length of the integral signal path.
The iterative reconstruction algorithm is a voxel-based solution for CIT and a method for solving a linear equation set in the image reconstruction theory, and MART is one of the widely used voxel-based techniques. The discrete form of Equation (1) should be applied to obtain a voxel-based solution.
The slant total electron content (STEC) along a signal ray is the summation of multiplications of the lengths of the transversing path and the electron densities in corresponding voxels. The discrete form of Equation (1) can be written as follows [
1]:
where
m is the number of rays passing through the reconstruction region and
n is the number of voxels dividing the reconstructed region.
is the measured STECs along the signal rays. The vector
ne is the electron density matrix in every voxel with a size of
n × 1.
A is the coefficient matrix of the rays transversing the reconstruction region with size
m ×
n,
A(
i,
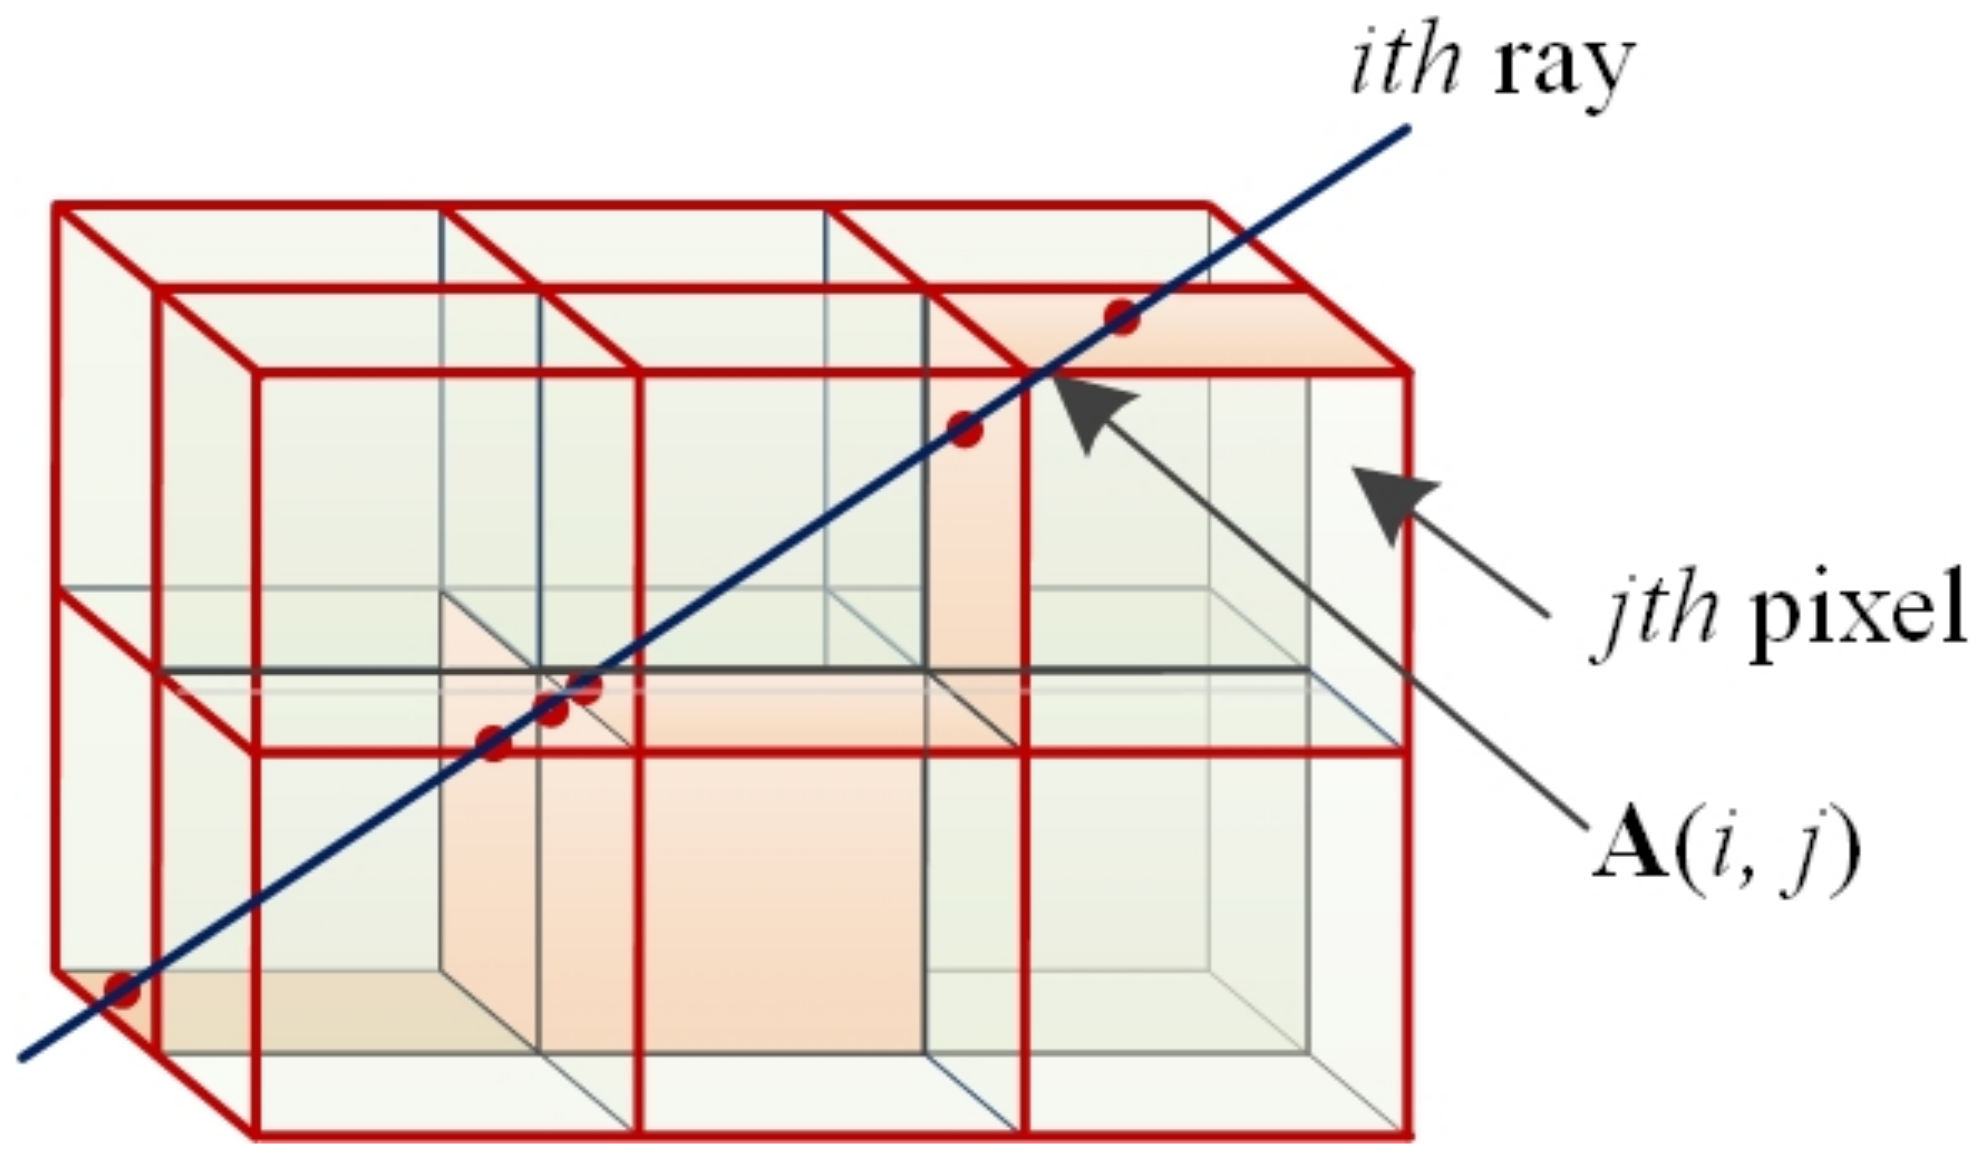
j) denotes the interception length of the
ith ray in the
jth voxel, as shown in
Figure 1, and
A is determined by the voxel size inside of the reconstructed area. The column vector
e is related to the discretization errors and measurement noises, which are ignored in our simulation.
Figure 1 shows a 3D view of a signal ray transversing the reconstruction voxels; the red dots are the puncture points in the interfaces made by a signal ray. The planes in light blue are not transversed by any signal rays. The distance between two adjacent puncture points is the coefficient in the voxel where the two points are, as shown by the longer arrow line in
Figure 1. The coefficient of voxels without any transversing rays, such as the lower right one in
Figure 1, is zero. The electron density in such voxels remains unchanged during the MART process; thus it remains the initial electron density. Therefore, the accuracy of the initial determines the reconstruction quality, especially for voxels without transversing signal rays.
The iteration algorithm in MART is written as:
where
λk is the relaxation factor, often set to be a fixed value in the MART reconstruction, and it ranges from 0 to 1; in this paper, it is set to be 0.5 in the MART process.
λk determines the accuracy and the smoothness of the reconstructed electron density [
24].
The MART is a process in which the reconstructed electron density ne is progressively improved during the iterations, so the STEC calculated by the iterated ne will be infinitely close to the measured data. The process of MART reconstruction is as follows:
Assume a set of initial electron density values ne(0) and bring it into the iterative formula to obtain the first set of iterative electron densities ne(1);
Set ne(1) as the input of the second iteration and bring it into the iterative formula to obtain ne(2);
- 3.
Set the result of ne(k) as the input of the k + 1th iteration and repeat step 2 to obtain ne(k+1) until the preset conditions are satisfied. The preset conditions here could be a preset iteration time k, the deviation between ne(k) and ne(k+1) could be smaller than a given value, or other conditions could be used to evaluate the equality of ne(k+1).
MART is an entropy optimization algorithm, and the iteration formula is in the multiplication form so that the output ne(k) could remain positive. inside the round brackets, which can be denote as , is the ratio of measured STEC to the iterated STEC, and is regarded as the modification of toward the real ne.
The selection of the initial value can affect the accuracy of CIT, and theoretically, the closer the initial value is to the true value, the more accurate the results are. When no measured data are available, the electron density data in the IRI model can be used as aforementioned. After the initial value is determined, it is brought into the iterative formula in Equation (2), and we repeat step 2 for the iterative calculation of CIT.
In this paper, the STECs on the small-satellite constellation and AIS paths are applied to obtain an initial ionospheric electron density (IED) for MART that is closer to the true IED. An adjustment factor δ, defined as the mean ratio between the measured
STEC and the
STEC, calculated using the coefficient matrix A and the initial electron density, is written as:
then, the modified initial IED is adjusted by multiplying by
, as follows:
The adjustment factor causes an overall change in the initial electron density ne(0) to make it close to the true electron density. To make a distinction between the two methods with different initial IEDs, we denote the original method by MART0 and the new method by MART1. In MART1, two more steps containing the calculation of using Equation (3) and the optimization of ne(0) using Equation (4) are added to the MART process after the ne(0) is selected.
3. AIS and Small-Satellite Constellation Configurations
Small-satellite constellations allow for the further exploitation of space, and the vastness of space makes small-satellite constellations flexible in deployment. Currently, Starlink itself has more than 3000 satellites in orbit, which can provide network connectivity around the world, including ships operating at sea. This also provides the opportunity to perform ionospheric observation over sea areas. By using the AIS signals received by small-satellite constellations, we can calculate the STEC on the signal rays, and in the lanes with dense ships, we can reconstruct the electron density by applying the above STECs, which can provide data support for global electron density modeling and the design of maritime communication links.
The global distribution of transient vessels is shown in
Figure 2.
Global ship distribution is shown in
Figure 2, and it can be seen that in the Atlantic region, ships are most densely distributed between the Americas, Europe and Africa. This is followed by the shipping lanes of the Indian Ocean, which surround the Malaysian Islands and the vicinity of Australia. Because the Pacific Ocean is so vast, ships sailing in it exhibit a distinct distribution along shipping lanes. In addition to the offshore areas, there is also a denser distribution of ships in the shoreline harbors, which can provide better imaging opportunities.
The region we chose for the electron density inversion is located in the Indian Ocean, with a latitude range of 1.1–5.1° N and a longitude range of 82.2–86.2° E. The resolutions in both latitude and longitude directions are 0.25°.
For small-satellite constellations, taking Starlink as an example, its real-time satellite latitude and longitude positions are shown in
Figure 3. The black dots in the figure show the real-time positions of the satellites, from which it can be seen that Starlink is densely distributed between the north mid-latitude and south latitude, which can well cover the densely distributed areas of the ships in
Figure 2, providing more effective rays for the layered 3D reconstruction of ionospheric electron density.
In this paper, we use a small-satellite constellation containing four satellites to perform electron density inversion for the above maritime regions. The four satellites are distributed at different orbits to obtain more access rays, and the four satellites are distributed equidistantly for a more even distribution of signal rays. We set the orbit altitude of the small satellites to about 1170 km, referring to the orbit height of Starlink satellites, and the rays can pass through the whole ionospheric region below 1000 km.
A small-satellite constellation is a distributed-satellite system, and we set the AIS receivers on a small-satellite constellation with four small satellites to perform CIT (
Figure 4).
The electron density reconstruction altitude range is set to be 100–1000 km with an altitude resolution of 25 km because the ionosphere electron distributed mainly in this altitude range.
We counted more than 100 ships in the 6° × 6° latitude-longitude range in the dense ship lanes in the real-time ship distribution maps. Thus, we assume there are 100 shipborne AIS transmitters in the projection ocean area of the reconstruction area in the latitude–longitude plane.
The STECs along the AIS four small-satellite signal rays are used to perform the electron density reconstruction. We simulated and reconstructed the electron density distributions at 00:00, 06:00, and 12:00 in this area with such a distribution of receivers and ships, and we analyzed the performance of CIT over the seas.
We assume that the satellite and the ship have the same position at the three times mentioned above. In fact, it is possible to satisfy the coverage of the voxels in the reconstruction areas if there are enough small satellites carrying AIS receivers at different moments, or if we design a suitable constellation of small-satellite orbits to pass through our area at all three times. We can also assume different constellations of small satellites at different moments to achieve coverage of the area to be reconstructed.
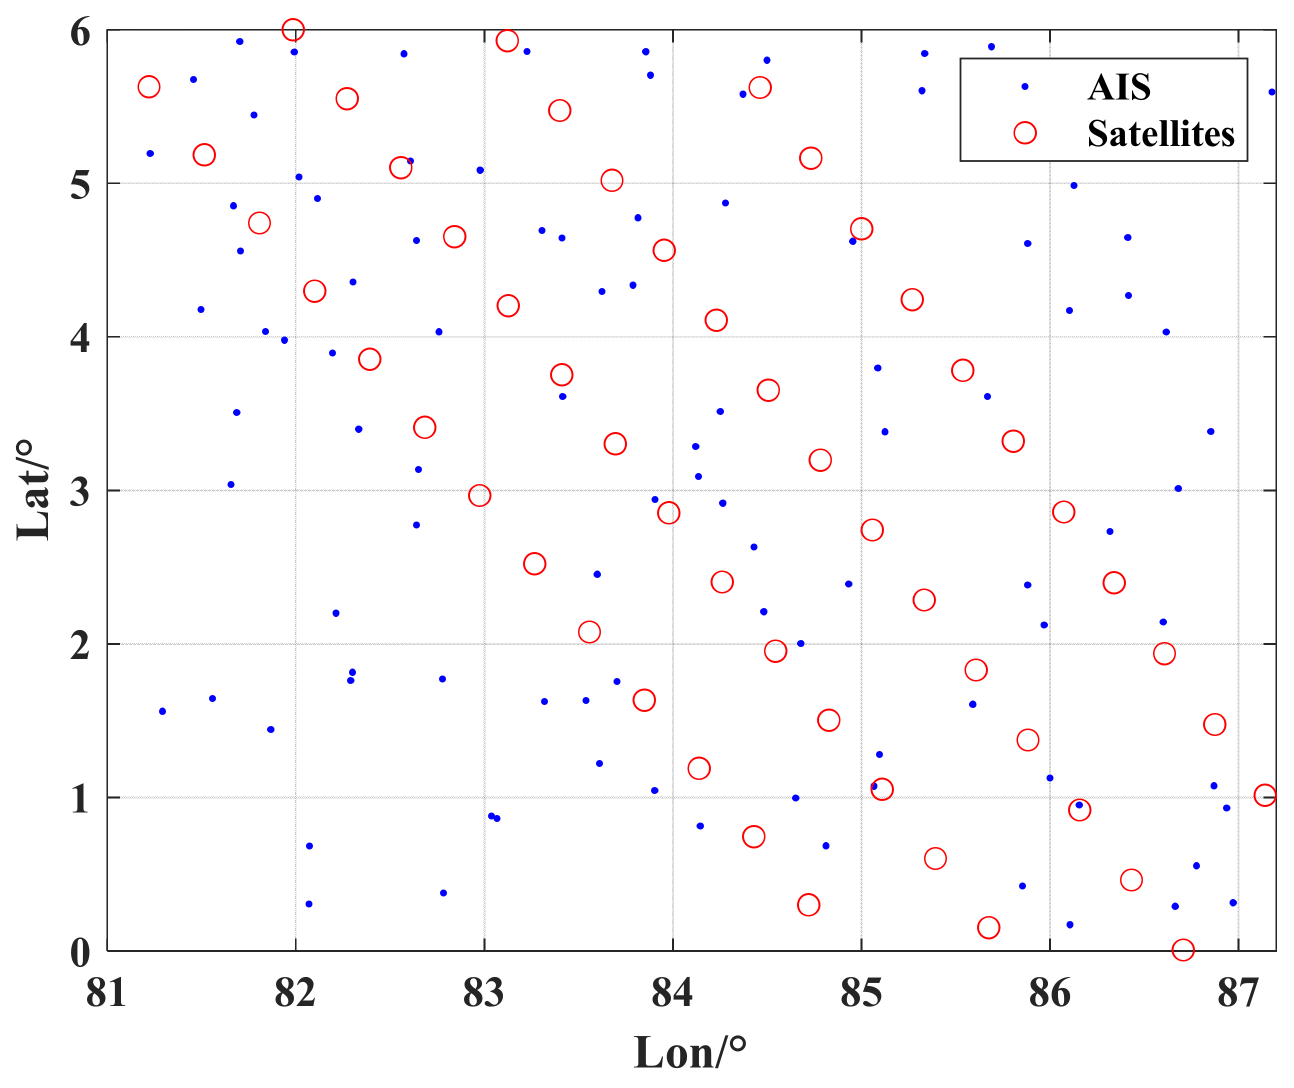
The distribution of small satellites and AIS-installed ships are shown in
Figure 5.
The distribution area of AIS-carrying ships is set to be over the sea, and it is assumed to be a naval congested area on the ship channel; therefore, there is a good opportunity for CIT.
There are two kinds of AIS transponders installed on different ships: Class A transponders, with a broadcast period of 2 to 10 s, and Class B transponders, with a broadcast period of 30 s or 3 min for different ship traveling speeds [
30].
A Class A transponder is chosen in this study, and the signal sampling interval is 10 s with a duration of 3 min in the simulation, during which the ionosphere is regarded as unchanged. Under this assumption, within the reconstruction area we set, we can obtain 2375 effective signal rays through the area, and 89.6% of the voxels can be transversed by the small-satellite constellation–AIS signal rays.
4. Result and Discussion
The 3D electron densities at 00:00, 6:00 and 12:00 on 15 March 2022 are reconstructed by MART0 and MART1. The 3D background electron densities at different times are obtained by the IRI-2020 [
20], and they are used as the background ionospheric electron density for the calculation of STEC in the simulation.
The average deviation (AD) and root-mean-square error (RMSE) are used to evaluate the reconstruction accuracy, which are written as follows:
here,
and
are the electron density reconstructed by CIT and the background electron density, respectively.
and
are the reconstructed and the background electron density in the
ith voxel, respectively, and
n is the total number of voxels.
4.1. Comparison of Reconstructed Electron Density at 00:00, 06:00 and 12:00
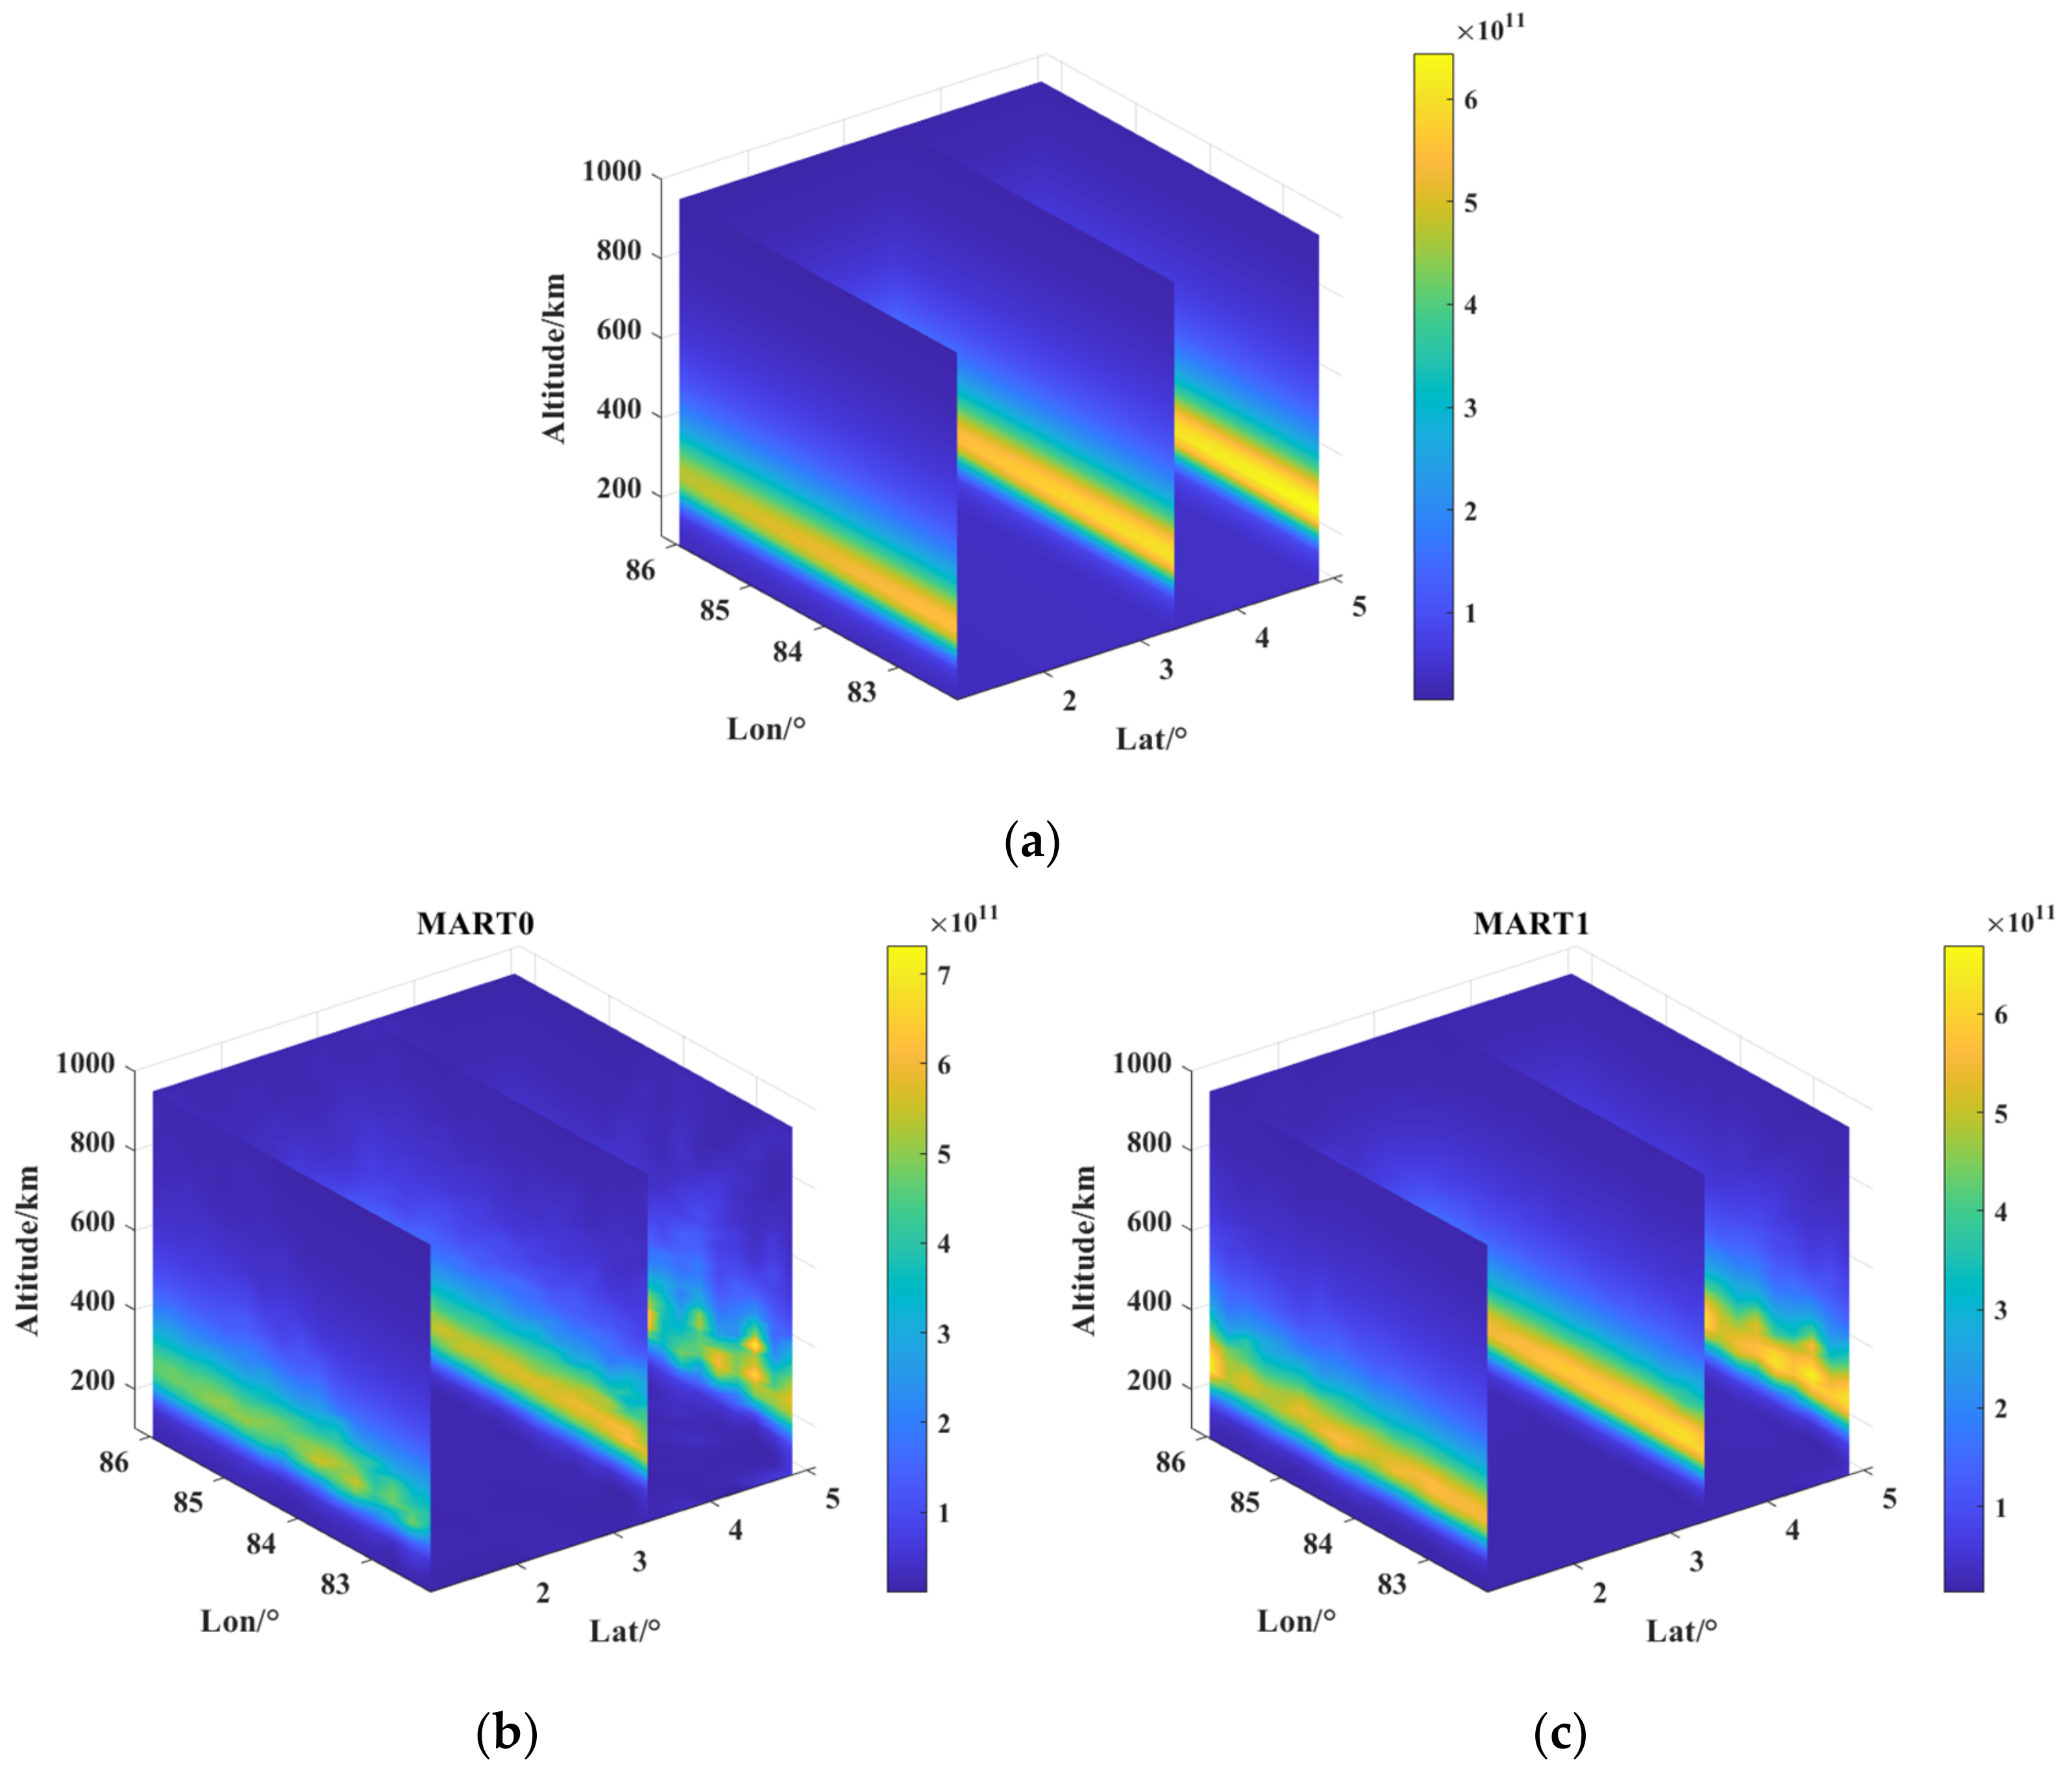
As is shown in
Figure 6a, the electron density increases with altitude to the maximum at about 300 km of the F layer in the ionosphere; then, it decreases with altitude, which is a common p. For a given longitude–altitude plane, the electron density does not change much at the latitude–longitude plane, but this is not the same with the reconstructed IED by MART0 in
Figure 6b. The electron density obtained by MART1 shown in
Figure 6c is more similar to the background electron density both in the peak value and in the variation trend in three dimensions of the 3D ionospheric electron density. As is shown in the 3D image, it can be inferred that the reconstructed electron density obtained using MART1 is better.
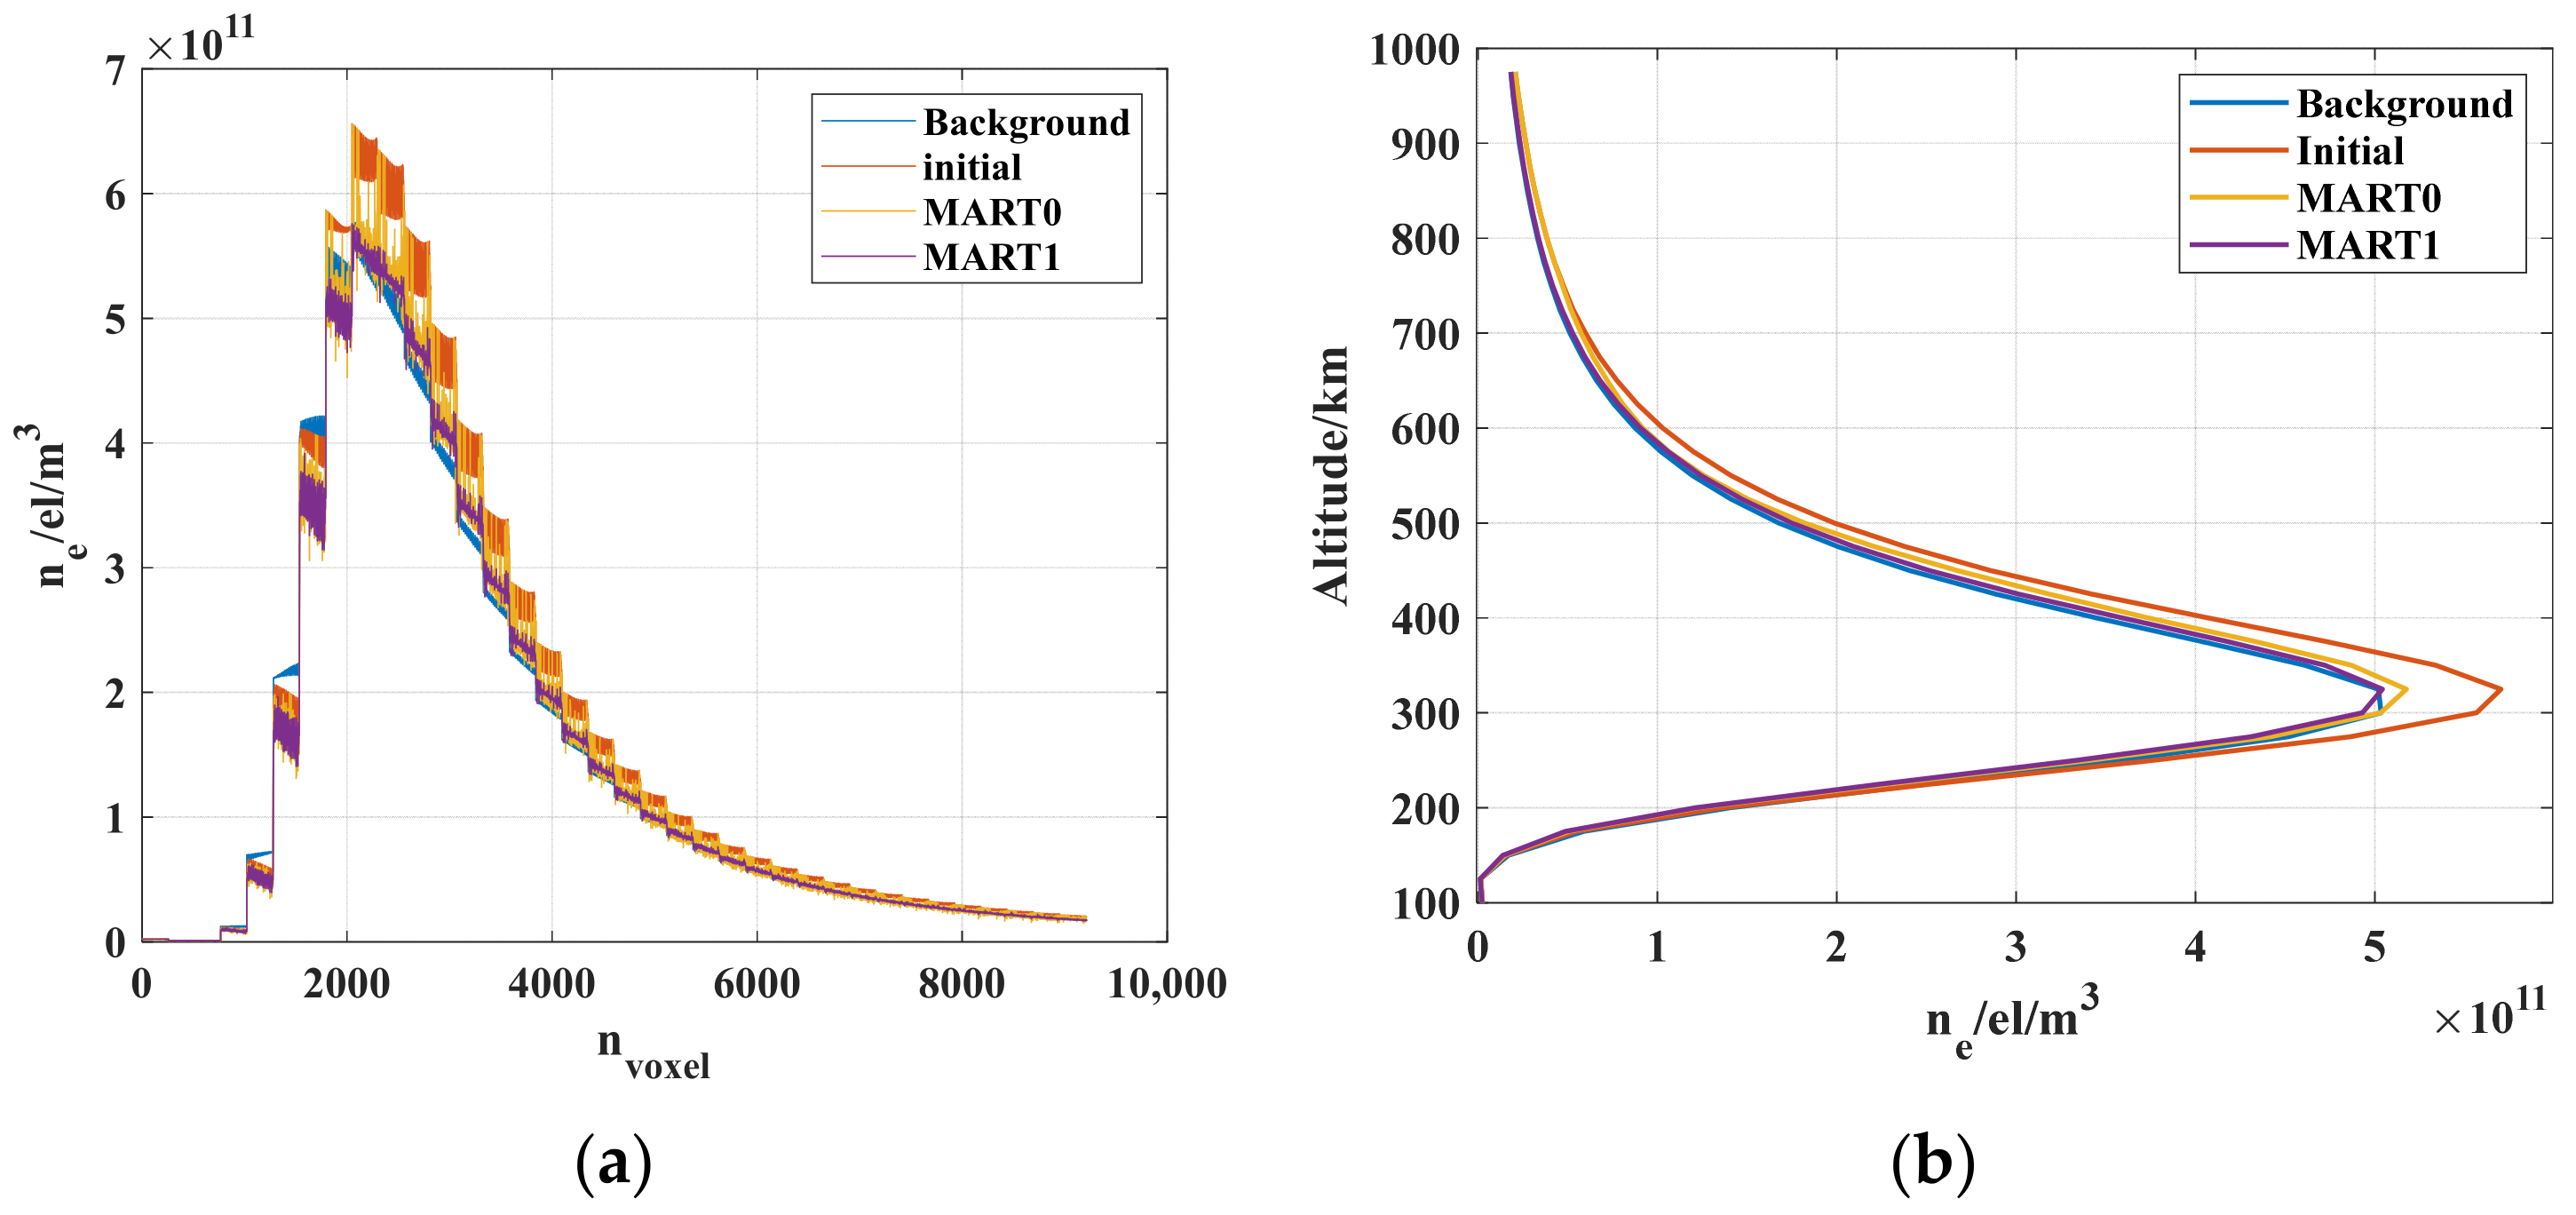
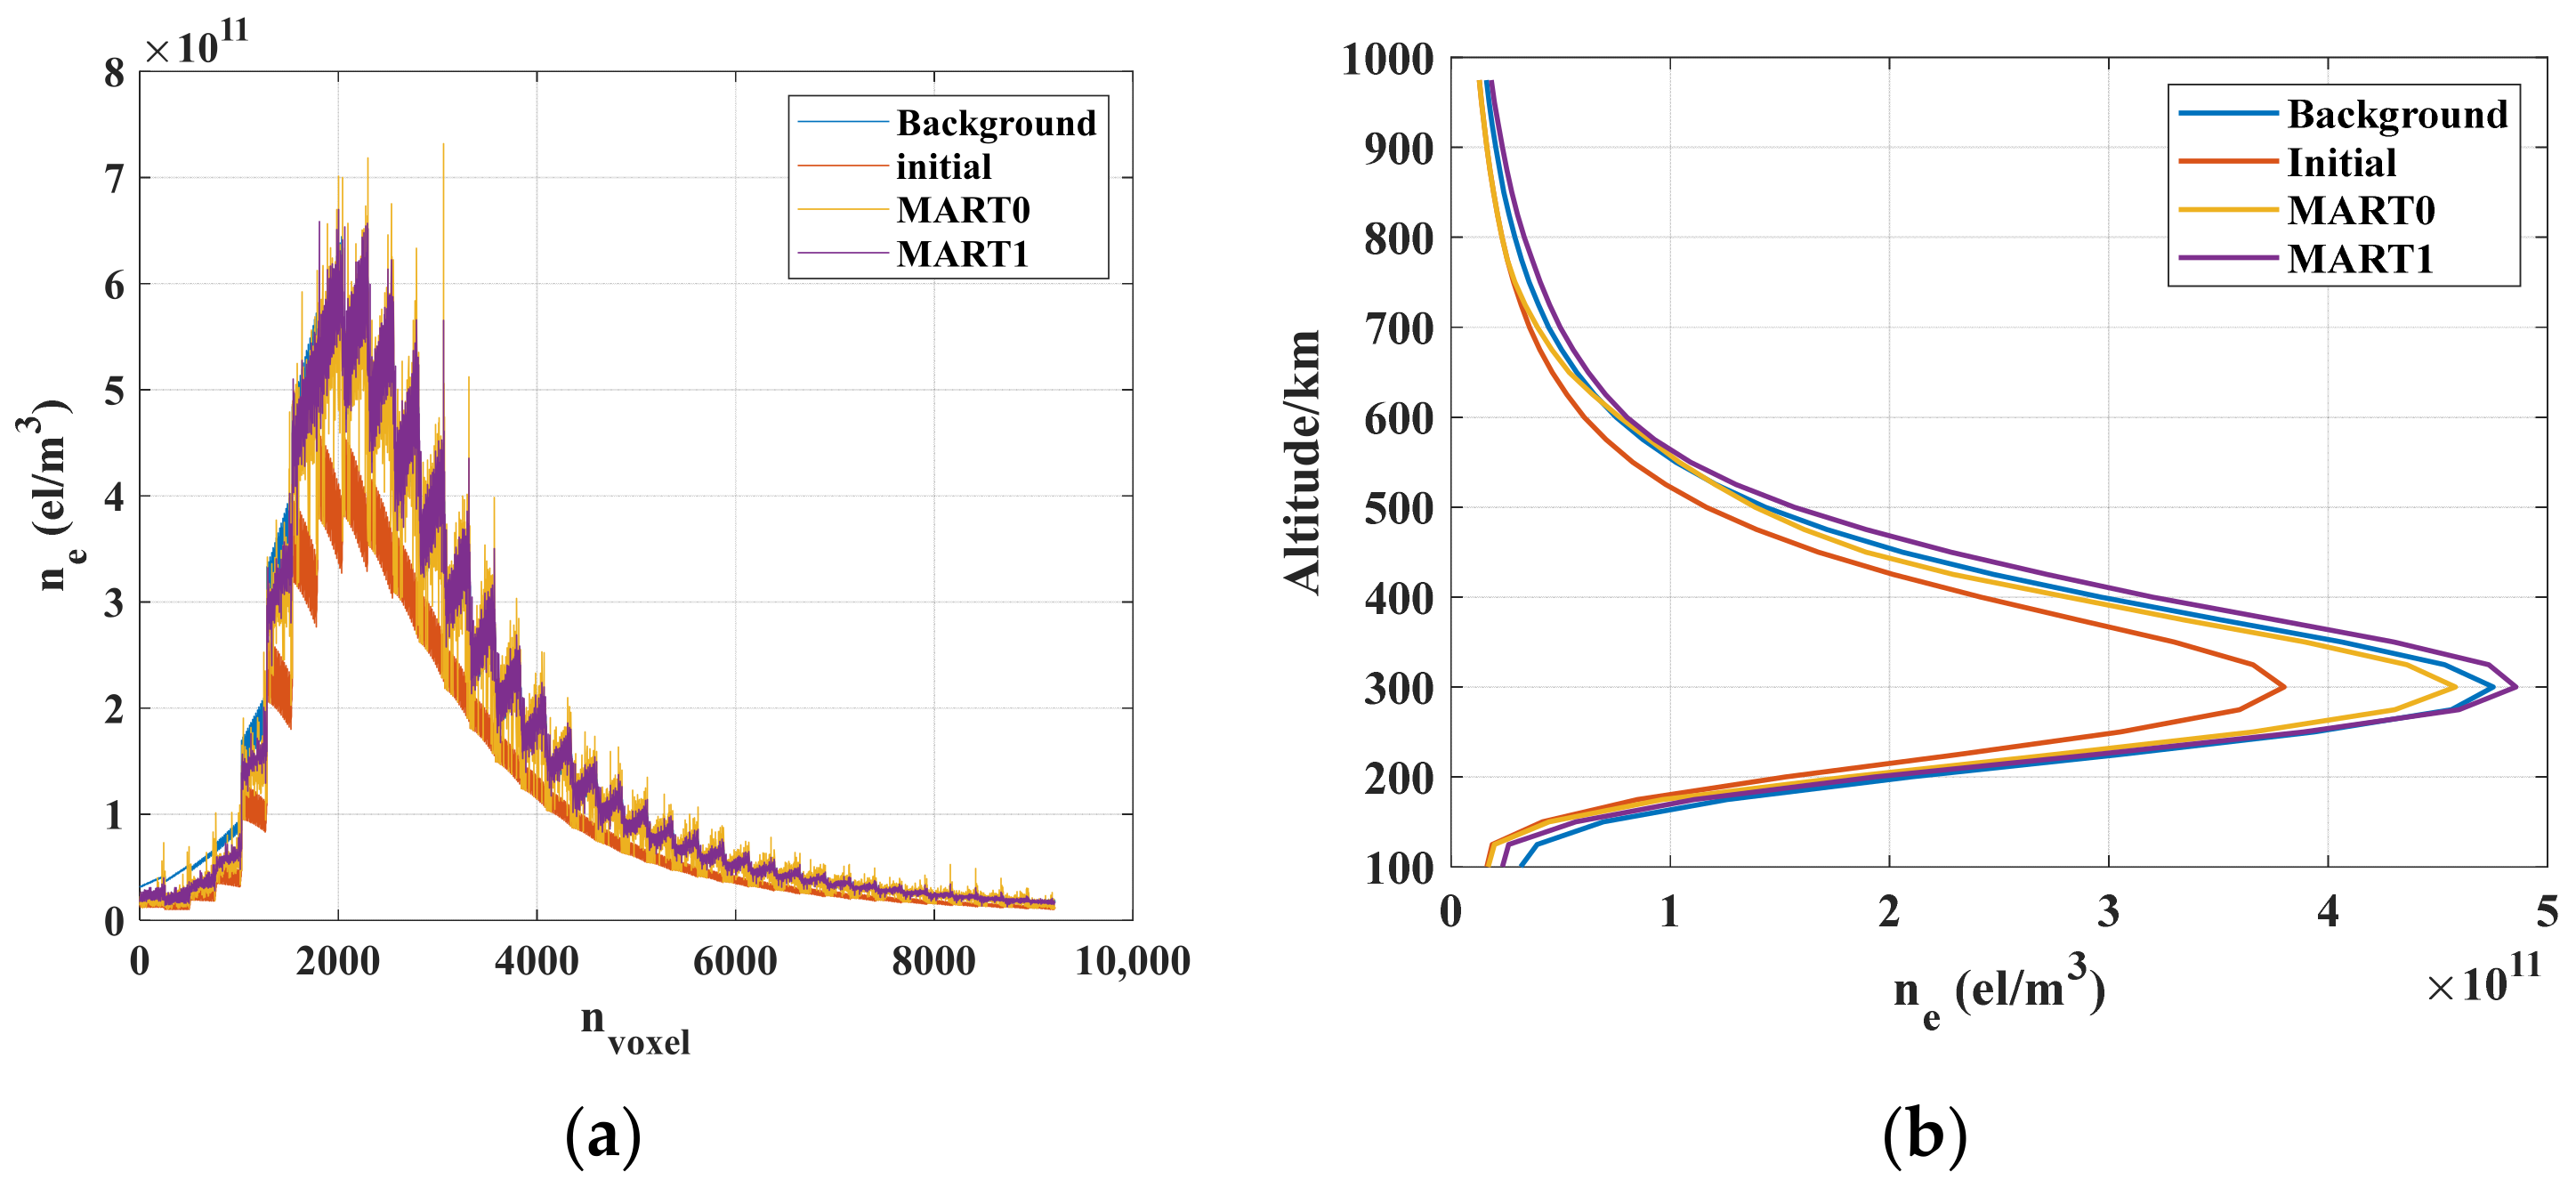
In order to more visually compare the electron density reconstructions within all voxel curves in the IED in all voxels of the background, the initial and reconstructed IEDs applying MART0 and MART1 are shown in
Figure 7a, and the curves in
Figure 7b show a profile of the IED at the same fixed spot of the above IEDs in the same order as curves in
Figure 7a. The transformation of the 3D electron density to the 1D electron density can be seen in
Figure 7a in the order of height; the clusters represent the electron density of a latitude–longitude plane at the same altitude. Thus, taking an overall view of
Figure 7a, the horizontal axis represents the height in large scale.
As can be inferred, the MART1 reconstructed IED is more similar to that of the background in both figures. The Ads of MART0 and MART1 are 1.0973 × 10¹⁰ and 9.1450 × 10⁹, and the RMSEs are 1.9595 × 10¹⁰ and 1.6653 × 10¹⁰, respectively. Therefore, a better reconstruction result is achieved by MART1.
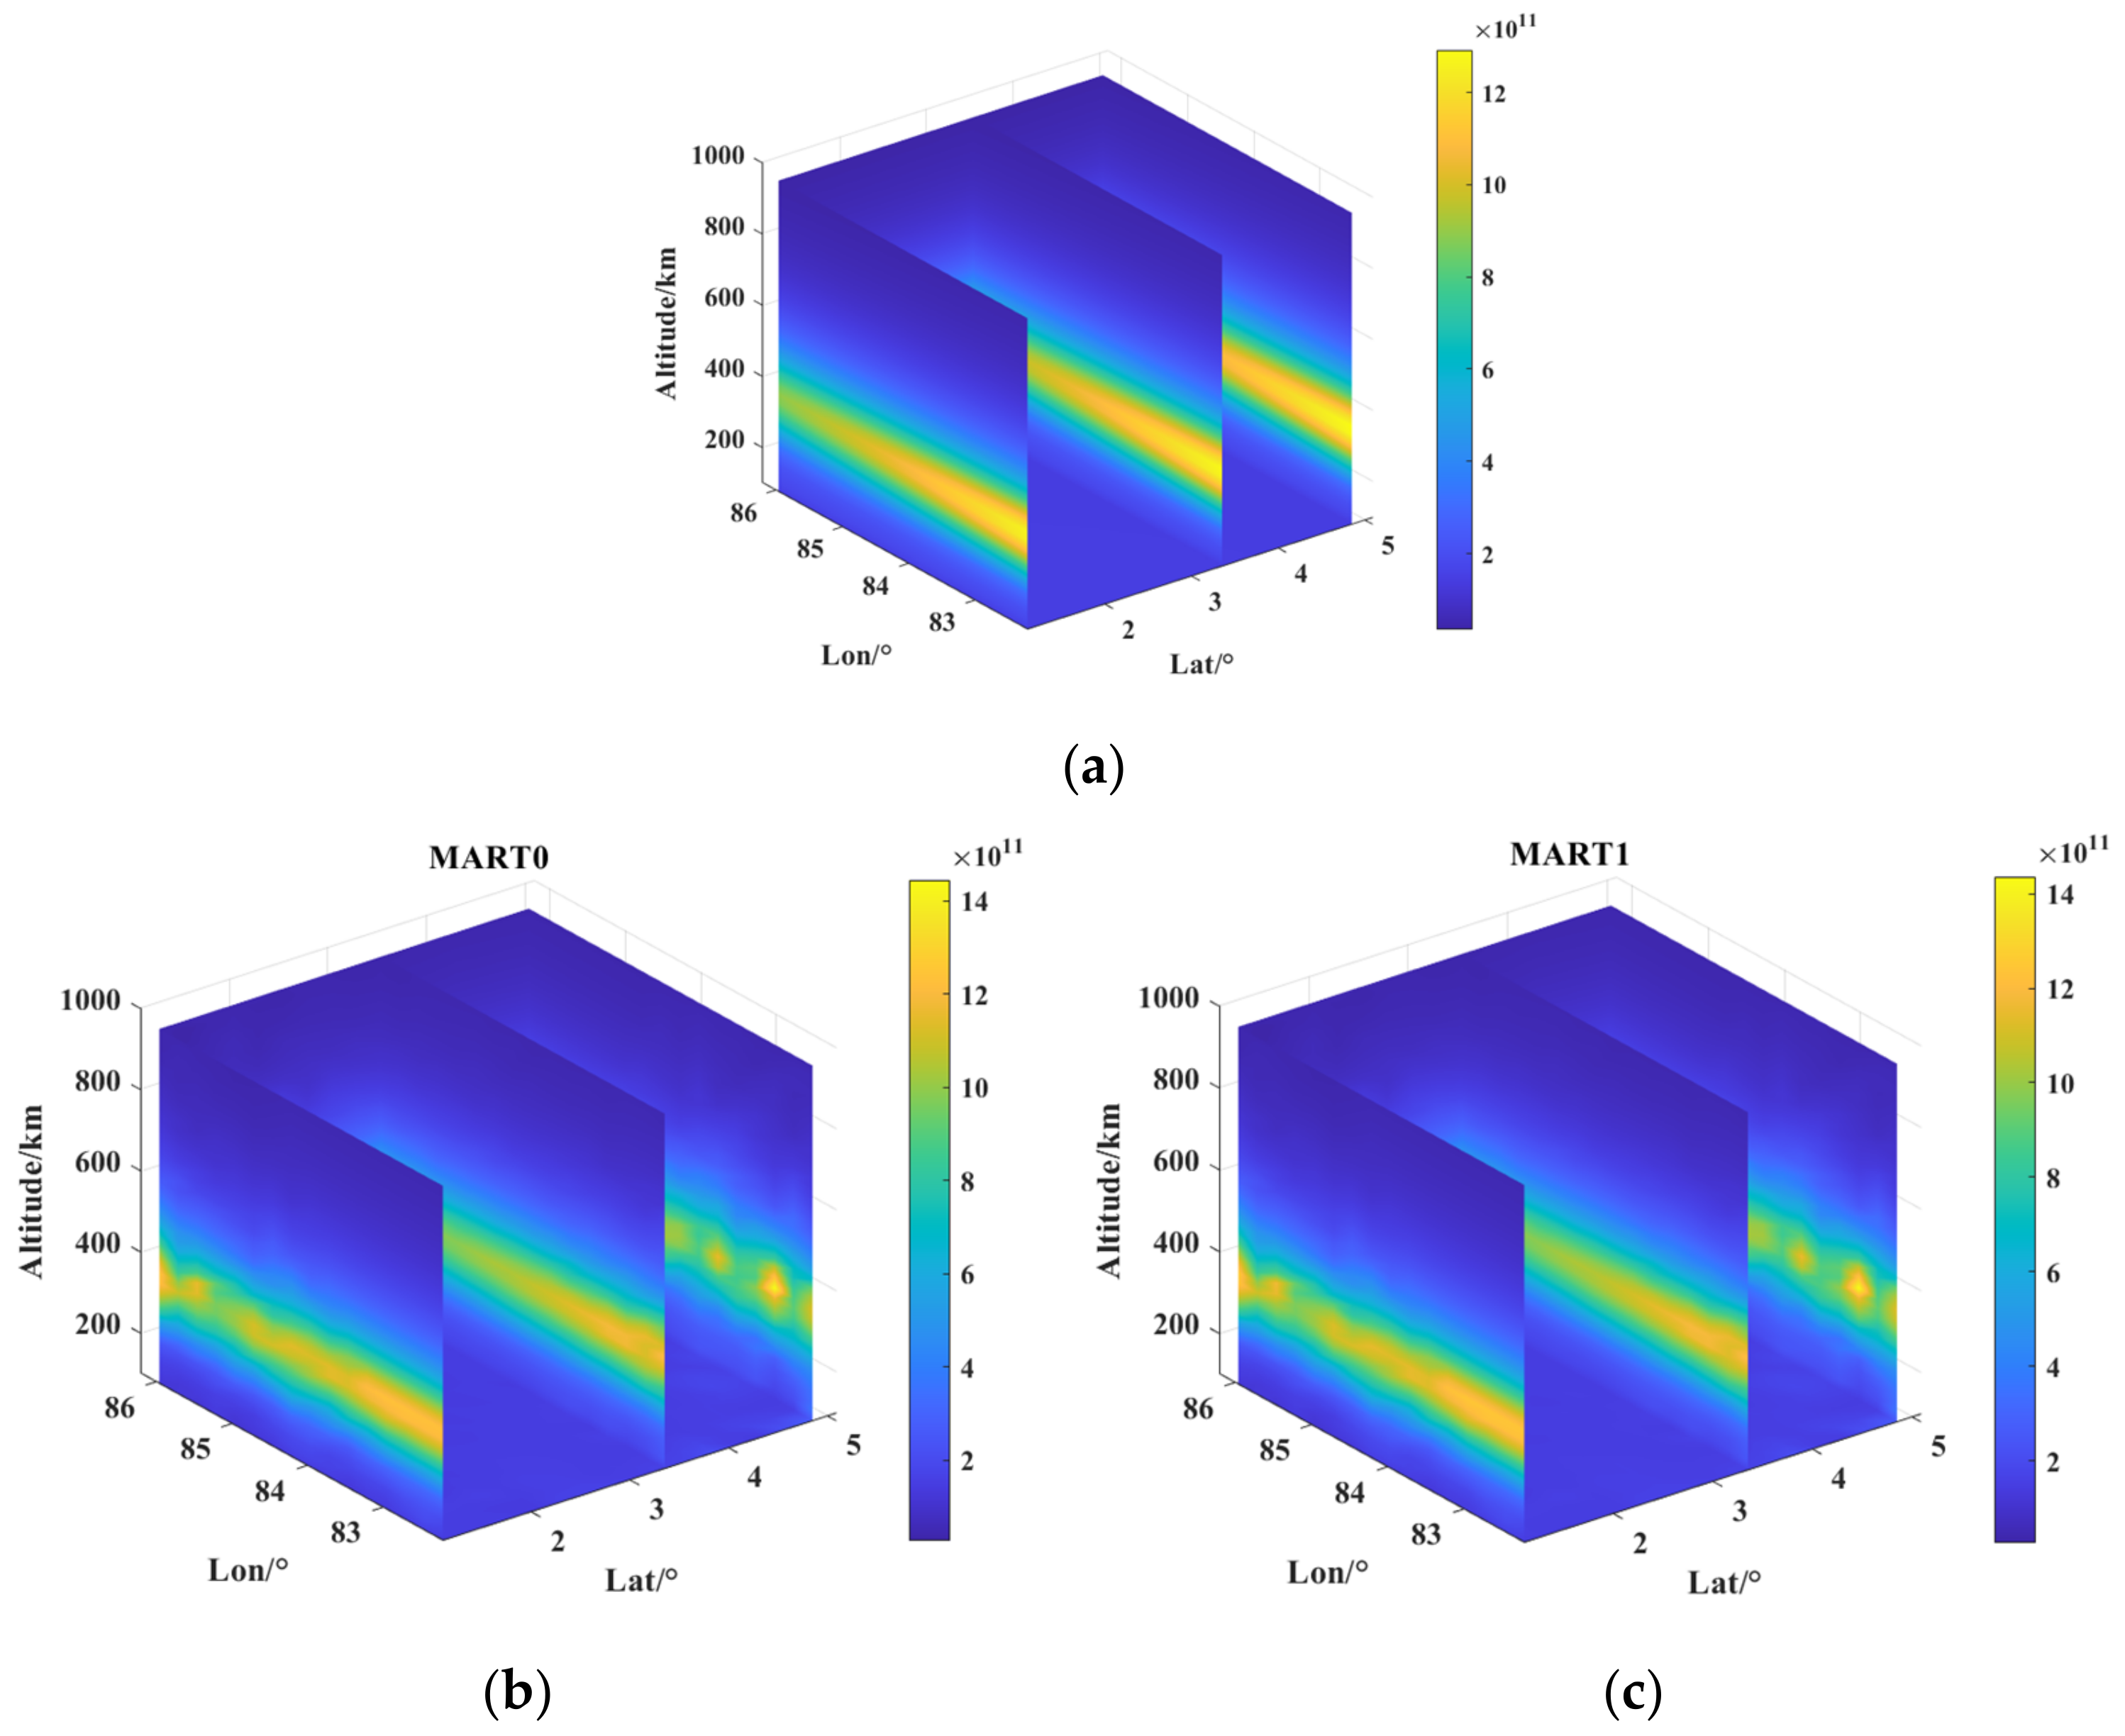
The background and reconstructed IED at 06:00 are shown in
Figure 8.
Comparing
Figure 8b,c with the background electron density values, respectively, it is clear from these longitude–height profiles given in the figures that the electron density results obtained from the MART1 reconstruction is much more similar to the background electron density image, especially in the first and second longitude–height sliced plane in the figures. In the first plane, at the height of the maximum electron density, there is a trend of decreasing electron density with increasing longitude, and the reconstructed electron densities by MART1 in
Figure 8c follow the same trend as in
Figure 8a, showing the background electron densities at longitudes smaller than about 85.8°. In the range shown in the second profile, its electron density trend, the value of the maximum, is closer to the background electron density. The maximum value and its color bar show that the maximum value is also closer to that of the background electron density map. Therefore, from the 3D electron density map, we can see that MART1 has better reconstructed electron density results.
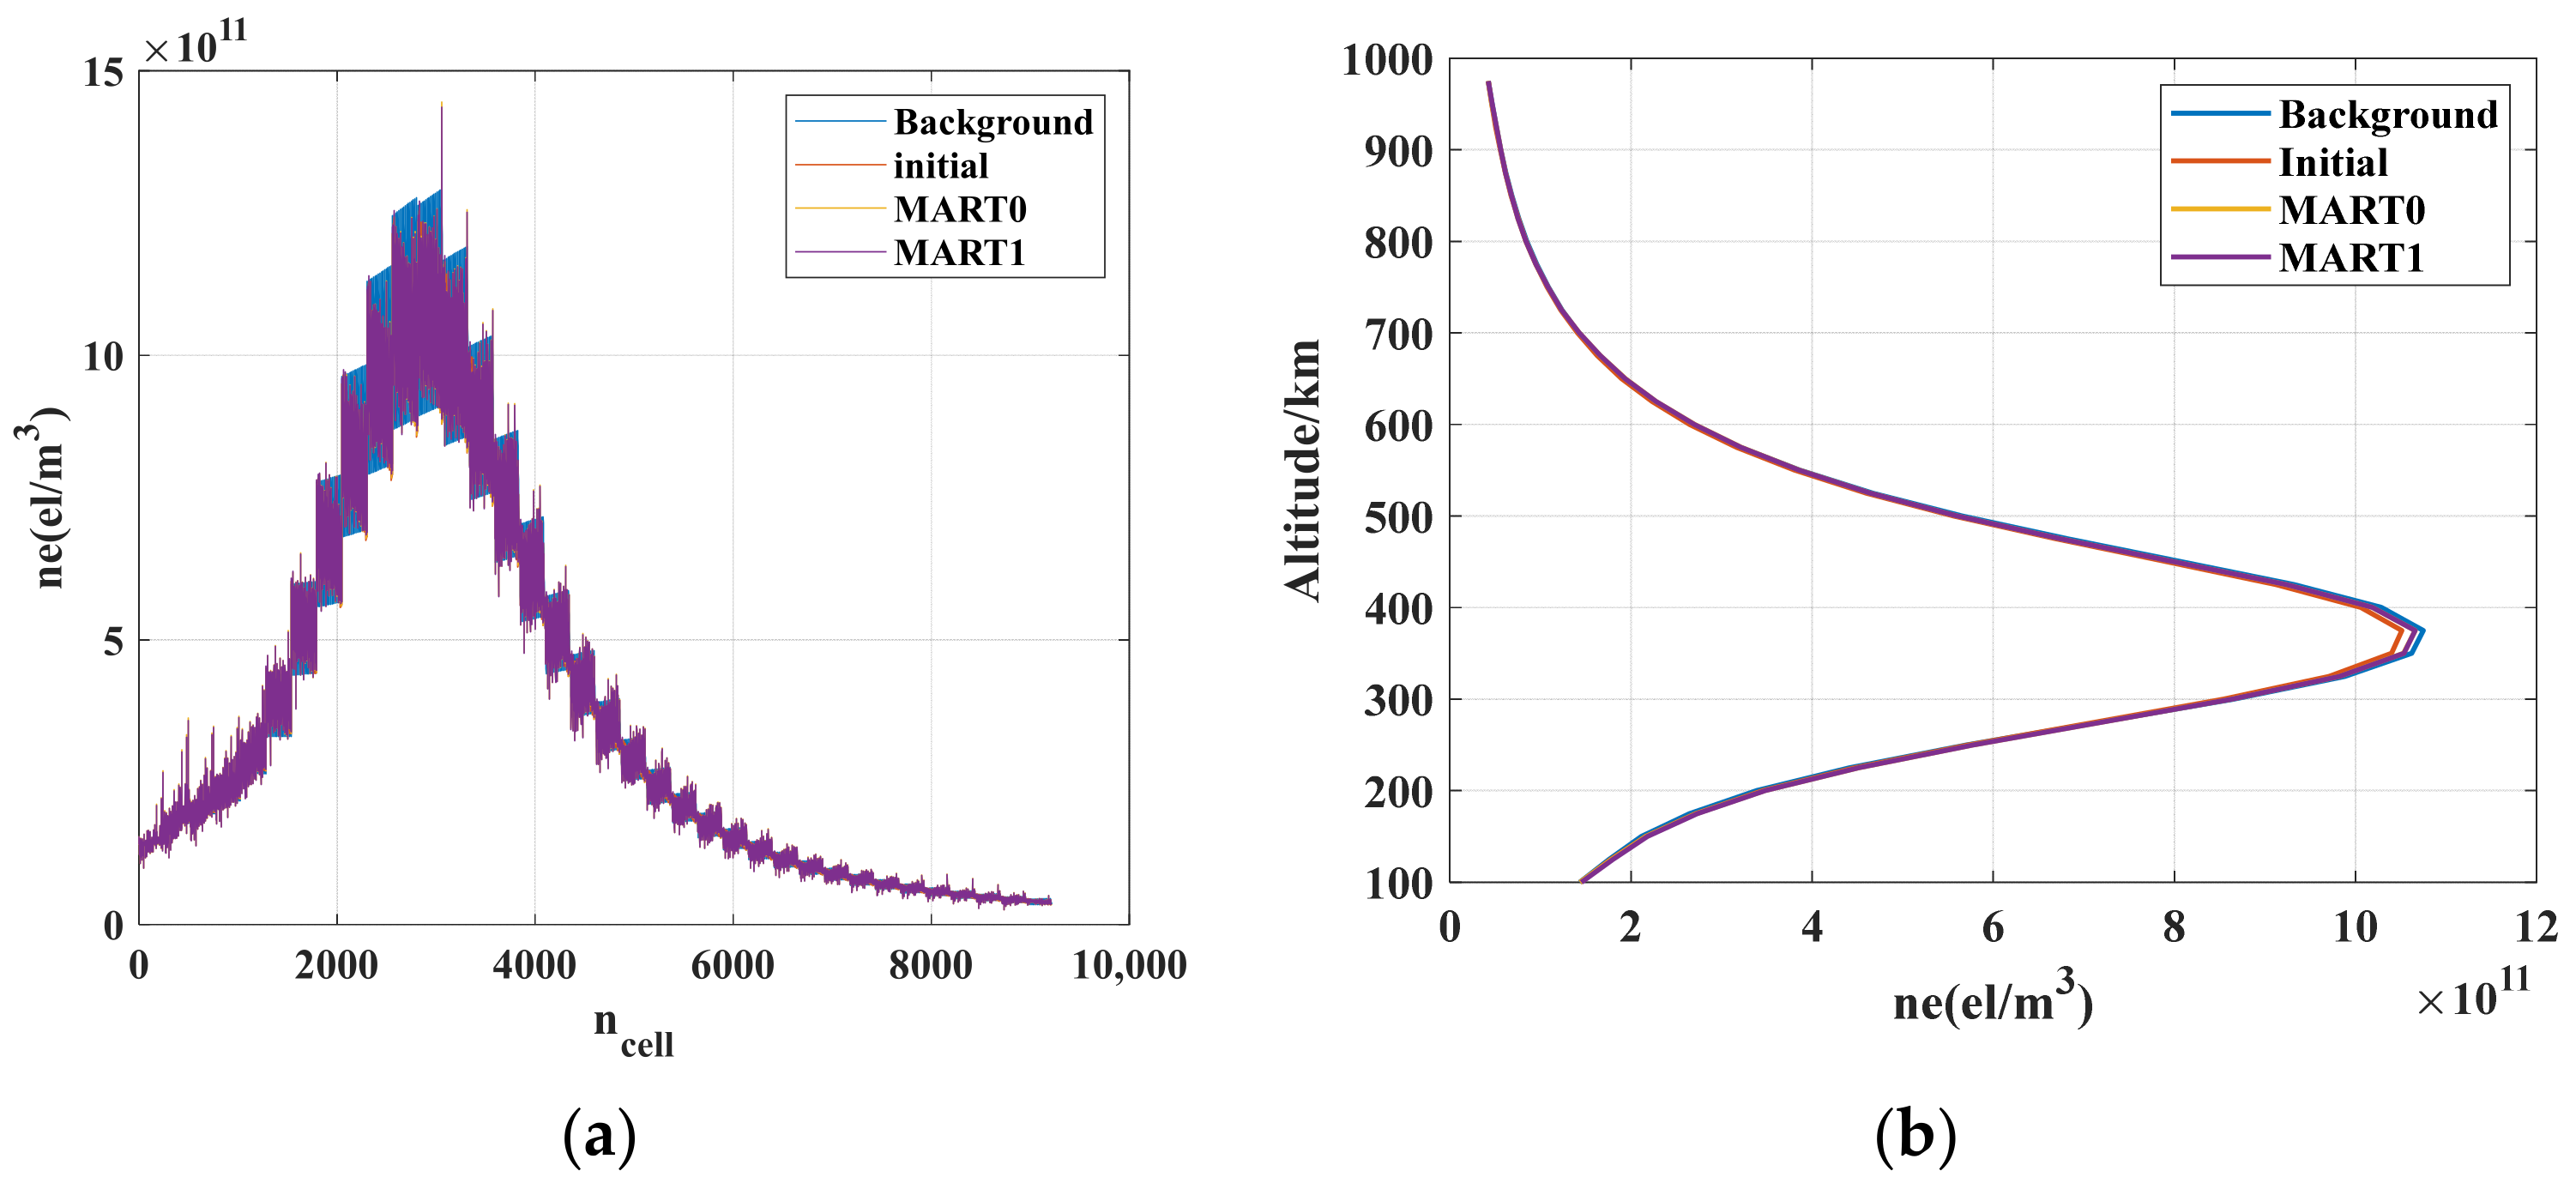
From the comparison of the four sets of electron density curves with the initial and background electron density values in
Figure 9a,b, we can find that the initial electron density values are smaller than the background electron density at most of the heights, especially at the height of the electron density maximum, and that the two reconstruction methods are better optimized for the initial electron density values. In
Figure 9a, each 16 × 16, i.e., 256 grids, represents the electron density at one height plane, and it can be seen in the figure that in the grid planes around the 3000th grid, the MART0 reconstruction yields much larger values of electron density than the surrounding ones, and the difference in the results of the MART1 reconstruction is even smaller. This is also the case in higher planes, except that the difference is not as large as near the 3000th grid, which corresponds to the last longitude–height plane in
Figure 8b, where the electron density undulates.
As can be seen in
Figure 10, the reconstruction electron density by MART0 and MART1 are similar; this is because the value of delta obtained with this initial value is 1.01, i.e., the STEC calculated using the initial value is similar to the simulated STEC, and the initial values of MART0 and MART1 are almost the same.
As can be seen from
Figure 11b, the in-grid electron densities obtained from the reconstruction of the two methods match the background electron density profiles better at the locations we chose, but there are several singularity values larger than the true electron density values in the plane of the peak height of the electron densities in
Figure 11a. Therefore, the reconstruction of the electron density is better because the initial value of the MART iteration is closer to the value of the true electron density of the background, which also leads to a value of delta close to 1. Therefore, the reconstruction results of MART1 and MART0 overlap with each other, and the new method is not very useful for improvement. We also reconstructed the electron density at 18:00 using MART0 and MART1, respectively, and the results are similar to those at 12:00.
4.2. Comparison and Results
The ratio
calculated using Equation (4), the AD and RMSE of the initial electron density, MART0, and MART1 at 00:00, 06:00, and 12:00 are listed in
Table 1.
It can be inferred from
Table 1 that the process of MART iterations optimizes the initial values toward the background true electron density values, and the AD and RMSE values of the reconstructed electron densities for both MART0 and MART1 are smaller than the initial values.
At 00:00, ; the AD of the initial electron density is 2.1 times the AD of MART0 and 2.5 times the AD of MART1; and the RMSE of the initial electron density is 1.86 times the RMSE of MART0 and 2.18 times the RMSE of MART1. The AD and the RMSE is improved by 16.8% and 14.8% by MART1 and MART0, respectively.
At 06:00, ; the AD of the initial value is 3 times the AD of MART0 and 5.16 times the RMSE of MART1; and the RMSE is 2.7 times the RMSE of MART0 and 4.85 times that of MART1. The improvements in the 3D electron density reconstruction at 00:00 and at 06:00 are evident. The AD and the RMSE are improved by 42% and 44.2% by MART1 and MART0, respectively.
Thus, our new method effectively improves the quality of the 3D electron density reconstruction at 00:00 and at 06:00, in the condition that the adjustment factor deviates from 1.
At 12:00, ; the AD and RMSE values for MART0 and MART1 are similar, with the initial values of AD being 2.9 times that of MART0 and MART1; and the RMSE is 2.4 times that of MART0 and MART1.
Therefore, the adjustment factor , which is the ratio between the simulated STEC and the STEC calculated using the initial value and parameter matrix, is an important parameter affecting the iteration accuracy of the MART1 method. In the CIT process, we can evaluate the chosen initial electron density by examining the relation between and 1.
If the discrepancy between and 1, which can be written as , is smaller and closer to 0, as is the case at 12:00, it means that the initial electron density is well selected, so the initial value of the MART1 iteration is not much different from that of MART0 iteration and its AD and RMSE are also similar. In this case, a closer match between the initial value and the background true electron density also provides better iterative results, and there is no need to use to optimize the initial electron density before the MART process.
In cases where is larger than 0.1 at 00:00 and 06:00, MART1 performs better than MART0 because the discrepancy between the simulated STEC and true STEC is larger, and the adjustment factor is optimized the initial electron density as a whole, especially at the altitudes of maximum electron density, which is the most important part of the ionosphere.
As can be inferred by comparing the three cases, the larger the is, the better performance MART1 can achieve, and this is for two main reasons: (1) The MART process does not establish a uniform constraint for the electron density in all voxels; therefore, the larger discrepancy between the initial electron density and the background electron density, the worse the reconstruction result MART can achieve. The multiplication of adjustment factor makes the initial electron density closer to the background electron density to achieve better performance. (2) In the voxels without any transversing rays, the reconstructed electron density remains at initial values, and the smaller discrepancy of optimized initial electron density makes better performance.
5. Summary and Conclusions
Simulated STECs along small-satellite constellation–AIS signal rays are applied for CIT over sea areas to reconstruct the 3D electron density. This can be used to analyze the variation of electron density over sea areas, which is important for maritime communication and can be applied as a complement to global ionospheric electron density data.
In this paper, we have designed a small-satellite constellation consisting of four small satellites, deployed the AIS in the ship-dense area, and used the simulated STEC of the signals between the small-satellite constellations and AIS installed on ships to perform CIT. For the CIT process, a method is proposed to evaluate the initial electron density and improve the accuracy of CIT by improving the iterative initial value of the electron density, i.e., the iterative initial value is optimized by utilizing the ratio of the measured STEC of the simulated STEC to the one obtained from the initial value and the parameter matrix, which is denoted as . The optimized initial electron density is brought to the MART for iteration to obtain the reconstructed 3D electron density. The use of MART1 can obtain better iterative results than those of MART0 when there is a large difference between MART0 and MART1. When the difference between MART1 and 1 is not large, it means that the initial value is close to the real value of the background, and better iteration results can often be obtained. Therefore, our proposed improvement of the iterative initial value can obtain better CIT electron density reconstruction results. More work needs to be conducted in order to achieve ionospheric observation and obtain reconstruction data in the sea area.
