Article

Placing 21st Century Warming in Southern California, USA in a Multi-Century Historical Context

by
Paul A. Knapp
1,*,
Avery A. Catherwood
1 and
Peter T. Soulé
2
1
Carolina Tree-Ring Science Laboratory, Department of Geography, Environment and Sustainability, University of North Carolina at Greensboro, Greensboro, NC 27412, USA
2
Appalachian Tree Ring Laboratory, Department of Geography and Planning, Appalachian State University, Boone, NC 28608, USA
*
Author to whom correspondence should be addressed.
Atmosphere 2024, 15(6), 649; https://doi.org/10.3390/atmos15060649
Submission received: 11 April 2024 / Revised: 13 May 2024 / Accepted: 25 May 2024 / Published: 29 May 2024
(This article belongs to the Section Climatology)

Abstract

:
Warming in southern California during the 21st century is unprecedented in the instrumental record. To place this warming in a multi-century historical context, we analyzed tree ring data sampled from Jeffrey pine (Pinus jeffreyi) and sugar pine (Pinus lambertiana) collected from minimally disturbed, old-growth high-elevation forests within Mt. San Jacinto State Park California, USA. Based on a calibration/verification period of 1960–2020 between earlywood radial growth and California Climate Division 6 climate data, we reconstructed annual (November–October) minimum temperature (Tmin) from 1658 to 2020. During the 61-year calibration/verification period, instrumental Tmin increased (r = 0.69, p < 0.01) and was positively associated with annual radial growth (r = 0.71, p < 0.01). Using regime shift analysis, we found that the 363-year reconstruction revealed Tmin stability until 1958 and then decreased until 1980, followed by the two warmest regimes (1981–2007, 2008–2020) on record. The last 13-year period was 0.77 °C warmer than the multi-century average with nine of the ten warmest years in the reconstruction recorded. These results suggest that 21st century warming in southern California is unique in the context of the past four centuries, indicating the rarity of exceptional warmth captured in the tree ring record.

1. Introduction

Summertime (June–August) temperatures in the southwestern US during the first two decades of the 21st century have been unmatched since at least the mid-1500s and are likely a consequence of anthropogenic warming [1]. The human and environmental consequences of increasing temperatures in this region are broad and ongoing and include changes to fire activity, snowpack and water resources, growing season length, and drought frequency. In California, which has the largest population [2], highest GDP [3], and highest value of crop sales [4] of all US states, the effects of warming have been extensive [5]. These warming impacts include increased drought risk [5], altered elevational distribution ranges of forest fires, greater burn frequency in the Sierra Nevada [6,7], increased extreme autumnal fires [8], lengthened fire season and area burned [9], reduced snowpack [10], earlier snowpack melt and runoff [11], and decreased (increased) growth of low-elevation (high-elevation) conifers [12,13]. Considerable spatial variability exists within California regarding the extent of 21st century warming effects, with the largest increases occurring in the southern third, and most populous region, of the state [14]. What remains unknown, however, is how unusual this rate of warming in southern California is over a multi-century timeframe.
Warming associated with greenhouse gas emissions is recognized as a significant contributor to drought conditions in the southwestern United States, with terms such as “global-change-type-drought” [15], “anthropogenic drought” [16], and “hot drought” [1,17,18] frequently used in reference to anthropogenic changes to drought climatology. However, 21st century warming in southern California is likely associated with both natural and anthropogenic forcing mechanisms, and dissociating these mechanisms is problematic because of their interconnectedness. For example, 21st century warming in southern California has been partially linked to the persistence of the “Ridiculously Resilient Ridge” (RRR) [19]. The RRR is characterized by anticyclonic ridging that develops during the winter months concurrent with Arctic Amplification (AA) and reductions in Arctic Sea ice extent (ASIE) [20,21,22,23]. In turn, internal variability in our climate system is a substantive driver of ASIE [24]. Thus, the enhanced variance of upper-level flow patterns associated with ridging and the subsequent sinking air motions associated with warming can be linked to surface changes associated with both anthropogenic and natural processes.
Numerous tree ring reconstructions have been conducted in the southwestern United States using variable month/monthly combinations to identify annual temperature. These studies include reconstructions of mean [25,26] and maximum temperatures [1]. Additionally, investigations in precipitation patterns [27] and soil moisture indices [28,29,30] in the western United States also have been explored. While studies in the southwestern United States have examined various temperature parameters, recent research in California has predominately focused on regions such as the White Mountains of eastern California [26] and interior old-growth forests in the Napa Range of northern California [31]. The limited studies that exist for southern California, such as those by Meko et al. [32], Briffa et al. [25], and Scuderi [33], lack data extending into the 21st century. Moreover, these studies did not focus on the examination of minimum temperature. Because of this gap in research examining radial growth and minimum temperature in the southwest mountains of California, our ability to fully grasp the interplay between 21st century anthropogenic warming [1,18] and ecosystem dynamics of mountainous regions in southern California is limited. In this study, we explore the historical temperature variations of southern California, particularly focusing on the region’s high-elevation old-growth forests within Mt. San Jacinto State Park. Specifically, we use old-growth Jeffrey and sugar pine tree ring data collected in the San Jacinto Mountains of southern California as a proxy measurement vehicle to reconstruct annual minimum temperature to the mid-17th century.

2. Methods

2.1. Data Collection and Processing

Our chronology was developed using tree ring data from Jeffrey pine (Pinus jeffreyi, hereafter JP) and sugar pine (Pinus lambertiana, SP), with core samples collected during summer 2021 in Mt. San Jacinto State Park (MSJSP) California, USA (sampling location of 33°48′24.46″ N, 116°38′41.07″ W) (Figure 1). Established in 1934, MSJSP lies within the granitic (quartz diorite) fault-block San Jacinto Mountains, which are part of the Peninsular Ranges of southern California and northern Mexico [34,35]. We sampled trees at elevations between 2560 and 2670 m a.s.l. in an old-growth Sierran Mixed Conifer Forest [36] growing under Mediterranean (winter wet/summer dry) climate conditions. MSJSP is located on the border of California climate divisions 6 (CD6) and 7 (CD7) (Figure 1A). CD6 and CD7 are similar in terms of their annual distribution of moisture, with the maximum falling in winter in both the Mediterranean climate (Koppen Csa) that dominates in CD6 and the hot desert climate (Koppen Bwh) of CD7 [18]. While CD6 and CD7 have similar winter temperatures (mean JFM of 10.3 °C and 10.2 °C, respectively), CD7 has substantially greater variance in annual temperature, with mean summer (JJA) temperatures of 28.1 °C compared to 21 °C in CD6.
For each species, we obtained two cores from thirty mature trees absent major visual damage, including scarring, rot, and missing central leaders using a 5.15 mm diameter increment borer. Samples were dried, glued into wooden mounts, sanded using progressively finer grit (120–600 um) following standard procedures [39], and scanned at 1200 DPI. We scanned and measured cores using WinDENDRO [40] and used COFECHA [41] to confirm crossdating accuracy. We standardized annual ring width data using the negative exponential option in ARSTAN [42] with the retention of the Standard Output (STD) version as this method and output produced the strongest relationship with temperature.
The JP chronology consisted of 42 cores from 23 trees (series intercorrelation [SI] = 0.65, mean sensitivity [MS] = 0.28), and the SP chronology consisted of 52 cores from 28 trees (SI = 0.65, MS = 0.29) (Table 1). We obtained the best climate growth correlations for both chronologies ([JP], r = 0.61; [SP], r = 0.57, p < 0.01) using annual (previous November–current October) minimum temperature (hereafter Tmin) data from CD6 1960–2020 (Table 1), which correlated better than either any single month (Figure 2) or CD7 data and using earlywood growth, which comprised 80.1% (JP) and 85.1% (SP) of the annual ring widths and had higher correlations (+0.06, JP; +0.02 SP) than totalwood. While CD6 data extend to 1895, data from 1960 onward incorporate the onset of the “hot drought” era [18] when soil moisture limitations created by excessive warmth frequently combined with below-average precipitation in southern California [18] and provided a higher r-value than the inclusion of earlier CD6 data.

2.2. Growth/Climate Model Development, Calibration, and Verification

To maximize the Tmin signal, we created a new chronology (hereafter the Composite chronology) that comprised seventeen cores from ten JP trees and nine cores from eight SP trees with all cores complete through 2020. The Composite chronology earlywood series (n = 26) ranged from 1518 to 2020, with an SI of 0.59 and an MS of 0.28 (Table 1). The Composite chronology also was standardized via ARSTAN with the STD retained for analysis for the period 1658–2020 (n = 363 years), with that interval having a signal strength of >0.80 (9 samples in 1658 increasing to 26 samples during 1906–2020). We calibrated and verified regression models between standardized radial growth (Composite chronology) and Tmin using data from 1960 to 2020 (n = 61) for the Tmin reconstruction. Verification statistics included the bivariate regression coefficients between instrumental and predicted Tmin using the leave-one-out (L1O) method [43] and the reduction of error statistic (RE) [44].

2.3. Data Analysis

To analyze potential significant changes in temperature between statistically stable states (i.e., regimes) during the 363-year study period, we used a sequential algorithm developed by Rodionov [45] to identify regime shifts. Regime shift analysis is affected by cutoff lengths, with shorter lengths producing shorter regimes and greater shift magnitudes [46]. To match the average duration of the Pacific Decadal Oscillation (PDO), which has been shown to exhibit phase reversals approximately every 20–30 years and has positive associations with precipitation [47] and temperature [48] in southern California, we selected a 30-year cutoff with phase shifts occurring at p < 0.05. Thus, mean reconstructed Tmin temperatures between adjacent phases are significantly different from each other.
We compared the accuracy of reconstructed Tmin data with the actual Tmin data to determine if reconstruction outliers were skewed towards over/under prediction of interannual temperature variability. We converted actual and reconstructed Tmin values to z-scores with a mean of zero for the 1960–2020 calibration/verification period. We identified outlier years when a z-score difference between actual and modeled Tmin was >1 and coincided with a year where either actual or reconstructed Tmin had a z-score > 1 or <−1. Lastly, we analyzed relationships between internal climate-forcing mechanisms and temperature using monthly data for El Nino Southern Oscillation for Region 3.4 (ENSO SST 3.4) [49], the PDO [50], North Pacific Index (NPI), [50], and Arctic Sea ice extent (ASIE) [51]. A visual representation of the various stages of our methodology is identified in Supplemental Figure S1.

3. Results and Discussion

3.1. Model Development and Validation

The Tmin model is radial growth = −2.147 + 0.355 (Tmin); R2 = 0.50, p < 0.001. Reconstructed Tmin values from the tree ring model were calculated via Tmin = 7.515 + 1.406 (radial growth); R2 = 0.50, p < 0.001. The Tmin model verification statistics (r = 0.69, p < 0.001, and RE = 0.47 for the L1O validation) compared favorably with the actual Tmin model (r = 0.71, p < 0.001, and RE = 0.50). Further, the RE values > 0 indicate that the predictive reconstruction skill of the Tmin model is robust and exceeds that of climatology.

3.2. Reconstructed Tmin 1658–2020

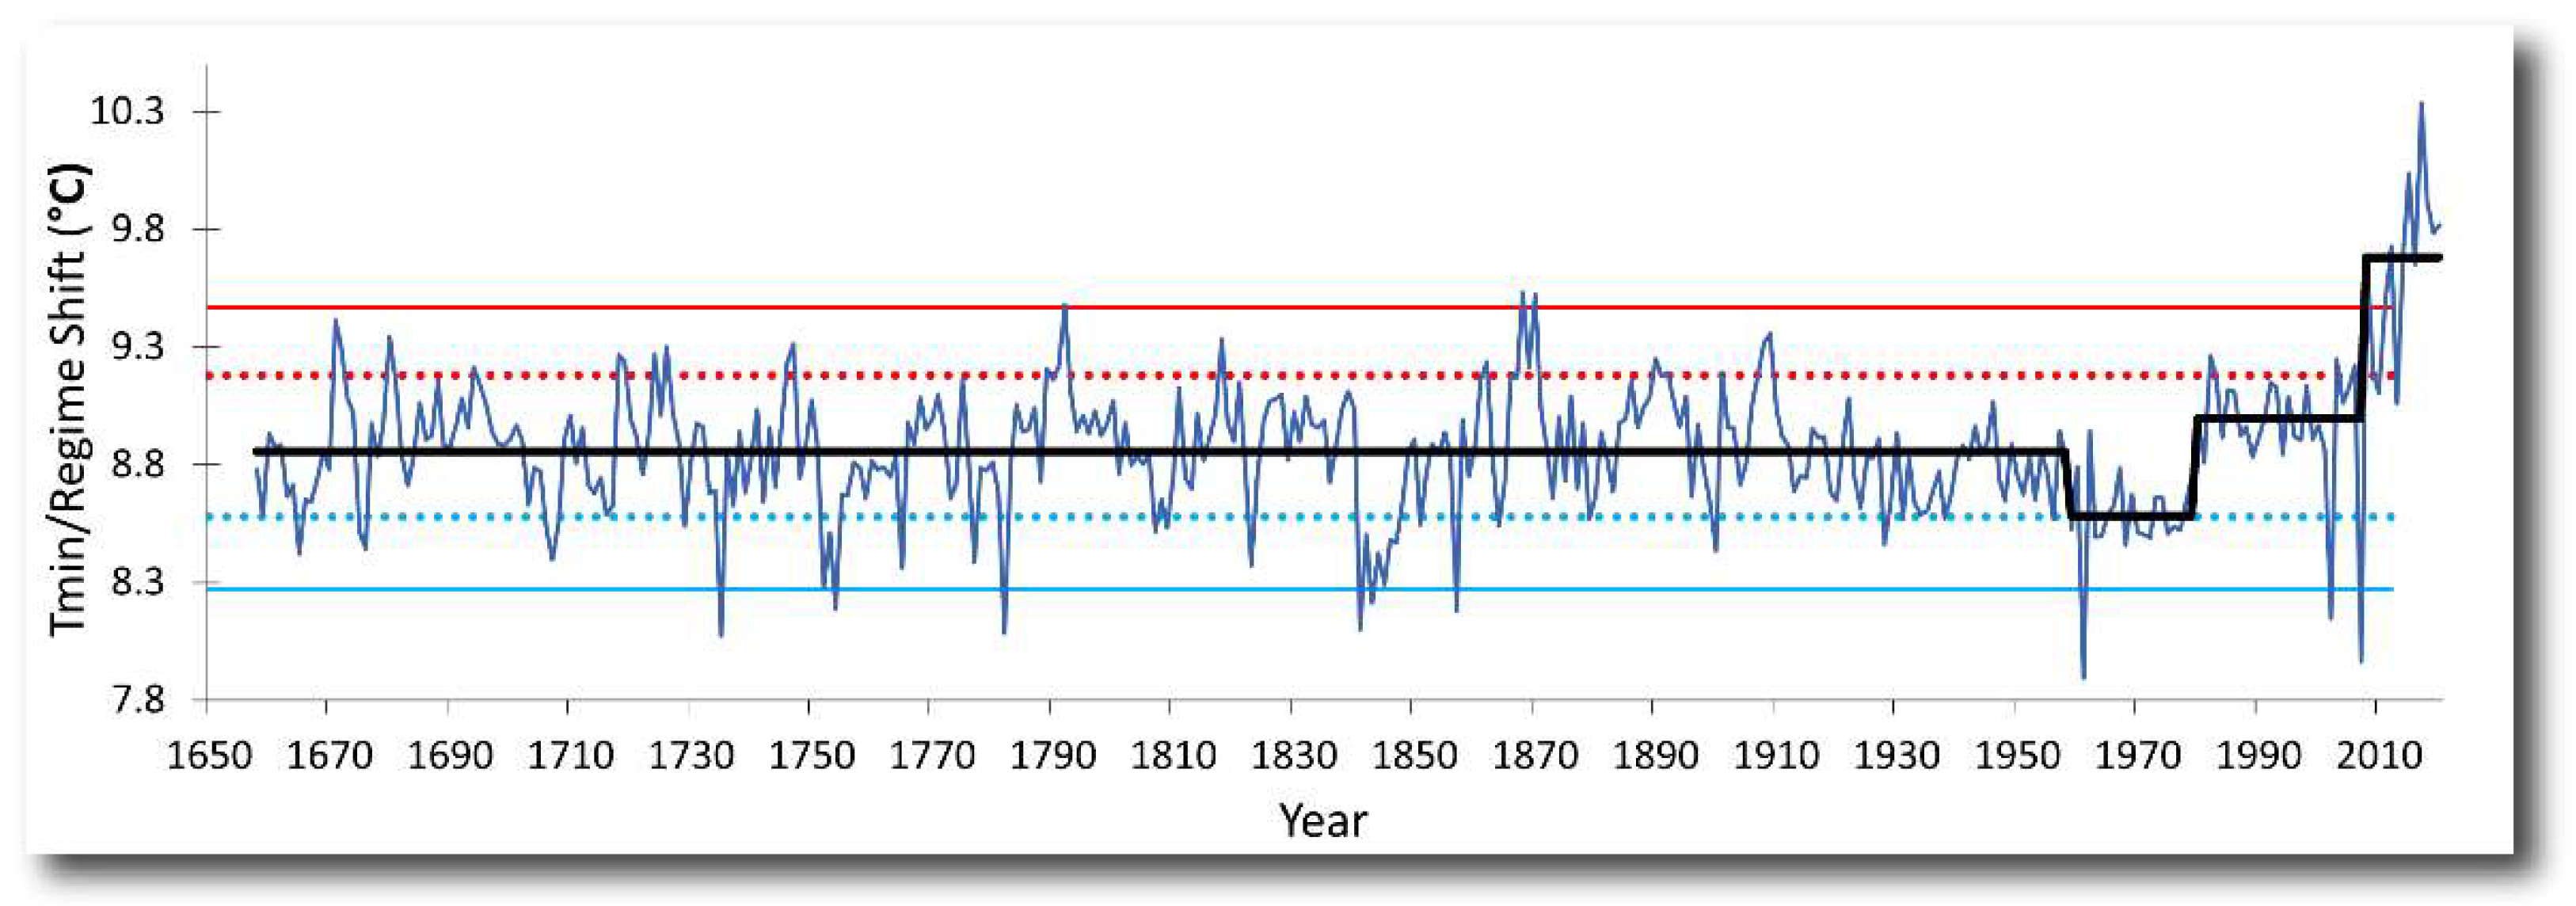
The reconstructed Tmin data from 1658 to 2020 show annual temperature oscillations between 8.07 and 9.53 °C from 1658 to 1959 with no significant trend (p > 0.05) (Figure 3). However, during 1960–2020, Tmin markedly increased and was significantly correlated (r = 0.71, p < 0.01) with year with a range of 7.90–10.34 °C (Figure 3). The greatest increases in temperature occurred during 2008–2020 (n = 13), with the mean value of 9.65 °C being significantly greater (p < 0.01, independent samples t-test) than the 363-year mean (8.88 °C). Reconstructed Tmin temperatures during this period of warming for 1960–2020 and 2008–2020 averaged 0.34 and 2.6 standard deviations above the 363-year average. Further, Tmin for five years (2015, 2017–2020) exceeded three standard deviations, with 2017 having a z-score of 4.9.
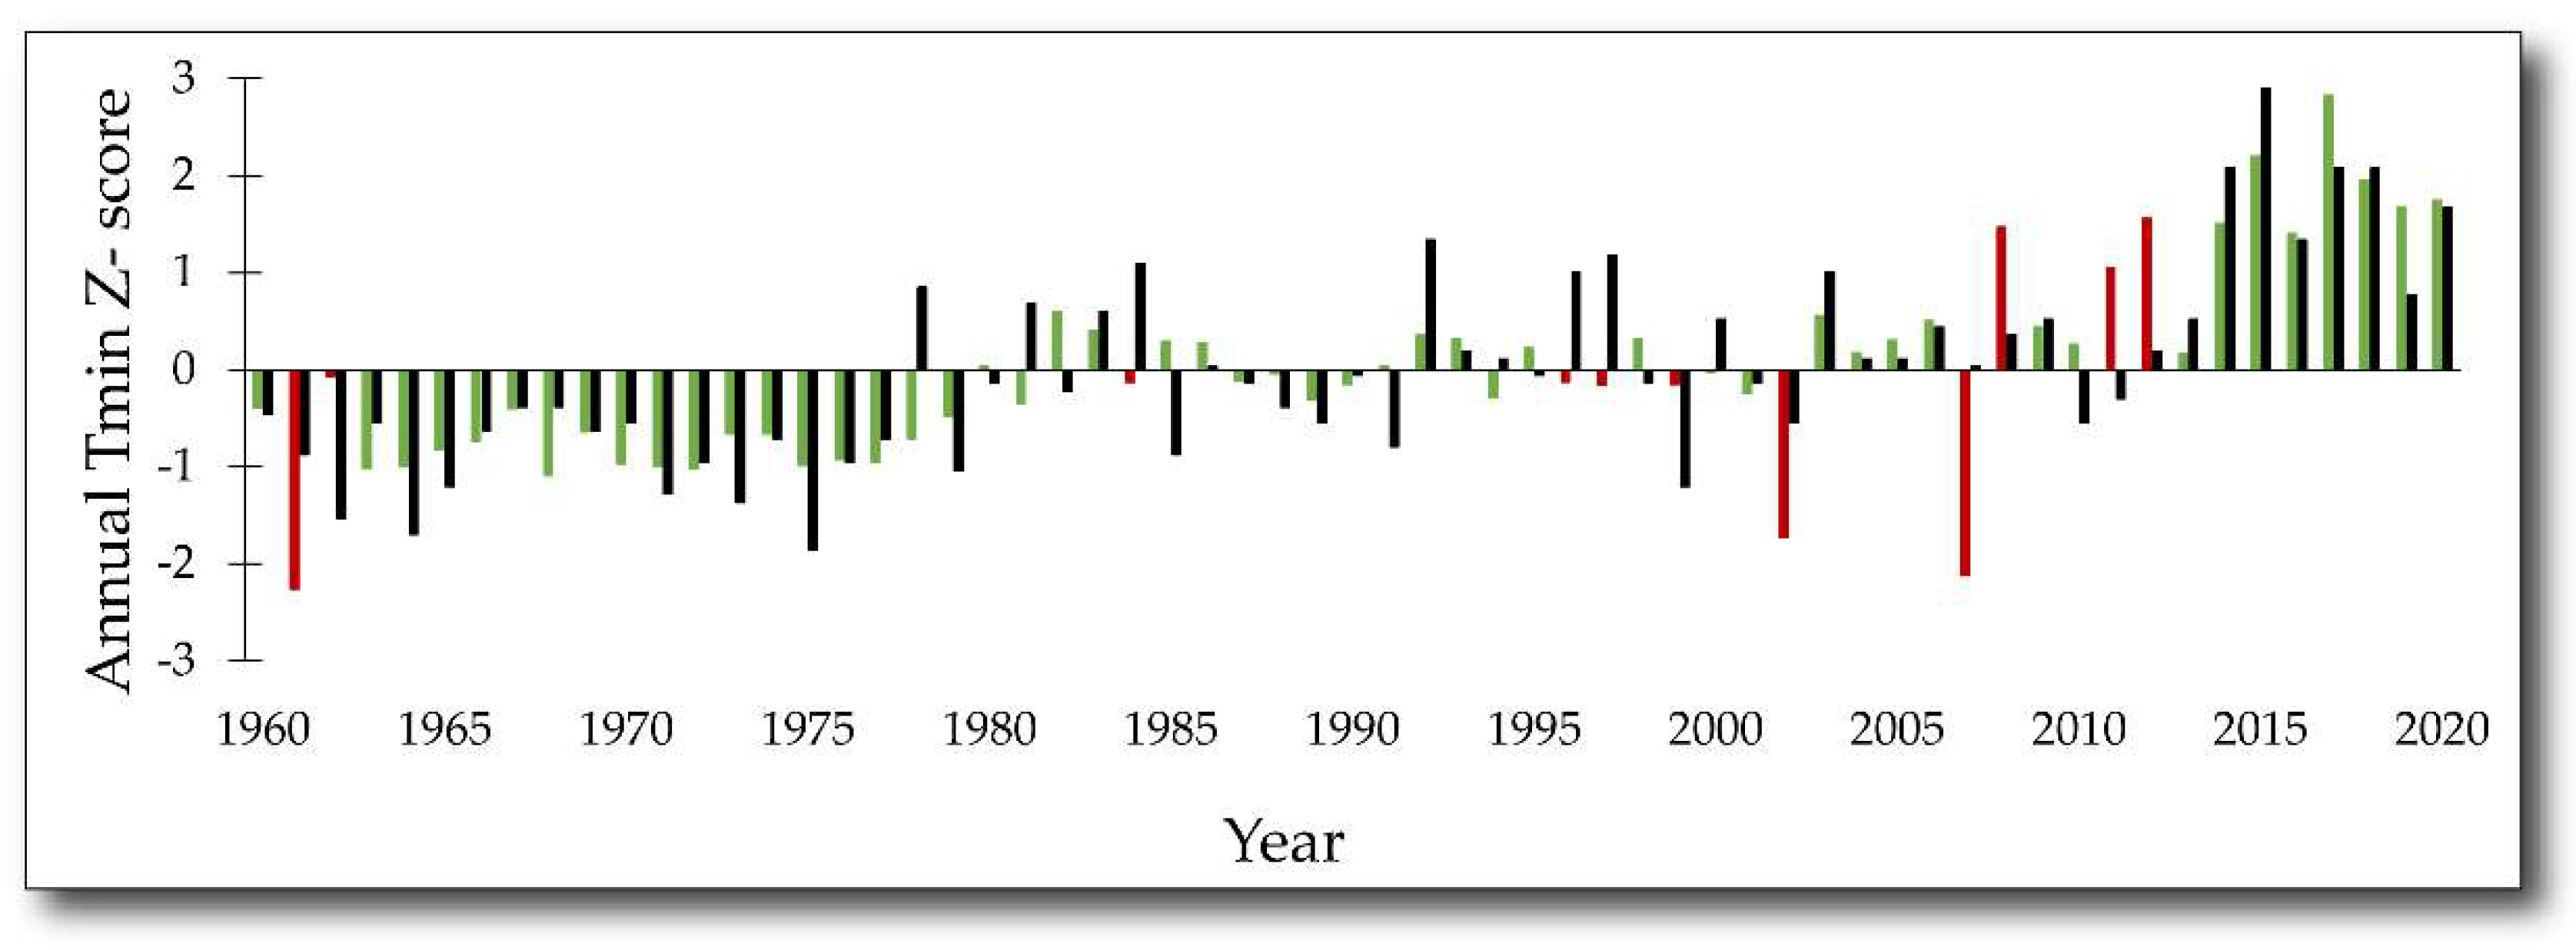
The quality of temperature-based reconstructions is typically assessed based on the correlation between instrumental temperature and ring widths, assuming sufficient sample depth, and significant (p < 0.05) calibration/verification statistics. However, other factors affect quality, including data homogeneity (e.g., number of species included, number of sites) sample replication scores, and chronology development scores (e.g., importance of including younger and older trees) [52]. Thus, our chronology exhibiting moderate to strong correlation, representing different aged trees sampled from the same location, and not expressing a large decline in samples from the beginning (n = 9) to end (n = 26) suggests that statistical skill remains consistent throughout the time series. Evaluation of the correlation period with instrumental data using z-scores suggests that 50 of the 61 (82%) reconstructed Tmin years closely replicated actual Tmin conditions, and 11 years did not capture actual Tmin (Figure 4). The largest disparities between actual and reconstructed temperatures occurred in 1961, 2002, and 2007. Each of these years was marked by dry conditions (z-score range −1.24 to −1.43) coupled with below- to near-average temperature conditions (z-score range −0.87 to 0.02). Thus, the largest reconstruction outliers were associated with the overprediction of cold. Conversely, six of the ten warmest reconstructed years coincided with the top ten warmest instrumental data years (Figure 4).

3.3. Mechanisms of 21st Century Warming

Exceptional warming in western North America has been linked to a combination of natural variability and anthropogenic forcing [1,18,28,53,54,55], and many of these factors likely contributed to the temperature variability (Figure 3) at MSJSP, but at different temporal scales. For natural forcing, we found that during 1960–2020, late spring (April–June) PDO conditions were positively associated with instrumental Tmin (r = 0.54, p < 0.01). Instrumental Tmin also is positively associated (r = 0.43, p < 0.05) with ENSO conditions during April–July. Tmin is negatively associated with April NPI (r = −0.52, p < 0.01) and March–May (1979–2020) ASIE (r = −0.59, p < 0.01). Overall, the relationship of these indices with Tmin is consistent with the literature, e.g., [56,57,58], which explains 18–35% of annual Tmin variability and suggests that conditions in spring to early summer have the greatest effects. Further, warming is associated with the occurrence of strong anticyclonic conditions over the northeastern Pacific that produce a northward deflection of the cool-season storm track [59]. Being overlain by favorable conditions for warming is an anthropogenic signature. Williams et al. [28], using multiple climate models, found that anthropogenic warming increased mean annual temperatures by 1.2 °C (range 1–1.5 °C) in southwestern North America during 2000–2018. Here, the Tmin reconstruction results showed temperatures since 2000 averaging 0.46 °C warmer than the 363-year average, but since this Tmin reconstruction slightly overpredicts cold, these results are consistent with anthropogenic forcing effects contributing to the overall warming.

4. Conclusions

Our reconstruction of annual Tmin from JP and SP tree ring data in southern California back to 1658 CE reveals that thermal conditions were largely stable for the first 300 years of this proxy record, with no sustained deviations of sufficient magnitude to warrant a regime shift change (Figure 2). Since the mid-20th century, the thermal climate of the region has exhibited significant variance, with recent vectors showing warming during regime shifts occurring from 1980 to 2007 and 2008 to 2020. This later period includes nine of the ten warmest years on record and is the only period in the past three centuries of exceptional decadal-length warmth. We posit that record warmth during the 21st century represented a period of warming-favorable internal variability conditions coupled with anthropogenic forcing but acknowledge that this is a complex and interrelated relationship. We note that above-average annual Tmin (instrumental data) has continued through 2023, suggesting that despite changes in internal forcing conditions and above-average winter precipitation in 2022/23, a trend towards warmer conditions remains. Given the suite of human–environmental issues associated with 21st century warming, understanding the magnitude and historical context of this unprecedented change in thermal conditions in a region as economically and biologically important as southern California is crucial for entities charged with the development and implementation of climate mitigation and adaptation strategies.

Supplementary Materials

The following supporting information can be downloaded at: https://www.mdpi.com/article/10.3390/atmos15060649/s1. Figure S1: A visual representation of the various stages of our methodology.

Author Contributions

Conceptualization, P.A.K. and P.T.S.; methodology, P.A.K., A.A.C. and P.T.S.; software, P.A.K., A.A.C. and P.T.S.; formal analysis, P.A.K., A.A.C. and P.T.S.; writing—review and editing, P.A.K., A.A.C. and P.T.S.; funding acquisition, P.A.K. and P.T.S. All authors have read and agreed to the published version of the manuscript.

Funding

This project was made possible by internal funding from a University of North Carolina Greensboro Faculty First Grant and a University Research Council grant at Appalachian State University. This research received no external funding.

Institutional Review Board Statement

Not applicable.

Informed Consent Statement

Not applicable.

Data Availability Statement

The raw data supporting the conclusions of this article will be made available by the authors on request.

Acknowledgments

We thank Tyler Mitchell for data collection and processing. Additionally, we are grateful for the support of Ken Kietzer of the California State Parks system for providing a research permit, Stephen James and other staff from the Long Valley Ranger Station at MJSP for providing climate data, and Tim Jones of the Palm Springs Aerial Tramway for providing complimentary tram passes so that we could access the study site.

Conflicts of Interest

The authors declare no conflicts of interest.

References

  1. King, K.E.; Cook, E.C.; Anchukaitis, K.J.; Cook, B.I.; Smerdon, J.E.; Seager, R.; Harley, G.L.; Spei, B. Increasing prevalence of hot drought across western North America since the 16th century. Sci. Adv. 2024, 10, eadj4289. [Google Scholar] [CrossRef]
  2. Available online: https://www.census.gov/popclock/ (accessed on 15 February 2024).
  3. Available online: https://www.bea.gov/data/gdp/gdp-state (accessed on 15 February 2024).
  4. Available online: https://www.ers.usda.gov/data-products/ag-and-food-statistics-charting-the-essentials/agricultural-production-and-prices/ (accessed on 15 February 2024).
  5. Diffenbaugh, N.S.; Swain, D.L.; Touma, D. Anthropogenic warming has increased drought risk in California. Proc. Natl. Acad. Sci. USA 2015, 112, 3931–3936. [Google Scholar] [CrossRef] [PubMed]
  6. Schwartz, M.W.; Butt, N.; Dolanc, C.R.; Holguin, A.; Moritz, M.A.; North, M.P.; Safford, H.D.; Stephenson, N.L.; Thorne, J.H.; van Mantgem, P.J. Increasing elevation of fire in the Sierra Nevada and implications for forest change. Ecosphere 2015, 6, 1–10. [Google Scholar] [CrossRef]
  7. Alizadeh, M.R.; Abatzoglou, J.T.; Adamowski, J.; Modaresi Rad, A.; AghaKouchak, A.; Pausata, F.S.; Sadegh, M. Elevation-dependent intensification of fire danger in the western United States. Nat. Commun. 2023, 14, 1773. [Google Scholar] [CrossRef] [PubMed]
  8. Goss, M.; Swain, D.L.; Abatzoglou, J.T.; Sarhadi, A.; Kolden, C.A.; Williams, A.P.; Diffenbaugh, N.S. Climate change is increasing the likelihood of extreme autumn wildfire conditions across California. Environ. Res. Lett. 2020, 15, 094016. [Google Scholar] [CrossRef]
  9. Li, S.; Banerjee, T. Spatial and temporal pattern of wildfires in California from 2000 to 2019. Sci. Rep. 2020, 11, 8779. [Google Scholar] [CrossRef] [PubMed]
  10. Mote, P.W.; Li, S.; Lettenmaier, D.P.; Xiao, M.; Engel, R. Dramatic declines in snowpack in the western US. NPJ Clim. Atmos. Sci. 2018, 1, 2. [Google Scholar] [CrossRef]
  11. O’Leary III, D.S.; Hall, D.K.; DiGirolamo, N.E.; Riggs, G.A. Regional trends in snowmelt timing for the western United States throughout the MODIS era. Phys. Geogr. 2022, 43, 285–307. [Google Scholar] [CrossRef]
  12. Hemming-Schroeder, N.M.; Gutierrez, A.A.; Allison, S.D.; Randerson, J.T. Estimating individual tree mortality in the Sierra Nevada using lidar and multispectral reflectance data. J. Geophys. Res. Biogeosci. 2023, 128, e2022JG007234. [Google Scholar] [CrossRef]
  13. Knapp, P.A.; Soulé, P.T.; Mitchell, T.J.; Catherwood, A.A.; Lewis, H.S. Increasing radial growth in old-growth high-elevation conifers in Southern California, USA, during the exceptional “hot drought” of 2000–2020. Int. J. Biometeorl. 2024, 68, 743–748. [Google Scholar] [CrossRef]
  14. Available online: https://www.ncei.noaa.gov/access/monitoring/climate-at-a-glance/divisional/time-series/0407/tmin/12/10/1895-2023?trend=true&trend_base=10&begtrendyear=2000&endtrendyear=2023 (accessed on 10 February 2024).
  15. Breshears, D.D.; Cobb, N.S.; Rich, P.M.; Price, K.P.; Allen, C.D.; Balice, R.G.; Romme, W.H.; Kastens, J.H.; Floyd, M.L.; Belnap, J. Regional vegetation die-off in response to global-change-type drought. Proc. Natl. Acad. Sci. USA 2005, 102, 15144–15148. [Google Scholar] [CrossRef] [PubMed]
  16. AghaKouchak, A.; Mirchi, A.; Madani, K.; Di Baldassarre, G.; Nazemi, A.; Alborzi, A.; Anjileli, H.; Azarderakhsh, M.; Chlang, F.; Hassanzadeh, E. Anthropogenic drought: Definition, challenges, and opportunities. Rev. Geophys. 2021, 59, e2019RG000683. [Google Scholar] [CrossRef]
  17. Overpeck, J.T. The challenge of hot drought. Nature 2013, 503, 350–351. [Google Scholar] [CrossRef] [PubMed]
  18. Soulé, P.T.; Knapp, P.A. The evolution of “Hot” droughts in Southern California, USA from the 20th to the 21st century. J. Arid Environ. 2024, 220, 105118. [Google Scholar] [CrossRef]
  19. Swain, D.L.; Singh, D.; Horton, D.E.; Mankin, J.S.; Ballard, T.C.; Diffenbaugh, N.S. Remote linkages to anomalous winter atmospheric ridging over the northeastern Pacific. Geophys. Res. Atmos. 2017, 122, 12–194. [Google Scholar] [CrossRef]
  20. Francis, J.A.; Vavrus, S.J. Evidence linking Arctic amplification to extreme weather in mid-latitudes. Geophys. Res. Let. 2012, 39, L06801. [Google Scholar] [CrossRef]
  21. Francis, J.A.; Vavrus, S.J. Evidence for a wavier jet stream in response to rapid Arctic warming. Environ. Res. Let. 2015, 10, 014005. [Google Scholar] [CrossRef]
  22. Francis, J.A.; Vavrus, S.J. How is rapid Arctic warming influencing weather patterns in lower latitudes? Arctic Antarct. Alp. Res. 2021, 53, 219–220. [Google Scholar] [CrossRef]
  23. Cvijanovic, I.; Santer, B.D.; Bonfils, C.; Lucas, D.D.; Chiang, J.C.; Zimmerman, S. Future loss of Arctic sea-ice cover could drive a substantial decrease in California’s rainfall. Nat. Commun. 2017, 8, 1947. [Google Scholar] [CrossRef]
  24. Bonan, D.B.; Lehner, F.; Holland, M.M. Partitioning uncertainty in projections of Arctic sea ice. Environ. Res. Let. 2021, 16, 044002. [Google Scholar] [CrossRef]
  25. Briffa, K.R.; Jones, P.D.; Schweingruber, F.H. Tree-ring density reconstructions of summer temperature patterns across western North America since 1600. J. Clim. 1992, 5, 735–754. [Google Scholar] [CrossRef]
  26. Salzer, M.W.; Bunn, A.G.; Graham, N.E.; Hughes, M.K. Five millennia of paleotemperature from tree-rings in the Great Basin, USA. Clim. Dyn. 2014, 42, 1517–1526. [Google Scholar] [CrossRef]
  27. Seager, R.; Hoerling, M.; Schubert, S.; Wang, H.; Lyon, B.; Kumar, A.; Nakamura, J.; Henderson, N. Causes of the 2011–14 California drought. J. Clim. 2015, 28, 6997–7024. [Google Scholar] [CrossRef]
  28. Williams, A.P.; Cook, E.R.; Smerdon, J.E.; Cook, B.I.; Abatzoglou, J.T.; Bolles, K.; Baek, A.M.; Livneh, B. Large contribution from anthropogenic warming to an emerging North American megadrought. Science 2020, 368, 314–318. [Google Scholar] [CrossRef] [PubMed]
  29. Stahle, D.W.; Fye, F.K.; Cook, E.R.; Griffin, R.D. Tree-ring reconstructed megadroughts over North America since AD 1300. Clim. Chang. 2007, 83, 133–149. [Google Scholar] [CrossRef]
  30. Stahle, D.W.; Cook, E.R.; Cleaveland, M.K.; Therrell, M.D.; Meko, D.M.; Grissino-Mayer, H.D.; Watson, E.; Luckman, B.H. Tree-ring data document 16th century megadrought over North America. Eos 2000, 81, 121–125. [Google Scholar] [CrossRef]
  31. Carroll, A.L.; Sillett, S.C.; Palladini, M.; Campbell-Spickler, J. Dendrochronological analysis of Sequoia sempervirens in an interior old-growth forest. Dendrochronologia 2018, 52, 29–39. [Google Scholar] [CrossRef]
  32. Meko, D.M.; Stockton, C.W.; Boggess, W.R. A tree-ring reconstruction of drought in Southern California. J. Ofthe Am. Water Resour. Assoc. 1980, 16, 594–600. [Google Scholar] [CrossRef]
  33. Scuderi, L.A. A 2000-year tree ring record of annual temperatures in the Sierra Nevada mountains. Science 1993, 259, 1433–1436. [Google Scholar] [CrossRef]
  34. Sharp, R.V. San Jacinto fault zone in the Peninsular Ranges of southern California. GSA Bull. 1967, 78, 705–730. [Google Scholar] [CrossRef]
  35. Singer, E. Geology of the Imperial Valley California: A Monograph. 1998. Available online: https://nrm.dfg.ca.gov/FileHandler.ashx?DocumentID=8423 (accessed on 5 December 2023).
  36. Allen, B.H. Habitat Description: Mixed Sierran Conifer (SMC). 2005. Available online: https://nrm.dfg.ca.gov/FileHandler.ashx?DocumentID=67311 (accessed on 5 December 2023).
  37. Available online: https://psl.noaa.gov/data/usclimdivs/boundaries.html (accessed on 21 October 2023).
  38. U.S. Geological Survey. USGS 3D Elevation Program Digital Elevation Model. Available online: https://elevation.nationalmap.gov/arcgis/rest/services/3DEPElevation/ImageServer (accessed on 10 March 2024).
  39. Stokes, M.A. An Introduction to Tree-Ring Dating; University of Arizona Press: Tucson, AZ, USA, 1996; pp. 1–73. [Google Scholar]
  40. Guay, R. WinDENDRO: User’s Guide; Regent Instruments. Inc.: Quebec, QC, Canada, 2012. [Google Scholar]
  41. Holmes, R.L. Computer-assisted quality control in tree-ring dating and measurement. Tree-Ring Bull. 1983, 43, 69–78. [Google Scholar]
  42. Cook, E.R.; Holmes, R.L. Users Manual for Program ARSTAN; Laboratory of Tree-Ring Research, University of Arizona: Tucson, AZ, USA, 1986; pp. 50–65. [Google Scholar]
  43. Michaelsen, J. Cross-validation in statistical climate forecast models. J. Clim. Appl. Meteorol. 1987, 26, 1589–1600. [Google Scholar] [CrossRef]
  44. Fritts, H.C. Reconstructing Large-Scale Climatic Patterns from Tree-Ring Data; University of Arizona Press: Tucson, AZ, USA, 1991; pp. 1–286. [Google Scholar]
  45. Rodionov, S.N. A sequential algorithm for testing climate regime shifts. Geophys. Res. Lett. 2004, 31, L09204. [Google Scholar] [CrossRef]
  46. Rodionov, S.; Overland, J.E. Application of a sequential regime shift detection method to the Bering Sea ecosystem. ICES J. Mar. Sci. 2005, 62, 328–332. [Google Scholar] [CrossRef]
  47. Dai, A. The influence of the inter-decadal Pacific oscillation on US precipitation during 1923–2010. Clim. Dyn. 2013, 41, 633–646. [Google Scholar] [CrossRef]
  48. LaDochy, S.; Medina, R.; Patzert, W. Recent California climate variability: Spatial and temporal patterns in temperature trends. Clim. Res. 2007, 33, 159–169. [Google Scholar] [CrossRef]
  49. Available online: https://psl.noaa.gov/gcos_wgsp/Timeseries/Data/nino34.long.anom.data (accessed on 29 February 2024).
  50. Available online: https://www.ncei.noaa.gov/pub/data/cmb/ersst/v5/index/ersst.v5.pdo.dat (accessed on 29 February 2024).
  51. Available online: https://noaadata.apps.nsidc.org/NOAA/G02135/seaice_analysis/ (accessed on 29 February 2024).
  52. Esper, J.; Krusic, P.J.; Ljungqvist, F.C.; Luterbacher, J.; Carrer, M.; Cook, E.; Davi, N.K.; Hartl-Meier, C.; Kirdyanov, A.; Konter, O.; et al. Ranking of tree-ring based temperature reconstructions of the past millennium. Quat. Sci. Rev. 2016, 145, 134–151. [Google Scholar] [CrossRef]
  53. Williams, A.P.; Cook, B.I.; Smerdon, J.E. Rapid intensification of the emerging southwestern North American megadrought in 2020–2021. Nat. Clim. Chang. 2022, 12, 232–234. [Google Scholar] [CrossRef]
  54. Wahl, E.R.; Zorita, E.; Diaz, H.F.; Hoell, A. Southwestern United States drought of the 21st century presages drier conditions into the future. Commun. Earth Environ. 2022, 3, 202. [Google Scholar] [CrossRef]
  55. Heeter, K.J.; Harley, G.L.; Abatzoglou, J.T.; Anchukaitis, K.J.; Cook, E.R.; Coulthard, B.L.; Dye, L.A.; Homfeld, I.K. Unprecedented 21st century heat across the Pacific Northwest of North America. Npj Clim. Atmos. Sci. 2023, 6, 5. [Google Scholar] [CrossRef]
  56. Knapp, P.A.; Soulé, P.T. Spatio-Temporal Linkages between Declining Arctic Sea-Ice Extent and Increasing Wildfire Activity in the Western United States. Forests 2017, 8, 313. [Google Scholar] [CrossRef]
  57. Zou, Y.; Rasch, P.J.; Wang, H.; Xie, Z.; Zhang, R. Increasing large wildfires over the western United States linked to diminishing sea ice in the Arctic. Nat. Commun. 2021, 12, 6048. [Google Scholar] [CrossRef] [PubMed]
  58. González-Pérez, A.; Álvarez-Esteban, R.; Penas, Á.; del Río, S. Analysis of recent mean temperature trends and relationships with teleconnection patterns in California (US). App. Sci. 2022, 12, 5831. [Google Scholar] [CrossRef]
  59. Swain, D.L.; Horton, D.E.; Singh, D.; Diffenbaugh, N.S. Trends in atmospheric patterns conducive to seasonal precipitation and temperature extremes in California. Sci. Adv. 2016, 2, e1501344. [Google Scholar] [CrossRef] [PubMed]
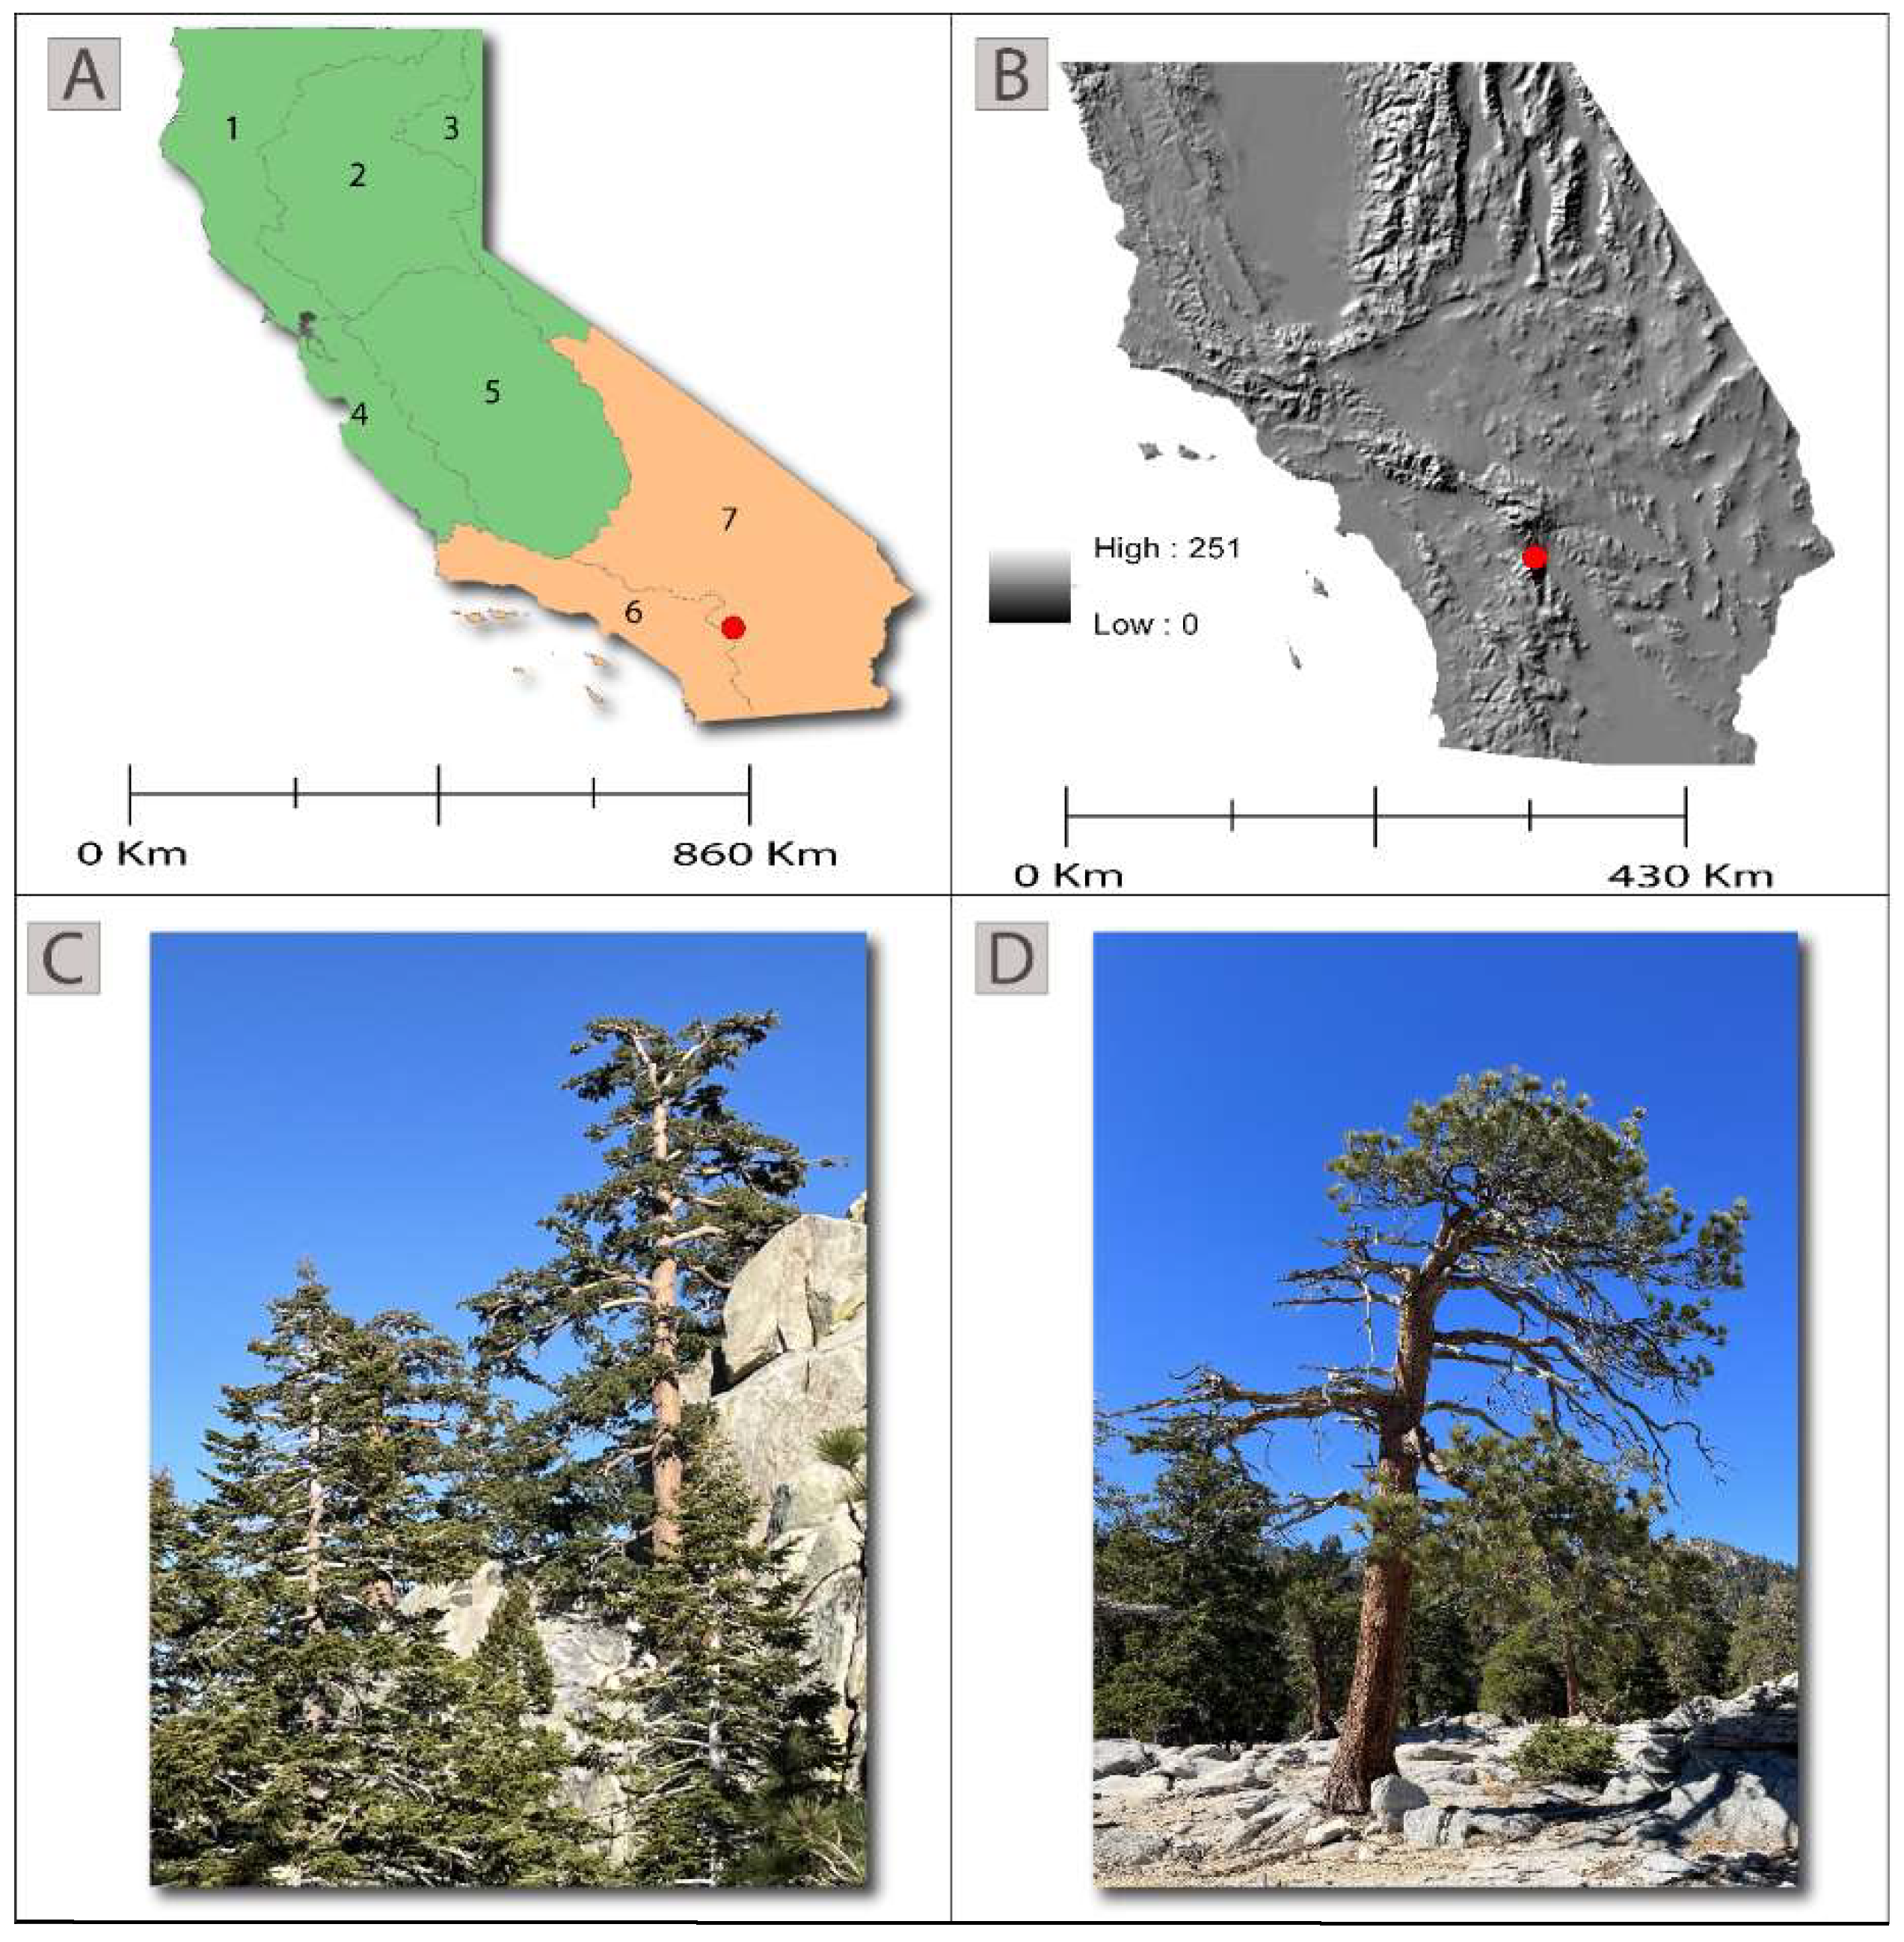
Figure 1. (A) Distribution of California climate divisions (CDs), including CDs 6 (used for this study) and CD 7 (location of study site). (B) Physiographic relief of southern California including the San Jacinto Mountains (red circle). Old-growth sugar pine (C) and Jeffrey pine (D) are common in the state park. Data sources for Figure A [37] and B [38].
Atmosphere 15 00649 g001
Figure 2. Monthly, seasonal, and annual Pearson correlation values between earlywood radial growth and temperature (A) and precipitation (B). All correlations with temperature were significant at p < 0.01, except for November, February, and May, which were significant at p < 0.05. There were no significant correlations (i.e., p > 0.05) between precipitation and radial growth.
Atmosphere 15 00649 g002
Figure 3. Reconstructed Tmin (black, °C) 1658–2020 (n = 363 years) with regime shifts (gray) superimposed. The multi-century chronology was characterized by four shifts (1658–1958, 1959–1979, 1980–2007, and 2008–2020), with the two warmest phases occurring during the past 41 years. Phase shifts mark significant (p < 0.05) changes in mean annual Tmin. Red lines display +2 (solid) and +1 (dashed) standard deviations. Blue lines display −2 (solid) and −1 (dashed) standard deviations.
Atmosphere 15 00649 g003
Figure 4. Comparison of instrumental Tmin (black) with reconstructed Tmin (green) during 1960–2020. Red bars (n = 11) represent years when a z-score difference between actual and reconstructed Tmin was > 1 and coincided with a year where either actual or reconstructed Tmin had a z-score > 1 or <−1.
Atmosphere 15 00649 g004
Table 1. Chronology statistics for the Jeffrey pine and sugar pine and Composite chronologies with Pearson correlation values for annual (prior November–current October) minimum temperature from CD6 1960–2020. Double asterisks indicate significance at p < 0.01.
ChronologySampled Trees (n)Cores (n)Series IntercorrelationMean SensitivityCorrelation with
Annual Tmin (r)
Jeffrey pine (JP)23420.650.280.61 **
Sugar pine (SP)28520.650.290.57 **
Composite
(JP & SP)
18260.590.280.71 **
Disclaimer/Publisher’s Note: The statements, opinions and data contained in all publications are solely those of the individual author(s) and contributor(s) and not of MDPI and/or the editor(s). MDPI and/or the editor(s) disclaim responsibility for any injury to people or property resulting from any ideas, methods, instructions or products referred to in the content.