1. Introduction
The stagnation of the atmosphere is one of the most important factors leading to the accumulation of pollutants in urbanized areas. Atmospheric stagnation occurs due to synoptic situations [
1] and the characteristic meteorological conditions [
2,
3], contributing to the accumulation of dispersion of impurities. There are many studies in this direction [
4,
5,
6,
7,
8]. Many works have noted that stagnation and recirculation of pollutants occur during prolonged weak (calm) winds [
9,
10], near surface stratification and, and temperature inversion [
11,
12]. The state of the atmosphere is influenced not only by the regional movement of air masses [
13], but also by the local movement [
14], including sea breezes, mountain-valley circulation (MVC) [
15,
16], and the urban heat island (UHI), which many researchers call the urban pollution island (UPI) [
17,
18,
19]. Furthermore, it is worth mentioning the seasonal influence of synoptic processes on the accumulation of pollutants in the atmosphere [
20,
21,
22].
This study is a continuation of previous work [
23,
24,
25] on modeling complex atmospheric processes occurring in the air basin of the city of Almaty, Kazakhstan (43°15′ N 76°54′ E). Almaty is a major urban center with a population exceeding 2 million people. The unique climate of Almaty is partly due to its position in the wind shadow of the towering Zailiyskiy Alatau mountains [
26]. While the southern city border follows the mountain range, with peaks reaching 4000–4600 m, the main urban areas occupy a gently sloping plain.
The environmentally unfavorable state of the air basin of Almaty [
20,
27,
28] is largely associated with the local peculiarities of meteorological processes in the foothill area, where the main built-up part of the city is located. This concerns frequent stagnant air conditions, especially in the city center [
26]. In the southern part, mountain-valley winds dominate [
29], while latitudinal transfer prevails in the north [
30,
31]. Unfortunately, these local winds are weak, typically only 1–2 m/s, and are unable to effectively disperse pollutants or move them out of the city, resulting in their confinement. This situation is further exacerbated by a capping inversion layer that traps pollutants near the ground and hinders vertical air exchange. Calm and low-wind conditions are especially common, occurring in 71% of summer cases and reaching around 80% in autumn and winter [
31]. The stagnant state of the atmosphere in Almaty is exacerbated by rapid population growth. Buildings and other urban infrastructure objects impede the already weak wind, and the increasing emission of pollutants contributes to their accumulation in the lower atmospheric layer.
As evidenced by the experience of major cities [
32,
33,
34], the development of an expert system is crucial for making informed decisions regarding air pollution control measures. The rapid growth of Almaty necessitates the creation of a similar expert system to effectively address its air quality challenges. Building such a system solely based on meteorological data is impossible due to their spatial and temporal limitations. This directly relates to the city of Almaty, where within the city limits and its influence zone, there are only a limited number of weather stations, where measurements are performed only eight times a day.
The primary objective of this study is to analyze the wind and thermal regimes of Almaty City based on the results of mesoscale modeling during environmentally unfavorable periods. To achieve this objective, the following key tasks, which are of scientific interest for understanding atmospheric stagnation conditions in Almaty City, will be addressed: (1) the dynamics of the inversion layer; (2) development of the urban heat island; (3) thermal and wind regimes.
Therefore, this study employed the Weather Research and Forecasting Model (WRF) [
35], adapted for Almaty’s specific conditions. Modeling in WRF is carried out using a land-use Local Climate Zone (LCZ) map as the underlying surface, divided into 10 types of urban infrastructure and 7 types of natural landscapes. This approach is applied to modeling highly rugged terrain and in the presence of urbanized areas with diverse categories of urban development [
36,
37,
38].
The research methodology, including information support, configuration of nested domains, methods of parameterizing microphysical processes adapting WRF to the conditions of the city of Almaty, as well as methods of analyzing the obtained results, are presented in
Section 2.
Section 3 of this work is dedicated to the analysis of the modeling results of these processes.
Section 3.1 provides a comparison of the modeling results with data from natural observations at weather stations located in the city of Almaty and its surroundings to confirm the adequate performance of the model. The formation patterns of surface and elevated inversions and the associated diurnal and nocturnal phases of mountain-valley circulation are described. Additionally, a comparison of air potential temperature profiles based on radiosonde data and the model is conducted (
Section 3.2). Another important indicator of the stagnant state of urban air is the urban heat island. Its structure and dynamics are vividly demonstrated by comparing calculations “with the city” and “without the city”. The influence of the wind regime of the city of Almaty on changes in the configuration of the UHI is shown (
Section 3.3).
For the city of Almaty, the most environmentally unfavorable season is autumn-winter, accompanied by increasing emissions of pollutants and the maximum frequency of calm situations, especially in January [
26]. This work focuses specifically on these January meteorological factors affecting the atmospheric environmental condition. Therefore, in
Section 3.4, a statistical analysis of temperature and wind regimes for four synoptic situations characterized by stagnant atmospheric phenomena conducive to the accumulation of harmful pollutants is conducted based on modeling data for January of 2022, 2023, and 2024. Ventilation maps are constructed to provide an understanding of the spatial distribution of wind speed and maps of the frequency of weak wind occurrences in the territory of Almaty.
2. Materials and Methods
Based on previous work [
23,
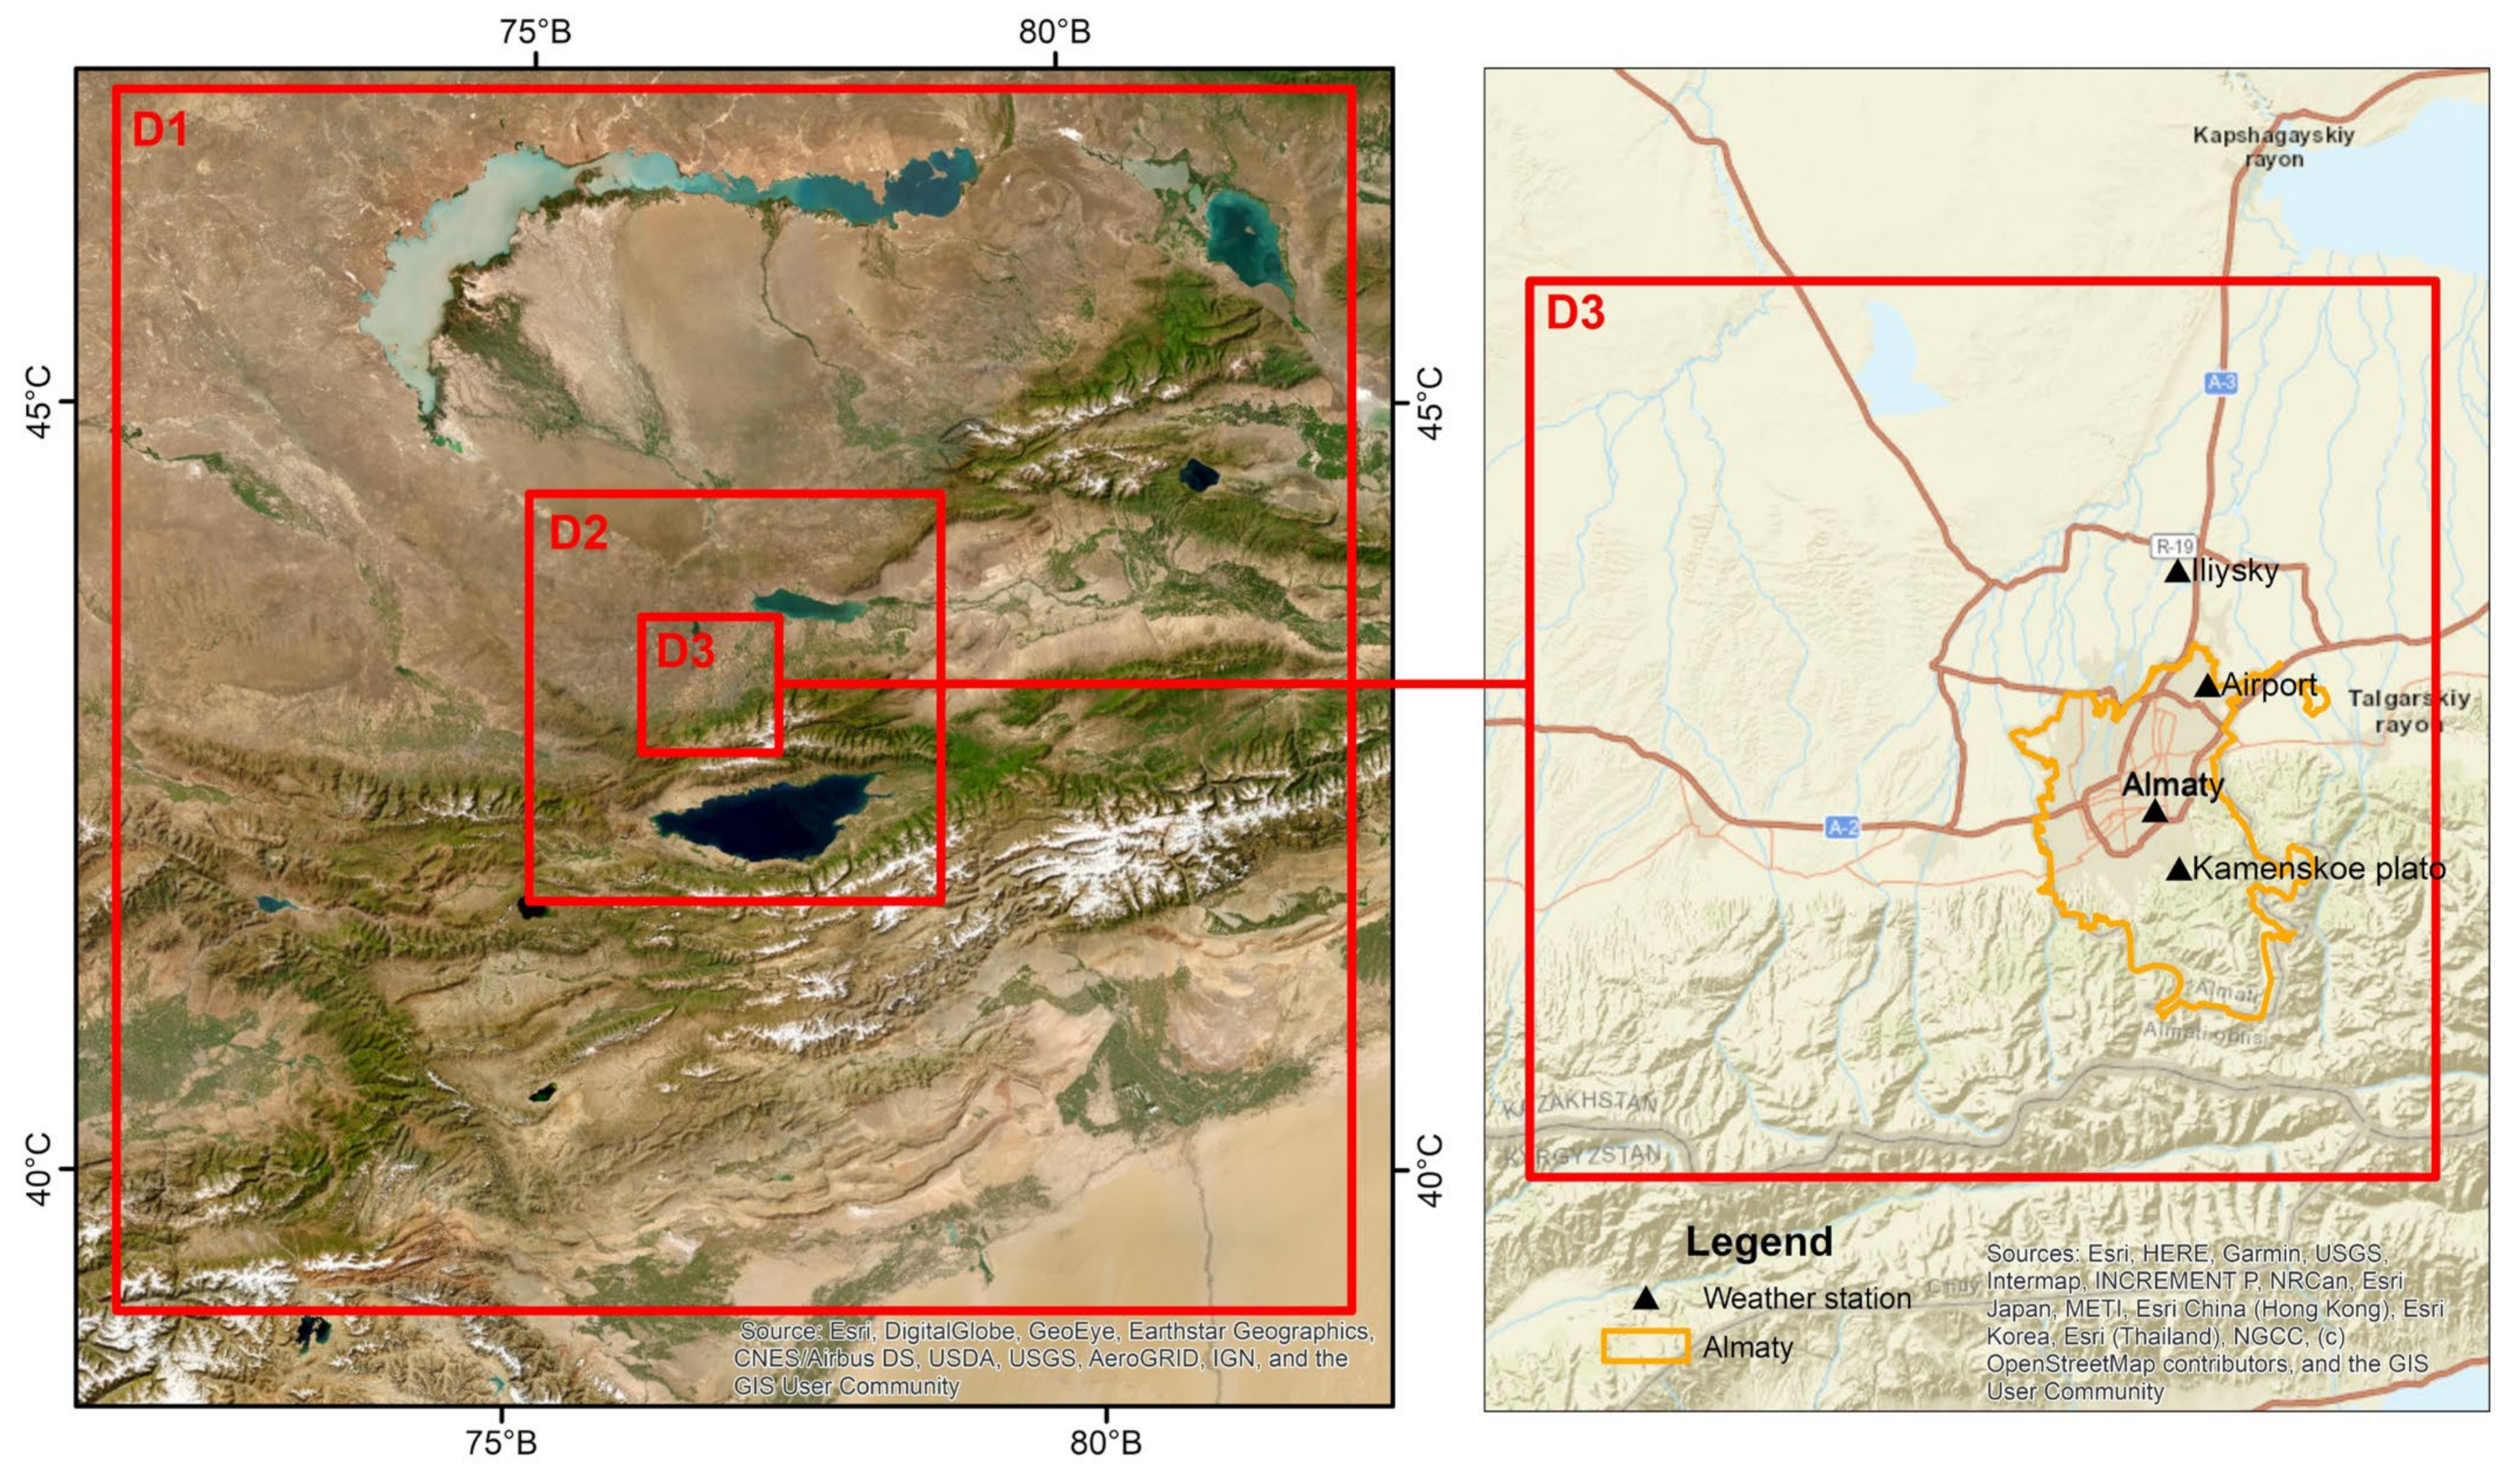
25], in this study, the WRF model of version 4.3 was used, for which three nested domains, D1, D2 and D3, were established in the Lambert conformal conic projection. The domains have grid resolutions of 9 km, 3 km, and 1 km, respectively. Each domain encompasses 100 nodes in both the west–east and south–north directions. Time steps for simulations within D1, D2, and D3 are 18, 6, and 2 s, respectively. The input parameters were modernized compared to prior research.
Firstly, the location of domain D3 (
Figure 1) was strategically adjusted to better capture the influence of the Zailiyskiy Alatau mountain’s intricate topography on the domain boundaries. This optimization ensures more accurate simulations within the domain.
Secondly, the number of vertical layers was increased to 45. Additionally, the minimum vertical resolution in the building layer was reduced to 4 m. These enhancements allow for a more precise implementation of the multi-level BEP (Building Environment Parameterization) model [
39] for detailed calculations of the UHI.
Thirdly, instead of three urban classes, a map of Local Climate Zones of land use was developed and incorporated uploaded as input information (
Figure 2). The high-resolution map (100 m) includes ten distinct urban classes (LCZ 1-LCZ 10) and seven natural landscape classes (LCZ A-LCZ G). This represents a significant improvement over previous approaches that utilized only three urban classes.
The WRF simulations were initialized with topographic data from the ASTER Global Digital Elevation Model (GDEM) database [
40]. Initial and boundary conditions were obtained from the Global Forecast System (GFS) [
41] global product of the National Centers for Environmental Prediction (NCEP). The GFS data have a spatial resolution of 0.25° × 0.25° and a time step of 3 h.
The following microphysical process parameterization methods adopted from previous works [
25] were maintained: WSM6 (WRF-Single-Moment-6-Class Microphysics Scheme) for cloud microphysics parameterization [
42]; RRTMG (Rapid Radiative Transfer Model for General Circulation Models) for parameterizing shortwave and longwave radiation [
43]; MOST for parameterization of the surface layer of agricultural areas according to the Monin–Obukhov similarity theory [
44]; BEP (Building Environment Parameterization) for urban areas [
39]; BouLac for parameterization of the Bougeault–Lacarrère planetary boundary layer [
45]; KF for Kain–Fritsch convective parameterization scheme [
46]; 2D Smagorinsky for parameterization of turbulence (horizontal turbulent diffusion) [
35].
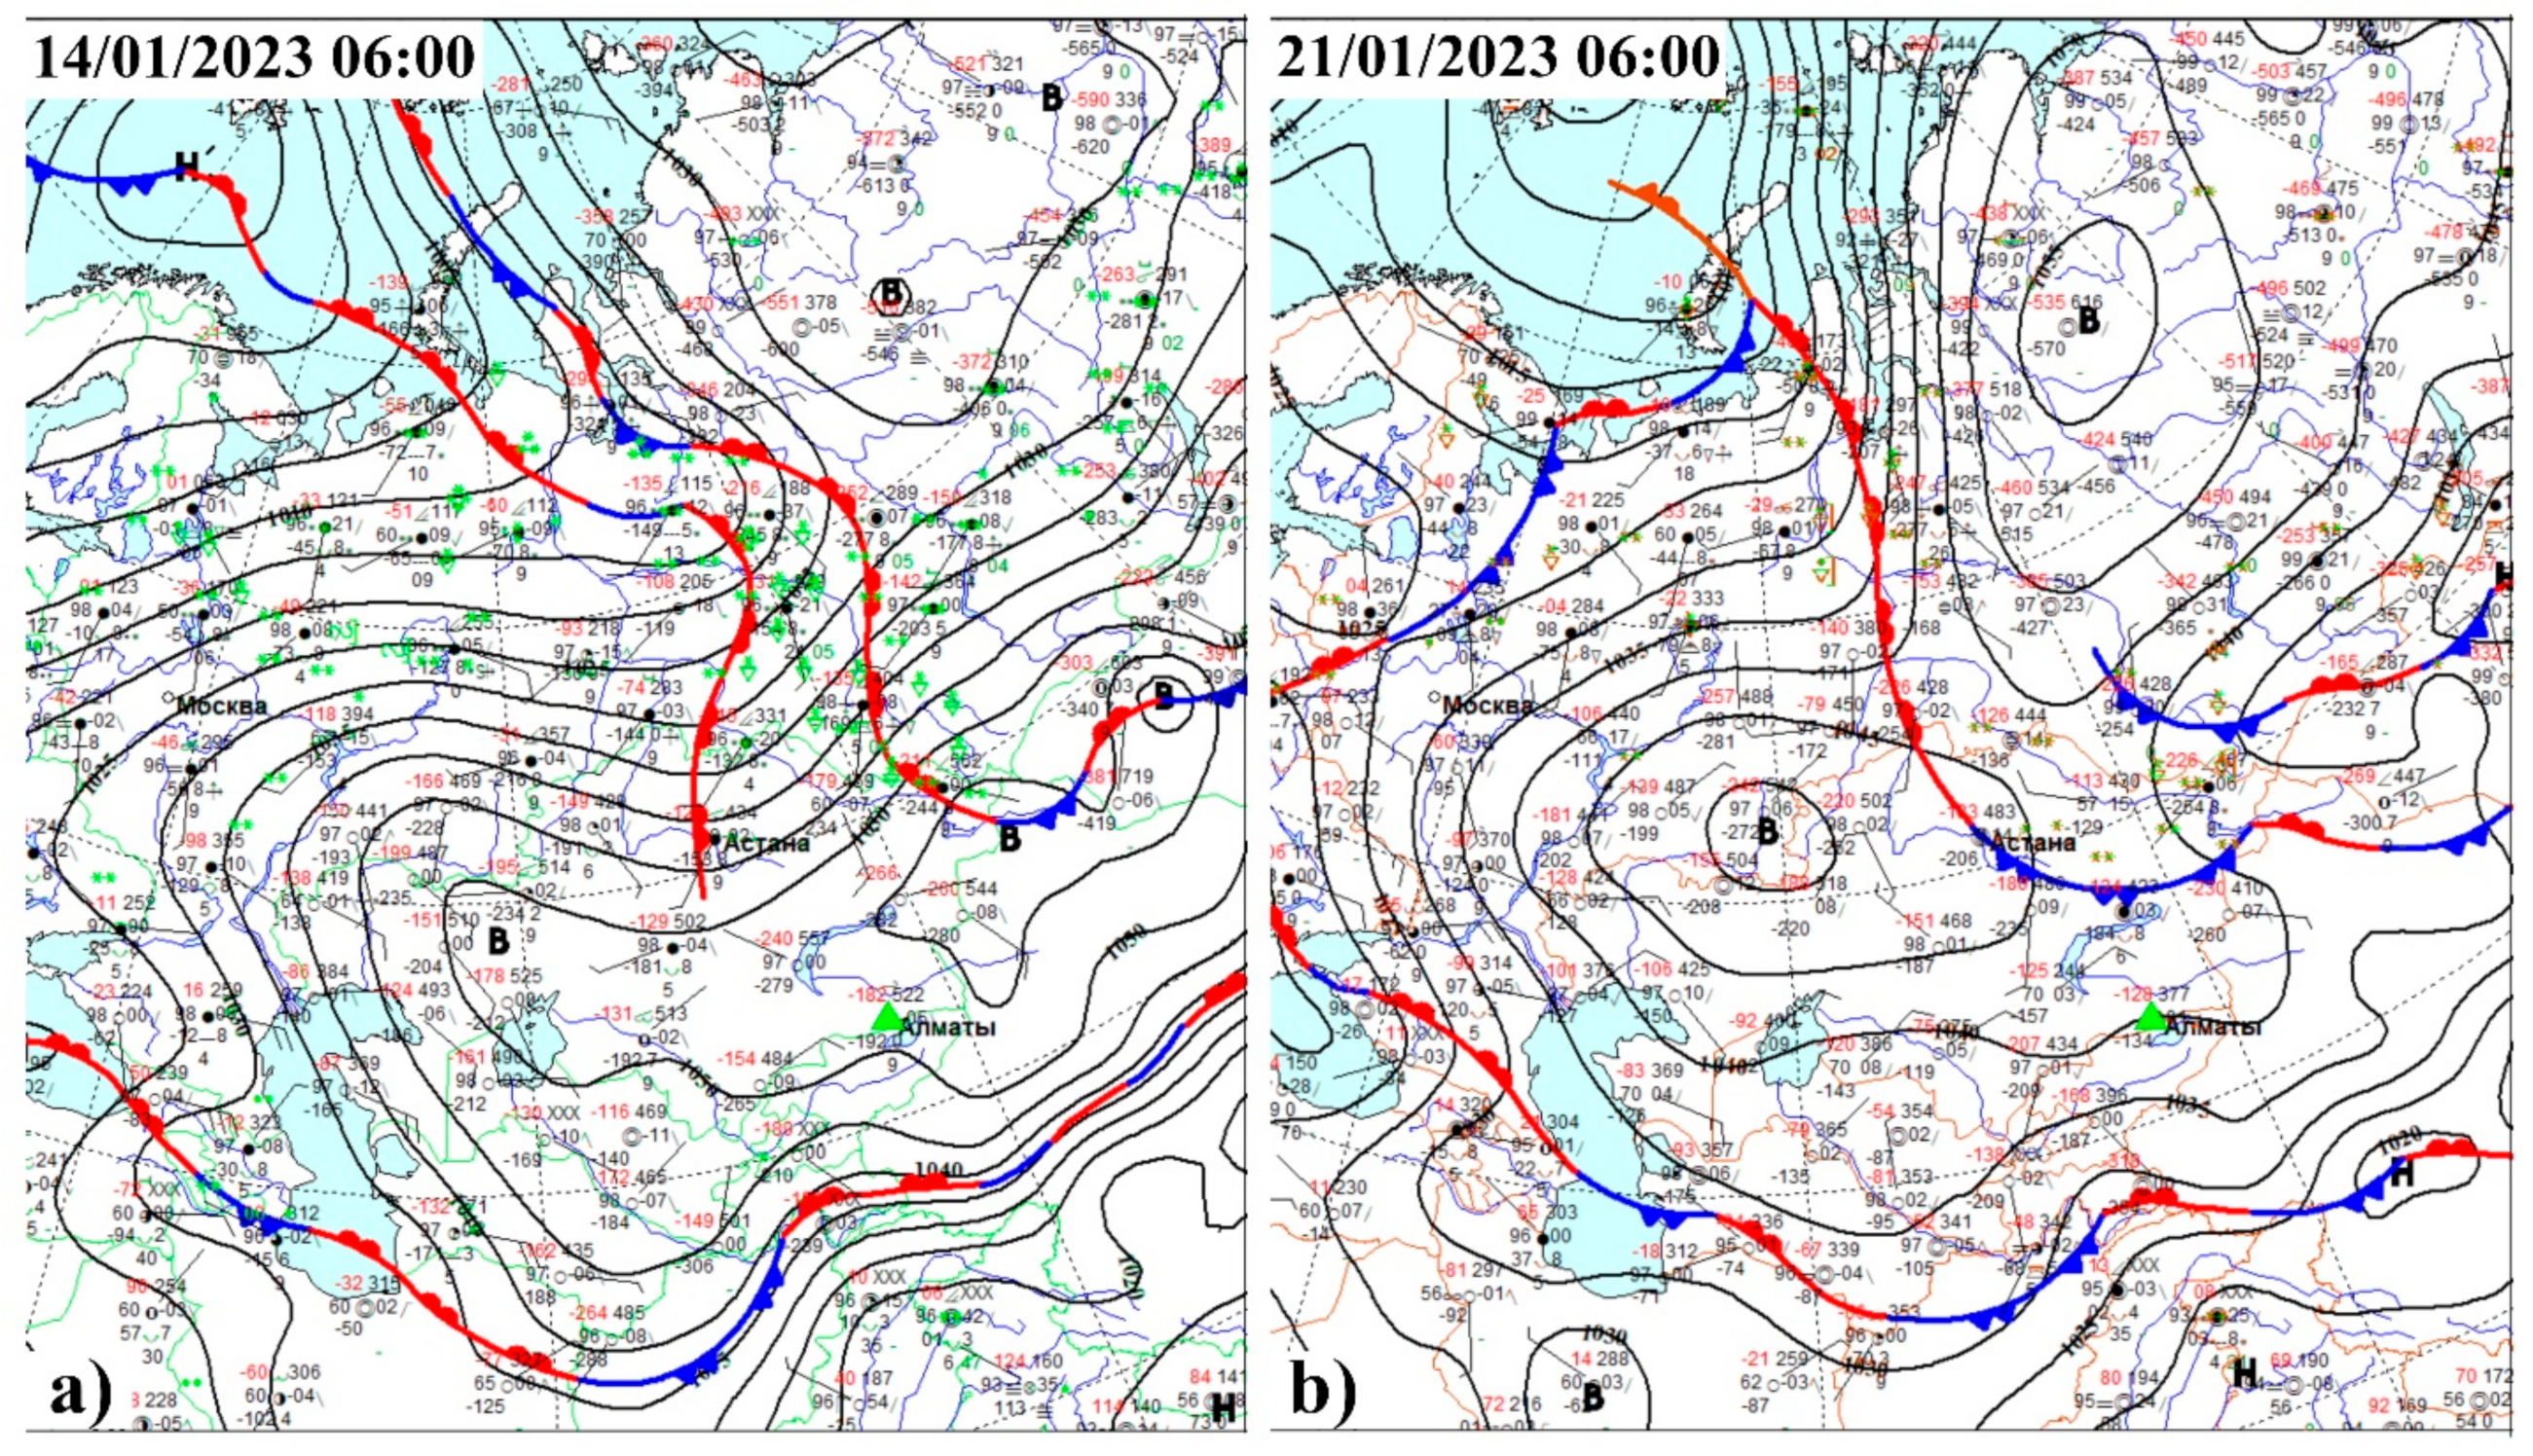
For the numerical simulations, an anticyclonic period from 13 to 23 January 2023 was selected, which is a typical weather pattern during the winter season in Almaty (
Figure 3) [
47]. The modeling results were compared with meteorological observation data from the Kazhydromet network (National hydrometeorological service of Kazakhstan). For this purpose, the following meteorological observation data stations were chosen: Almaty, Airport, Iliysky, and Kamenskoye Plato (
Figure 1 and
Figure 2). These stations are located within the city’s influence zone, unlike the other stations that are situated high in the mountains or far from Almaty. Meteorological observation data with an 8-time-per-day frequency are available in the “Weather in 241 Countries of the World” database [
48]. The calculation of the first day was not included in the comparative analysis, as it was used for model spin-up.
Model performance was assessed using the following statistical metrics: mean bias (
BIAS), mean absolute error (
MAE), and root mean square error (
RMSE) [
49].
Here, represents the calculated value at the i-th moment in time, while denotes observations from weather stations at the i-th moment in time. The variable n denotes the total number of measurements from weather stations at various time points. The aforementioned statistical metrics were employed to evaluate the accuracy of the model’s simulations of temperature, wind speed, and wind direction.
The dynamics of the inversion layer were investigated through the construction of vertical profiles of simulated temperature and wind speed. Additionally, a comparison was conducted between radiosonde data acquired twice daily (06:00 and 18:00 local time) at the aerological station near Almaty airport (lon 76.93, lat 43.24) [
50] and the simulated meteorological parameters.
Due to the limited network of weather stations within Almaty, it was decided to employ remotely sensed data from Landsat-9 satellite imagery [
51] for model verification. Landsat-9 offers a spatial resolution of 30 m, enabling detailed analysis of surface temperatures. To compare land-surface temperatures, the following graphs were constructed: Landsat-9 thermal infrared sensor (TIRS) Band 10; WRF surface skin temperature (TSK); WRF air temperature at 2 m (T2).
To comprehensively investigate the UHI effect, a series of maps were generated. These maps depict the difference between the thermal field with urban land cover and a corresponding thermal field without urban land cover. The latter was created by replacing urban classes in the land-use map with grasslands. This series included both instantaneous UHI values and UHI averaged for the 14–23 January 2023 test period. Nighttime UHI was averaged from 21:00 to 9:00 local time, while daytime UHI was averaged from 9:00 to 21:00 local time. There is also a simplified method for evaluating UHI intensity, which involves calculating the difference between the average temperature in the city and in an unbuilt area.
A comprehensive statistical analysis of the thermal and wind regimes was conducted for Januaries of 2022, 2023, and 2024. This analysis focused on the following four specific synoptic conditions associated with high air pollution events in Almaty: anticyclonic ridge, low-gradient field (LGF) of high pressure, LGF of low pressure, and warm sector of a cyclone. These synoptic situations are known to contribute to air pollution in Almaty, and Kazhydromet has classified them as environmentally unfavorable.
In Almaty, the primary mechanism for atmospheric cleansing during the winter season is the arrival of precipitation. To illustrate this phenomenon, a joint analysis was conducted, encompassing precipitation data recorded at Kazhydromet weather stations [
48] and daily PM
2.5 concentrations derived from measurements at monitoring stations [
52].
A comprehensive statistical analysis of temperature and wind regimes was conducted utilizing multiple simulations of meteorological fields using the WRF model for selected time periods. Employing the T2 parameter, maps depicting the average daily (09:00 to 21:00) and average nighttime (21:00 to 09:00) air temperature at 2 m were constructed. Additionally, based on the U10 and V10 parameters, maps illustrating the average wind speed at 10 m and the frequency of calm wind conditions were generated.
The construction of maps was carried out using the following formulas for calculating arithmetic mean values:
Here, 1 ≤ r ≤ R, where R is the number of synoptic situations, k is a coefficient indicating the time of day, when k = 1 is daytime, k = 2 is nighttime, is a set of wind speed maps, the elements of which are wind speed maps for time moment m, related to time of day k and synoptic situation r, = power of the set , set of air temperature maps, the elements of which are air temperature maps for time moment m, related to time of day k and synoptic situation r, = power of the set .
3. Results and Discussion
3.1. Comparison of Simulation Results with Observational Data
Figure 4 and
Figure 5 compares the stimulated temperatures with measurements from designated weather stations. Overall, the model appropriately captures the daily temperature variations. However, there are some deviations from the model. At the Almaty station, the model fails to reach the daytime maximums and does not adequately match the nighttime minimums, with discrepancies up to 3 °C between field measurements and simulations. Similarly, at the Airport and Iliysky weather stations, the model underestimates temperature extremes, displaying lower temperatures compared to field measurements for both nighttime and daytime. During the end of the anticyclonic period, daytime temperature differences can reach up to 6 °C. Notably, the model effectively reproduces the air heating dynamics on the mountain plateau observed at the Kamenskoe Plato weather station.
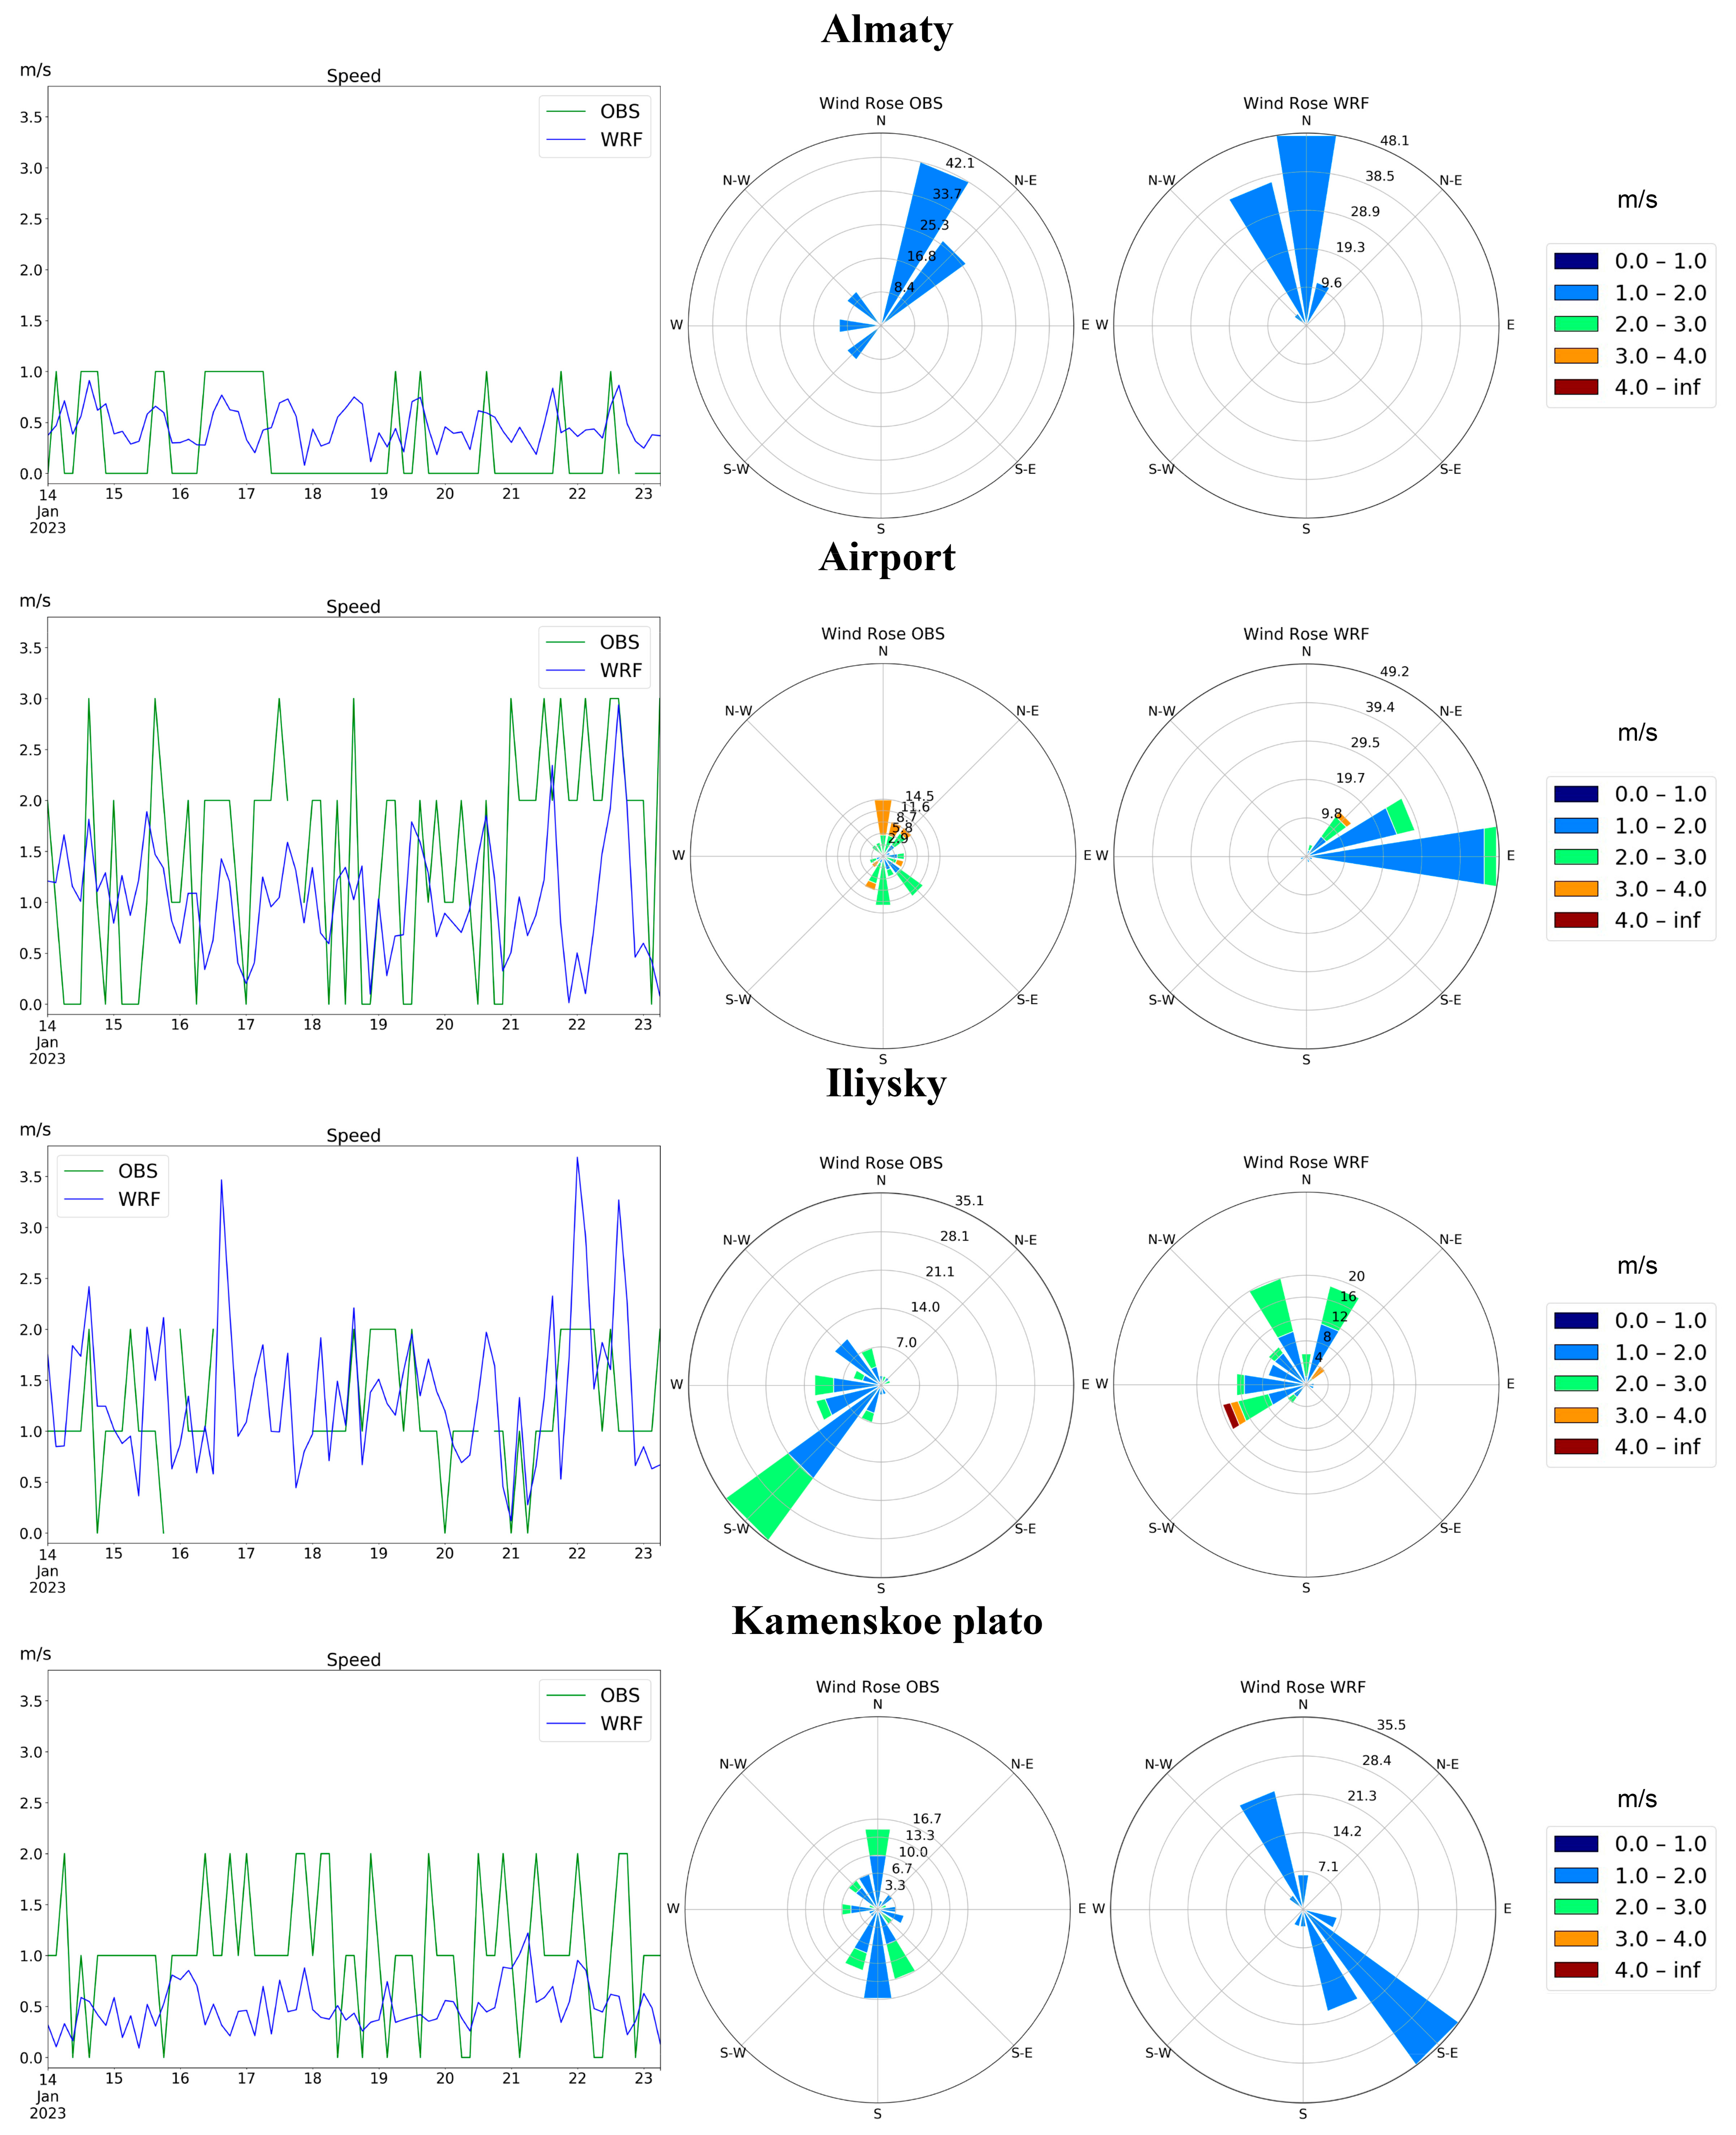
Since wind measurements at weather stations are rounded to integer values, comparing the ranges of measured and modeled wind speeds is more meaningful than comparing specific values (
Figure 5). At the Almaty station, both measured and modeled wind speeds fall within a range of 0 to 1 m/s, indicating good agreement between the model and observations. This pattern slightly differs at the Airport. Here, modeled winds range from 0 to 2 m/s (excluding occasional gusts at the end of anticyclones), while measured winds can reach up to 3 m/s. A contrasting trend in wind patterns is observed at the Iliysky weather station. While the measured wind speed at this station ranges from 0 to 2 m/s, the simulated wind speed reaches up to 3.5 m/s. The Kamenskoe Plato station shows a similar trend, with modeled winds being slightly weaker (0 to 1 m/s) compared to measured values (0 to 2 m/s). Overall, the model effectively captures the characteristic low wind activity in Almaty and its immediate suburbs.
As expected for low wind conditions and complex terrain, particularly in urban areas [
53], the 1 km resolution of the WRF model limits its ability to capture the fine-scale details of air mass movement. This limitation is evident in the wind rose diagrams (
Figure 5), which show discrepancies between observed and simulated wind directions. Notably, the smallest differences in the dominant direction are observed at the Almaty and Kamenskoe Plato stations.
The complex wind patterns observed at the four weather stations can be attributed to their distinct locations within different local climate zones, topographic conditions and consequently, exposure to varying wind regimes. Kamenskoe Plato lies within the influence of mountain-valley circulation, characterized by low wind speeds. Almaty, situated in a densely built-up urban area, experiences frequent calm conditions. The airport station is located at the boundary between the urban area and the plain, while Iliysky, situated in the plain region, falls within the zone of latitudinal transfer. Additionally, the discrepancies between the calculated and observed wind speed and direction values were attributed to errors introduced during the generalization of the initial 100 m resolution to 1 km in the local climate zones.
Table 1 displays error estimates for temperature, wind speed, and wind direction for the four weather stations under consideration.
As expected, the highest error estimates are observed for wind direction. While the model partially captured the dominant wind patterns (see the diagrams of wind roses in
Figure 5), the errors remain significant for all weather stations due to weak winds and complex terrain.
3.2. Inversion Layer
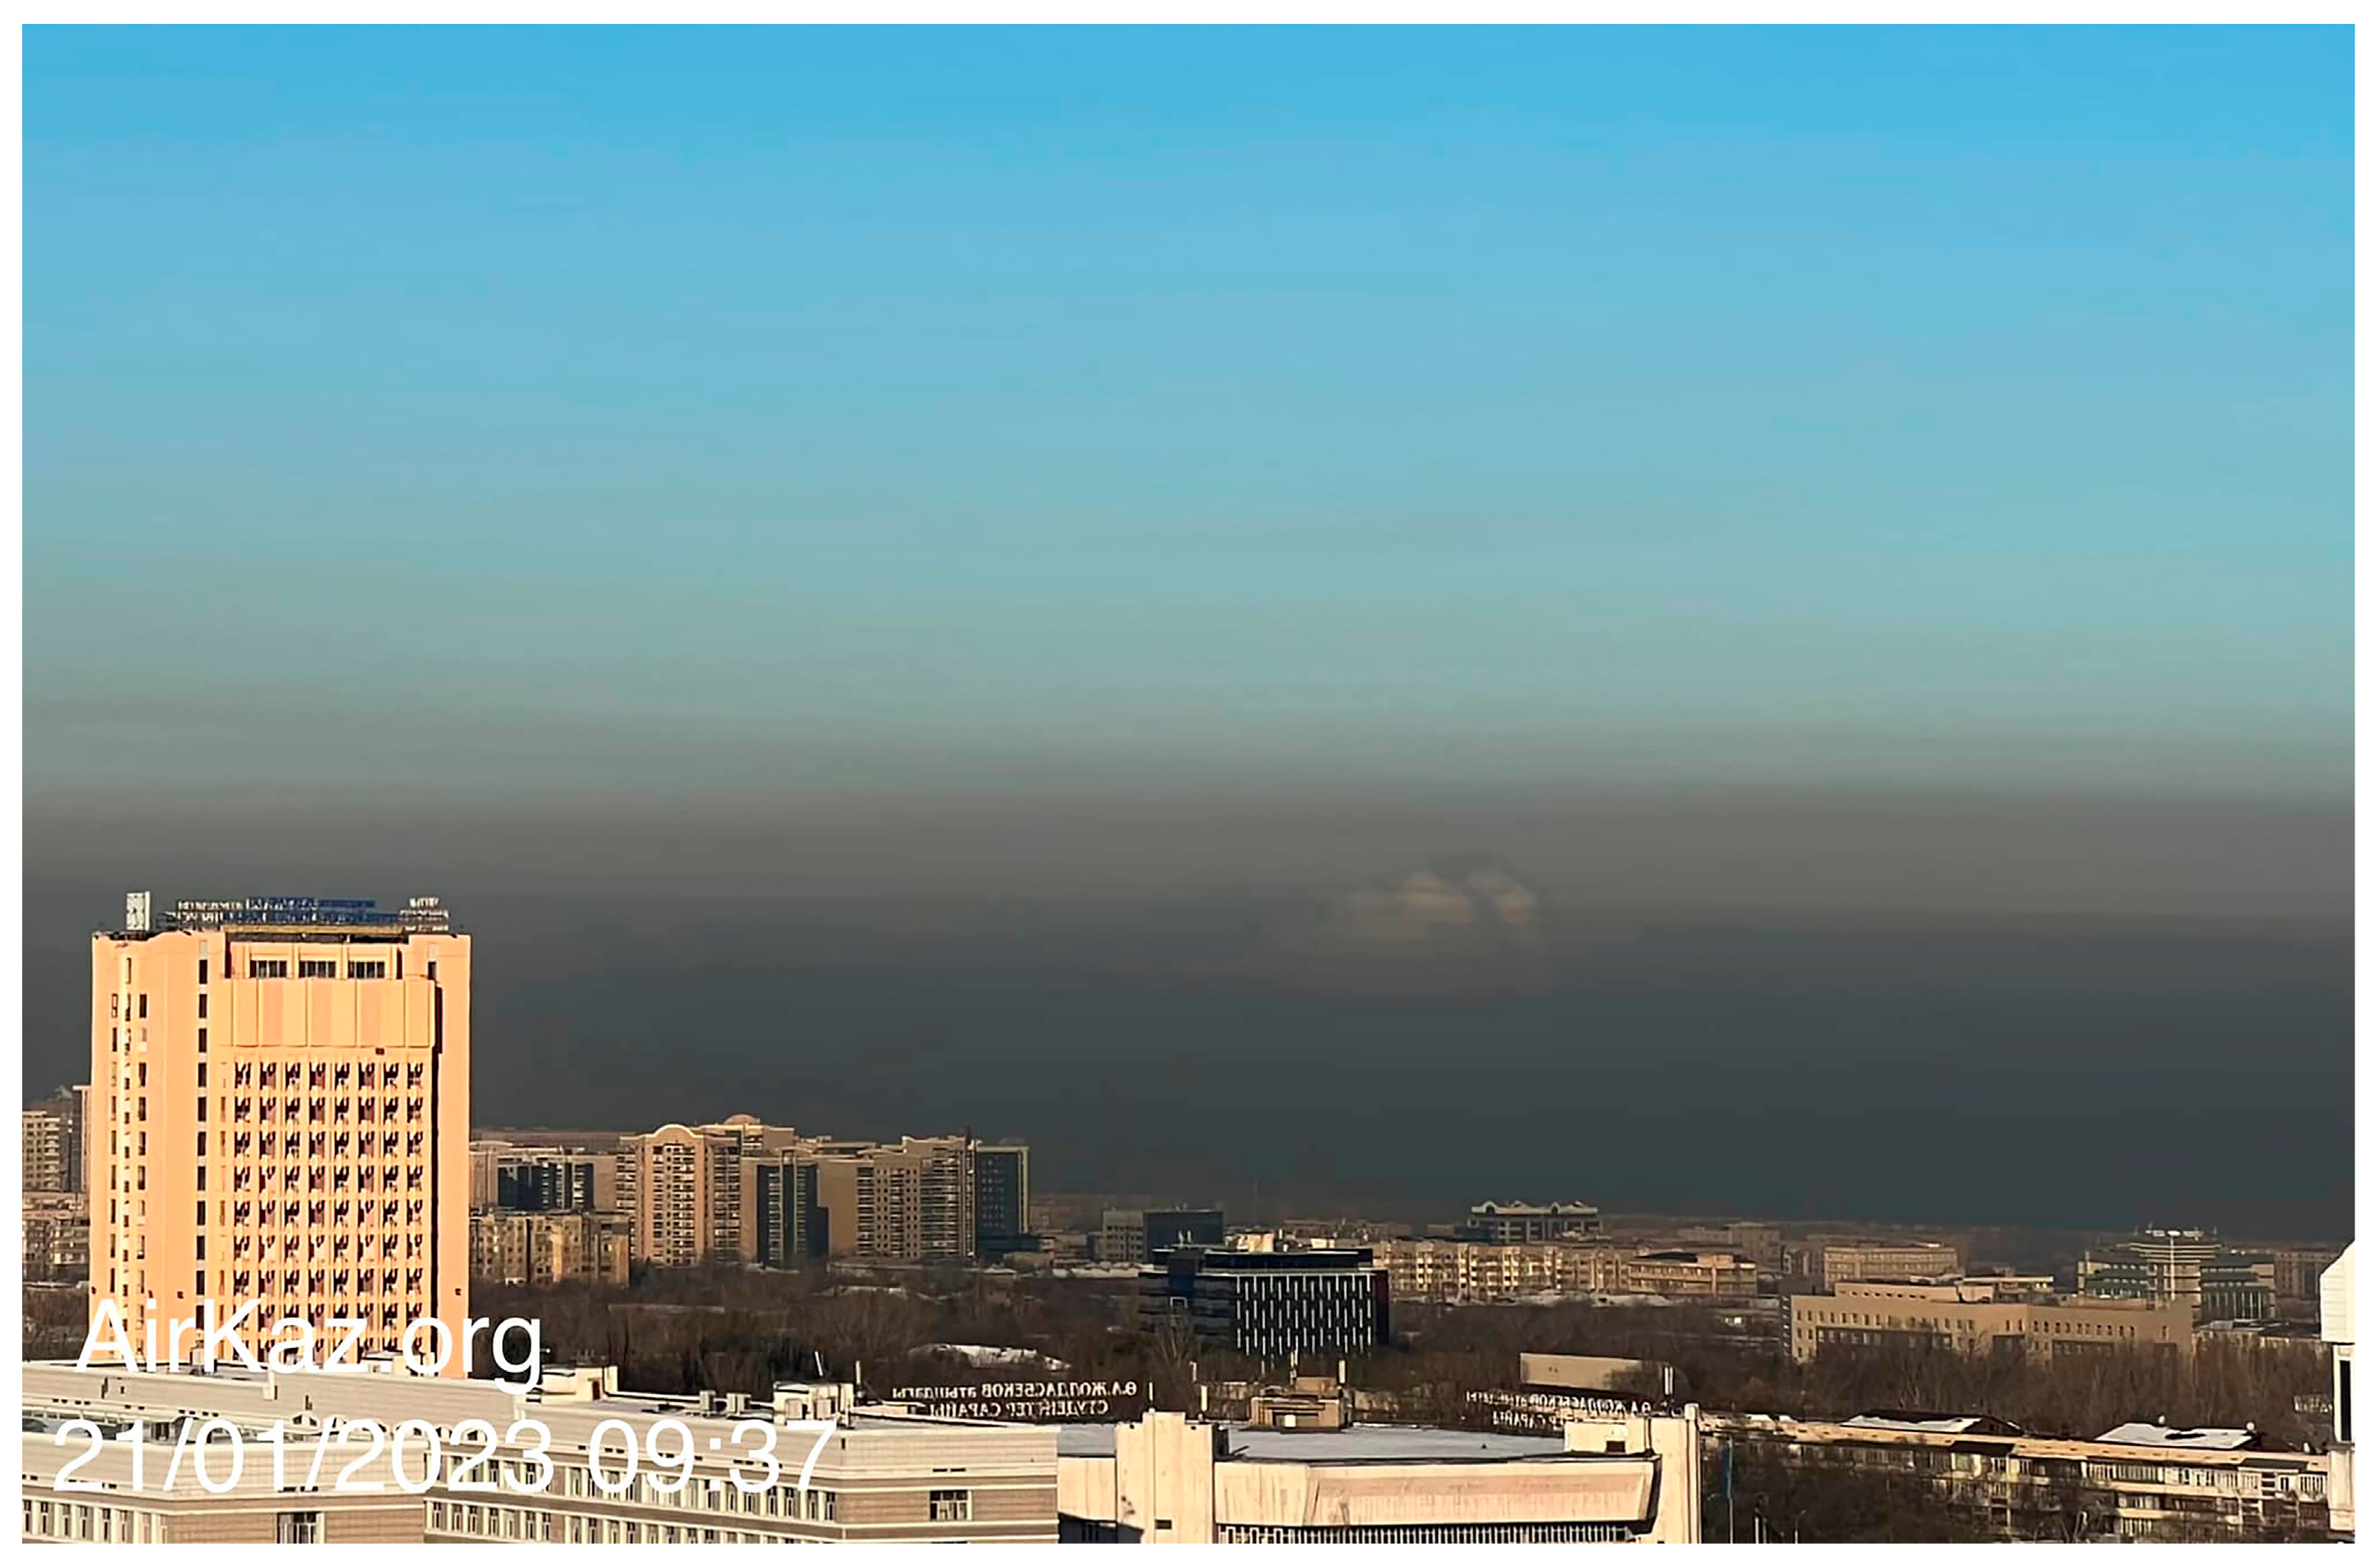
One of the primary meteorological factors contributing to Almaty’s stagnant atmospheric conditions is its inversion layer. This layer acts as a barrier, preventing vertical air exchange.
Figure 6 illustrates the detrimental impact of a blocking inversion on the ecological state of the city’s atmosphere.
A series of WRF model simulations were performed to analyze the structure of the inversion layer during the anticyclonic period from 13 to 23 January 2023.
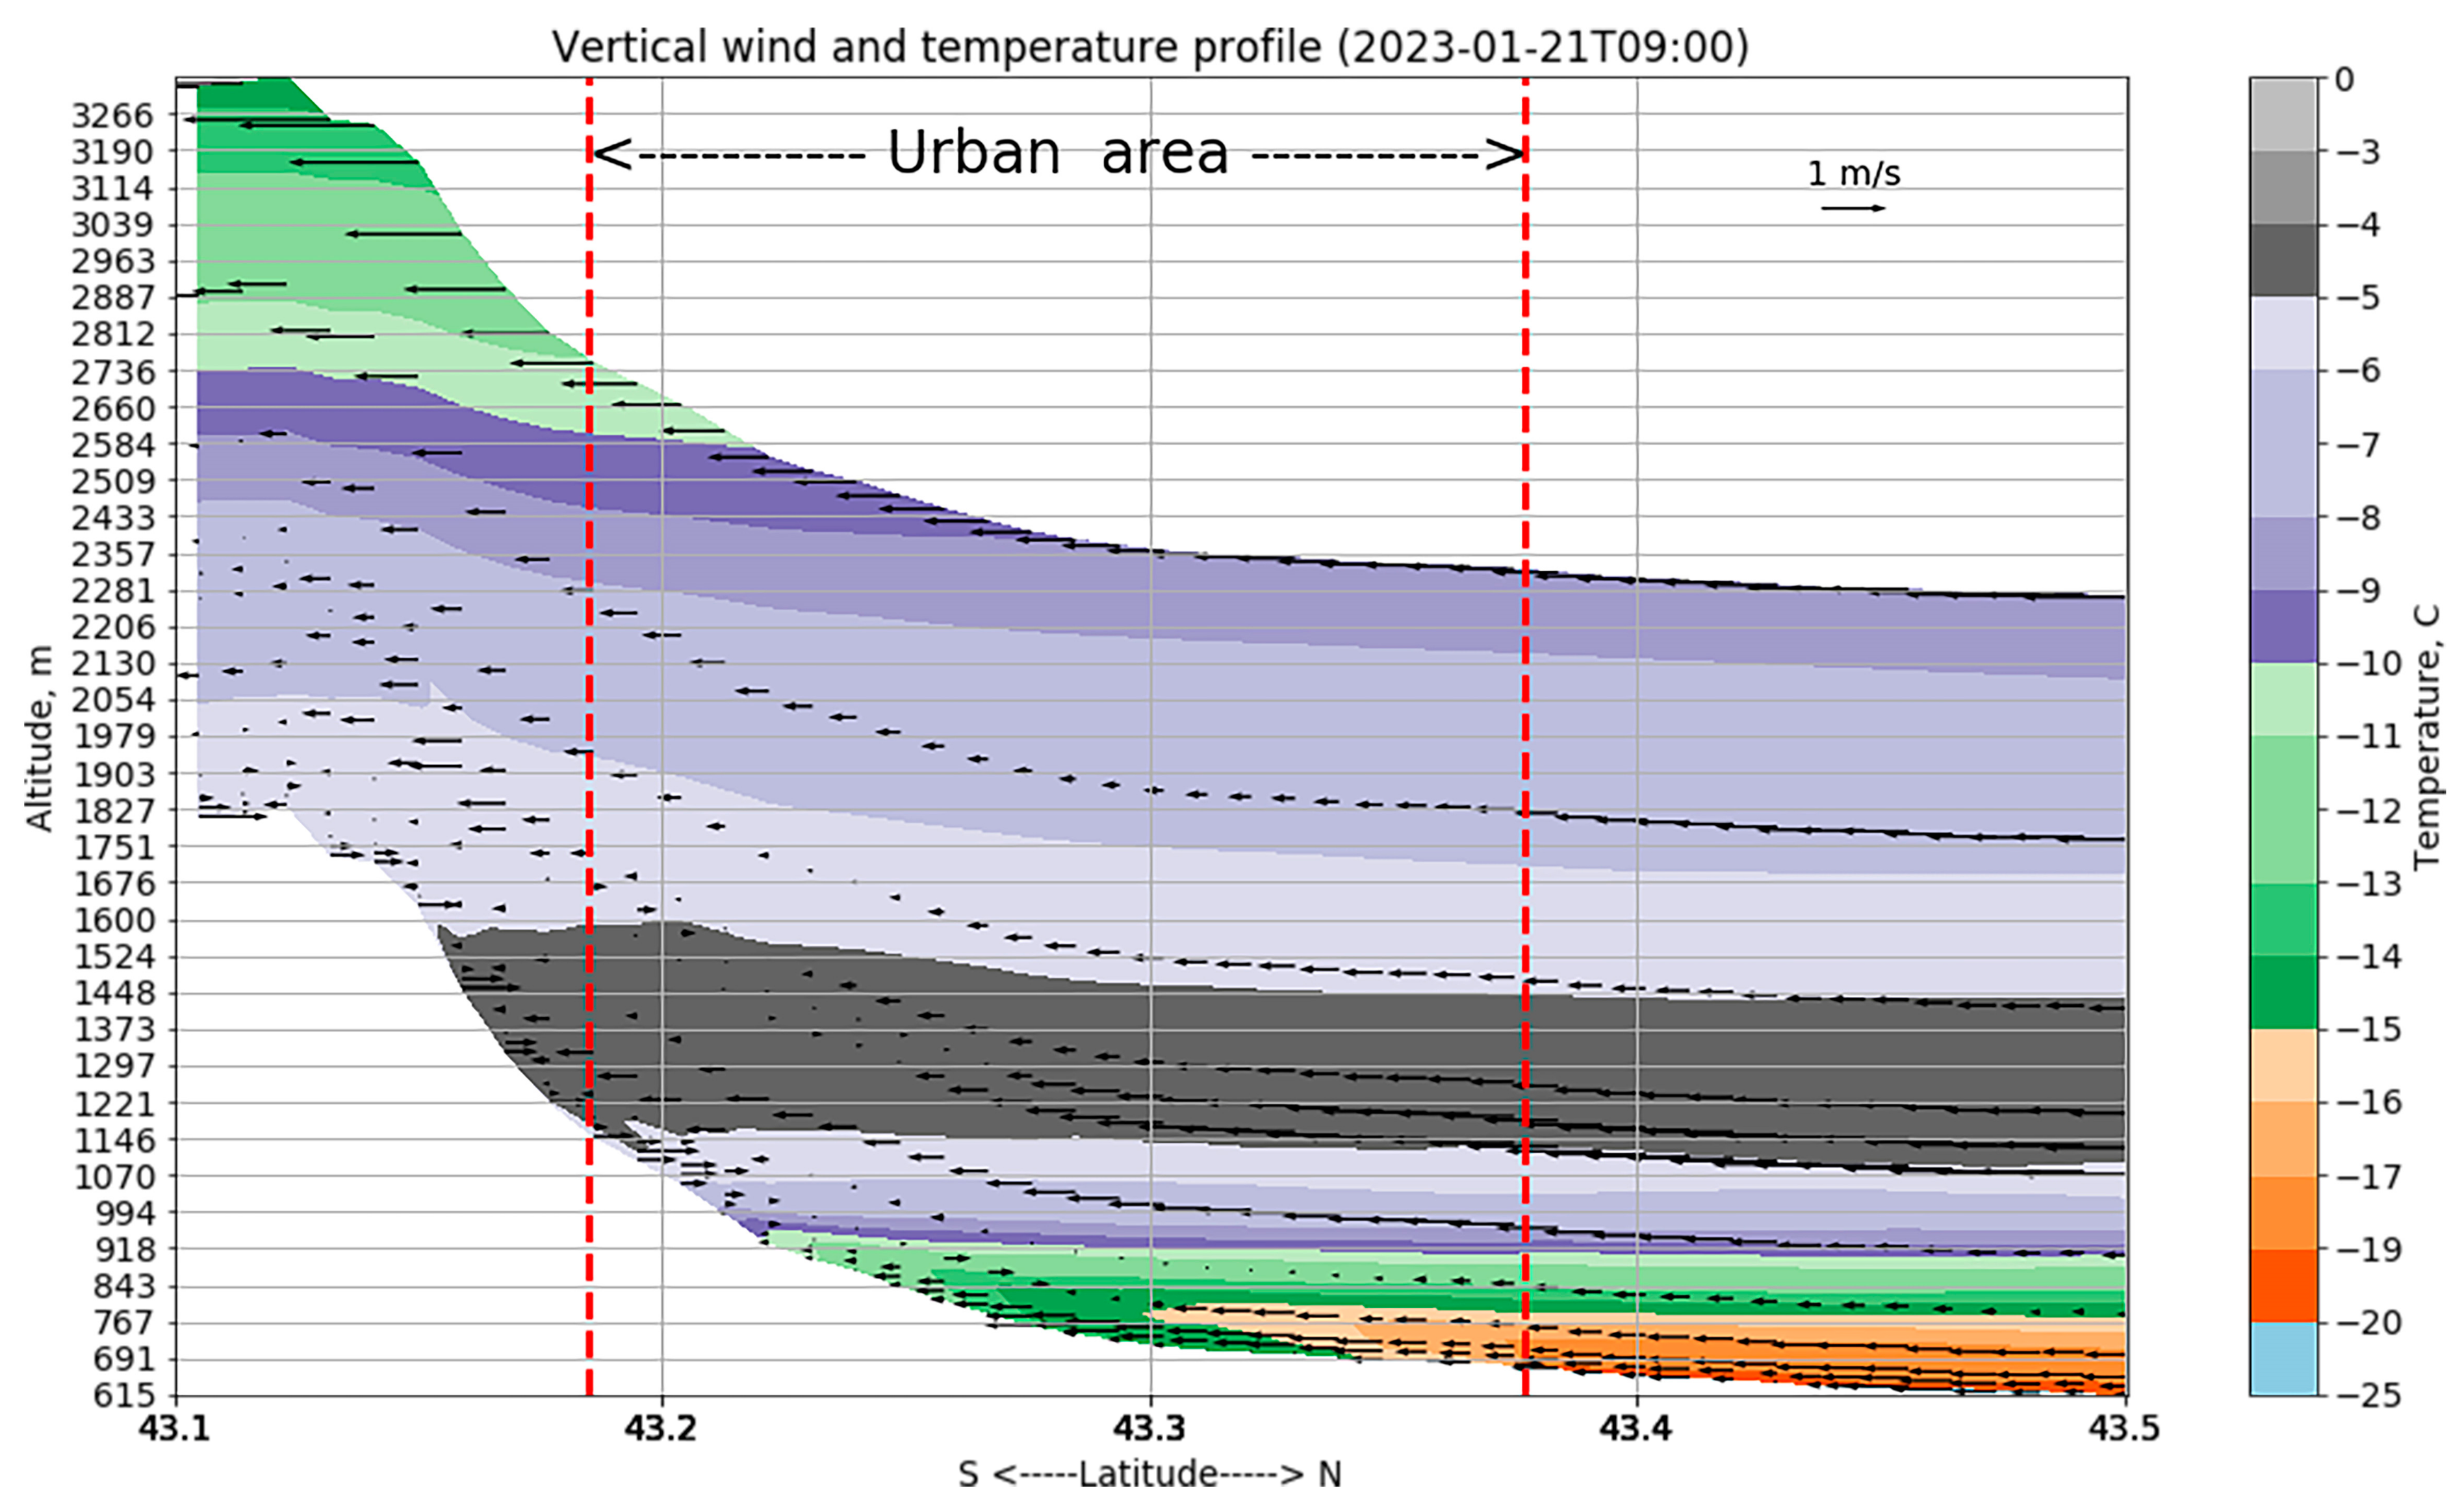
Figure 7 illustrates the temperature distribution and the v-component of wind within a vertical cross-section in the south–north orientation passing through the Almaty weather station. The time chosen closely matches the time the photograph was taken. Each layer in the figure is colored uniquely at 1 °C intervals to delineate the blocking inversion structure. The figure reveals a stable and neutral stratification across the temperature field, albeit with varying gradients along the vertical axis (as evident by the changing thickness of colored layers), occasionally transitioning to neutral stability. The near-surface layer, particularly in urban areas, is of particular interest. As seen in the figure, warmer air is beginning to intrude into this layer, and over time, it will envelop the entirety of the urban residential area, forming a daytime heat island.
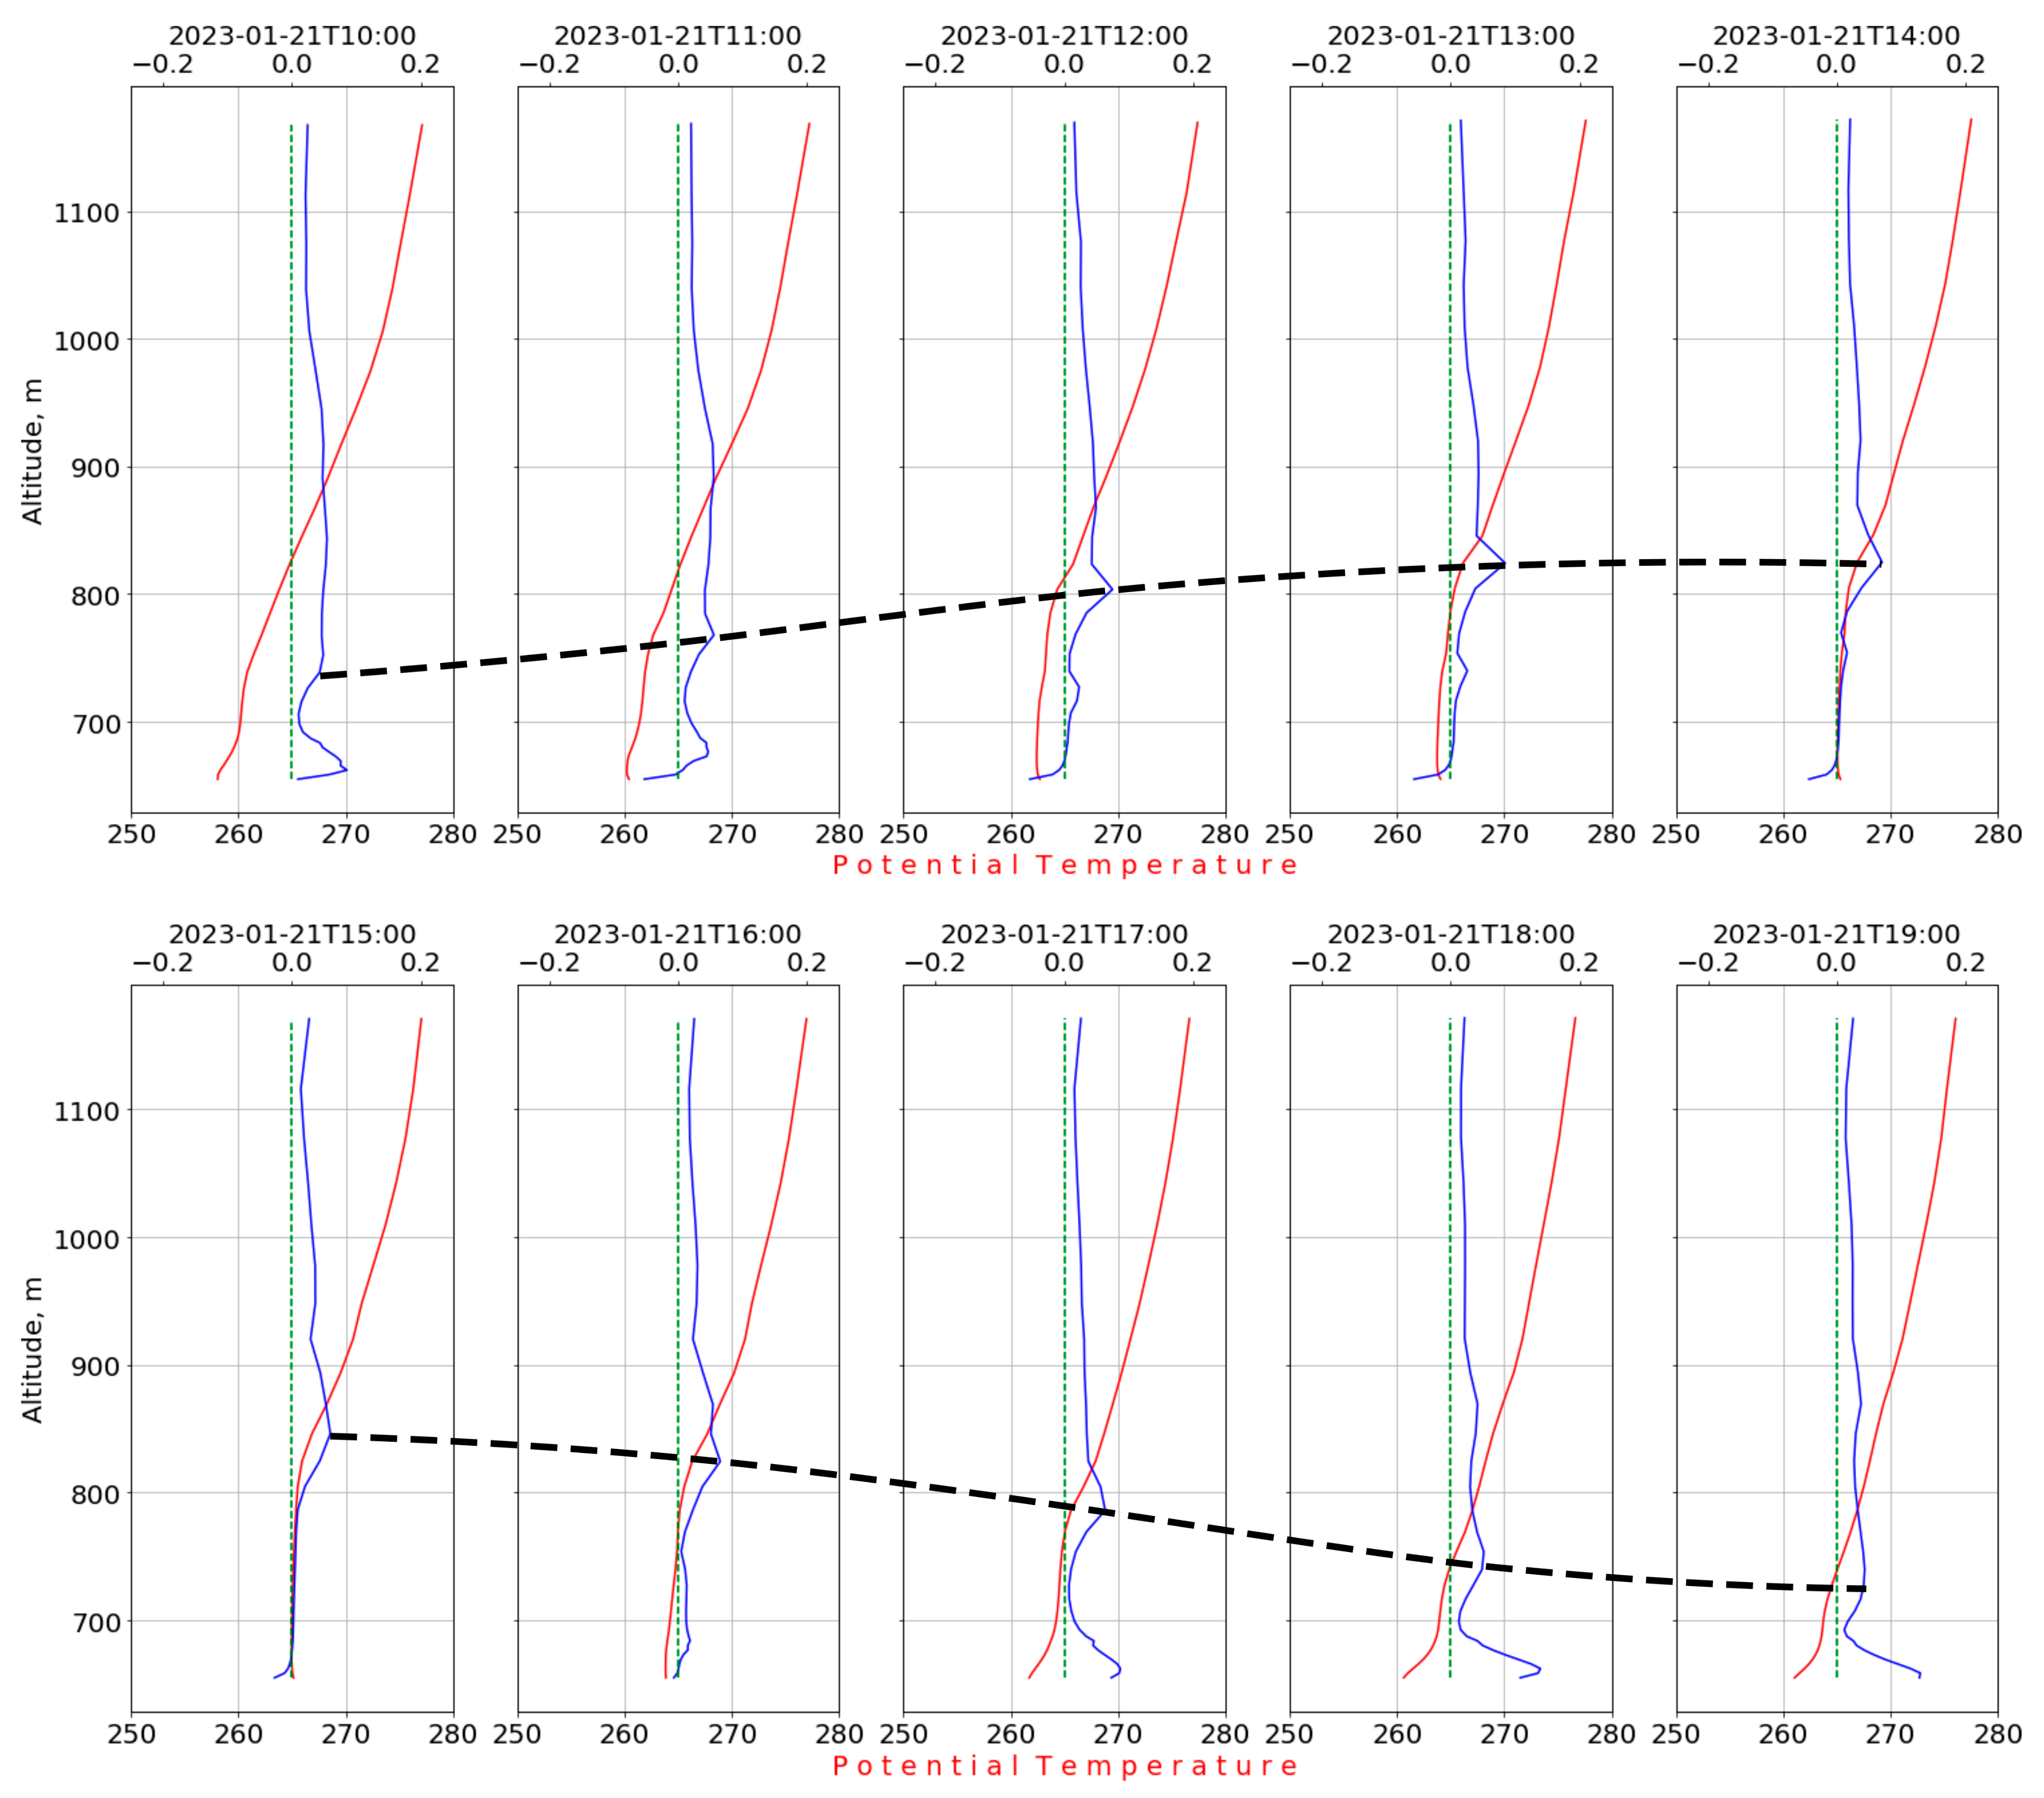
Figure 8 shows the vertical profile of potential temperature (θ) and its derivative (dθ/dz), tracing the evolution and formation of the inversion layer. The lower limit of the inversion is identified in the plot as the height where the layer with near-neutral stability ends (marked by the inflection point of the dθ/dz curve).
The figure reveals that the inversion layer’s height increases from 750 m to 850 m above sea level during the first half of the day (10:00 to 15:00) when the solar heating is strong. As the solar heating weakens after 16:00, the inversion layer starts to shrink. By the time it is 19:00, a nocturnal layer of cold air settles over the city’s atmosphere.
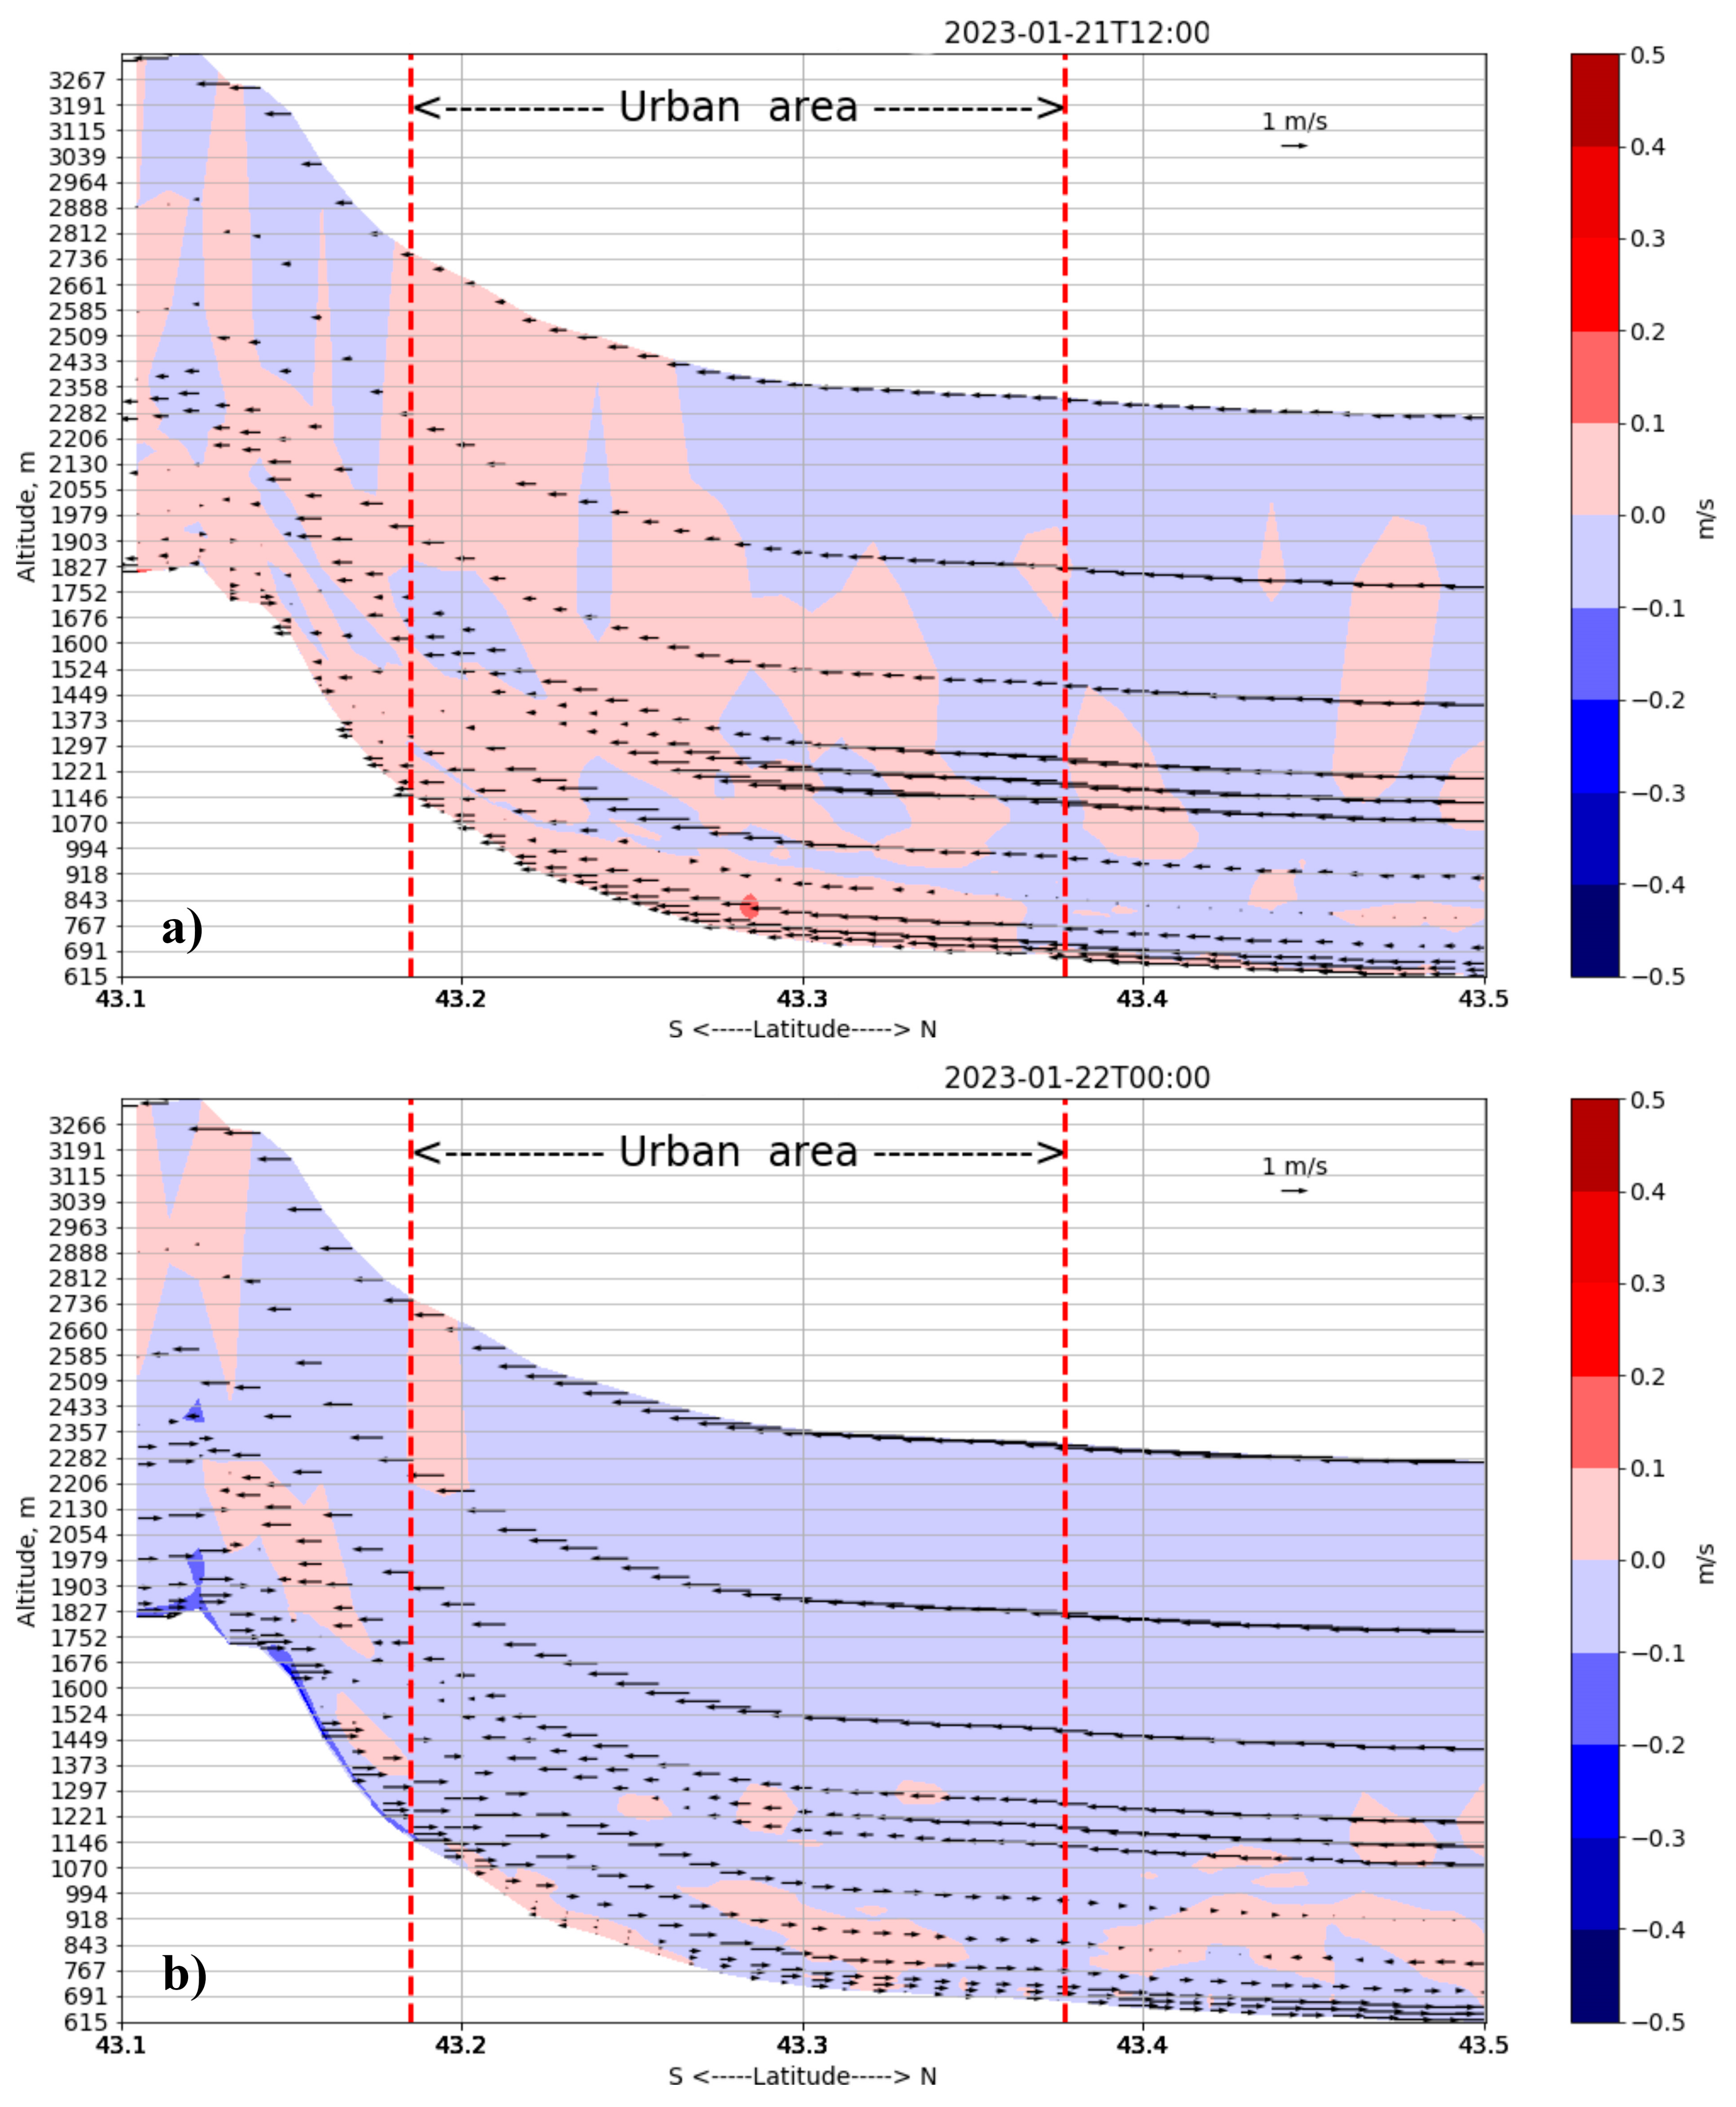
These two phases of the dynamics of the inversion layer correspond to the following two phases of the mountain-valley circulation: the anabatic flow into the mountains at 12:00 on 21 January 2023 (
Figure 9a) and the katabatic flow of cold air from the mountains at 00:00 on 22 January 2023 (
Figure 9b). In this figure, the horizontal v-component of the wind is represented by arrows, and the vertical w-component is represented by color.
Obtaining data on the vertical structure of inversion layers traditionally relies on aerological stations that use radiosonde balloons equipped with meteorological sensors [
50]. These balloons are launched twice daily at most stations, often limiting data acquisition. Unfortunately, on the outskirts of Almaty, there is only one such station with launches at 6:00 and 18:00 local time.
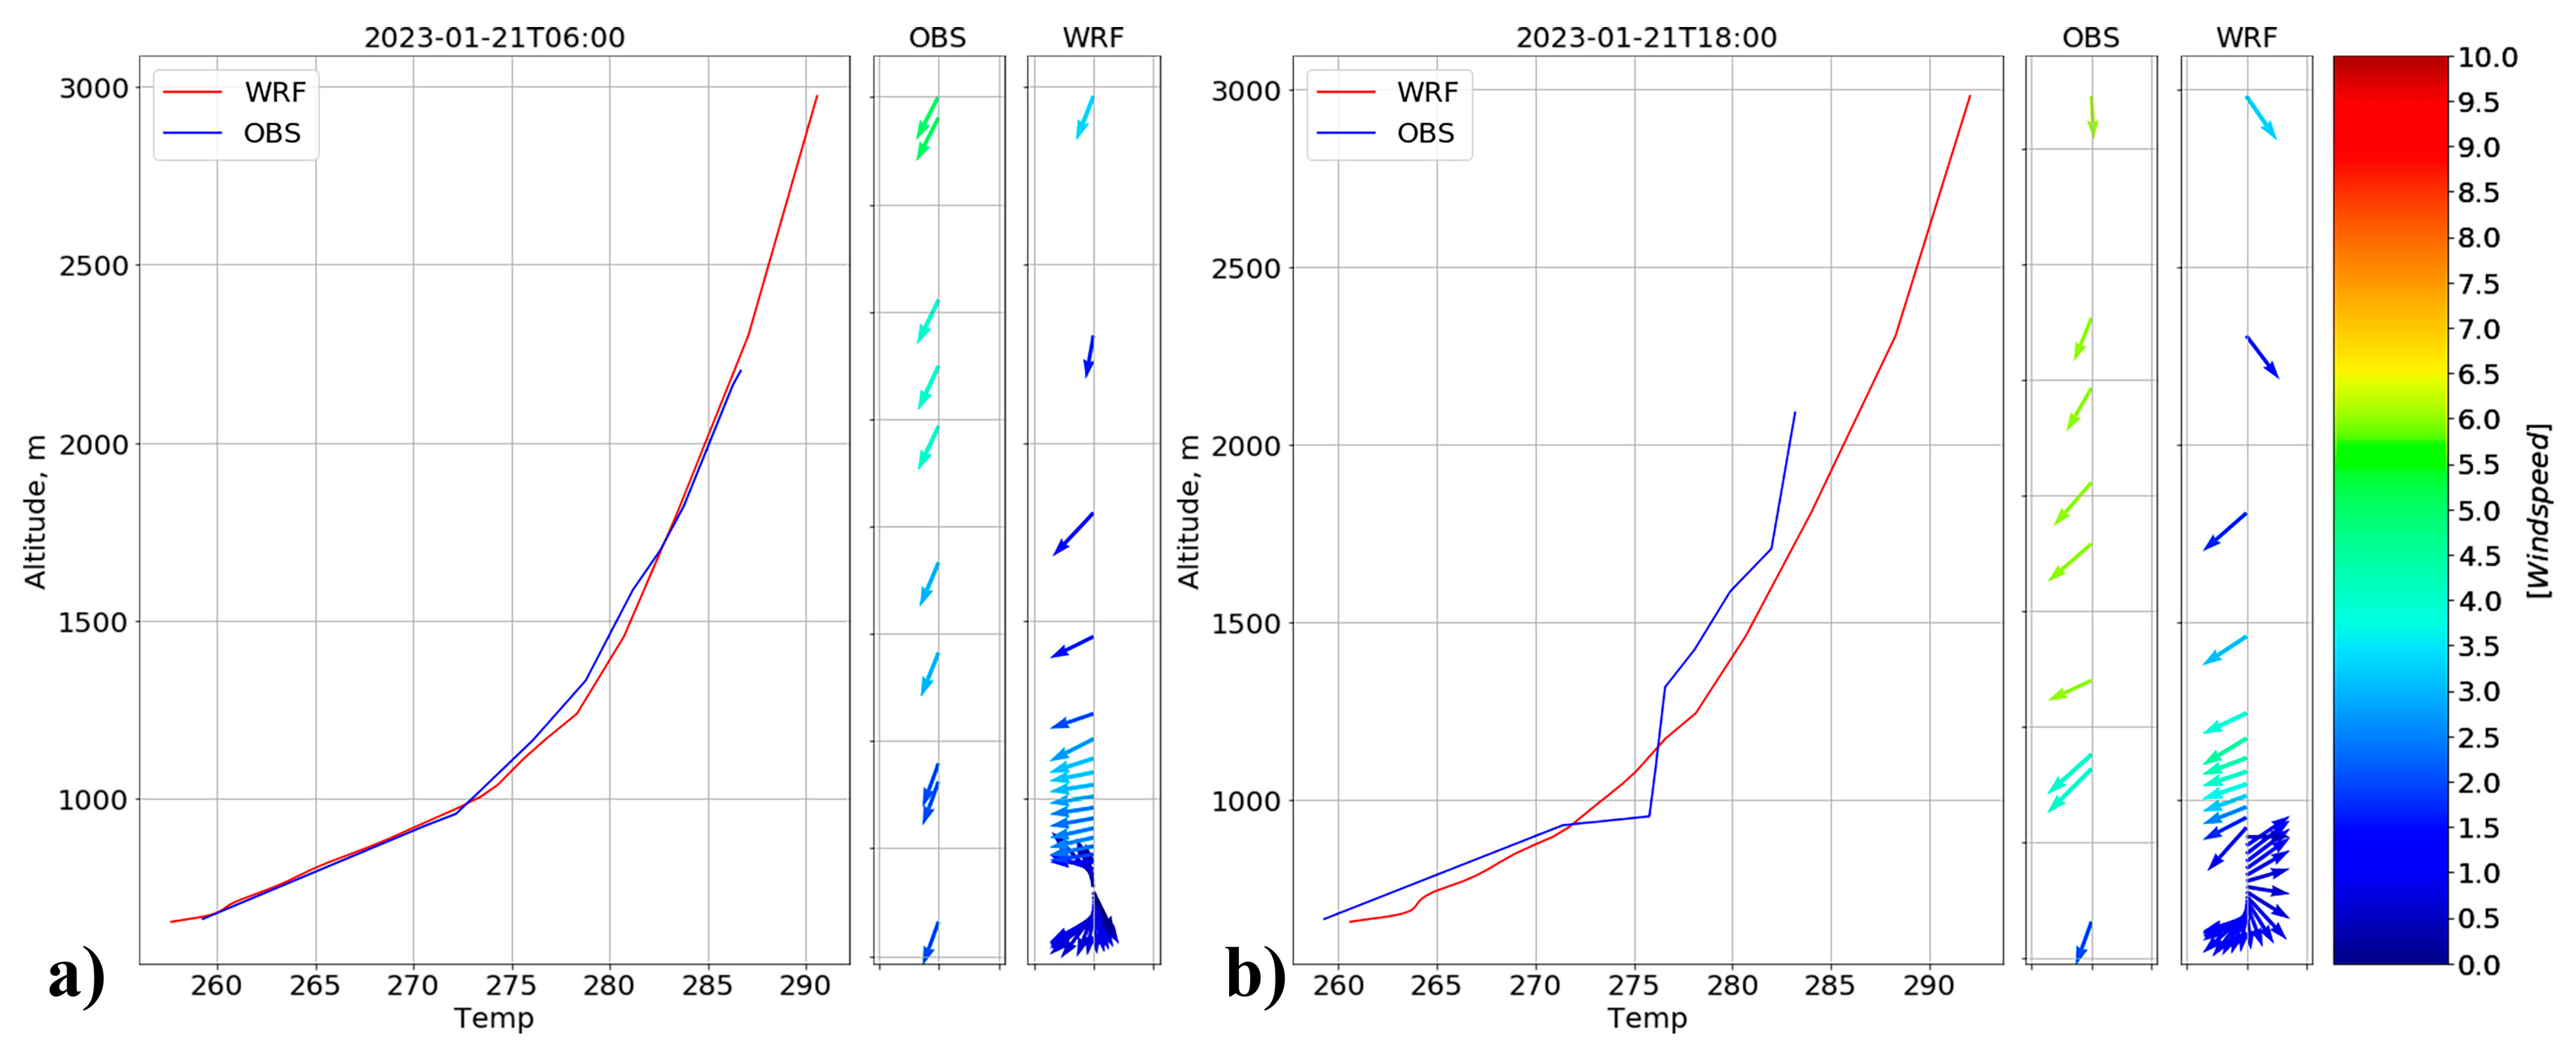
Figure 10 compares aerological measurements of potential temperature and wind velocity with corresponding data from the WRF model simulations. The figure reveals good agreement between the model and sounding data during the pre-dawn period, suggesting a relatively stable state in the atmosphere (
Figure 10a). However, the picture changes by evening when it is 18:00 (
Figure 10b). By this time, cold air from the mountains infiltrates the lower atmosphere in Almaty, forming a complex multi-layer system with alternating stable and neutral stratification. The WRF model, in this case, captured the development of the surface inversion but did not replicate the full complexity of the multi-layered structure. Similar limitations of the WRF model for simulating multi-layered inversions have been reported in studies of other cities, such as Tomsk, Russia [
54].
3.3. Urban Heat Island
Urban heat islands (UHIs) are a defining characteristic of urban environments. Recent decades have seen a surge in research on UHI formation, with studies employing meteorological models like WRF alongside urban canopy models [
55]. Almaty’s unique location in the foothills presents a fascinating case study, potentially influencing UHI development patterns. Building on previous research [
25], this study aims to compare results obtained from space-based sensing data with a focus on analyzing the dynamic processes that govern UHI formation in Almaty.
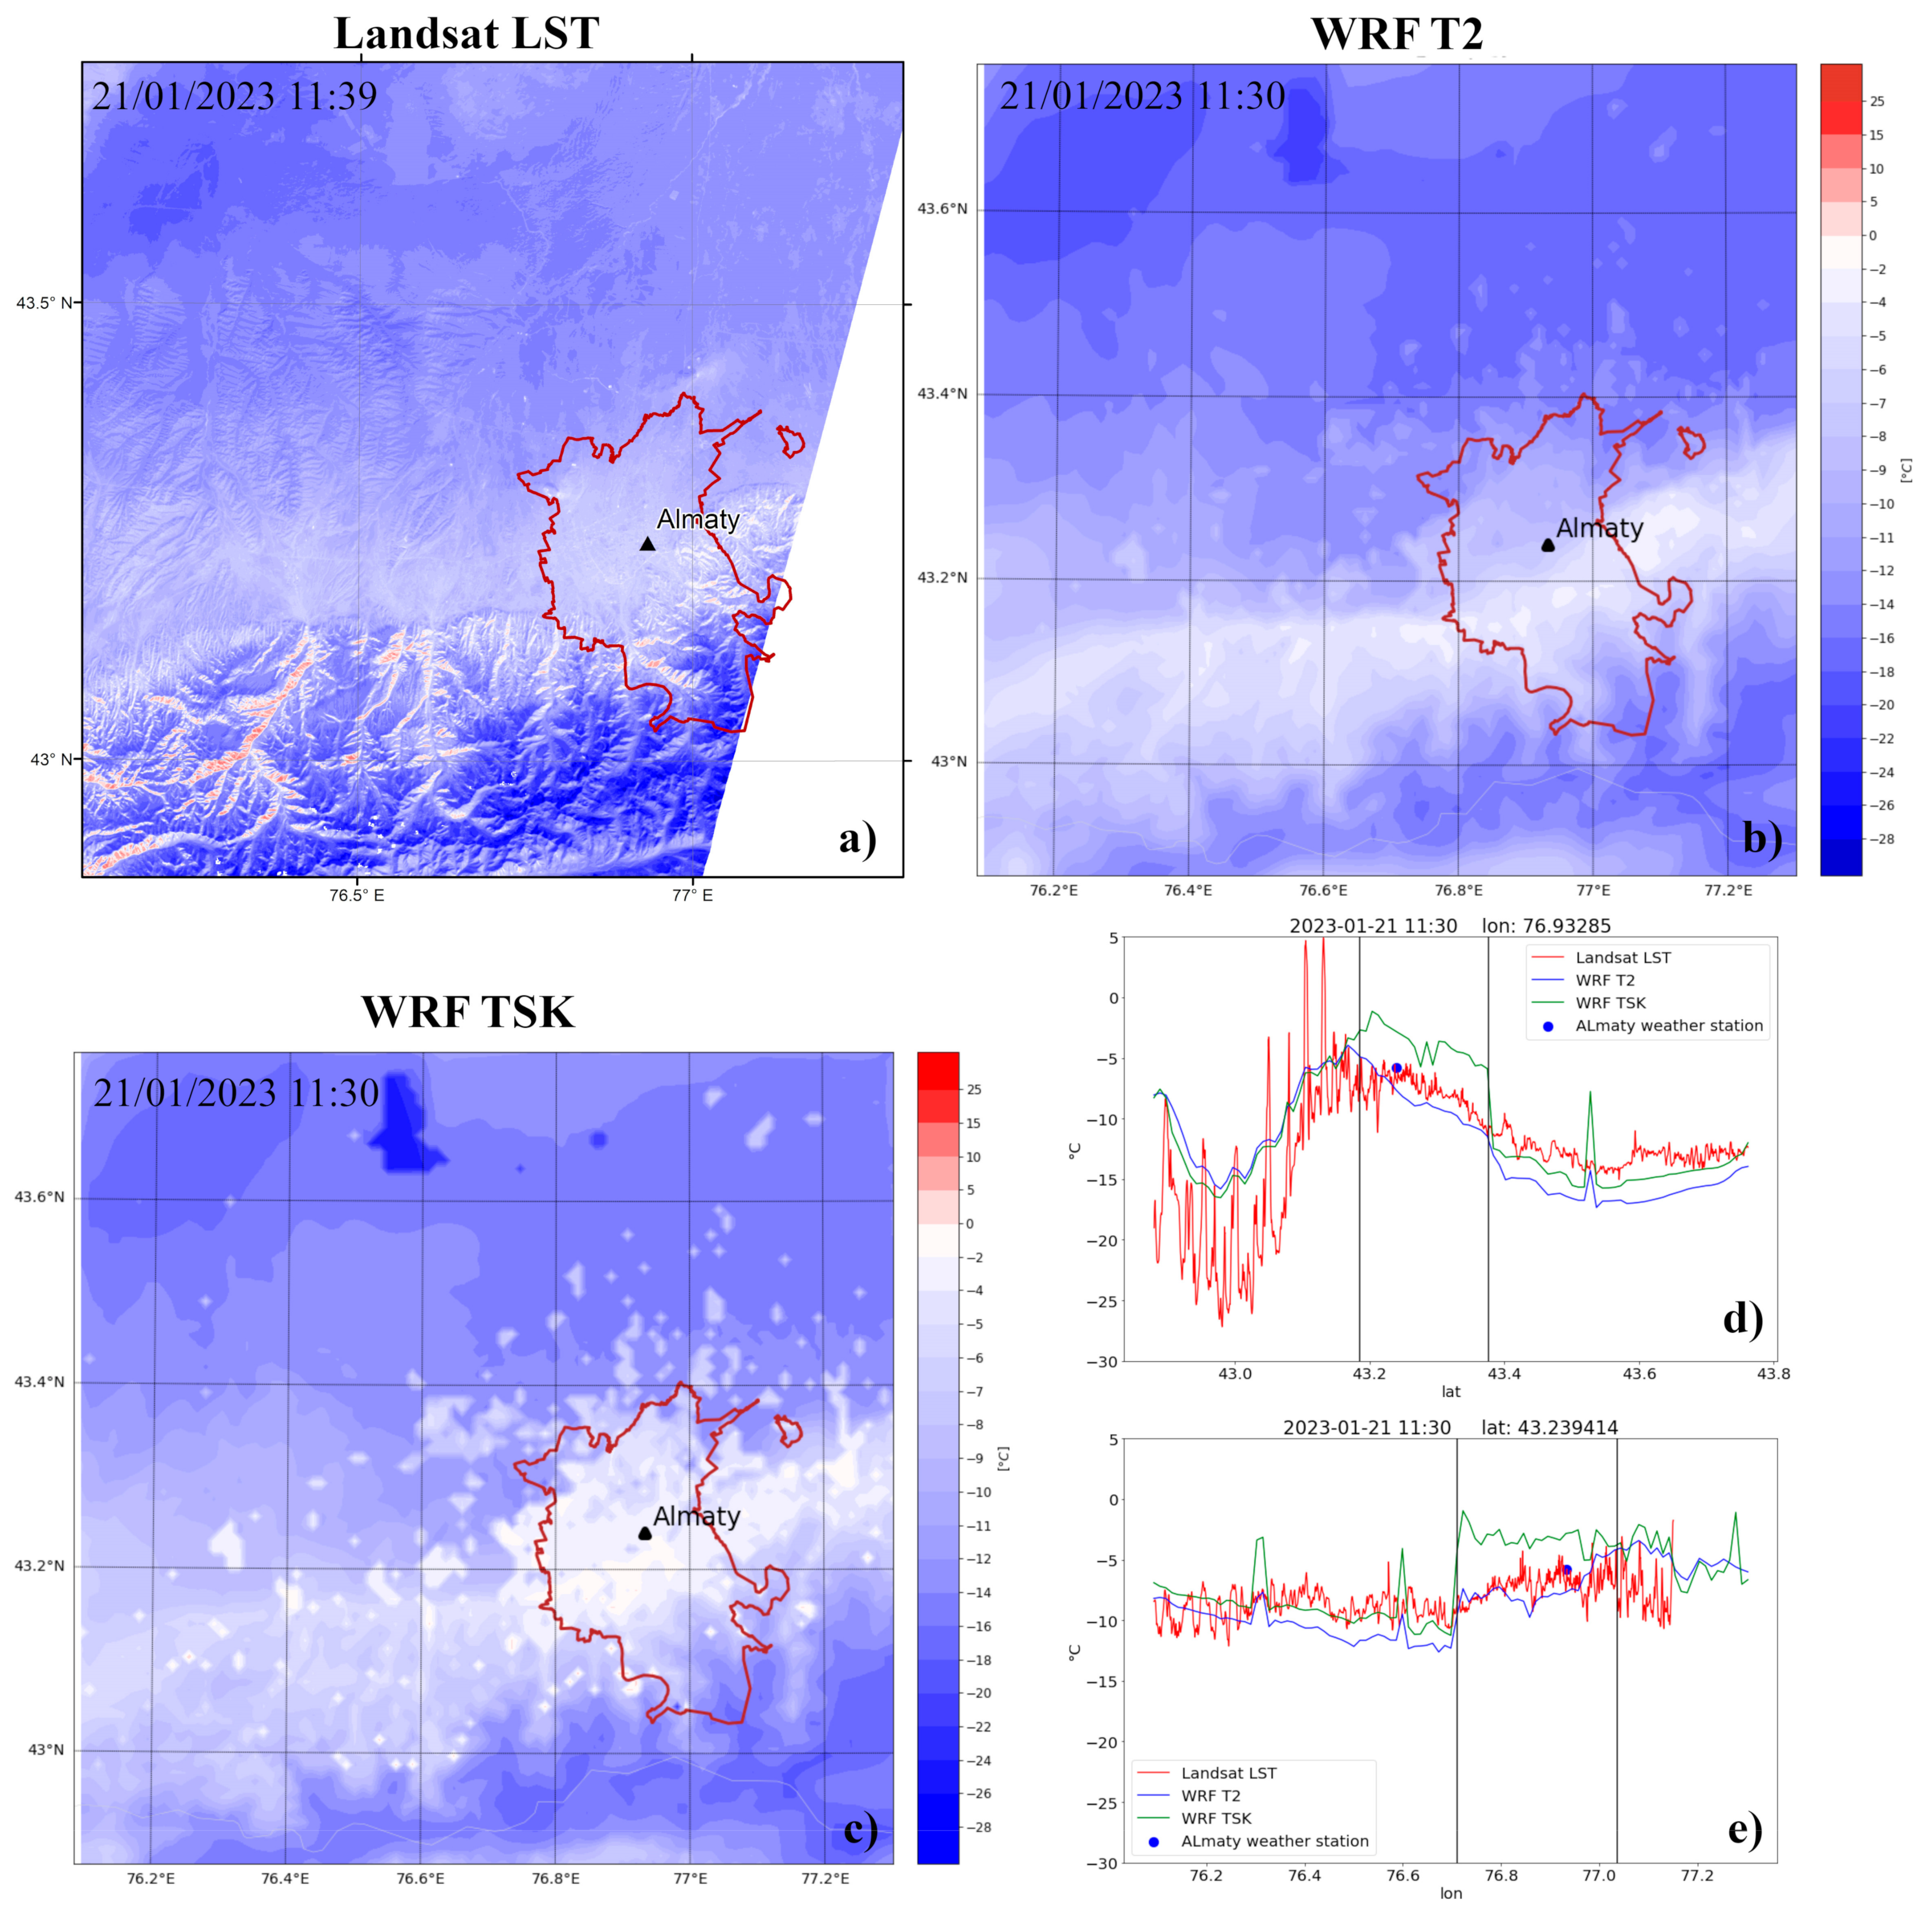
The presence of a heat island in Almaty is confirmed by remote sensing data. Shown in
Figure 11a is a land-surface temperature (LST) from Landsat-9 [
51]. For comparison, air temperature at a height of 2 m (WRF T2) is presented in
Figure 11b and surface skin temperature (WRF TSK) is shown in
Figure 11c. All data are for the same periods. Below are the temperature profiles along the south–north (
Figure 11d) and west–east (
Figure 11e) lines passing through the Almaty weather station, which is indicated by a triangle in the image and the map. The temperature measured at the weather station is shown on the plots as a blue dot. Noteworthy are the frequent temperature changes in the mountains, recorded using remote sensing data. These differences reflect the actual temperature of rough terrain and infrastructure at a given time, and the satellite, which has a spatial resolution of 30 m, captures these variations effectively. According to the profiles, the underlying surface temperature (TSK) is slightly higher than the air temperature (T2), except in mountainous areas. It is noteworthy that within the urban area, the modeled surface temperature is overestimated compared to both the air temperature at a height of 2 m and the Landsat-9 LST data. Overall, the modeled WRF parameters TSK and T2 correlate with the Landsat-derived land-surface temperature, and it can be concluded that the model adequately describes the temperature regime near ground level.
Simulations of thermal fields at various times enable analysis of temperature dynamics, especially day–night variations under anticyclonic conditions (
Figure 12a,b). Notably, foothill zones consistently show higher temperatures compared to the surrounding flat plains in the north. This complex thermal landscape, however, hinders a clear understanding of UHI characteristics. To address this challenge, a dedicated heat island map was constructed by calculating the difference between a thermal field that accounts for urban development and one that excludes the city’s influence.
Researchers employed the “virtual rural zone” (VRR) method [
56] to analyze the UHI. This technique involves replacing urban land-cover classes (LCZ 1–10) with herbaceous vegetation (LCZ D) in a land-use map. VRR offers advantages over other methods.
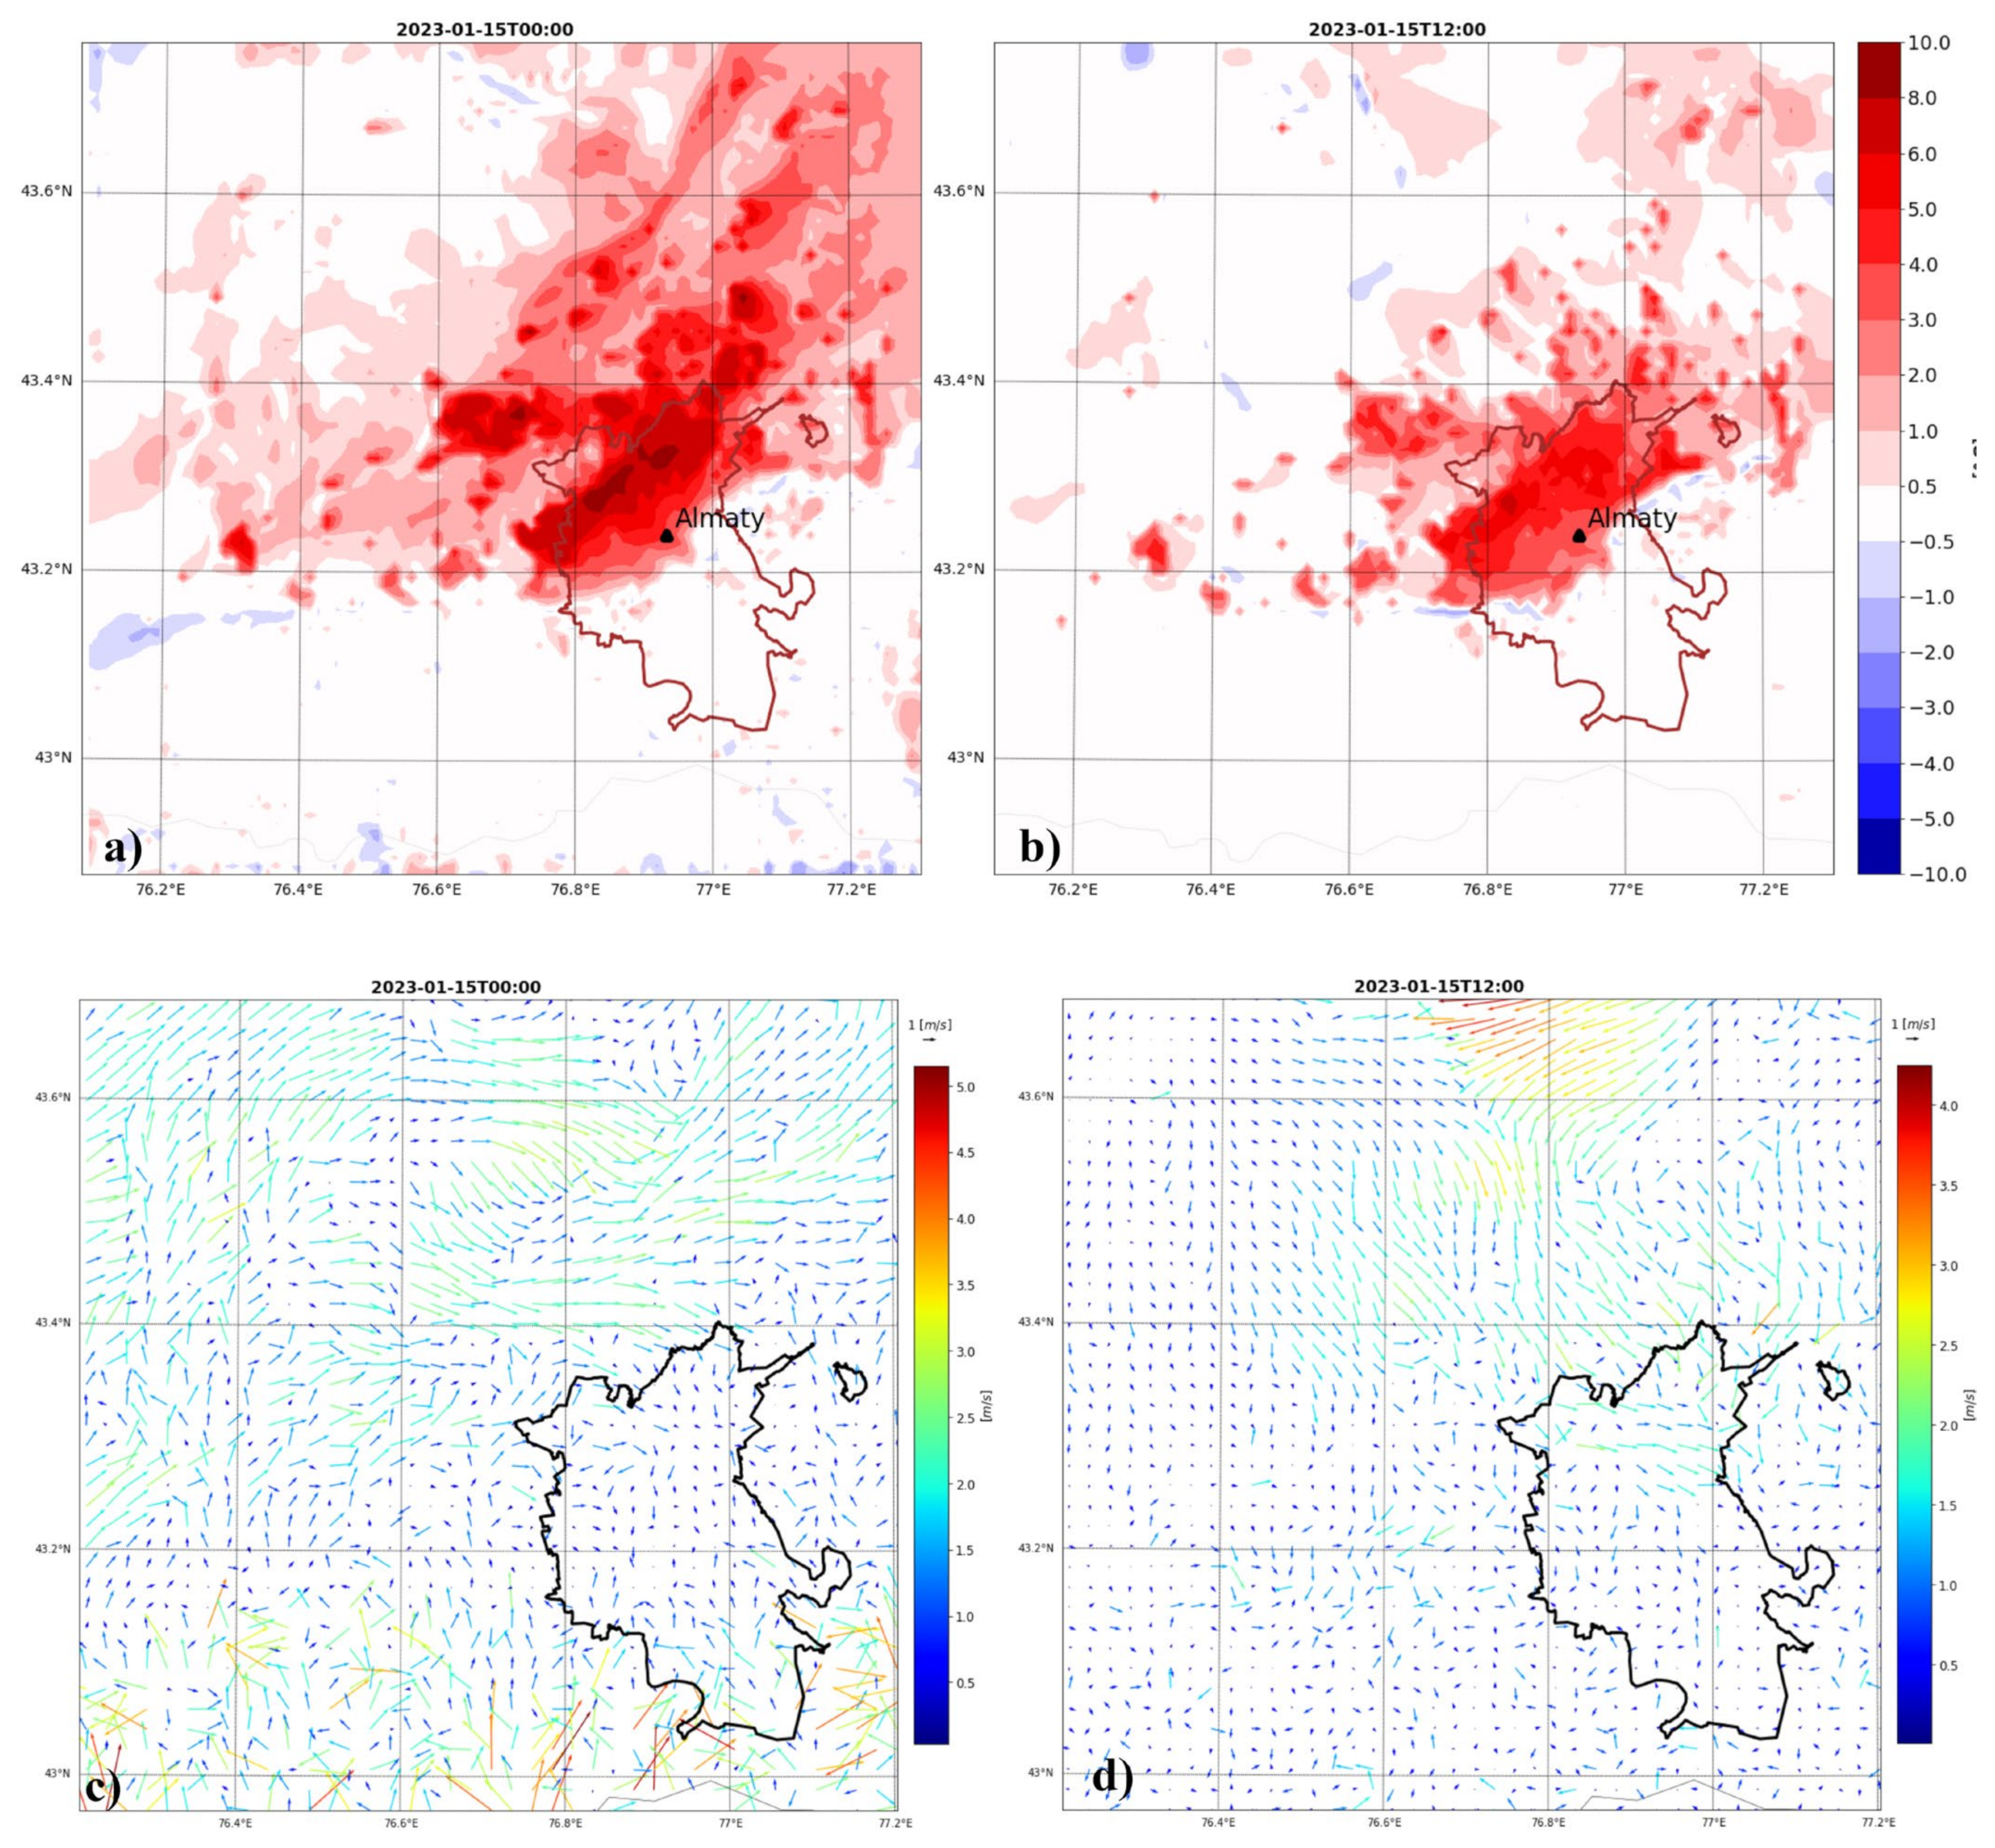
Figure 13a,b show thermal field maps depicting the temperature difference between scenarios “with city” and “without city” for the same times as the previous figure. Clearly visible in both night and day scenarios is the elevated ground temperature in urbanized areas, including the city center and surrounding areas, particularly the north and west where residential areas are located. By combining the UHI maps (
Figure 13a,b) with wind field data (
Figure 13c,d), we can observe thermal pollution transfer occurring when wind speeds exceed 2 m/s. At night (00:00), this transfer occurs in a northeasterly direction. As illustrated in
Figure 13c, the configuration of the heat island reveals that during nighttime, katabatic flow transports warm air from the southern part of the city towards the north. This warm air is then entrained by the prevailing latitudinal transfer, which skirts the mountain range and blows in a northeasterly direction in this area. During the day (
Figure 13d), the transfer is southeasterly, drawing heat emitted by surrounding villages towards the city and mountains.
Almaty’s UHI exhibits a stronger intensity at midnight, with a maximum temperature exceeding 8 °C. Notably, thermal pollution is concentrated in the city’s northwestern region during this time. In contrast, midday reveals a weaker UHI, with a maximum temperature below 8 °C and a larger overall area compared to nighttime. This difference can be attributed to nocturnal katabatic winds, which transport cold air from the mountains and suppress the UHI effect.
It is important to note that these calculations only considered residential buildings and roads as anthropogenic heat sources, excluding contributions from vehicles and industrial activity.
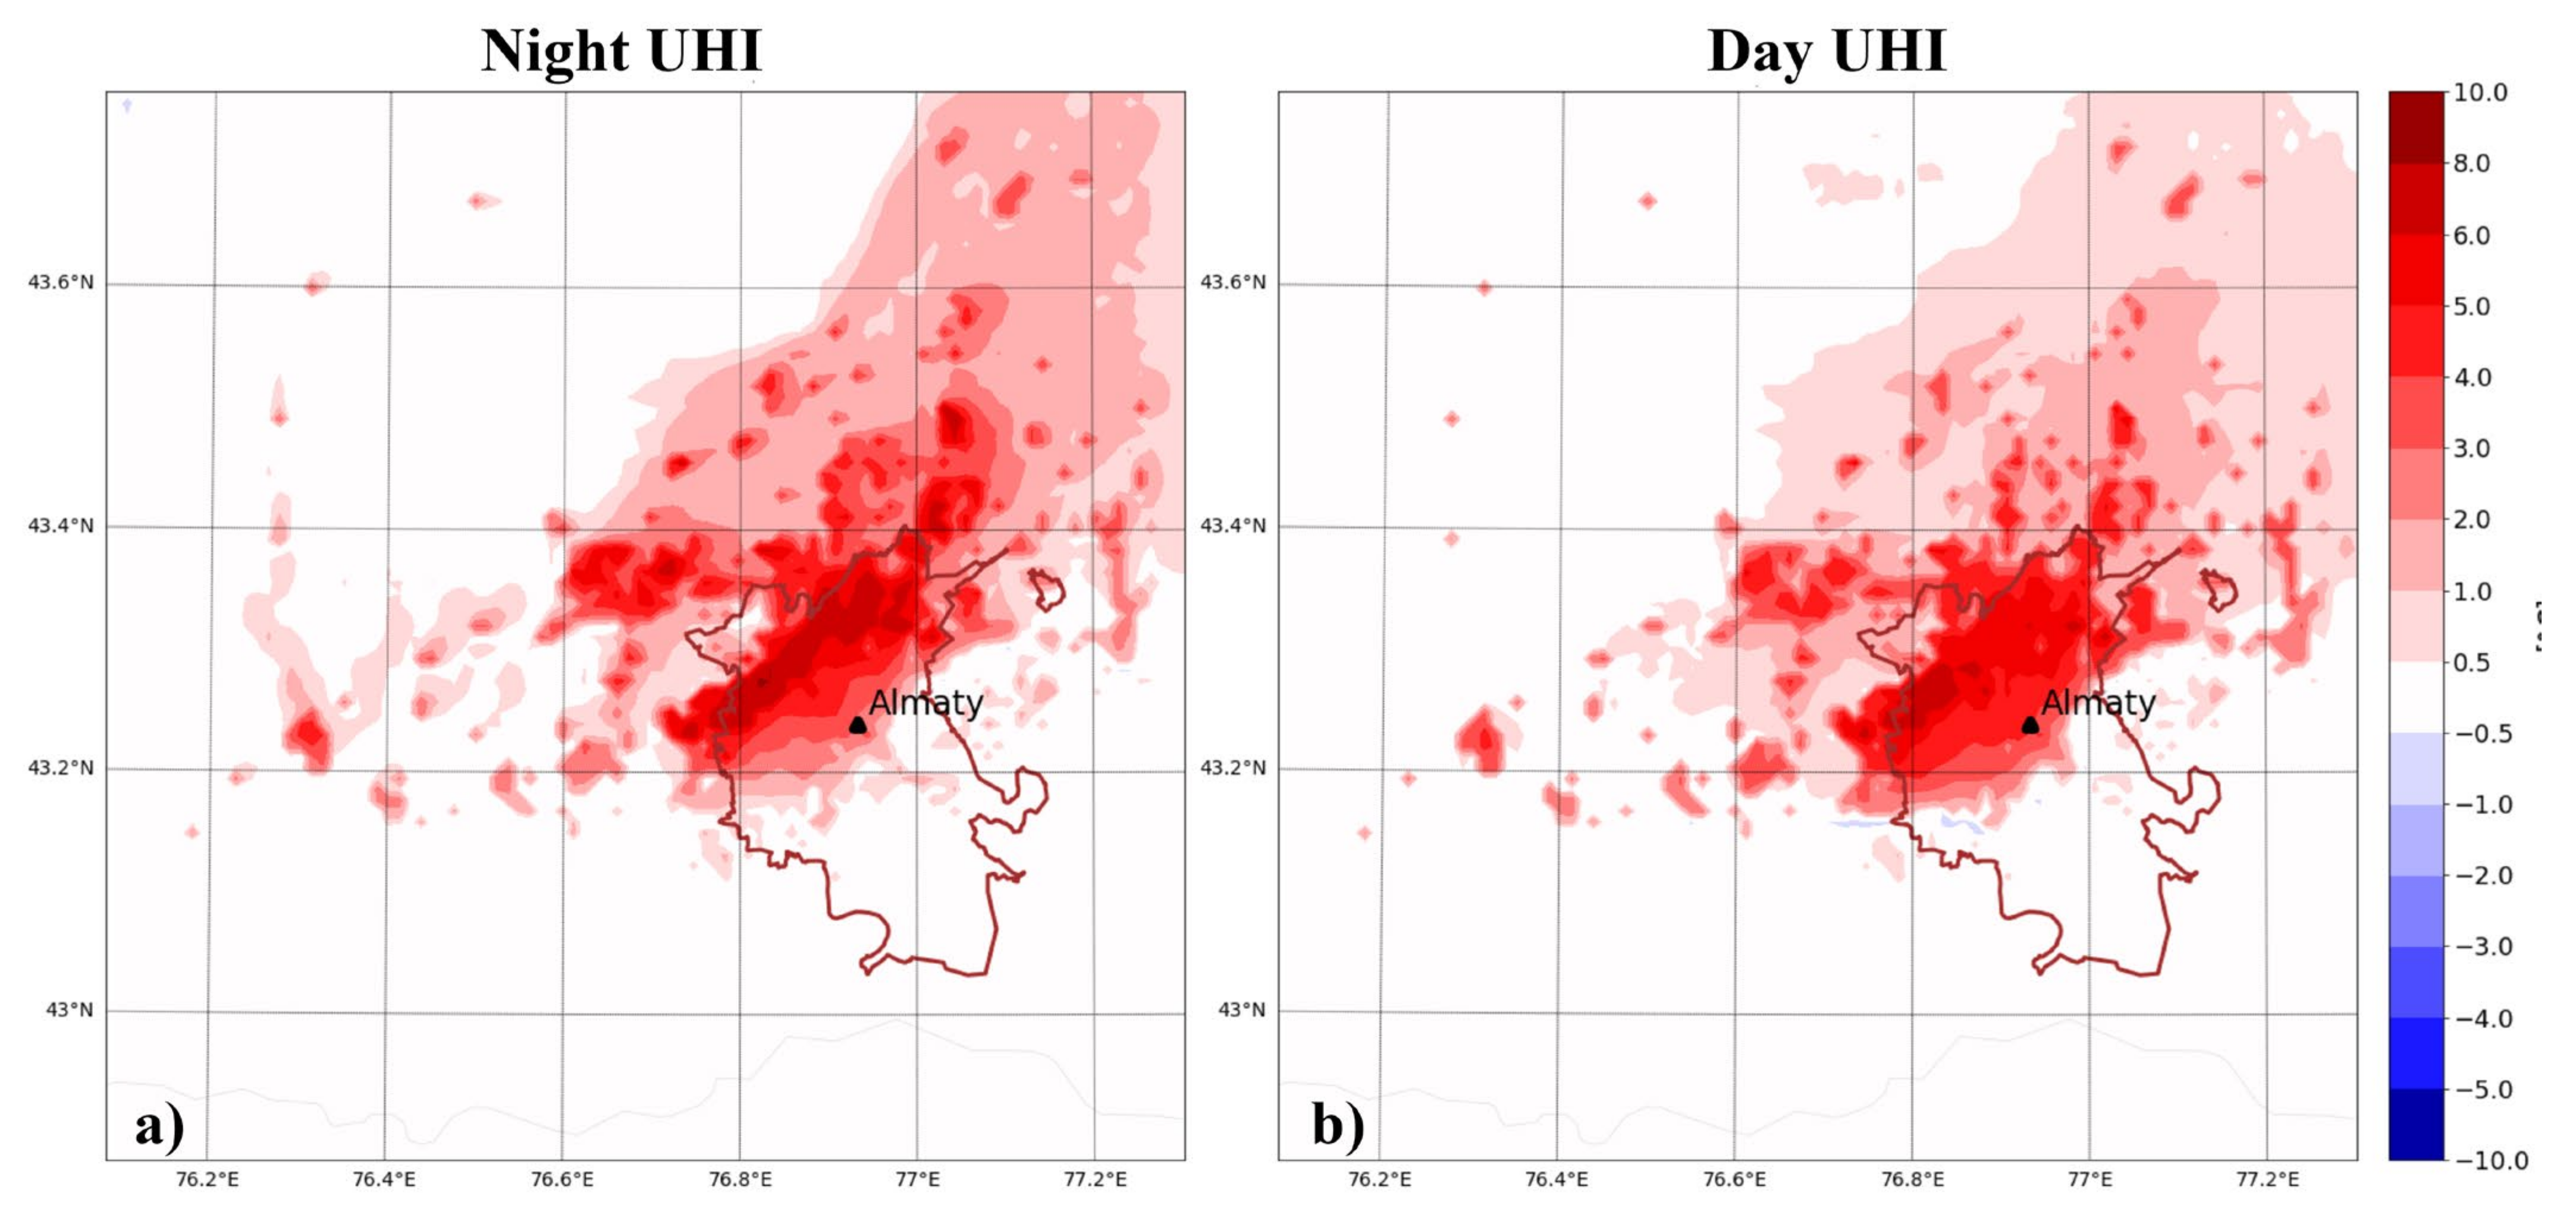
While the snapshots from the thermal fields provide some insights, a clearer picture of the UHI’s day and night behavior emerges from
Figure 14. This figure presents average UHI fields for nighttime (21:00 to 9:00 local time) and daytime (9:00 to 21:00) during the anticyclonic period of 14–23 January 2023. The distribution of heat is uneven, with the northwestern part of the city experiencing more intense warming at night, while the southeastern area exhibits greater daytime heating. The extent of nighttime thermal pollution within the city is 344 sq.km, expanding to 370 sq.km during the day. Interestingly, despite a slightly lower maximum temperature (7.4 °C) compared to nighttime (8.2 °C), the daytime UHI has a larger area of thermal pollution and higher temperatures in the foothills. Consequently, the average daytime UHI (3.6 °C) is higher than the nighttime average (3.3 °C).
The assessment of urban heat island intensity based on the temperature difference between the city (Almaty weather station) and rural areas (Iliysky weather station) yields the following results: according to the modeling data, the average daytime temperature difference over the test period is 5.6 °C and the average nighttime difference is 5.4 °C, while according to observations, it is 5.2 °C during the day and 6.2 °C at night. Therefore, such a calculated estimate with an error margin of less than 1 °C can serve, in our opinion, as an indicator of urban heat island intensity.
3.4. Statistical Analysis of Synoptic Situations
Almaty’s air quality is significantly influenced by large-scale weather patterns, also known as synoptic situations. Bugaev and Giorgio developed a comprehensive classification of atmospheric circulation forms for Central Asia, encompassing 15 distinct types of synoptic processes [
57,
58]. This classification was subsequently expanded to include 17 types of synoptic processes [
59] and later supplemented with an 18th type [
60]. The classification encompasses a diverse range of atmospheric patterns, including seven types of cyclones; three types of anticyclonic activity; two types of low-gradient fields (LGFs); advection of warm air; three types of cold intrusions; western intrusion; summer thermal depression. Work [
61] provides a comprehensive synthesis of the key findings from regional synoptic and synoptic–statistical studies conducted for Central Asia.
Notably, research by [
62] suggests that specific synoptic situations, including anticyclone spurs, LGF of high pressure, LGF of low pressure, and warm sectors of cyclones, are associated with elevated air pollution in Almaty. Recognizing the value of this classification system, Kazhydromet has officially adopted it, and it forms the basis for the synoptic analysis used in this study.
Unfavorable weather patterns, as identified in this study, are prevalent during fall and winter, reaching up to 80% frequency [
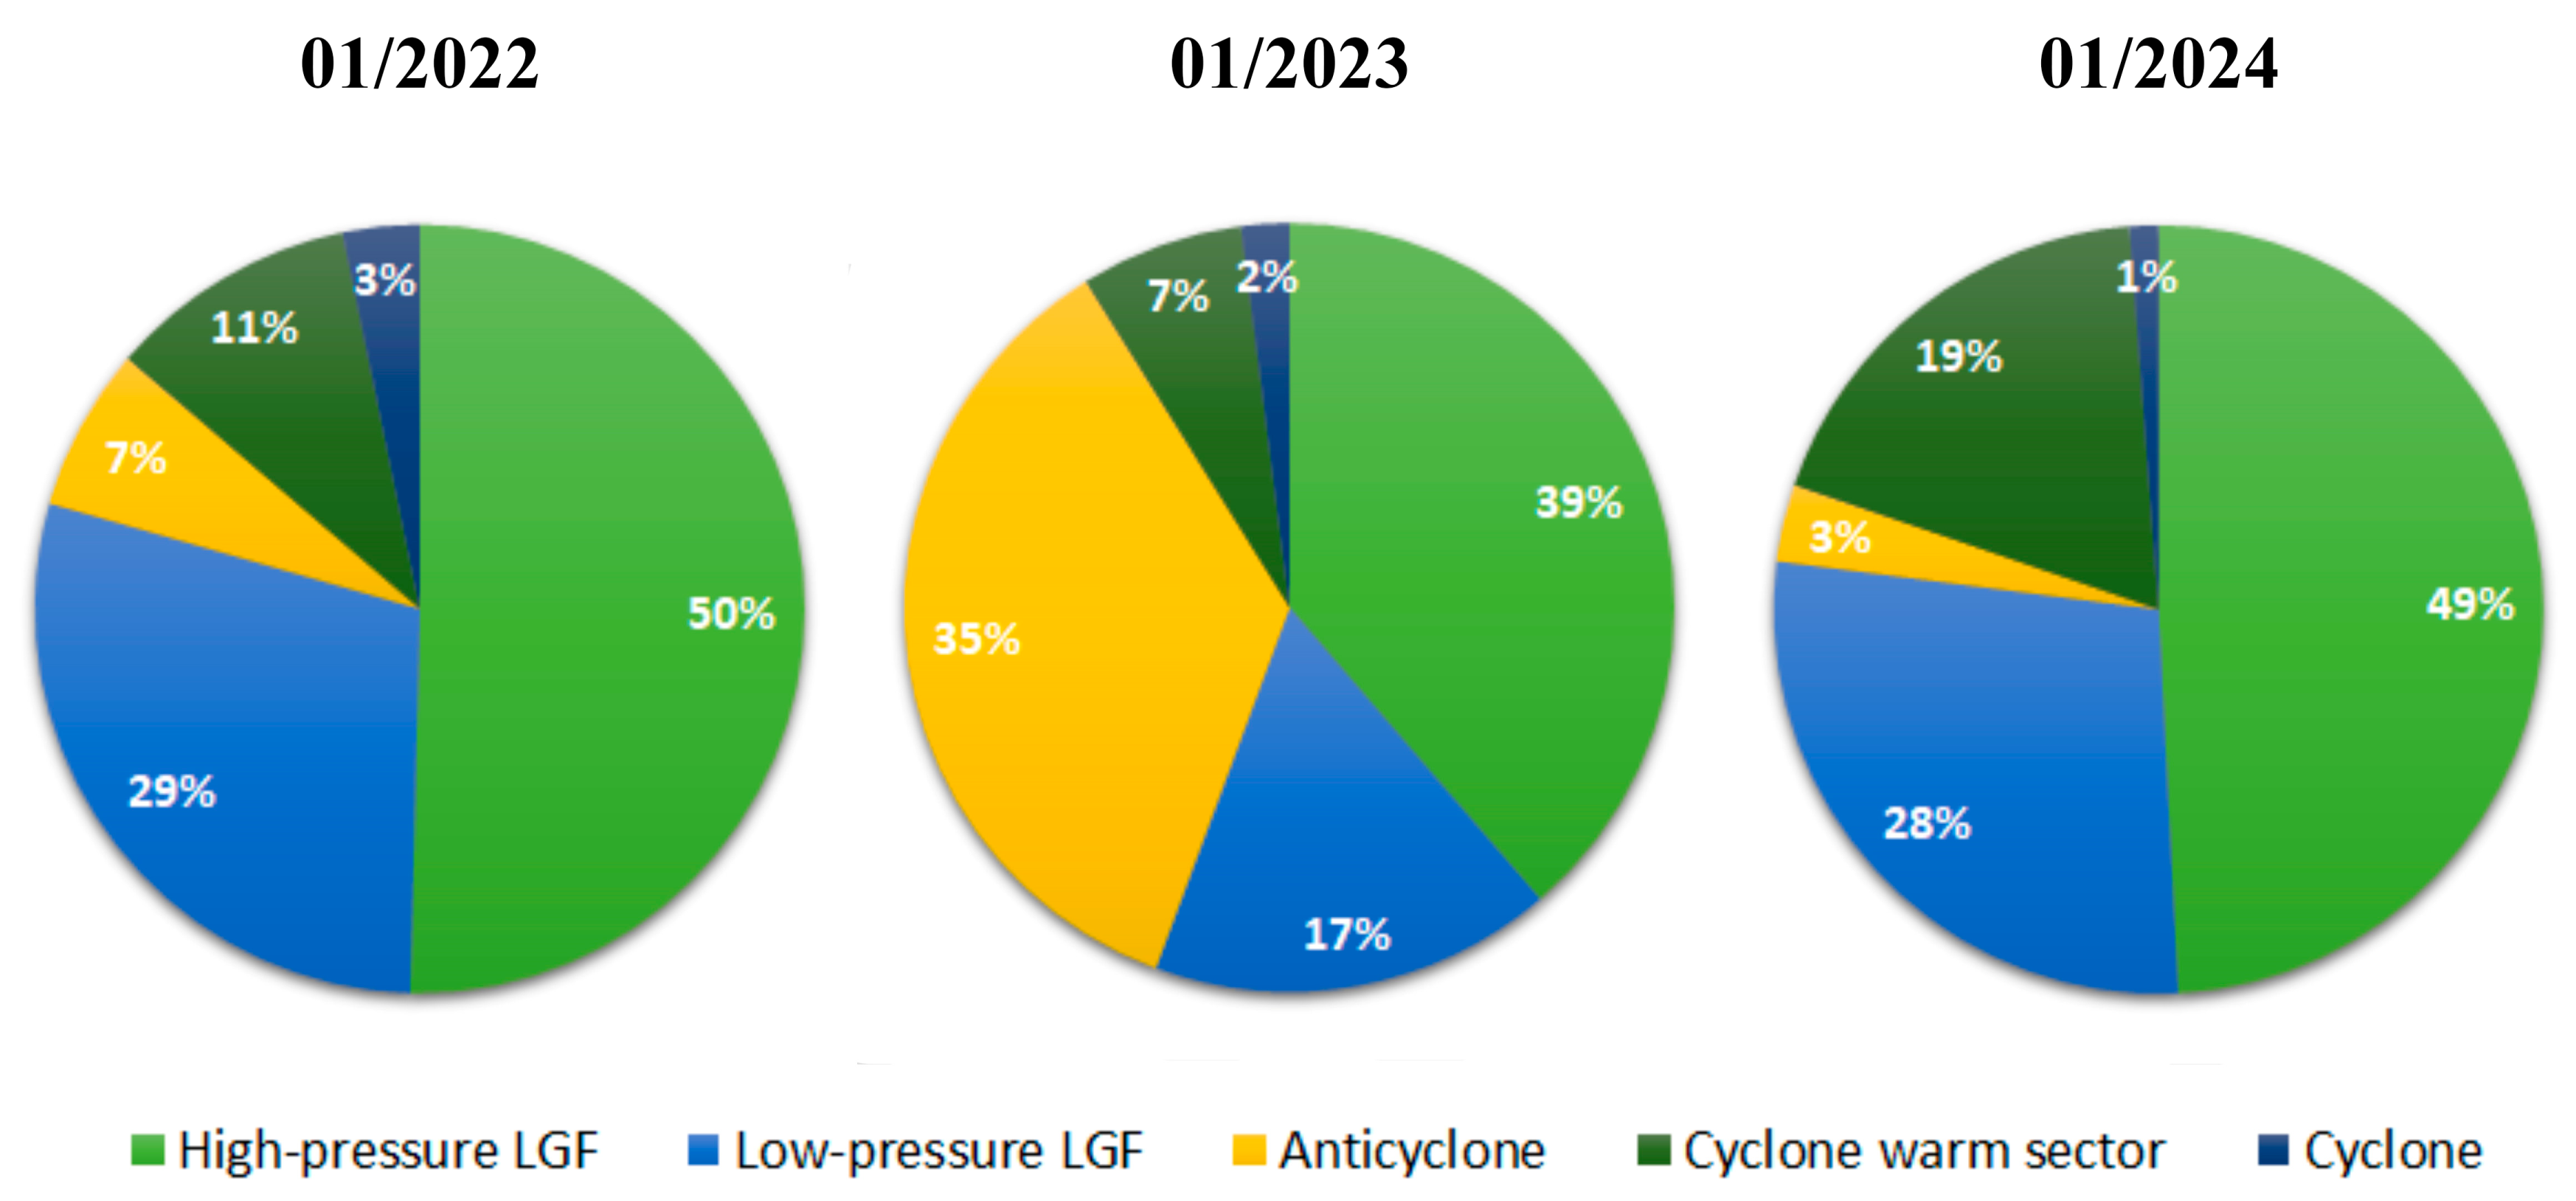
31]. In January of recent years, this number has climbed even higher, exceeding 90%.
Figure 15 illustrates this trend with pie charts analyzing the recurrence of synoptic situations for three Januaries (2022, 2023, and 2024) based on eight daily observations. The identification of these patterns relied on surface weather analysis maps for Eurasia [
47,
63] alongside atmospheric pressure and temperature readings [
48]. As the figure reveals, unfavorable synoptic situations dominated the chosen period, accounting for 97% to 99% of occurrences. Cyclones, which bring stronger winds and precipitation, are infrequent and short-lived events in contrast.
Interestingly, short bursts of precipitation were observed at the tail end of the cyclone’s warm sector and during the high-pressure LGF. This rain helps cleanse the atmosphere of pollutants, acting as a natural purification process beneficial for the environment.
Figure 16 illustrates this connection. The yellow line shows the daily average PM
2.5 concentration calculated from measured data [
52]. The red line indicates the maximum permissible concentration (MPC) for PM
2.5 particles set by the World Health Organization (WHO). The blue line represents precipitation data recorded at Kazhydromet weather stations [
48]. As the figure shows, a decrease in PM
2.5 concentration typically coincides with days with precipitation.
An analysis of temperature and wind conditions for unfavorable synoptic situations was conducted using the WRF model for January of 2022, 2023, and 2024.
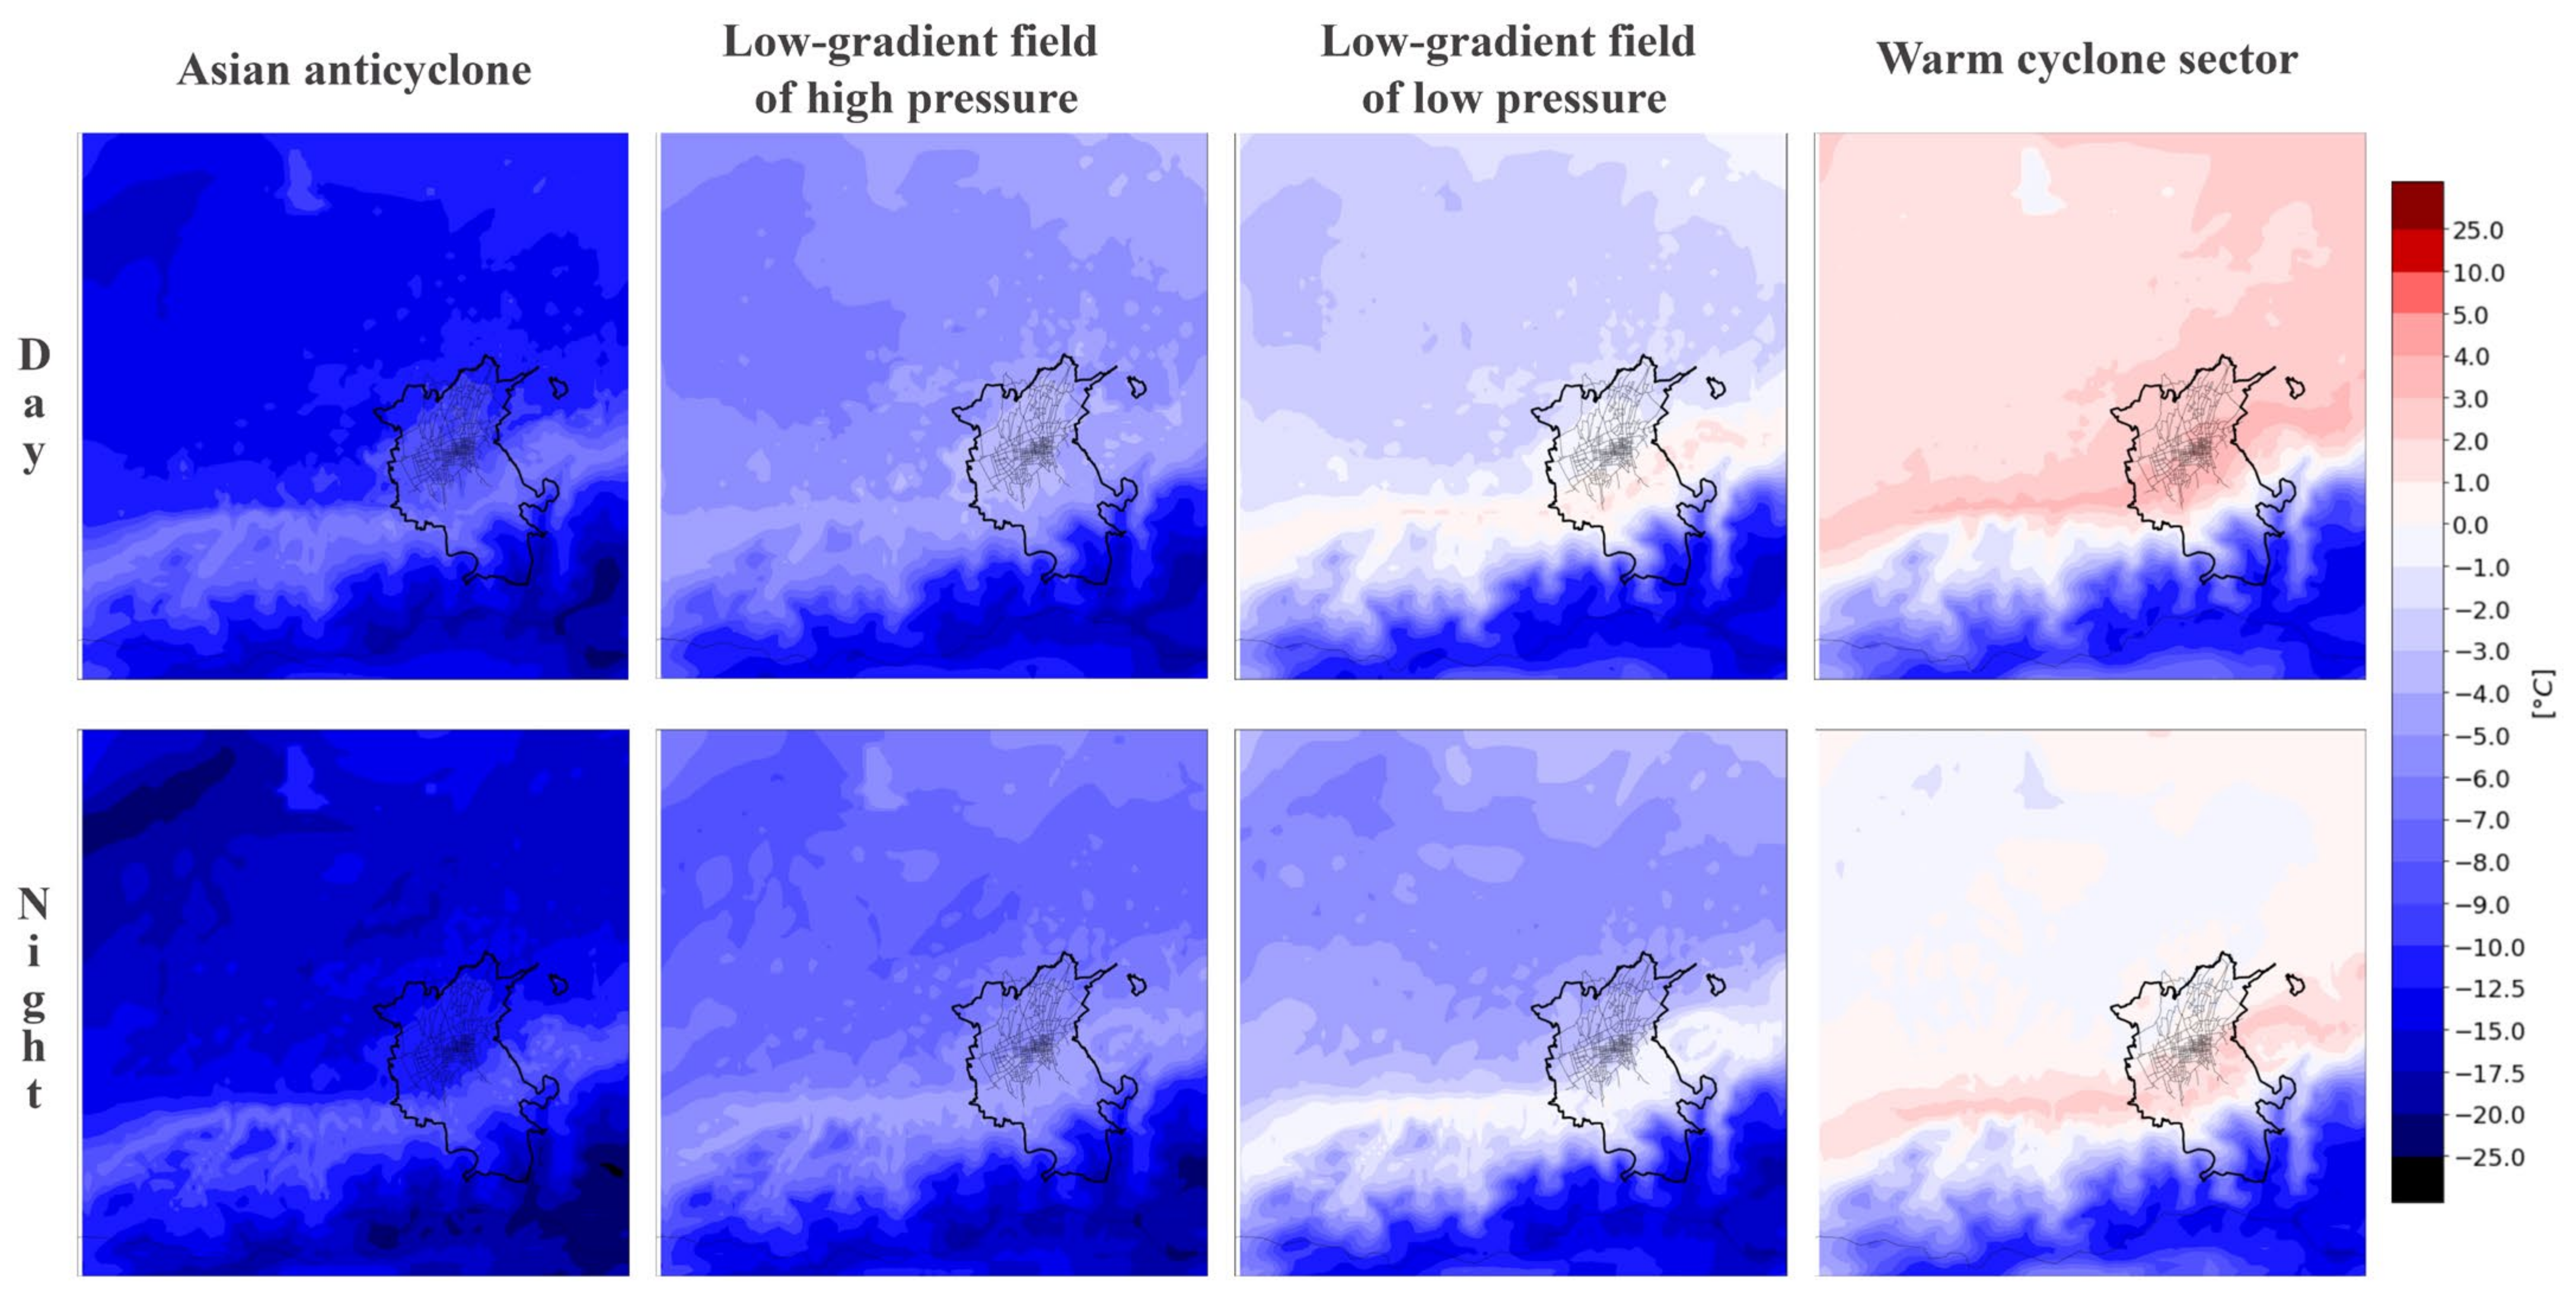
Figure 17 shows average daytime and nighttime air temperature maps for these scenarios. Consistently across all situations, foothills exhibit higher temperatures compared to the lowlands and highlands. This can be attributed to the favorable sun exposure of mountain slopes, allowing for better solar radiation absorption. As expected, the warm sector of the cyclone brings the most significant daytime and nighttime warming. During both high- and low-pressure LGFs, an increase in daytime and nighttime air temperatures is observed within the city. The anticyclonic period displays the lowest overall temperatures. Daytime sees a rise in temperature within the city, while nighttime temperatures remain nearly identical to those in the suburbs.
The statistical analysis of the city and its suburbs’ wind regime revealed poor air circulation within the city.
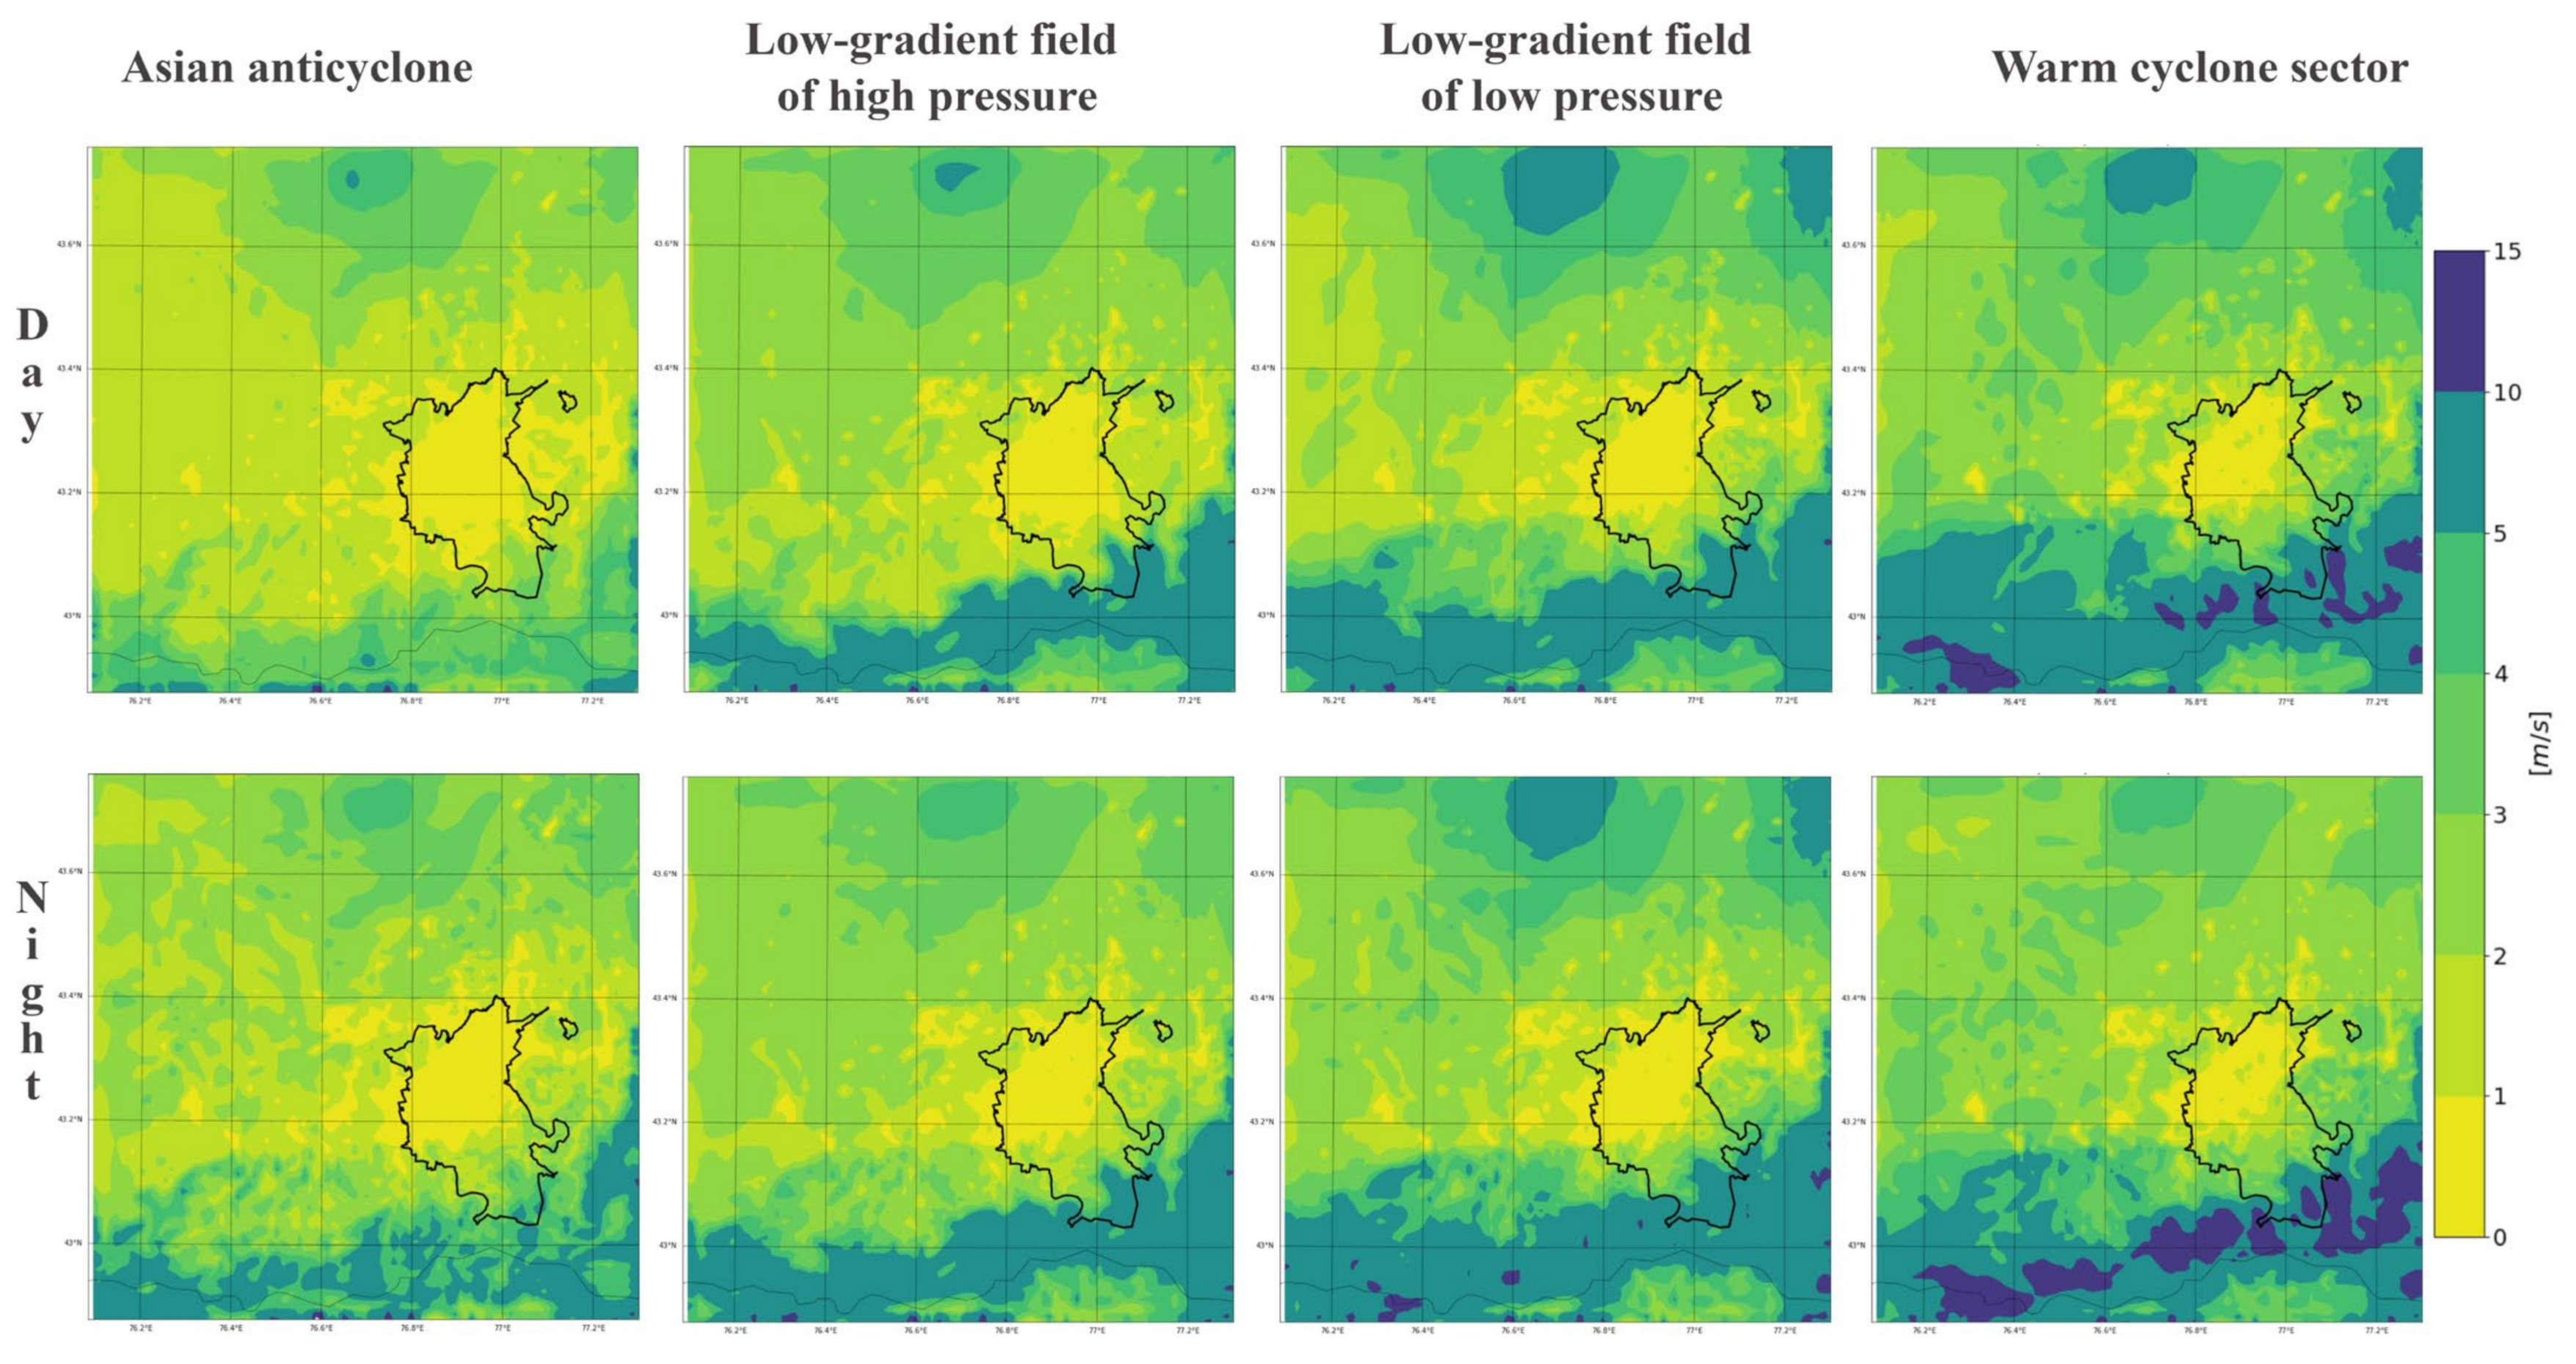
Figure 18 illustrates average wind speeds under different synoptic situations. The figure shows that anticyclonic periods experience very low wind speeds throughout, ranging from 0 to 2 m/s during the day and 0 to 3 m/s at night within the foothills and lowlands. This stagnant air, with speeds of 0–1 m/s in the city itself, reduces ventilation and contributes to poor air quality. Low wind speeds are also observed during high- and low-pressure LGFs. The maximum impact of urban development on wind attenuation occurs in warm sector cyclone conditions. While wind speeds in the vicinity of the city range from 2 to 5 m/s, in the city center, they drop to minimum values (0–1 m/s).
The influence of synoptic situations on the intensity of the urban heat island (UHI) is illustrated in
Table 2. As seen from this table, the maximum intensity of the UHI is reached under anticyclone conditions, when the nocturnal drainage of cold air from the mountains forms a stagnant zone in the form of a stably stratified surface layer of the atmosphere. Heat emitted by buildings, roads, and other objects of urban infrastructure becomes trapped in this zone, resulting in the UHI with the highest intensity of approximately 4 °C.
Synoptic situations of high-pressure LGF, low-pressure LGF, and warm cyclone sectors are characterized by lower intensity urban heat island effects (temperature differences not exceeding 2–3 °C). During these stages, regional processes begin to intensify, particularly in the northern part of the city’s air basin. Winds blowing from latitudinal directions are more frequent and vigorous there [
31]. As expected, the UHI virtually disappears during cyclonic periods (temperature differences are around 0 °C).
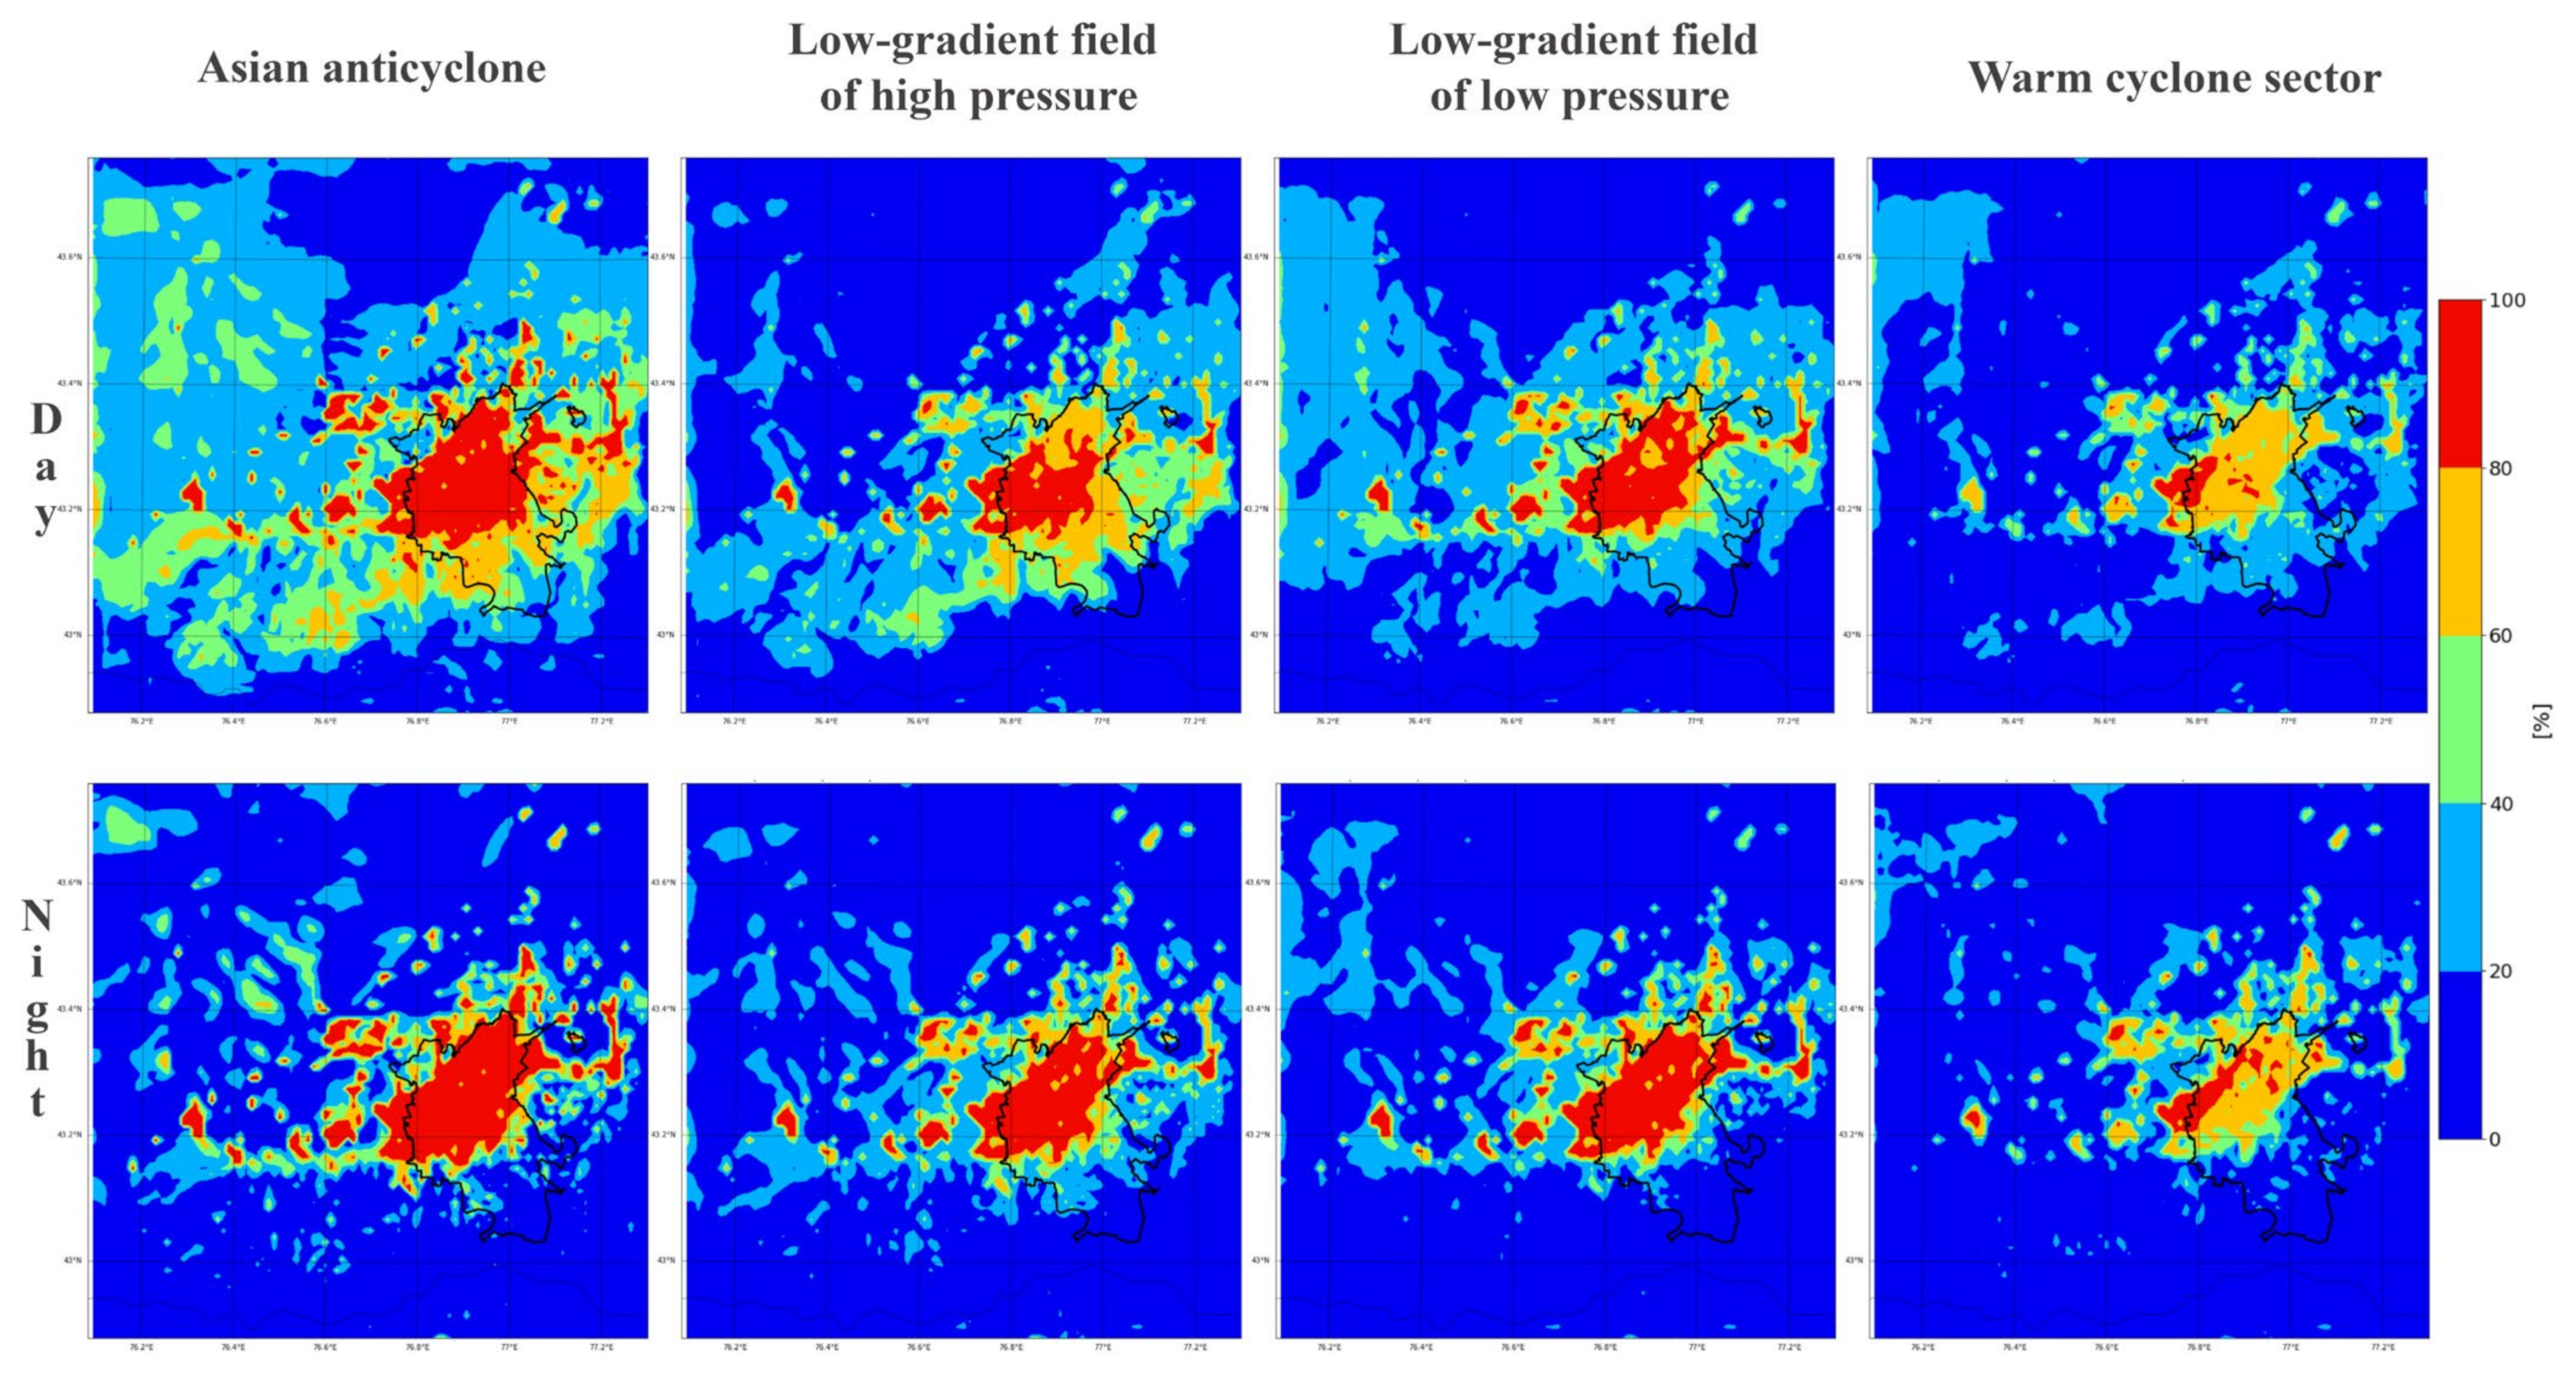
To assess air ventilation within the city, we calculated the frequency of calm and low wind conditions (0–1 m/s) during unfavorable synoptic situations. Daytime calculations (
Figure 19, day) reveal the weakest air circulation occurs during anticyclonic periods. Here, weak local winds are significantly dampened by urban development, leading to near-calm conditions.
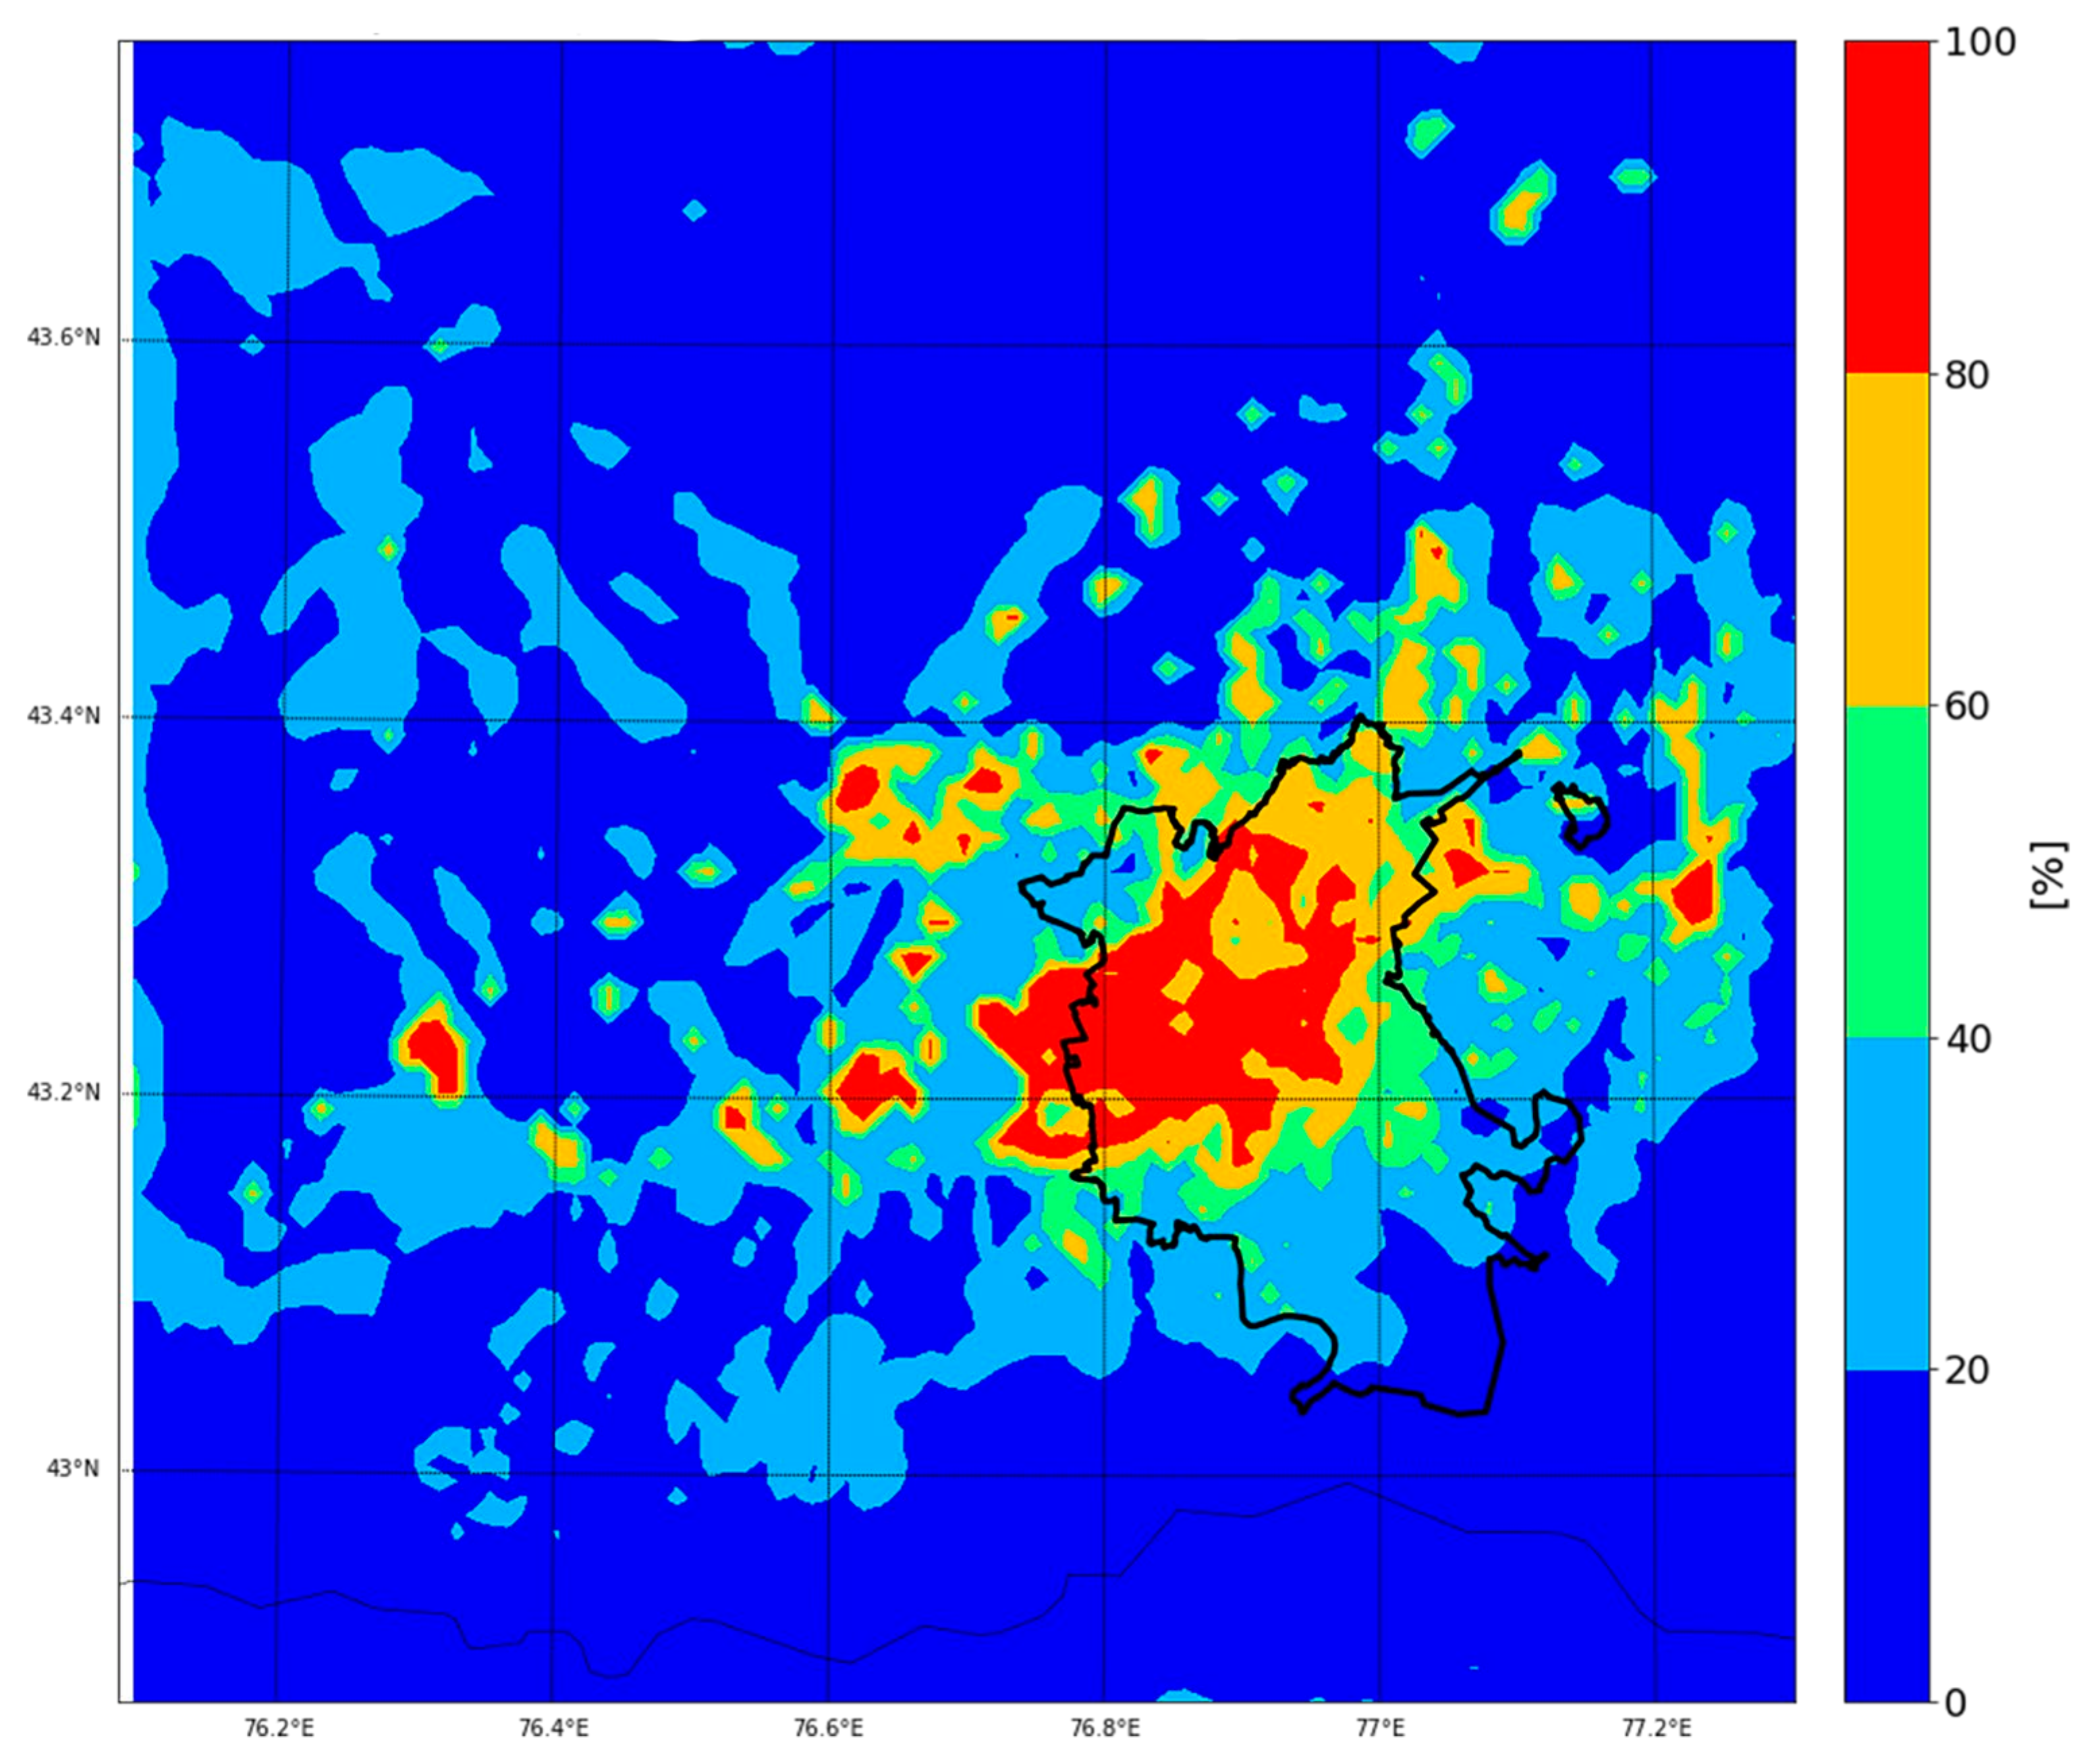
Figure 20 illustrates the areas most affected, where wind speeds of 0–1 m/s occur over 80% of the time, encompassing a substantial 350 sq km within the city. Only in the north are there limited pockets where the frequency of weak winds dips to 20–40%. Low-pressure LGF also bring poor ventilation, with wind speeds of 0–1 m/s observed over 80% of the time and affecting an area of 238 sq km. High-pressure LGFs show some improvement, with calm and weak winds (80–100% frequency) covering a reduced area of 193 sq km. Finally, the warm sector of the cyclone brings a slight improvement, with the frequency of low-wind and calm conditions dropping to 60–80%.
Nighttime observations across all four unfavorable synoptic situations (anticyclone, LGFs of high and low pressure, warm sector of the cyclone) reveal a further weakening of air circulation within urbanized areas (refer to
Figure 19, night). Wind speeds decrease significantly, leading to an expansion of the area experiencing frequent low winds (over 80% of the time).
This concerning trend signifies that, regardless of daytime or nighttime conditions, nearly the entire residential urban area is poorly ventilated and falls within a high environmental risk zone during these January periods (2022, 2023, and 2024). Based on this three-year sample of January months, we can confidently conclude that stagnant atmospheric conditions are prevalent during this time of year.
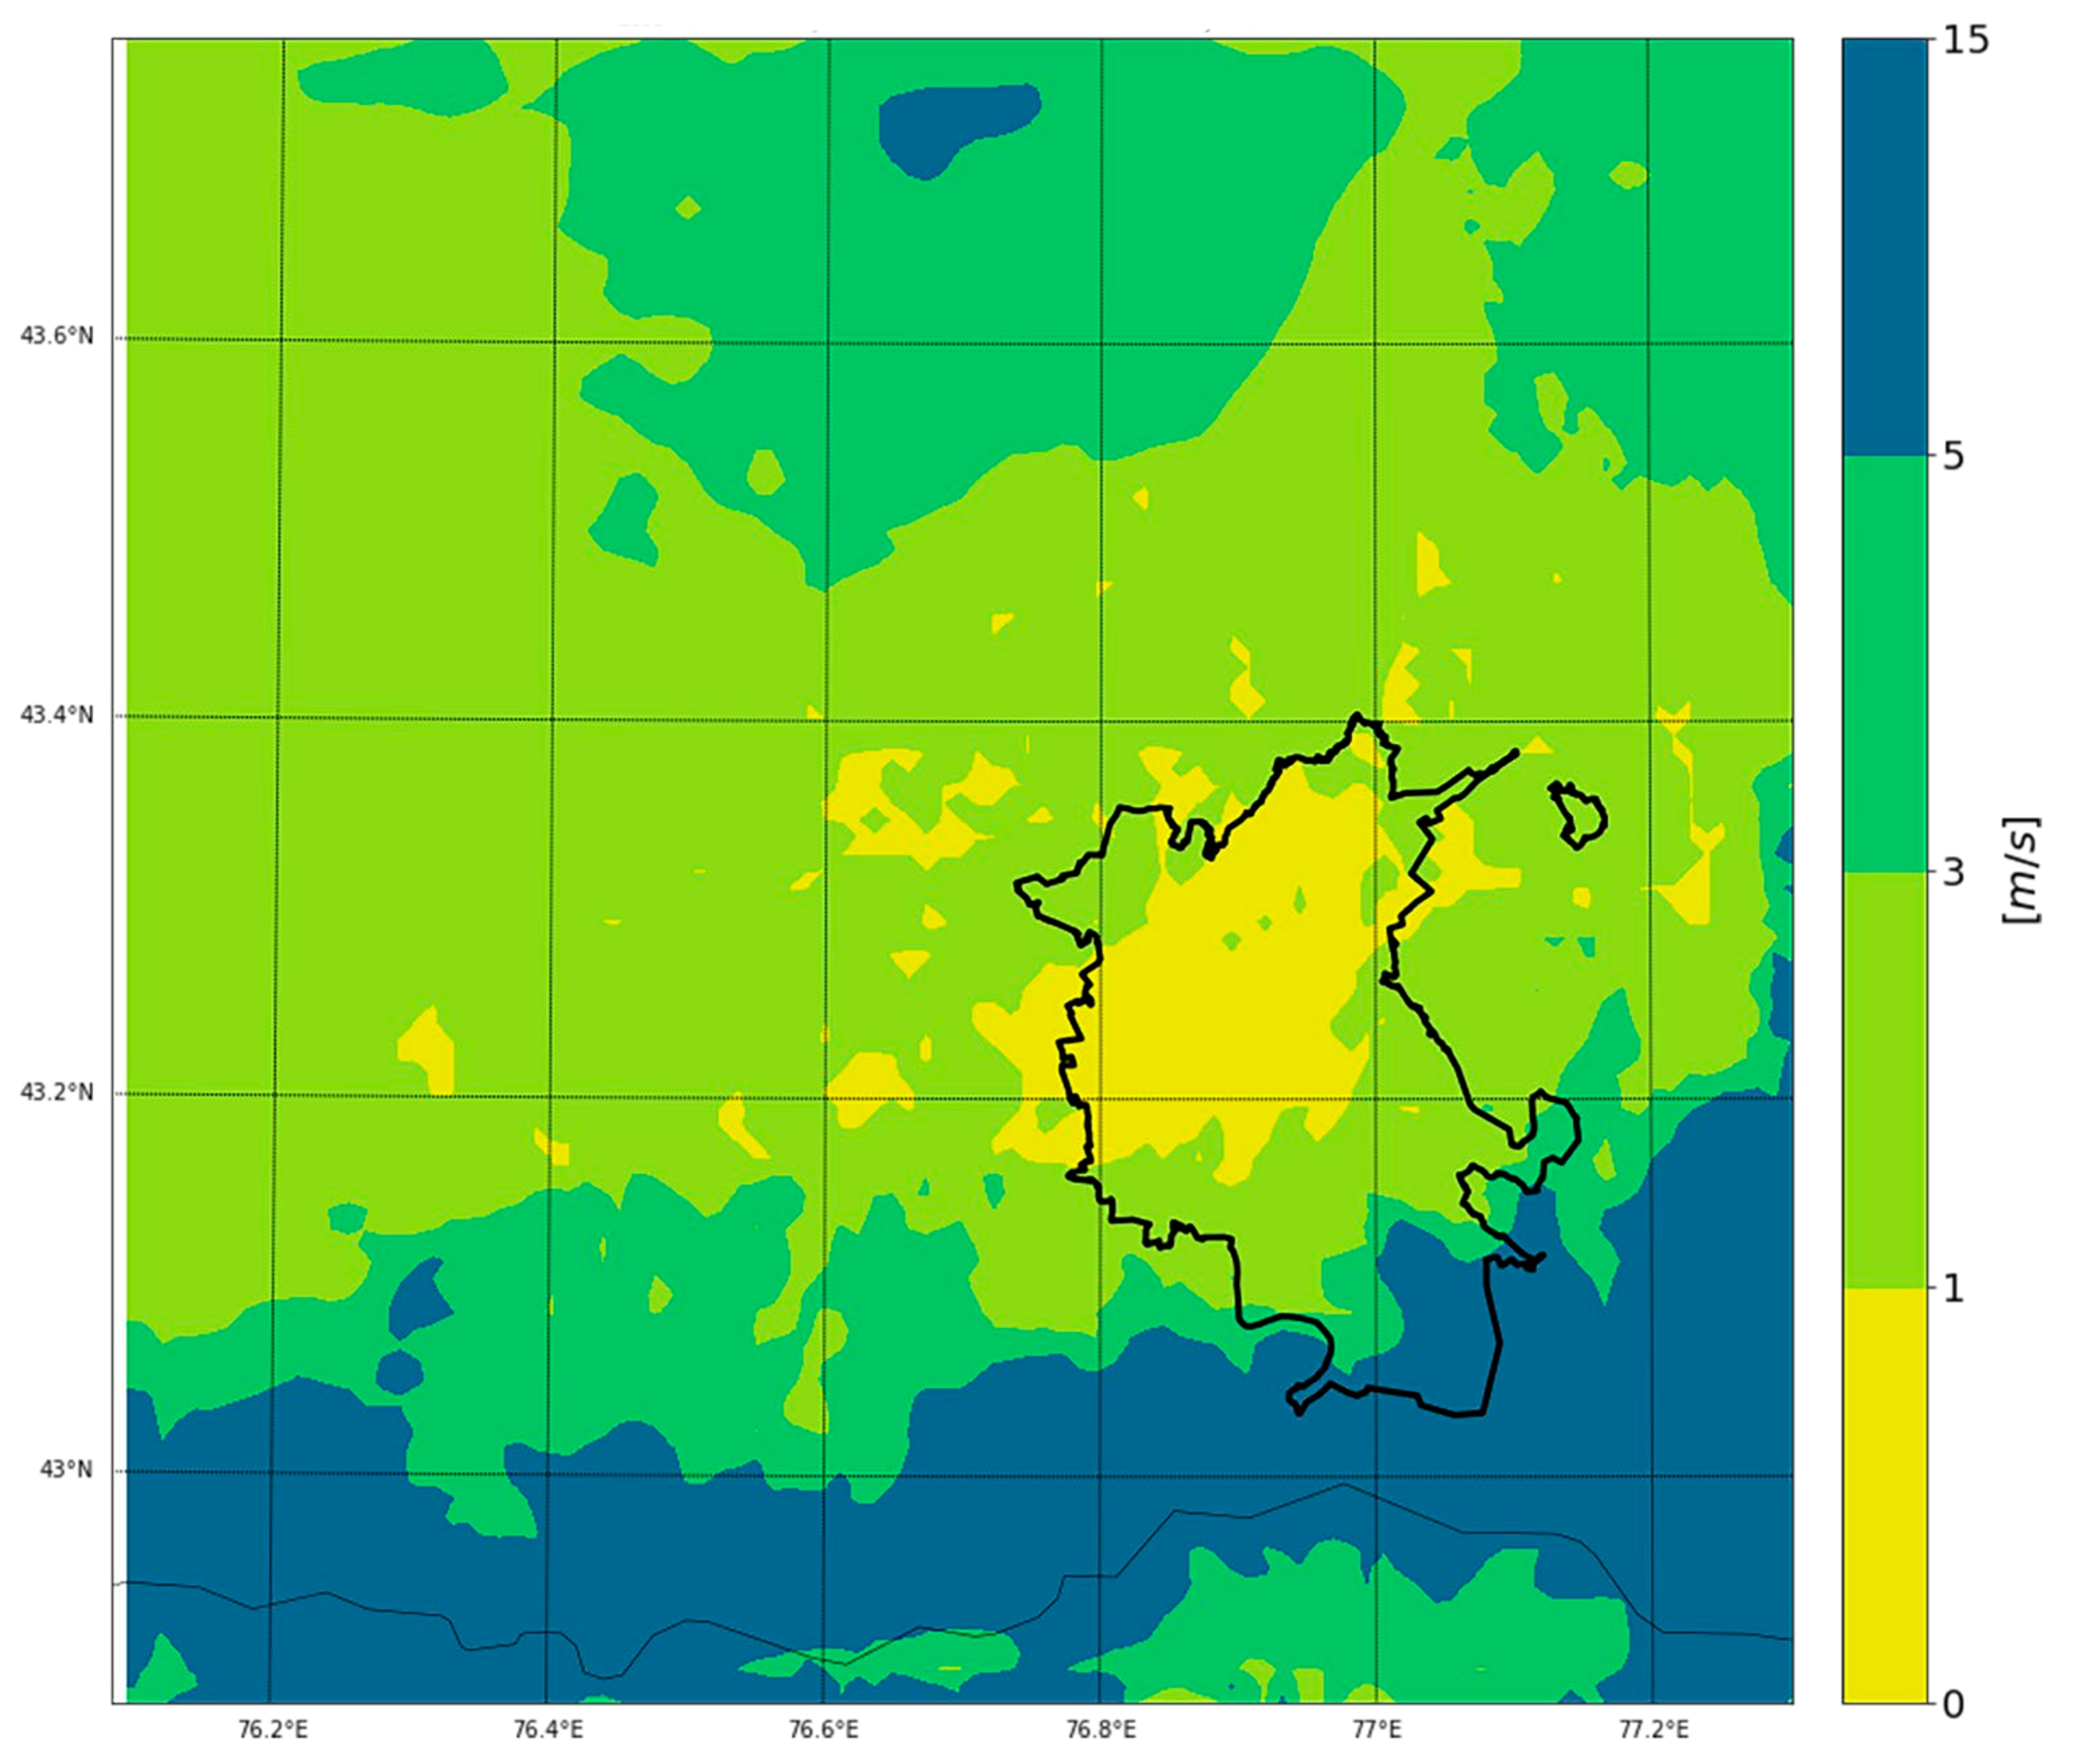
Figure 21 illustrates average wind speeds across all synoptic situations. A concerning finding is the extensive unventilated zone within the city’s residential area, characterized by wind speeds of 0–1 m/s and occurring over 60–100% of the time (refer to
Figure 22 for details). Scattered pockets of similarly stagnant air can also be found throughout these residential areas. In contrast, northern and western Almaty experience generally stronger winds, averaging 1–5 m/s. A small high-wind zone exceeding 5 m/s is even observed near Lake Sarybulak. Wind speeds are higher in foothill areas, averaging 3–5 m/s, while mountainous regions experience a wider range of 5–15 m/s.
Figure 22 reveals that a significant portion of the city’s residential area experiences poor ventilation, with light and calm winds exceeding 80% of the time. In contrast, some limited areas in the north show a slightly lower frequency of weak winds, ranging from 20 to 40%.
4. Conclusions
This study presents the results of WRF modeling of stagnant atmospheric conditions in Almaty, Kazakhstan, utilizing a Local Climate Zone map as input land-use data. Comparison of the modeling results with observational data for the test period from 13 to 23 January 2023 demonstrated that the model generally accurately captures the diurnal temperature variation and weak wind regime in Almaty and its surrounding areas.
WRF modeling results indicate that the inversion layer’s dynamics exhibit a cyclical pattern under anticyclonic conditions, with an elevated inversion during the daytime and a ground-based inversion at night. This process is accompanied by mountain-valley circulation, which is adequately captured by WRF modeling.
The results indicate that the modeling results are in good agreement with the aerological sounding data for the morning time period. In the evening, according to the radiosonde data, a multi-layer system with alternating layers of stable and neutral stratification forms in the atmosphere. However, the WRF model does not reflect the multi-layered structure.
The urban heat island is analyzed using the virtual rural method, which involves calculating the difference between the thermal field with urban land cover and a corresponding thermal field without urban land cover. The latter is created by replacing urban classes in the land-use map with grasslands.
The analysis of simulated UHI results for the test period from 13 to 23 January 2023 showed that the distribution of heat pollution varies throughout the day. The UHI area at night covers 344 km², while during the day, it expands to 370 km². The highest UHI temperature at night is observed in the northwestern part of the city, reaching 8.2 °C. During the day, the maximum temperature is lower, at 7.4 °C, but the average temperature across the entire area (including the foothills) is higher, at 3.6 °C compared to 3.3 °C at night.
Surface temperature TSK and air temperature T2 are compared to LST from the Landsat-9 satellite. The results demonstrated that the WRF model adequately captures the temperature regime at the ground level.
For unfavorable synoptic situations that promote the accumulation of pollutants in the atmosphere, such as anticyclones, high-pressure LGF, low-pressure LGF, and warm sectors of cyclones, a statistical analysis was conducted using modeling data from three January months (2022, 2023, and 2024). It has been demonstrated that the accumulation of thermal pollution, manifested as the urban heat island (UHI) effect, varies under different synoptic situations. In this regard, the anticyclone is characterized by the strongest UHI. The results indicate that the worst ventilation of the urban area occurs during anticyclonic periods, with a recurrence of calm winds exceeding 80% over the entire developed part of the city. Ventilation improves somewhat under high- and low-pressure LGFs. In the warm sector of cyclones, the recurrence of low-wind and calm situations in the built-up part of the city decreases to 60–80%, while the maximum influence of urban development on wind retardation is observed. Thus, regardless of the time of day, under all four synoptic situations, virtually the entire urban residential area in the considered periods is poorly ventilated and is in a zone of high environmental risk.
In our view, the research conducted in this work has shown that the WRF model can be used as a tool for analyzing air stagnation in the city of Almaty. The results of this article will serve as the basis for further research by the authors to study the wind and heat regimes of the city of Almaty based on data obtained from modeling the circulation of local winds and other meteorological parameters under different urban development options in environmentally unfavorable periods.
