Article

Residual Spatiotemporal Convolutional Neural Network Based on Multisource Fusion Data for Approaching Precipitation Forecasting

1
School of Atmospheric Sciences, Sun Yat-sen University, Guangdong Province Key Laboratory for Climate Change and Natural Disaster Studies, Key Laboratory of Tropical Atmosphere-Ocean System, Ministry of Education, Zhuhai 519000, China
2
Southern Marine Science and Engineering Guangdong Laboratory, Zhuhai 519000, China
3
National Observation and Research Station of Coastal Ecological Environments in Macao, Macao Environmental Research Institute, Faculty of Innovation Engineering, Macau University of Science and Technology, Macao SAR 999078, China
*
Author to whom correspondence should be addressed.
Atmosphere 2024, 15(6), 628; https://doi.org/10.3390/atmos15060628
Submission received: 20 April 2024 / Revised: 18 May 2024 / Accepted: 23 May 2024 / Published: 24 May 2024
(This article belongs to the Section Atmospheric Techniques, Instruments, and Modeling)

Abstract

:
Approaching precipitation forecast refers to the prediction of precipitation within a short time scale, which is usually regarded as a spatiotemporal sequence prediction problem based on radar echo maps. However, due to its reliance on single-image prediction, it lacks good capture of sudden severe convective events and physical constraints, which may lead to prediction ambiguities and issues such as false alarms and missed alarms. Therefore, this study dynamically combines meteorological elements from surface observations with upper-air reanalysis data to establish complex nonlinear relationships among meteorological variables based on multisource data. We design a Residual Spatiotemporal Convolutional Network (ResSTConvNet) specifically for this purpose. In this model, data fusion is achieved through the channel attention mechanism, which assigns weights to different channels. Feature extraction is conducted through simultaneous three-dimensional and two-dimensional convolution operations using a pure convolutional structure, allowing the learning of spatiotemporal feature information. Finally, feature fitting is accomplished through residual connections, enhancing the model’s predictive capability. Furthermore, we evaluate the performance of our model in 0–3 h forecasting. The results show that compared with baseline methods, this network exhibits significantly better performance in predicting heavy rainfall. Moreover, as the forecast lead time increases, the spatial features of the forecast results from our network are richer than those of other baseline models, leading to more accurate predictions of precipitation intensity and coverage area.

1. Introduction

Approaching precipitation forecasting predicts the intensity of precipitation within the next 0–6 h, enabling early warning for potential disasters such as heavy rain and flooding. This forecasting holds significant importance for people’s daily lives. In comparison with medium- to long-term precipitation forecasts, accurate approaching predictions garner considerable attention in the meteorological services sector, because intense approaching rainfall, if not addressed promptly, can have adverse effects on agriculture, industry, and tertiary sectors such as transportation services. Therefore, it is crucial for both individuals and governments to forecast approaching precipitation in advance and issue warnings, enabling appropriate response measures. Hence, enhancing the accuracy and timeliness of approaching precipitation forecasting bears great practical significance [1,2].
Traditional approaching precipitation forecasting primarily relies on radar extrapolation methods, mainly including Tracking Radar Echoes by Correlation (TREC), Storm Cell Identification and Tracking (SCIT), and optical flow [3,4,5]. These methods extrapolate future frames of radar echo images based on past frames, resulting in high computational efficiency and relatively clear predictive images, making them the mainstream approach in traditional forecasting. However, due to their neglect of the fundamental nonlinear characteristics of atmospheric motion and inadequate utilization of historical radar echo data, relying solely on given radar echo images for extrapolation lacks historical patterns, resulting in lower prediction accuracy and inability to meet practical application needs. On the other hand, Numerical Weather Prediction (NWP), which parameterizes weather conditions through a series of physical equations, is also not suitable for use in the field of approaching forecasting because of its short lead time and high computational cost [6,7]. Therefore, how to obtain more accurate approaching precipitation forecasts at lower costs has been a significant concern in the meteorological services sector.
With the rapid advancement of deep learning in recent years and the improvement in computer hardware and software, artificial intelligence has found wide-ranging applications across various industries with notably impressive results [8,9,10]. Researchers in the meteorological field also have gradually begun to explore the application of deep learning techniques in weather forecasting such as using channel attention mechanisms for lightning forecasting, generative adversarial networks for short-term precipitation forecasting, and encoder–decoder structures for quantitative precipitation forecasting [11,12,13]. Precipitation forecasting necessitates considering spatial correlations, temporal dependencies, and interdependencies among meteorological elements, with the most representative approaches undoubtedly being Long Short-Term Memory (LSTM) architectures and convolutional neural network (CNN) architectures.
The LSTM architecture, based on the Markov assumption, is well-suited for handling long time series due to the presence of its hidden layers, which capture temporal features through recurrent connections. Furthermore, the inclusion of gating units helps mitigate the issues of gradient explosion and vanishing gradients. Shi et al. proposed the convolutional LSTM (ConvLSTM) model for approaching precipitation forecasting, innovatively substituting convolutional operations for fully connected operations in the encoder–decoder architecture [14]. This model effectively addresses the original decoder’s limitations in capturing spatial features over long periods, serving as a foundational model in the field of deep learning for precipitation prediction. Subsequently, Shi et al. further improved the model by introducing optical flow into Trajectory GRU (TrajGRU) [15], enhancing the transfer of high-level features by reversing the prediction direction, thus enabling the encoder to receive and process more comprehensive feature information. However, the introduction of optical flow significantly slowed down the training speed. The proposal of a predictive recurrent neural network (PredRNN) [16] effectively alleviated this issue by completing the transfer from high- to low-level information through a zigzag structure, addressing the inability to pass information layer by layer between adjacent layers. PredRNN has since been designated as the foundational model for approaching precipitation forecasting by the China Meteorological Administration. The subsequent model, PredRNN+, further streamlined the flow of information, enhancing the ability to forecast approaching sudden events by increasing network depth to capture more spatiotemporal features [17]. Memory In Memory (MIM) networks attempt to introduce memory modules to model the nonstationary and approximately stationary characteristics of spatiotemporal information by multiple differentiations to transform non-stationary processes into stationary ones [18]. The MotionRNN model enhances optimizer performance, learns instantaneous changes, and accumulates motion trends by incorporating MotionGRU between layers to capture transient changes and motion trends [19]. These are all representative models based on the recurrent neural network architecture.
The forecasting model based on convolutional neural network architecture is exemplified by the U-net [20], which was originally applied in the field of biomedical image segmentation. Subsequently, meteorologists viewed the prediction problem as an image-to-image translation task and began applying the U-net model to precipitation forecasting [21]. In 2020, researchers adapted predictive headers to replace the original classification headers. They integrated temporal and spatial information specific to radar data and proposed a versatile radar precipitation forecasting model called RainNet [22], which demonstrated universality for radar precipitation forecasting tasks. Furthermore, Shen et al. proposed a new radar echo extrapolation model named ADC_Net based on dilated convolutions and attention mechanisms to enhance the utilization and accuracy of radar extrapolation information, effectively improving the accuracy of radar echo extrapolation [23].
Although the current two architectures perform well in the field of approaching precipitation, most current research is solely based on radar data without considering the relationship between other meteorological elements in the upper atmosphere and rainfall. The extrapolation of a single element cannot accurately capture the occurrence of a sudden event, and therefore the predictive ability for events such as convective initiation and dissipation often falls short of forecasts. Furthermore, as neural networks become deeper, the feature information extracted at shallow layers is prone to disturbances during transmission, resulting in iterative errors. Errors propagate through the network as information is passed layer by layer. Consequently, as the forecast lead time increases, the network’s predictive performance rapidly declines.
To address these issues, this study proposes a Residual Spatiotemporal Convolutional Network (ResSTConvNet) based on multisource fused data. This network replaces the LSTM architecture with separate three-dimensional convolutions, adopts a pure convolutional architecture for feature capturing, and fits spatiotemporal information using residual fitting blocks, thereby improving operational speed and reducing memory usage.
The following sections of this article are arranged in the following structure. Section 2 describes the data and methodology. Section 3 describes the ResSTConvNet model in detail. Section 4 presents the experimental results used to evaluate the model. Section 5 provides a conclusion.

2. Materials and Methods

2.1. Study Area

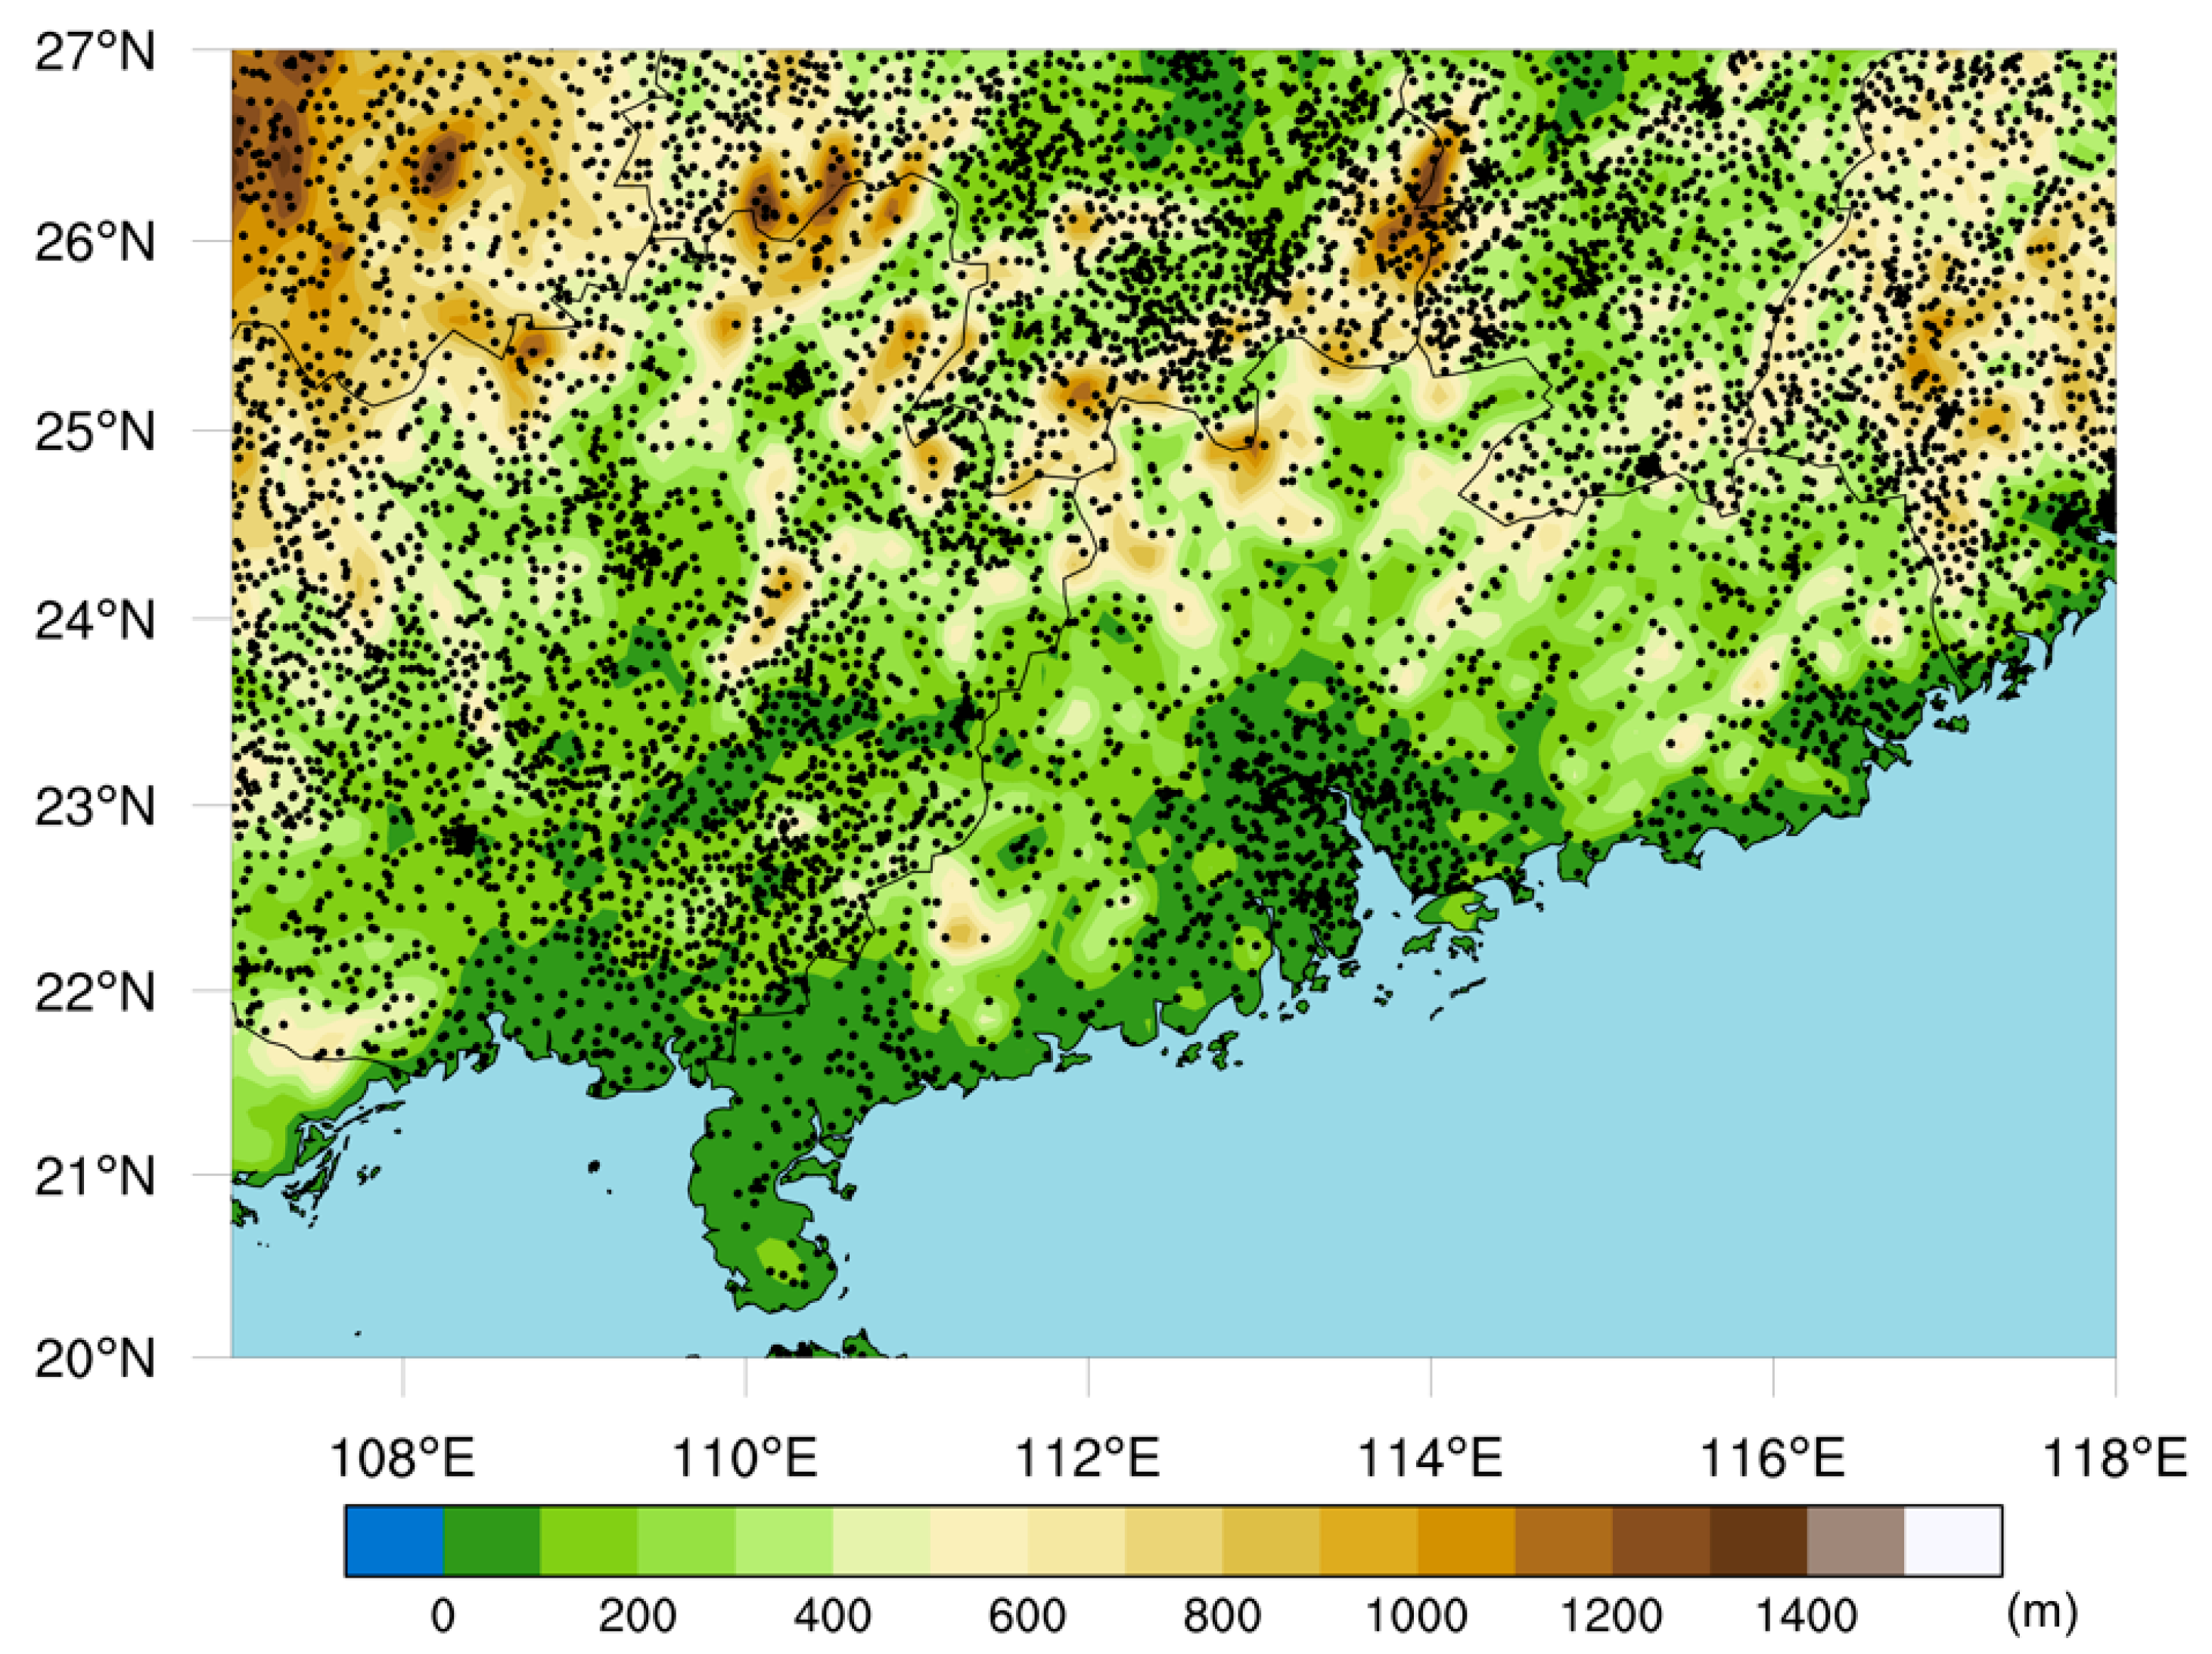
The study area of this research is located in Southern China, primarily encompassing the provinces of Guangdong and Guangxi and surrounding areas, as shown in Figure 1. The latitude and longitude coordinates range from 20° to 27° N and 107° to 118° E, respectively. This region is influenced by a subtropical monsoon climate, leading to frequent occurrences of short-term heavy rainfall. The frequency of short-duration heavy rainfall and the maximum hourly rainfall intensity in this region are among the highest in China. Additionally, the southern region boasts a well-established meteorological detection network, providing a wealth of high-quality meteorological data. The densely populated urban agglomerations in the Guangdong–Hong Kong–Macao Greater Bay Area are highly susceptible to the impacts of heavy rainfall, which can significantly affect agriculture, industry, and the service sector. Therefore, effective and accurate approaching precipitation forecasting is crucial for the daily lives and economic development of the people in this region.

2.2. Dataset Preprocessing and Selection of Meteorological Elements

This study combines ground precipitation data with upper-air meteorological element data as the dataset. The upper-air data utilize hourly data from the European Centre for Medium-Range Weather Forecasts (ECMWF) ERA5 reanalysis, with a spatial resolution of 0.25° × 0.25°. Surface observation data utilize hourly rainfall data from all national and automatic weather stations within the selected region provided by the China Meteorological Administration. Within the study area, there are a total of 301 national stations and 6579 automatic regional stations contributing to the dataset. The station locations are annotated in Figure 1. The rainfall data from observation stations undergo quality control processing, excluding data from malfunctioning stations. Subsequently, inverse distance weighting interpolation is employed to interpolate station data onto grid points, matching the temporal and spatial resolution of the upper-air data, thus enabling multimodal data fusion. If there are any missing or omitted data in either dataset, the corresponding samples are removed. Additionally, we replaced all extreme values below 0 and above 1000 with missing values to avoid the abnormal impact of individual extreme values on the overall performance of the model. Ground observation data and upper-air reanalysis data are fused and concatenated based on meteorological elements to form the experimental dataset.
According to the requirements of deep learning training, the total dataset is divided into training, validation, and test sets. The ten years of data from 2010 to 2020 are allocated according to the ratio of 8:1:1, as shown in Table 1. The selected meteorological elements include the most fundamental elements in the weather system, including temperature, pressure, humidity, U-wind, and V-wind. Details can be found in Table 2.

2.3. Evaluation Metrics

The evaluation of precipitation forecasting results in this study primarily includes both qualitative and quantitative aspects, comprising four common categorical metrics: Probability of Detection (POD); False Alarm Rate (FAR); Critical Success Index (CSI); Heidke Skill Score (HSS); and two continuous metrics, Root Mean Squared Error (RMSE) and Mean Absolute Error (MAE).
In order to calculate the four categorical indicators, it is necessary to establish a binary confusion matrix based on the two-class classification. This involves using a probability threshold method, where a grid point is assigned a value of 1 if the data at that point exceed the set threshold, and 0 otherwise. Subsequently, by comparing the predicted results with the actual values, the following values are calculated: TP (true positive, when prediction = 1 and truth = 1), FN (false negative, when prediction = 0 and truth = 1), FP (false positive, when prediction = 1 and truth = 0), and TN (true negative, when prediction = 0 and truth = 0). Finally, the calculation of the relevant parameters is carried out according to the following formula:
POD = TP TP + FN
FAR = TP TP + FP
CSI = TP TP + FN + FP
HSS = 2 × ( TP × TN FP × FN ) ( TP + FN ) × ( FP + TN ) + ( TP + FP ) × ( FN + TN )
To assess the prediction capability regarding precipitation intensity, we also computed the MAE and RMSE between the predicted values and the ground truth. These metrics focus on the differences in intensity. The specific formulas for calculation are as follows:
MAE = 1 m × n i = 1 m j = 1 n X i , j Y i , j
RMSE = 1 m × n i = 1 m j = 1 n X i , j Y i , j 2
X and Y, respectively, represent the forecasted precipitation results and the actual ground observation results, where m × n represents the grid points within the research area. The smaller the difference value between the predicted values and the observed values, the better the prediction performance.

2.4. Baseline Methods

The baseline models in this study mainly included ConvLSTM, U-net, ResNet, and PredRNN. The details are as follows:
ConvLSTM: ConvLSTM is defined as the cornerstone network in the field of precipitation forecasting. In this experiment, a three-layer network is chosen with hidden layer sizes of [64, 64, 128], and the learning rate is set to 0.001. Based on the scale and characteristics of the processed data, the kernel size and padding are respectively set to [3, 3] and 1, and the bias is set to 0, aiming to restore the original feature map size as much as possible. Due to the model’s susceptibility to overfitting, the number of epochs is set to 50, which is deemed sufficient.
U-net: Compared with ConvLSTM, U-net utilizes a U-shaped architecture predominantly composed of convolutional pooling layers. The basic network for feature extraction is a convolutional neural network. Training proceeds through four convolutional layers, with channel sizes of 64, 128, 256, and 512, respectively. Similarly, the kernel size and padding are, respectively, set to [3, 3] and 1 for all layers. After each convolutional operation, there is a corresponding average pooling layer. Following the downsampling layer, the image is restored through skip connections to four upsampling layers.
ResNet: We construct a simple three-layer residual block with the aim of observing whether the residual block has a positive effect on predicting extreme values. The input and output channel sizes of the convolutional layers are both set to 1, and only single ground observation data are used for experimentation.
PredRNN: In this experiment, PredRNN utilized a three-layer basic model, maintaining consistency with ConvLSTM’s parameter configuration on important parameters. The configuration of memory modules and recurrent units corresponds to the number of input channels and spatial ranges.
To ensure that other parameters do not affect the network training effectiveness, the learning rate for the aforementioned models is set to 0.001, and the training epochs are all set to 50.

3. Model Construction

In this section, the proposed ResSTConvNet model is discussed in detail. First, we present the overall architecture of our model and the basic information flow, explaining the data transmission direction. Subsequently, we elaborate on channel attention, spatiotemporal feature information flow, and residual fitting connection, explaining how ResSTConvNet uses these modules to accomplish feature extraction and data transmission.

3.1. Overall Network

This section aims to introduce the overall network of ResSTConvNet, which mainly includes the attention weight allocation module, the spatiotemporal feature information flow, and the residual fitting module. The overall framework is illustrated in Figure 2. The data pass through the data fusion block, undergo feature extraction, and are merged in the residual fitting block to obtain the final prediction results. The details of these three modules are elaborated in the following sections.

3.2. Channel Attention

This section introduces high-altitude variables to establish a comprehensive meteorological system for deducing future precipitation conditions. Each meteorological element in Table 2 can be regarded as a channel of input, equivalent to modeling a multichannel correlation problem. The contribution of each variable to the final prediction is allocated through channel attention mechanisms.
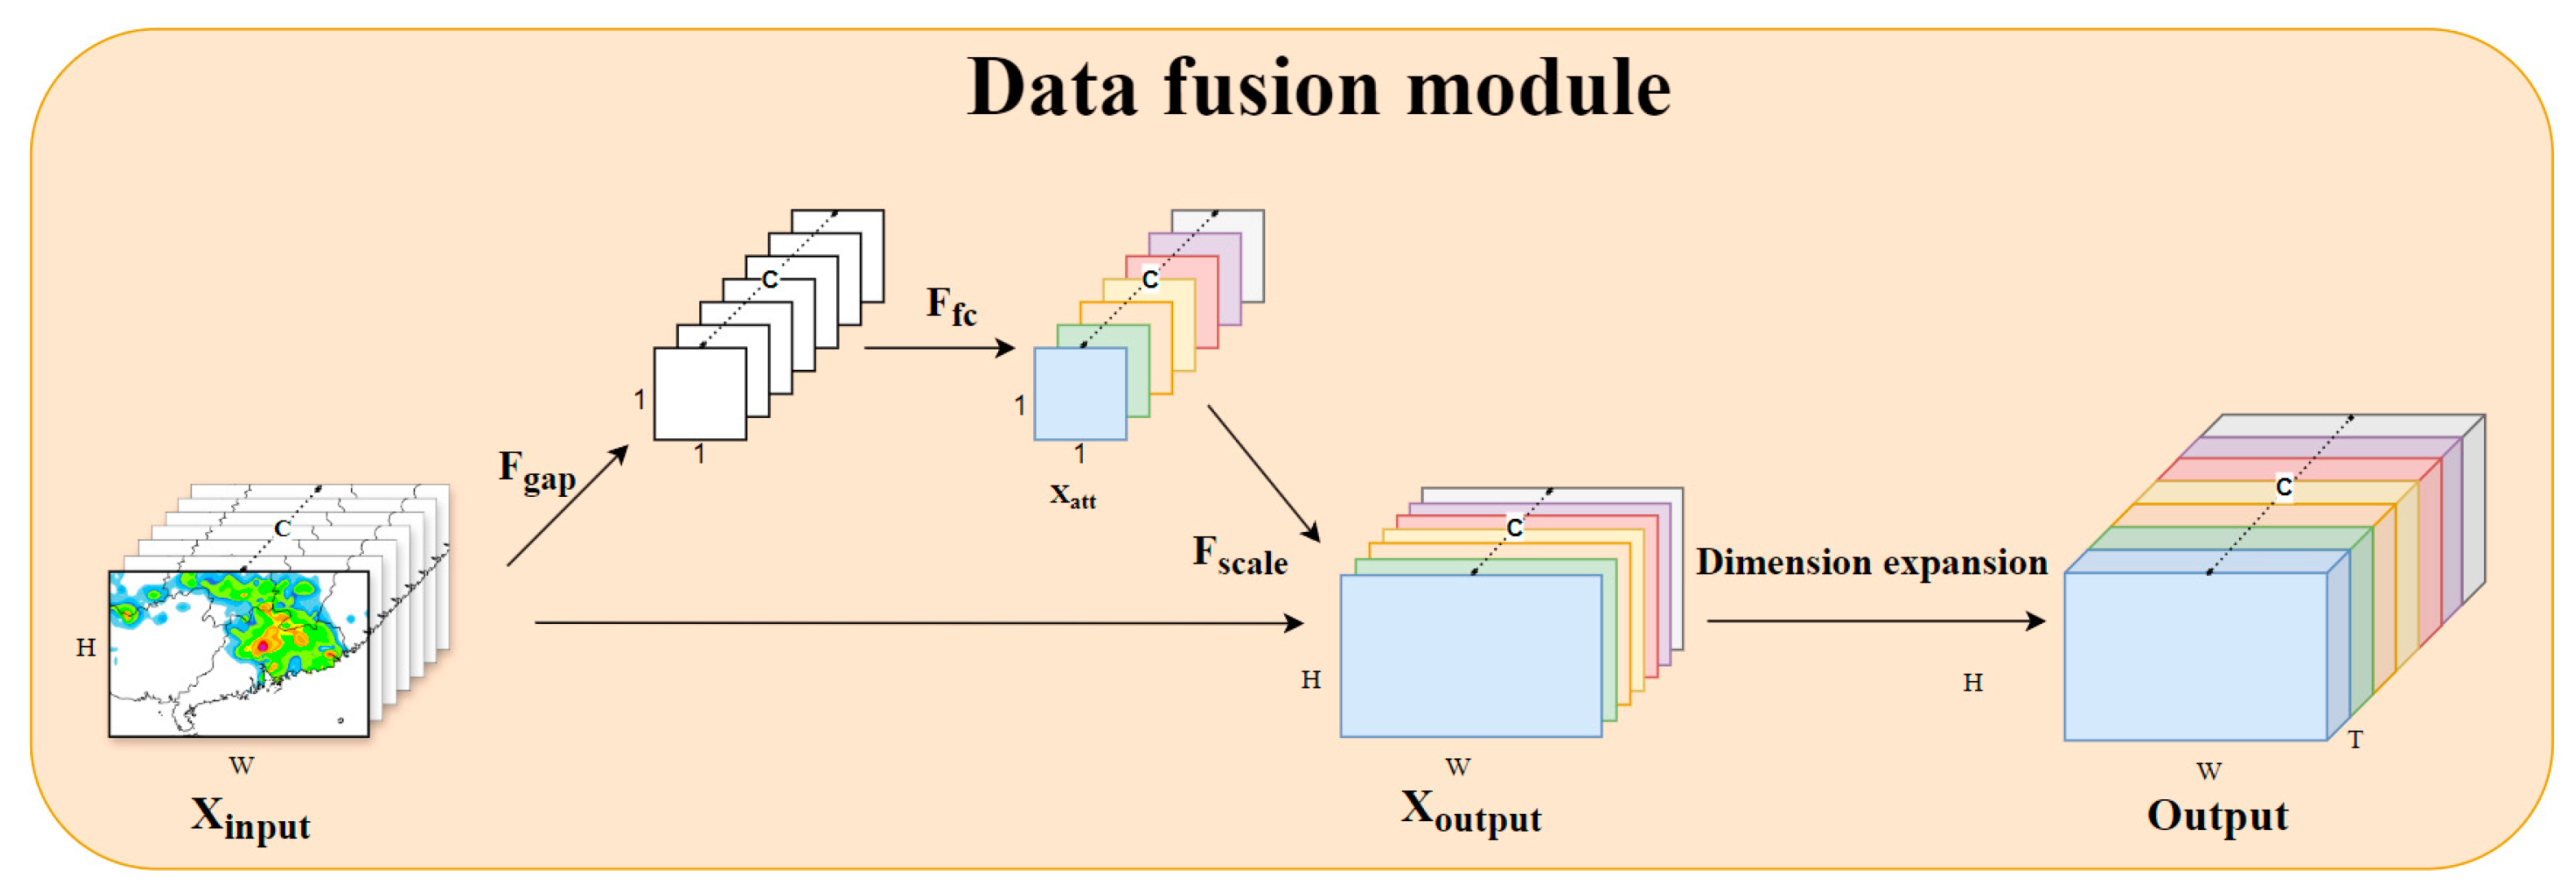
Because this module only needs to consider the channel feature distribution at the same moment and does not need to consider temporal features, the classic channel attention mechanism is adopted for feature calibration [24]. As shown in Figure 3, multiple channel variables at the same moment are concatenated by channel to obtain a three-dimensional input X i n p u t R C × H × W , where C refers to the number of channels, and each meteorological element is regarded as a channel. H × W represents the spatial range selected, namely the spatial range of the obtained feature map. Global Average Pooling (GAP) is used to aggregate the spatial feature maps of each channel by averaging the information of all points in space into a single value, generating a contribution descriptor of size C × 1 × 1. This descriptor represents the proportion of information for each channel in the global receptive field. Adopting average pooling can suppress spatial information interference and extract channel correlation to the greatest extent. Then, two fully connected layers are used to activate channel samples for subsequent gradient backtracking and dynamically allocate to obtain weights X att R C × 1 × 1 . The weight values are multiplied by the input, which is the scaling operation in attention allocation, as shown in Equation (7):
X output = X input X att
The output is obtained as X output R C × H × W . At this point, the weight allocation for channel correlation is completed. After completing the weight allocation for each channel data at each moment, they are concatenated along the time dimension to perform time dimension expansion, resulting in a four-dimensional Output R T × C × H × W , where T refers to time. With this, the fusion of multiple data sources is completed, and the output results are fed into the subsequent feature capture module.

3.3. Spatiotemporal Feature Information Flow

Due to the extensive application and excellent performance of convolution in the field of image processing [25,26], many meteorologists have also begun to adopt convolution for predicting meteorological elements in weather forecasting. The advantage of convolution lies in its ability to fuse spatial information in a local receptive field and explicitly model spatial correlations. With its local perception capability, convolution establishes nonlinear relationships for subtle changes in adjacent spaces, focusing on the trend of changes in neighboring areas.
Due to the strong temporal correlation in meteorological element prediction tasks, traditional two-dimensional convolution lacks the capability to extract features from long time sequences. Therefore, there is an urgent need for dimension expansion, making three-dimensional convolution the preferred choice. However, basic experiments have revealed that directly using three-dimensional convolutional networks for prediction yields minimal improvement compared with two-dimensional convolution. This is because three-dimensional convolution kernels cannot simultaneously extract features from both time and space dimensions using a single convolution kernel. Moreover, the parameter volume required for computation increases with dimensionality, resulting in slower execution speeds and making optimization difficult.
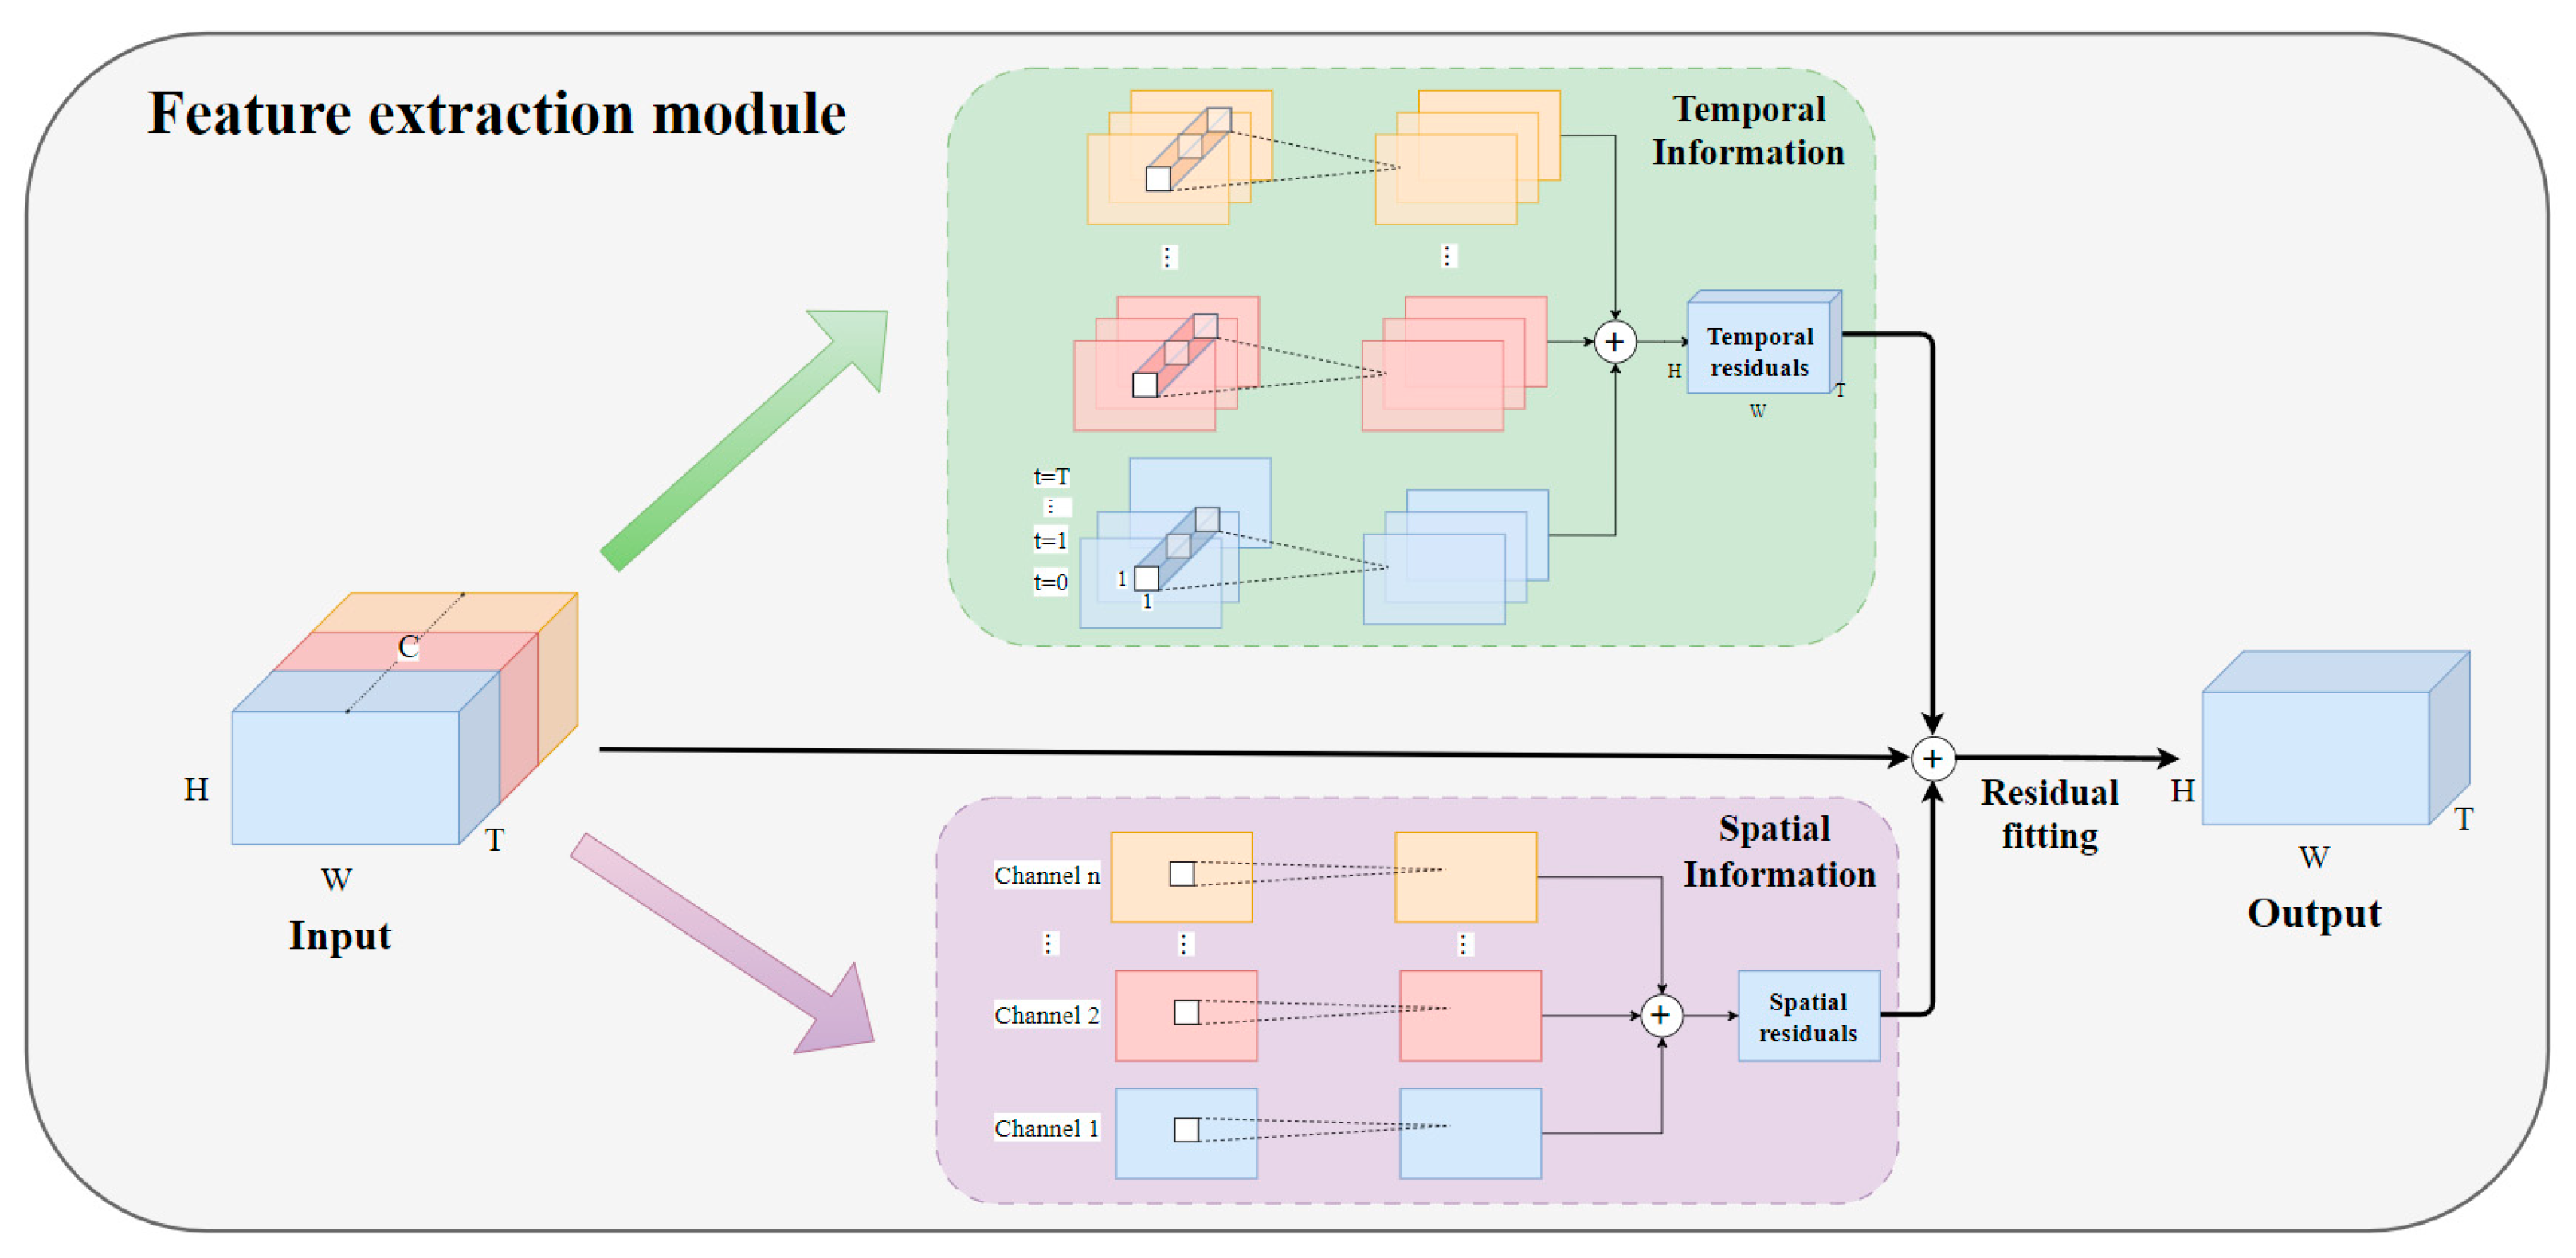
Tran et al. (2018) proposed a solution involving separable three-dimensional convolution [27], decomposing 3D convolution into R(2 + 1)D, which is accomplished by multiple convolutions after separation. They introduced ReLU layers between each convolution block to increase the network’s nonlinearity and performed feature extraction in steps to enhance network complexity. Based on this, the feature extraction module in this paper also decomposes 3D convolution. The original three-dimensional convolution is split into two simultaneous steps: the temporal feature information flow and the spatial feature information flow. After performing the corresponding convolution calculations, feature fusion is carried out, effectively separating the temporal and spatial feature extraction components. The main structure is illustrated in Figure 4.
The focus of temporal information feature extraction lies in capturing information from adjacent time steps. The output obtained from the preceding data fusion module is directly used as the input X I n p u t R T × C × H × W for the temporal information flow, and it undergoes three-dimensional convolution operations, as depicted by the Temporal Information Block in Figure 4. In a complete three-dimensional convolution, the convolution kernel typically has dimensions of t × h × w. Here, spatial dimension information is disregarded, and a t × 1 × 1 temporal convolution kernel is employed, treating the spatial dimension operation at each time step as a 1 × 1 convolution. This approach emphasizes the correlation of each channel across adjacent time steps. The blue, red, and yellow feature maps in Figure 4 represent different meteorological elements. After performing three-dimensional convolution on each meteorological element, the resulting feature maps are summed to obtain the feature map for temporal information.
The spatial information extraction is accomplished using the most commonly used two-dimensional convolutional layers in Computer Vision. This module focuses on extracting spatial information, with each time step value calculated independently. Firstly, the input undergoes dimension permutation, concatenating the inputs according to the number of channels. Unlike temporal information, which performs convolution operations on adjacent time steps each time, spatial information conducts two-dimensional convolution operations only on the values of a single time step at a time. Finally, the feature maps obtained from all channels are summed to obtain the spatial feature map. In order to minimize the loss of spatial features for image prediction, the relationship between padding and kernel size for the convolution operation is designed as p a d d i n g = k e r n e l s i z e 1 2 , ensuring that the output size matches the input image size. Through convolutional operations, spatial information flow is obtained, gradually encoding implicit and abstract spatial features.

3.4. Residual Fitting Connection

Predicting heavy rainfall has always been a major challenge in the field of precipitation forecasting. Precipitation data are inherently discrete, and it is possible for a region to experience no rainfall for consecutive months, resulting in a dataset with a large number of missing values. Moreover, the characteristic of neural network outputs tends to be smooth, which can easily lead the model to ignore extreme values, causing false alarms or misses in predicting heavy rainfall events. The residual fitting module proposed by He et al. effectively addresses this issue [28]. As indicated by the black arrows in Figure 4, both Temporal Information and Spatial Information no longer directly predict the results but instead predict the change values. These change values are then fitted with the input through residual fitting. This approach better preserves useful information learned in the early stages of the network, preventing it from being continuously iterated or canceled out during transmission, thereby minimizing the loss of original information. The decomposed convolution extracts rich temporal and spatial information, fitting with the original input from two dimensions, resulting in a model that captures more comprehensive spatiotemporal features. Consequently, the predicted images produced by this model will be clearer, and the forecasting accuracy for extreme values will also be correspondingly improved.

4. Results

4.1. Results Analysis

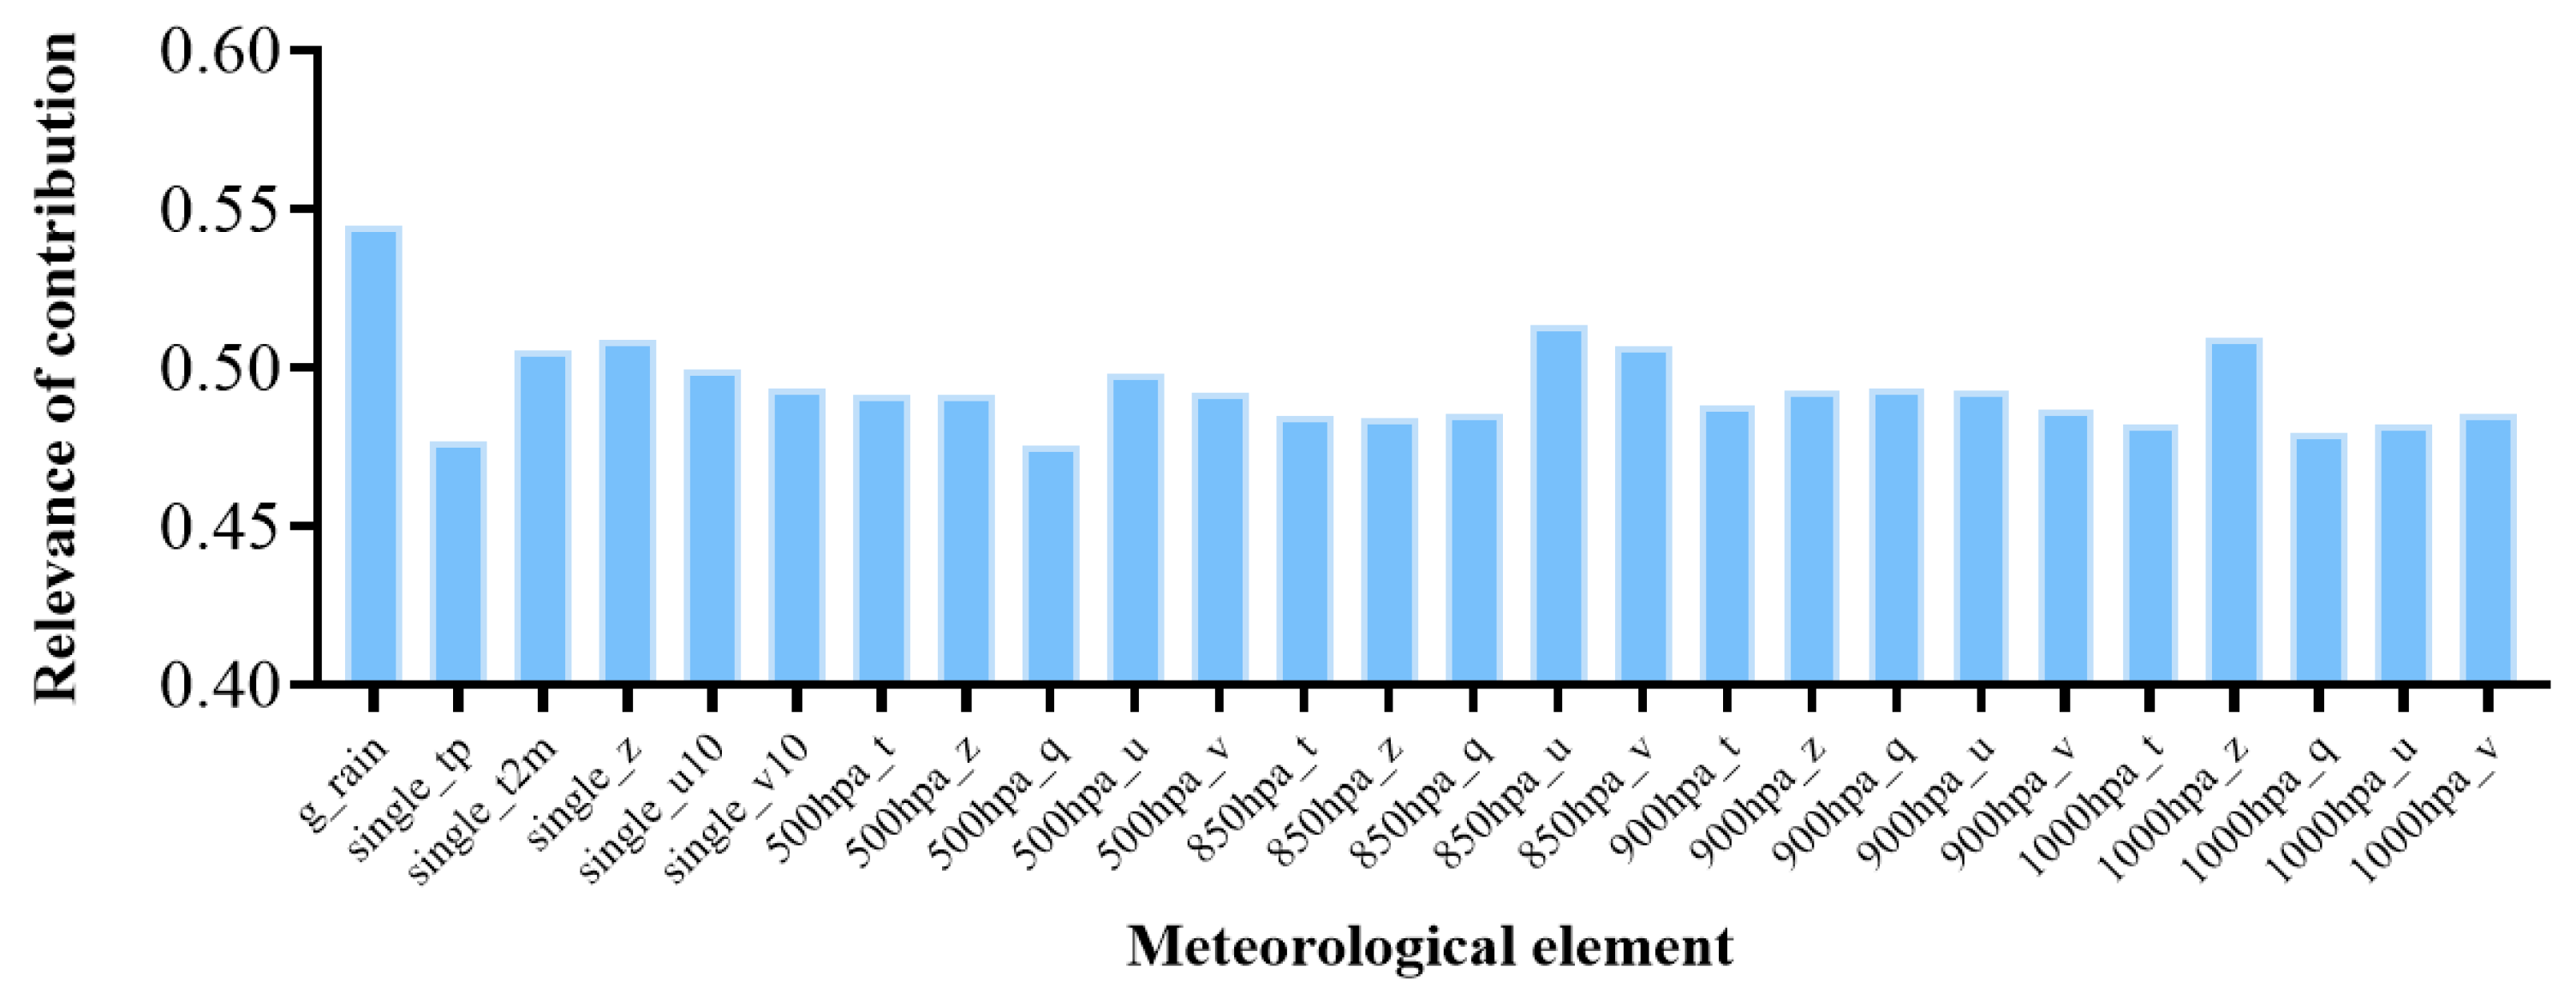
To verify whether the use of multisource data inputs improves the final results, the average contribution value of each channel is visualized. During the testing phase, we first initialized an array to accumulate attention, summing up the corresponding contribution values of each batch operation. After evaluating the entire test dataset, we calculated the absolute average of the results. The outcome, as shown in Figure 5, illustrates that the contribution percentages of all 26 channels to the results are between 0.45 and 0.55. This validates our experimental hypothesis that there is a strong correlation between air pressure, temperature, humidity, wind speed, and precipitation. Utilizing multisource data exhibits significant advantages over single-observation predictions.
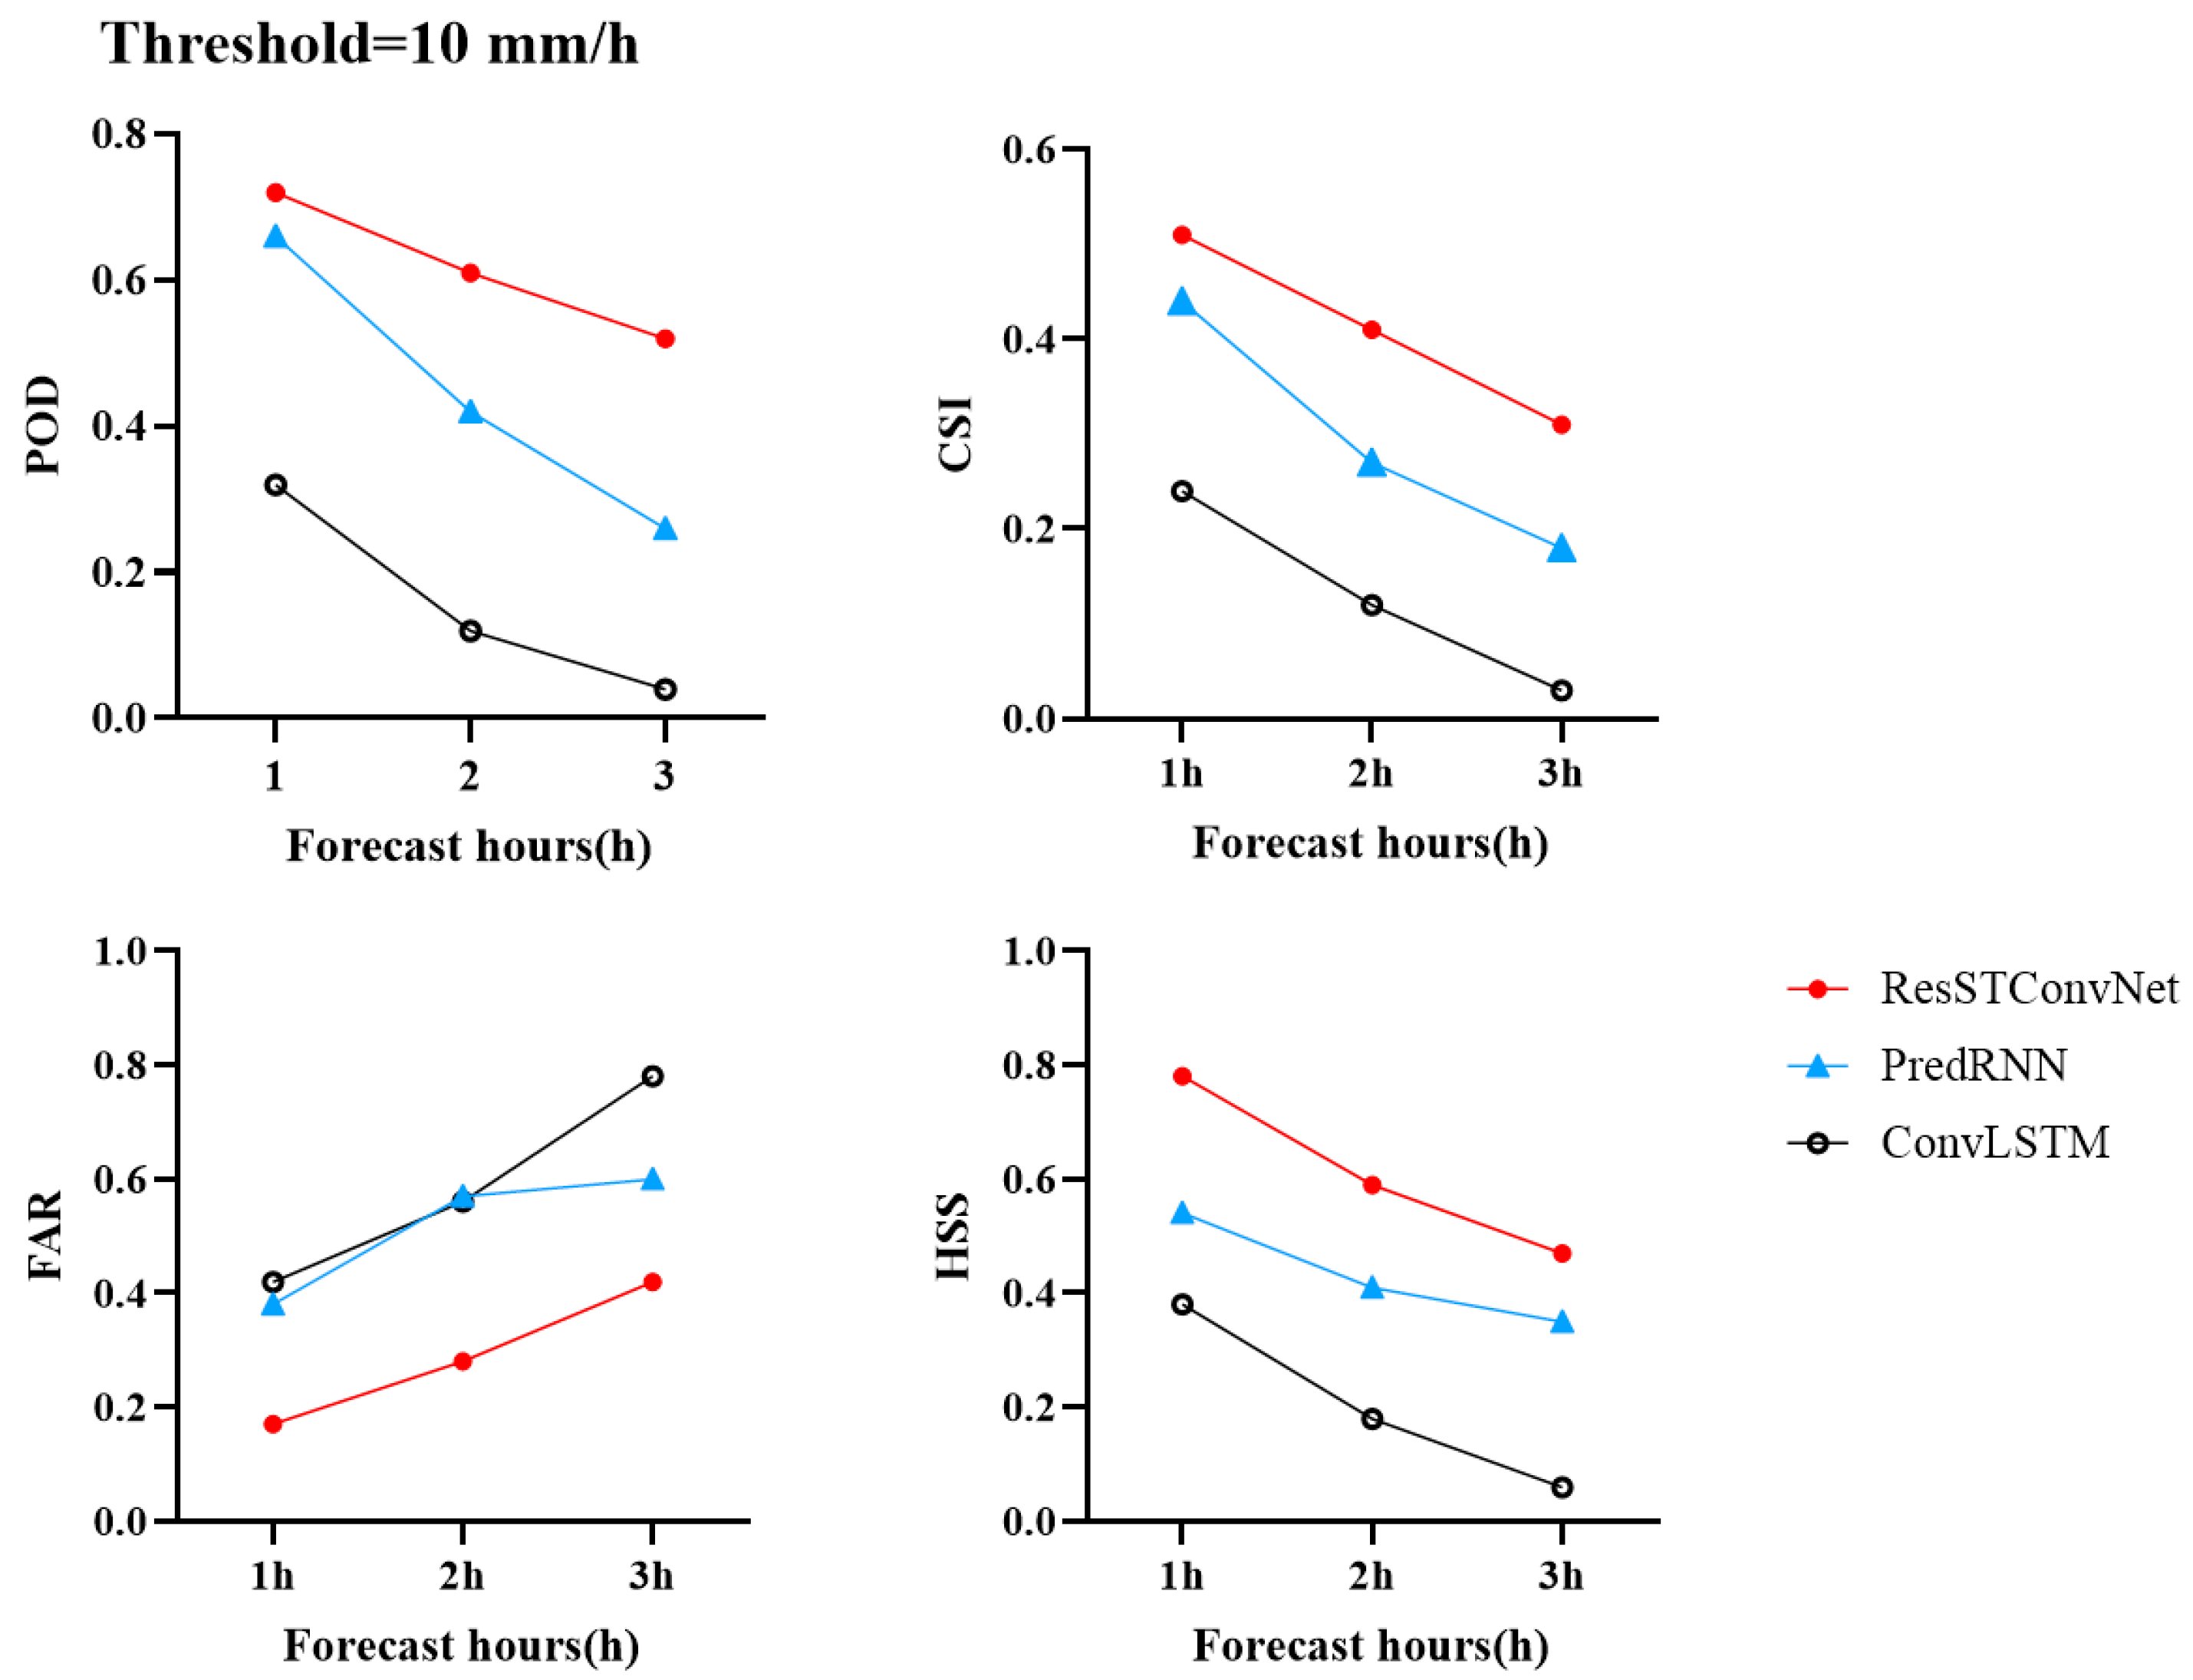
In this section, both qualitative and quantitative evaluations are conducted on the proposed ResSTConvNet and several baseline models mentioned earlier. The threat score (TS) primarily assesses the accuracy of precipitation areas. Following the precipitation classification standards set by the Chinese national standard, thresholds of 0.1 and 10 were set in this experiment to assess the accuracy of the model in predicting the presence of rain and the presence of heavy rain, respectively. Since the TS assigns a value of 1 to grid points that exceed the threshold and a value of 0 to those below the threshold, which weakens the accuracy aspect of intensity, additional metrics such as MAE and RMSE were introduced to evaluate precipitation intensity. Table 3 presents the evaluation of TS at a threshold of 0.1, as well as the memory usage and runtime of each model. Figure 6 is targeted for a comparison plot of TS at a threshold of 10, and Table 4 demonstrates the intensity analysis evaluation.
From the tables, it is evident that in the TS evaluation, our proposed ResSTConvNet shows significant advantages in CSI, FAR, and HSS, while PredRNN exhibits the best predictive performance in POD from 1 to 3 h. ConvLSTM, U-net, and ResNet, as baseline models, all have certain shortcomings in approaching precipitation forecasting. As shown in Table 3, ConvLSTM performs similarly to PredRNN and ResSTConvNet in the first two hours of prediction, but its scores drastically decrease when the forecast lead time reaches the third hour, with CSI dropping from 0.55 to 0.25. On the other hand, PredRNN, with improved information transmission, shows a noticeable improvement in performance at the third hour, although its stability is questionable. Despite having the best POD, it also exhibits a very high FAR, indicating that the system is overly sensitive, resulting in frequent false alarms. The U-net model, as a benchmark in the field of image segmentation, lacks regression prediction capabilities due to its kernel being designed for classification. Hence, its scores fail to meet our requirements, especially with prolonged forecast lead times, as it lacks the ability to extract temporal information. Therefore, if U-net were to be used as a benchmark for precipitation forecasting models, the issue of losing raw feature information during sampling needs to be addressed. ResNet, in this experiment, was included to observe whether the residual network could improve the prediction ability of extreme precipitation events. A basic three-layer residual network was employed. It performs comparably to, or even better than, multilayer U-net networks in the first two hours of prediction. Further intensity evaluations will be observed in subsequent evaluations. Benefitting from its pure convolutional structure, ResSTConvNet’s memory usage is only half of ConvLSTM and PredRNN based on the LSTM architecture, albeit slightly higher than the U-net model. It significantly reduces the amount of required runtime memory, enabling training on larger datasets. In terms of runtime, ResSTConvNet is higher than all other baseline models because of the synchronous operation of 2D and 3D convolutions and the feature concatenation module at the end.
Due to the poor performance of U-net and ResNet with a threshold of 10, showing almost no ability to predict heavy rain, the evaluation at a threshold of 10 only includes the remaining three models with better performance, as shown in Figure 6. From Figure 6, it can be observed that as the forecast time increases, the POD, CSI, and HSS of all three models gradually decrease, with ResSTConvNet consistently outperforming PredRNN and ConvLSTM in these three metrics. The FAR also increases with forecast time, with ResSTConvNet and PredRNN showing very similar forecast results in the first two hours but ResSTConvNet surpassing PredRNN in the third hour. The trends in the four metrics changing over time align with previous experimental analysis results. It can be observed that when the threshold is set to 10, the superiority of our proposed ResSTConvNet model is fully demonstrated. It outperforms both PredRNN and ConvLSTM models across all four evaluation metrics. PredRNN’s prediction for the first hour is somewhat comparable to the ResSTConvNet, but the gap widens gradually in the subsequent two hours, displaying its instability. Although ConvLSTM demonstrates good prediction ability for precipitation occurrence, its capability to predict heavy rain significantly decreases, which is closely related to the architecture of the network.
In addition to determining the presence or absence of precipitation, assessing precipitation intensity is also crucial in precipitation forecasting. Therefore, we adopted two performance evaluation metrics: MAE and RMSE. From Table 4, it can be observed that except for PredRNN, which has a slightly smaller MAE than ResSTConvNet at 1 h, ResSTConvNet outperforms other baseline models in all other timeframes. Consistent with qualitative assessments, the advantage of ResSTConvNet becomes more pronounced as the forecast lead time increases. In the 1 h prediction, ConvLSTM, which performs well in TS scores, shows relatively high values in both continuity scores. Meanwhile, U-net and ResNet have MAE and RMSE values smaller than ConvLSTM, slightly inferior to ResSTConvNet. This suggests that these models excel in capturing spatial features but start to weaken compared with ConvLSTM at 2 and 3 h, indicating the strong temporal correlation in meteorological element predictions. Pure convolutional models lack the fitting of temporal information.
As seen from the individual case analysis in Section 4.2, even though precipitation is predicted for the same area, failure to capture spatial features adequately may result in a forecast of heavy rain being downgraded to light rain. This can significantly impact practical warnings, highlighting the importance of accurately forecasting rainfall intensity. For training neural networks in deep learning, the main loss function used in regression tasks is MSE (L2), due to its differentiability and dynamic gradient values, allowing for rapid convergence. However, MSE amplifies the loss of outliers, leading the model to focus on reducing errors at the expense of other samples, which tends to push the results toward a smooth average under continuous updates. Therefore, the prediction results for extreme values may not be satisfactory. Additionally, since precipitation data are irregular and can include datasets with consecutive days of no rainfall, training on a single precipitation dataset may inevitably lead to averaging, thereby weakening the model’s ability to predict heavy rainfall events. From this perspective, ResSTConvNet, by incorporating multisource data, avoids the interference of continuous empty datasets on the overall model. Furthermore, it utilizes three-dimensional convolution and residual networks to compensate for the loss of temporal features in the information transmission process. Hence, it exhibits significant improvements in forecasting heavy rainfall.

4.2. Evaluation on a Heavy Rainfall Case

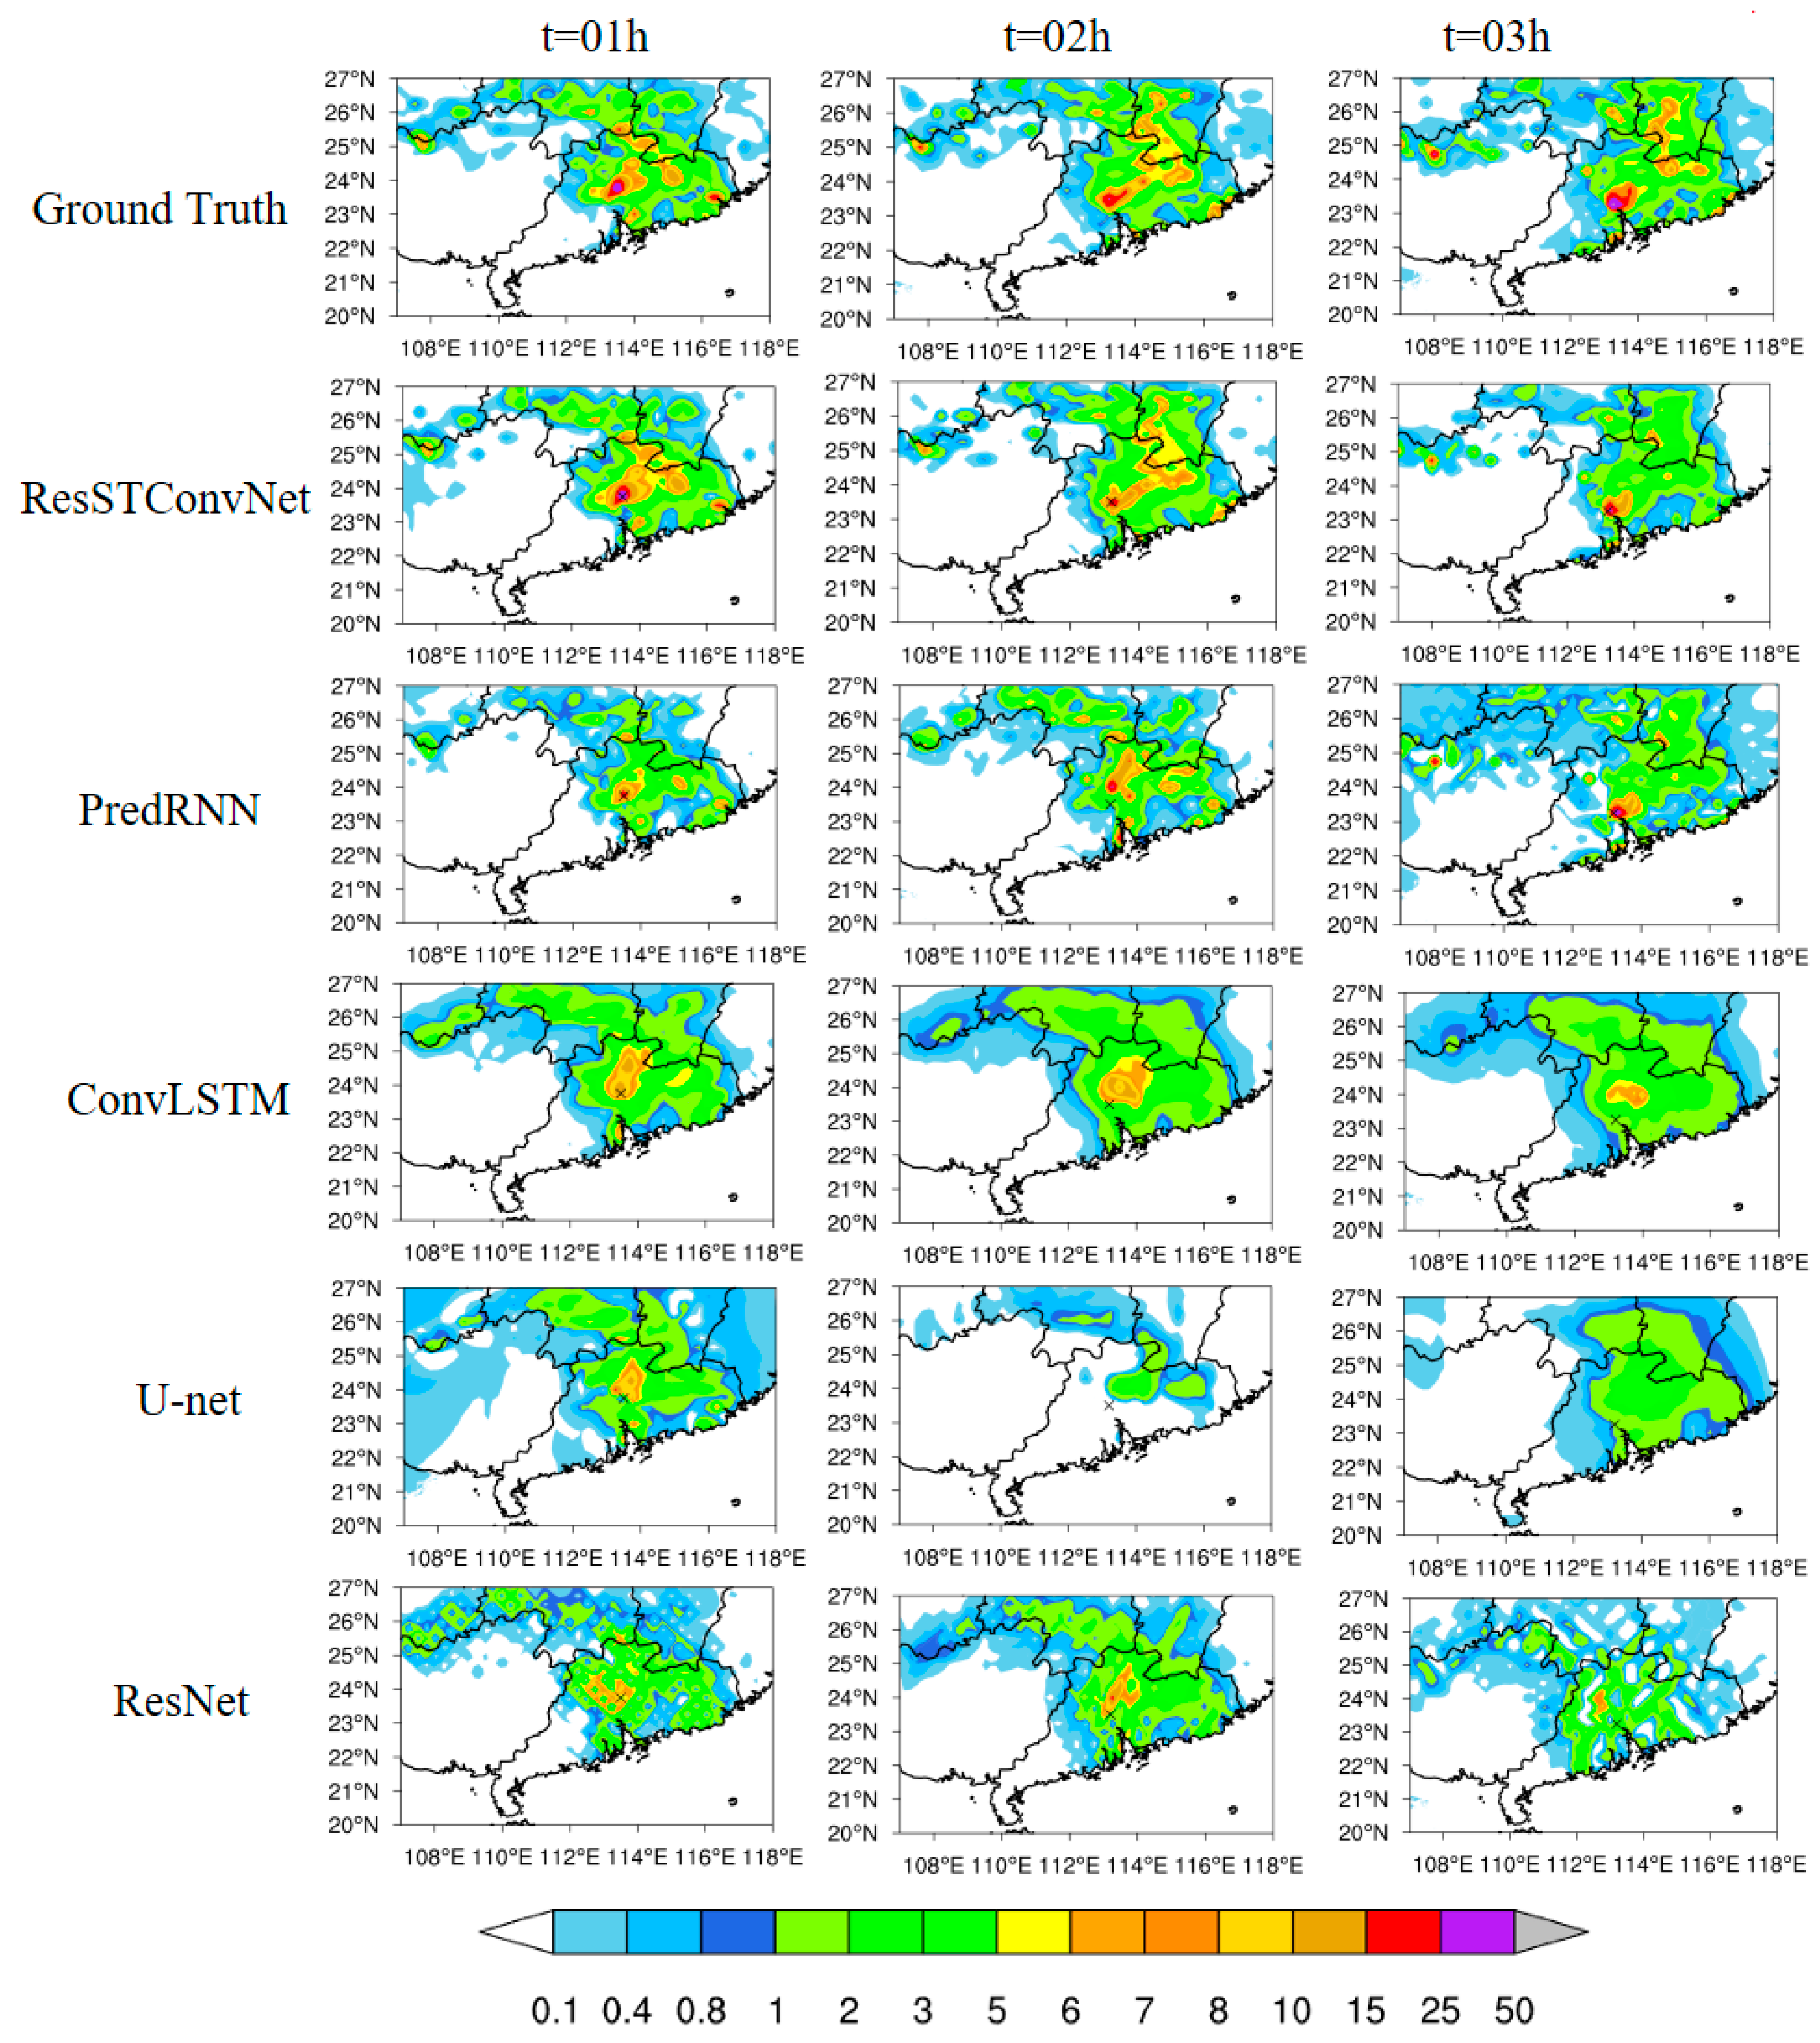
To provide a clear visual comparison of the forecasted results, we selected a typical short-duration heavy precipitation process for analysis. On 20 May 2020, a severe rainstorm entered Guangdong Province from the northwest and peaked at 17:00. Maximum precipitation intensity in the regional center can reach 52.6 mm per hour. Using data from the preceding twelve hours as input, we forecasted the actual precipitation at 15:00, 16:00, and 17:00. The forecasted plots from each baseline model are presented in Figure 7.
From Figure 7, it can be observed that the PredRNN model benefits from its long-range information flow and deep information feature transmission, resulting in strong predictive capabilities for precipitation centers and intensities. The predictions for the rainfall center in the first and third hours are very accurate. However, the prediction for the second hour tends to be slightly northward, as shown in the parameter evaluation results in Section 4.1; it is overly sensitive and may lead to a high false alarm rate. The predictive stability of the PredRNN model is unsatisfactory, aligning with findings from previous experiments. On the other hand, ConvLSTM exhibits a more pronounced tendency towards smoothing, resulting in blurry prediction results that show trends in precipitation centers and intensities but lose too many spatial details. The prediction of the rainfall center is accurate in the first hour, but in the subsequent two hours, it gradually falls behind the movement of the rainfall center area, resulting in significant errors. Fine-grained precipitation forecasting is crucial for effective prevention and control of precipitation in small areas; in previous studies, researchers using ConvLSTM for predictions inevitably encountered increasing blurriness in the predictions as the lead time extended. This has also led researchers to focus on improving the extraction of temporal correlations and reducing feature transmission losses. The predictive performance of the U-net network declines most rapidly with increasing lead time. Past studies have shown that at a lead time of 1 h, U-net can only predict the rough central outline of precipitation. As shown in Figure 7 of this experiment, at lead times of 2 and 3 h, it cannot predict precipitation results accurately, as its prediction head was originally designed for classification tasks. Therefore, applying it to regression tasks requires upsampling to restore the original image size, leading to the inevitable loss of spatial features. Additionally, the U-net network is predominantly a pure convolutional structure and cannot capture temporal features, making it unsuitable for precipitation forecasting tasks. While the ResNet’s smoothing effect on images is not optimal, it demonstrates good performance in predicting precipitation areas and intensities over three hours. Its representation of the movement trend of the rainfall center is very clear. Although there is some error, it is evident that the residual layer plays a positive role in accurate prediction. In fact, its predictions for precipitation intensity centers and areas in the next two to three hours may even surpass ConvLSTM and PredRNN. This is because ResNet purely treats predictions as corresponding to single images, predicting residuals based on grid points and then fitting them. Consequently, the results show very clear differences between grid points. This underscores the significant contribution of residual fitting to predicting extreme values in networks. It can be observed that the proposed ResSTConvNet in this paper exhibits more spatial details in precipitation forecasting. This is mainly reflected in the prediction of precipitation centers and intensities. With the combination of 2D and 3D convolutions, even as the lead time extends to 3 h, it is still possible to capture some spatial feature details. Due to its prediction of residual values, the ResSTConvNet network is the only model capable of forecasting the center of heavy rainfall exceeding 25 mm and hitting the center of heavy rainfall precisely for the next three hours; this highlights the stability and accuracy of the model. However, by the third hour, the accuracy of the prediction of strong precipitation centers begins to decline, indicating some loss of spatial details. It is evident that even with the fitting of the residual network, the characteristic of the entire prediction results tending toward an average with the extension of the forecast time has not fundamentally improved, which is a problem that needs to be addressed in our future research.

5. Conclusions

In this paper, we proposed the ResSTConvNet model for short-term (0–3 h) precipitation forecasting, which can integrate ground observation data and high-altitude reanalysis data by allocating channel weights. In the feature extraction module, we designed a pure convolutional structure instead of the traditional LSTM structure, saving memory space while improving operational speed. Additionally, we employed a residual fitting module for final feature fitting, enabling the model to better capture long-term memory information and spatial features, particularly in extreme value extraction. Experimental results on the test set demonstrate that ResSTConvNet achieves better performance than the baseline model across key indicators.
However, this network still has certain limitations and challenges. Although pure convolutional networks offer improvements in space utilization and running speed compared with networks based on LSTM, the use of three-dimensional convolutions for temporal information flow still increases data volume dimensionally. Therefore, the training requirements for this network remain relatively high. Furthermore, although the issue of excessive smoothing during convolution operations is mitigated through residual connections, the fundamental problem of the forecast results tending toward an average is not resolved. As the forecast lead time reaches three hours, a significant loss of spatial features still occurs. In the field of precipitation forecasting, the accuracy of forecasting extreme precipitation is crucial, as it has the greatest impact on people’s daily lives and work. Hence, addressing and overcoming this challenge will be a key focus of future work. Additionally, further experiments can be conducted to explore the selection of upper-level meteorological variables. More levels and additional meteorological variables can be added to the model for screening and experimentation to further improve the accuracy of the model’s predictive capabilities.
Author Contributions

Conceptualization, T.Z. and D.W.; methodology, T.Z.; software, T.Z. and L.H.; validation, T.Z., L.H. and Y.C.; formal analysis, T.Z.; investigation, D.W.; resources, D.W.; data curation, T.Z.; writing—original draft preparation, T.Z.; writing—review and editing, L.H., Y.C. and E.L.; visualization, T.Z.; supervision, D.W.; project administration, D.W.; funding acquisition, D.W. All authors have read and agreed to the published version of the manuscript.

Funding

This research was funded by the Guangdong Major Project of Basic and Applied Basic Research (2020B0301030004), and the National Key R&D Program of China (2019YFC1510400).

Institutional Review Board Statement

Not applicable.

Informed Consent Statement

Not applicable.

Data Availability Statement

The data presented in this study are available on request from the corresponding author. The data are not publicly available due to privacy.

Acknowledgments

We thank the authors, reviewers, and editors who made amendments to the article.

Conflicts of Interest

The authors declare no conflicts of interest.

References

  1. Singh, S.; Sarkar, S.; Mitra, P. A Deep Learning Based Approach with Adversarial Regularization for Doppler Weather Radar ECHO Prediction. In Proceedings of the 2017 IEEE International Geoscience and Remote Sensing Symposium (IGARSS), Fort Worth, TX, USA, 23–28 July 2017; pp. 5205–5208. [Google Scholar]
  2. He, W.; Xiong, T.; Wang, H.; He, J.; Ren, X.; Yan, Y.; Tan, L. Radar Echo Spatiotemporal Sequence Prediction Using an Improved ConvGRU Deep Learning Model. Atmosphere 2022, 13, 88. [Google Scholar] [CrossRef]
  3. Ayzel, G.; Heistermann, M.; Winterrath, T. Optical Flow Models as an Open Benchmark for Radar-Based Precipitation Nowcasting (Rainymotion v0.1). Geosci. Model Dev. 2019, 12, 1387–1402. [Google Scholar] [CrossRef]
  4. Johnson, J.T.; MacKeen, P.L.; Witt, A.; Mitchell, E.D.W.; Stumpf, G.J.; Eilts, M.D.; Thomas, K.W. The Storm Cell Identification and Tracking Algorithm: An Enhanced WSR-88D Algorithm. Weather Forecast. 1998, 13, 263–276. [Google Scholar] [CrossRef]
  5. Rinehart, R.E.; Garvey, E.T. Three-Dimensional Storm Motion Detection by Conventional Weather Radar. Nature 1978, 273, 287–289. [Google Scholar] [CrossRef]
  6. Atencia, A.; Rigo, T.; Sairouni, A.; Moré, J.; Bech, J.; Vilaclara, E.; Cunillera, J.; Llasat, M.C.; Garrote, L. Improving QPF by Blending Techniques at the Meteorological Service of Catalonia. Nat. Hazards Earth Syst. Sci. 2010, 10, 1443–1455. [Google Scholar] [CrossRef]
  7. Bowler, N.E.; Pierce, C.E.; Seed, A.W. STEPS: A Probabilistic Precipitation Forecasting Scheme Which Merges an Extrapolation Nowcast with Downscaled NWP. Q. J. R. Meteorol. Soc. 2006, 132, 2127–2155. [Google Scholar] [CrossRef]
  8. Sun, J.; Xue, M.; Wilson, J.W.; Zawadzki, I.; Ballard, S.P.; Onvlee-Hooimeyer, J.; Joe, P.; Barker, D.M.; Li, P.-W.; Golding, B.; et al. Use of NWP for Nowcasting Convective Precipitation: Recent Progress and Challenges. Bull. Am. Meteorol. Soc. 2014, 95, 409–426. [Google Scholar] [CrossRef]
  9. LeCun, Y.; Bengio, Y.; Hinton, G. Deep Learning. Nature 2015, 521, 436–444. [Google Scholar] [CrossRef] [PubMed]
  10. Simonyan, K.; Zisserman, A. Very Deep Convolutional Networks for Large-Scale Image Recognition. arXiv 2015. [Google Scholar] [CrossRef]
  11. Geng, L.; Geng, H.; Min, J.; Zhuang, X.; Zheng, Y. AF-SRNet: Quantitative Precipitation Forecasting Model Based on Attention Fusion Mechanism and Residual Spatiotemporal Feature Extraction. Remote Sens. 2022, 14, 5106. [Google Scholar] [CrossRef]
  12. Ravuri, S.; Lenc, K.; Willson, M.; Kangin, D.; Lam, R.; Mirowski, P.; Fitzsimons, M.; Athanassiadou, M.; Kashem, S.; Madge, S.; et al. Skilful Precipitation Nowcasting Using Deep Generative Models of Radar. Nature 2021, 597, 672–677. [Google Scholar] [CrossRef] [PubMed]
  13. Lin, T.; Li, Q.; Geng, Y.-A.; Jiang, L.; Xu, L.; Zheng, D.; Yao, W.; Lyu, W.; Zhang, Y. Attention-Based Dual-Source Spatiotemporal Neural Network for Lightning Forecast. IEEE Access 2019, 7, 158296–158307. [Google Scholar] [CrossRef]
  14. Shi, X.; Chen, Z.; Wang, H.; Yeung, D.-Y.; Wong, W.; Woo, W. ConvLSTM; Convolutional LSTM Network: A Machine Learning Approach for Precipitation Nowcasting. In Advances in Neural Information Processing Systems; Curran Associates, Inc.: New York, NY, USA, 2015; Volume 28. [Google Scholar]
  15. Shi, X.; Gao, Z.; Lausen, L.; Wang, H.; Yeung, D.-Y.; Wong, W.; Woo, W. Deep Learning for Precipitation Nowcasting: A Benchmark and A New Model. In Advances in Neural Information Processing Systems; Curran Associates, Inc.: New York, NY, USA, 2017; Volume 30. [Google Scholar]
  16. Wang, Y.; Long, M.; Wang, J.; Gao, Z.; Yu, P.S. PredRNN: Recurrent Neural Networks for Predictive Learning Using Spatiotemporal LSTMs. In Advances in Neural Information Processing Systems; Curran Associates, Inc.: New York, NY, USA, 2017; Volume 30. [Google Scholar]
  17. Wang, Y.; Gao, Z.; Long, M.; Wang, J.; Yu, P.S. PredRNN++: Towards A Resolution of the Deep-in-Time Dilemma in Spatiotemporal Predictive Learning. In Proceedings of the Proceedings of the 35th International Conference on Machine Learning, Stockholm, Sweden, 10–15 July 2018; PMLR: London, UK, 2018; pp. 5123–5132. [Google Scholar]
  18. Wang, Y.; Zhang, J.; Zhu, H.; Long, M.; Wang, J.; Yu, P.S. Memory in Memory: A Predictive Neural Network for Learning Higher-Order Non-Stationarity from Spatiotemporal Dynamics. In Proceedings of the 2019 IEEE/CVF Conference on Computer Vision and Pattern Recognition (CVPR), Long Beach, CA, USA, 15–20 June 2019; IEEE: Long Beach, CA, USA, 2019; pp. 9146–9154. [Google Scholar]
  19. Wu, H.; Yao, Z.; Wang, J.; Long, M. MotionRNN: A Flexible Model for Video Prediction with Spacetime-Varying Motions. In Proceedings of the 2021 IEEE/CVF Conference on Computer Vision and Pattern Recognition (CVPR), Nashville, TN, USA, 20–25 June 2021; IEEE: Nashville, TN, USA, 2021; pp. 15430–15439. [Google Scholar]
  20. Ronneberger, O.; Fischer, P.; Brox, T. U-Net: Convolutional Networks for Biomedical Image Segmentation. In Medical Image Computing and Computer-Assisted Intervention—MICCAI 2015; Navab, N., Hornegger, J., Wells, W.M., Frangi, A.F., Eds.; Springer International Publishing: Cham, Switzerland, 2015; pp. 234–241. [Google Scholar]
  21. Agrawal, S.; Barrington, L.; Bromberg, C.; Burge, J.; Gazen, C.; Hickey, J. Machine Learning for Precipitation Nowcasting from Radar Images. arXiv 2019. [Google Scholar] [CrossRef]
  22. Ayzel, G.; Scheffer, T.; Heistermann, M. RainNet v1.0: A Convolutional Neural Network for Radar-Based Precipitation Nowcasting. 2020. Available online: https://gmd.copernicus.org/articles/13/2631/2020/gmd-13-2631-2020-discussion.html (accessed on 22 May 2024).
  23. Shen, X.; Meng, K.; Zhang, L.; Zuo, X. A Method of Radar Echo Extrapolation Based on Dilated Convolution and Attention Convolution. Sci. Rep. 2022, 12, 10572. [Google Scholar] [CrossRef] [PubMed]
  24. Hu, J.; Shen, L.; Sun, G. Squeeze-and-Excitation Networks. 2018, pp. 7132–7141. Available online: https://openaccess.thecvf.com/content_cvpr_2018/html/Hu_Squeeze-and-Excitation_Networks_CVPR_2018_paper.html (accessed on 22 May 2024).
  25. Krizhevsky, A.; Sutskever, I.; Hinton, G.E. ImageNet Classification with Deep Convolutional Neural Networks. Commun. ACM 2017, 60, 84–90. [Google Scholar] [CrossRef]
  26. Long, J.; Shelhamer, E.; Darrell, T. Fully Convolutional Networks for Semantic Segmentation. Available online: https://openaccess.thecvf.com/content_cvpr_2015/html/Long_Fully_Convolutional_Networks_2015_CVPR_paper.html (accessed on 22 May 2024).
  27. Tran, D.; Wang, H.; Torresani, L.; Ray, J.; LeCun, Y.; Paluri, M. A Closer Look at Spatiotemporal Convolutions for Action Recognition. In Proceedings of the 2018 IEEE/CVF Conference on Computer Vision and Pattern Recognition, Salt Lake City, UT, USA, 18–23 June 2018; IEEE: Salt Lake City, UT, USA, 2018; pp. 6450–6459. [Google Scholar]
  28. He, K.; Zhang, X.; Ren, S.; Sun, J. Deep Residual Learning for Image Recognition. 2016, pp. 770–778. Available online: https://openaccess.thecvf.com/content_cvpr_2016/html/He_Deep_Residual_Learning_CVPR_2016_paper.html (accessed on 22 May 2024).
Figure 1. Distribution of Chinese national weather stations and regional automated weather stations in the study area. The coloring represents altitude levels.
Atmosphere 15 00628 g001
Figure 2. The overall architecture of the network. The arrow pointing represents the direction of the information flow, and the final feature extraction module is the result of the fusion of the three information flows; such a structure captures richer spatiotemporal features.
Atmosphere 15 00628 g002
Figure 3. The module for integrating multiple data sources. Fgap refers to the pooling operation conducted globally across the spatial dimensions. Ffc indicates the process of passing the pooled features through fully connected layers. Fscale involves assigning weights to the features based on their importance. After completing weight allocation, the data undergo time dimension expansion before being forwarded to the feature extraction module.
Atmosphere 15 00628 g003
Figure 4. The operational flow of the feature extraction module. The temporal flow and spatial flow separately fit the temporal and spatial variation values. Finally, the results of these flows are added to the original input to obtain the transformed output.
Atmosphere 15 00628 g004
Figure 5. Attention contribution relevance by 26 channels.
Atmosphere 15 00628 g005
Figure 6. Four categorical metrics for the three models at a threshold of 10.
Atmosphere 15 00628 g006
Figure 7. An individual example of heavy precipitation on 20 May 2020. Precipitation forecast maps for the next three hours for each baseline model. ‘×’ represents the center location of heavy rainfall at the same time as the ground truth.
Atmosphere 15 00628 g007
Table 1. Outline of the distribution of the dataset.
DatasetPeriod
Training set2011–2018
Validation set2019
Test set2020
Table 2. Basic Information of meteorological elements.
Meteorological ElementsLevelsSource
Precipitation_1 hSurfaceNational and automatic weather stations
Total precipitationSurfaceERA5
2 m temperatureSurfaceERA5
GeopotentialSurfaceERA5
10 m U component of windSurfaceERA5
10 m V component of windSurfaceERA5
Temperature500/850/900/1000 hPaERA5
Geopotential500/850/900/1000 hPaERA5
Specific humidity500/850/900/1000 hPaERA5
U component of wind500/850/900/1000 hPaERA5
V component of wind500/850/900/1000 hPaERA5
Table 3. The results of the TS evaluations of different models on the test set at a threshold of 0.1, where higher scores for POD, CSI, and HSS prove that the models have better predictive performance, and lower scores for FAR prove that they have better predictive performance, with the scores that have the best results in each evaluation shown in bold. To compare the computational effort of different models, we also showcase the memory usage and runtime for each epoch during training.
ModelPODCSIFARHSSMemory UsageRun Time
1 h2 h3 h1 h2 h3 h1 h2 h3 h1 h2 h3 h
ResSTConvNet0.860.750.660.650.600.490.040.110.290.800.740.561344.57 MB229.07 s
ConvLSTM0.880.800.320.670.550.250.250.360.460.750.630.352240.28 MB193.96 s
U-net0.740.500.300.600.360.220.340.540.580.650.260.21908.08 MB126.93 s
ResNet0.820.490.180.620.420.160.260.360.640.710.270.26144.03 MB37.62 s
PredRNN0.900.820.690.630.560.430.290.310.490.720.650.492855.48 MB212.55 s
Table 4. Model accuracy error assessment table. When the values of MAE and RMSE approach zero, it indicates that the predicted values are closer to the true values. The optimal results are represented in bold.
ModelMAERMSE
1 h2 h3 h1 h2 h3 h
ResSTConvNet0.0860.1010.1200.2900.3180.476
ConvLSTM0.1350.1380.1620.7820.8290.970
U-net0.1200.3820.4580.7360.9561.187
ResNet0.1110.2200.2980.6880.9031.123
PredRNN0.0830.1040.1670.4640.5250.671
Disclaimer/Publisher’s Note: The statements, opinions and data contained in all publications are solely those of the individual author(s) and contributor(s) and not of MDPI and/or the editor(s). MDPI and/or the editor(s) disclaim responsibility for any injury to people or property resulting from any ideas, methods, instructions or products referred to in the content.