1. Introduction
The increasing frequency and intensity of heavy precipitation events worldwide have attracted considerable interest and raised widespread concerns [
1]. Characterized by massive precipitation amounts over short durations, these events can trigger hazards for human societies, including flooding [
2], landslides [
3], and water pollution [
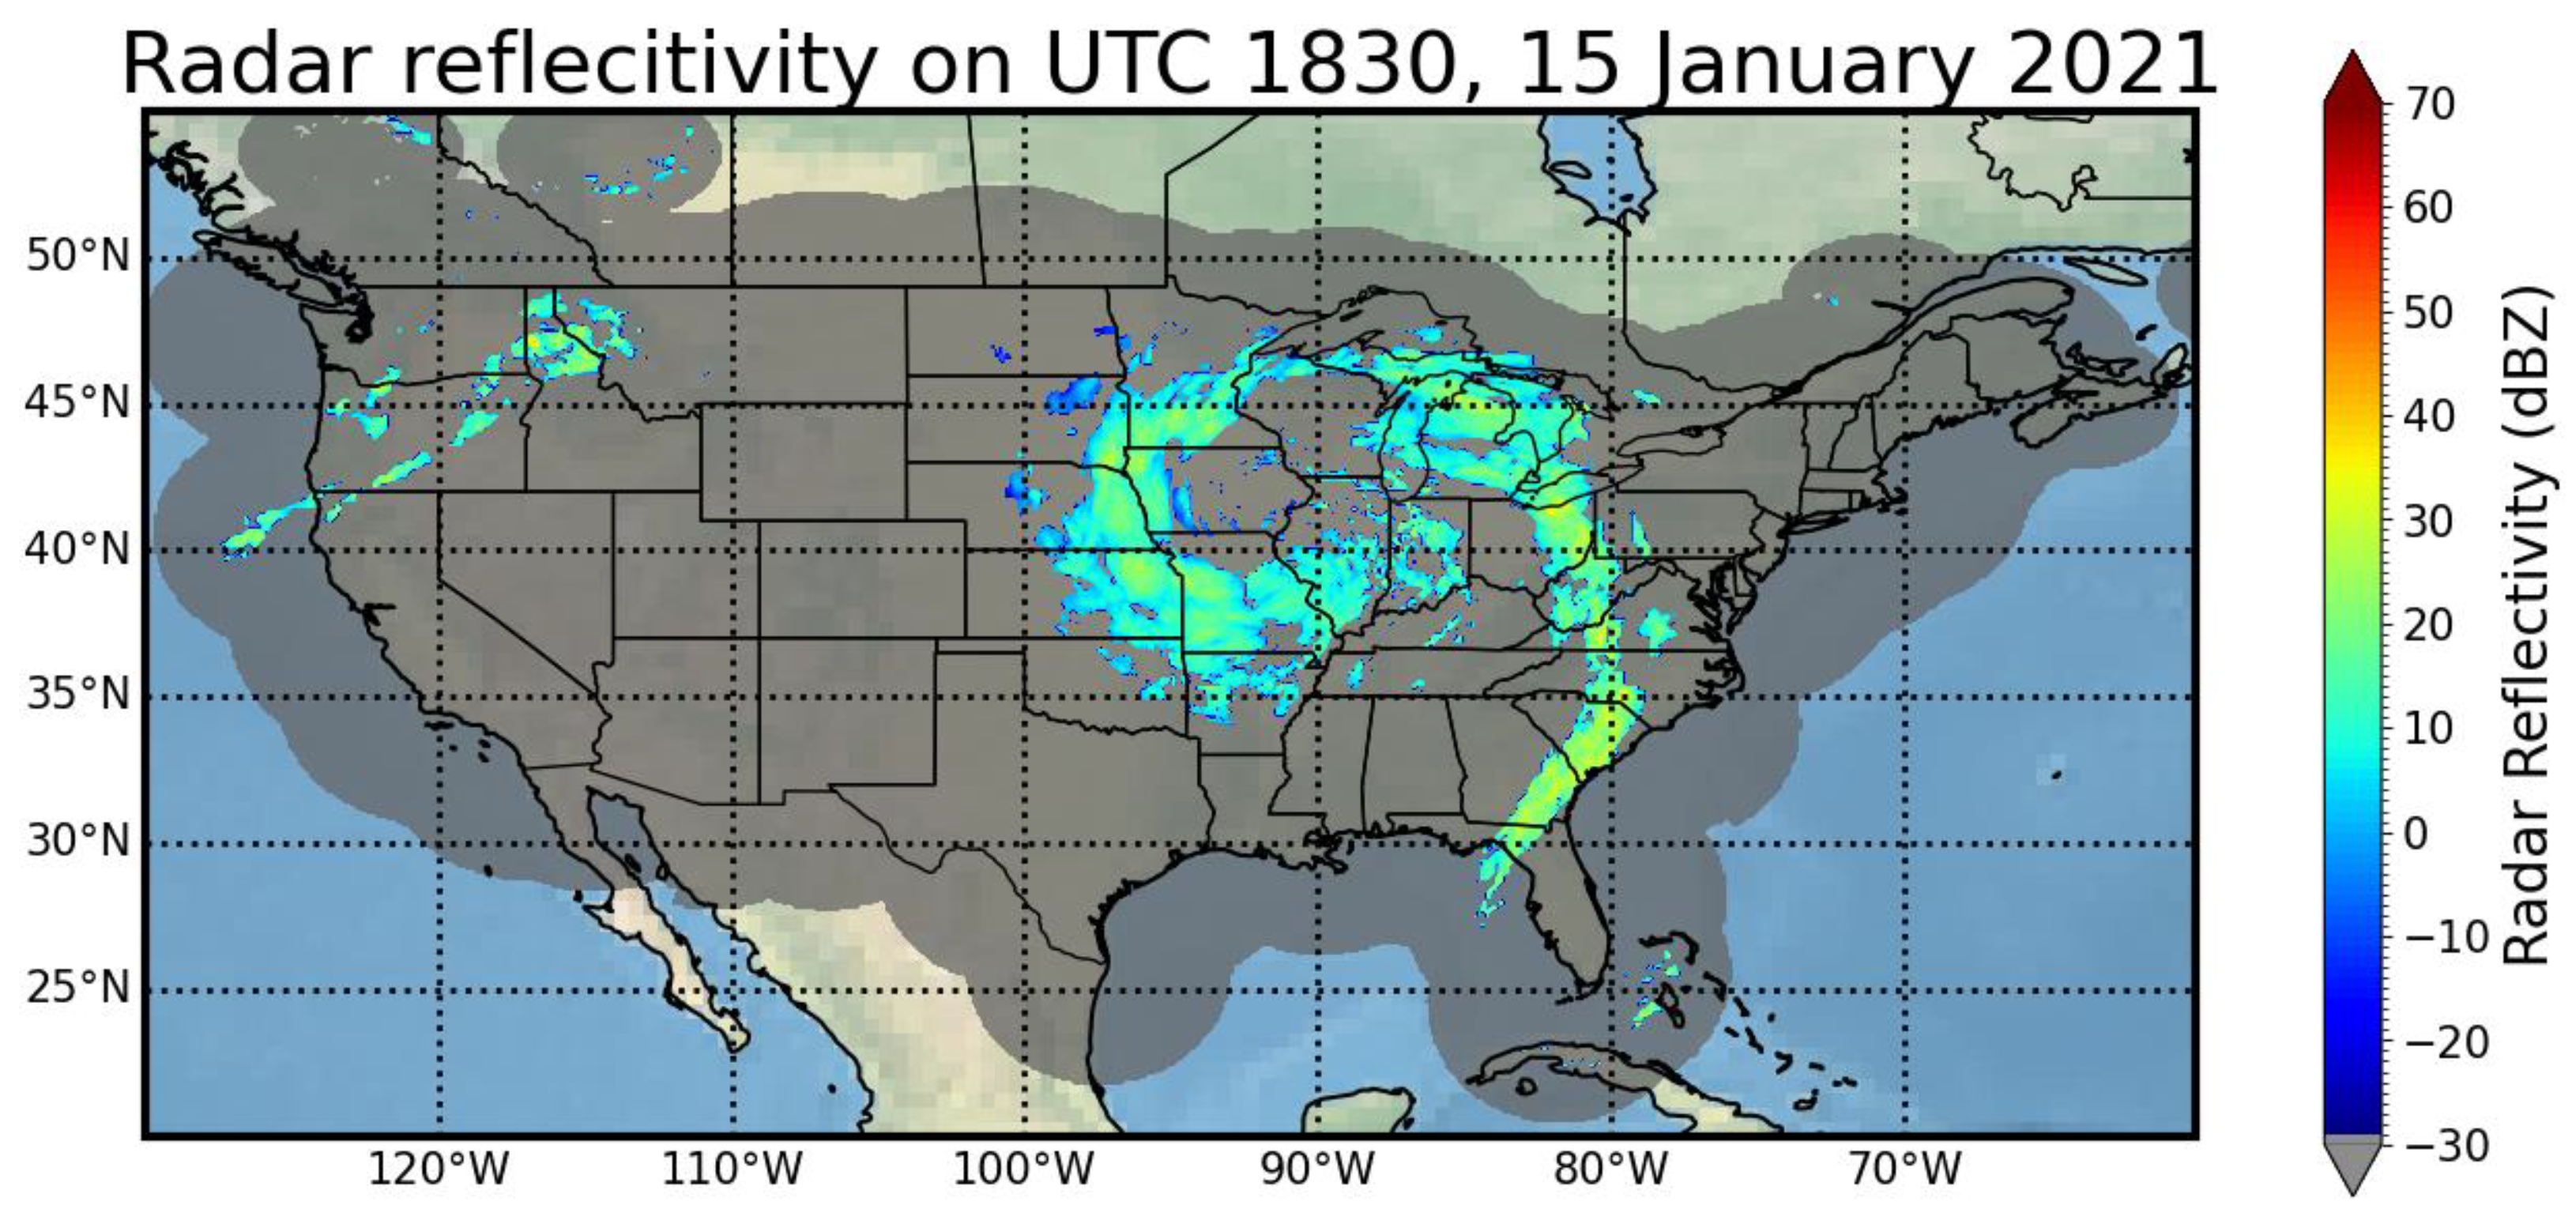
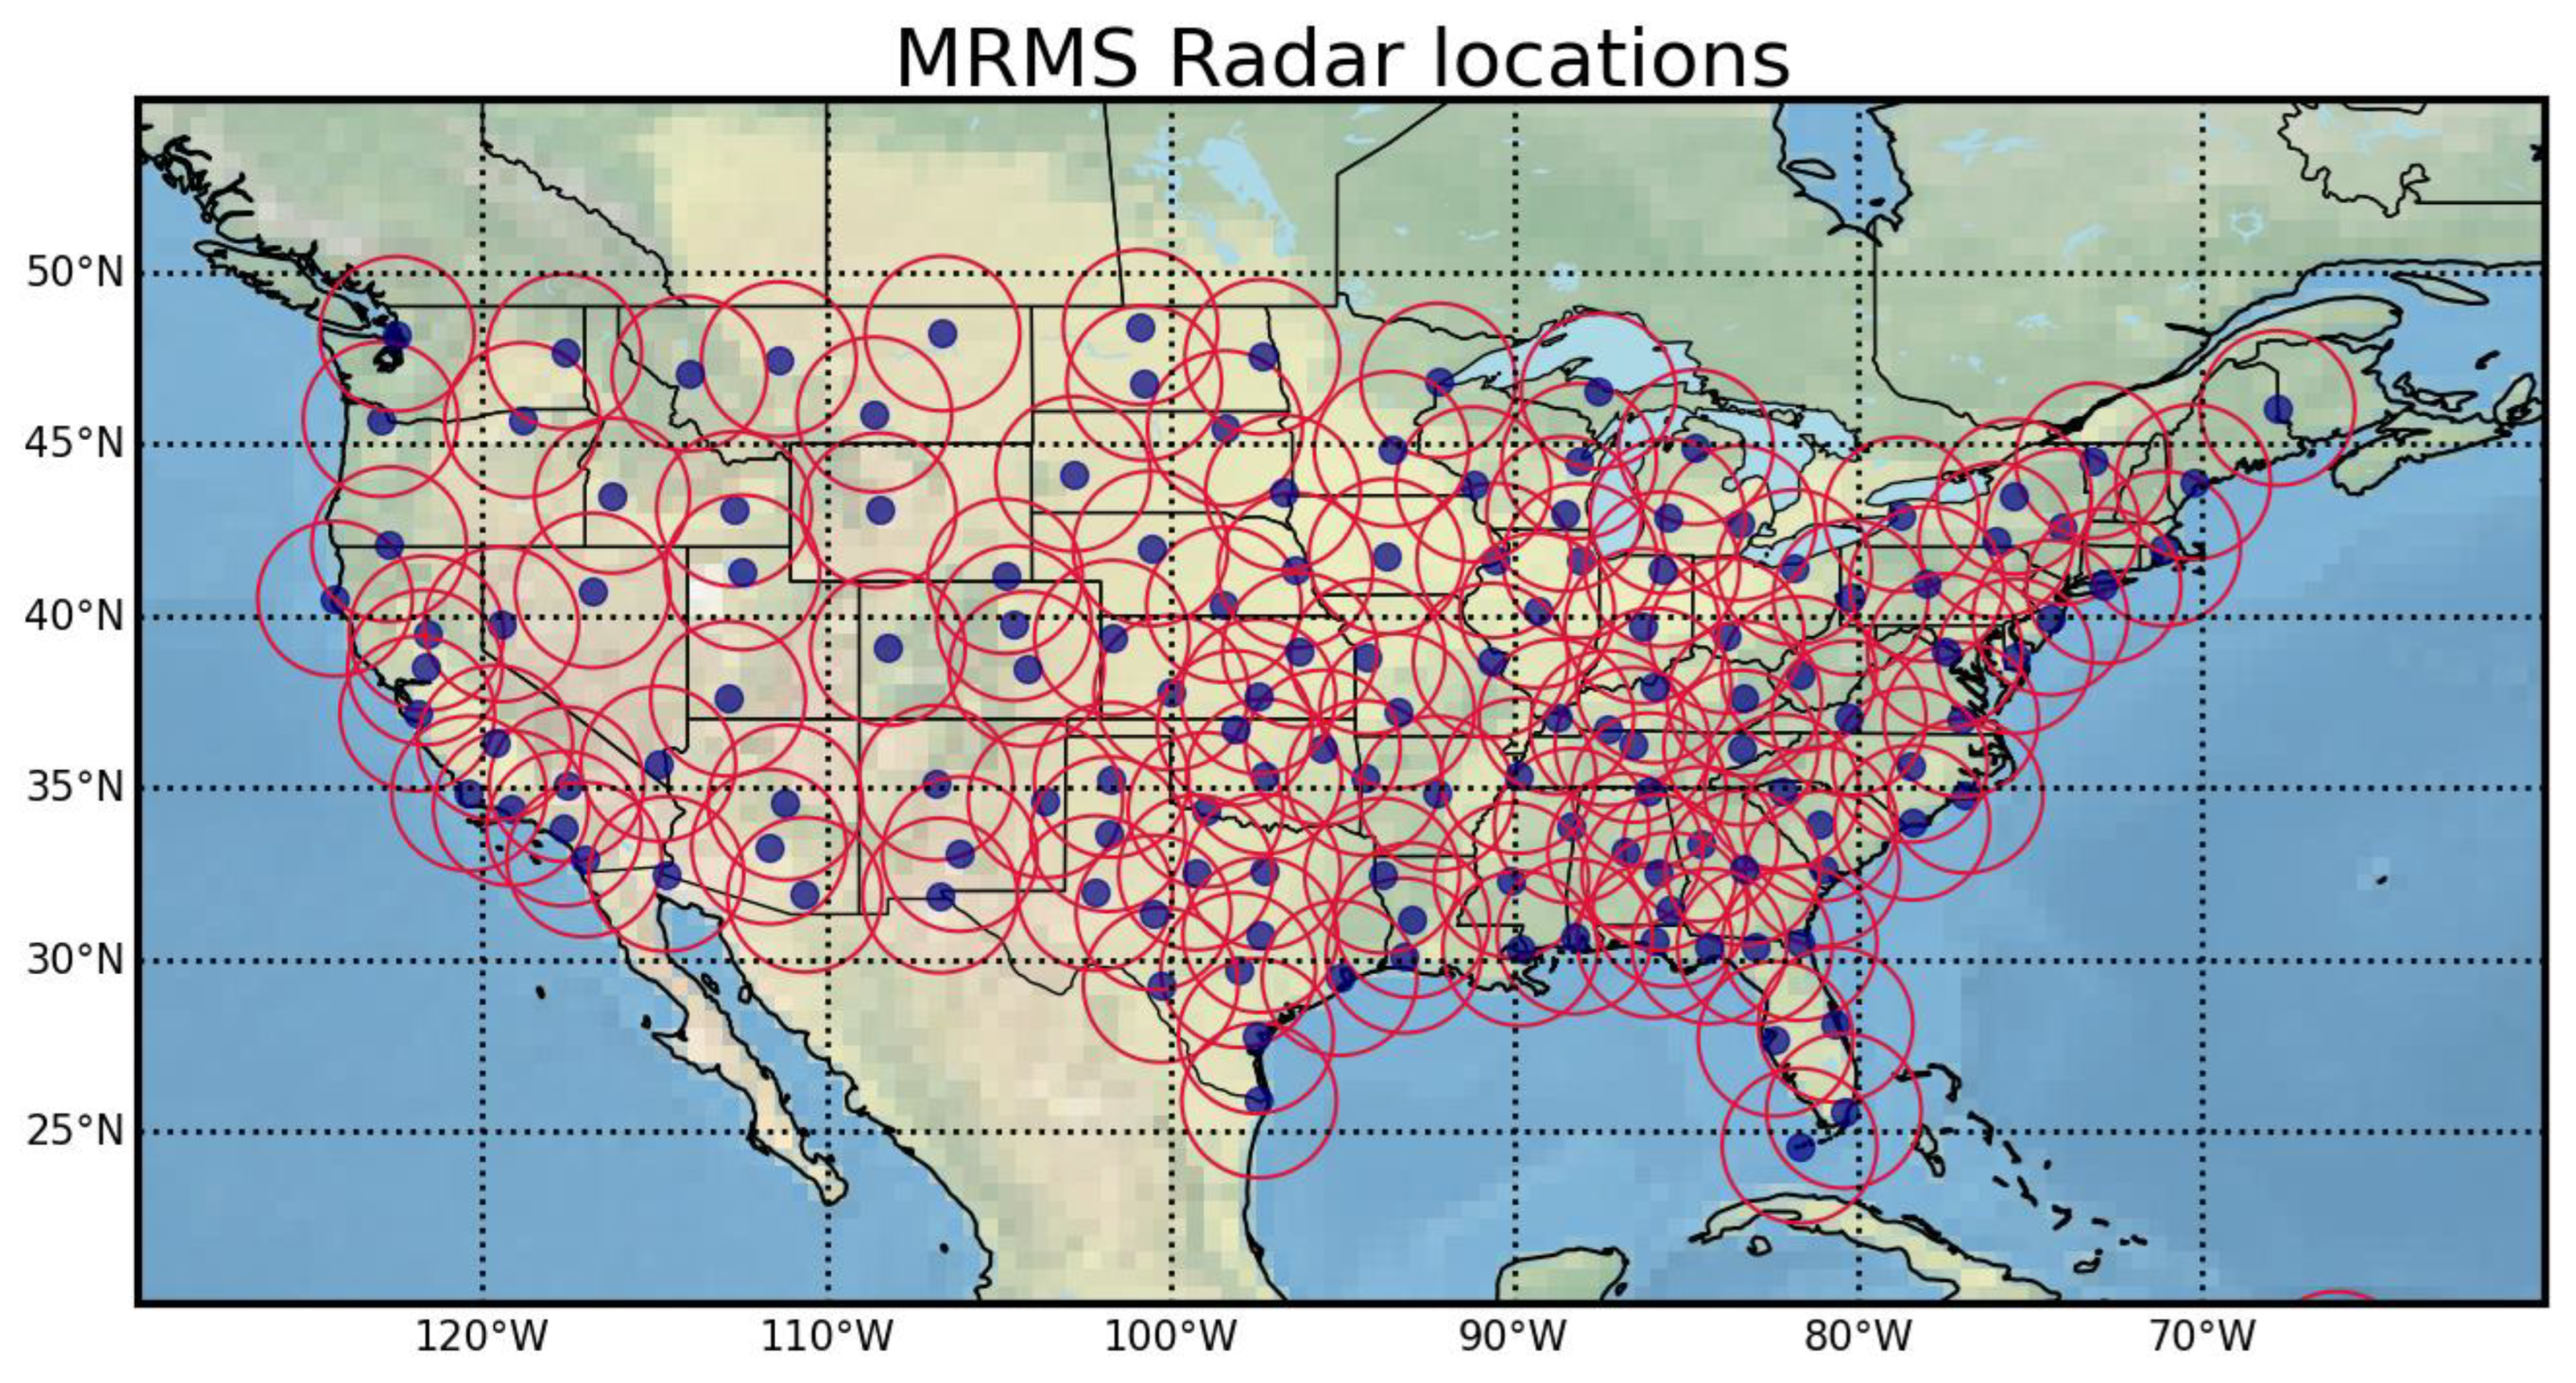
4]. Hence, understanding the change and implications of extreme precipitation patterns is crucial for enhancing our ability to anticipate, prepare for, and alleviate potential harm. By focusing on the precipitation change in the conterminous United States (CONUS), the research contributes to the growing body of knowledge on the Earth’s climate system and supports efforts to develop sustainable and effective strategies to adapt and minimize the impacts of future extreme precipitation events. Our study examines the patterns of extreme precipitation, focusing on CONUS with high-resolution Multi-radar Multi-sensor (MRMS) reflectivity data at a temporal resolution of two minutes and a spatial resolution of 1 km [
5,
6]. The MRMS system incorporates about 190 ground weather radars across the CONUS and southern Canada, and the data cover the entire CONUS region. With the high-resolution data, the MRMS system can better capture the peak values of precipitation.
On a global level, precipitation events are anticipated to become more intense and frequent under climate change [
2,
7]. Research indicates that both observations and models have demonstrated generally increasing trends in extreme precipitation since 1901. Observed annual maximum daily precipitation has risen by an average of 5.73 mm over the past 110 years, representing a relative increase of 8.5%. This corresponds to an increase of 10% per K in global warming since 1901, which is higher than the climate model average of 8.3% per K [
8]. Furthermore, research points to a larger disparity in global precipitation distribution, with already wet regions becoming even wetter, and arid areas becoming drier [
9]. Moreover, annual land precipitation has continued to rise in the middle and high latitudes of the Northern Hemisphere [
10]. New analyses reveal that in regions experiencing increased total precipitation, heavy and extreme precipitation events are likely to see even more significant increases. Similarly, the same pattern is observed in some regions where heavy and extreme events have increased, even though total precipitation has decreased or remained constant [
11]. Other research demonstrates that human-induced greenhouse gas emissions have contributed to the observed intensification of heavy precipitation events in approximately two-thirds of data-covered parts of Northern Hemisphere land areas [
12]. Adler et al. reviewed global precipitation variations during 1979–2014 using the Global Precipitation Climatology Project (GPCP) monthly analysis, which integrates satellite and surface gauge information [
13]. There is no overall significant trend observed in global precipitation mean values. However, there is a pattern of positive and negative trends across the planet, with increases over tropical oceans and decreases over some mid-latitude regions.
Transitioning to the regional scale, specifically focusing on the CONUS, research has indicated spatially and temporally varied precipitation trends. Hoerling et al. analyzed the time series of the daily heavy precipitation in the United States (US) (95th percentile) from 1979 to 2013 to determine factors responsible for regionality and seasonality in their trends [
14]. The results show an increase in heavy precipitation events across the northern US and a decrease across the southern US. Easterling et al. found that heavy precipitation events in most parts of the US have increased in both intensity and frequency since 1901 and are projected to continue to increase over the 21st century. In addition, annual precipitation has decreased in the West, Southwest, and Southeast and increased in most of the Northern and Southern Plains, Midwest, and Northeast [
15]. There is also research showing that the northeastern US has experienced a large increase in precipitation over recent decades [
16]. Sayemuzzaman and Jha found a significant increasing trend in winter precipitation and a decreasing trend in fall precipitation across North Carolina [
17].
However, while these trends are evident, there remains a gap in high-resolution analysis within the CONUS on the spatial and temporal sampling errors of remotely sensed precipitation products. High-resolution data allow for a detailed representation of small-scale features. For instance, in regions with complex terrain, such as mountain ranges or urban areas, the precipitation patterns can vary significantly over short distances. Low-resolution data might smooth out these variations, potentially missing localized extreme events [
18]. In addition, high-frequency changes in precipitation can be better captured by high-resolution data. This is crucial for understanding rapidly developing weather systems or capturing the exact onset, peak, and recession of extreme precipitation events [
19]. The gap in high-resolution analysis is especially significant given the vast climatic diversity across the region, necessitating a detailed, localized examination. This research aims to provide a comprehensive analysis of extreme precipitation change in CONUS, with a particular emphasis on the variability of these changes across different regions and seasons. The objectives of this research are threefold:
Utilizing high-resolution, multi-sensor radar reflectivity data to capture precipitation peaks and discern precipitation patterns;
Providing a detailed analysis of extreme precipitation changes within the CONUS and highlighting distinct variability across regions and seasons;
Revealing the pattern of diurnal precipitation by focusing on the timing of daily maxima.
Equipped with reflectivity data at a temporal resolution of 2 min and a spatial resolution of 1 km, this research can capture more peak precipitation values and reveal more patterns about precipitation trends. In this paper, we show the results in the following sections. In
Section 2, we describe the data we used and the method to process the data.
Section 3 shows the results of the research objectives.
Section 4 discusses the limitations of the research and compares the results to other research.
Section 5 provides the conclusion of these results.
3. Results
3.1. Precipitation Distribution in the CONUS
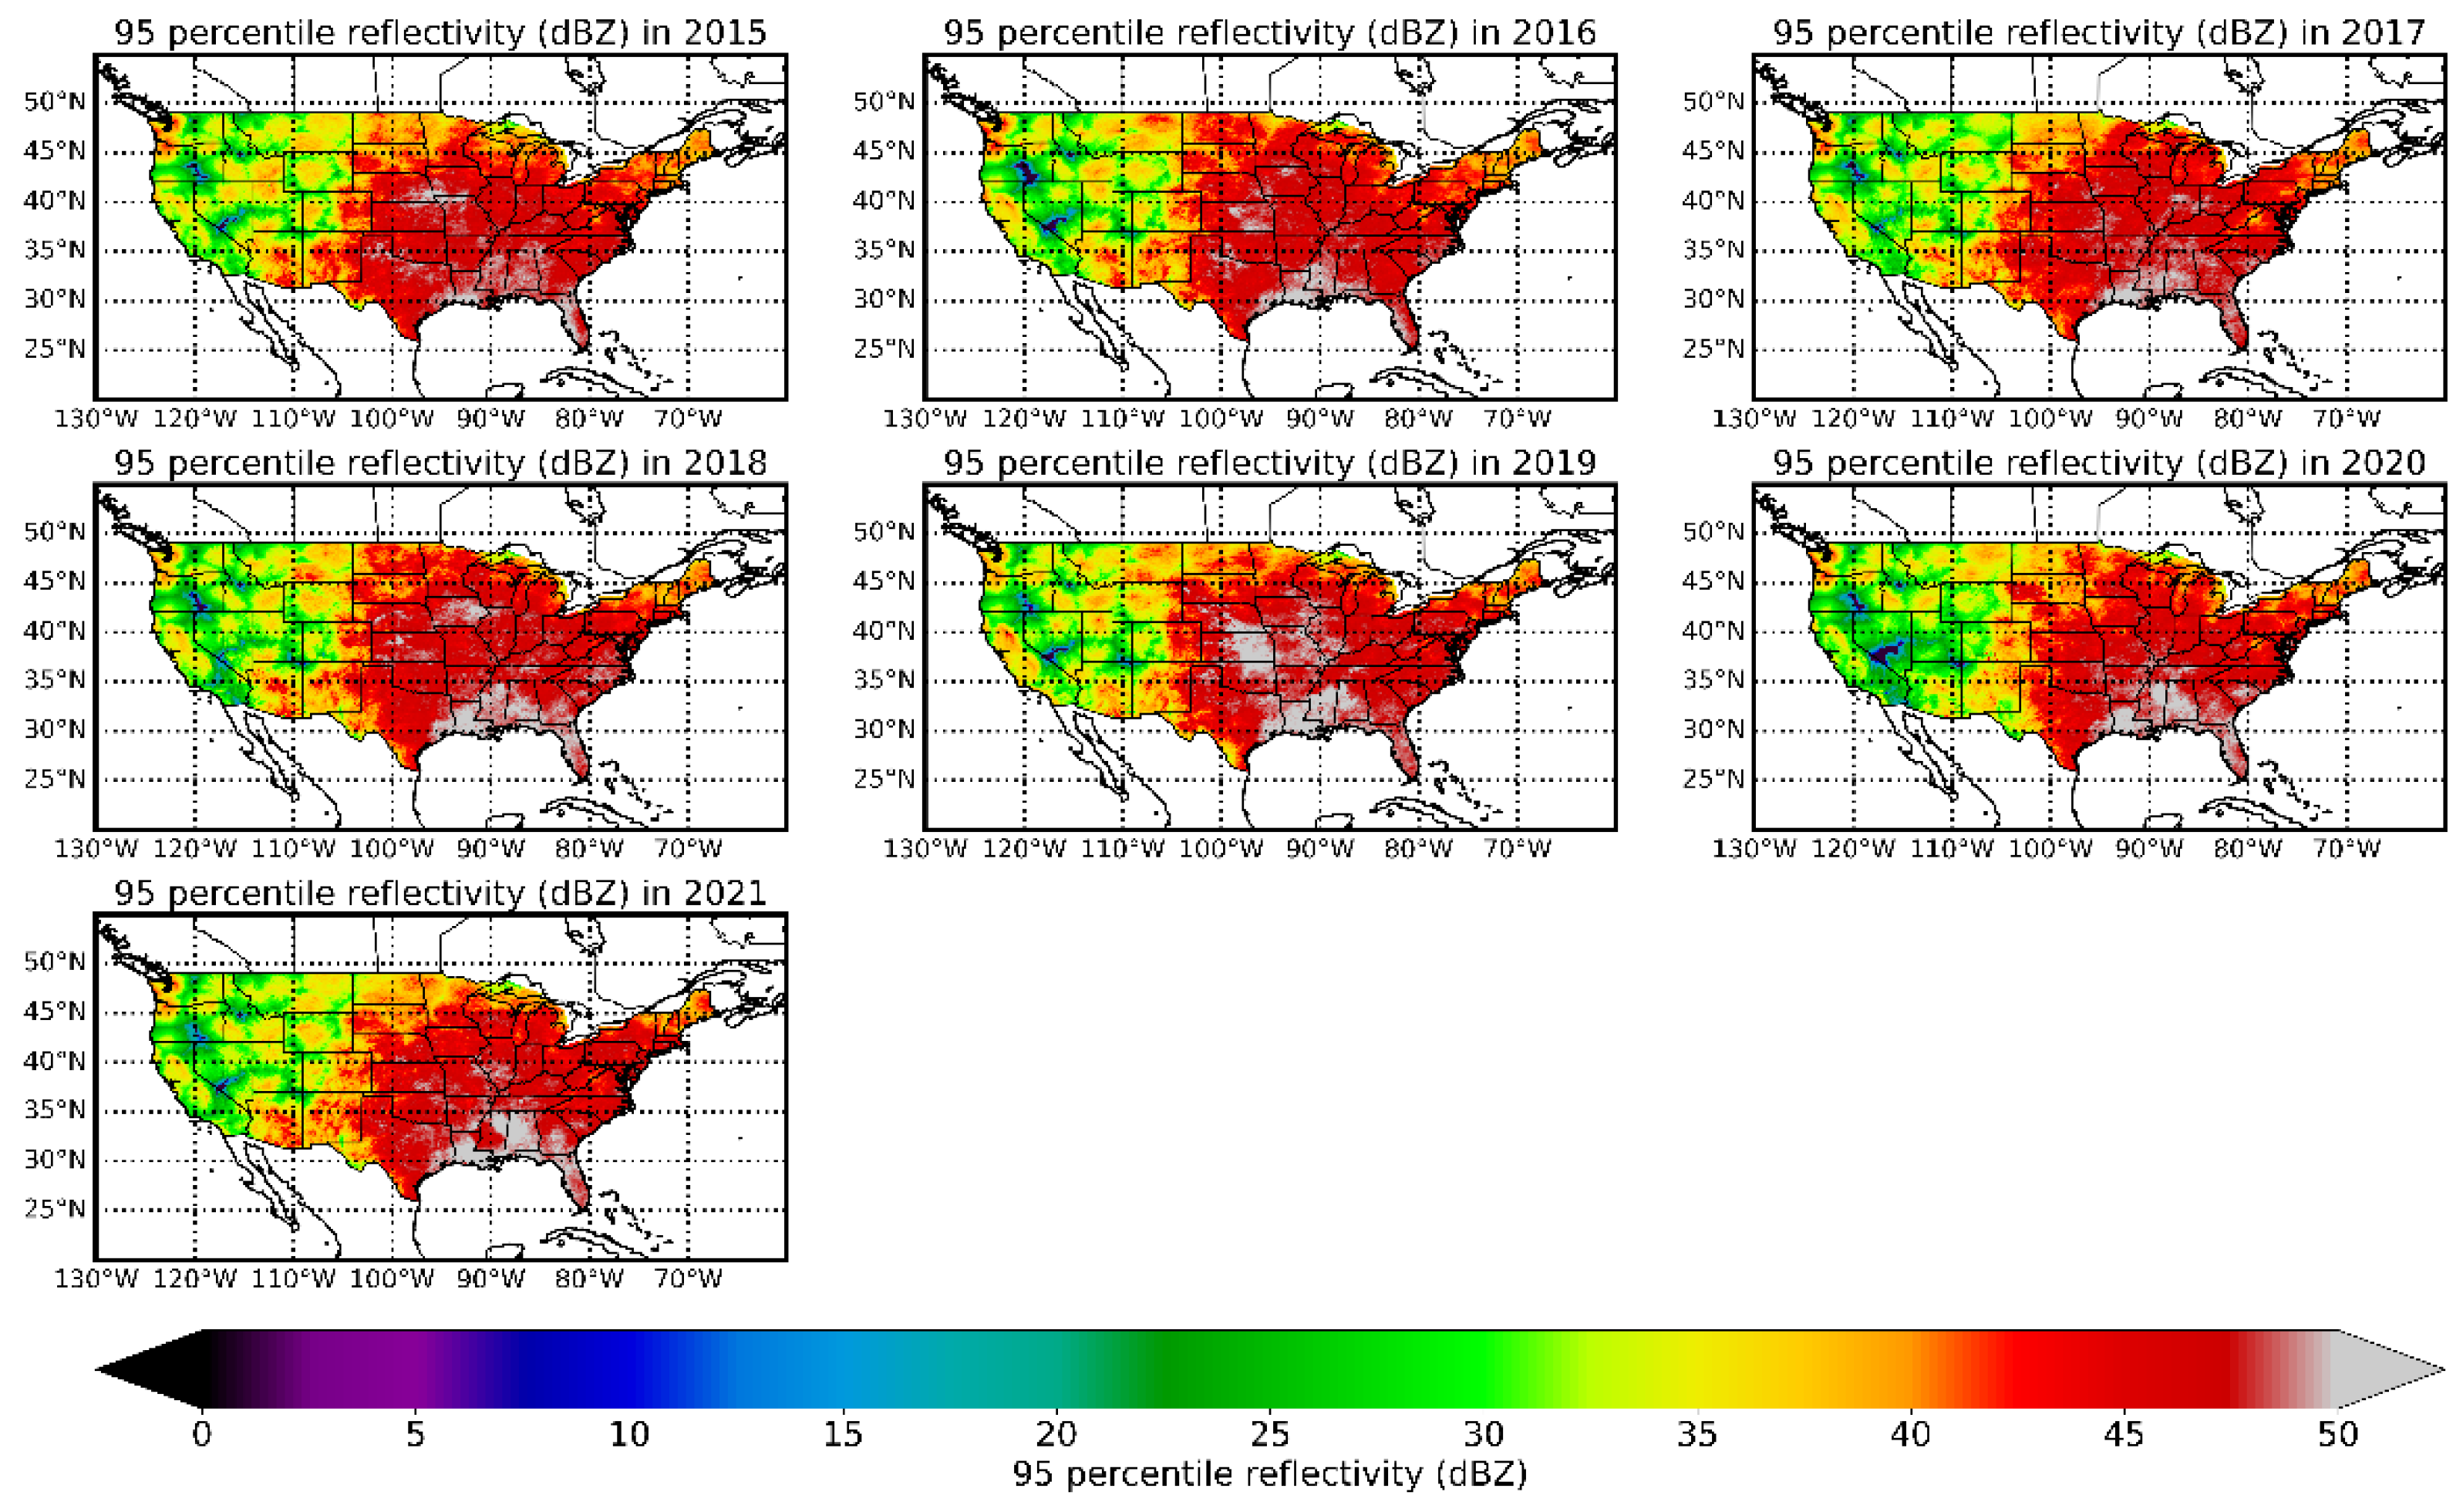
Precipitation varies a lot by different regions in CONUS. We first calculated the daily maximum reflectivity pixel by pixel for each day of the year using the 2 min data and subsequently ranked the daily maximum reflectivity from smallest to largest to calculate the 95th percentile for each year.
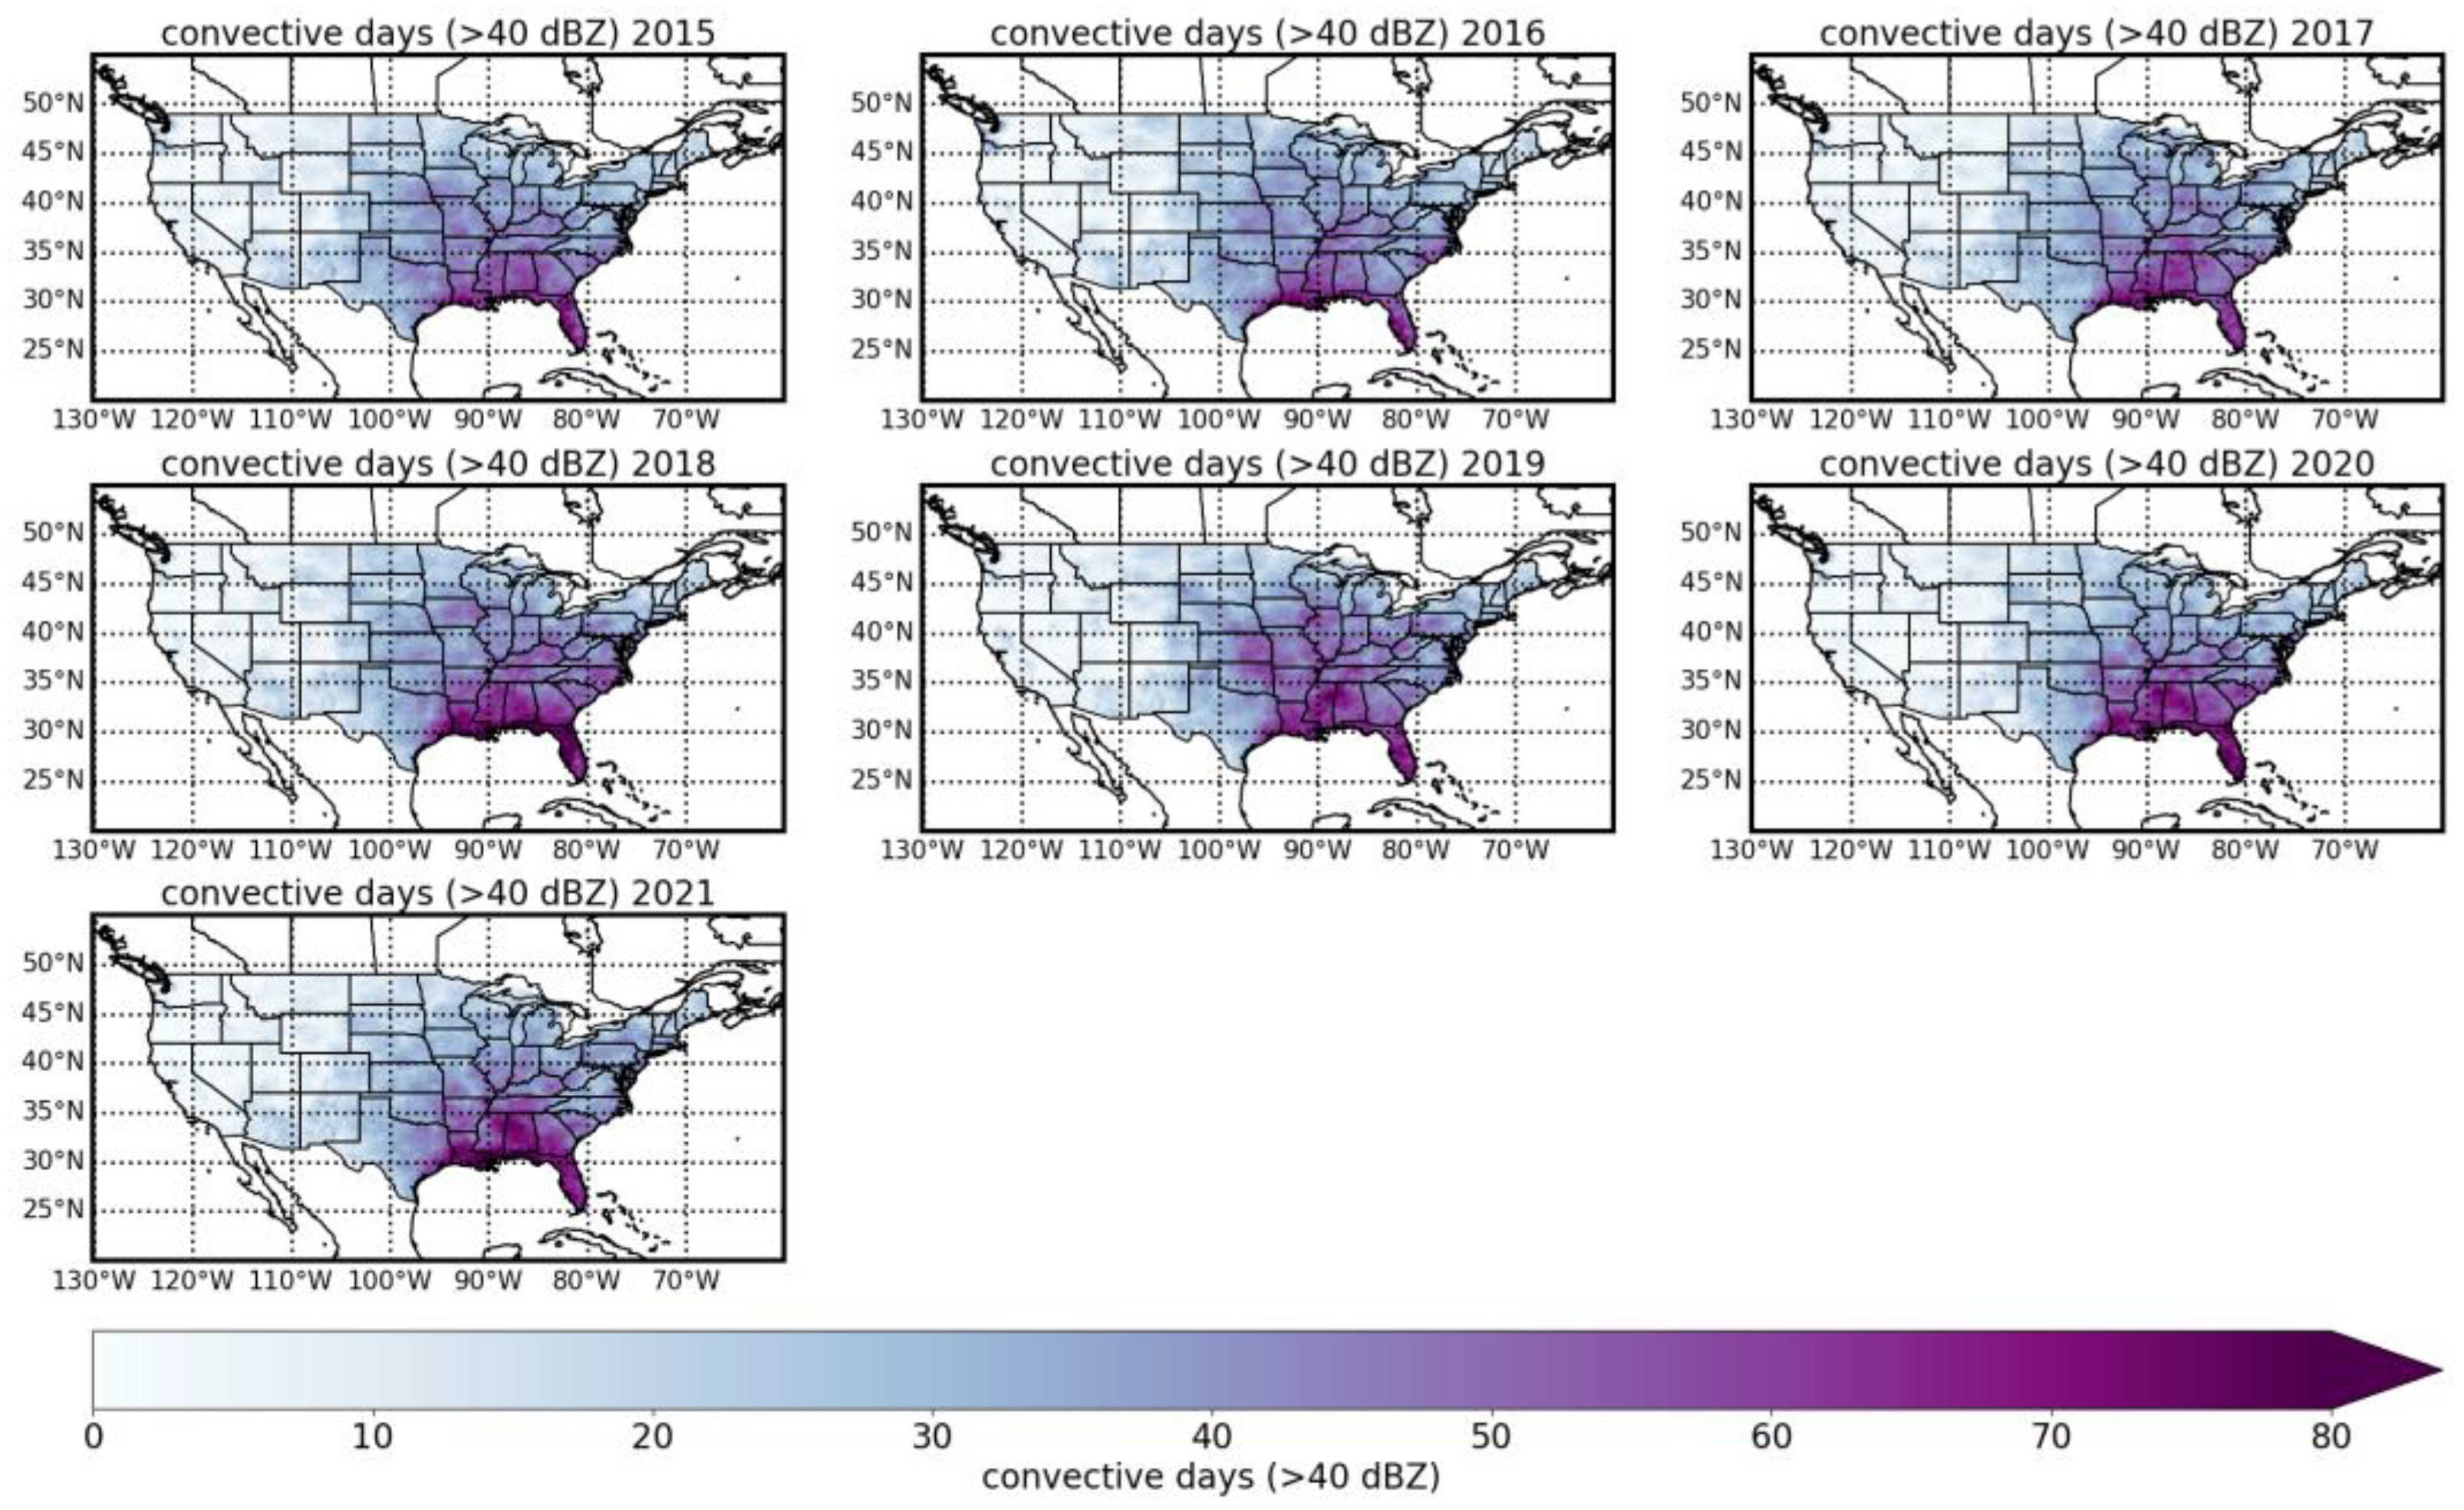
Figure 4 shows the distribution of the 95th percentile reflectivity magnitude. As can be seen from the figure, the strongest reflectivity occurs in the eastern part of CONUS. The reflectivity values in the Gulf Coast of Mexico and the Central Plains are prominent (greater than 50 dBZ), as they are likely influenced by hurricanes and convective thunderstorms. The number of convective days in each year is depicted in
Figure 5. We used 40 dBZ as a threshold and any day with a reflectivity stronger than 40 dBZ is identified as a convective day. There are more convective days in the southeastern part of the US, over the Gulf Coast and Florida peninsula (
Figure 5). A possible explanation for this might be the influence of tropical storms (or hurricanes) and sea breeze effects. Sea breeze is a phenomenon that includes thermodynamic distribution, available moisture, and proximity to warm oceanic currents, as well as other thermal effects [
25]. Moving to the inland, such as the Central Plains and the Northeast, there are fewer convective days, and the Intermountain West has the least convective days, which could be partly ascribed to beam blockage in complex terrains.
3.2. Precipitation Change in the CONUS
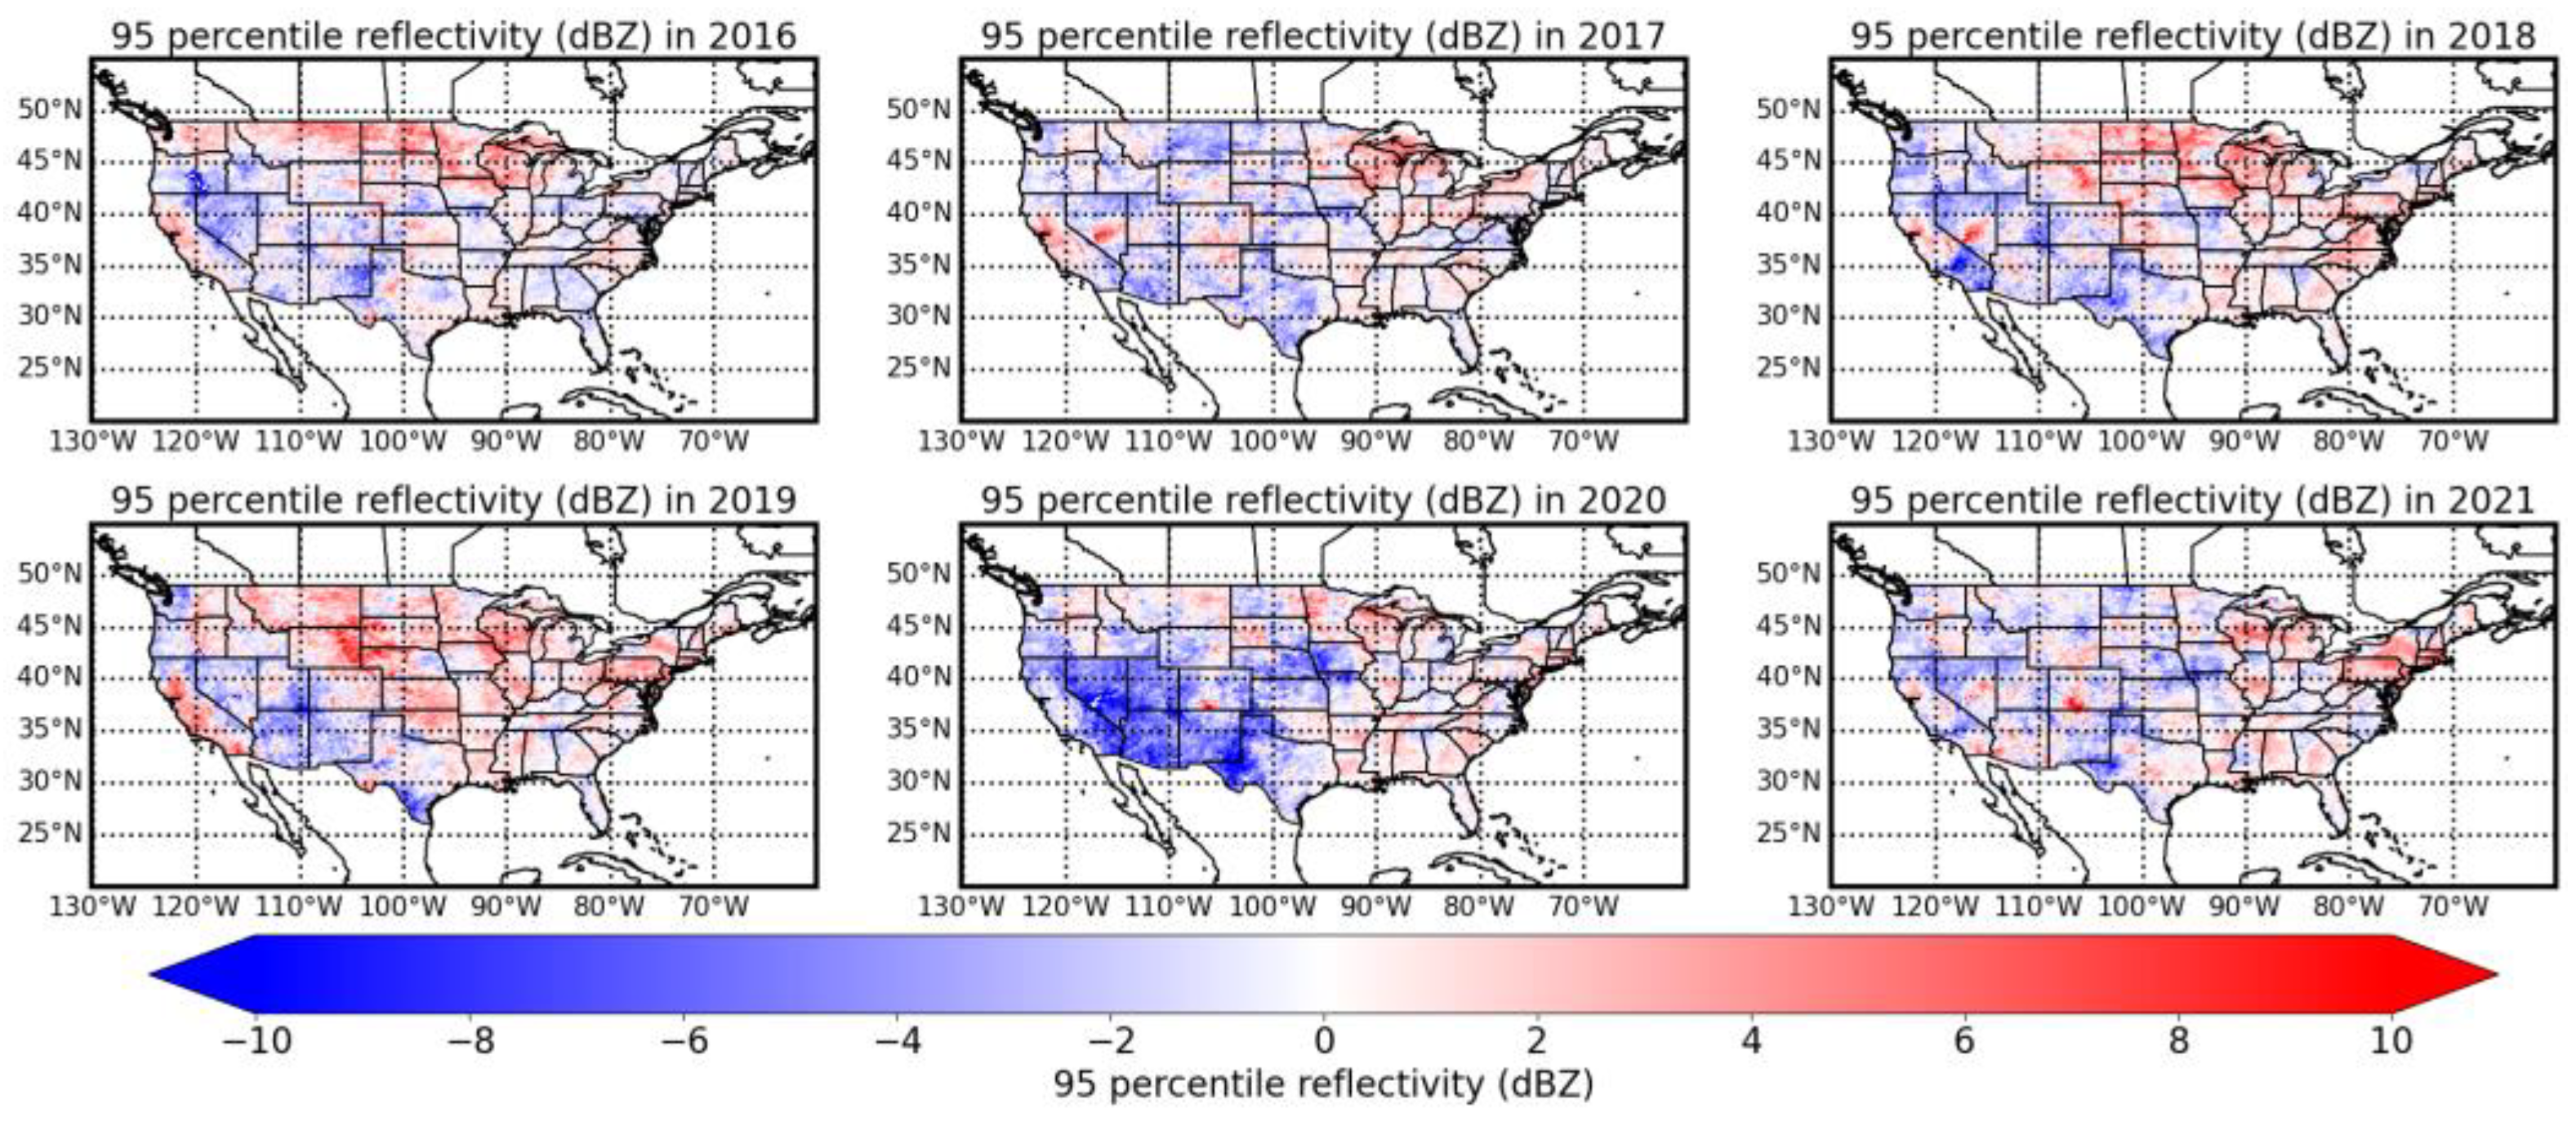
To better understand the change in precipitation reflectivity from 2016 to 2021, we plotted the relative change of the reflectivity in each year as compared to the benchmark year 2015 (
Figure 6). Apart from the year 2020, most of the regions in the other years showed stronger reflectivity than the year 2015. In 2017 and 2021, the reflectivity magnitude increased the most in the northeastern US. In 2016, 2018, and 2019, the reflectivity magnitude increased the most in the Great Lakes and Northern Plains. 2019 is the year with the largest positive anomaly, the Central Plains and southwestern coastal areas show an extended reflectivity increase besides areas with strong reflectivity signals. Conversely, 2020 is the year when reflectivity decreased in most of the areas. This result may be coincident by the fact that 2020 was identified as the COVID-19 pandemic year. The global lockdown limited the aerosol emissions and thus reduced condensation nuclei in the atmosphere, one important component for condensation, resulting in reduced precipitation [
26].
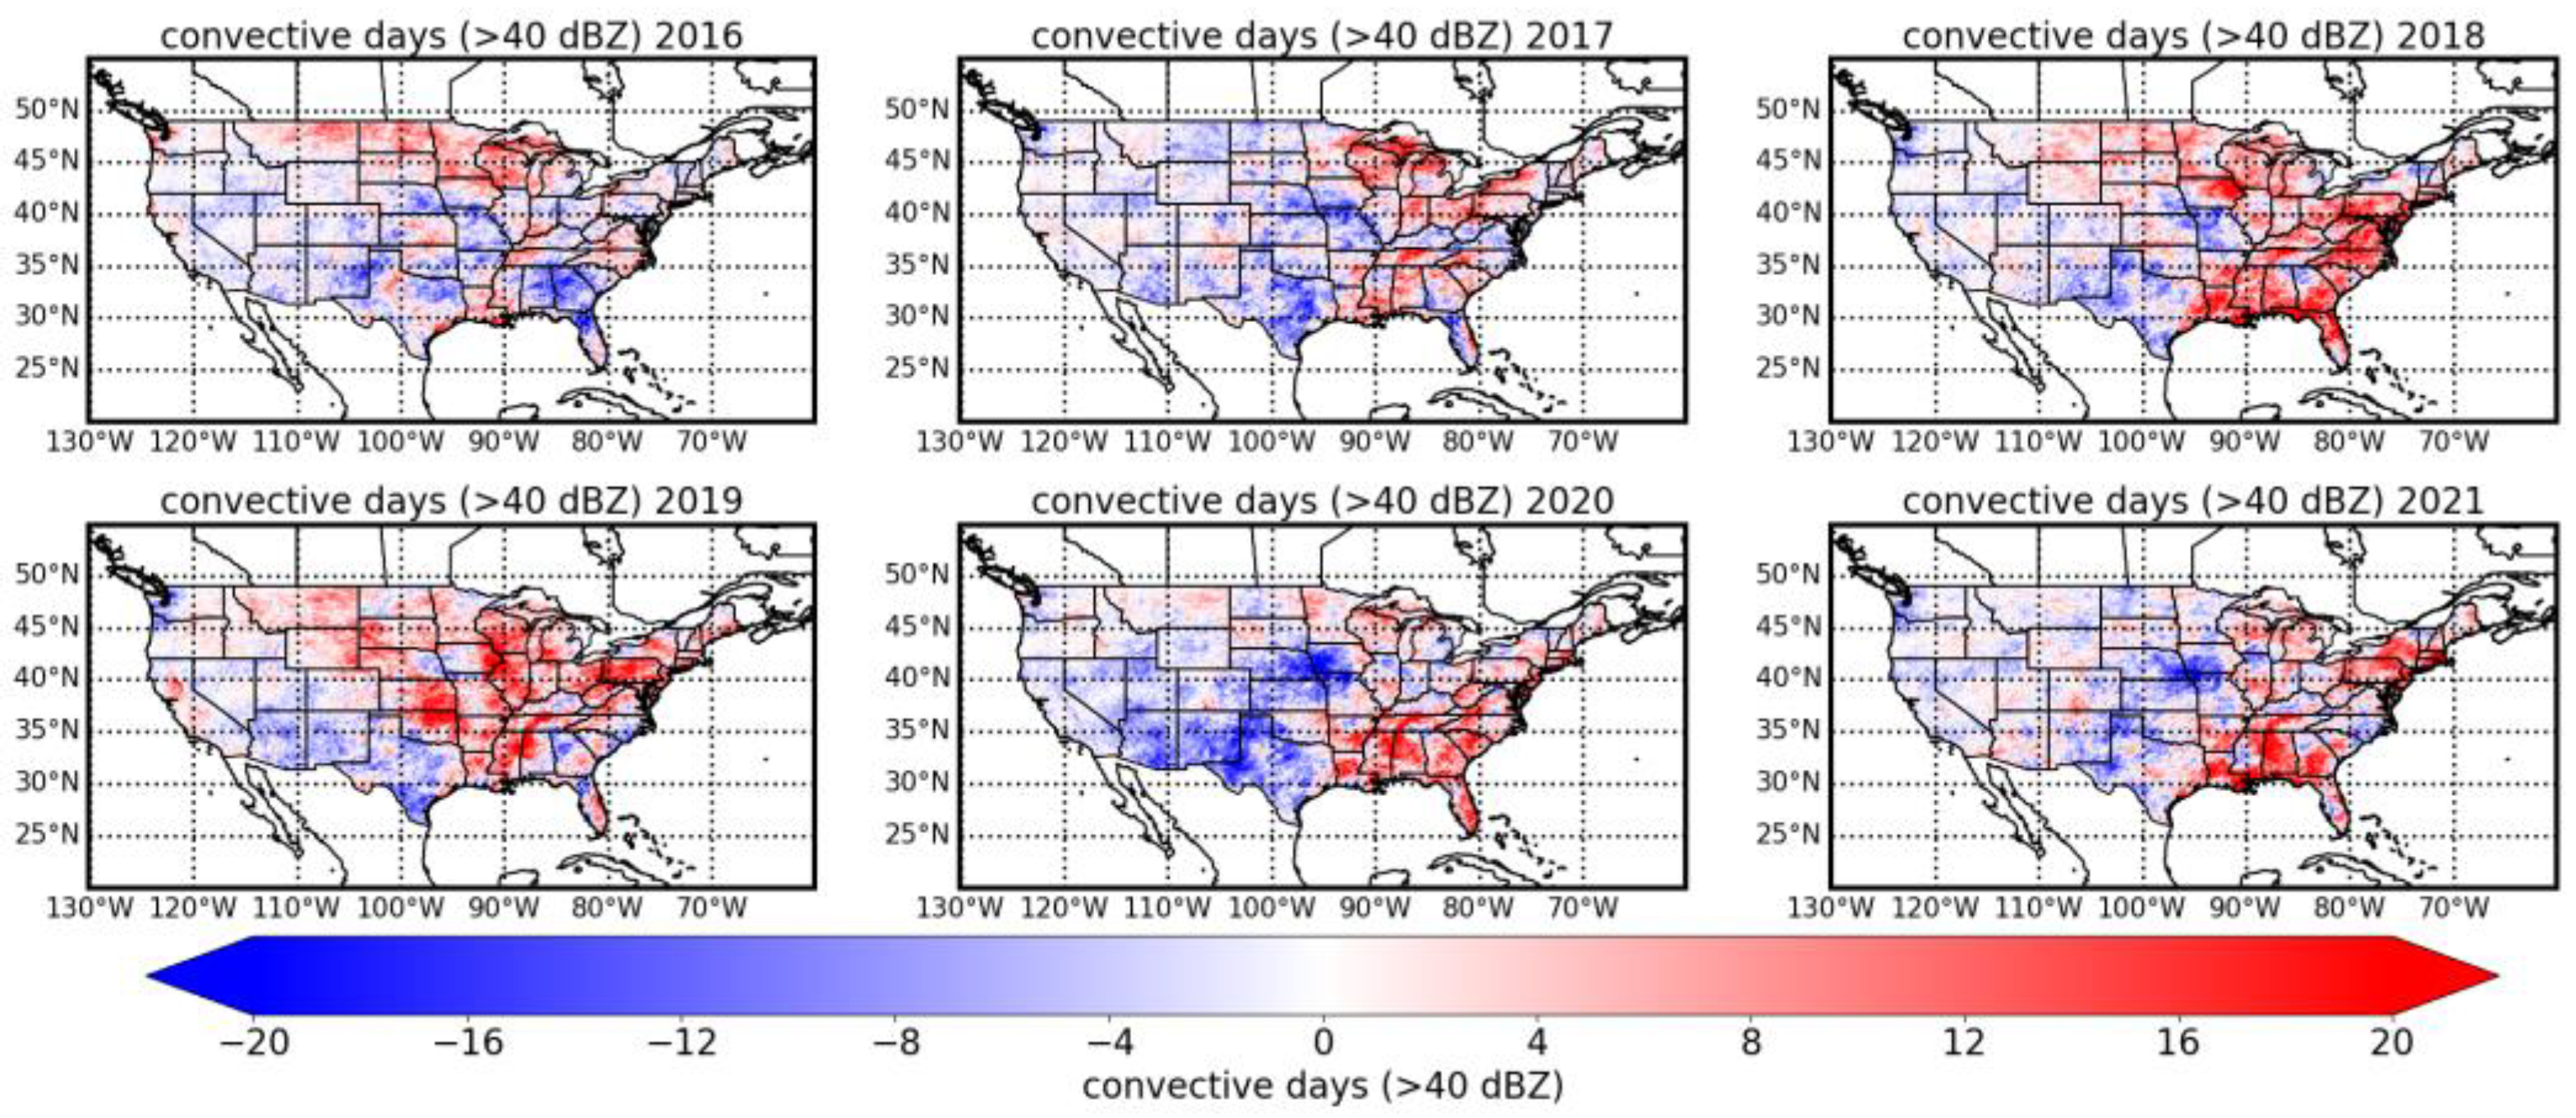
A general observation from
Figure 7 suggests a noticeable increase in convective days from 2016 to 2021, as compared to 2015. This trend is consistent across most of the years, underscoring a broader climatic pattern. Zooming into regional differences, the eastern US emerges as a significant hotspot. Compared to the western regions, the East has seen a more pronounced increase in convective days. This distinction becomes especially clear in the Atlantic Coast and the Central Plains. Breaking down year by year, specific patterns and anomalies emerge. While the increase in convective days is evident in most years, 2020 stands out as an exception, witnessing a decrease in most areas except for the southeastern CONUS. In 2018 and 2021, the surge was most noticeable along the eastern coastlines. Meanwhile, 2019 marked an uptick in the Northeast and the Central Plains. Interestingly, while 2016 and 2017 also saw a rise in the eastern US, the intensity of this increase was relatively less prominent compared to the subsequent years. In conclusion,
Figure 7 shows a complex view of changing weather patterns, and in the eastern US, there are a lot of convective activities.
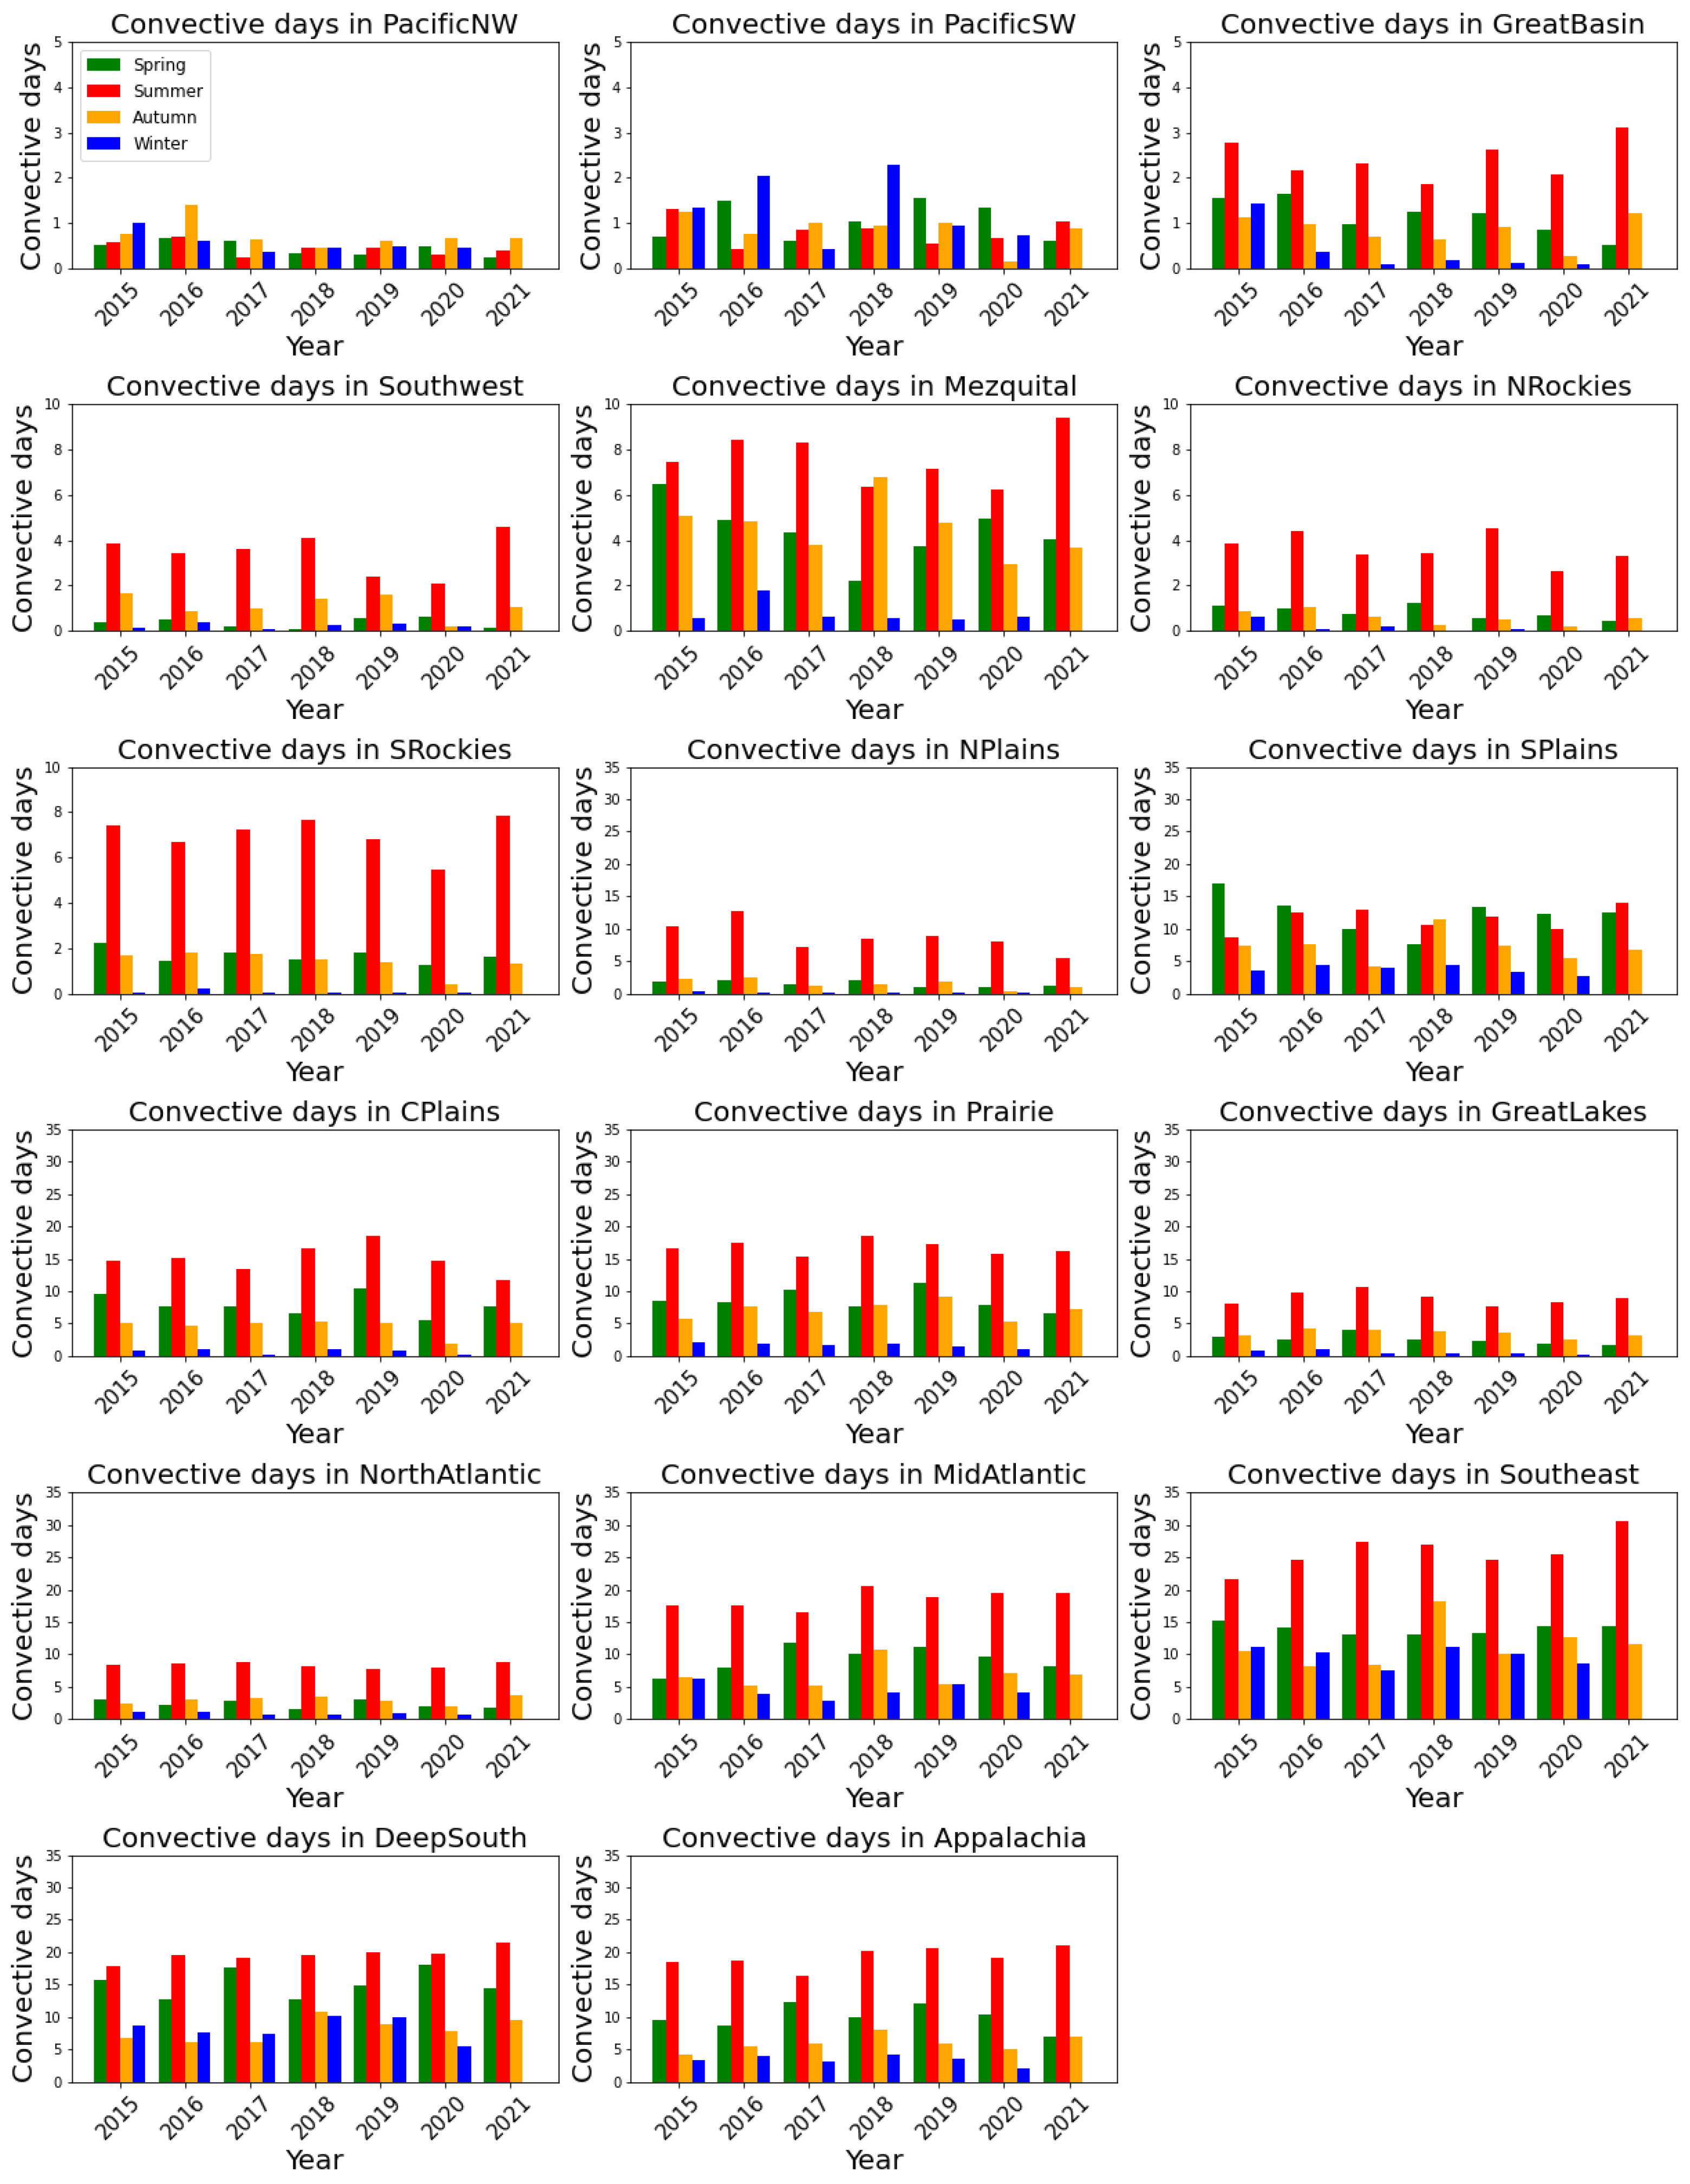
3.3. Precipitation Changes in Different Regions and Seasons
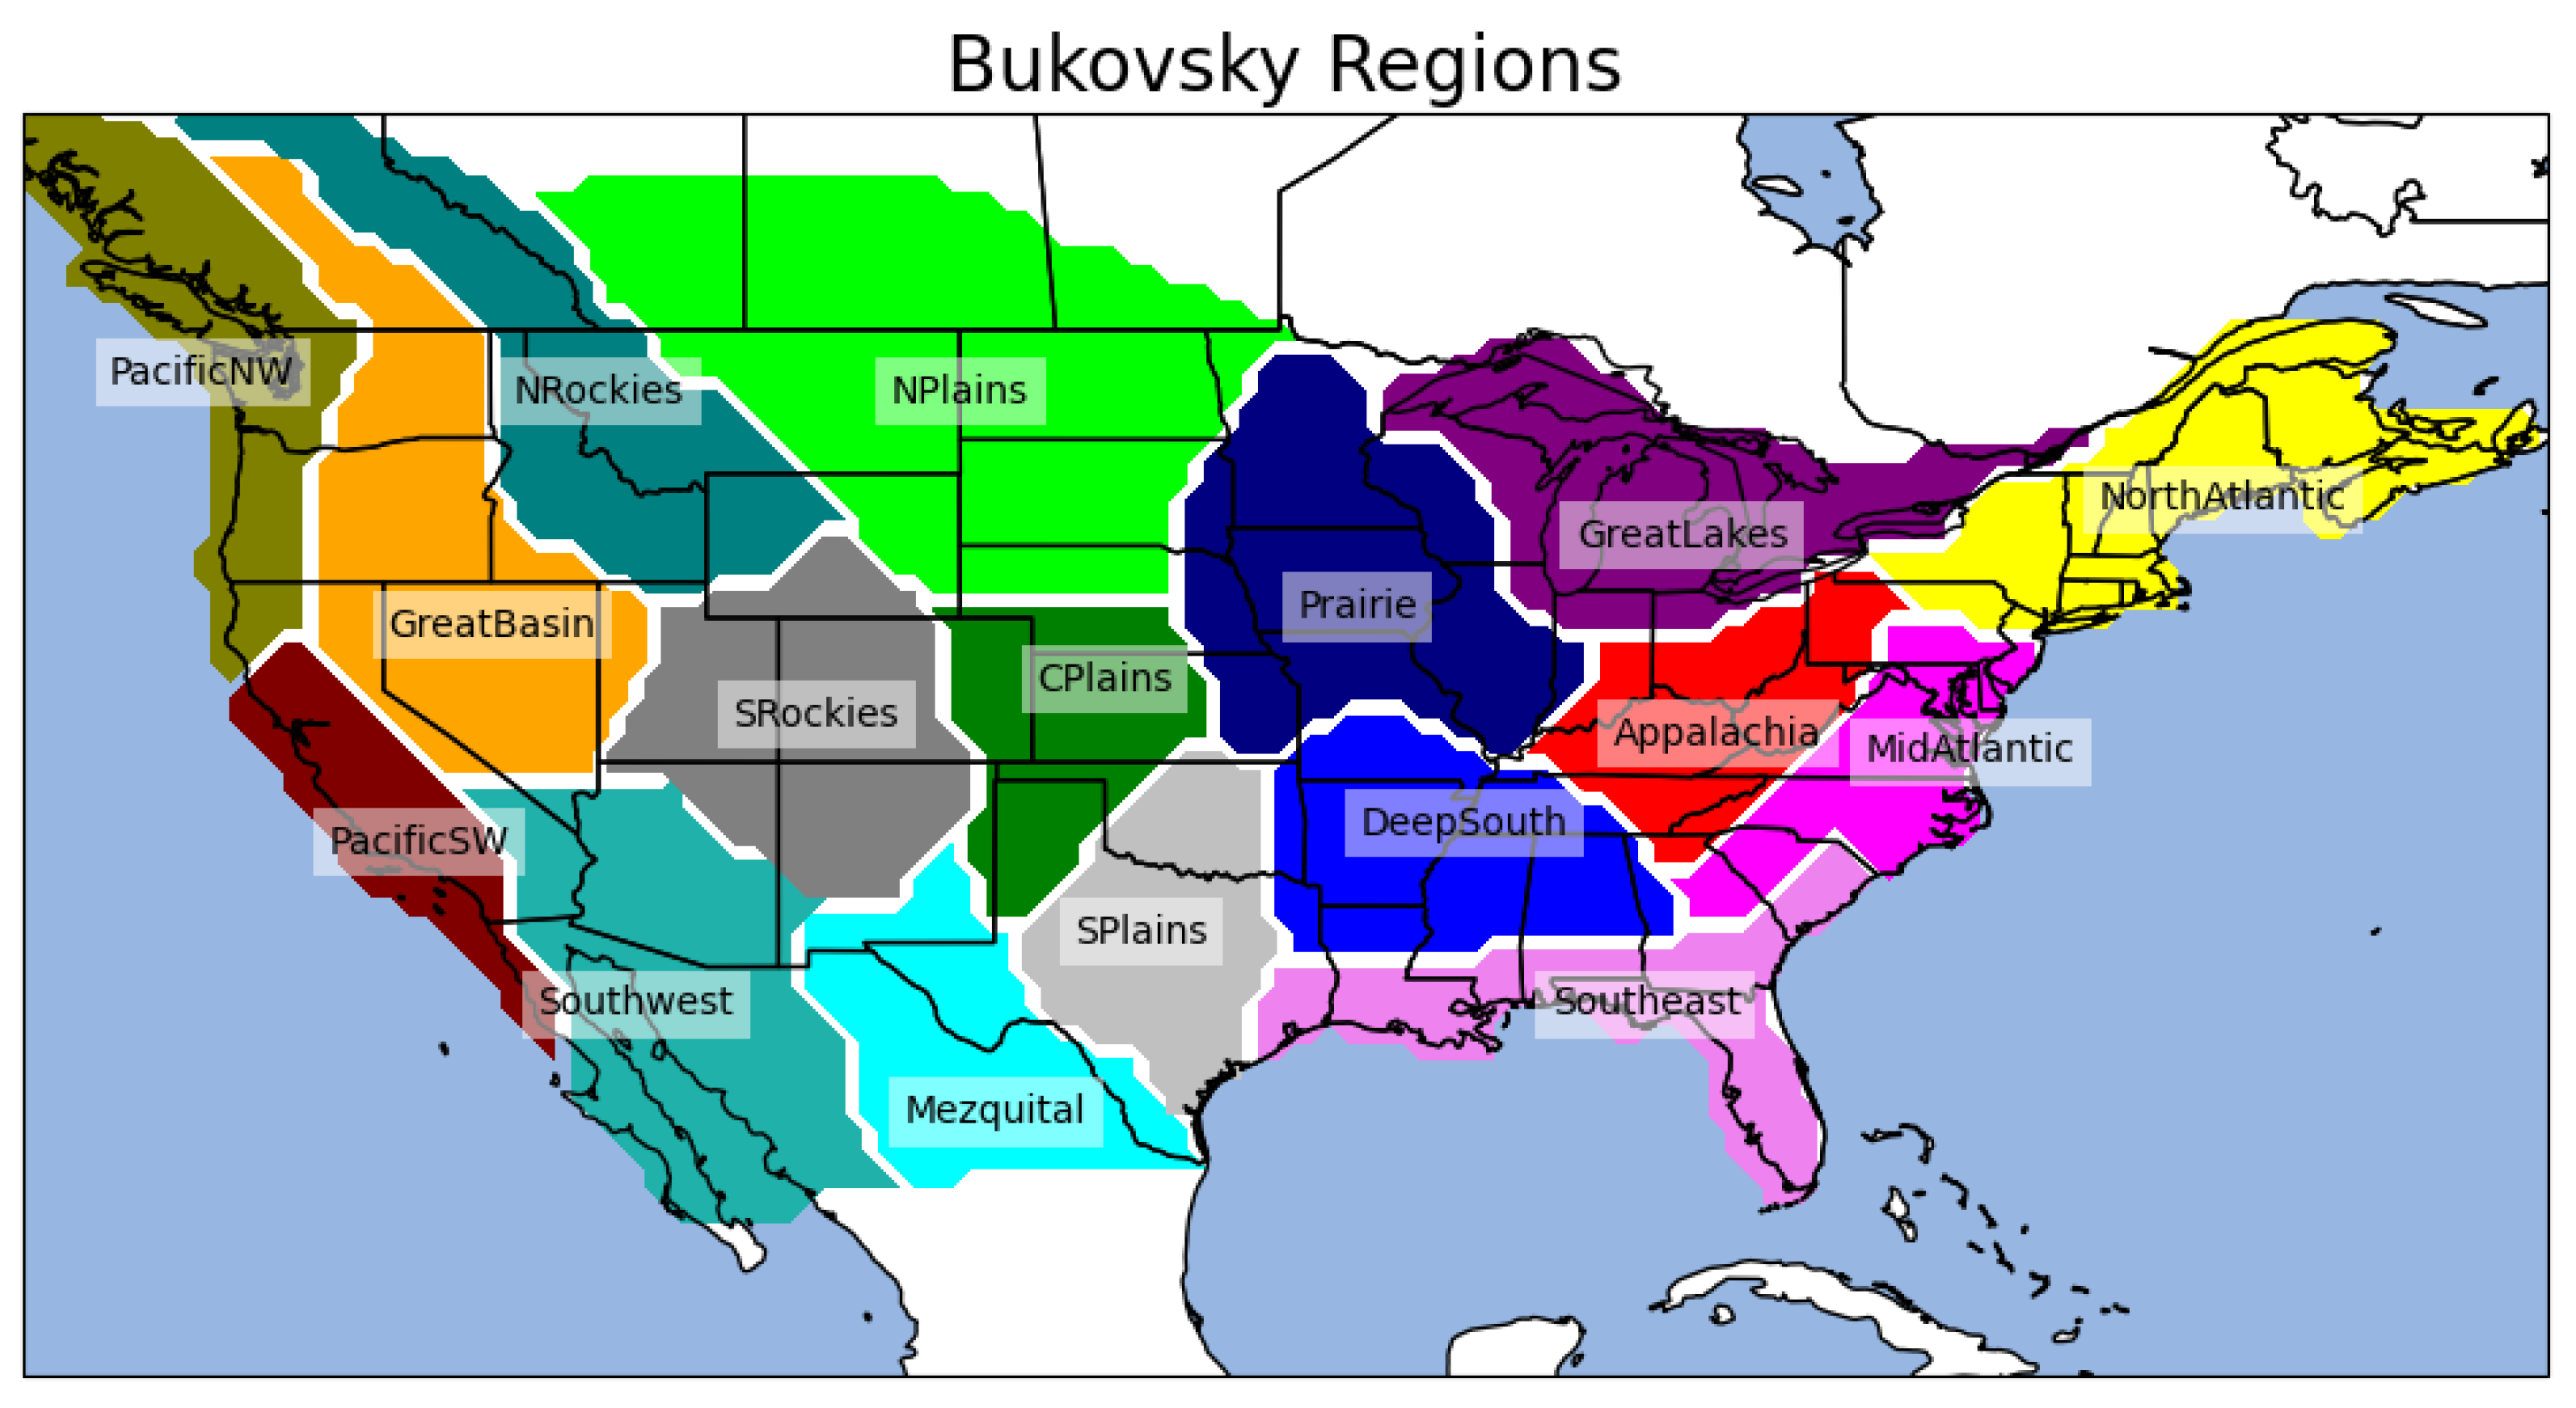
In further analysis, we break down the radar reflectivity data into regions and seasons.
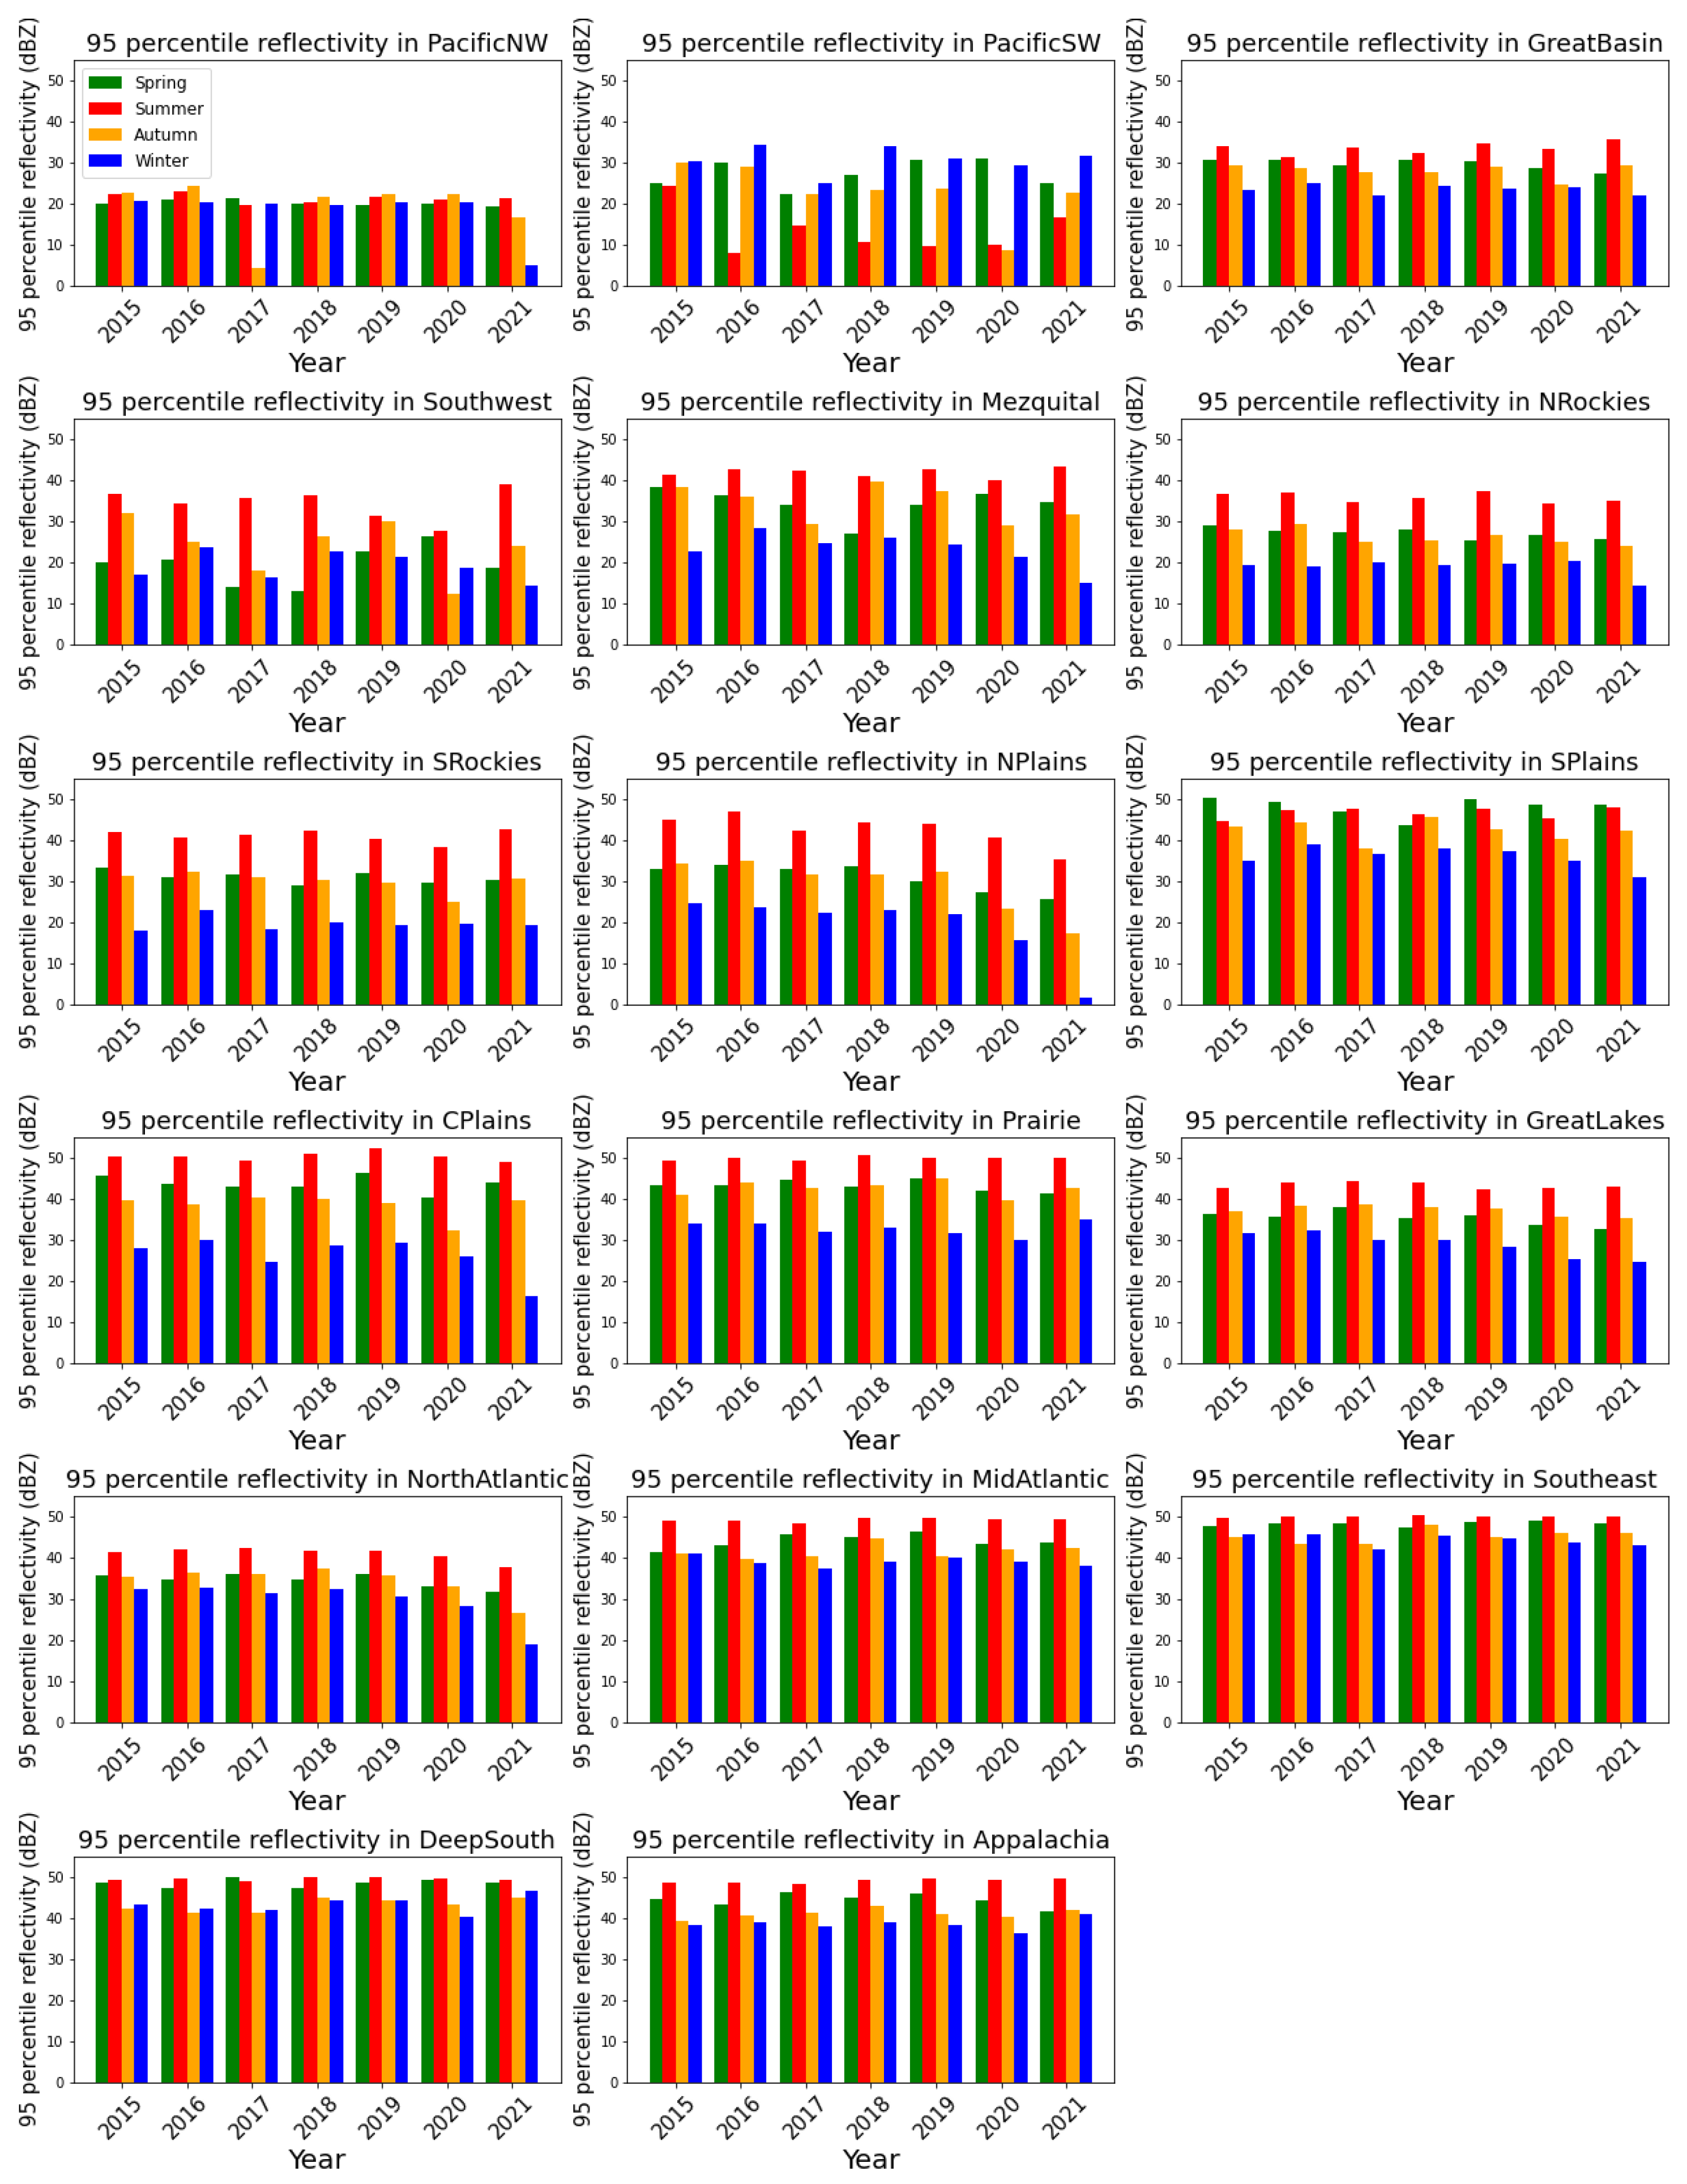
Figure 8 shows the radar reflectivity magnitude in different seasons and regions. The reflectivity magnitude is stronger in the East and South than in the West and North in general. In the Southeast, Deep South, and Southern Plains, the seasonal differences are not significant, and the reflectivity magnitude is strong across the seasons. While in the central US, such as the Rockies, the North and Central Plains, the Great Lakes, and the Prairies, the seasonal difference tends to emerge. The reflectivity values are the strongest in summer whilst the weakest in winter. The results on the West Coast are different. Over the Pacific Southwest, there exhibits strong wintertime precipitation, especially in the years of 2016 and 2018, which is contributed by the atmospheric rivers [
27].
Figure 9 shows the convective days in different seasons and regions. In most of the regions in the US except for the West Coast, convective precipitation days peak in summer and fade in winter. Over the Southeast, the Mid-Atlantic, and the Prairies, the summer convective precipitation has been increasing since 2015. On the West Coast, similar to reflectivity magnitude, the summer convective precipitation days are fewer than the fall and winter precipitation. In the Pacific Southwest, the winter precipitation events in the years 2016 and 2018 are more frequent than in the other years.
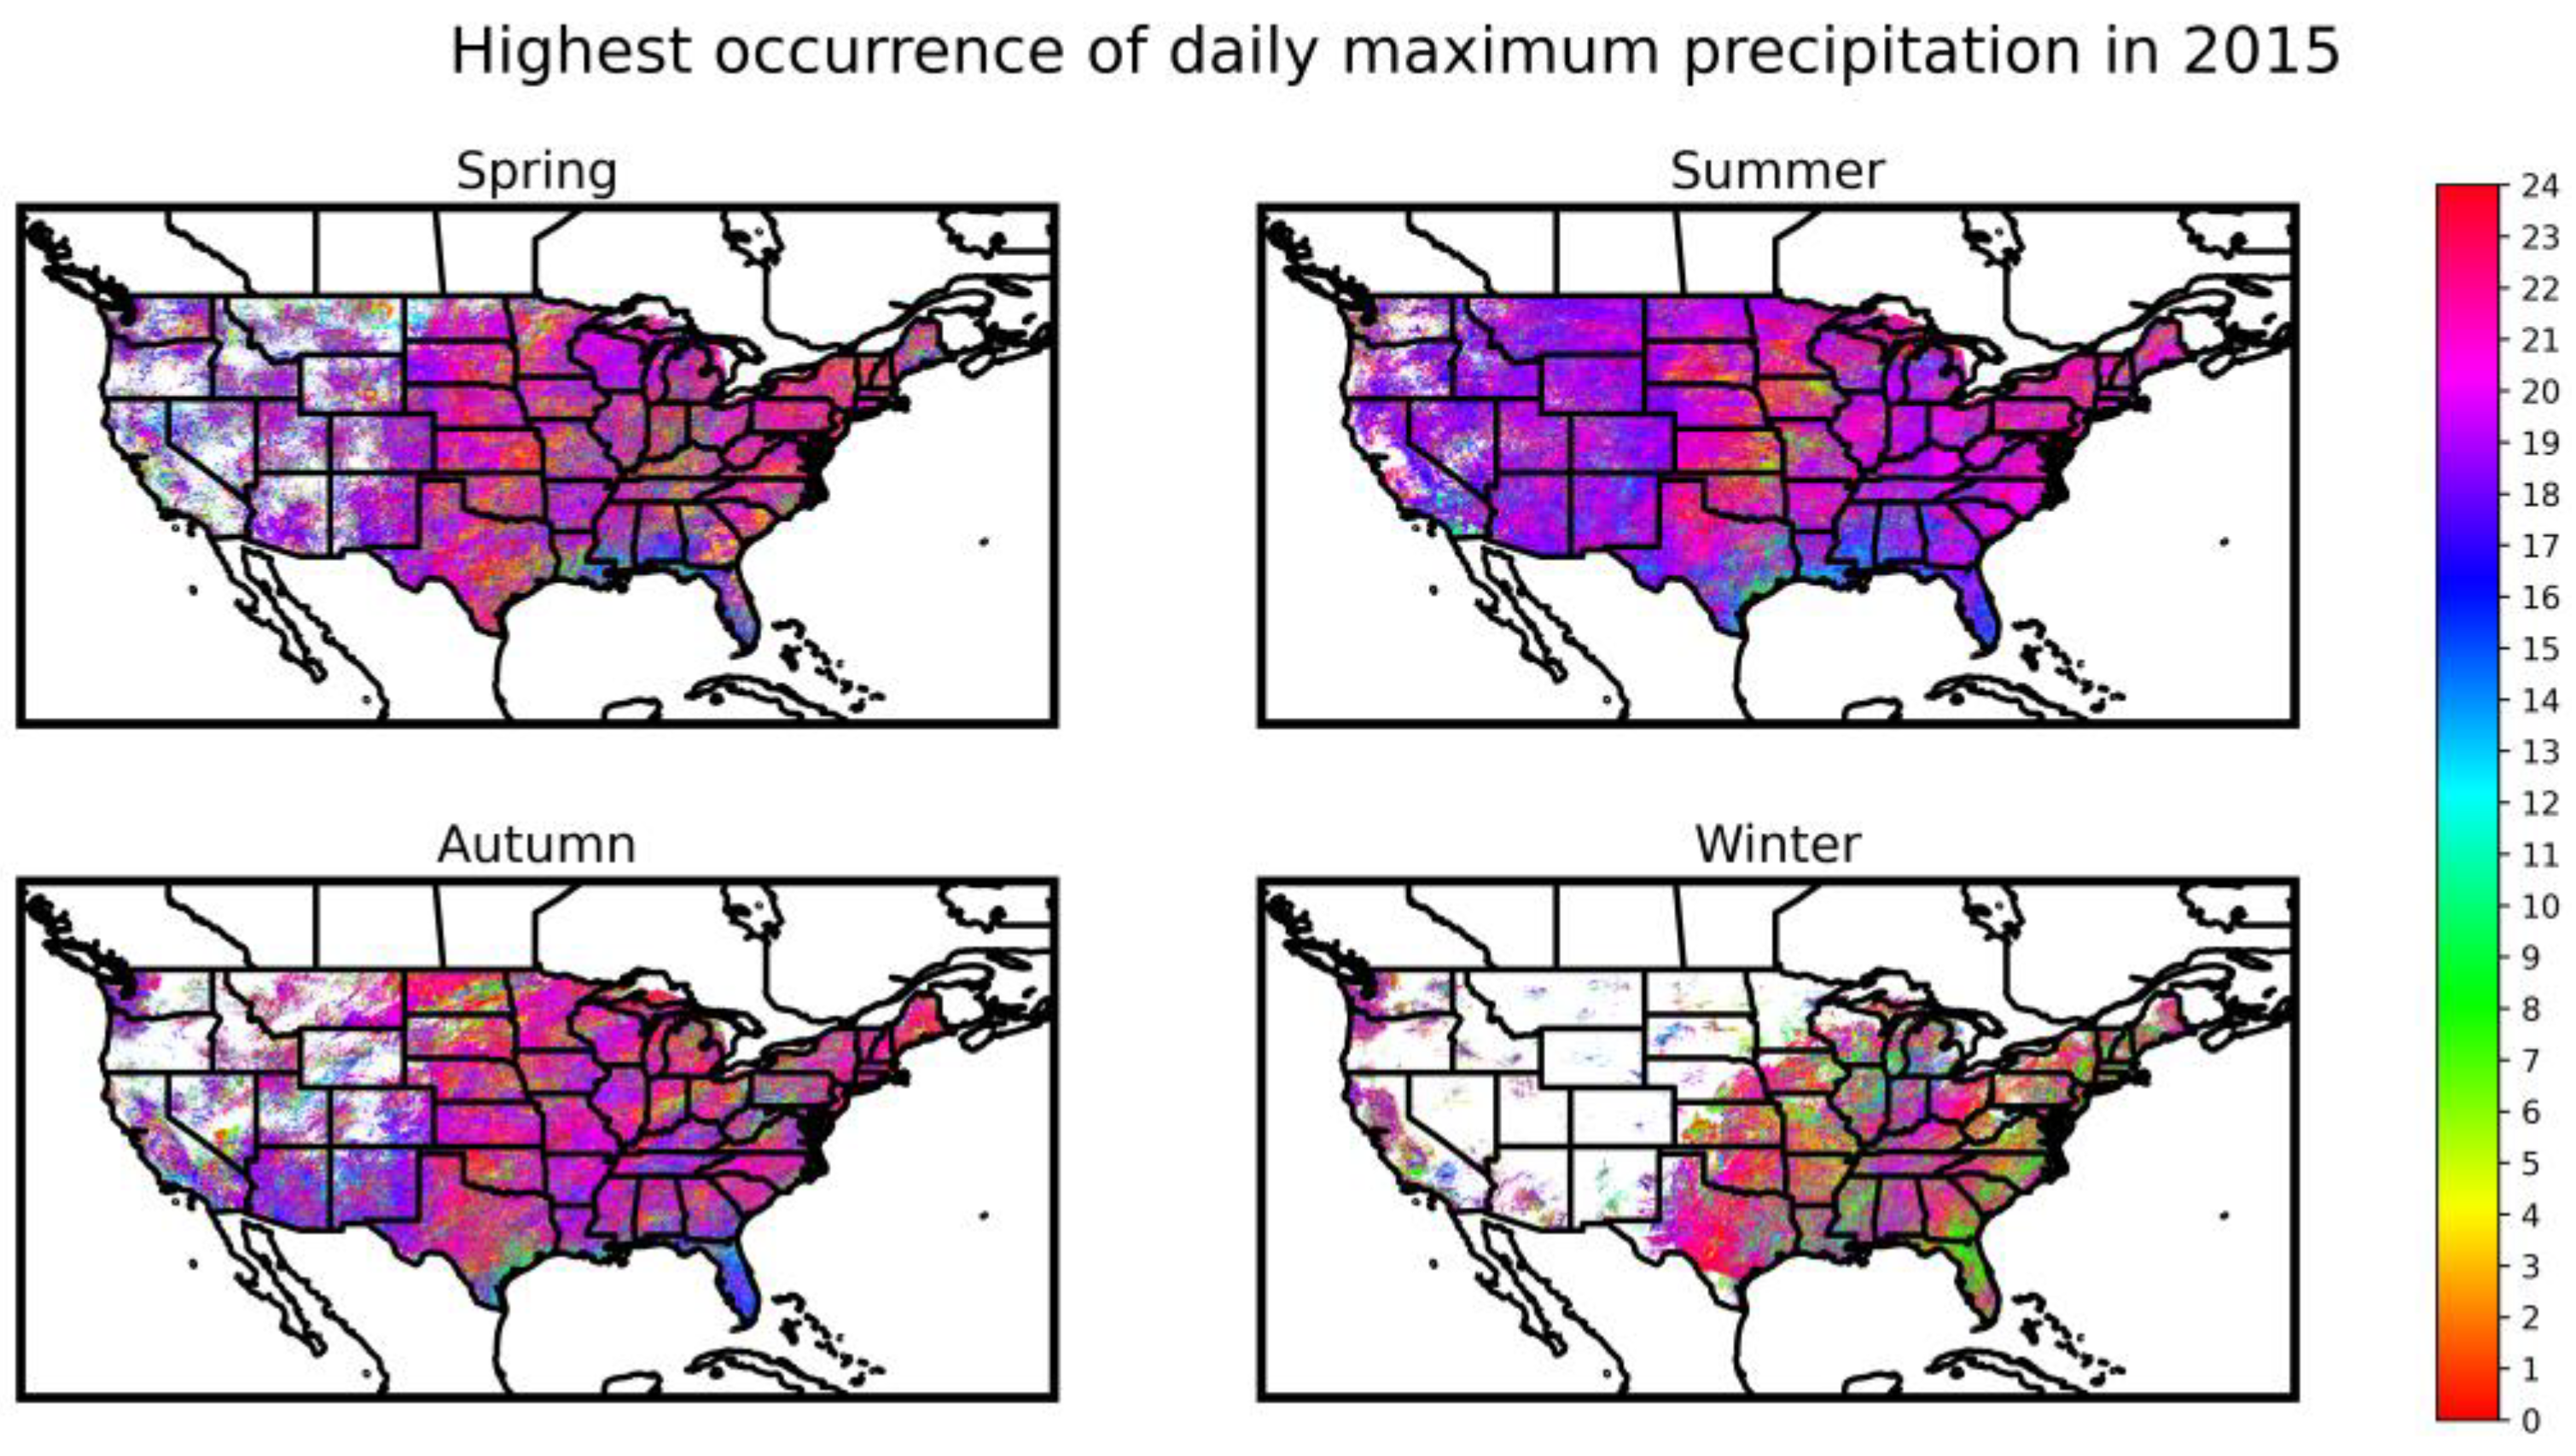
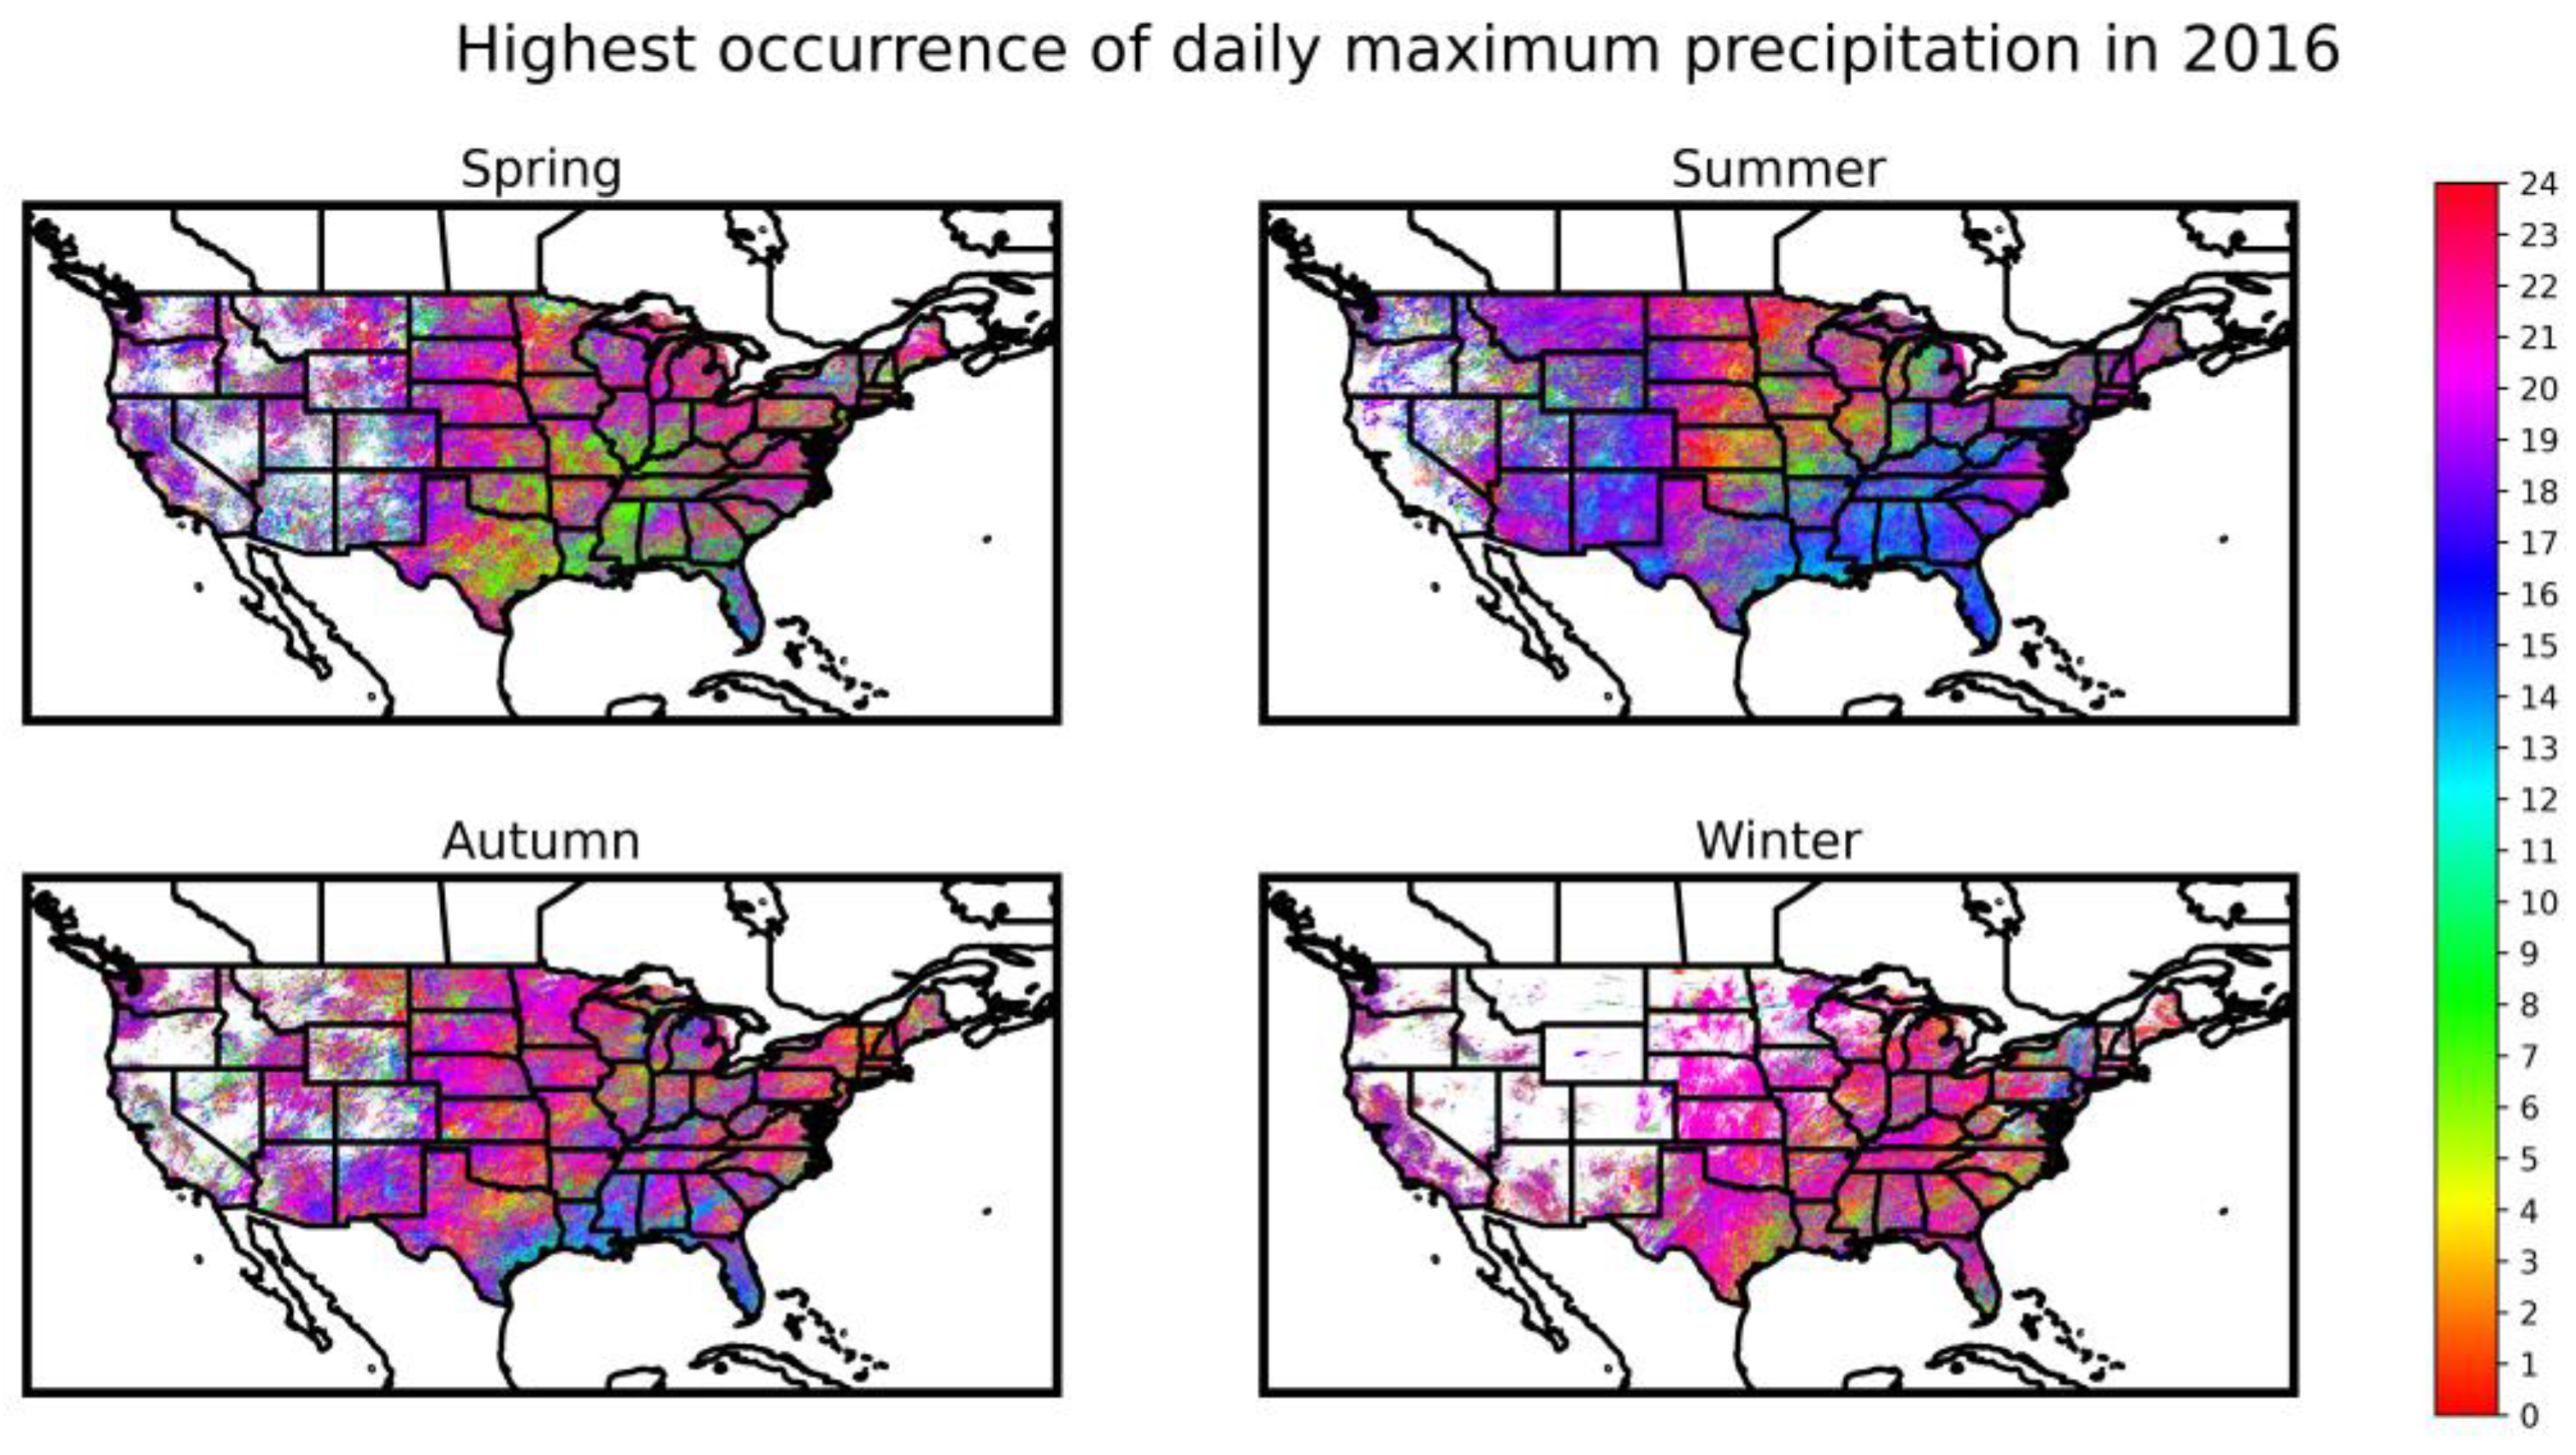
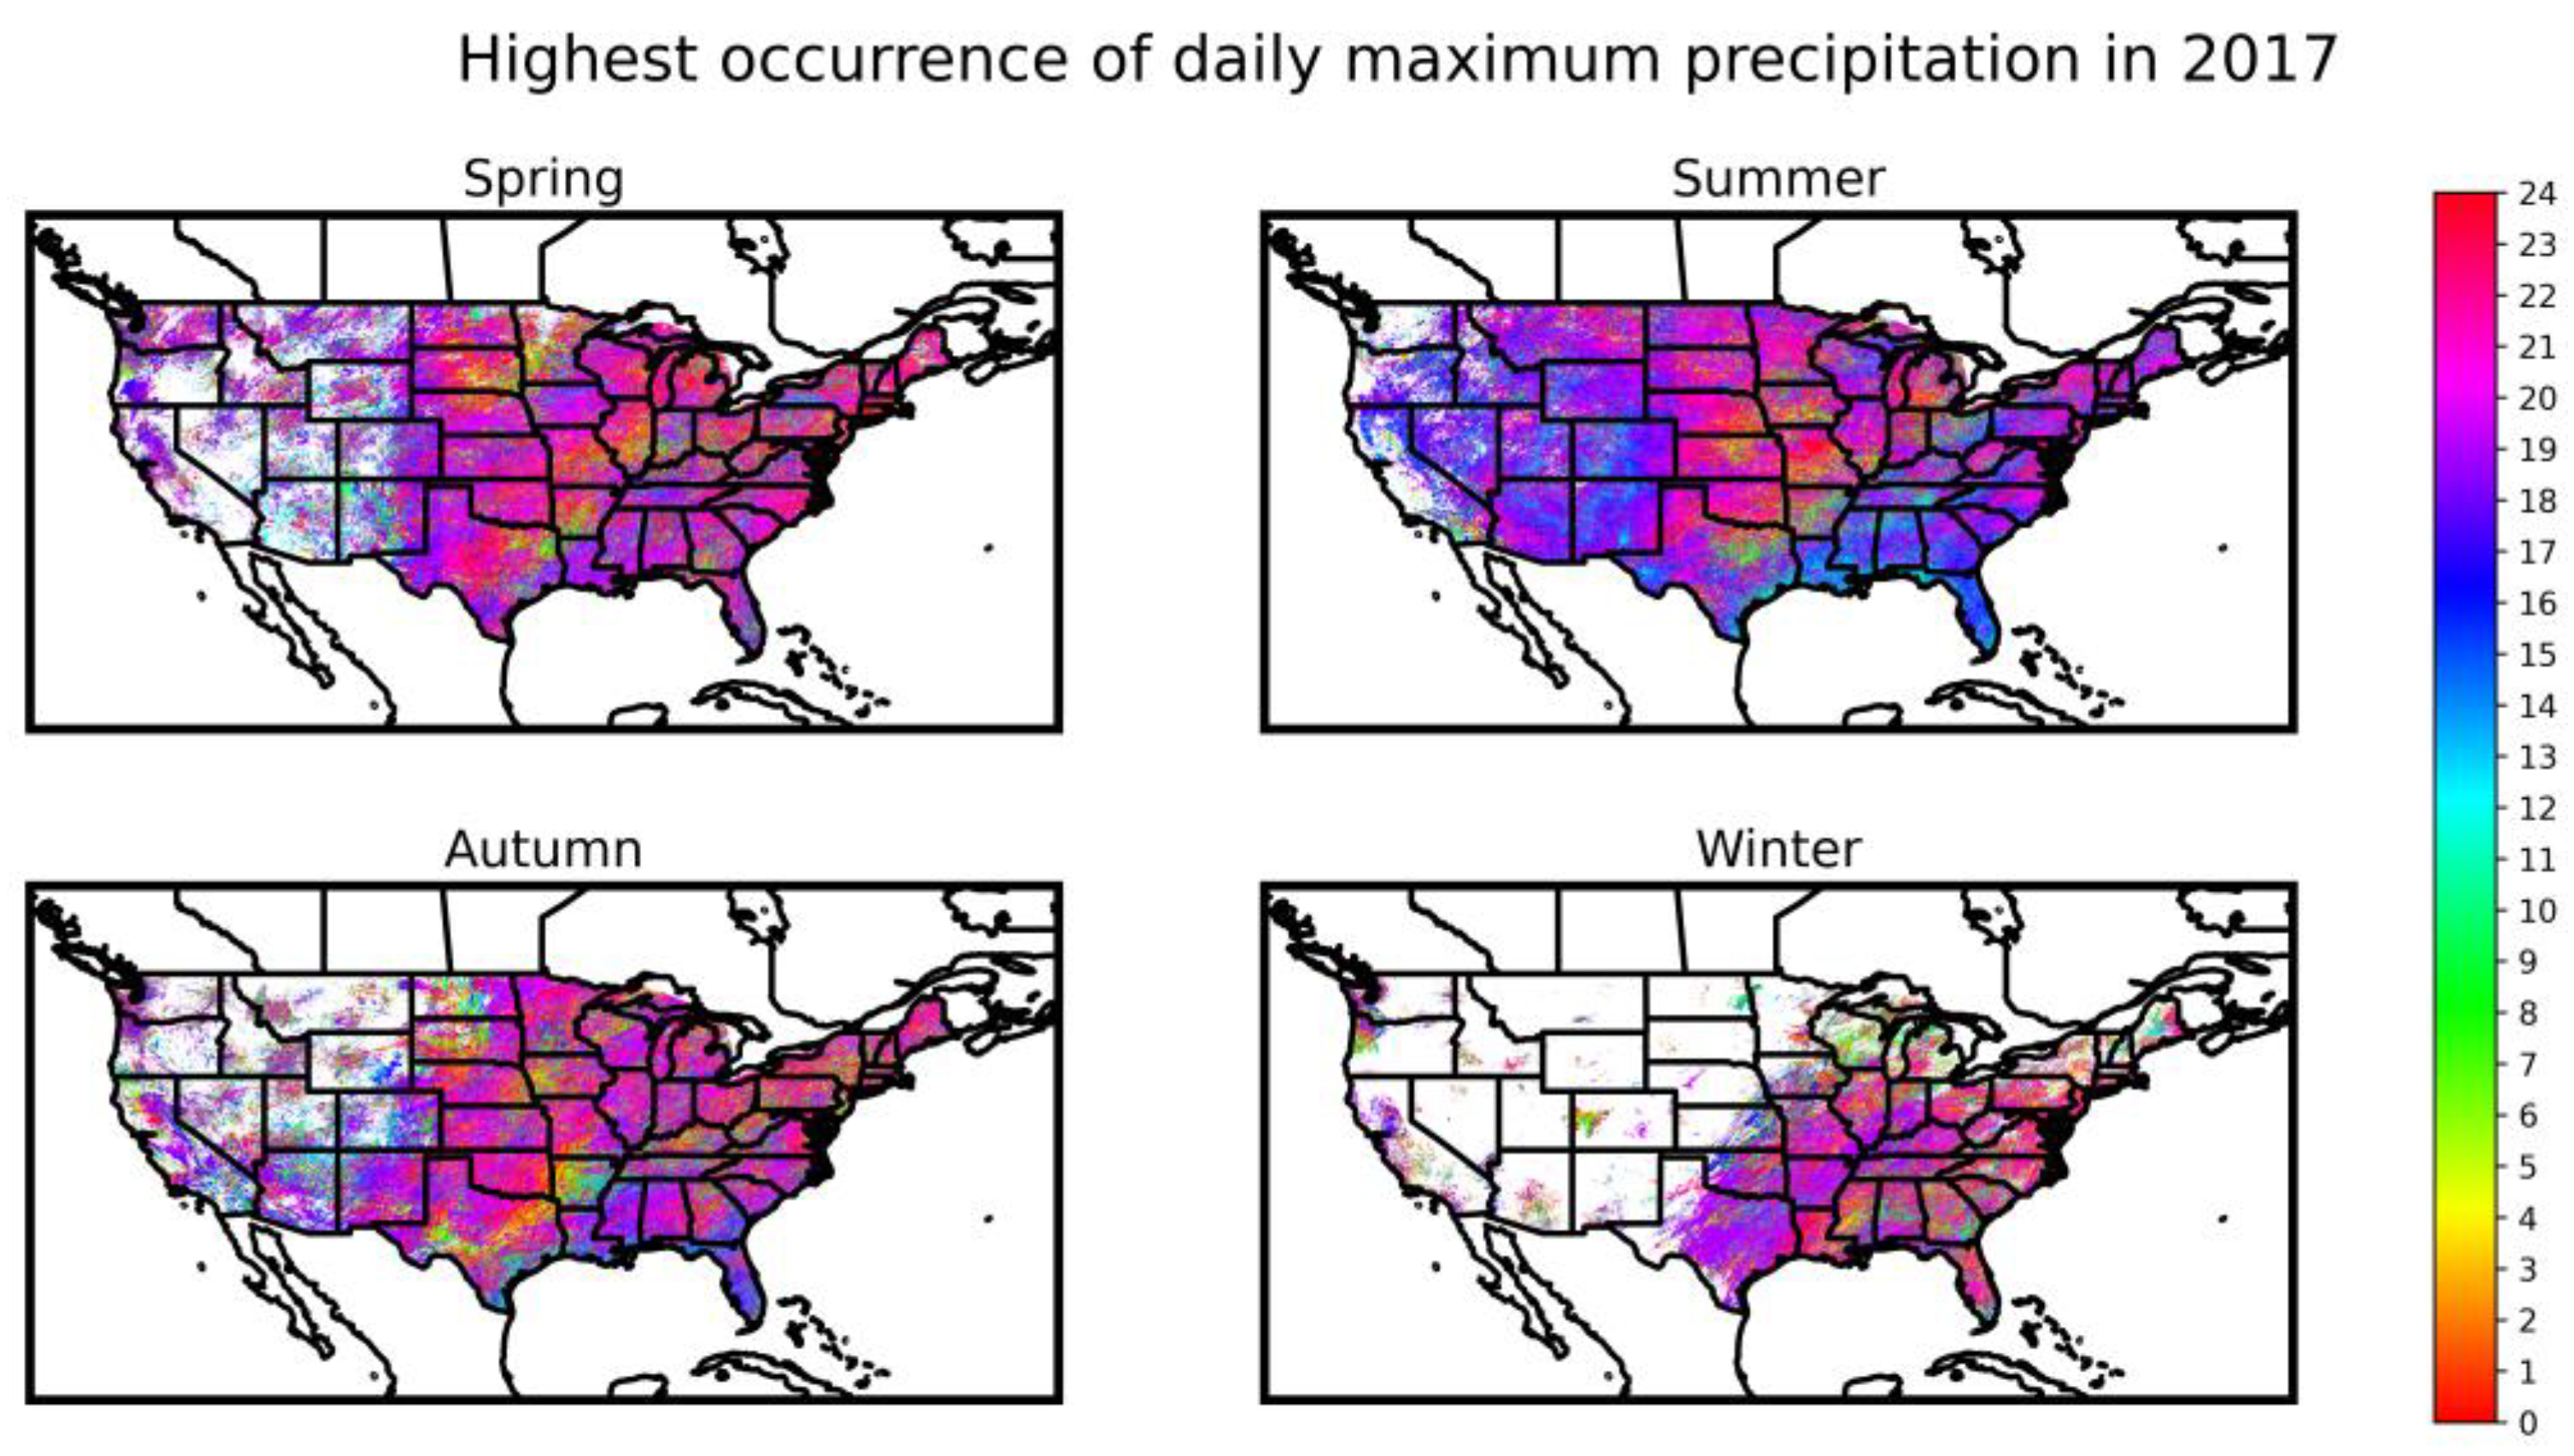
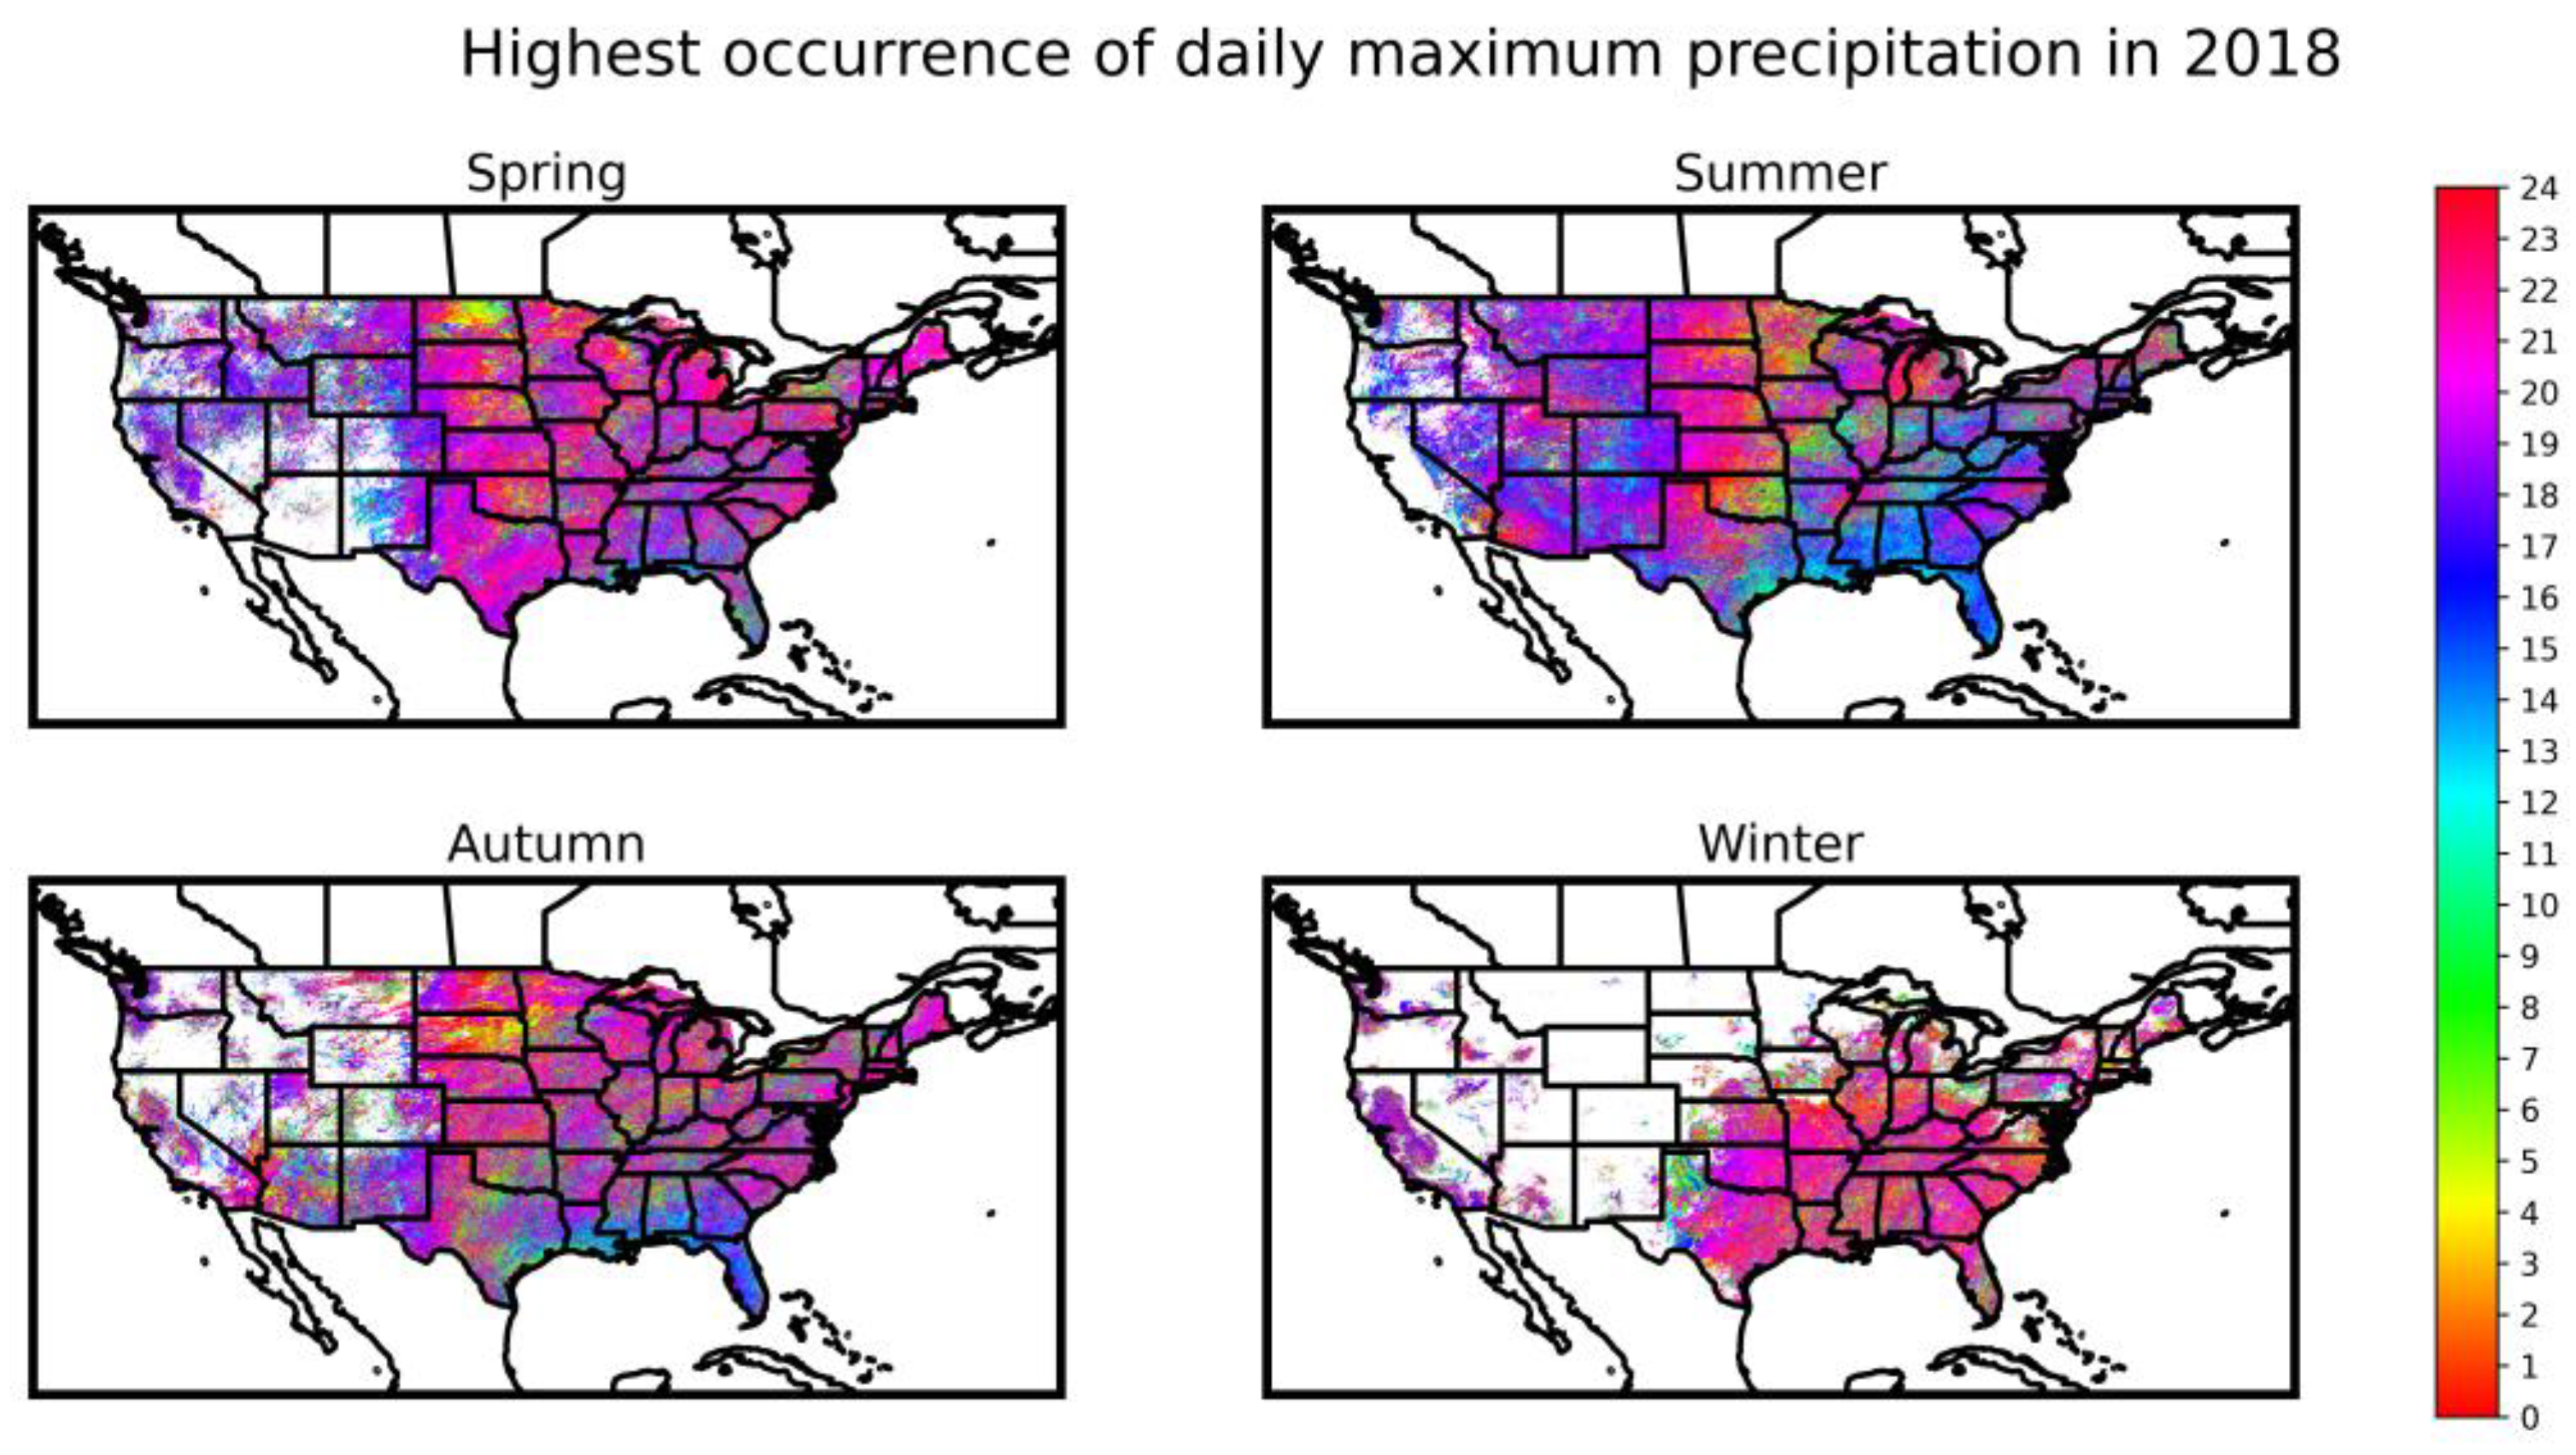
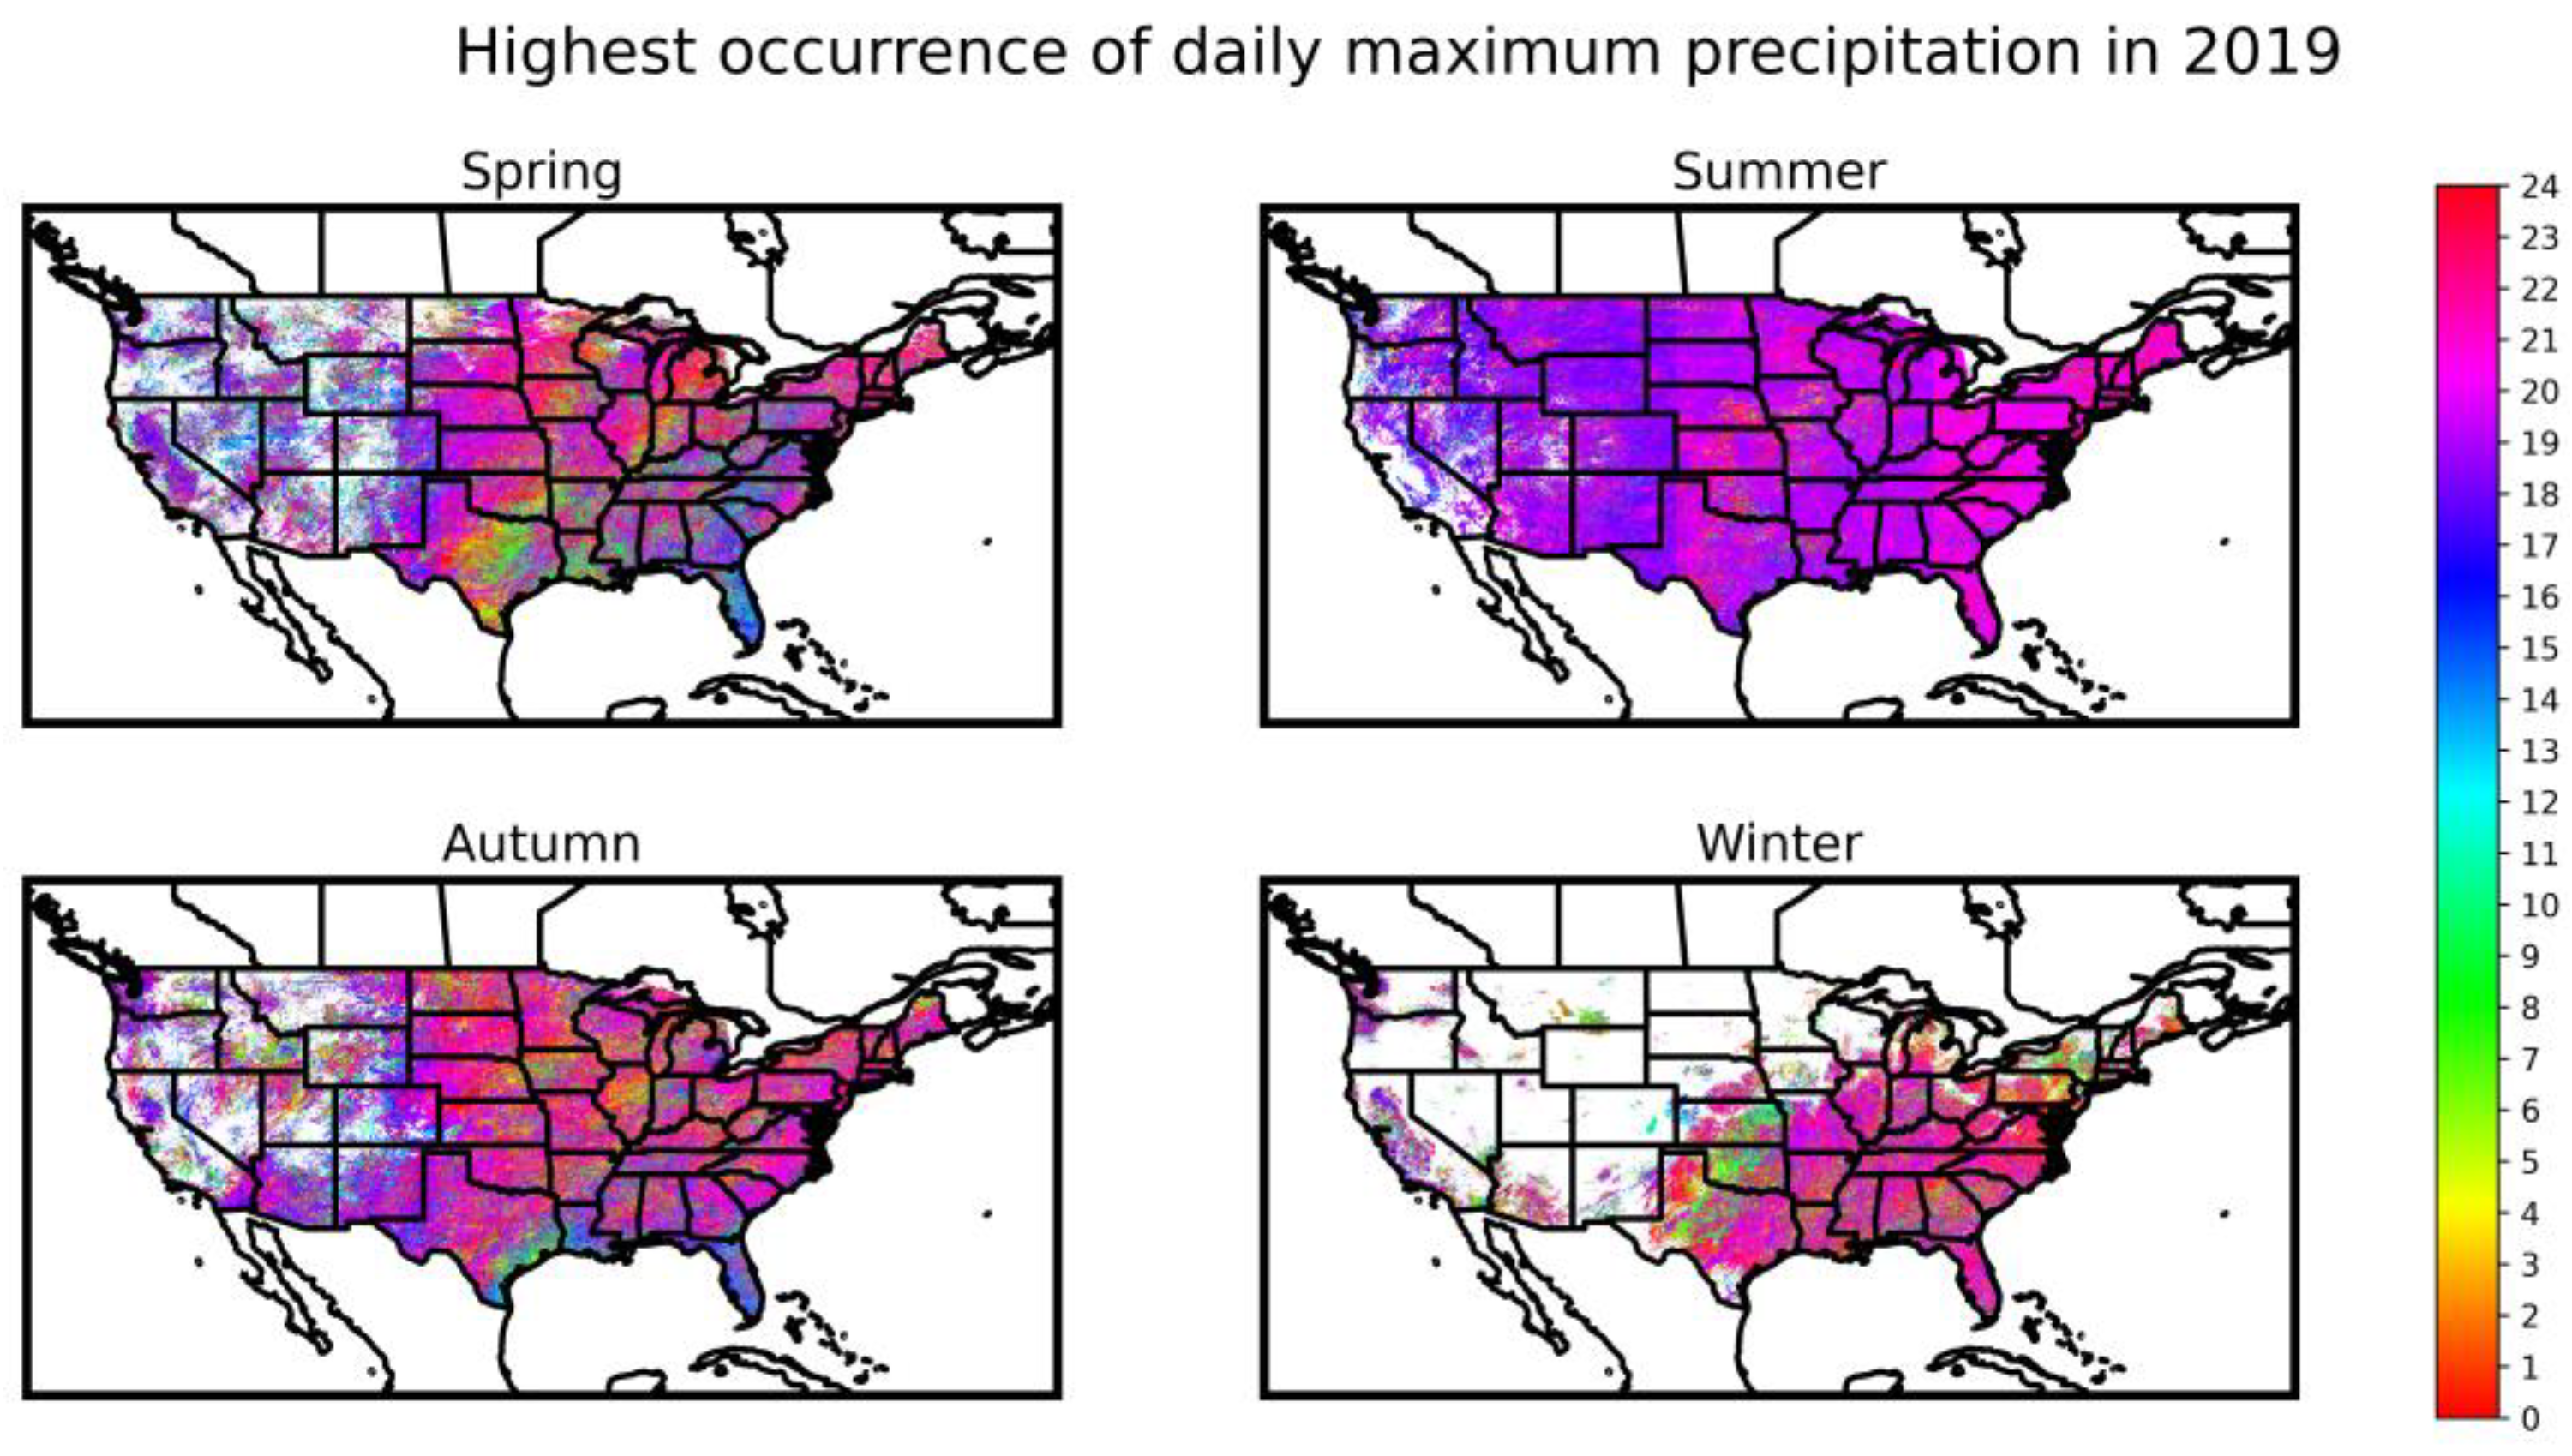
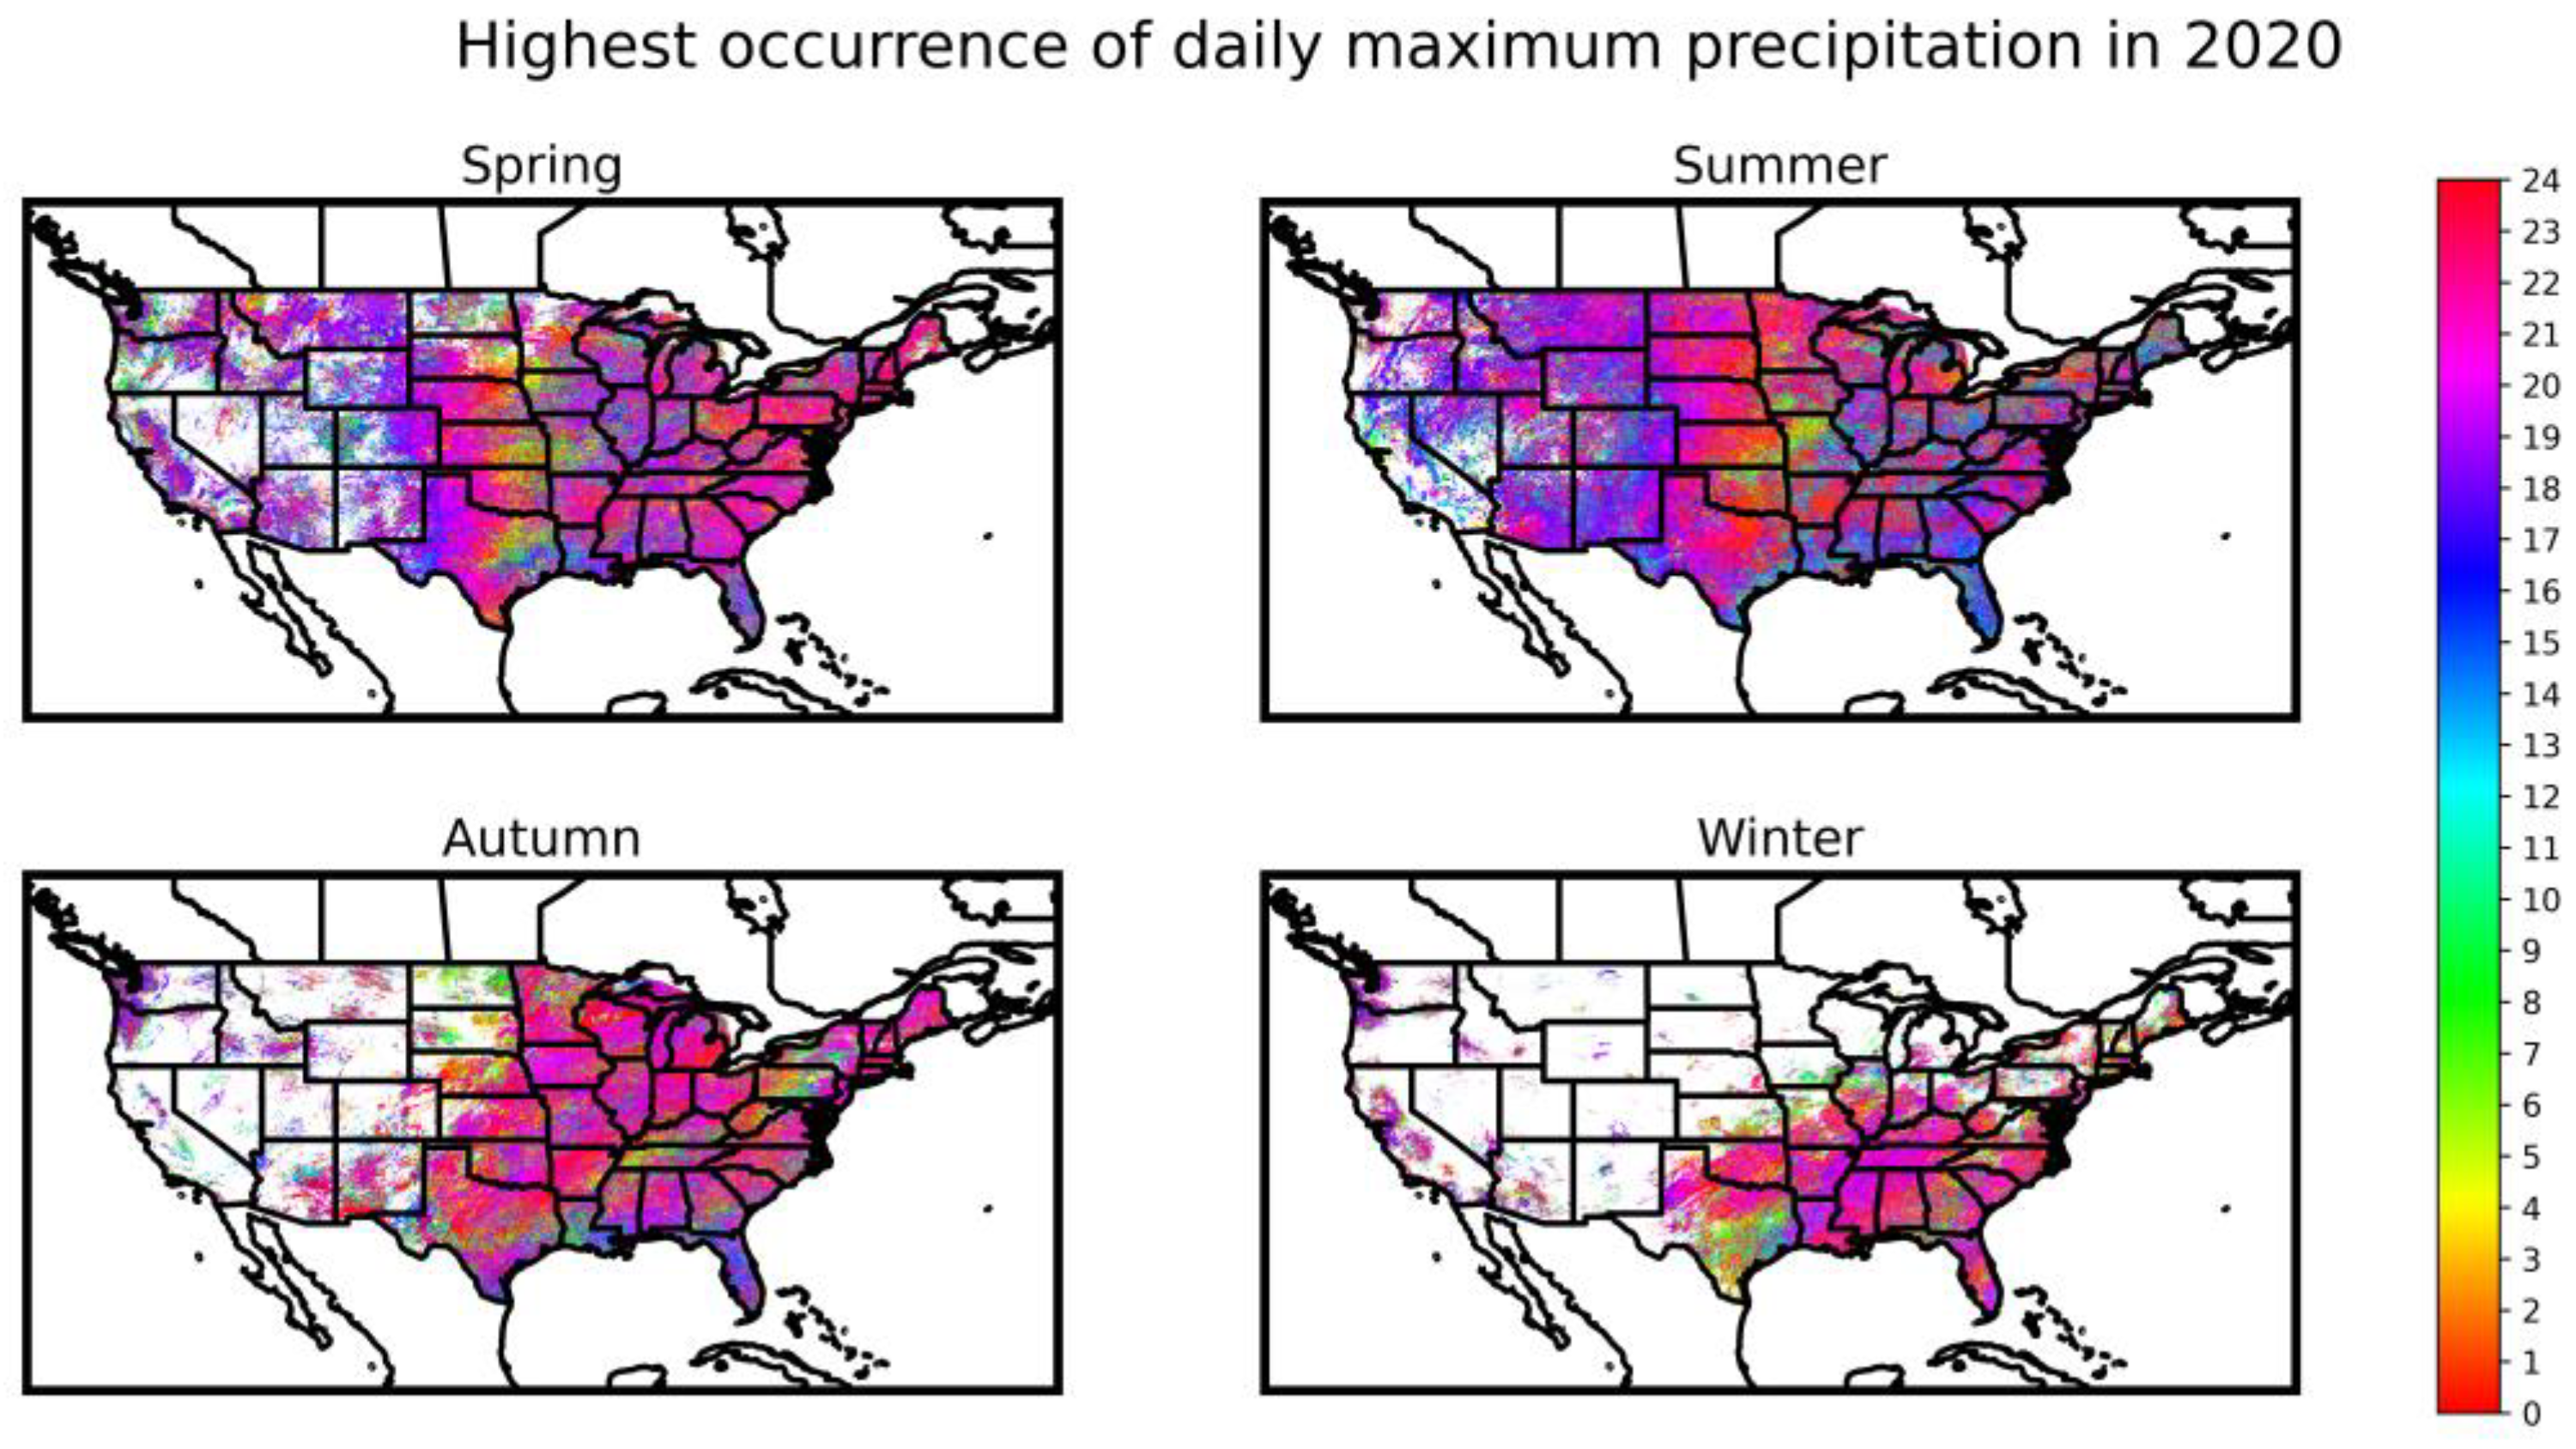
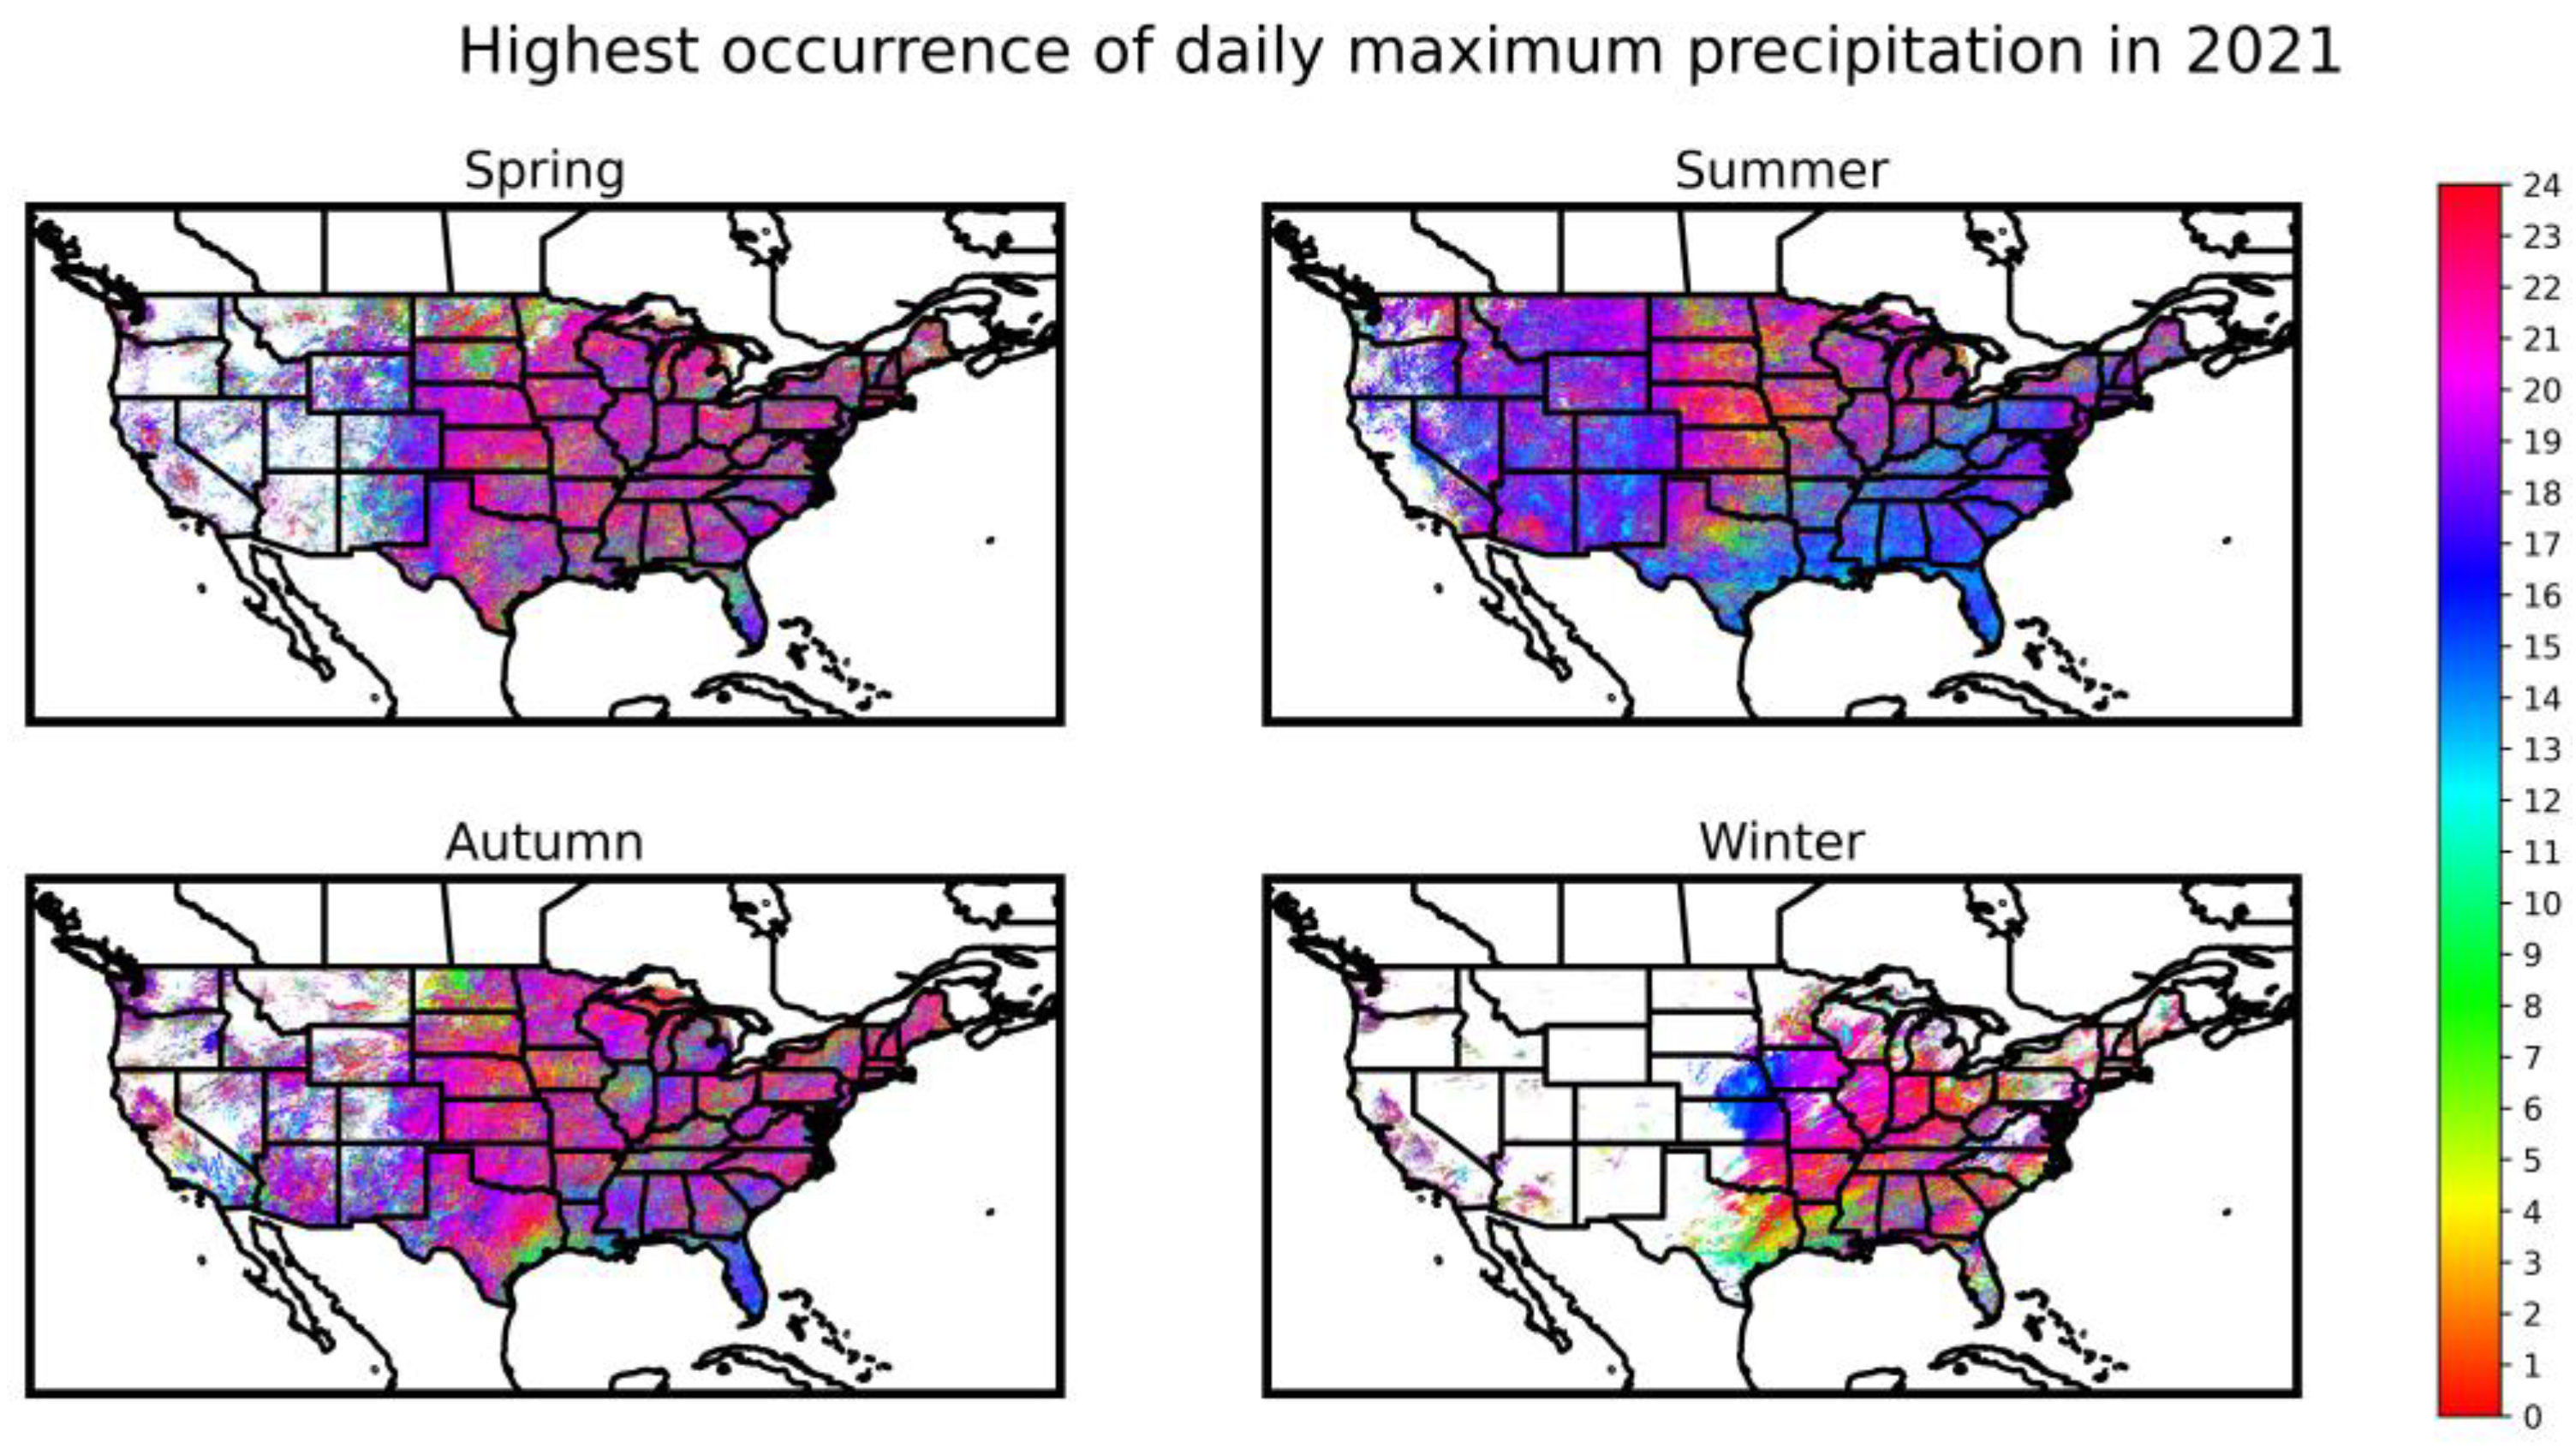
3.4. Timing of Daily Maximum Precipitation
The diurnal patterns of precipitation, characterized by the timing of daily maxima, exhibit strong regional and seasonal variations across the United States. This analysis examines these variations with a particular focus on regions such as the Southeast and the Gulf Coast, the Central U.S., and the West Coast. The results are displayed in
Figure 10,
Figure 11,
Figure 12,
Figure 13,
Figure 14,
Figure 15 and
Figure 16.
In the humid subtropical climates of Southeast and the Gulf Coast, daily precipitation peaks occur predominantly during the afternoon and evening hours, especially in summer. The diurnal trend can be attributed to the region’s convective precipitation mechanisms, influenced by a variety of factors, including local sea breeze. The pronounced solar heating during the day causes temperature differences between land and ocean, which drives moisture influx from adjacent bodies of water. This results in the observed precipitation peaks during these hours.
Conversely, in certain areas of the central United States, daily precipitation maxima exhibit both afternoon/evening and morning peaks during summer. This distinct diurnal pattern is multifaceted, with morning precipitation often associated with the passage of synoptic-scale meteorological systems, such as jet streams, cutoff lows, frontal boundaries, and upper-level disturbances. These features often initiate overnight precipitation events that persist into the morning and taper off as the day progresses. Thus, the morning precipitation maxima in these areas are largely influenced by the overlying synoptic patterns.
The West Coast presents a unique precipitation regime, particularly in its seasonal manifestation. This coastal region is predominantly characterized by increased precipitation during the winter months, a feature attributed to the influence of the Pacific Ocean and the role of atmospheric rivers. These are moisture corridors in the atmosphere that increase in frequency and intensity during the winter, facilitating increased moisture transfer from the Pacific to coastal areas. This surplus of atmospheric moisture increases the probability of winter precipitation events along the West Coast.
In essence, the timing of daily precipitation peaks is closely tied to regional and seasonal characteristics across the United States. The Southeast and the Gulf Coast regions experience a lot of afternoon and evening precipitation in the summer, while some central US regions manifest morning peaks. The West Coast, with its primary winter precipitation, highlights the importance of atmospheric rivers and Pacific moisture transport. Understanding these temporal variations is critical to refining precipitation forecasting and management across these diverse regions.
4. Discussion
This study examines radar reflectivity signals that are used for precipitation estimates through statistical relations such as Z-R relationships. In the following discussions, we interchangeably use precipitation and reflectivity values.
The MRMS has manifested itself as an important tool in assessing precipitation patterns and intensities. Yet, the application of MRMS bears uncertainties. Mountains, valleys, and other complex terrains can interfere with radar beams or create unwanted reflections. This is especially noticeable in regions such as the Rockies over CONUS, where intricate landscapes can generate false readings, making the data less reliable [
28]. Additionally, non-meteorological interferences from buildings, birds, aircraft, and other non-meteorological objects can introduce false echoes, distorting the overall reflectivity picture. The data for the Western Coast presented some intriguing but ambiguous trends. The limited convective days made the variations less pronounced. A more comprehensive analysis of precipitation in the Western Coast may require incorporating additional variables.
Regarding convective precipitation, the findings of our study align with general patterns identified in wider research spheres. The precipitation distribution patterns revealed in this research are comparable to the research of Li et al. [
29] using IMERG data. Notably, the observed rise in precipitation, particularly in the eastern US, agrees with [
30]. Our results also underscore a consistent uptick in both reflectivity magnitude and the number of convective days, corroborating with the observations made by Easterling et al. that point towards the heightened frequency and severity of heavy precipitation events across most of the US [
15]. The diurnal precipitation trends highlighted in our study are similar to those documented by Watters et al. and Zhu et al. [
31,
32]. Specifically, in the Central Plains, a concentration of maximum values during the morning to midday and peaks in the eastern US, predominantly in the afternoon and evening, align with the patterns we have discerned. The comparisons also show the importance of using high-resolution data. While previous research shows the pattern of precipitation, the use of high-resolution data in the research could reveal more spatial details. For example, we could view a finer structure of the distribution of precipitation maxima occurrence time than the coarser data.
Additionally, there are some other notable discrepancies. One interesting finding is the year 2020, which was an anomaly year in our data set. Contrary to the increasing trend in precipitation observed over the years, the year 2020 showed a relatively low precipitation amount. Given the widespread impact of the COVID-19 pandemic during this period, it is plausible that changes in human activities, such as significant reductions in industrial emissions and transportation, may have influenced atmospheric and meteorological conditions. This highlights the importance of considering external non-climatic influences when interpreting precipitation data.
In addition, our analysis identified region-specific variations that differed from broader patterns. Specifically, although the number of convective days increased in various parts of the US, some regions, such as the Southeast, did not show a corresponding increase in reflectivity. This suggests that while convective activity may be increasing, the intensity or structure of these events may not necessarily follow the same trajectory across regions.
These differences underscore the value of sub-hourly precipitation analysis. Relying solely on climate models or hourly precipitation estimates may miss these nuanced patterns and variations. By analyzing precipitation at the sub-hourly scale, we gain a deeper understanding of its dynamics, providing unique insights that can improve predictive models, contribute to our understanding of regional climate differences, and inform adaptive strategies in a changing climate.
In examining convective precipitation, different thresholds were applied to discern the broader trends in convective activity. Some noteworthy insights emerged. This study revealed consistent patterns of convective activity, irrespective of the threshold applied. This suggests a robust underlying trend of increased convective action over the observed period. Interestingly, as thresholds were raised, the increase in precipitation began to be weakened, meaning that high-end extreme precipitation is increasing less than low-end extremes. This could be indicative of a more complex climatological pattern that warrants further exploration.
This research, while offering substantial insights into CONUS precipitation patterns, also highlights areas where future work is necessary. Addressing the limitations of MRMS, including better algorithms to filter non-meteorological signals and improved terrain modeling, can enhance the quality of future studies. Further investigation into localized patterns, particularly in regions with complex topography or distinctive climatic conditions like the western US, would contribute to a nuanced understanding. Understanding the observed trends in convective precipitation can pave the way for improved climate models and weather forecasting. This research opens avenues for exploring how these patterns may evolve under different climate change scenarios. Future studies would benefit from a multidisciplinary approach, employing climatology, geography, and even social science. Bridging meteorology with other fields such as environmental science, urban planning, and public policy could lead to more actionable insights, leveraging the knowledge derived from precipitation patterns for societal benefit.
5. Conclusions
This research conducted a comprehensive analysis of precipitation patterns, changes, and distributions across the CONUS, evaluating reflectivity magnitudes, convective days, and timing of precipitation over different regions and seasons from 2015 to 2021. The results of our study provide important insights into the dynamic nature of precipitation patterns in the United States over this seven-year period from 2015 to 2021. The main findings are concluded as follows:
A variation in precipitation distribution was identified across the CONUS with the strongest reflectivity observed in the eastern parts, particularly in the Gulf Coast area and the Central Plains.
There was a general trend of increased reflectivity from 2015 to 2021 in most regions except 2020, with the eastern US acting as a focal point of heightened convective activity.
Diurnal precipitation patterns revealed that while Florida and the Gulf Coast regions experience peak afternoon and evening precipitation in summer, some central US regions exhibit both afternoon and morning peaks. The West Coast showed a distinctive increase in winter precipitation due to atmospheric rivers and Pacific moisture transport.
These findings have important implications for understanding and anticipating climate-related challenges in different regions and seasons, allowing for better planning and implementation of adaptation strategies. However, given the dynamic nature of weather and climate patterns, these results should be viewed as part of an ongoing investigation. Looking forward, it would be particularly beneficial to focus future studies on the potential factors influencing these changing precipitation patterns. Factors such as urbanization, climate change, and the frequency or intensity of hurricanes may play a significant role in these shifts. Urbanization, with its changes in land cover and local climate, can have significant effects on regional weather patterns, including precipitation. Similarly, the broader effects of climate change and the occurrence of extreme weather events such as hurricanes could be driving these trends. By investigating these and other possible drivers, we can gain a more comprehensive understanding of the underlying causes of these shifts in precipitation trends. This, in turn, would enable the development of more targeted and effective mitigation and adaptation strategies. Continued monitoring of these trends and further research into their potential impacts on various sectors, such as the environment, agriculture, and urban planning, are necessary to comprehensively understand our changing climate.


 ,
, 