Abstract
Floods in southwestern Saudi Arabia, especially in the Asir region, are among the major natural disasters caused by natural and human factors. In this region, flash floods that occur in the Wadi Hail Basin greatly affect human life and activities, damaging property, the built environment, infrastructure, landscapes, and facilities. A previous study carried out for the same basin has effectively revealed zones of flood risk using such an approach. However, the utilization of the HEC–HMS (Hydrologic Engineering Center–Hydrologic Modeling System) model and IMERG data for delineating areas prone to flash floods remain unexplored. In response to this advantage, this work primarily focused on flood generation assessment in the Wadi Hail Basin, one of the major basins in the region that is frequently prone to severe flash flood damage, from a single extreme rainfall event. We employed a fully physical-based, distributed hydrological model run with HEC–HMS software version 4.11 and Integrated Multi-satellite Retrievals of Global Precipitation Measurement (IMERG V.06) data, as well as other geo-environmental variables, to simulate the water flow within the Wadi Basin, and predict flash flood hazard. Discharge from the wadi and its sub-basins was predicted using 1 mm rainfall over an 8-h occurrence time. Significant peak discharge (3.6 m3/s) was found in eastern and southern upstream sub-basins and crossing points, rather than those downstream, due to their high-density drainage network (0.12) and CNs (88.4). Generally, four flood hazard levels were identified in the study basin: ‘low risk’, ‘moderate risk’, ‘high risk’, and ‘very high risk’. It was found that 43.8% of the total area of the Wadi Hail Basin is highly prone to flooding. Furthermore, medium- and low-hazard areas make up 4.5–11.2% of the total area, respectively. We found that the peak discharge value of sub-basin 11 (1.8 m3/s) covers 13.2% of the total Wadi Hail area; so, it poses more flood risk than other Wadi Hail sub-basins. The obtained results demonstrated the usefulness of the methods used to develop useful hydrological information in a region lacking ungagged data. This study will play a useful role in identifying the impact of extreme rainfall events on locations that may be susceptible to flash flooding, which will help authorities to develop flood management strategies, particularly in response to extreme events. The study results have potential and valuable policy implications for planners and decision-makers regarding infrastructural development and ensuring environmental stability. The study recommends further research to understand how flash flood hazards correlate with changes at different land use/cover (LULC) classes. This could refine flash flood hazards results and maximize its effectiveness.
1. Introduction
A flash flood, the most powerful of natural hazard events, is a transformative force that happens suddenly in a dry wadi (valley) bed [1] in arid and semi-arid areas owing to climate change and other environmental events. Although flash floods are still poorly understood in terms of prediction, management, and the procedures that lead to their initiation [2,3], this type of natural hazard is characterized by a rapid increase in water levels during a rainstorm, which occurs suddenly, with no warning, and quickly results in massive danger to life and extensive damage to property and infrastructure [4]. “Rain-induced flash floods are excessive water flow events that occur within a few hours (usually less than 6 h) of the triggering rainfall event, usually in mountainous areas or areas with extensive impermeable surfaces, such as urban areas” [5]. As the negative impact of flash floods on life, property, and infrastructure has been frequently emphasized in numerous pieces of scientific literature [2,3,6,7,8,9], this natural disturbance has also been induced to cause severe damage to property and infrastructure in many regions and cities within the Kingdom of Saudi Arabia, including the Asir region [2,6,7,8].
The Wadi Hail catchment area is an extreme example of this condition, where about 13% of the studied catchment is classified as extreme to high hazard level [2]. Furthermore, the interface between the occurrence of flash floods and the local topography is not easy to determine, and detailed meteorological and hydrological data are few or non-existent. Thus, there is a need for an approach that enables estimation of peak discharge, identification of sites susceptible to the threat of flash floods and avoidance of such loss, and reduction of the impact of these risks in rapidly developing countries.
Sophisticated methods exist to predict storm hydrography and their peak discharges, aiding in the prediction of locations sensitive to flash flood risk [2,6,10]. However, such techniques would not be suitable for a region where the topography is highly variable and complex. A physically-based, distributed-parameter hydrologic model [7,8] has been used to simulate a flood event to obtain a prediction of flood occurrence. In another study, a one-dimensional hydrodynamic model or combined models were also used for flood hazard mapping [1]. Nevertheless, these techniques either require complex and expensive equipment, which limits their repetition and cannot be easily applied, or are only suitable for river channels and other types of floodplains. The watershed modeling system and the Gridded Surface Subsurface Hydrologic Analysis (GSSHA) model have been used to simulate a storm event in three wadis located in the United Arab Emirates, and the models were run with IMERG products [11], but this model requires uniform rainfall distribution over the inland watershed. A hydrological modeling approach, supported by data extracted from the digital elevation model (DEM) of the Shuttle Radar Topography Mission (SRTM), LULC, and soil properties, to predict or identify sites at risk of flood inundation by understanding surface characteristics as well as runoff through modeled hydrographs, has also been used as one of the successful models that provide satisfactory results [3]. A subsequent study documented the usefulness of the physically-based, distributed hydrologic model to accurately estimate peak discharge for a mountainous catchment located in Makkah Province in Saudi Arabia [7]; however, it underestimated rainfall and resulted in an augmented underestimation of the surface runoff. In other research, the flash flood vulnerability of the Kebena watershed in Addis Ababa has been mapped by utilizing a variety of techniques including “Principal Component Analysis (PCA)”, “Biophysical Composition Index (BCI)”, “Normalized Difference Vegetation Index (NDVI)”, and “fuzzy overlay analysis”, indicating that integrating geospatial with statistical methods is considered a powerful approach to flood monitoring [12].
Researchers are continuously developing new models to optimize flash flood hazard prediction, incorporating a wider range of factors and using advanced modeling techniques. Here are some noteworthy examples: Maneechot et al. [13] examined the performance of post-processing approaches based on interpolation and bias correction methods, and d4PDF data for simulating extreme flood events in the Chao Phraya River Basin. The study showed the utility of such a technique for assessing events that relate to climate change, such as flood event simulation. Usman et al. [14] leveraged a modified version of semi-distributed, conceptual hydrological model HBV (Hydrologiska Byrans Vattenbalansav delning) known as HBV-light for streamflow prediction in two sub-catchments in Pakistan, using eight different precipitation products. Their approach showed that the APHRODITE product performed well in simulating observed streamflow. However, these approaches were used with long-term continuous rainfall records, characterized by high temporal and spatial resolutions. Adnan et al. [15] tested the capability of four machine learning frameworks, including optimal pruning extreme learning (OPELM), multivariate adaptive regression spline (MARS), M5 model tree, and hybridized MARS and Kmeans algorithm (MARS-Kmeans), for rainfall-runoff prediction, considering hourly rainfall-runoff modeling. He et al. [16] proposed a hybrid model based on variational mode decomposition (VMD) and deep neural network (DNN) for daily runoff forecasting, and they achieved satisfactory results.
Some investigations have proposed that a combination of conceptual prediction models with machine learning methods will improve flood simulation and flood prediction, thereby enhancing the identification of areas at high risk from floods [17,18,19,20]. The snow module as a conceptual model was combined with machine learning modeling approaches, such as wavelet-based support vector regression (WSVR) and wavelet-based multivariate adaptive regression spline (WMARS), to model daily stormwater runoff in a Karst Ljubljanica catchment in Slovenia [17]. They reported that the proposed machine learning models provided unexpected results compared to the conceptual model. Other work, however, has found that coupling neural networks and numerical models is a reliable approach that can simulate and identify areas at high risk of urban flooding and has the ability to quickly predict the depth of water accumulation in an area [20]. Motta et al. [19] proposed a hybrid approach to urban flood forecasting using machine learning and GIS and obtained promising results with limited data. In their framework, random forest was the most accurate model with a sensitivity of about 84%. Mani et al. [18] reported that hybrid model integration including the process-based hydrological model (PHM) and data-driven model (DD) would yield satisfactory results when used for streamflow simulation.
Overall, most of these investigations together indicate that flash flood risks can be modeled and locations sensitive to this type of flood can be predicted using a variety of techniques based on remote sensing data and GIS techniques. Moreover, based on some of these studies, the combination of conceptual prediction models and machine learning methods is considered the optimum framework for simulating streamflow and predicting sites that are at risk of flooding.
The determination of locations sensitive to flash floods by integrating the capability of remotely sensed data, GIS tools, and hydrological and/or hydraulic models can provide insights into whether a given rainstorm event will cause a natural hazard, mainly in arid and semi-arid regions, including the study site. However, comprehensive information about the procedures leading to flash floods in the study site remains unclear. This may be due to the non-existence of hydrological and rainfall data, thus highlighting a particular need for designing a hydrological model, incorporating the capability of remote sensing and GIS techniques, to predict locations susceptible to flash flood risks. A few studies have used such an approach to predict locations sensitive to flash flooding in this wadi [2]. However, no study, to our knowledge, has examined the use of the HEC–HMS model and IMERG precipitation data to predict locations susceptible to flash floods in this region. Moreover, the feasibility of utilizing the proposed approach and data to assess flash flood generation has yet to be thoroughly investigated in this region.
Therefore, this work mainly aims to introduce an effective approach for assessing flash flood occurrence in the Wadi Hail Basin, utilizing the HEC–HMS model integrated with IMERG precipitation product. The specific objectives of this study are to (1) depict the Wadi Hail flood response to specific rainstorm event by integrating remote sensing and GIS techniques with hydrological and hydraulic models, and (2) to identify flash flood hazard within the wadi basin. Our hypothesis is centered on the potential of a GIS modeling-based method to identify areas within the Wadi Hail Basin susceptible to flash flood risk. A better understanding of the behavior of this basin will help in predicting the consequences of flash floods regionally, setting up conservation plans, and improving disaster response efforts in the study region during a rainstorm event.
2. Study Area
The research area is in the Wadi Hail Basin (5148.70 square kilometers), one of the largest valleys in Saudi Arabia. It is located geographically in the south-western section of Asir province, Saudi Arabia, as shown in Figure 1. Its location lies within the latitudinal range of 18°13′44.36″–19°2′55.39″ N and the longitudinal range of 41°21′18.07″–42°29′47.28″ E, a distance of about 141 km. This area is largely composed of basalt rocks [2]. The main city in the area is Muhayil, located in the center of the wadi catchment. The area is characterized by mountains, and its elevation ranges between 3 and 2993 m above sea level (m a.s.l.) (Figure 2a), with an average slope of 14.9° (Figure 2b). The highest point consists of the Sawda and Thirban mountains. Directly to the northeast of this wadi is Wadi Tabablah; in the western part is the Yiba Basin; and in the south is the Habawnah Basin [21]. The flow direction of the Habawnah and Yiba wadis is from east to west where they drain toward the Red Sea, whereas Wadi Tabalah flows from the west to the east.
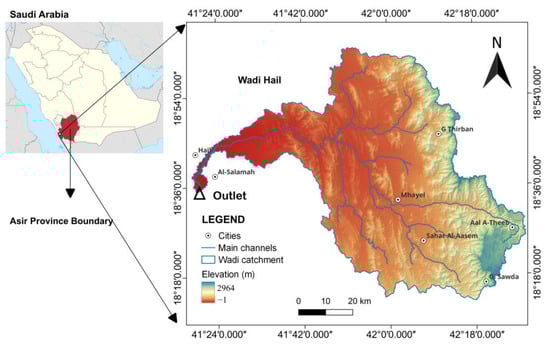
Figure 1.
Overview of the study region: on the left side is a map of Saudi Arabia while on the right side is the study site location (Wadi Hail), which is located in Asir Province.
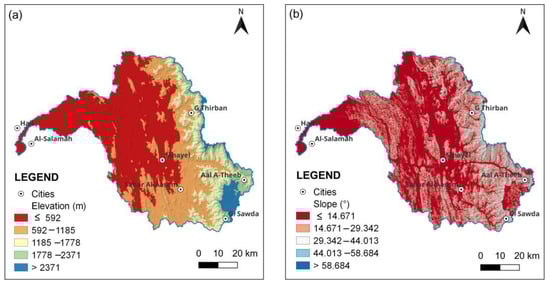
Figure 2.
Topographic characteristics of Wadi Hail, where (a) is the surface elevation (m) and (b) is the slope (degrees).
From a climatic point of view, the rainfall in the region is highly variable. The rainy season is from November to April, where the average annual rainfall ranges between 400–700 mm/y [22]. The return period of the highest precipitation ranges from 2 to 200 years [14], which is highly variable. Figure 3 shows the average rainfall from 2002 to 2020, where most of the basin is located in the humid region. For more information about the rainfall system in this region, readers can refer to the studies conducted by Sulaiman et al. [22] and Helmi et al. [23].
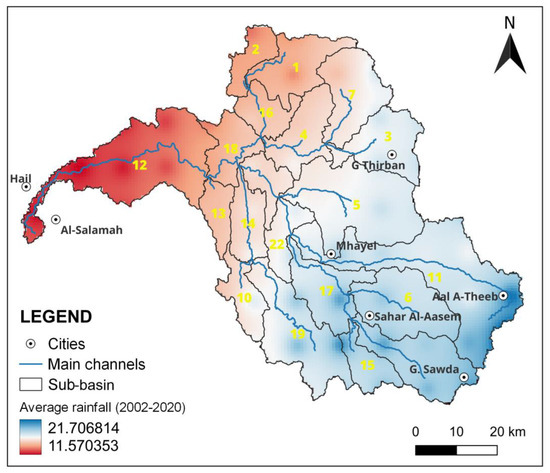
Figure 3.
Average annual rainfall regime in the wadi catchment. This was interpolated from data obtained from the Precipitation Measurement Mission (PMM) website (http://pmm.nasa.gov/data-access/download/gpm, accessed on 22 November 2023). The numbers show the sub-basins ID, according to the HEC-HMS model output.
3. Data and Methods
One of the difficulties that always hinders hydrologic modeling is the lack of hydrological data [3], especially in developing countries where this type of data lack convenient facilities. The lack of hydrological data for the Wadi Hail Basin makes it necessary to adapt modeling techniques to simulate the behavior of the basin during flash floods and the changing aspects of runoff as a result of rainfall. These modeling techniques rely on many factors, including LULC and topographic variables that can be established using remotely sensed data, and capabilities of GIS software. Here, a fully physical-based, distributed hydrological model run with HEC–HMS, one of the well-known systems used for simulating flood and surface runoff based on precipitation event, was used to generate flood hydrographs for the main outlet and the wadi sub-basins [9]. For more details about the HEC–HMS model, readers are referred to Al-Areeq et al. [7].
All basin and sub-basin characteristics and parameters, including the wadi stream network, were extracted using GIS tools available in the HEC–HMS model. For this purpose, we used a digital elevation model (DEM) of the Shuttle Radar Topographic Mission (SRTM) with a spatial resolution of 30 m, obtained freely from the open access Earth Explorer platform of the US Geological Survey (USGS) (http://earthexplorar.usgs.gov/, accessed on 30 September 2023). Several datasets were also used alongside the DEM, including: Landsat-8 and 9 images (OLI), downloaded free from the open access Earth Explorer platform of the US Geological Survey (USGS) (http://earthexplorar.usgs.gov/, accessed on 12 October 2023), and acquired on 7 April 2022 and 6 April 2022, respectively (acquired as cloud-free; all the images were acquired as level 1); geological data were freely downloaded from the USGS Global Oil and Gas Resources Assessment website (https://certmapper.cr.usgs.gov/, accessed on 21 October 2023) and soil data were obtained from the Food and Agricultural Organization of the United Nations (FAO) (https://www.fao.org/soils-portal/data-hub/, accessed on 11 November 2023) at a spatial resolution of 30 arcsecond; and IMERG data (early, late, and final—here we used only the final data), which were obtained from the Precipitation Measurement Mission (PMM) website (http://pmm.nasa.gov/data-access/download/gpm, accessed on 22 November 2023). The IMERG output has a spatial resolution of 0.1° × 0.1° and temporal resolution of 30 min. For more details about the IMERG products, we refer the readers to Hamouda et al. [11] and Mahmoud et al. [24]. A simplified flowchart of our data and used methodology is shown in Figure 4.
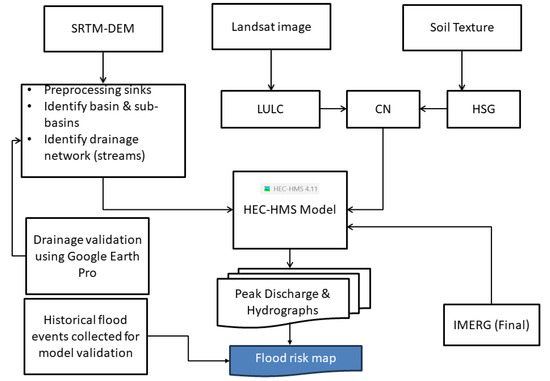
Figure 4.
A simplified flowchart of the adopted methodology of HEC–HMS model.
Data about historical flash flood events were collected from local newspapers and news agencies reports, namely, Alwatan (Arabic; https://www.alwatan.com.sa (accessed on 18 May 2024), Aljazeera (Arabic; https://www.aljazeera.net/news (accessed on 19 May 2024), Al-Arabiya (Arabic; https://www.alarabiya.net/saudi-today (accessed on 19 May 2024), and Al-madina (Arabic; https://www.al-madina.com (accessed on 20 May 2024). The longitude and latitude of these events were determined through Google Maps. These data will be used to validate the flood risk map generated by the HEC–HMS model.
3.1. Hydrologic Simulation Model
Data on LULC, soil texture, and surface topography are needed to simulate the rainfall runoff processes, utilizing the HEC–HMS model, as previously described by Foody et al. [9]. Accordingly, the LULC data were provided by classifying the obtained Landsat images into six classes (Figure 5a,b) with accuracy estimated to be 93%, after image pre-processing application, using the commonly used maximum likelihood classification algorithm [25] within the ENVI 4.8 software environment.
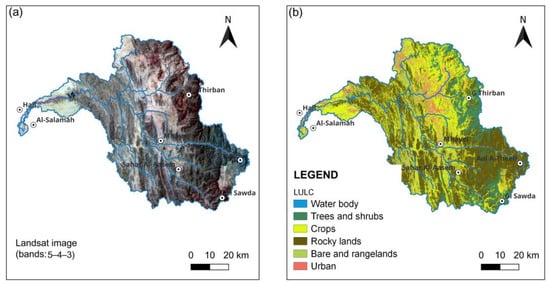
Figure 5.
(a) Landsat imagery (bands 5, 4, & 3), (b) LULC of the wadi basin.
Image pre-processing was achieved through the use of the semi-automatic classification plugin (SCP) [26] in QGIS software v 3.18. Therein, the sensor’s pixel values were transformed into at-surface spectral reflectance; next, one image covering the study site was constructed using mosaicking techniques; then, a subscene covering the wadi basin, depicted in Figure 1, was identified and clipped out from the mosaicked images. The accuracy of the obtained LULC map was measured by using a random sample design of 100 points. The actual land cover category of these points was obtained from high-resolution Google Earth Pro satellite imagery; using these data, a confusion error matrix was designed to compute the overall precision of the obtained land cover map.
To define the drainage basin, sub-basins, and their corresponding drainage channels, we used 1 arcsecond SRTM-DEM (~30 m resolutions) with a vertical accuracy of 16 m (Figure 6a). Then, after filling the surface sinks within the DEM, the stream network was delineated—using a threshold of 100 cells—based on the 8D flow direction algorithm [27,28] (Figure 6b). The derived drainage network underwent a meticulous validation process to ensure its accuracy. High-resolution satellite imagery obtained from Google Earth Pro served as the reference data for this validation. The comparison revealed excellent agreement between the derived network and the imagery, bolstering our confidence in its fidelity to the basin’s morphology. Subsequently, all pertinent basin and sub-basin characteristics, including channel slope, longest flow path, and relief ratio, were meticulously extracted to parameterize the hydrologic model.
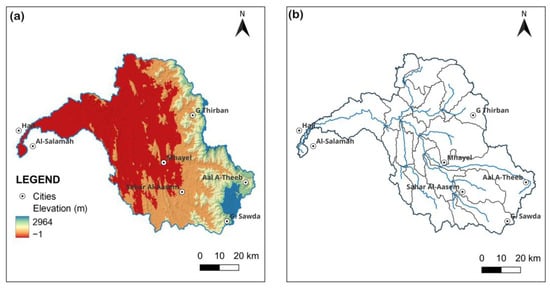
Figure 6.
(a) SRTM-DEM and (b) delineated drainage network (blue lines) using 8D flow direction algorithm.
We used soil texture data from the “Harmonized World Soil Database version 1.2” to prepare the final soil texture map (Figure 7a) for the wadi basin, identified using QGIS 3.18 software. To prepare the geological map of the study site (Figure 7b), USGS geological data were utilized.
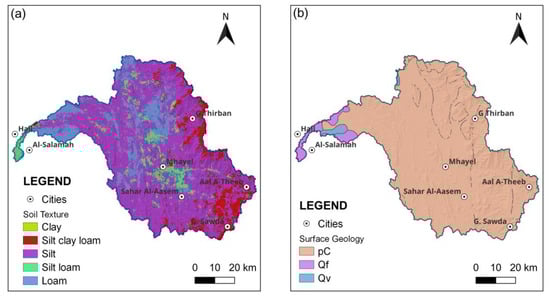
Figure 7.
(a) Soil texture and (b) surface geological data for Wadi Hail Basin.
To compute water potentially lost due to seepage, we used the widely used Soil Conservation Service curve number (SCS-CN) method [29,30], developed by the US Department of Agriculture (US Soil Conservation Service) in 1972. It is also recognized as the Natural Resources Conservation (NRCS) curve number (CN) method. It has been commonly used to compute surface runoff (Q), map potential areas of groundwater recharge in arid and semi-arid regions [31,32], estimate peak discharge [33,34,35], and simulate and assess flooding [9,36,37]. The excess rainfall (Q) is related to the effective rainfall, as shown in Equation (1), through what is known as maximum potential retention value (S).
The initial abstraction Ια is estimated to be equal to 0.2 S (the maximum potential retention). The S value can be obtained as follows:
In the equation, CN represents the purpose of the LULC and Hydrologic Soil Group (HSG), and α denotes a unit conversion constant value that equals 25.4 in SI units and 1.0 in CU units [33].
To achieve the set objectives, we computed CN values by integrating the classified land cover map (Figure 5b) and the Hydrological Soil Group (HSG) map prepared using the soil texture map (Figure 8). Antecedent moisture condition tables published by the (U.S Department of Agriculture at [3] supported this integration. These previous tables contain information about “soil moisture”, which is a function of total precipitation for the “5 days” preceding the event. Thus, a dry antecedent moisture condition was selected and used to compute the CN values. Accordingly, a CN value for each sub-basin was computed (Figure 9) and incorporated into the HEC–HMS model to generate a flood hydrograph.
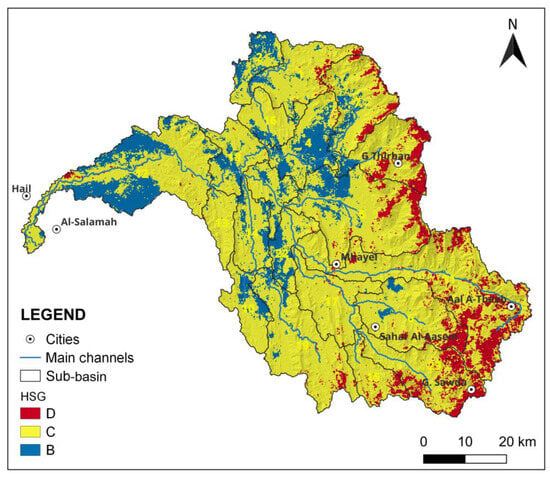
Figure 8.
The hydrological soil group map (HSG) of the wadi’s catchments. The numbers show the sub-basins ID, according to the HEC-HMS model output.
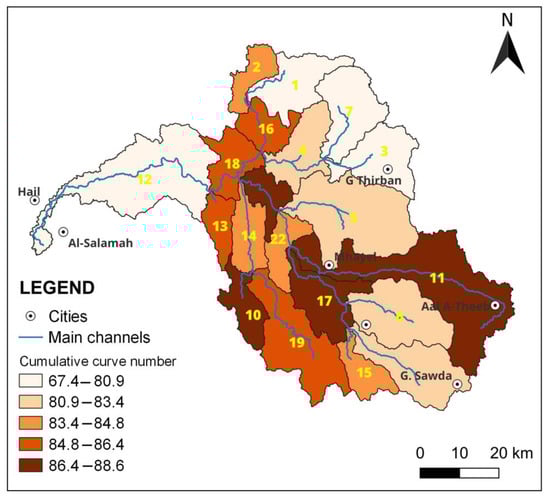
Figure 9.
Cumulative curve number (CN) map of the stream watersheds. The numbers show the sub-basins ID, according to the HEC-HMS model output.
3.2. Model Description and Setup
The HEC–HMS model was used here to simulate the flow and predict the flash flood hazard of the Wadi Hail catchment and its associated sub-basins. It is a semi-distributed model [7] characterized by many advantages, including flexibility and ease of use, simulation with high efficiency, requiring fewer environmental factors, and fast computation [7]. According to Lautenbach et al. [38] it has some drawbacks. For example, it is not able to consider the impact of the variation in some environmental parameters, such as “precipitation”, “topography”, “soil”, and “LULC”. However, it is commonly used for hydrological modelling and flood simulation in the United States. This model, after delineating the wadi’s watershed, has the capability to divide the delineated watershed into sub-basins, where each sub-basin represents a single hydrological unit, representing all required parameters for generating flow hydrograph, peak discharge, and runoff volume. For more information about this model, we refer readers to Scharffenberg [39] and Halwatura and Najim [40].
In order to set up the model, four main components must be prepared, namely: (1) the basin model—which consists of the hydrological factor and its connecting elements that facilitate the flow of water in the wadi basin, (2) the meteorological model, (3) the control specifications, and (4) data entry. The parameter selection and data processing are crucial step to achieve satisfactory results. Thus, in this study, the model parameters were selected and processed according to an in-depth literature review (for example, the LULC layer’s accuracy should be more than 85% to ensure data reliability).
Here, we utilized the HEC–HMS model to simulate water flow in Wadi Hail and generate the required information, i.e., flow hydrographs and peak discharge. For this, the Muskingum method was used for channel routing; lag time (time of concentration, min) for each sub-basin was computed [41], and CN values were incorporated into each sub-basin.
3.3. Rainfall Data
The GPM IMERG data (NASA’s Integrated Multi-satellite Retrievals for the Global Precipitation Mission) were used. These data sets are considered one of the SPPS (satellite precipitation products) data sources that are characterized by accuracy relevancy for application for different purposes [42], including extreme rainfall event modeling [43,44]. The data also have three products, namely, “IMERG Early”, “IMERG Late”, and “IMERG Final”. For more information about the IMERG products, readers can refer to Hamouda et al. [11]. Figure 10 and Figure 11 show the IMERG Early, Late, and Final half-hourly products for most regions of Saudi Arabia and for the Wadi Hail catchment, respectively.
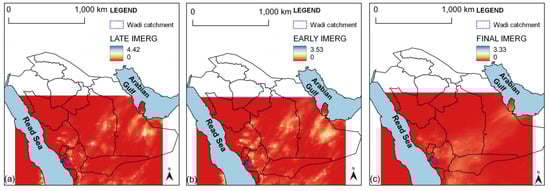
Figure 10.
Total IMERG rainfall (a) Late, (b) Early, and (c) Final for the 23 May 2015 event over the Saudi Arabia regions. The blue frame shows the location of the study basin. For more clarification, the rainfall over the wadi catchment was clipped and showed in Figure 11.
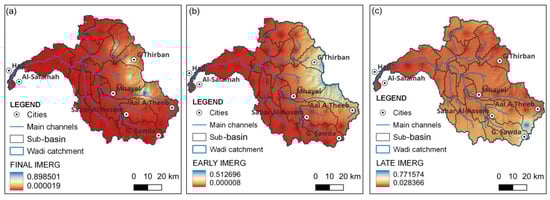
Figure 11.
Rainfall totals (presented as (a) Final, (b) Early, and (c) Late) over the Wadi Hail catchment for the 23 May 2015 storm event estimated by the three IMERG products utilizing the IDW interpolation algorithm.
Eventually, a final-IMERG product rainstorm event recorded on 23 May 2015 (Figure 10c and Figure 11c) was selected, because it has yielded satisfactory results enough to run the HEC–HMS model for the term between 10:00 a.m. local time and 18:30 p.m. local time, as per Sharif et al. [8] and Mahmoud et al. [24]. The selection of this specific rainstorm for analysis was guided by data obtained from residents within the study area. Their reports identified the event as a major flood-producing storm responsible for inflicting significant damage upon the transportation network and infrastructure in Hail city and its adjoining neighborhoods.
The IMERG data were obtained in Raster and ASCII formats; therefore, it was convenient to manage them in Microsoft Excel software v 2019 and QGIS v 3.18, the open-source software. To smooth the spatial distribution of the three IMERG products, we firstly converted them into a point vector files, and then the Inverse Distance Weight (IDW) interpolation technique of the QGIS software v 3.18 was used.
4. Results and Discussion
4.1. Flood Hydrographs and Peak Runoff
The discharge rate of floodwaters for the main outlet of the study area drainage basin was obtained using the constructed hydrological model. By making use of this model, hydrographs that give the amount of water discharging through the main outlet of the wadi and its sub-basins, lag time, and total peak discharge were calculated. To achieve this, we used a hypothetical storm of 1 mm of rainfall over the course of 8 h. The findings indicated that a 1 mm rainstorm may encourage the main outlet of the wadi to yield a highest discharge amount of 8.8 m3/s (Figure 12). This rate of peak flow may be attributed to the morphometric characteristics of the drainage basin, which include the size of the main catchment, basin slope, drainage density, curve number, and LULC, as previously reported [3].
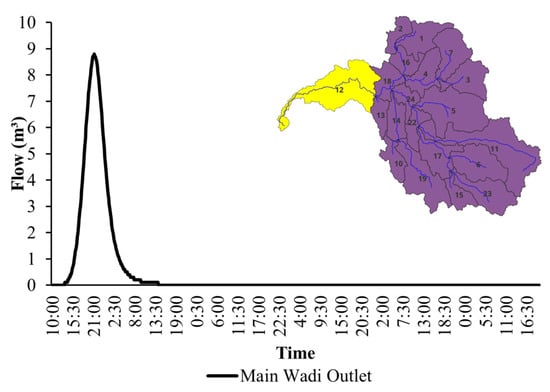
Figure 12.
Modeled hydrographs showing the range of expected discharges for the five selected sub-basins of Wadi Hail under hypothetical 1 mm rainstorms for 8 h. The numbers in the upper right inset show the subbasins ID, according to the HEC-HMS model output.
It was found that Wadi Hail is large in size and collects precipitation from an overall contributed area of approximately 5235.3 square kilometers. It also has an elongation ratio of 8.5, from a topographical and geomorphological point of view. Further, it has an overall moderate slope of 14.9°, and an overall moderate longest flow-path length of 43.3 km with an average of vegetation coverage of nearly 6.6%. With such considerations, parameters of a drainage basin that would create high peak flow rates from a rainstorm with <1 mm rainfall may yield a massive flash flood, such as the one that happened on 23 May 2015. In addition, this wadi has a relatively moderate drainage density of 0.10 km/km2 with a ruggedness number of 7.8 [45]. Drainage density, as reported by Patton & Baker [46], indicates a basin’s capacity to drain excess water. The ruggedness number, calculated based on basin characteristics and drainage density, reflects the drainage system’s ability to transport both sediment and water. Studies by Mashaly & Ghoneim [3] and Patton & Baker [46] suggest a positive correlation between peak flow and increasing basin drainage density and ruggedness.
In the case of Wadi Hail, the moderate ruggedness number suggests a potential for increased peak flow rates during moderate rainstorms. However, the basin’s elongated shape may mitigate the severity of the flash flood hazard during such events.
Furthermore, as soil roughness may influences the infiltration and flow, prior work has shown the effects of soil-surface roughness on surface runoff rates and its relationship with an increased flash flood risk [3,47]. For example, in a study conducted in Wadi El-Ambagi in Egypt, Mashaly & Ghoneim [3] observed low infiltration rates and high surface runoff rates in the main wadi bed, which was characterized by a moderate roughness and coarse texture materials, suggesting a significant effect of roughness. In another study, however, soil-surface roughness had no relationship to the flow and runoff, suggesting the ineffectiveness of roughness in an increased risk of flash flood. However, because the average roughness of the mainstream of Wadi Hail, which was dominated by highlands, was 21.8, and the mean lag time was short, approximately less than 3 h, the risk of flash flood was expected to increase.
It was found that, because the sub-basins No. 1, 19, and 23 had been characterized by short times, which were less than 2 h, compared to the other sub-basins, these sub-basins would cause a frequent concentration of floodwaters, and hence increase the surface runoff rates and the destructive effect of the wadi during intense rainstorms. This result was consistent with the findings of Mashaly and Ghoneim [3], who found that basins which have short lag periods were at greater potential risk of flash floods than those which have longer lag periods. Additionally, it was found that the Wadi Hail catchment had an overall average curve number (CN) of 83, suggesting more runoff owing to the absence of surface permeability over the drainage basin, as previously documented using variable techniques [6,32,33,48].
Moreover, vegetation may influence surface runoff by reducing water flow during a rainstorm event, allowing rainwaters to infiltrate the soil layers. The reduction in flow velocity through vegetation cover has been documented in several studies [49,50]. For example, one study on the Loess Plateau, China, found that an area covered with grassland and shrubland produces a lower runoff depth. However, the relative influence of the vegetation cover on water flow and then flash flood generation has been linked directly to canopy structure and the aboveground biomass [51]. In a study of dam break floods with a vegetation effect, the vegetation has reduced the velocity of rainwaters, leading to a decrease in the peak discharge [49]. The changes in land use also influence surface runoff and flash flood occurrence by slowing and increasing water movement [52].
Our analysis showed that the Wadi Hail’s catchment has 20 sub-basins that drain towards the Red Sea. Among these sub-basins, eight drain in the direction of the current local highway, as shown in Figure 13. Due to the differences in the physiographical characteristics, drainage density, LULC, soil texture, and drainage network, hazard levels varied from one sub-basin to another (Table 1).
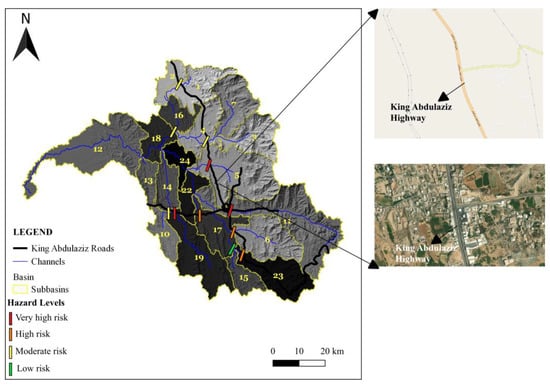
Figure 13.
A map view depicting the 20 upstream sub-basins that drain toward the Red Sea and their risk levels on the King Abdulaziz Highway. These risk levels were classified based on the sub-basins’ physiographic characteristics, drainage density, soil texture, and peak discharge (Table 1). The numbers in the upper right inset show the subbasins ID, according to the HEC-HMS model output. In the right side is a close-up view of the site classified as being at extreme flood risk.

Table 1.
Morphometric characteristics of the upstream and downstream sub-basins of Wadi Hail, Asir Province, Saudi Arabia.
According to our analyses results, the upstream sub-basins were classified into four hazards classes: “low risk”, “moderate risk”, “high risk”, and “very high risk” (Figure 13). Of the 20 sub-basins, sub-basin No. 11 (Figure 13 and Figure 14) was selected as a sub-basin with a very high flood risk because of many reasons, including a large catchment area (692.9 km2), high peak discharge (1.8 m3/s), moderate drainage density (0.12), and moderate CN (88.4). It was found that the outlet of this sub-basin crosses the Highway of King Abdulaziz and may expose this road to a major flood risk. This finding aligned with another similar study, which identified the same locations as sites with extreme to very high levels of flood risk [2]. Flash floods in these areas have severely affected cities and infrastructure like roads and parking lots, causing massive losses of property [2]. Beside the upstream sub-basin No. 11, another six upstream sub-basins, namely, 1, 5, 6, 15, 23, and 11, were classified as being at a high flood risk due to their high drainage density networks, and CNs. It was found that 13.2–30.6% (43.8% in total) of the total area of Wadi Hail Basin is highly prone to flooding. This finding also aligned with Alarifi et al. [2]. Furthermore, medium- and low hazard areas make up 4.5–11.2% of the total area, respectively. We found that the peak discharge value of sub-basin 11 (1.8 m3/s), covers 13.2% of the Wadi Hail total area; accordingly, it poses more flood risk than other Wadi Hail sub-basins.
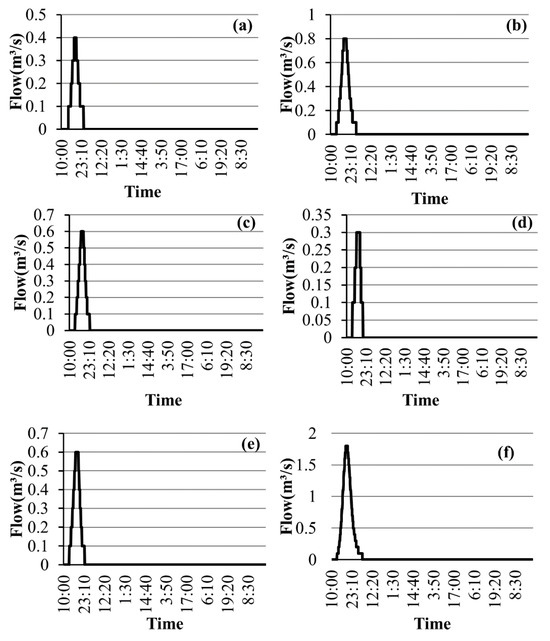
Figure 14.
Model-derived hydrographs of the six selected sub-basins: (a) sub-basin 1, (b) sub-basin 5, (c) sub-basin 6, (d) sub-basin 15, (e) sub-basin 23, and (f) sub-basin 11, because of the March 2015 rainstorm. Sub-basin number 11 was selected as the basin that was characterized by a high level of flood risk due to its physiographic characteristics.
Comparing Figure 13 with Figure 15a,b, we found that Muhayil city is situated downstream towards the south; therefore, it may be at risk of flooding, where the water depth reaches 43.2 (1000 m3/s) in a volumetric scale, which is too deep compared to the other sub-basins. The water depth in this sub-basin was an outcome of a peak flow of 1.8 m3/s.
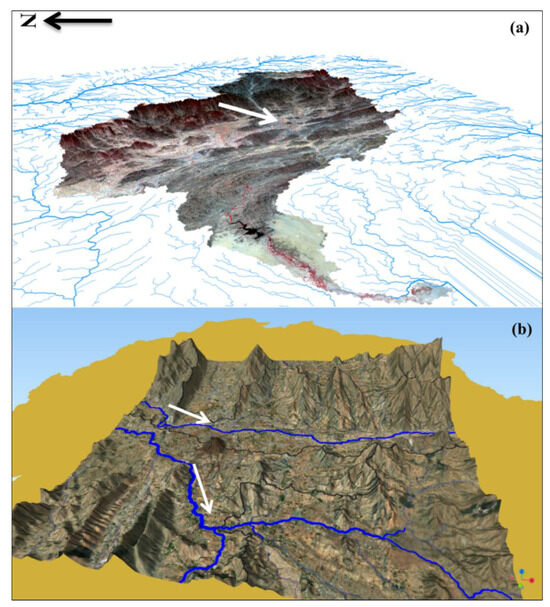
Figure 15.
The three-dimensional “oblique perspective” of the downstream area of Wadi Hail. Where, (a) is a Multispectral Landsat image overlaid on a 90 m SRTM-DEM. The white arrow indicates the city of Muhayil, (b) is a zoomed area of sub-basin No. 11. With many houses surrounding this area, the risk of flood inundation remains a concern. The blue lines show the closest stream to the city of Muhayil, while the white arrows indicate areas at risk of flooding.
Based on the simulation results, the built and natural environment of the study basin may experience a severe flash flood impact. This effect can include:
- (i)
- Impacts on the built environment such as damage to property and infrastructure.
- (ii)
- Impacts on the natural environmental such as vegetation cover, forests, and agricultural lands.
- (iii)
- Impact on the human population and their activities like injuries, loss of life and health, and the economy.
Since the effects of flash floods vary from one place to another within the wadi basin, depending on the severity of the hazard, the local government and relevant agencies in Saudi Arabia have formulated several polices to control and mitigate the effects of flash floods mentioned above. This includes pre-event policies such as mitigation and preparation; and post-event policies such as emergency planning for flash flood response and recovery.
Accordingly, other studies have focused on using different return periods (e.g., 5-year, 10-year, 25-year, 50-year, and 100-year) to estimate flood hydrographs and investigate flash floods hazards. For example, Babiker and Mohamed [33] predicted the amount of surface runoff reaching the crossing point of a watershed stream with a highway for a rainfall intensity of a 10-year return period. They found that peak discharge values ranged between 15.6 and 47.2 m3/s. However, in this study, the estimation of flash floods was not related to a specific return or recurrent period. However, the rainfall intensity used in this framework was obtained from a previous 24-h rainstorm event that would occur during frequency analysis of a 2-year recurring period of rainfall data and medium to high probability of occurrence.
4.2. Model Validation
To further test the feasibility and applicability of the conceptual semi-distributed (HEC–HMS) model, this model was compared with the GSSHA model [7]. They found that the HEC–HMS model significantly overestimated the peak discharge before calibration, while providing satisfactory results after calibration, and this can confirm the validity of our results. However, validation of the model results is still required for the reliability of the results obtained. For this purpose, historical data on flash flood events reported by newspapers and news agencies were used (Table 2). It was found that about 45.5% of the historical flood points are located within the very high flood risk zone, while about 18.2% to 27.3% of the historical flood points are located within the high and moderate flood risk zones, respectively (Table 2). Only 9% of the flood events occur in the very low hazard zone. Overall, we found that about 63.7% of historical flood events occur in high and very high hazard flash flood areas.
Table 2.
Validation of flood-prone areas using historical events.
4.3. Limitations of the Study and Future Direction
This study acknowledges certain limitations. The primary constraint lies in the utilization of a Digital Elevation Model (DEM) with a coarse spatial resolution of 30 m. This resolution impedes the precise delineation of flood inundation extents and depths within the wadi channels. The implementation of cost-effective DEMs derived from very high-resolution satellite stereo-pair imagery, as advocated by Mashaly & Ghoneim [3], is recommended for future studies. An additional limitation pertains to the absence of stream flow data for model calibration. The ungagged nature of the basin, coupled with the lack of on-site meteorological data, necessitates alternative approaches. While the IMERG rainfall product offers promise, its relative novelty necessitates further validation efforts. Moreover, the uncertainty related to the extraction of parameters of the HEC–HMS model might affect the study results, and the assumption made by the model that LULC features are unchanged [38] (when in fact they are subject to changes) may also affect the study results. In addition, the HEC–HMS model is considered not suitable for simulating flood hydrographs due to lateral diffusion [40]. Despite these limitations, the study employed a well-established, physically-based, fully distributed model, and achieved satisfactory results. In addition, this model has been successfully implemented by other researchers, achieving satisfactory results (e.g., Hamouda et al. [11]). While the derived results provide a valuable initial assessment, further refinement is certainly achievable. Hence, a subsequent study is proposed. This follow-up investigation would incorporate a higher resolution DEM and explore the application of alternative rainfall-runoff models such as the GSSHA model.
The study demonstrates the potential of hydrological modelling for identifying areas susceptible to high peak flows associated with flash floods. These results can be instrumental for engineers and managers in pinpointing vulnerable locations and executing suitable measures to control or diminish the impact of such events in arid and semi-arid areas.
Nevertheless, a comprehensive understanding of factors influencing flash flood occurrence is crucial for effective control and mitigation strategies. Future research should focus on comparative analyses of variables that determine a site’s susceptibility to flash floods. This will enable us to better understand how these variables differentially affect specific locations and under what circumstances. Moreover, the study recommends further research to understand how flash flood hazards correlate with changes at different LULC classes. This could refine flash flood hazard results and maximize their effectiveness. In addition, the role of rainfall intensity on flash flood events should be investigated.
5. Summary and Conclusions
Limited data often hinder a thorough understanding of flood risks in arid regions, such as the Asir region in the Kingdom of Saudi Arabia, leaving critical infrastructure like roads and railways inadequately modeled and susceptible to damage. In this work, a physically-based, distributed hydrological model run with HEC–HMS model was employed to predict flash flood-prone areas within the Wadi Hail Basin, situated in the Asir Mountains region of southwestern Saudi Arabia. The study serves as a case study for this under-researched region. We leverage remote sensing data and the capabilities of Geographic Information Systems (GIS) software to construct spatial data layers suitable for flood modeling in the HEC–HMS model. These layers include elevation, LULC, and curve number (CN). By simulating flood events using the constructed model, the study successfully identified potential flash flood risk zones within the Wadi Hail Basin.
Throughout the study, a flood hazard area map was generated and hence, newspapers and news agency reports were used as a tool to validate the HEC–HMS model outputs. Only 9% of the flood events occurred in the very low hazard zone. We found that approximately 63.7% of historical flood events occurred in high hazard and very high hazard flood zones, respectively. Accordingly, the analysis results revealed that even relatively low intensity rainfall, such as 1 mm within 8 h, could produce peak discharge of 8.8 m3/s.
Four hazard levels were delineated within the Wadi basin, namely ‘low’, ‘moderate’, ‘high’, and ‘very high’. Therefore, it was found that 43.8% of the total area of the Wadi Hail Basin is highly prone to flooding. Furthermore, medium- and low-hazard areas made up 4.5–11.2% of the total area, respectively. On the other hand, the obtained results indicated that seven upstream sub-basins primarily in the eastern and southern parts of the wadi basin, like sub-basin 11, were classified as ‘very high’ to ‘high’ hazard, compared to those for downstream ones, due to their dense drainage networks and high CNs (Curve Number). It was found that the peak discharge value of sub-basin 11 (1.8 m3/s) covers 13.2% of the Wadi Hail total area; accordingly, it poses more flood risk than other Wadi Hail sub-basins. In addition, the outlet of the upstream sub-basin No. 11 intersects with the King Abdulaziz Highway, posing a great flood hazard to this critical, economic road. Moreover, we found that the LULC, soil characteristics, and topographical parameters, such as slope degree and elevation, play a critical role in predicting flash flood hazard within the wadi basin.
In fact, integrating the capabilities of hydrological modeling with the power of Geographic Information Systems (GIS) and HEC–HMS model is a practical and simple way to develop a robust model for estimating flood events and pinpointing highly vulnerable locations. Such an approach could be a powerful technique in designing flood control structures and making informed planning decisions in the study area and other regions in Saudi Arabia.
Overall, we emphasize that the results obtained from this study not only contribute to the broader understanding of flash flood risks in arid regions but also fill a critical knowledge gap regarding flood risk analysis specifically within the Wadi Hail Basin. Moreover, it may represent a useful and practical approach for local government and organizations in order to predict flood hazards associated with arid and semi-arid wadis and offer a valuable first step towards mitigating the impact of such events. However, the proposed model could be compared with machine learning (ML) methods such as the M5 model tree, optimal pruning extreme learning machine (OPELM), multivariate adaptive regression spline (MARS), etc., for optimizing obtained results.
Author Contributions
Conceptualization, A.S. and A.H.; methodology, A.H. and A.S.; software, A.S.; validation, A.H., and A.S.; formal analysis, A.H.; investigation, A.S.; resources, A.H.; data curation, A.S.; writing—original draft preparation, A.H. and A.S.; writing—review and editing, A.S.; visualization, A.S and A.H.; project administration, A.S.; funding acquisition, A.S. All authors have read and agreed to the published version of the manuscript.
Funding
This work was supported by the Deanship of Scientific Research, Vice Presidency for Graduate Studies and Scientific Research, King Faisal University, Saudi Arabia [Grant No. A116].
Institutional Review Board Statement
Not applicable.
Informed Consent Statement
Not applicable.
Data Availability Statement
The data presented in this study are available on request from the corresponding author. The data are not publicly available due to privacy.
Acknowledgments
The authors would like to thank the King Faisal University for its continuous support and help. We would also like to express our thanks to the anonymous reviewers and the editor for their valuable comments, suggestions and feedback on our manuscripts.
Conflicts of Interest
The authors declare no conflicts of interest.
References
- Sene, K. Flash floods. In Hydrometeorology: Forecasting and Applications; Springer: Cham, Switzerland, 2016; pp. 273–312. [Google Scholar]
- Alarifi, S.S.; Abdelkareem, M.; Abdalla, F.; Alotaibi, M. Flash flood hazard mapping using remote sensing and GIS techniques in southwestern Saudi Arabia. Sustainability 2022, 14, 14145. [Google Scholar] [CrossRef]
- Mashaly, J.; Ghoneim, E. Flash flood hazard using optical, radar, and stereo-pair derived dem: Eastern desert, Egypt. Remote Sens. 2018, 10, 1204. [Google Scholar] [CrossRef]
- Montz, B.E.; Gruntfest, E. Flash flood mitigation: Recommendations for research and applications. Glob. Environ. Chang. Part B Environ. Hazards 2002, 4, 15–22. [Google Scholar] [CrossRef]
- WMO. Guide to Hydrological Practices, 6th ed.; WMO-No. 168; WMO: Geneva, Switzerland, 2009. [Google Scholar]
- AlAli, A.M.; Salih, A.; Hassaballa, A. Geospatial-Based Analytical Hierarchy Process (AHP) and Weighted Product Model (WPM) Techniques for Mapping and Assessing Flood Susceptibility in the Wadi Hanifah Drainage Basin, Riyadh Region, Saudi Arabia. Water 2023, 15, 1943. [Google Scholar] [CrossRef]
- Al-Areeq, A.M.; Al-Zahrani, M.A.; Sharif, H.O. Assessment of the performance of satellite rainfall products over Makkah watershed using a physically based hydrologic model. Appl. Water Sci. 2022, 12, 246. [Google Scholar] [CrossRef]
- Sharif, H.O.; Al-Zahrani, M.; El Hassan, A. Physically, fully distributed hydrologic simulations driven by GPM satellite rainfall over an urbanizing arid catchment in Saudi Arabia. Water 2017, 9, 163. [Google Scholar] [CrossRef]
- Foody, G.M.; Ghoneim, E.M.; Arnell, N.W. Predicting locations sensitive to flash flooding in an arid environment. J. Hydrol. 2004, 292, 48–58. [Google Scholar] [CrossRef]
- Ahmed, I.; Pan, N.D.; Debnath, J.; Bhowmik, M.; Bhattacharjee, S. Flood hazard zonation using GIS-based multi-parametric Analytical Hierarchy Process. Geosyst. Geoenviron. 2024, 3, 100250. [Google Scholar] [CrossRef]
- Hamouda, M.A.; Hinge, G.; Yemane, H.S.; Al Mosteka, H.; Makki, M.; Mohamed, M.M. Reliability of GPM IMERG Satellite Precipitation Data for Modelling Flash Flood Events in Selected Watersheds in the UAE. Remote Sens. 2023, 15, 3991. [Google Scholar] [CrossRef]
- Mohamed, A.; Worku, H. Urban land cover and morphometric analysis for flash flood vulnerability mapping and riparian landscape conservation in Kebena River watershed, Addis Ababa. Appl. Geomat. 2021, 13, 15–28. [Google Scholar] [CrossRef]
- Maneechot, L.; Wong, Y.J.; Try, S.; Shimizu, Y.; Bharambe, K.P.; Hanittinan, P.; Ram-Indra, T.; Usman, M. Evaluating the necessity of post-processing techniques on d4PDF data for extreme climate assessment. Environ. Sci. Pollut. Res. 2023, 30, 102531–102546. [Google Scholar] [CrossRef]
- Usman, M.; Ndehedehe, C.E.; Farah, H.; Ahmed, B.; Wong, Y.; Adeyeri, O.E. Application of a Conceptual Hydrological Model for Streamflow Prediction Using Multi-Source Precipitation Products in a Semi-Arid River Basin. Water 2022, 14, 1260. [Google Scholar] [CrossRef]
- Adnan, R.M.; Petroselli, A.; Heddam, S.; Santos CA, G.; Kisi, O. Comparison of different methodologies for rainfall-runoff modeling: Machine learning vs conceptual approach. Nat. Hazards 2021, 105, 2987–3011. [Google Scholar] [CrossRef]
- He, X.; Luo, J.; Zuo, G.; Xie, J. Daily Runoff Forecasting Using a Hybrid Model Based on Variational Mode Decomposition and Deep Neural Networks. Water Resour. Manag. 2019, 33, 1571–1590. [Google Scholar] [CrossRef]
- Mani, S.T.; Kolluru, V.; Amai, M.; Acharya, T.D. Enhanced streamflow simulations using nudging based optimization coupled with data-driven and hydrological models. J. Hydrol. Reg. Stud. 2022, 43, 101190. [Google Scholar] [CrossRef]
- Yan, X.; Xu, K.; Feng, W.; Chen, J. A rapid prediction model of urban flood inundation in a high-risk area coupling machine learning and numerical simulation approaches. Int. J. Disaster Risk Sci. 2021, 12, 903–918. [Google Scholar] [CrossRef]
- Sezen, C.; Šraj, M. Improving the simulations of the hydrological model in the karst catchment by integrating the conceptual model with machine learning models. Sci. Total Environ. 2024, 926, 171684. [Google Scholar] [CrossRef] [PubMed]
- Motta, M.; de Castro Neto, M.; Sarmento, P. A mixed approach for urban flood prediction using Machine Learning and GIS. Int. J. Disaster Risk Reduct. 2021, 56, 102154. [Google Scholar] [CrossRef]
- Al-Amri, N.S.; Abdurahman, S.G.; Elfeki, A.M. Modeling Aquifer Responses from Flash Flood Events through Ephemeral Stream Beds: Case Studies from Saudi Arabia. Water 2023, 15, 2735. [Google Scholar] [CrossRef]
- Sulaiman, A.; Elawadi, E.; Mogren, S. Gravity interpretation to image the geologic structures of the coastal zone in al Qunfudhah area, southwest Saudi Arabia. Geophys. J. Int. 2018, 2143, 1623–1632. [Google Scholar] [CrossRef]
- Helmi, A.M.; Elgamal, M.; Farouk, M.I.; Abdelhamed, M.S.; Essawy, B.T. Evaluation of Geospatial Interpolation Techniques for Enhancing Spatiotemporal Rainfall Distribution and Filling Data Gaps in Asir Region, Saudi Arabia. Sustainability 2023, 15, 14028. [Google Scholar] [CrossRef]
- Mahmoud, M.T.; Mohammed, S.A.; Hamouda, M.A.; Dal Maso, M.; Mohamed, M.M. Performance of the IMERG Precipitation Products over High-latitudes Region of Finland. Remote Sens. 2021, 13, 2073. [Google Scholar] [CrossRef]
- Richards, J.A. Remote Sensing Digital Image Analysis: An Introduction, 5th ed.; Springer: Cham, Switzerland, 1994. [Google Scholar]
- Luca, C. Semi-Automatic Classification Plugin: A Python tool for the download and processing of remote sensing images in QGIS. J. Open Source Softw. 2021, 6, 3172. [Google Scholar]
- Maidment, D.R. Handbook of Hydrology, 2nd ed.; McGraw-Hill: New York, NY, USA, 1993. [Google Scholar]
- Ghoneim, E.; Robinson, C.; El-Baz, F. Radar topography data reveal drainage relics in the eastern Shahra. Int. J. Remote Sens. 2007, 28, 1759–1772. [Google Scholar] [CrossRef]
- Michel, C.; Andréassian, V.; Perrin, C. Soil conservation service curve number method: How to mend a wrong soil moisture accounting procedure? Water Resour. Res. 2005, 41, W02011. [Google Scholar] [CrossRef]
- Mishra, S.K.; Singh, V.P. Long-term hydrological simulation based on the Soil Conservation Service curve number. Hydrol. Process. 2004, 18, 1291–1313. [Google Scholar] [CrossRef]
- Kolekar, S.S.; Mishra, A.; Choudhari, P.; Choudhari, N.R. Identification of specific areas for water conservation measures using Geoinformatics approach. Arab. J. Geosci. 2021, 14, 531. [Google Scholar] [CrossRef]
- Ghoneim, E. Optimum groundwater locations in the northern United Arab Emirates. Int. J. Remote Sens. 2008, 29, 5879–5906. [Google Scholar] [CrossRef]
- Babiker, I.S.; Mohamed, M.A.A. Use of NRCS-curve number method for peak discharge estimation in Sharqu ElNeil locality, Khartoum, Sudan. Arab. J. Geosci. 2019, 12, 541. [Google Scholar] [CrossRef]
- Salih, A.A.; Hamid, A.A. Hydrological studies in the White Nile state in Sudan. Egypt. J. Remote Sens. Space Sci. 2017, 20, S31–S38. [Google Scholar] [CrossRef]
- Mahmoud, W.H.; Elagib, N.A.; Gaese, H.; Heinrich, J. Rainfall conditions and rainwater harvesting potential in the urban area of Khartoum. Resour. Conserv. Recycl. 2014, 91, 89–99. [Google Scholar] [CrossRef]
- Ghoneim, E.; Foody, G.M. Assessing flash flood hazard in an arid mountainous region. Arab. J. Geosci. 2013, 6, 1191–1202. [Google Scholar] [CrossRef]
- Rao, M.P.; Cook, E.R.; Cook, B.I.; D’Arrigo, R.D.; Palmer, J.G.; Lall, U.; Woodhouse, C.A.; Buckley, B.M.; Uriarte, M.; Bishop, D.A.; et al. Seven centuries of reconstructed Brahmaputra River discharge demonstrate underestimated high discharge and flood hazard frequency. Nat. Commun. 2020, 11, 6017. [Google Scholar] [CrossRef]
- Lautenbach, S.; Voinov, A.; Seppelt, R. Localization effects of land use change on hydrological models. In Proceeding of the 3rd International Congress on Environmental Modelling and Software, Burlington, VT, USA, 9–13 July 2006. [Google Scholar]
- US Army Corps of Engineers. Hydrologic Modeling System HEC-HMS–User’s Manual; Institute for Water Resources, Hydrologic Engineering Center: Davis, CA, USA, 2013; Available online: https://www.hec.usace.army.mil/software/hec-hms/documentation/HEC-HMS_Users_Manual_4.0.pdf (accessed on 23 February 2024).
- Halwatura, D.; Najim, M.M.M. Application of the HEC-HMS model for runoff simulation in a tropical catchment. Environ. Model. Softw. 2013, 46, 155–162. [Google Scholar] [CrossRef]
- Chow, V.T.; Maidment, D.R.; Mays, L.W. Applied Hydrology, 1st ed.; McGraw-Hill: New York, NY, USA, 1988. [Google Scholar]
- Jiang, L.; Bauer-Gottwein, P. How Do GPM IMERG Precipitation Estimates Perform as Hydrological Model Forcing? Evaluation for 300 Catchments across Mainland China. J. Hydrol. 2019, 572, 486–500. [Google Scholar] [CrossRef]
- Behrangi, A.; Khakbaz, B.; Jaw, T.C.; AghaKouchak, A.; Hsu, K.; Sorooshian, S. Hydrologic Evaluation of Satellite Precipitation Products over a Mid-Size Basin. J. Hydrol. 2011, 397, 225–237. [Google Scholar] [CrossRef]
- Sun, R.; Yuan, H.; Liu, X.; Jiang, X. Evaluation of the Latest Satellite–Gauge Precipitation Products and Their Hydrologic Applications over the Huaihe River Basin. J. Hydrol. 2016, 536, 302–319. [Google Scholar] [CrossRef]
- Reily Shawn, J.; DeGloria Stephen, D.; Elliot Robert, A. Terrain Ruggedness Index That Quantifies Topographic Heterogeneity. Intermt. J. Sci. 1999, 5, 23–27. [Google Scholar]
- Patton, P.C.; Baker, V.R. Morphometry and floods in small basins subject to diverse hydro-geomorphic controls. Water Resour. Res. 1976, 12, 941–952. [Google Scholar] [CrossRef]
- Darboux, F.; Reichert, J.M.; Huang, C. Soil roughness effects on runoff and sediment production. In Proceedings of the 13th International Soil Conservation Organization Conference, Brisbane, Australia, 4–8 July 2004. [Google Scholar]
- Khzr, B.O.; Ibrahim, G.R.F.; Hamid, A.A.; Ail, S.A. Runoff estimation using SCS CN and GIS techniques in the Sulaymaniyah sub-basin of the Kurdistan region of Iraq. J. Environ. Sustain. 2022, 24, 2640–2655. [Google Scholar] [CrossRef]
- Zhang, M.; Liu, N.; Harper, R.; Li, Q.; Liu, K.; Wei, X.; Ning, D.; Hou, Y.; Liu, S. A global review on hydrological responses to forest change across multiple spatial scales: Importance of scale, climate, forest type and hydrological regime. J. Hydrol. 2017, 546, 44–59. [Google Scholar] [CrossRef]
- Nicolau, J.M.; Solé-Benet, A.; Puigdefábregas, J.; Gutiérrez, L. Effects of soil and vegetation on runoff along a catena in semi-arid Spain. Geomorphology 1996, 14, 297–309. [Google Scholar] [CrossRef]
- Leonard, L.A.; Reed, D.J. Hydrodynamics and sediment transport through tidal 892 marsh canopies. J. Coast. Res. Spec. Issue 2002, 36, 459–469. [Google Scholar]
- Sugianto, S.; Deli, A.; Miswar, E.; Rusdi, M.; Irham, M. The effect of land use and land cover changes on flood occurrence in Teunom Watershed, Aceh Jaya. Land 2022, 11, 1271. [Google Scholar] [CrossRef]
Disclaimer/Publisher’s Note: The statements, opinions and data contained in all publications are solely those of the individual author(s) and contributor(s) and not of MDPI and/or the editor(s). MDPI and/or the editor(s) disclaim responsibility for any injury to people or property resulting from any ideas, methods, instructions or products referred to in the content. |
© 2024 by the authors. Licensee MDPI, Basel, Switzerland. This article is an open access article distributed under the terms and conditions of the Creative Commons Attribution (CC BY) license (https://creativecommons.org/licenses/by/4.0/).