
Relations between High Anticyclonic Atmospheric Types and Summer Season Temperature in Bulgaria


Abstract
1. Introduction
2. Materials and Methods
3. Results and Discussion
3.1. Extremely Warm and Cold Summer Seasons in 1961–1990 and 1991–2020
3.2. Correlation between Summer Temperature and the Anticyclonic Types at 500 hPa
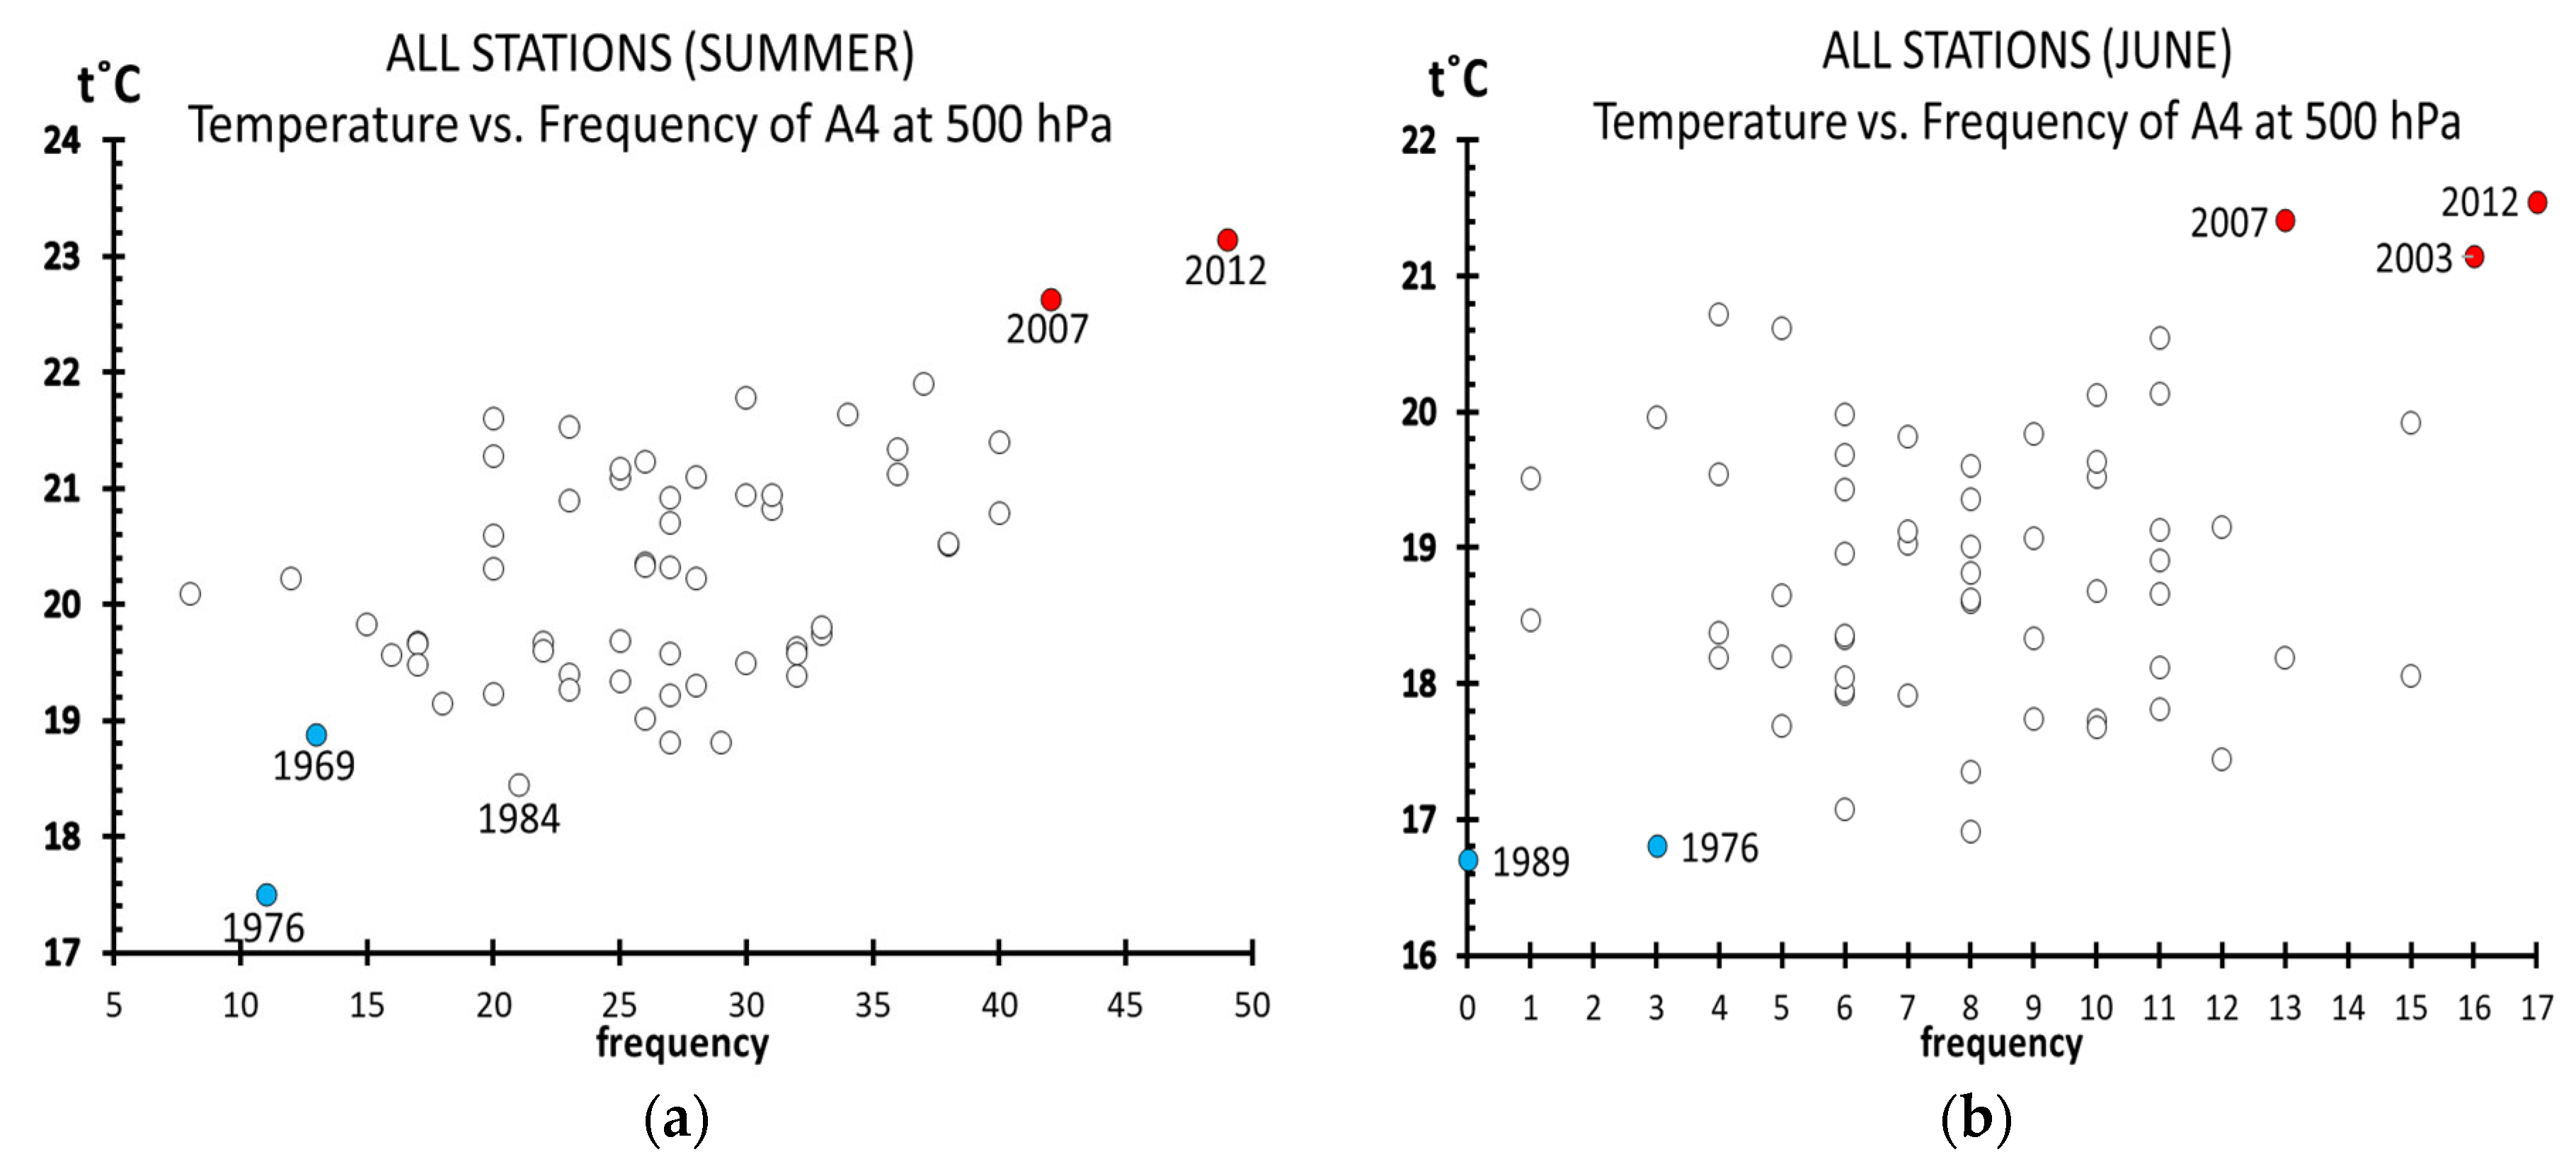
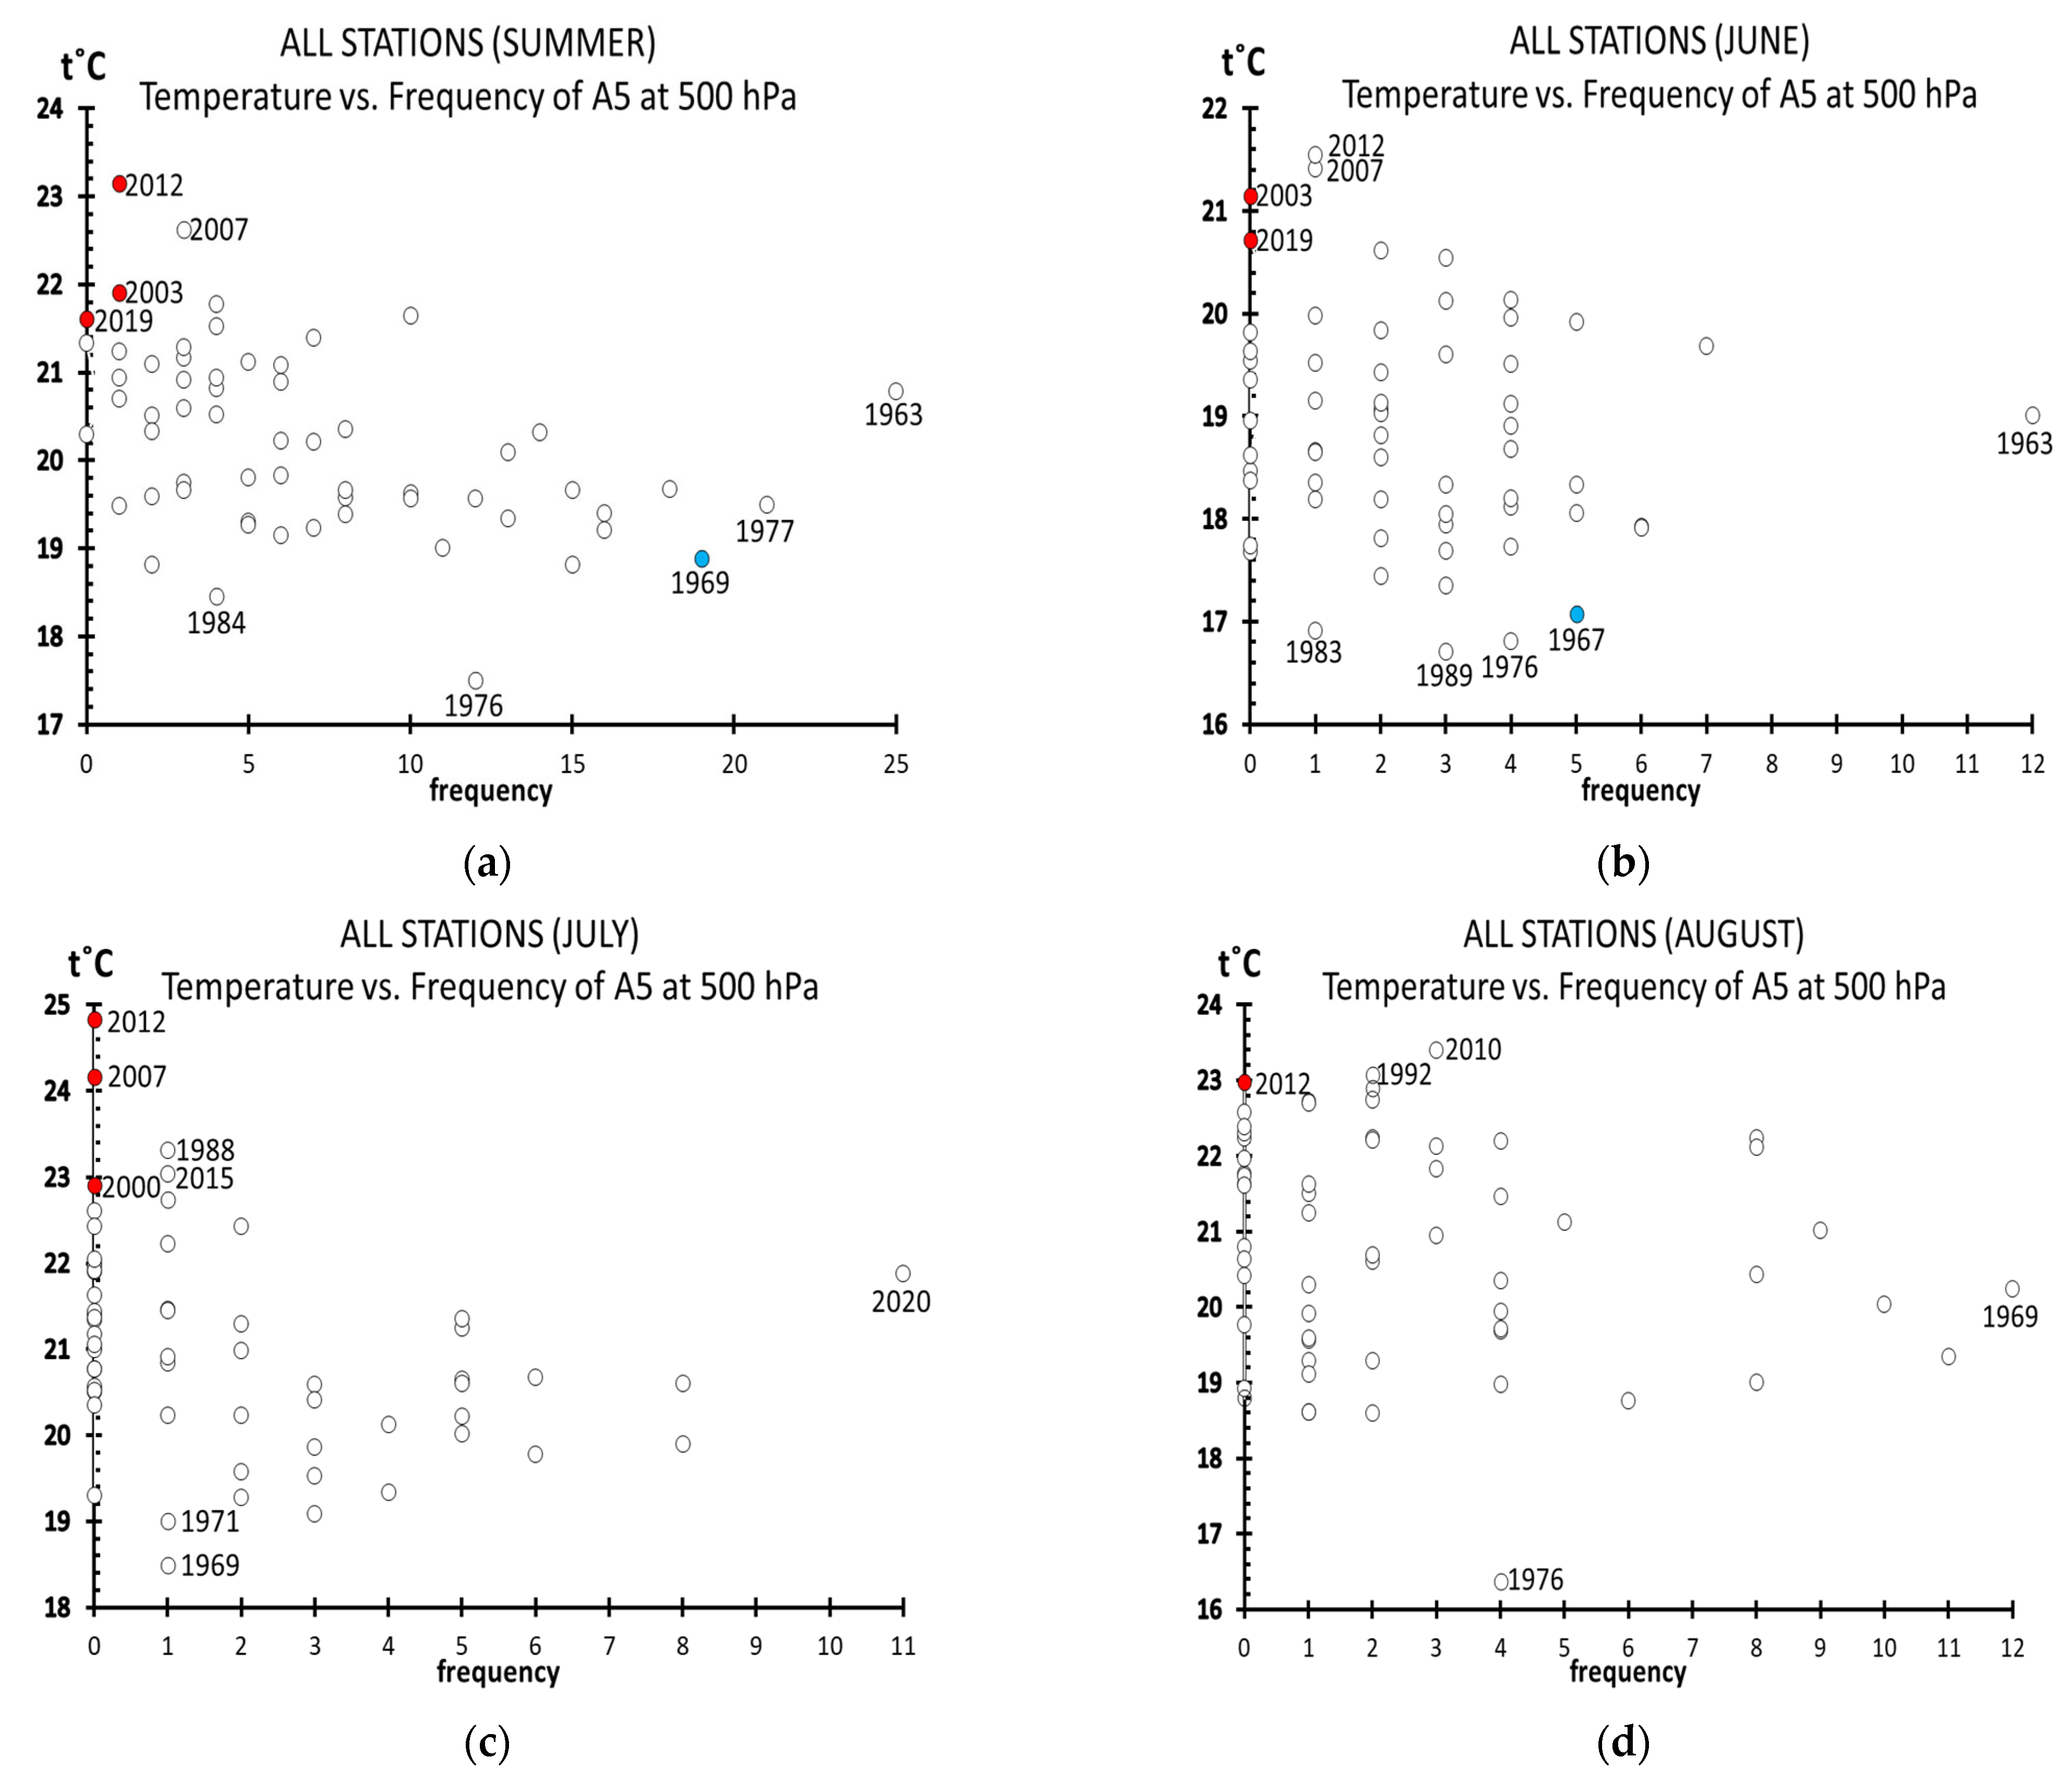
3.3. Dependencies between Seasonal and Monthly Temperature and the Frequencies of the Anticyclonic Types at the 500 hPa Level
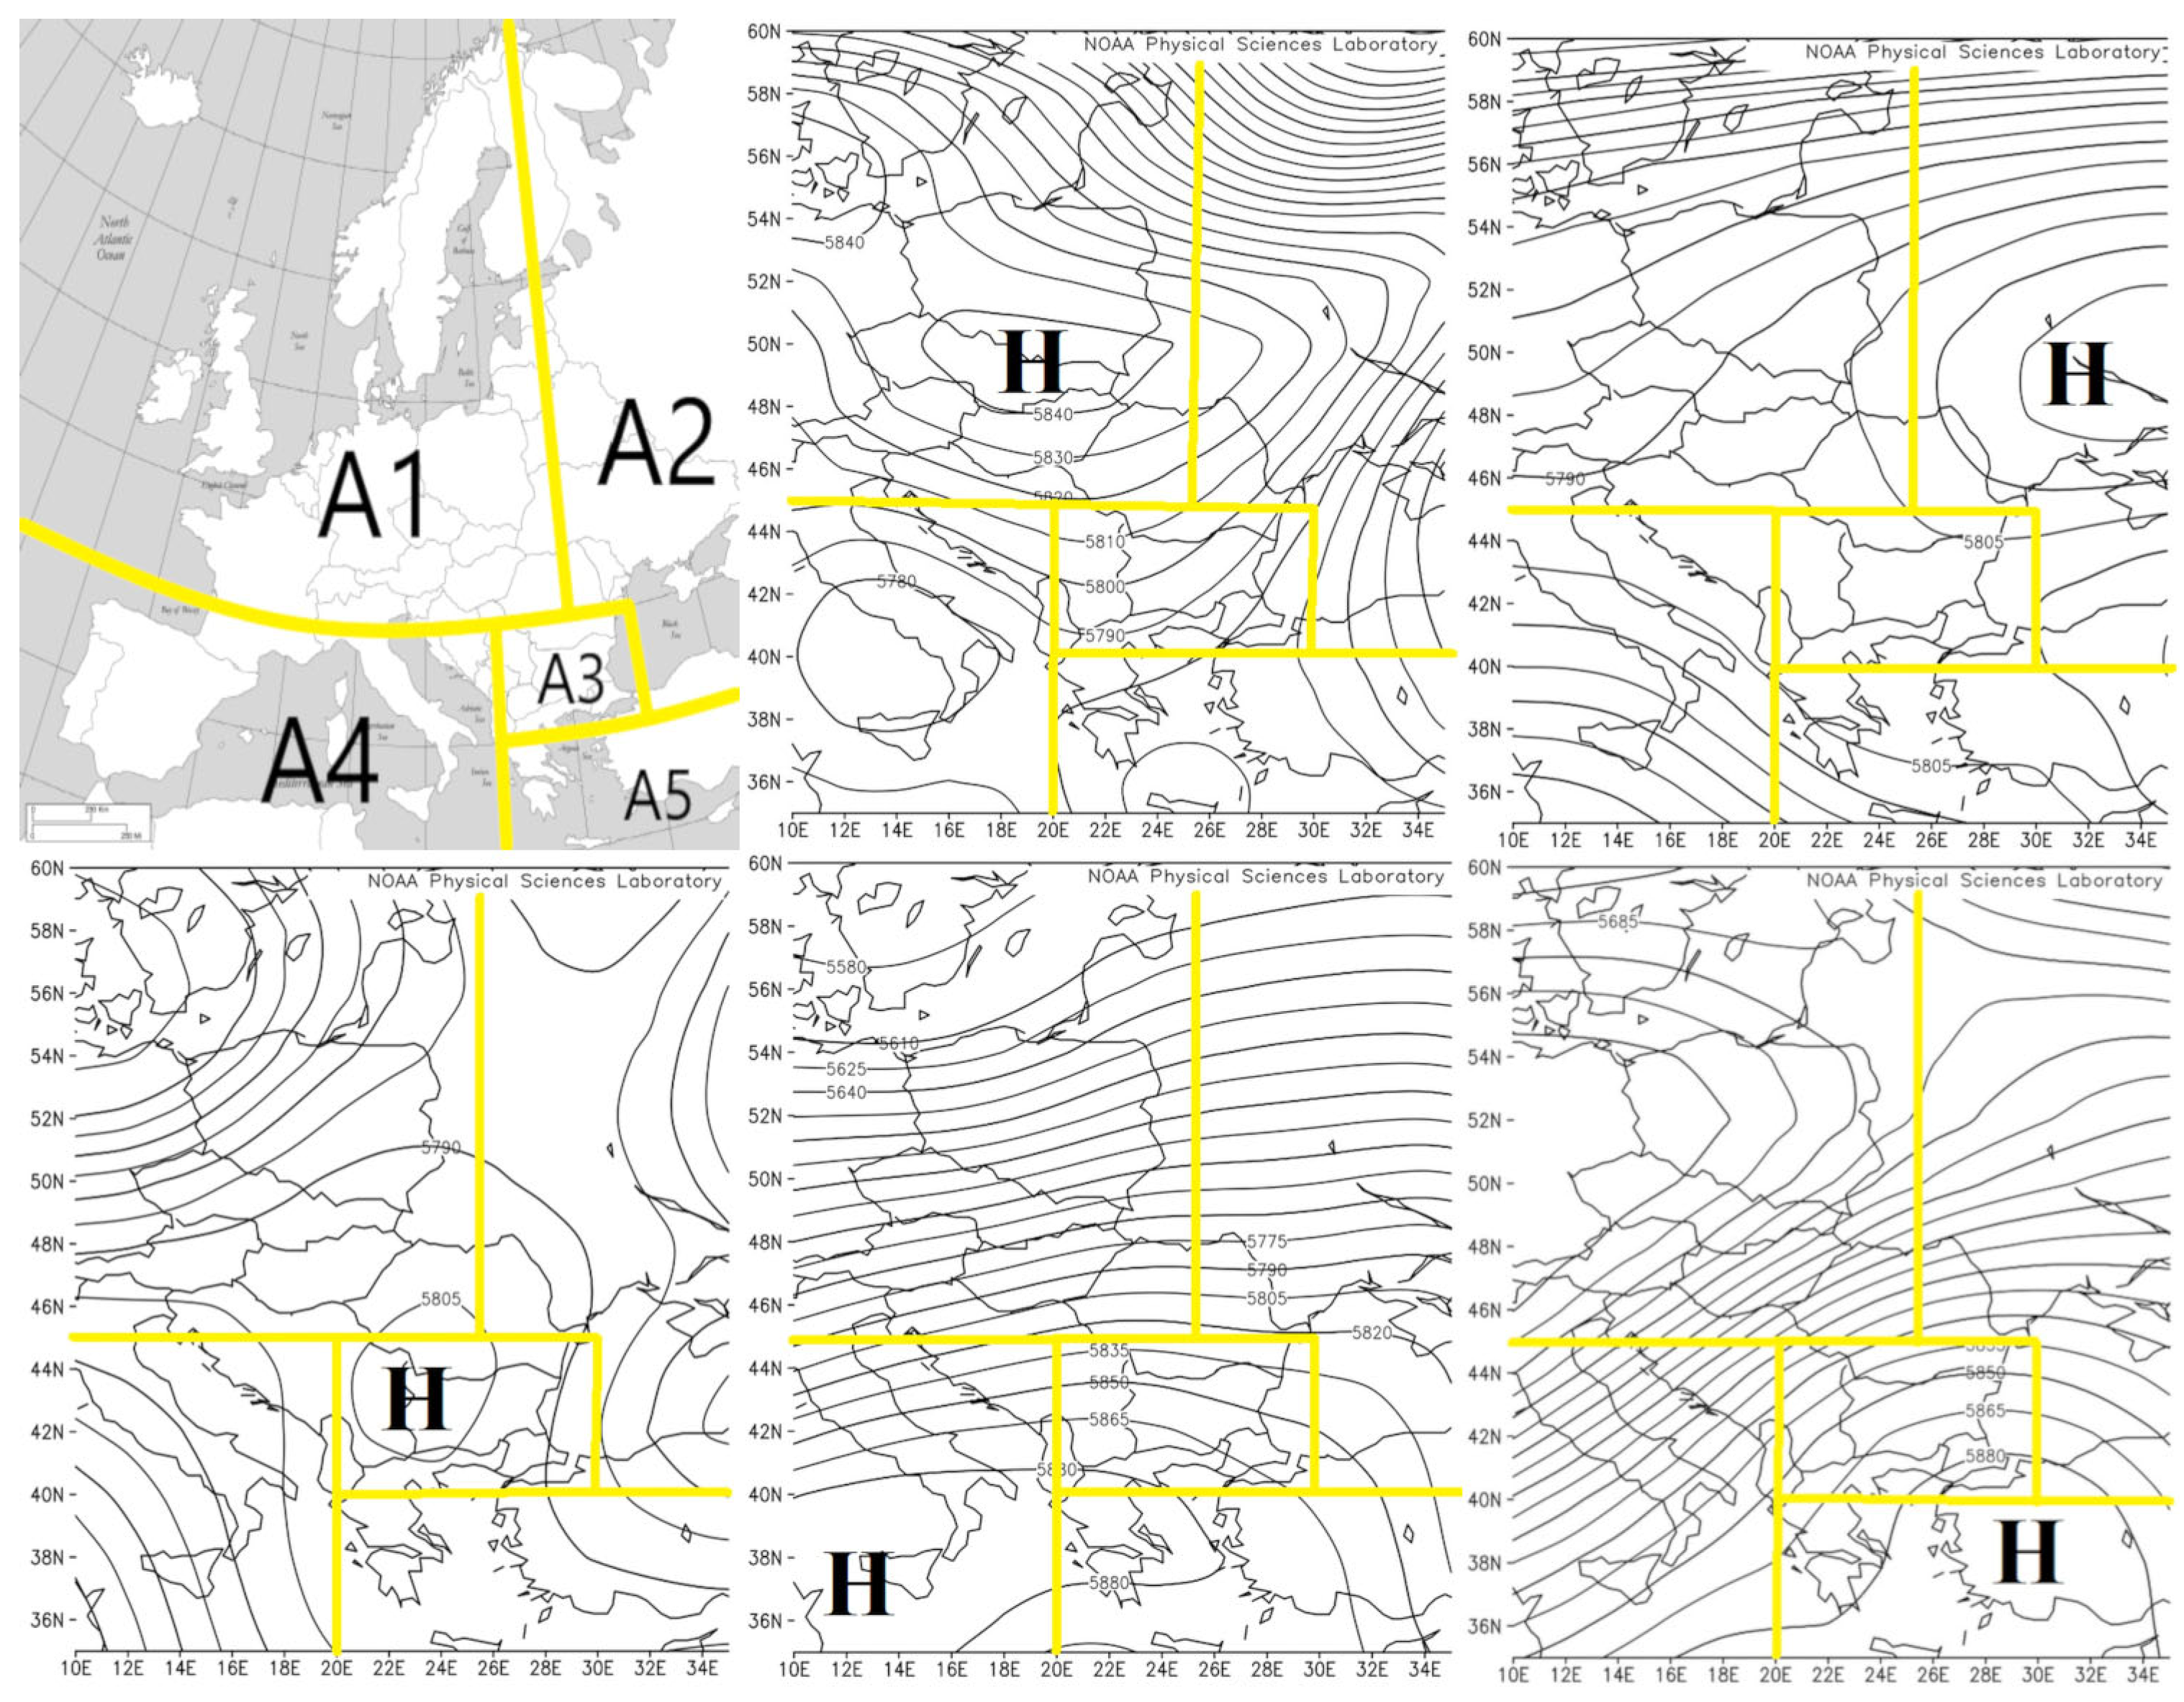
3.4. Trends of A4 and A5 Anticyclonic Types at the 500 hPa Level in the Summer Seasons
4. Conclusions
Author Contributions
Funding
Institutional Review Board Statement
Informed Consent Statement
Data Availability Statement
Acknowledgments
Conflicts of Interest
References
- Sfîcă, L.; Croitoru, A.E.; Iordache, I.; Ciupertea, A.F. Synoptic conditions generating heat waves and warm spells in Romania. Atmosphere 2017, 8, 50. [Google Scholar] [CrossRef]
- Tomczyk, A.M.; Piotrowski, P.; Bednorz, E. Warm spells in Northern Europe in relation to atmospheric circulation. Theor. Appl. Climatol. 2017, 128, 623–634. [Google Scholar] [CrossRef]
- Katsoulis, B.D.; Hatzianastassiou, N. Analysis of hot spell characteristics in the Greek region. Clim. Res. 2005, 28, 229–241. [Google Scholar] [CrossRef]
- Colacino, M.; Conte, M. Heat waves in the central Mediterranean. A synoptic climatology. Il Nuovo C. C 1995, 18, 295–304. [Google Scholar]
- Rusticucci, M.; Vargas, W. Synoptic situations related to spells of extreme temperatures over Argentina. Meteorol. Appl. 1995, 2, 291–300. [Google Scholar] [CrossRef]
- Runyon, S.C.; Bosart, L.F. A Statistical analysis and synoptic climatology of heat waves over the United States. In Proceedings of the 21st Conference on Weather Analysis and Forecasting/17th Conference on Numerical Weather Prediction, Albany, NY, USA, 1 August 2005. [Google Scholar]
- Grotjahn, R. Western North American Extreme Heat, Associated Large Scale Synoptic-Dynamics, and Performance by a Climate Model; Cambridge University Press: Cambridge, UK, 2016; pp. 198–209. [Google Scholar]
- Min, K.H.; Chung, C.H.; Bae, J.H.; Cha, D.H. Synoptic characteristics of extreme heatwaves over the Korean Peninsula based on ERA Interim reanalysis data. Int. J. Climatol. 2020, 40, 3179–3195. [Google Scholar] [CrossRef]
- Luo, M.; Lau, N.C. Synoptic characteristics, atmospheric controls, and long-term changes of heat waves over the Indochina Peninsula. Clim. Dyn. 2018, 51, 2707–2723. [Google Scholar] [CrossRef]
- Wang, W.; Zhou, W.; Li, X.; Wang, X.; Wang, D. Synoptic-scale characteristics and atmospheric controls of summer heat waves in China. Clim. Dyn. 2016, 46, 2923–2941. [Google Scholar] [CrossRef]
- Tringa, E.; Tolika, K.; Anagnostopoulou, C.; Kostopoulou, E. A Climatological and Synoptic Analysis of Winter Cold Spells over the Balkan Peninsula. Atmosphere 2022, 13, 1851. [Google Scholar] [CrossRef]
- Pappas, C.; Hatzianastassiou, N.; Katsoulis, B.D. Analysis of cold spells in the Greek region. Clim. Res. 2004, 27, 211–223. [Google Scholar] [CrossRef]
- Aalijahan, M.; Salahi, B.; Rahimi, Y.G.; Asl, M.F. A new approach in temporal-spatial reconstruction and synoptic analysis of cold waves in the northwest of Iran. Theor. Appl. Climatol. 2019, 137, 341–352. [Google Scholar] [CrossRef]
- Anagnostopoulou, C.; Tolika, K.; Lazoglou, G.; Maheras, P. The exceptionally cold January of 2017 over the Balkan Peninsula: A climatological and synoptic analysis. Atmosphere 2017, 8, 252. [Google Scholar] [CrossRef]
- Zschenderlein, P.; Wernli, H. The unusually long cold spell and the snowstorm Filomena in Spain in January 2021. Nat. Hazards Earth Syst. Sci. Discuss. 2022, 1–21. [Google Scholar] [CrossRef]
- Demirtaş, M. The anomalously cold January 2017 in the south-eastern Europe in a warming climate. Int. J. Climatol. 2022, 42, 6018–6026. [Google Scholar] [CrossRef]
- Reale, M.; Lionello, P. Synoptic climatology of winter intense precipitation events along the Mediterranean coasts. Nat. Hazards Earth Syst. Sci. 2013, 13, 1707–1722. [Google Scholar] [CrossRef]
- Warner, M.D.; Mass, C.F.; Salathé, E.P. Wintertime extreme precipitation events along the Pacific Northwest coast: Climatology and synoptic evolution. Mon. Weather Rev. 2012, 140, 2021–2043. [Google Scholar] [CrossRef]
- Wu, Y.C.; Wang, S.Y.S.; Yu, Y.C.; Kung, C.Y.; Wang, A.H.; Los, S.A.; Huang, W.R. Climatology and change of extreme precipitation events in Taiwan based on weather types. Int. J. Climatol. 2019, 39, 5351–5366. [Google Scholar] [CrossRef]
- Bluestein, H.B.; Parks, C.R. A synoptic and photographic climatology of low-precipitation severe thunderstorms in the southern plains. Mon. Weather Rev. 1983, 111, 2034–2046. [Google Scholar] [CrossRef]
- Viale, M.; Nuñez, M.N. Climatology of winter orographic precipitation over the subtropical central Andes and associated synoptic and regional characteristics. J. Hydrometeorol. 2011, 12, 481–507. [Google Scholar] [CrossRef]
- Quinting, J.F.; Catto, J.L.; Reeder, M.J. Synoptic climatology of hybrid cyclones in the Australian region. Q. J. R. Meteorol. Soc. 2019, 145, 288–302. [Google Scholar] [CrossRef]
- Collins, M.J.; Kirk, J.P.; Pettit, J.; DeGaetano, A.T.; McCown, M.S.; Peterson, T.C.; Means, T.N.; Zhang, X. Annual floods in New England (USA) and Atlantic Canada: Synoptic climatology and generating mechanisms. Phys. Geogr. 2014, 35, 195–219. [Google Scholar] [CrossRef]
- Gamble, D.W.; Meentemeyer, V.G. A synoptic climatology of extreme unseasonable floods in the southeastern United States, 1950–1990. Phys. Geogr. 1997, 18, 496–524. [Google Scholar] [CrossRef]
- Kahana, R.; Ziv, B.; Enzel, Y.; Dayan, U. Synoptic climatology of major floods in the Negev Desert, Israel. Int. J. Climatol. A J. R. Meteorol. Soc. 2002, 22, 867–882. [Google Scholar] [CrossRef]
- Lamb, H.H. British Isles Weather Types and a Register of Daily Sequence of Circulation Patterns, 1861–1971. In Geophysical Memoirs; HMSO: London, UK, 1972; Volume 116, 85p. [Google Scholar]
- O’Hare, G.; Sweeney, J. Lamb’s circulation types and British weather: An evaluation. Geography 1993, 78, 43–60. [Google Scholar]
- Hess, P.; Brezowsky, H. Katalog der Grosswetterlagen Europas. Ber. Dt. Wetterd. US-zone Nr.33, 1952. 39 S.; neue erweiterte Auflage des wahrend des Krieges von. F. Baur, P. Hess und H. Nagel bearbeiteten und nicht veroffentlichten Kalenders der Groswetterlagen Europas vom 1. Januar 1881 bis 31. Dezember 1943. Hamburg 1944; Deutscher Wetterdienst: Hamburg, Germany, 1952. [Google Scholar]
- Gerstengarbe, F.W.; Werner, P.C.; Rüge, U. Katalog der Grosswetterlagen Europas (1881–1998) nach Paul Hess und Helmuth Brezowsky 1999; Potsdam-Institut für Klimafolgenforschung: Potsdam, Germany, 1969. [Google Scholar]
- Hess, P.; Brezowsky, H. Katalog der Groûwetterlagen Europas. 2. Neu bearbunderg Aufl. Berichte Des Dtsch. Wetterdienstes Offenb. 1969, 113, 52. [Google Scholar]
- Maheras, P.; Patrikas, I.; Karacostas, T.; Anagnostopoulou, C. Automatic classification of circulation types in Greece: Methodology, description, frequency, variability and trend analysis. Theor. Appl. Clim. 2000, 67, 205–223. [Google Scholar] [CrossRef]
- Maheras, P.; Tolika, K.; Anagnostopoulou, C.; Vafiadis, M.; Patrikas, I.; Flocas, H. On the relationships between circulation types and changes in rainfall variability in Greece. Int. J. Clim. 2004, 24, 1695–1712. [Google Scholar] [CrossRef]
- Maheras, P.; Flocas, H.; Tolika, K.; Anagnostopoulou, C.; Vafiadis, M. Circulation types and extreme temperature changes in Greece. Clim. Res. 2006, 30, 161–174. [Google Scholar] [CrossRef]
- Pophristov, V.; Peneva, E. Classification of circulation types over Bulgaria: Method description, frequency, variability and trend analysis. Int. J. Adv. Res. 2018, 6, 1289–1305. [Google Scholar] [CrossRef]
- Malcheva, K.; Pophristov, V.; Marinova, T.; Trifonova, L. Complex approach for classification of winter severity in Bulgaria. In AIP Conference Proceedings (Melville USA); AIP Publishing: College Park, MD, USA, 2019; Volume 2075. [Google Scholar]
- Bocheva, L.; Pophristov, V. Seasonal analysis of large-scale heavy precipitation events in Bulgaria. In AIP Conference Proceedings; AIP Publishing: College Park, MD, USA, 2019; Volume 2075. [Google Scholar]
- Skinner, W.R.; Flannigan, M.D.; Stocks, B.J.; Martell, D.L.; Wotton, B.M.; Todd, J.B.; Bosch, E.M. A 500 hPa synoptic wildland fire climatology for large Canadian forest fires, 1959–1996. Theor. Appl. Climatol. 2002, 71, 157–169. [Google Scholar] [CrossRef]
- Skinner, W.R.; Stocks, B.J.; Martell, D.L.; Bonsal, B.; Shabbar, A. The association between circulation anomalies in the mid-troposphere and area burned by wildland fire in Canada. Theor. Appl. Climatol. 1999, 63, 89–105. [Google Scholar] [CrossRef]
- Hayasaka, H.; Tanaka, H.L.; Bieniek, P.A. Synoptic-scale fire weather conditions in Alaska. Polar Sci. 2016, 10, 217–226. [Google Scholar] [CrossRef]
- Amraoui, M.; Pereira, M.G.; DaCamara, C.C.; Calado, T.J. Atmospheric conditions associated with extreme fire activity in the Western Mediterranean region. Sci. Total Environ. 2015, 524, 32–39. [Google Scholar] [CrossRef] [PubMed]
- Pereira, M.G.; Trigo, R.M.; da Camara, C.C.; Pereira, J.M.; Leite, S.M. Synoptic patterns associated with large summer forest fires in Portugal. Agric. For. Meteorol. 2005, 129, 11–25. [Google Scholar] [CrossRef]
- Richardson, D.; Black, A.S.; Monselesan, D.P.; Risbey, J.S.; Squire, D.T.; Tozer, C.R.; Canadell, J.G. Increased extreme fire weather occurrence in southeast Australia and related atmospheric drivers. Weather Clim. Extrem. 2021, 34, 100397. [Google Scholar] [CrossRef]
- Sun, Y.; Niu, T.; He, J.; Ma, Z.; Liu, P.; Xiao, D.; Yan, X. Classification of circulation patterns during the formation and dissipation of continuous pollution weather over the Sichuan Basin, China. Atmos. Environ. 2020, 223, 117244. [Google Scholar] [CrossRef]
- Gao, D.; Xie, M.; Chen, X.; Wang, T.; Liu, J.; Xu, Q.; Ren, J. Systematic classification of circulation patterns and integrated analysis of their effects on different ozone pollution levels in the Yangtze River Delta Region, China. Atmos. Environ. 2020, 242, 117760. [Google Scholar] [CrossRef]
- Zhou, C.; Wei, G.; Xiang, J.; Zhang, K.; Li, C.; Zhang, J. Effects of synoptic circulation patterns on air quality in Nanjing and its surrounding areas during 2013–2015. Atmos. Pollut. Res. 2018, 9, 723–734. [Google Scholar] [CrossRef]
- He, J.; Gong, S.; Zhou, C.; Lu, S.; Wu, L.; Chen, Y.; Yin, C. Analyses of winter circulation types and their impacts on haze pollution in Beijing. Atmos. Environ. 2018, 192, 94–103. [Google Scholar] [CrossRef]
- Gu, S.; Wu, S.; Yang, L.; Hu, Y.; Tian, B.; Yu, Y.; Zhang, B. Synoptic Weather Patterns and Atmospheric Circulation Types of PM2. 5 Pollution Periods in the Beijing-Tianjin-Hebei Region. Atmosphere 2023, 14, 942. [Google Scholar] [CrossRef]
- Zheng, X.Y.; Fu, Y.F.; Yang, Y.J.; Liu, G.S. Impact of atmospheric circulations on aerosol distributions in autumn over eastern China: Observational evidence. Atmos. Chem. Phys. 2015, 15, 12115–12138. [Google Scholar] [CrossRef]
- Ormanova, G.; Karaca, F.; Kononova, N. Analysis of the impacts of atmospheric circulation patterns on the regional air quality over the geographical center of the Eurasian continent. Atmos. Res. 2020, 237, 104858. [Google Scholar] [CrossRef]
- Fotros, S.; Meshkatee, A.H.; Kamali, G.; Sedaghatkerdar, A. Exploring the most influential part of atmospheric circulation in the formation of severe air pollution episodes in the Greater Tehran. Arab. J. Geosci. 2018, 11, 1–18. [Google Scholar] [CrossRef]
- Thomas, M.A.; Devasthale, A.; Nygård, T. Influence of springtime atmospheric circulation types on the distribution of air pollutants in the Arctic. Atmos. Chem. Phys. 2021, 21, 16593–16608. [Google Scholar] [CrossRef]
- Valverde, V.; Pay, M.T.; Baldasano, J.M. Circulation-type classification derived on a climatic basis to study air quality dynamics over the Iberian Peninsula. Int. J. Climatol. 2015, 35, 2877–2897. [Google Scholar] [CrossRef]
- Raziei, T.; Azizi, G.; Mohammadi, H.; Khoshakhlagh, F. 500 Hpa Wintertime Daily Circulation Types over Iran and the Middle East. Phys. Geogr. Res. Q. 2011, 42, 17–34. [Google Scholar]
- Fraedrich, K.; Bantzer, C.; Burkhardt, U. Winter climate anomalies in Europe and their associated circulation at 500 hPa. Clim. Dyn. 1993, 8, 161–175. [Google Scholar] [CrossRef]
- Weaver, S.M.; Guinan, P.E.; Semenova, I.G.; Aloysius, N.; Lupo, A.R.; Hunt, S. A Case Study of Drought during Summer 2022: A Large-Scale Analyzed Comparison of Dry and Moist Summers in the Midwest USA. Atmosphere 2023, 14, 1448. [Google Scholar] [CrossRef]
- Wang, Y.; Sun, X. Features and Evolution of Autumn Weather Regimes in the Southeast China. Atmosphere 2022, 13, 1734. [Google Scholar] [CrossRef]
- Sulikowska, A.; Wypych, A. Summer temperature extremes in Europe: How does the definition affect the results? Theor. Appl. Climatol. 2020, 141, 19–30. [Google Scholar] [CrossRef]
- Stephenson, D.B.; Diaz, H.F.; Murnane, R.J. Definition, diagnosis, and origin of extreme weather and climate events. Clim. Extrem. Soc. 2008, 340, 11–23. [Google Scholar]
- Field, C.B.; Barros, V.; Stocker, T.F.; Qin, D.; Dokken, D.J.; Ebi, K.L.; Mastrandrea, M.D.; Mach, K.J.; Plattner, G.-K.; Allen, S.K.; et al. (Eds.) Managing the Risks of Extreme Events and Disasters to Advance Climate Change Adaptation; Cambridge University Press: Cambridge, UK, 2012. [Google Scholar]
- Data, C. Guidelines on analysis of extremes in a changing climate in support of informed decisions for adaptation. World Meteorol. Organ. 2009, 1500, 72. [Google Scholar]
- Zhang, X.; Alexander, L.; Hegerl, G.C.; Jones, P.; Tank, A.K.; Peterson, T.C.; Zwiers, F.W. Indices for monitoring changes in extremes based on daily temperature and precipitation data. Wiley Interdiscip. Rev. Clim. Chang. 2011, 2, 851–870. [Google Scholar] [CrossRef]
- Ustrnul, Z.; Wypych, A.; Kosowski, M. Extreme temperatures and precipitation in Poland—An evaluation attempt. Meteorol. Z. 2012, 21, 37–47. [Google Scholar] [CrossRef] [PubMed]
- Alexander, L.V.; Zhang, X.; Peterson, T.C.; Caesar, J.; Gleason, B.; Klein Tank, A.M.G.; Haylock, M.; Collins, D.; Trewin, B.; Rahimzadeh, F.; et al. Global observed changes in daily climate extremes of temperature and precipitation. J. Geophys. Res. 2006, 111, 1–22. [Google Scholar] [CrossRef]
- Moberg, A.; Jones, P.D.; Lister, D.; Walther, A.; Brunet, M.; Jacobeit, J.; Alexander, L.V.; Della-Marta, P.M.; Luterbacher, J.; Yiou, P.; et al. Indices for daily temperature and precipitation extremes in Europe analyzed for the period 1901–2000. J. Geophys. Res. 2006, 111, D22106. [Google Scholar] [CrossRef]
- Fischer, E.M.; Schär, C. Consistent geographical patterns of changes in high-impact European heatwaves. Nat. Geosci. 2010, 3, 398–403. [Google Scholar] [CrossRef]
- Tomczyk, A.M.; Półrolniczak, M.; Kolendowicz, L. Cold waves in Poznań (Poland) and thermal conditions in the city during selected cold waves. Atmosphere 2018, 9, 208. [Google Scholar] [CrossRef]
- Sanderson, M.; Economou, T.; Salmon, K.; Jones, S. Historical trends and variability in heat waves in the United Kingdom. Atmosphere 2017, 8, 191. [Google Scholar] [CrossRef]
- Lhotka, O.; Kyselý, J. Hot Central-European summer of 2013 in a long-term context. Int. J. Clim. 2015, 35, 4399–4407. [Google Scholar] [CrossRef]
- Revich, B.; Shaposhnikov, D. Excess mortality during heat waves and cold spells in Moscow, Russia. Occup. Environ. Med. 2008, 65, 691–696. [Google Scholar] [CrossRef]
- Topliysky, D. The Climate of Bulgaria; Foundation Amstels: Sofia, Bulgaria, 2006; 300p. (In Bulgarian) [Google Scholar]
- Weiss, A.; Hays, C.J. Calculating daily mean air temperatures by different methods: Implications from a non-linear algorithm. Agric. For. Meteorol. 2005, 128, 57–65. [Google Scholar] [CrossRef]
- Kolyvas, C.; Missiakoulis, S.; Gofa, F. Mean Daily Temperature Estimations and the Impact on Climatological Applications. Environ. Sci. Proc. 2023, 26, 131. [Google Scholar] [CrossRef]
- Compo, G.P.; Whitaker, J.S.; Sardeshmukh, P.D.; Matsui, N.; Allan, R.J.; Yin, X.; Worley, S.J. The twentieth century reanalysis project. Q. J. R. Meteorol. Soc. 2011, 137, 1–28. [Google Scholar] [CrossRef]
- Saha, S.S.; Moorthi, H.; Pan, X.; Wu, J.; Wang, S.; Nadiga, P.; Tripp, R.; Kistler, J.; Woollen, D.; Behringer, H.; et al. The NCEP Climate Forecast System Reanalysis. Bull. Amer. Meteor. Soc. 2010, 91, 1015–1058. [Google Scholar] [CrossRef]
- Kalnay, E.M.; Kanamitsu, R.; Kistler, W.; Collins, D.; Deaven, L.; Gandin, M.; Iredell, S.; Saha, G.; White, J.; Woollen, Y.; et al. The NCEP/NCAR 40—Year Reanalysis Project. Bull. Amer. Meteor. Soc. 1996, 77, 437–471. [Google Scholar] [CrossRef]
- Available online: https://wetter3.de/archiv_gfs_dt.html (accessed on 18 December 2023).
- Kendall, M.G. Rank Correlation Methods. By Maurice, G.; Kendall, MA [Pp. Vii + 160. London: Charles Griffinand Co. Ltd., 42 Drury Lane, 1948. 18 S]. J. Inst. Actuar 1949, 75, 140–141. [Google Scholar]
- Sen, P.K. Estimates of the regression coefficient based on Kendall’s tau. J. Am. Stat. Assoc. 1968, 63, 1379–1389. [Google Scholar] [CrossRef]
- Gocic, M.; Trajkovic, S. Analysis of changes in meteorological variables using Mann-Kendall and Sen’s slope estimator statistical tests in Serbia. Glob. Planet. Chang. 2013, 100, 172–182. [Google Scholar] [CrossRef]
- Malcheva, K.; Bocheva, L.; Chervenkov, H. Spatio-Temporal Variation of Extreme Heat Events in Southeastern Europe. Atmosphere 2022, 13, 1186. [Google Scholar] [CrossRef]
- Zahradníček, P.; Brázdil, R.; Řehoř, J.; Lhotka, O.; Dobrovolný, P.; Štěpánek, P.; Trnka, M. Temperature extremes and circulation types in the Czech Republic, 1961–2020. Int. J. Climatol. 2020, 42, 4808–4829. [Google Scholar] [CrossRef]
- Sfîcă, L.; Niţă, A.; Iordache, I.; Ilie, N. Specific weather conditions on Romanian territory for Hess-Brezowsky westerly circulation type. In Proceedings of the 15th International Multidisciplinary Scientific Geo Conference SGEM 2015, Conference Proceedings, Albena, Bulgaria, 18–24 June 2015; Volume 4, pp. 1073–1080, ISBN 978-619-7105-38-4, ISSN 1314-2704. [Google Scholar] [CrossRef]
- Bartoszek, K. The main characteristics of atmospheric circulation over East-Central Europe from 1871 to 2010. Meteorol. Atmos. Phys. 2017, 129, 113–129. [Google Scholar] [CrossRef]


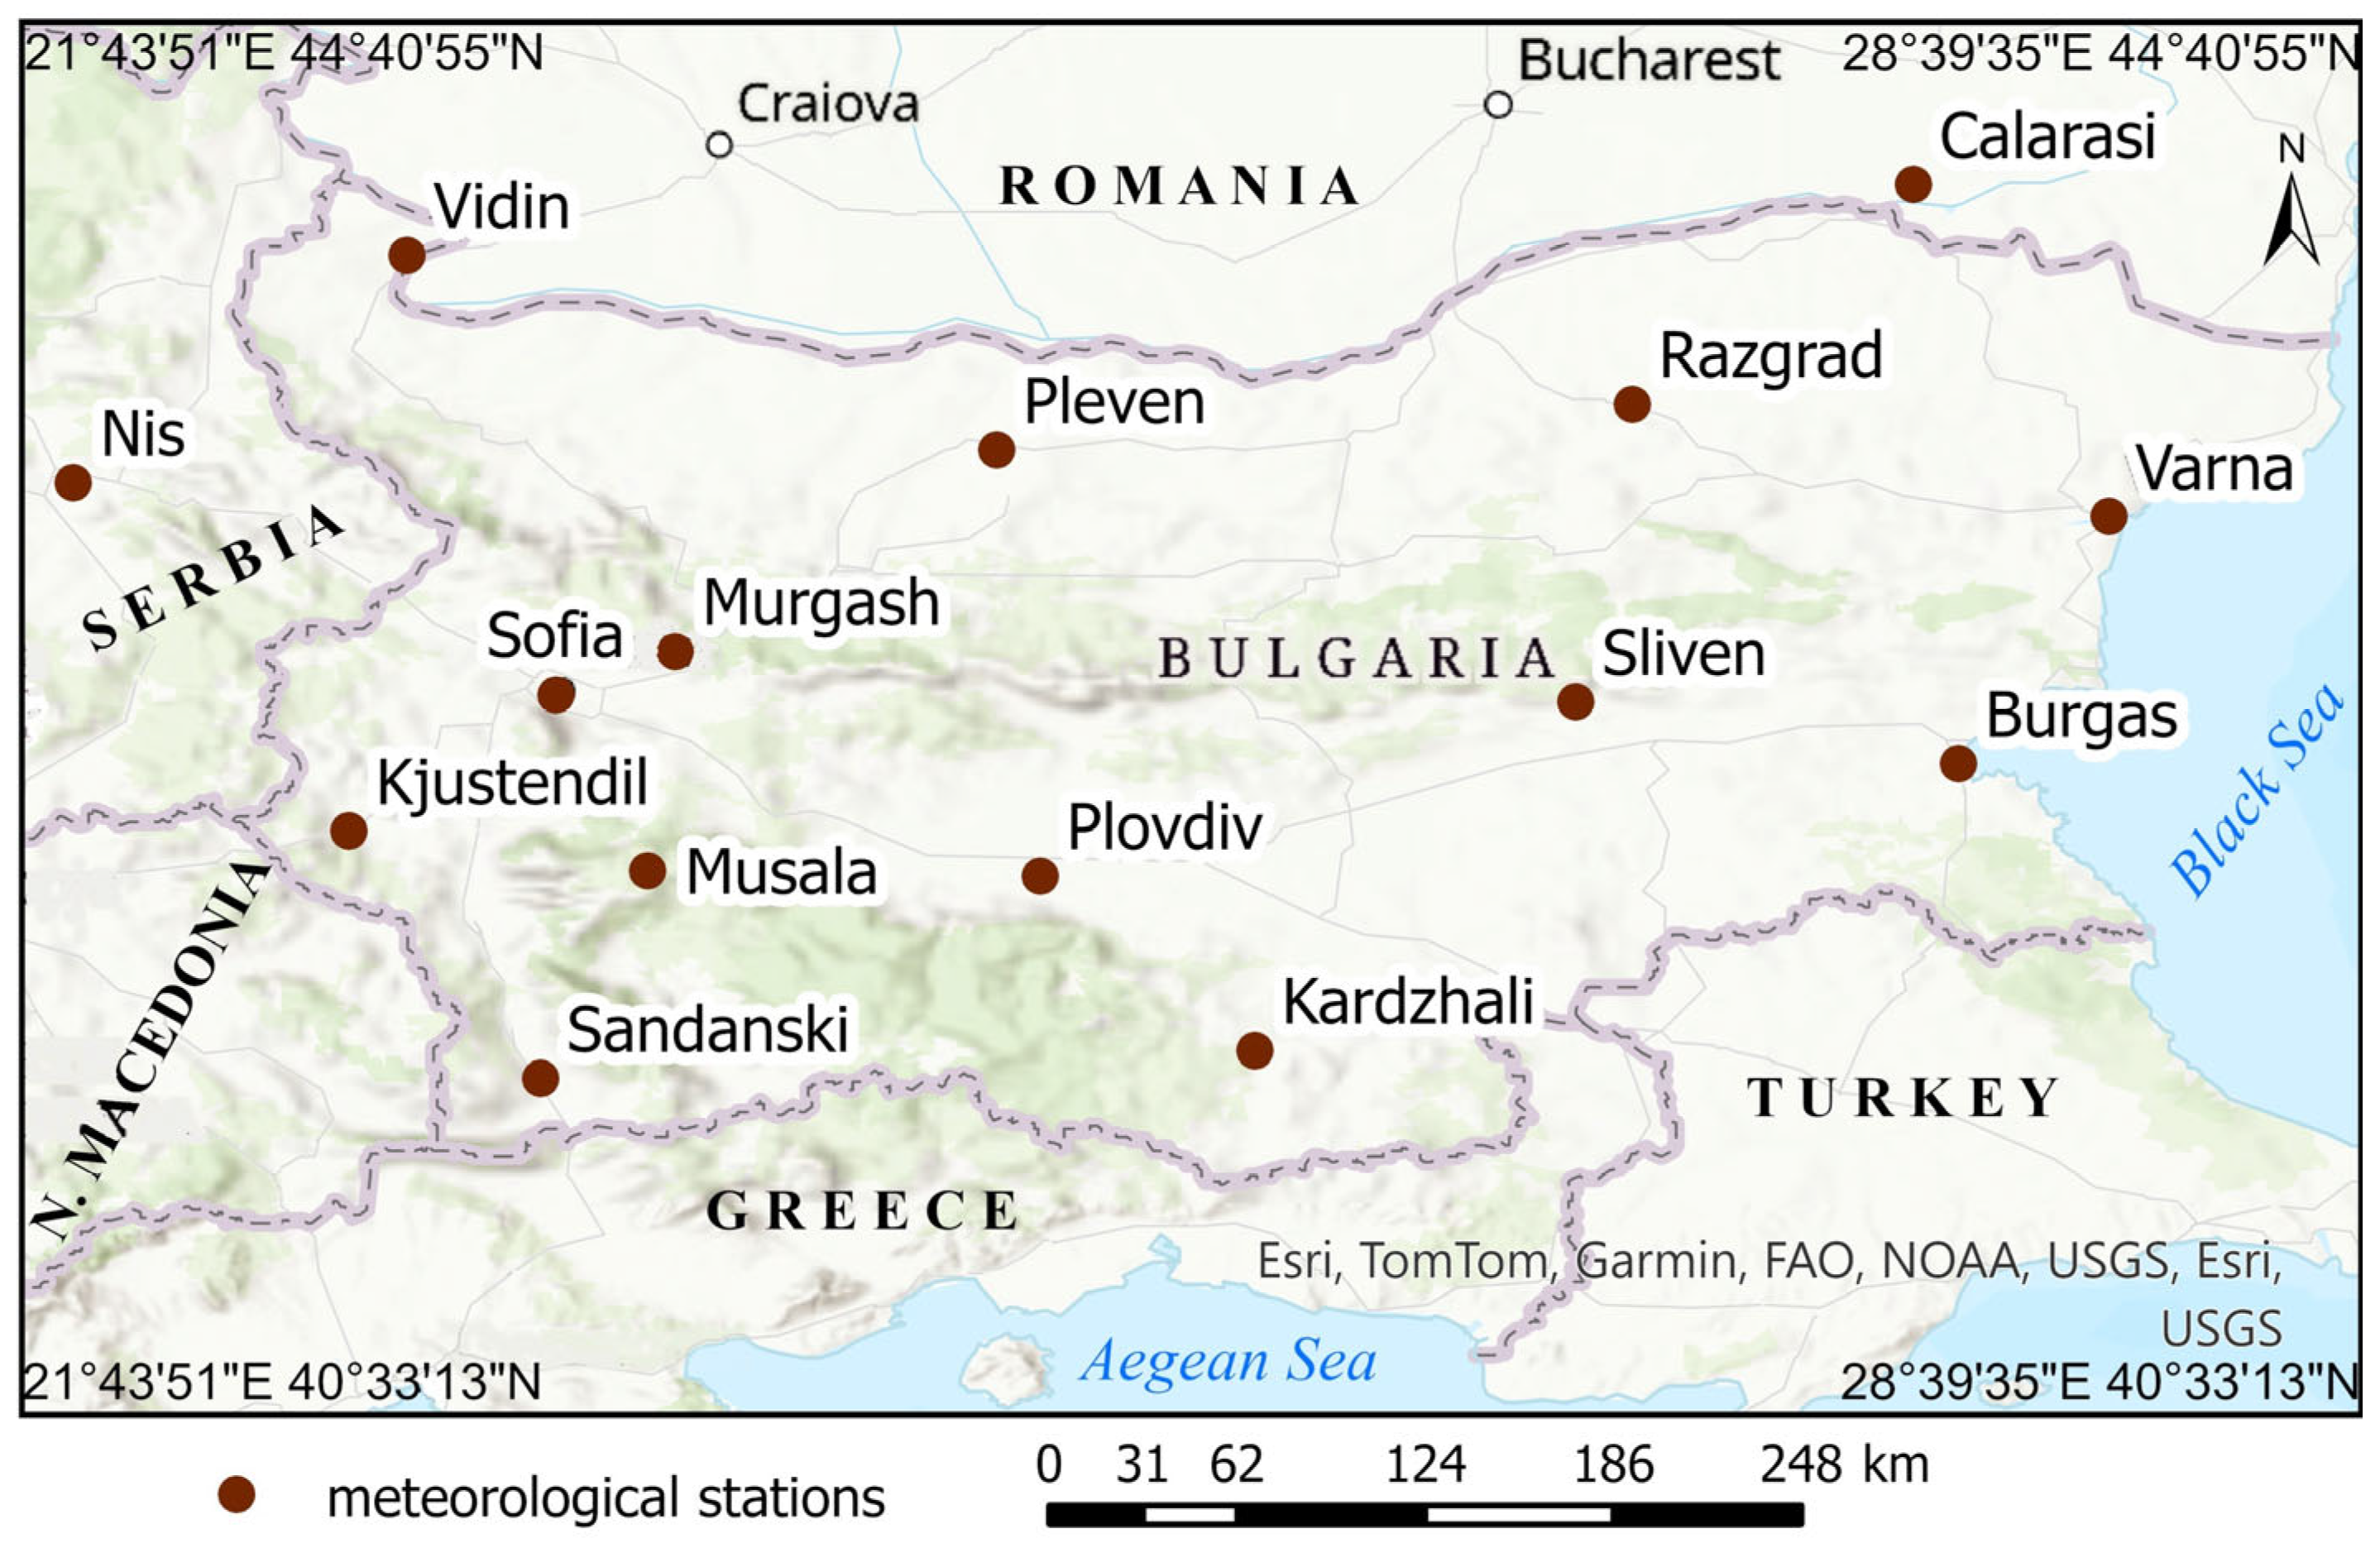
| Station | Altitude | Latitude | Longitude | Climate Zone |
|---|---|---|---|---|
| Vidin | 31 | 43°59′39.1″ N | 22°51′09.1″ E | Cfa |
| Pleven | 160 | 43°24′26.5″ N | 24°36′22.4″ E | Cfa |
| Razgrad | 346 | 43°33′58.5″ N | 26°30′27.7″ E | Cfb |
| Calarasi | 20 | 44°12′21.0″ N | 27°20′18.0″ E | Cfa |
| Varna | 39 | 43°12′45.0″ N | 27°57′08.3″ E | Cfa |
| Burgas | 21 | 42°29′51.7″ N | 27°28′57.7″ E | Cfa |
| Sliven | 259 | 42°40′39.9″ N | 26°20′23.5″ E | Cfa |
| Kardzhali | 337 | 41°38′48.2″ N | 25°23′07.2″ E | Csa |
| Plovdiv | 154 | 42°08′03.5″ N | 24°48′09.0″ E | Cfa |
| Sandanski | 206 | 41°33′00.0″ N | 23°16′02.5″ E | Csa |
| Kjustendil | 520 | 42°17′01.7″ N | 22°42′47.3″ E | Cfb |
| Musala | 2925 | 42°10′45.6″ N | 23°35′06.7″ E | E |
| Murgash | 1687 | 42°49′58.4″ N | 23°40′07.7″ E | Dfc |
| Sofia | 586 | 42°39′13.2″ N | 23°22′58.3″ E | Cfb |
| Nis | 202 | 43°19′35.2″ N | 21°53′51.4″ E | Cfa |
| Type | % of All Types | % of AC Types |
|---|---|---|
| A1 | 1.6 | 4.0 |
| A2 | 0.8 | 2.0 |
| A3 | 1.3 | 3.3 |
| A4 | 28.7 | 71.9 |
| A5 | 7.5 | 18.8 |
| All (AC) | 39.9 | 100.0 |
| Station | Summer | June | July | August | ||||
|---|---|---|---|---|---|---|---|---|
| p10 | p90 | p10 | p90 | p10 | p90 | p10 | p90 | |
| Vidin | 20/0 | 2/17 | 7/0 | 0/7 | 7/0 | 2/4 | 6/0 | 0/6 |
| Pleven | 18/0 | 3/16 | 6/0 | 1/6 | 6/0 | 2/4 | 6/0 | 0/6 |
| Razgrad | 16/1 | 2/16 | 5/1 | 1/5 | 6/0 | 1/5 | 5/0 | 0/6 |
| Calarasi | 19/1 | 2/19 | 6/0 | 1/7 | 5/1 | 1/6 | 8/0 | 0/6 |
| Varna | 17/1 | 0/21 | 6/0 | 0/7 | 6/0 | 0/7 | 5/1 | 0/7 |
| Burgas | 18/0 | 0/21 | 6/0 | 0/6 | 6/0 | 0/7 | 6/0 | 0/8 |
| Sliven | 15/3 | 1/18 | 5/1 | 1/5 | 5/1 | 0/6 | 5/1 | 0/7 |
| Kardzhali | 14/4 | 2/16 | 4/2 | 1/5 | 5/1 | 1/5 | 5/1 | 0/6 |
| Plovdiv | 18/0 | 0/18 | 6/0 | 1/6 | 6/0 | 0/6 | 6/0 | 0/6 |
| Sandanski | 18/1 | 3/17 | 6/0 | 1/5 | 6/0 | 2/6 | 6/1 | 0/6 |
| Kjustendil | 16/2 | 2/18 | 5/1 | 0/6 | 6/0 | 2/5 | 5/1 | 0/7 |
| Musala | 17/1 | 3/16 | 6/0 | 0/6 | 6/0 | 2/5 | 5/1 | 1/5 |
| Murgash | 17/1 | 2/16 | 6/0 | 0/6 | 6/0 | 2/4 | 5/1 | 0/6 |
| Sofia | 18/0 | 2/17 | 6/0 | 0/7 | 6/0 | 2/4 | 6/0 | 0/6 |
| Nis | 16/2 | 2/17 | 6/0 | 0/6 | 6/0 | 2/5 | 4/2 | 0/6 |
| ALL | 257/17 | 26/263 | 86/5 | 7/90 | 88/3 | 19/79 | 83/9 | 1/94 |
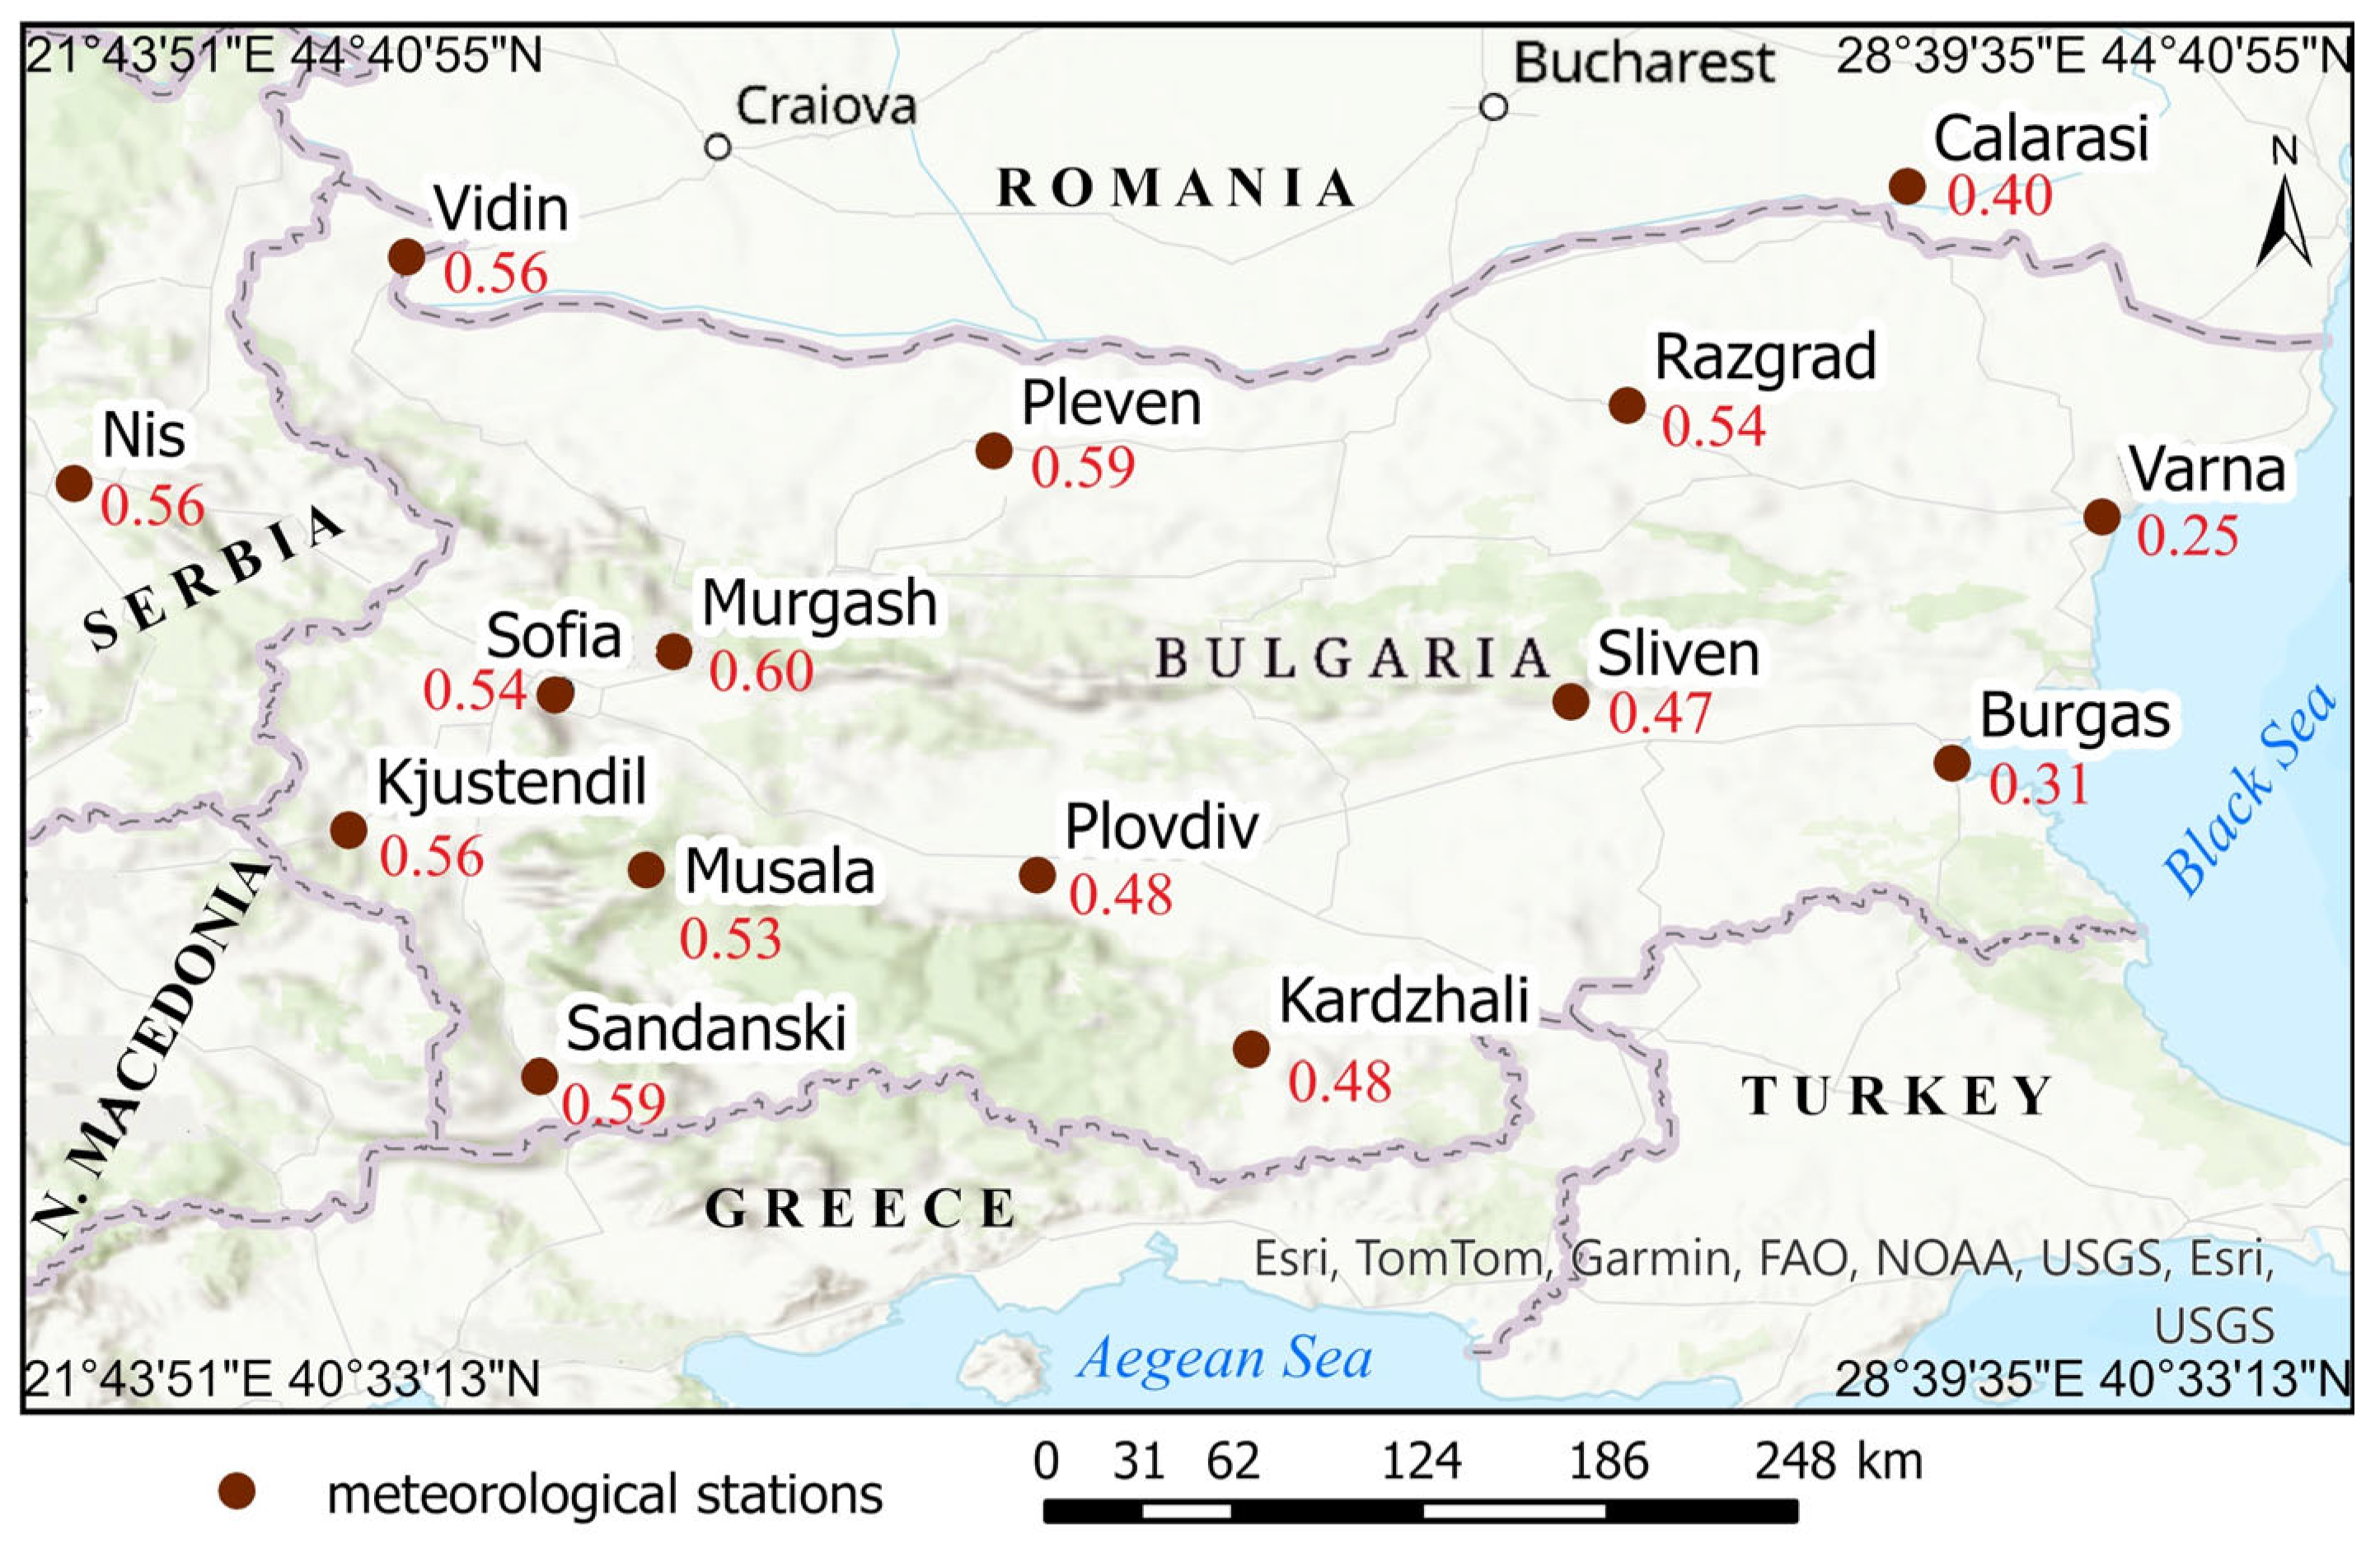
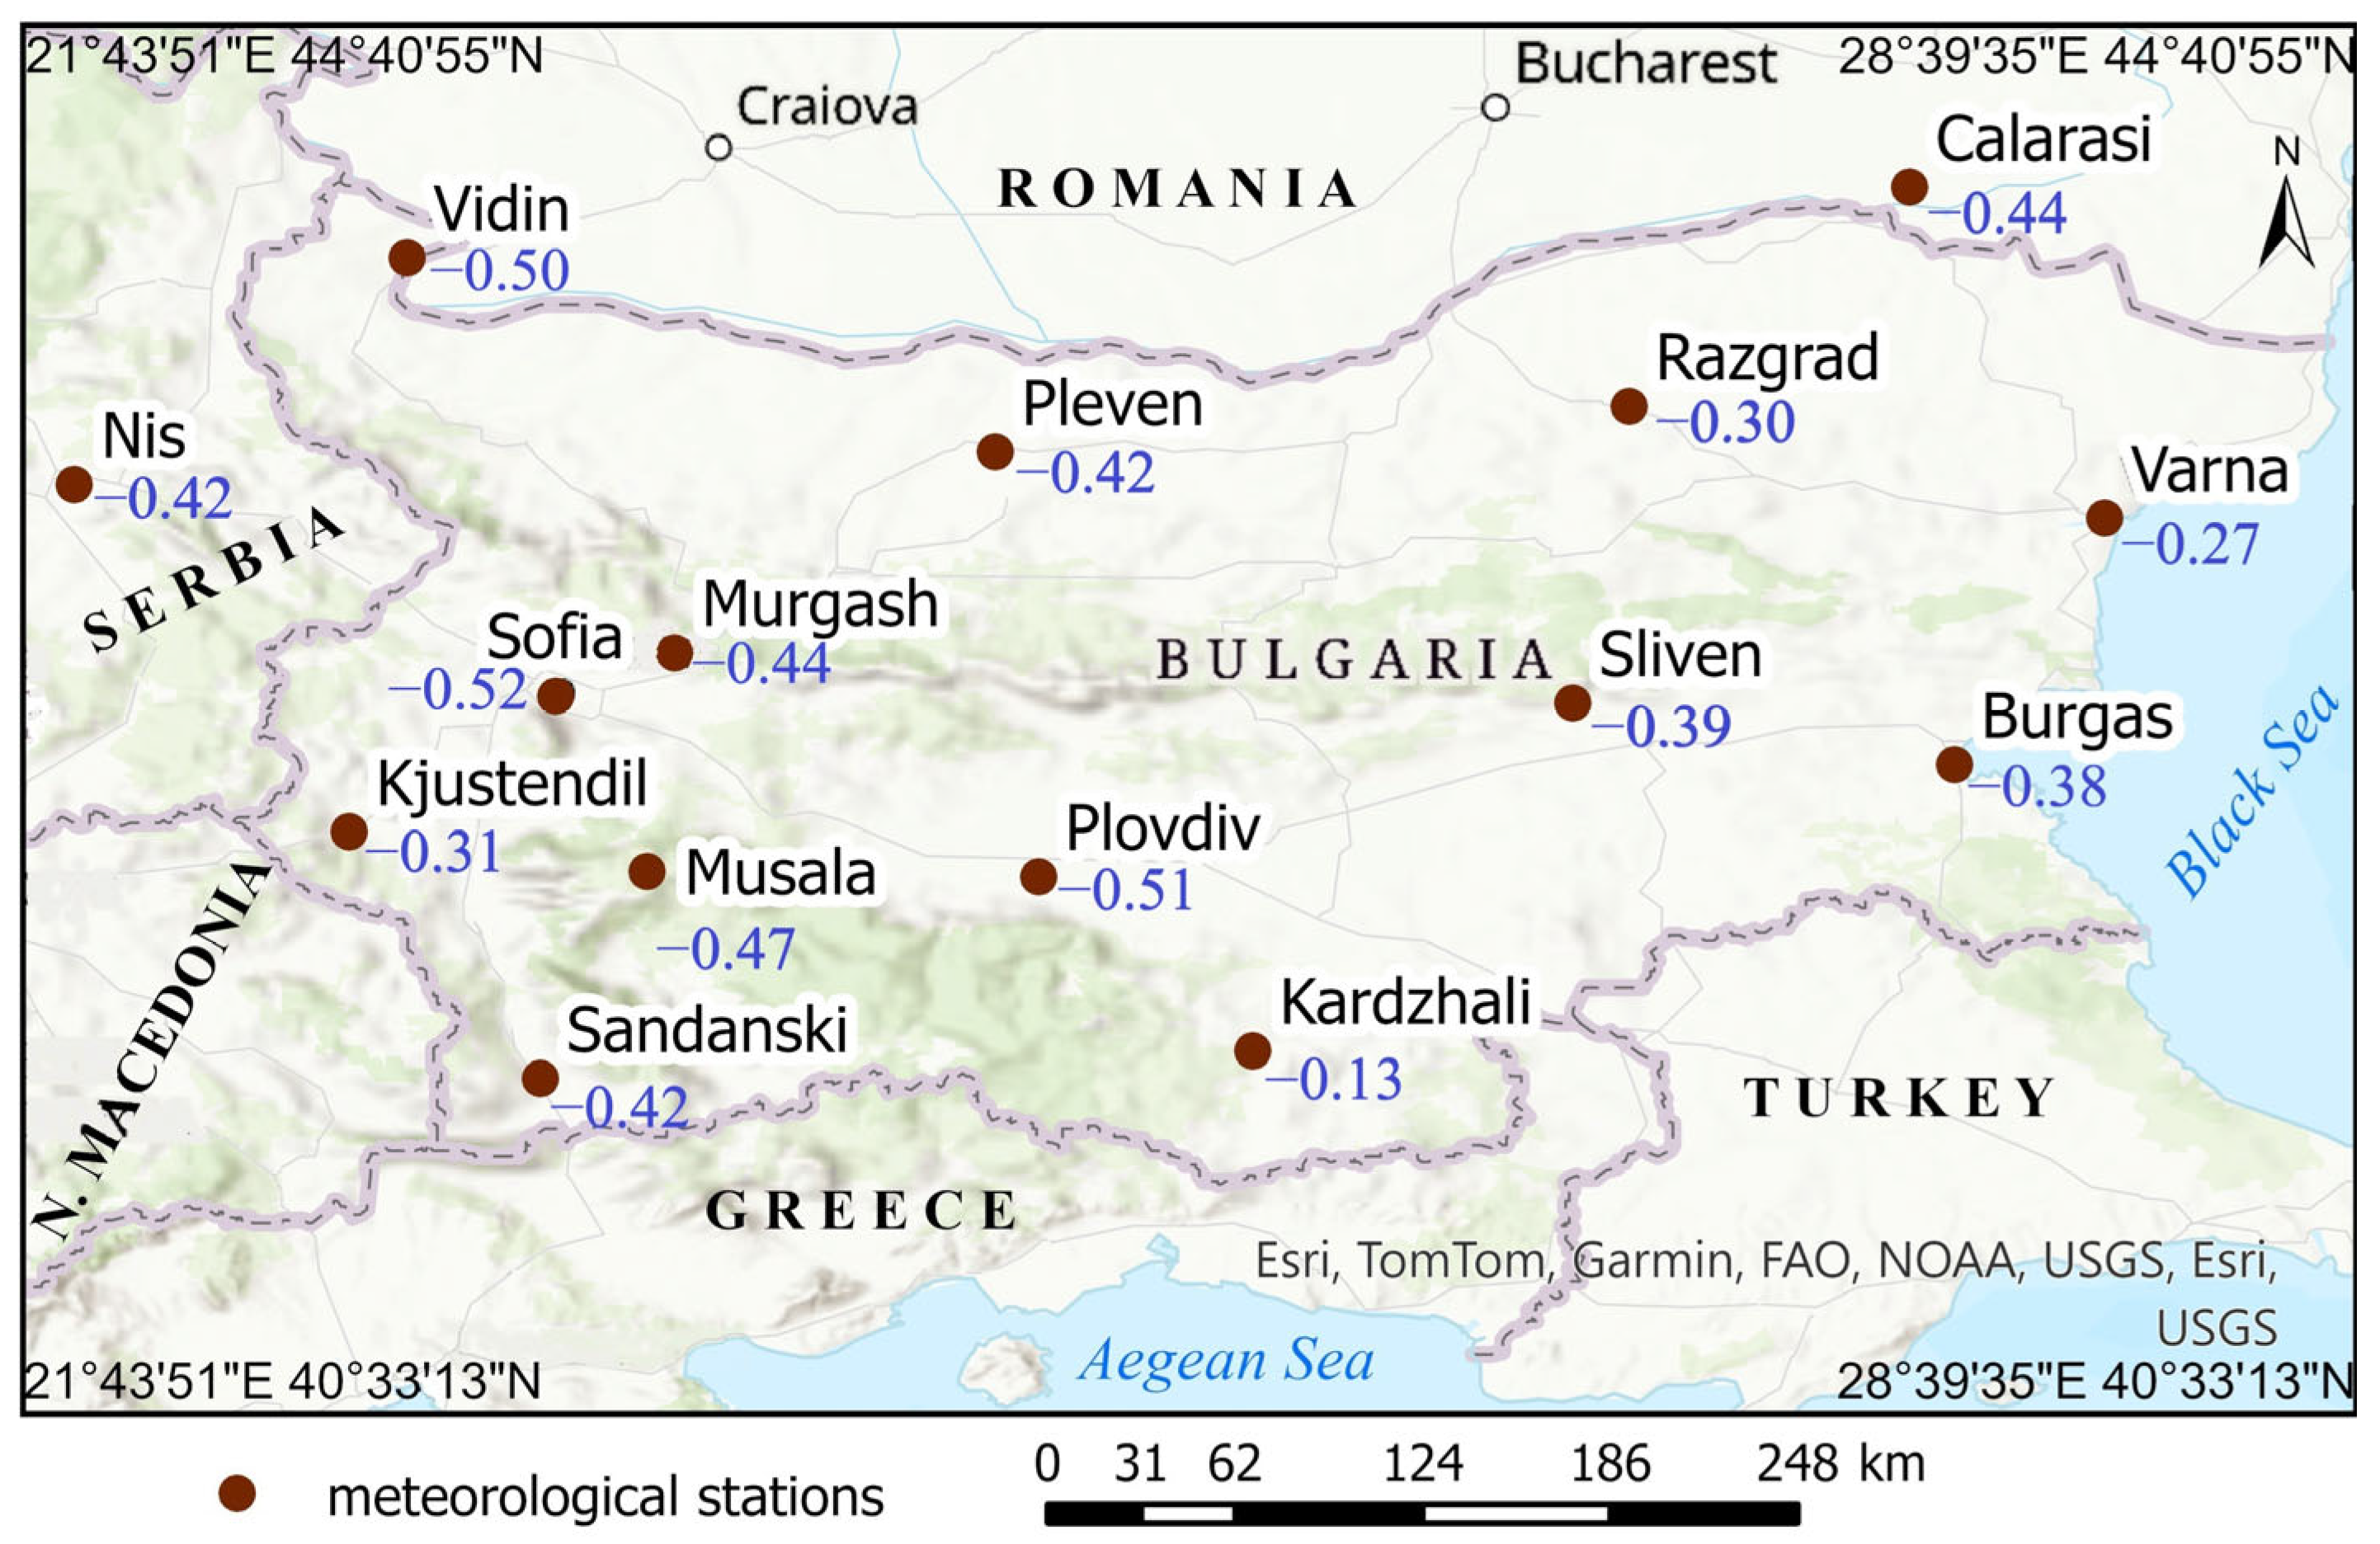
| Station | A1 | A2 | A3 | A4 | VI | VII | VIII | A5 | VI | VII | VIII |
|---|---|---|---|---|---|---|---|---|---|---|---|
| Vidin | −0.57 | −0.20 | 0.12 | 0.56 | 0.29 | 0.56 | 0.66 | −0.50 | −0.17 | −0.42 | −0.25 |
| Pleven | −0.49 | −0.15 | 0.23 | 0.59 | 0.29 | 0.66 | 0.68 | −0.42 | −0.17 | −0.28 | −0.20 |
| Razgrad | −0.47 | −0.06 | 0.12 | 0.54 | 0.33 | 0.61 | 0.60 | −0.30 | −0.09 | −0.34 | −0.25 |
| Calarasi | −0.47 | −0.04 | −0.06 | 0.40 | 0.19 | 0.50 | 0.51 | −0.44 | −0.27 | −0.20 | −0.13 |
| Varna | −0.37 | 0.07 | 0.01 | 0.25 | 0.07 | 0.31 | 0.39 | −0.27 | −0.15 | −0.21 | −0.05 |
| Burgas | −0.42 | −0.01 | 0.03 | 0.31 | 0.15 | 0.34 | 0.44 | −0.38 | −0.20 | −0.25 | −0.14 |
| Sliven | −0.48 | −0.09 | 0.05 | 0.47 | 0.28 | 0.51 | 0.53 | −0.39 | −0.19 | −0.25 | −0.13 |
| Kardzhali | −0.43 | 0.01 | 0.06 | 0.48 | 0.32 | 0.60 | 0.54 | −0.13 | 0.01 | 0.06 | −0.02 |
| Plovdiv | −0.55 | −0.16 | 0.10 | 0.48 | 0.27 | 0.55 | 0.57 | −0.51 | −0.21 | −0.32 | −0.25 |
| Sandanski | −0.58 | −0.10 | 0.18 | 0.59 | 0.34 | 0.66 | 0.62 | −0.42 | −0.09 | −0.24 | −0.16 |
| Kjustendil | −0.53 | −0.01 | 0.18 | 0.56 | 0.32 | 0.63 | 0.64 | −0.31 | −0.10 | −0.21 | −0.11 |
| Musala | −0.53 | −0.04 | 0.08 | 0.53 | 0.31 | 0.65 | 0.65 | −0.47 | −0.20 | −0.22 | −0.15 |
| Murgash | −0.56 | −0.10 | 0.12 | 0.60 | 0.38 | 0.66 | 0.68 | −0.44 | −0.19 | −0.29 | −0.18 |
| Sofia | −0.57 | −0.17 | 0.15 | 0.54 | 0.29 | 0.58 | 0.66 | −0.52 | −0.24 | −0.43 | −0.23 |
| Nis | −0.56 | −0.10 | 0.12 | 0.56 | 0.31 | 0.55 | 0.69 | −0.42 | −0.14 | −0.36 | −0.21 |
| Summer | VI | VII | VIII | Station | Summer | VI | VII | VIII |
|---|---|---|---|---|---|---|---|---|
| (t,n) ≤ p10 | (t,n) ≤ p10 | (t,n) ≤ p10 | (t,n) ≤ p10 | Type A4 | (t,n) ≥ 90p | (t,n) ≥ 90p | (t,n) ≥ 90p | (t,n) ≥ 90p |
| 1969, 1976 | 1976, 1989 | 1969, 1971 | 1976 | Vidin | 2007, 2012 | 2003, 2007, 2012 | 1987, 2007, 2012 | 1992 |
| 1969, 1976 | 1976, 1989 | 1969, 1971, 1981 | 1976 | Pleven | 2007, 2012 | 2003, 2007, 2012 | 1987, 2007, 2012 | 1992, 2000, 2008 |
| 1969, 1976 | 1976, 1989 | 1969, 1971, 1981 | 1976, 1997 | Razgrad | 2007, 2000, 2012 | 2003, 2007, 2012 | 2007, 2012 | 1992, 2008 |
| 1969, 1976 | 1976, 1989 | 1969, 1971, 1981 | 1976 | Calarasi | 2007, 2012 | 2003, 2007, 2012 | 2007, 2012 | 1992 |
| 1976 | 1989 | 1976, 1997 | Varna | 2007, 2012 | 2003, 2007, 2012 | 2007, 2012 | ||
| 1976 | 1989 | 1969, 1971 | 1976 | Burgas | 2007, 2012 | 2003, 2007, 2012 | 2007, 2012 | |
| 1976 | 1976, 1989 | 1969, 1971 | 1976, 1997 | Sliven | 2007, 2012 | 2003, 2007, 2012 | 2007, 2012 | 2008 |
| 1976 | 1989 | 1969, 1971 | 1976, 1997 | Kardzhali | 2007, 2012 | 2003, 2007, 2012 | 2007, 2012 | 1992 |
| 1969, 1976 | 1976, 1989 | 1969, 1971 | 1976 | Plovdiv | 2007, 2012 | 2003, 2007, 2012 | 2007, 2012 | 1992 |
| 1969, 1976 | 1976, 1989 | 1969, 1971 | 1976, 1997 | Sandanski | 2007, 2008, 2012 | 2003, 2007, 2012 | 1987, 2007, 2012 | 1992, 2008 |
| 1969, 1976 | 1976, 1989 | 1969, 1971, 1981 | 1976, 1997 | Kjustendil | 2007, 2012 | 2003, 2007, 2012 | 1987, 2007, 2012 | 1963, 2000 |
| 1969, 1976 | 1976, 1989 | 1969, 1971 | 1976, 1997 | Musala | 2007, 2012 | 2003, 2007, 2012 | 1987, 2007, 2012 | 1992,2 008 |
| 1969, 1976 | 1976, 1989 | 1969, 1971, 1981 | 1976, 1997 | Murgash | 2007, 2012 | 2003, 2007, 2012 | 1987, 2007, 2012 | 1992, 2000 |
| 1969, 1976 | 1976, 1989 | 1969, 1971, 1981 | 1976 | Sofia | 2007, 2012 | 2003, 2007, 2012 | 1987, 2007, 2012 | 1992, 2000, 2008 |
| 1969, 1976 | 1976, 1989 | 1969, 1971 | 1976, 1997 | Nis | 2007, 2008, 2012 | 2003, 2007, 2012 | 1987, 2007, 2012 | 1992, 2000 |
| Summer | Station | Summer |
|---|---|---|
| t ≤ p10; n ≥ 90p | Type A5 | t ≥ 90p; n ≤ p10 |
| 1968, 1969 | Vidin | 2003, 2012 |
| 1969 | Pleven | 2003, 2012 |
| 1969 | Razgrad | 2003, 2012 |
| 1969 | Calarasi | 2003, 2012, 2019 |
| Varna | 2012, 2019 | |
| 1974 | Burgas | 2003, 2012, 2019 |
| Sliven | 2003, 2012 | |
| Kardzhali | 2003, 2012 | |
| 1969 | Plovdiv | 1998, 2003, 2012 |
| 1969 | Sandanski | 2012 |
| 1969 | Kjustendil | 2012, 2015, 2019 |
| 1969, 1974 | Musala | 2012, 2019 |
| 1969 | Murgash | 2003, 2012, 2019 |
| 1969 | Sofia | 2003, 2012, 2019 |
| 1969 | Nis | 2003, 2012, 2019 |
Disclaimer/Publisher’s Note: The statements, opinions and data contained in all publications are solely those of the individual author(s) and contributor(s) and not of MDPI and/or the editor(s). MDPI and/or the editor(s) disclaim responsibility for any injury to people or property resulting from any ideas, methods, instructions or products referred to in the content. |
© 2024 by the authors. Licensee MDPI, Basel, Switzerland. This article is an open access article distributed under the terms and conditions of the Creative Commons Attribution (CC BY) license (https://creativecommons.org/licenses/by/4.0/).
Share and Cite
Pophristov, V.; Nikolova, N.; Matev, S.; Gera, M. Relations between High Anticyclonic Atmospheric Types and Summer Season Temperature in Bulgaria. Atmosphere 2024, 15, 620. https://doi.org/10.3390/atmos15060620
Pophristov V, Nikolova N, Matev S, Gera M. Relations between High Anticyclonic Atmospheric Types and Summer Season Temperature in Bulgaria. Atmosphere. 2024; 15(6):620. https://doi.org/10.3390/atmos15060620
Chicago/Turabian StylePophristov, Vulcho, Nina Nikolova, Simeon Matev, and Martin Gera. 2024. "Relations between High Anticyclonic Atmospheric Types and Summer Season Temperature in Bulgaria" Atmosphere 15, no. 6: 620. https://doi.org/10.3390/atmos15060620
APA StylePophristov, V., Nikolova, N., Matev, S., & Gera, M. (2024). Relations between High Anticyclonic Atmospheric Types and Summer Season Temperature in Bulgaria. Atmosphere, 15(6), 620. https://doi.org/10.3390/atmos15060620