The initial findings from the bibliometric analysis encapsulate the bibliographic statistics. In this section, we offer an in-depth analysis of indicators, information, and hot keywords in the relevant literature in the field of study, the country of origin and institution of the first author, the journal from which the study originated, the top ten authors globally, and the most influential papers.
4.2. WOS Research Domains
Clarivate Analytics’s WOS research domains are used to categorize research publications [
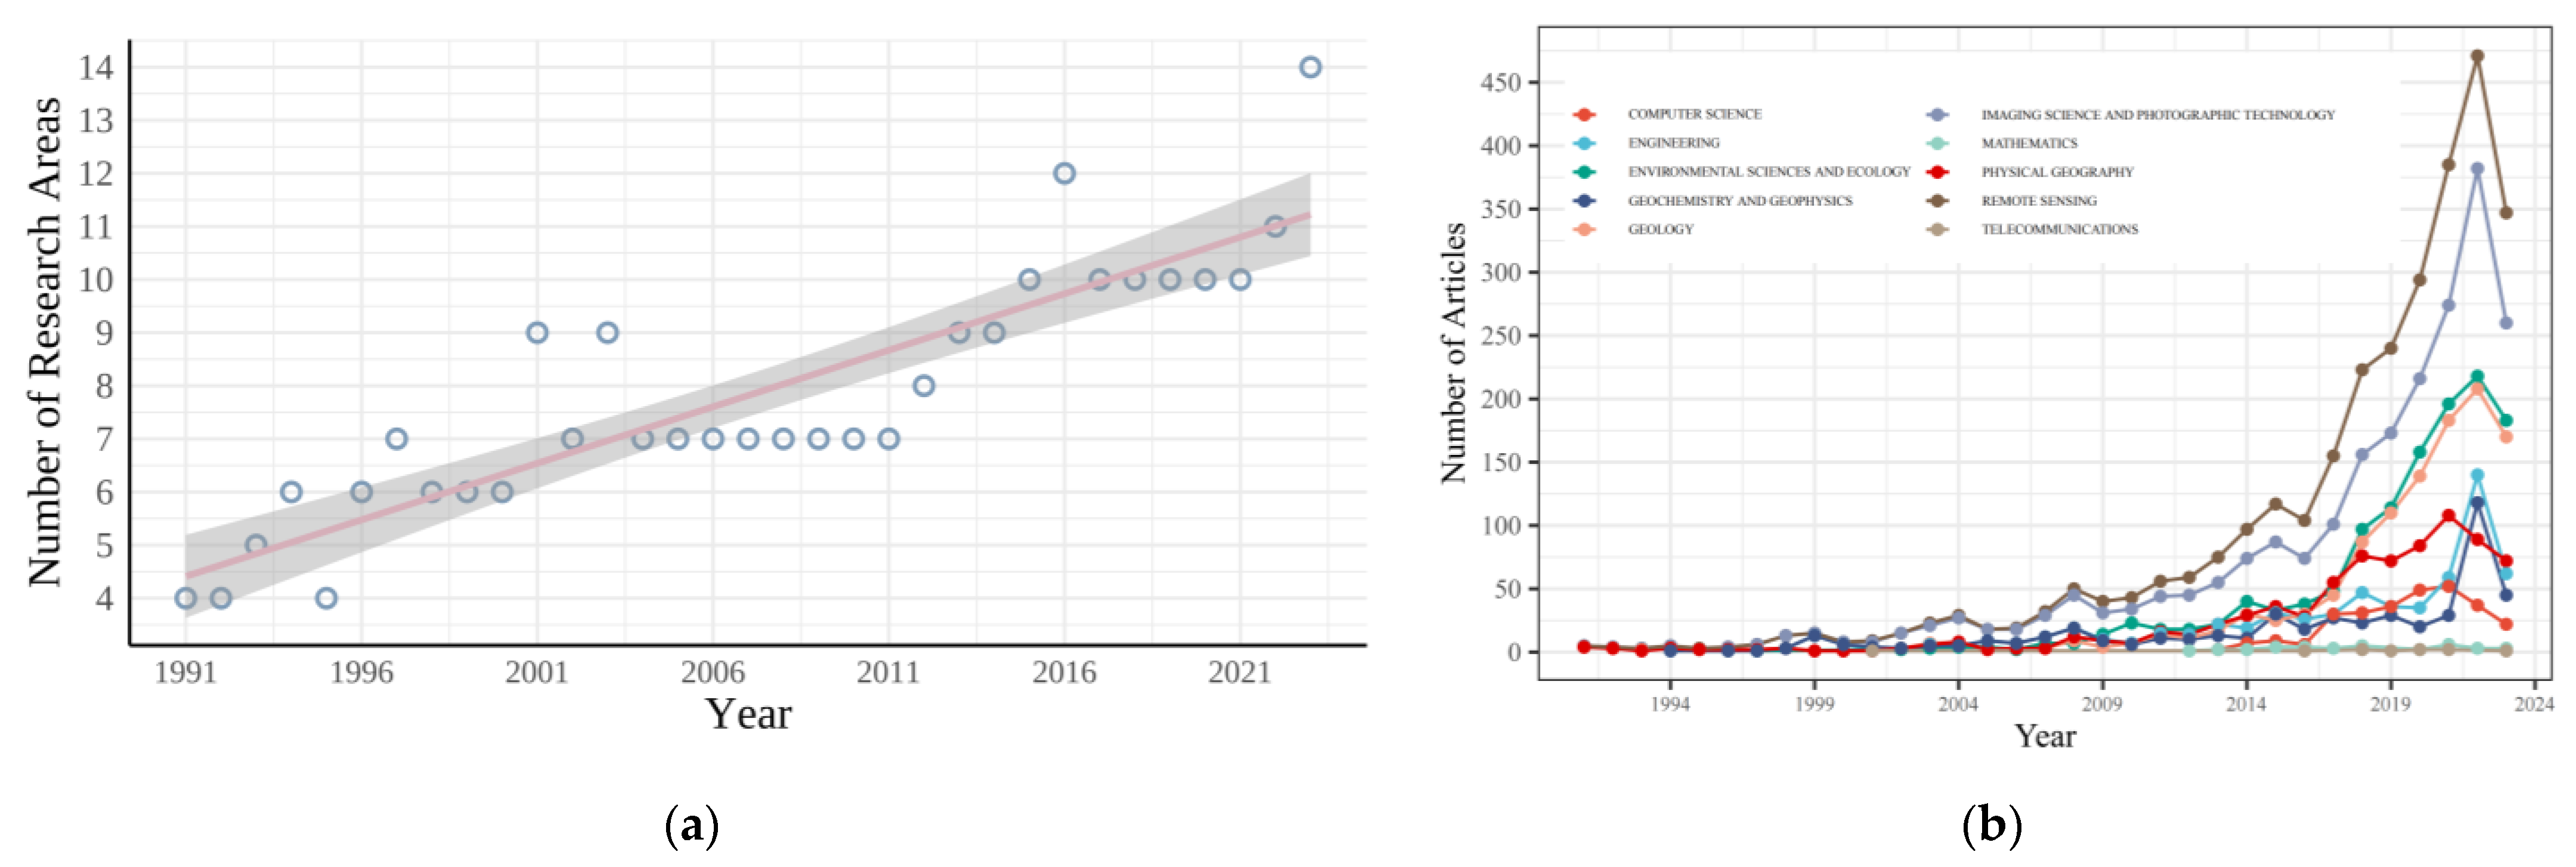
15]. Each document in the WOS database is categorizable into a minimum of one particular subject of study. This analysis shows that the literature on remote sensing STF covers an increased number of research subjects in 2023, 14, compared to 4 in 1991 (
Figure 3a). The top 10 research fields with the highest production include remote sensing, computer science, mathematics, environmental science and ecology, geology, physical geography, engineering, geochemistry and geophysics, imaging science and photographic technology, geology, and telecommunications.
Figure 3b illustrates the annual progression of the ten most prolific areas in STF research, delineating the shift in focus areas over time. Preceding 2009, geochemistry and geophysics, computer and imaging science, and photographic science and photographic technology were the main fields of study, after which each area garnered increasing attention. By 2022, remote sensing became the dominant area, with a large output of STF literature. However, all fields show a clear downward trend by 2023. The three scientific fields with the highest number of closely linked citations are remote sensing, imaging science and photographic technology, and environmental science with ecology.
4.3. Exploration of Research Countries
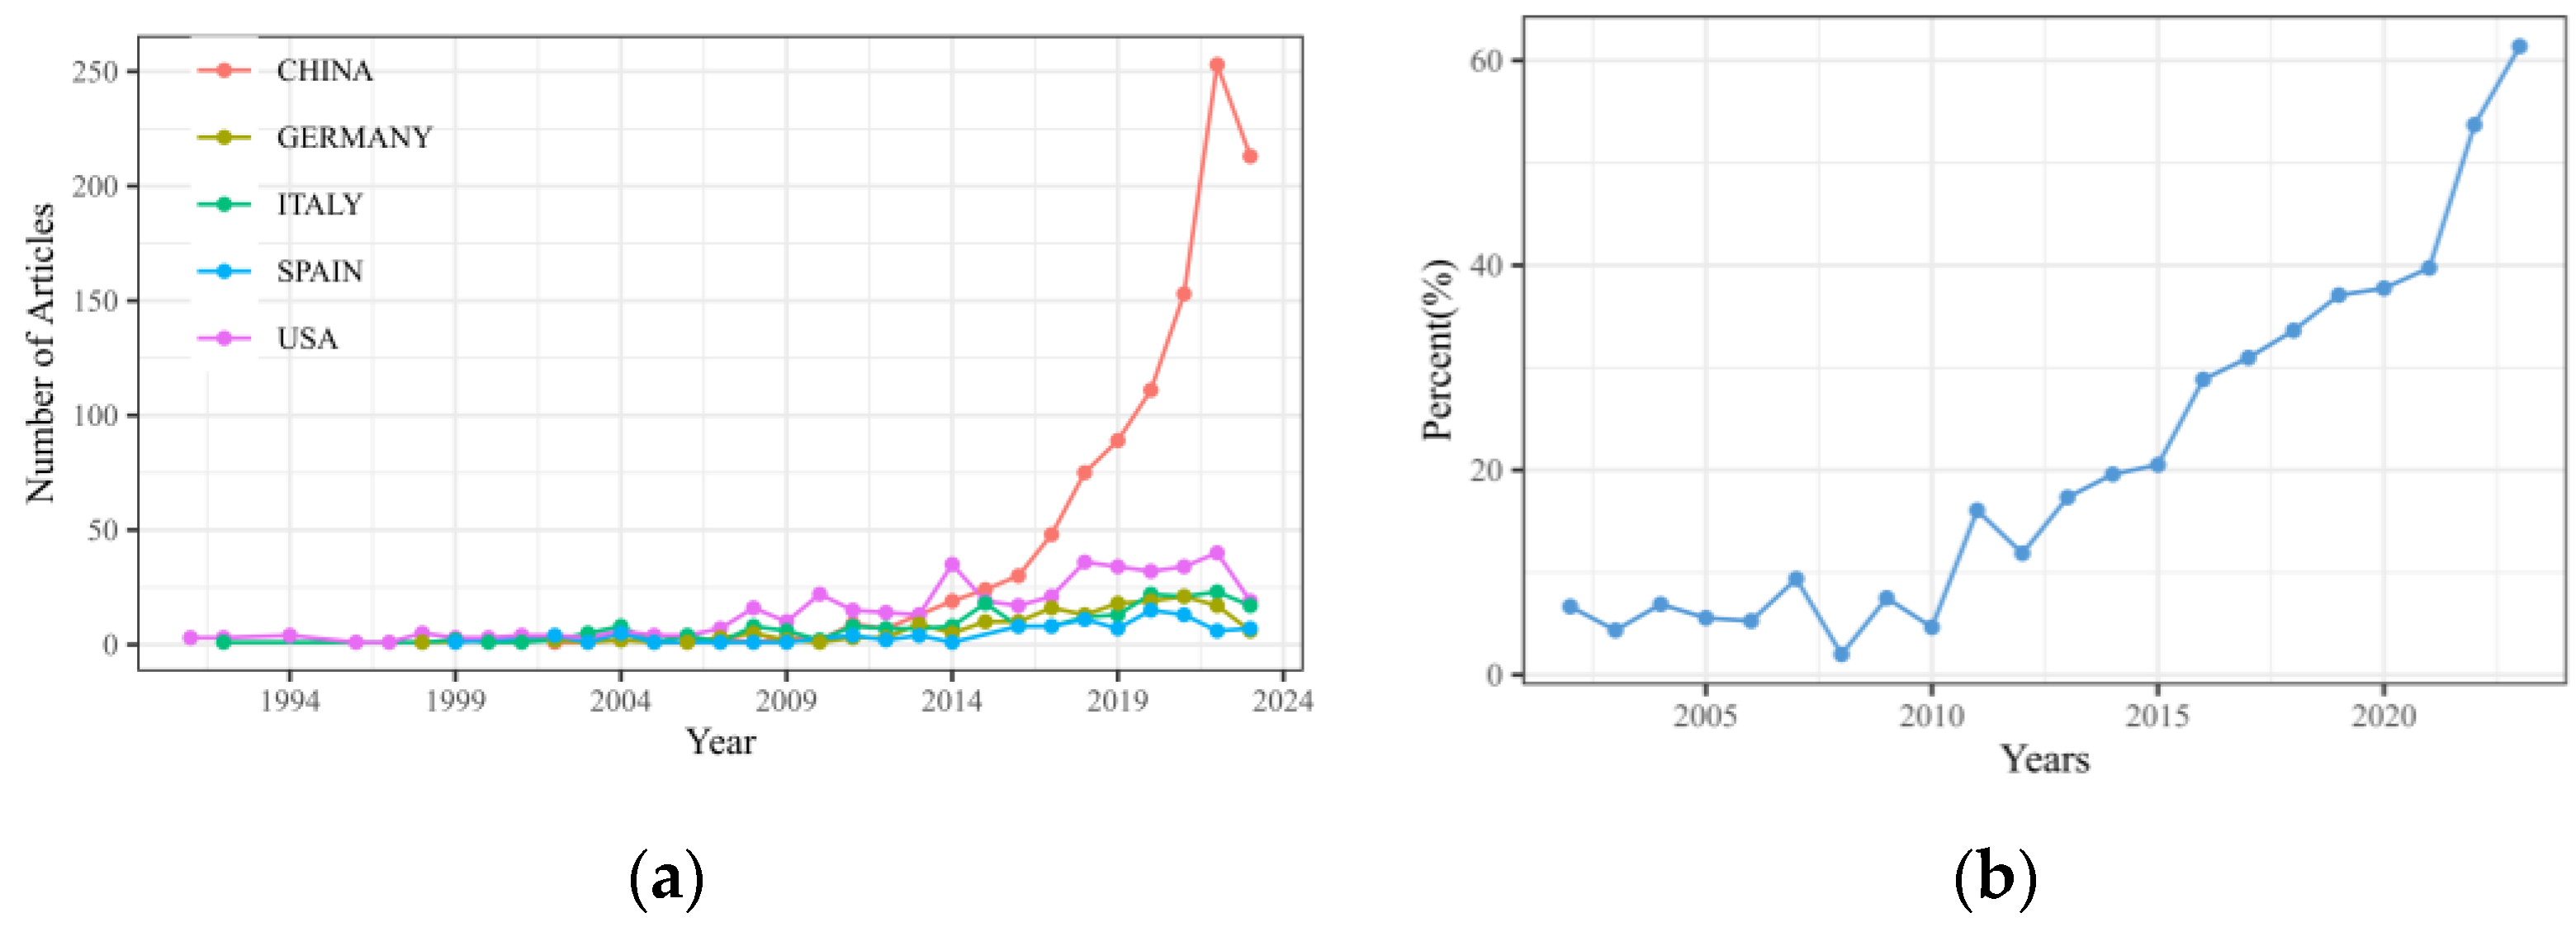
The results show that authors from 50 countries have researched STF in remote sensing. The five countries with the most research outputs are China (1059 papers), the United States (432 papers), Italy (215 papers), Germany (169 papers), and Spain (101 papers). Since 2015, the number of publications from China has increased, surpassing that of the United States (
Figure 4a). China’s share of remote sensing STF scientific output has grown yearly, reaching 61.38% by 2023 (
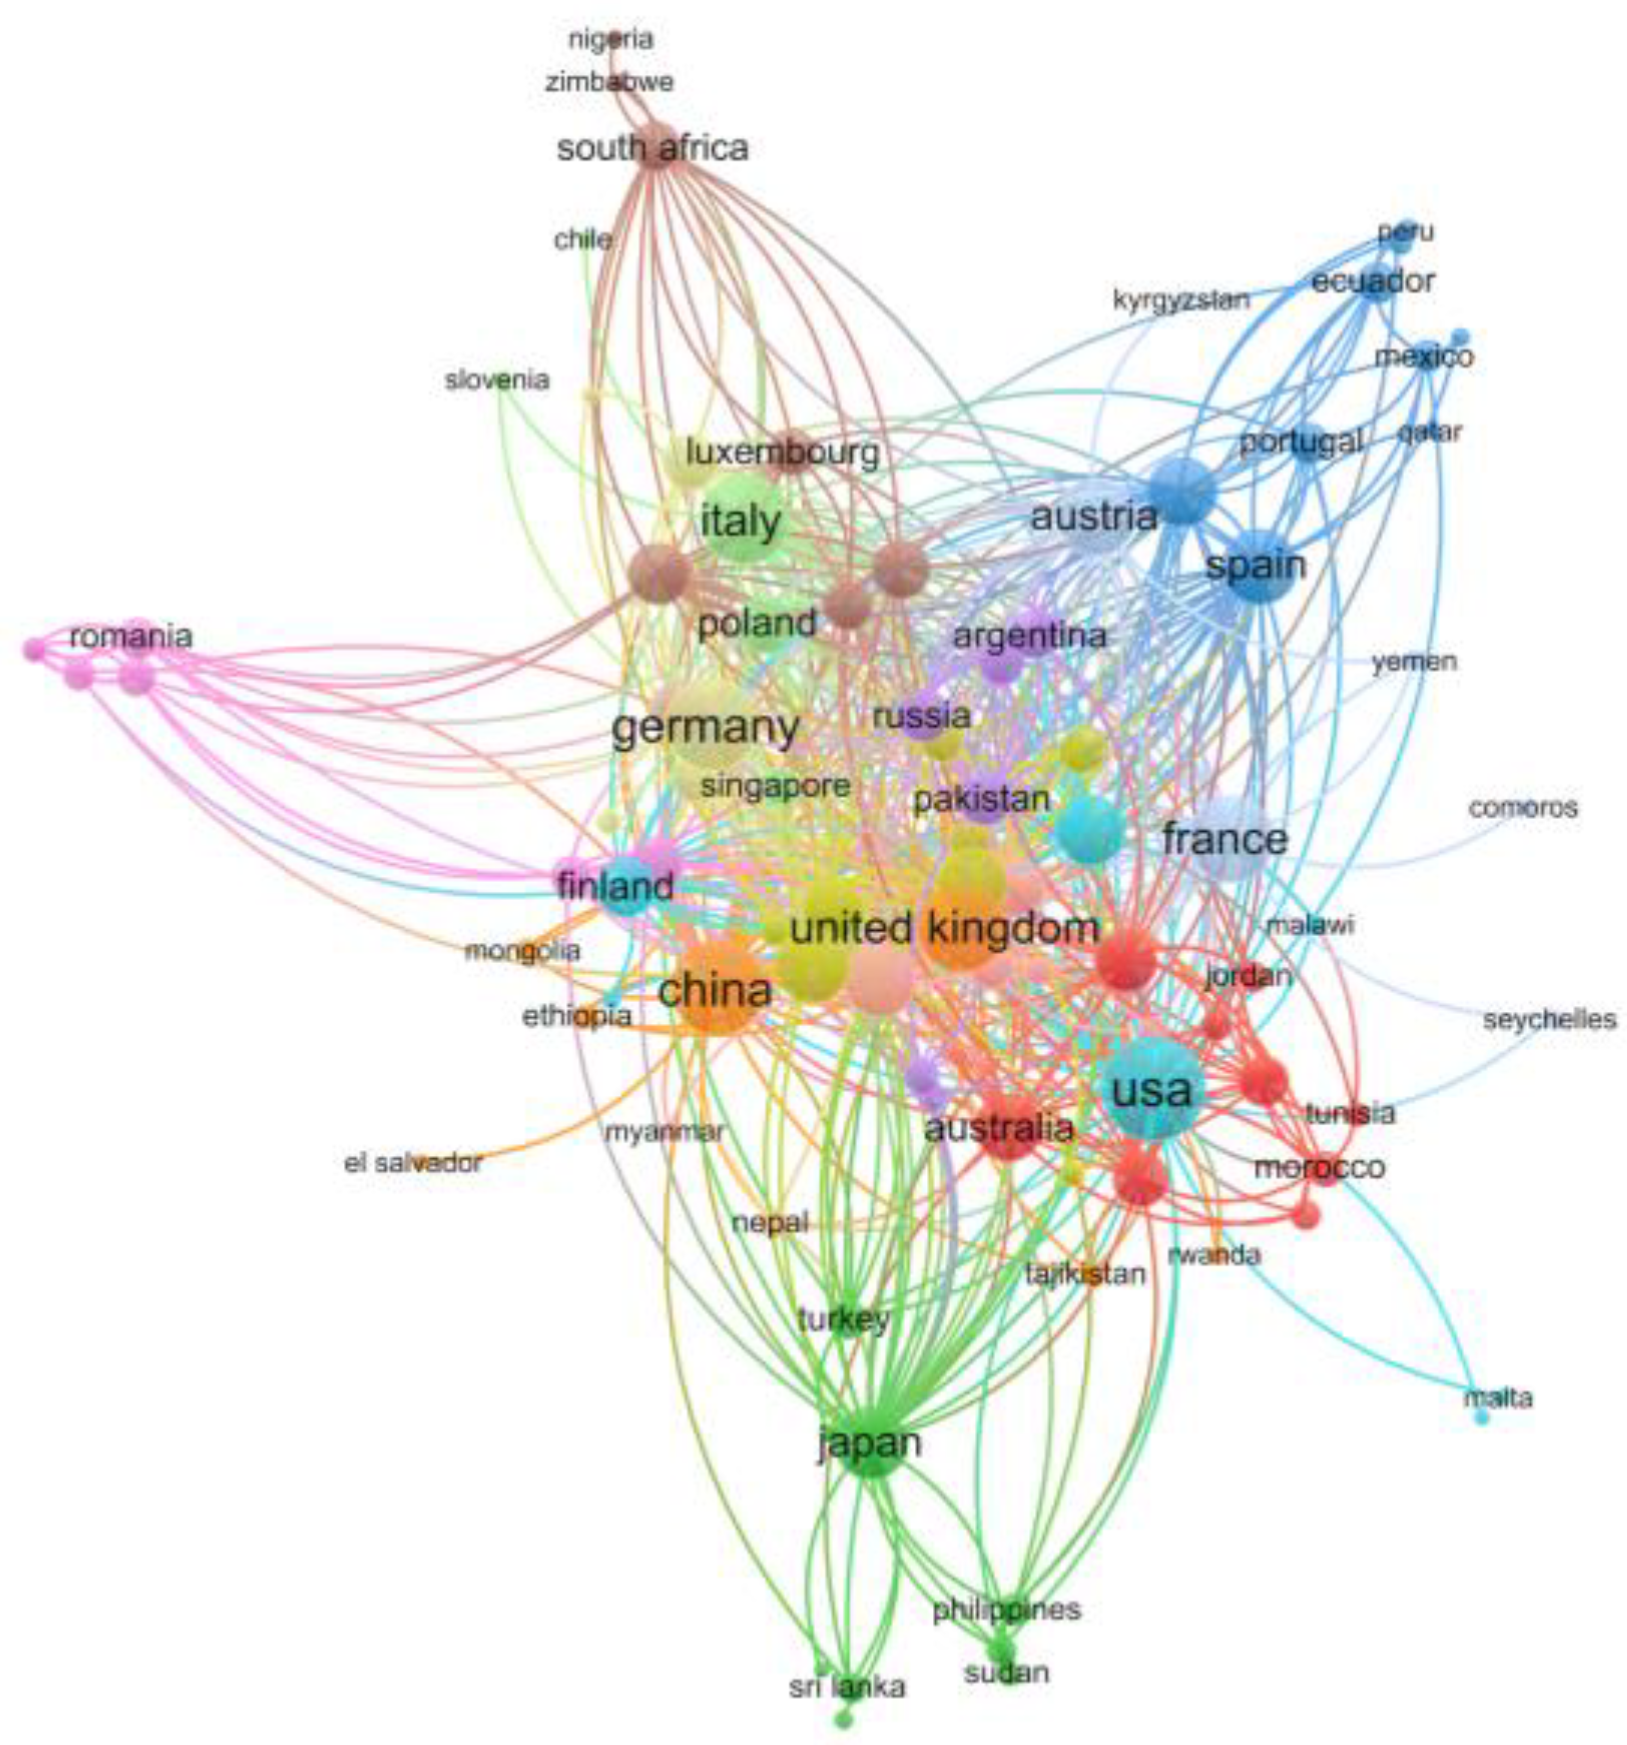
Figure 4b). Apart from the quantity of scientific outputs, the map of national collaborations can also serve as an indicator of a country’s research strength.
Figure 5 illustrates global collaborations, showing that the United States (64 collaborative connections) has the most national collaborations, followed by China (52), Germany (51), Italy (45), France (42), the United Kingdom (39), Spain (29), the Netherlands (27), India (24), Canada (23), and Japan (23). Cooperation in remote sensing STF research is more limited in other countries. China cooperates mainly with the United States, Germany, the United Kingdom, France, Australia, Canada, and Italy. In contrast, the United States cooperates mainly with Germany, France, Italy, Canada, Spain, and the United Kingdom.
4.4. Global Research Institutions
Research on STF in remote sensing has been conducted at 1624 institutions worldwide. Each research institution’s influence was evaluated by counting the citations that its publications received. The ten most influential research institutions were determined by tallying all of the citations received by their publications, which included 180 articles and each institution’s first-author accomplishments. The impact of the papers varied greatly from institution to institution, with Wuhan University in China (2203 citations) and the University of Florence in Italy (2011) having the highest total number of citations, followed by Beijing Normal University (2006), the Goddard Space Flight Center (1753), the German Aerospace Center (DLR), the Remote Sensing Technology Institute (1678), Texas A&M University (1493), the Instituto Superior Técnico (1359), the University of Tokyo (1330), Earth Resources Technology, Inc. (1316), and the Aerospace Information Research Institute, Chinese Academy of Sciences (1116) (
Table 2).
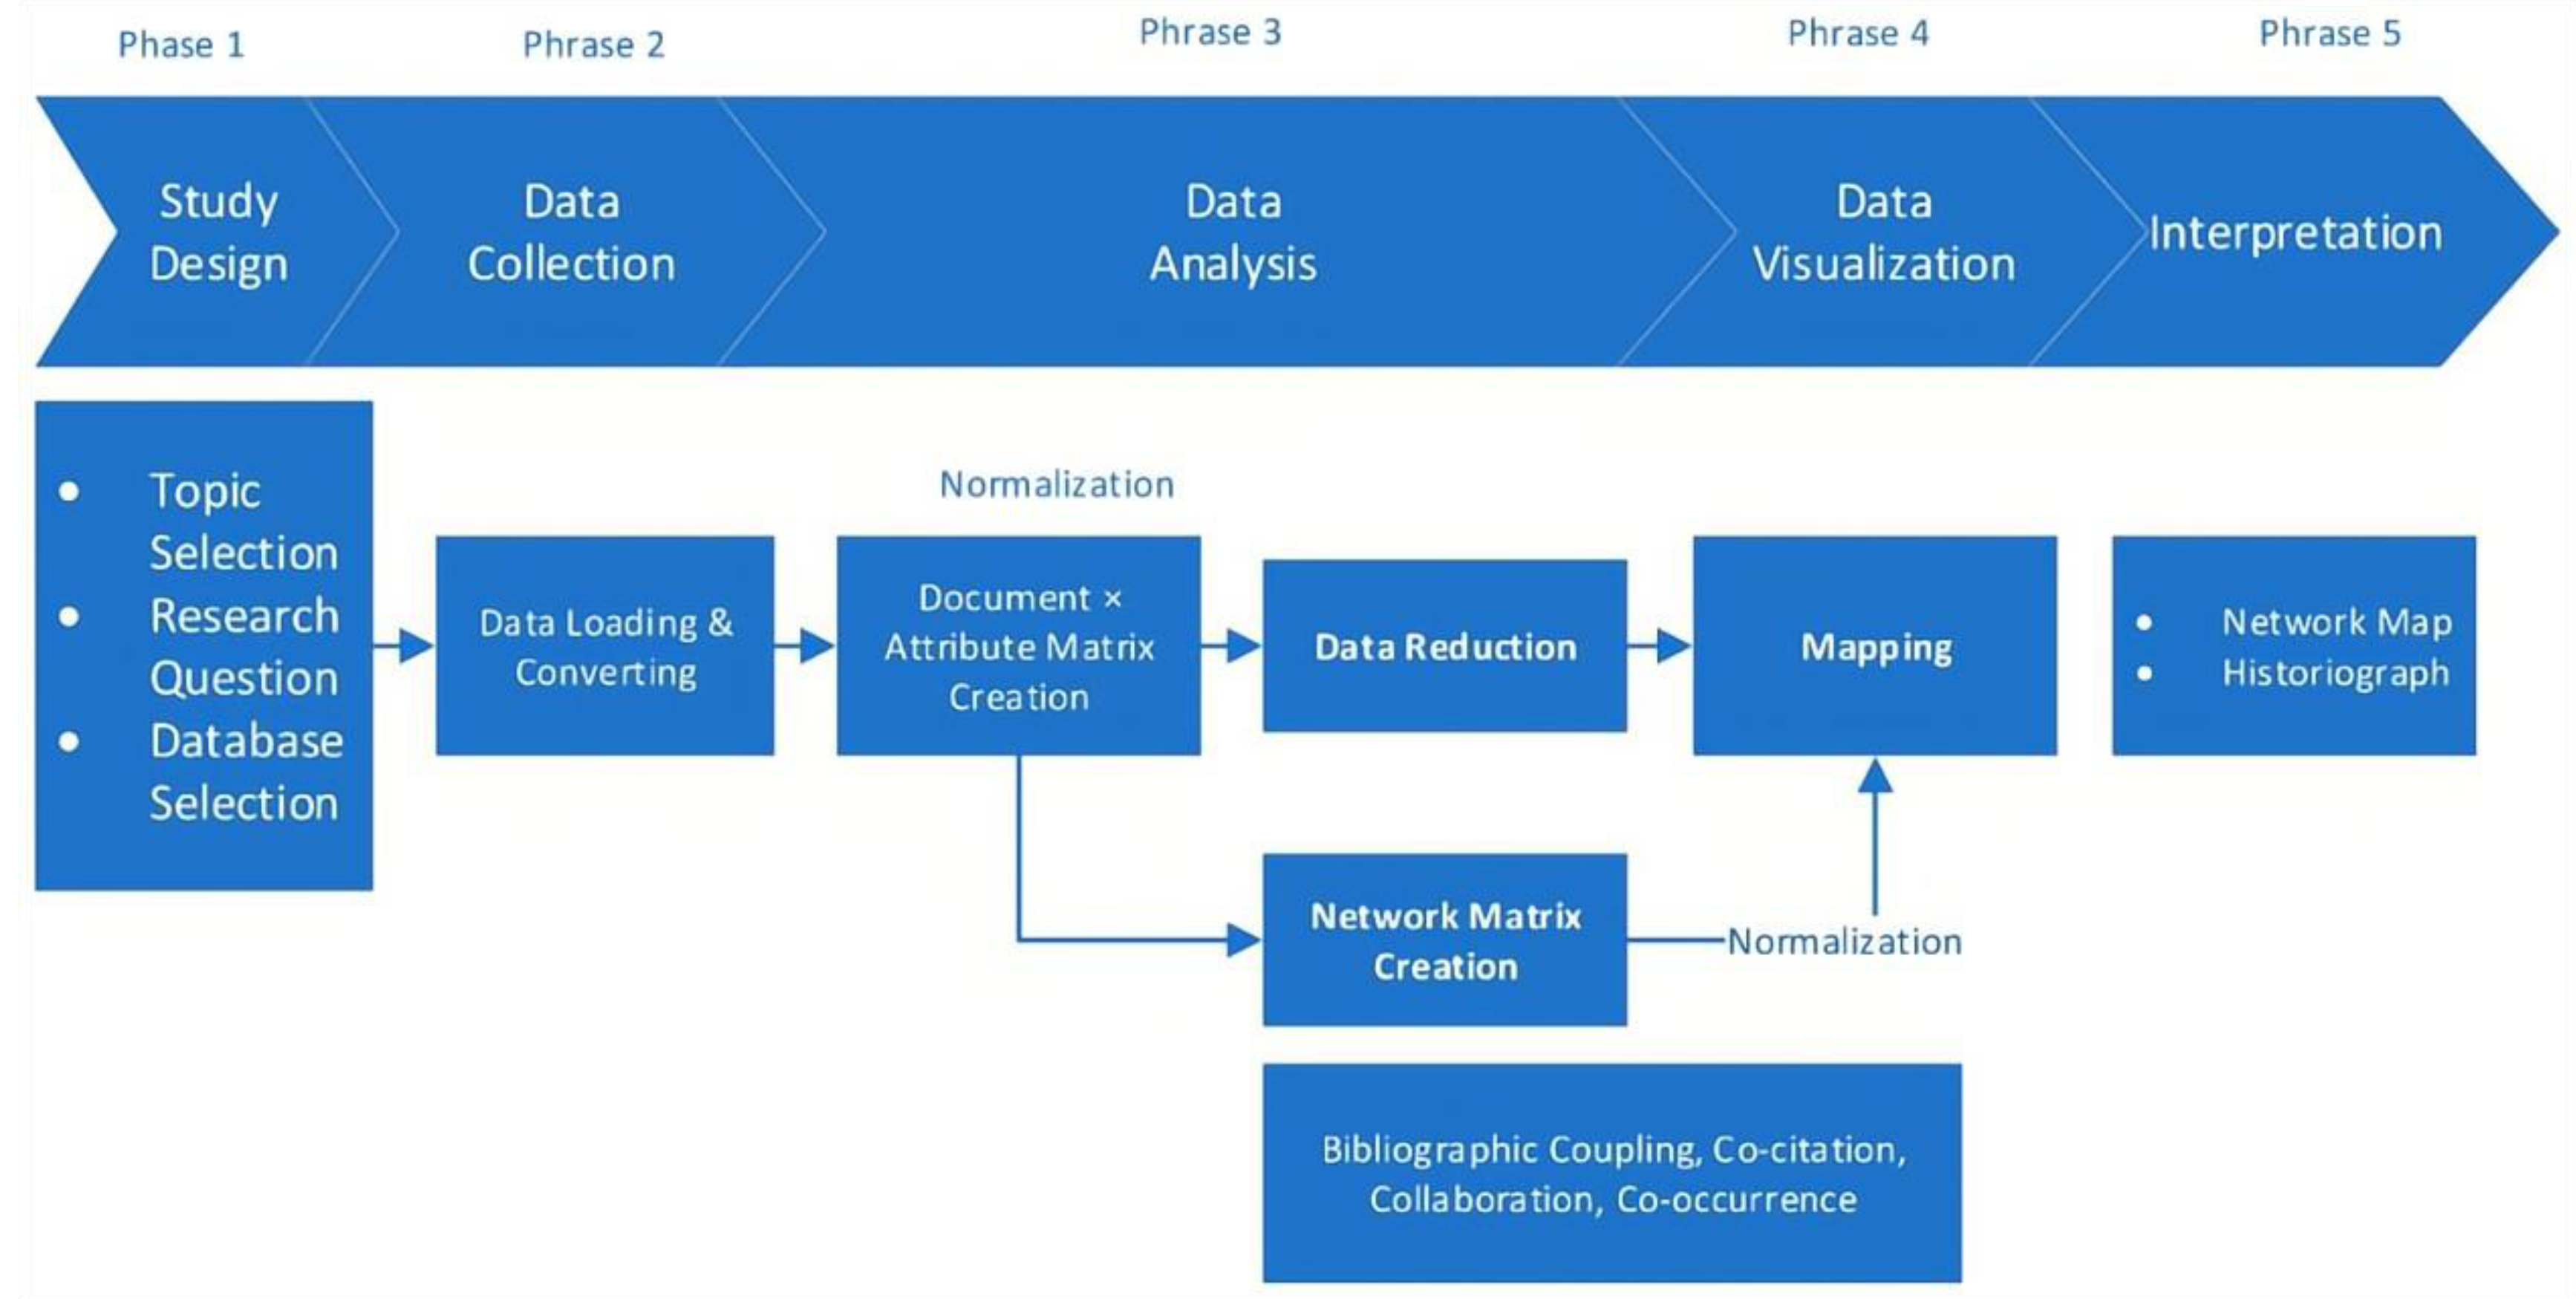
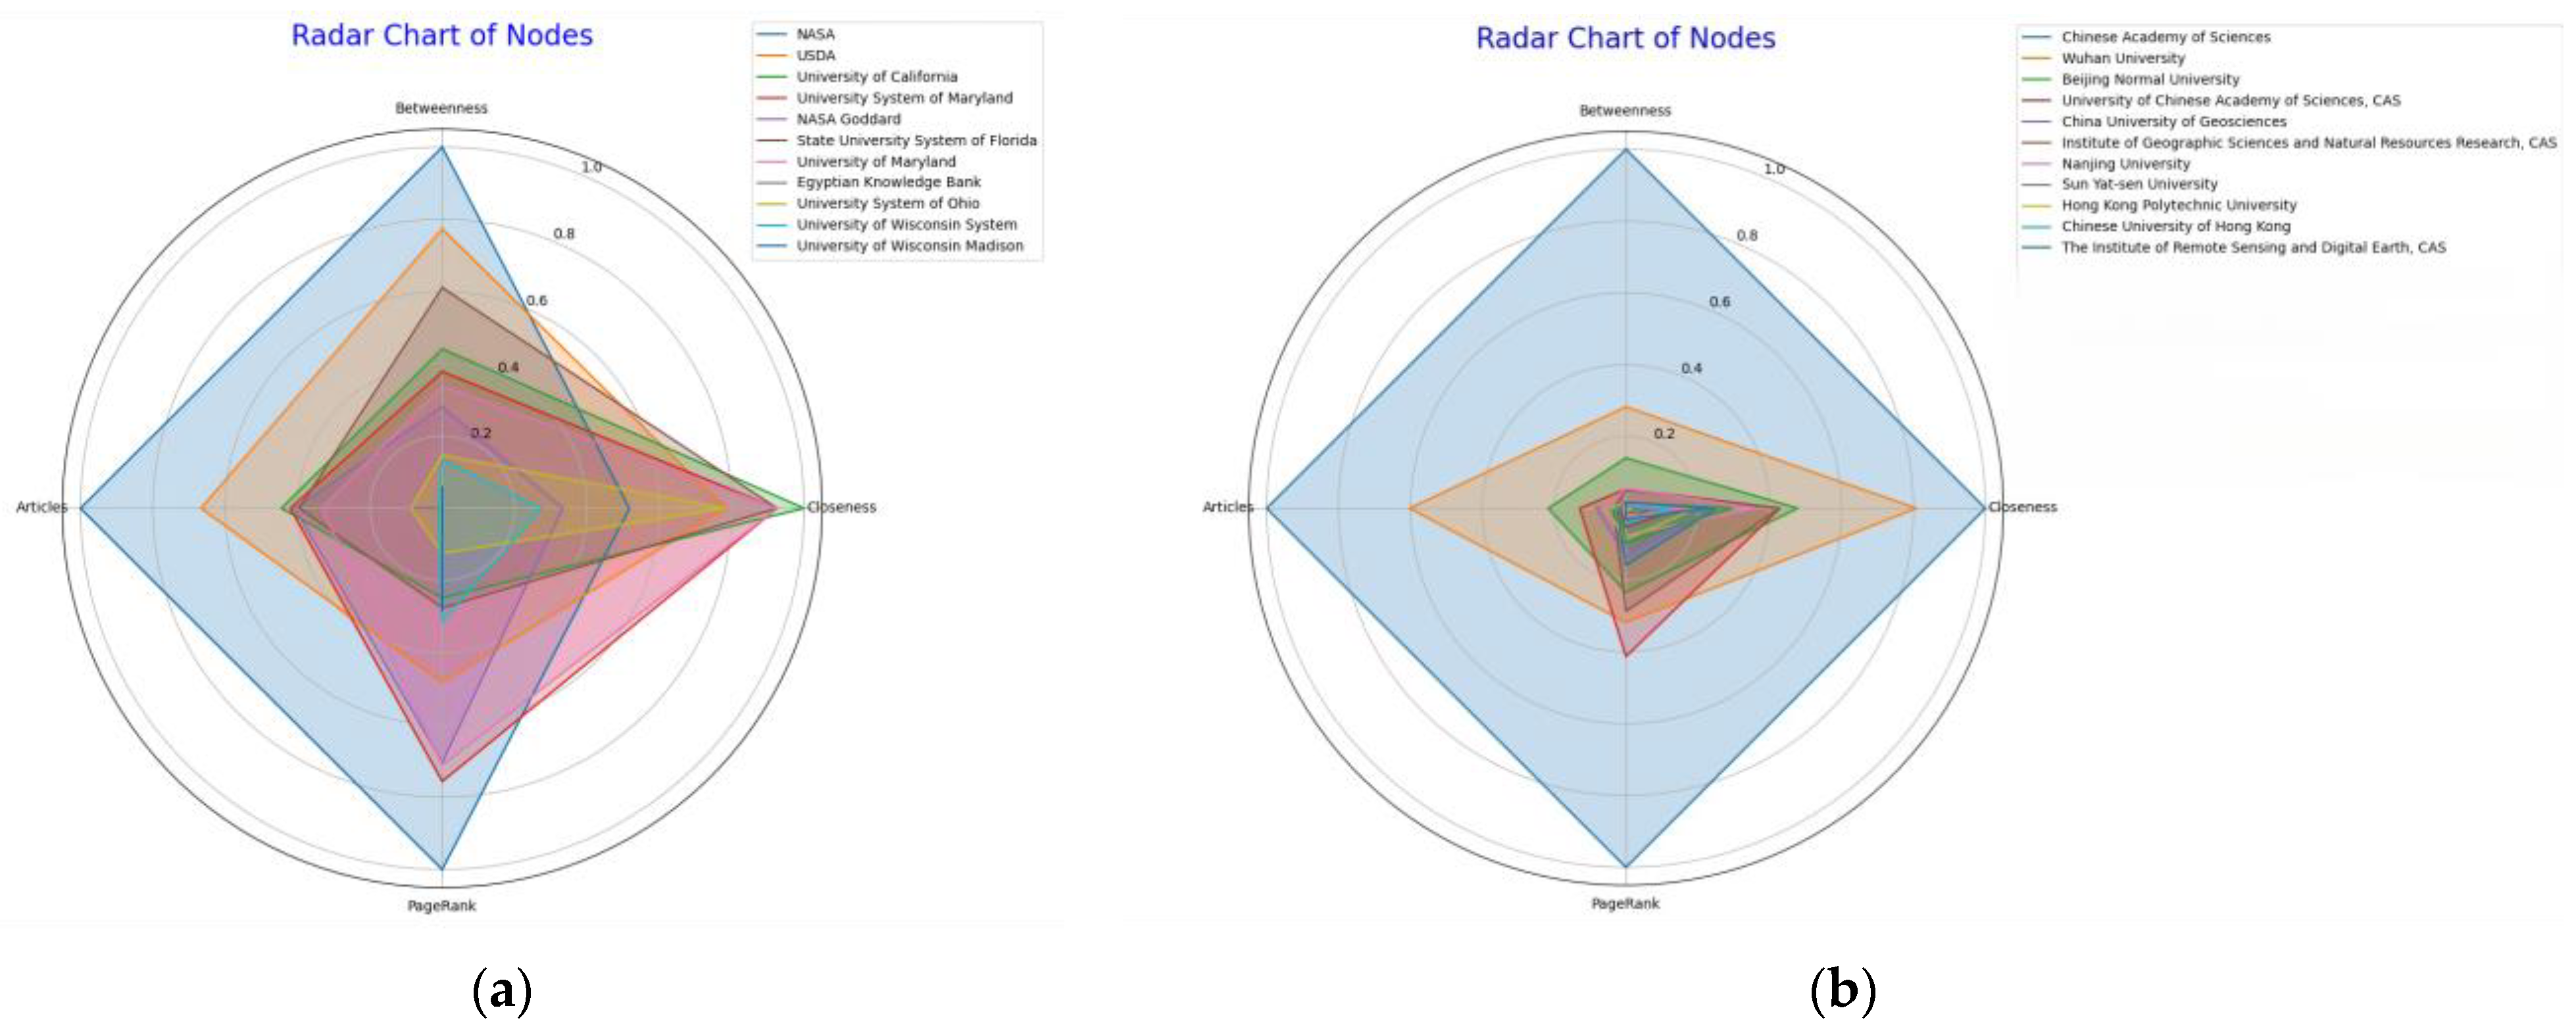
For analyzing international research networks in STF of remote sensing, we used cluster analysis to classify research institutions. This analysis was performed on the program Biblioshiny, and the results are presented in the form of a radar chart drawn in Python. The radar chart reveals institutions’ trends and relative positions in remote sensing STF in different countries. In each radargram, different colors represent different institutions, and their shapes and sizes reflect each institution’s performance in other metrics. The primary metrics used to assess these clusters include betweenness, closeness, PageRank, and the number of articles published (Articles).
As depicted in
Figure 6a, the National Aeronautics and Space Administration (NASA) and the Chinese Academy of Sciences (CAS) exhibit robust profiles across all four measured indicators. Their prominence in metrics like betweenness, closeness, PageRank, and publication volume highlights their significant roles in the field of spatiotemporal fusion (STF) within remote sensing. Most of the first clusters are U.S. institutions, with NASA, the United States Department of Agriculture (USDA), the University of California (U.C.) system, and the University of Maryland system playing critical roles in spatial and temporal fusion of remote sensing. The USDA has a significant impact in the field of agricultural sciences, and the U.C. system and the University of Maryland system demonstrate extensive collaboration and theoretical contributions to multidisciplinary research. The second cluster contains mainly Chinese research organizations (
Figure 6b). Wuhan University, Beijing Normal University, China University of Geosciences, and Tsinghua University also show importance in the research network and extensive academic connections.
4.5. Pivotal Source Journals
STF remote sensing investigations were published in 420 main journals; in 2023, there were 14 publication sources, up from 4 in 1991. We also looked at how widely renowned sources distributed research publications on remote sensing in the field of STF. The top 5 journals published 1855 papers (62.52% of the total), while 31 journals (7.32% of the total) published only 1 remote sensing time–space fusion paper. Out of all the journals, 104 (41.46%) produced a maximum of 10 publications. The top five scientific journals by total number of published articles are displayed in
Figure 7: Remote Sensing (849), IEEE Transactions on Geoscience and Remote Sensing (321), ISPRS International Journal of Geo-Information (281), IEEE Journal of Selected Topics in Applied Earth Observations and Remote Sensing (203), and Remote Sensing of Environment (201).
Table 3 shows that the Journal of Remote Sensing had the largest annual growth rate, while the Journal of Remote Sensing of the Environment had the highest total number of citations. Following Bradford’s law, the source journals for remote sensing STF research papers exhibit a high degree of dispersion. The number of regional references was used to choose the top ten most influential journals (
Table 3). In the field of remote sensing STF studies, the journals indicated by asterisks are regarded as primary source journals, including the journals IEEE Transactions on Geoscience and Remote Sensing and Remote Sensing. Therefore, these journals were crucial in STF research during the study period.
4.6. Influential Authors
One common metric used to assess academic achievement is the H-index, which measures the frequency with which a scientist’s works have been cited [
20]. In remote sensing STF, we found the ten most prominent researchers. Among them, the STARFM algorithm based on the weight function model proposed by Gao, F. (from Earth Resources Technology, Inc., with an H-index of 27) is one of the most cited articles, with 1268 citations [
5]. Other notable researchers include Chanussot, J. (from the University of Savoy, with an H-index of 24) and Zhu, X.X. (from DLR, the German national space agency, with an H-index of 20), both of whom have made notable academic contributions to the field (
Table 4). Three of these ten most influential researchers are from China, two are from the United States, and one each are from Germany, France, Portugal, Japan, and Iceland, respectively, demonstrating international collaboration. A total of 2967 papers enlisted the contributions of 9017 authors, with 97 independent authors responsible for 102 single-author papers. The collaboration index was 3.11, and the average quantity of co-authors for each manuscript was 4.63, highlighting remote sensing STF research as a typical field of multi-author collaboration.
4.7. Influential Papers
For identifying the most impactful papers from 1991 to 2023, we utilized citation counts as a primary metric, following methodologies proposed in previous studies [
21]. Our analysis distinguishes between the global reference factor (GRF), which accounts for all citations recorded in Web of Science, and the local reference factor (LRF), which reflects citations within the specific field (see
Table 5 and
Table 6 for detailed metrics).
Table 7 presents a detailed overview of the models used in the top ten local papers, along with their respective contributions. One standout paper in our analysis is the Spatio-Temporal Adaptive Reflectance Fusion Model (STARFM) proposed by Dr. Gao Feng from the USDA. This influential work pioneered a weight function-based approach for surface reflectance fusion, effectively integrating the high-resolution spatial capabilities of Landsat with the high-frequency temporal data from MODIS. The STARFM algorithm has demonstrated its ability to predict surface reflectance with an accuracy comparable to that of the Landsat Enhanced Thematic Mapper Plus (ETM+). Its effectiveness was substantiated through both simulated and actual Landsat/MODIS datasets [
5]. This seminal paper has garnered widespread recognition, significantly influencing the development of spatiotemporal fusion (STF) research. The continuous increase in its citation numbers serves as a testament to its enduring relevance and foundational role in the field. The success of the STARFM method has provided robust support for ongoing advancements in the remote sensing STF domain, illustrating the practical and theoretical value of integrating spatial and temporal data to enhance remote sensing capabilities.
The advancements in spatiotemporal data fusion are well documented through several high-impact papers. The Enhanced Spatio-Temporal Adaptive Reflectance Fusion Model (ESTARFM) algorithm, ranked second by LRF and ninth by GRF, represents a significant improvement over the well-known STARFM algorithm. This enhanced model addresses the limitations of STARFM by improving the accuracy of fine-resolution reflectance predictions, particularly in heterogeneous landscapes. It introduces a conversion factor that refines weight calculations based on the spectral similarity between fine- and coarse-resolution image elements, facilitating more precise studies of global landscape changes on seasonal and interannual scales [
22]. Following this, the Flexible Spatio-Temporal Data Fusion (FSDAF) method, ranked third in LRF, combines a demixing-based approach with weighting functions and spatial interpolation techniques. This hybrid algorithm effectively merges frequent coarse spatial resolution data from MODIS with infrequent high-resolution data from Landsat, generating consistently high-resolution synthetic images. The FSDAF method’s superiority in producing accurate images, particularly in capturing reflectance changes due to land cover transitions, highlights its potential to enhance the availability of high-resolution time series data for rapid surface dynamics studies [
23]. Moreover, the Spatio-Temporal Adaptive Algorithm for mapping Reflectance Change (STAARCH) method, which ranks fourth in LRF, introduces a novel approach to mapping reflectance changes using a weight function to identify change spots dynamically. By blending data from Landsat TM/ETM+ and MODIS, STAARCH improves the detection of land cover changes and disturbances with enhanced spatial and temporal resolution. Validation using a disturbance dataset confirmed its ability to accurately date disturbances over multiple years, showcasing improvements over previous data fusion techniques [
24].
The fifth most impactful paper in the LRF is a comprehensive review article that categorizes existing spatiotemporal data fusion methods, discusses the underlying principles, and outlines future research directions. This paper is instrumental in summarizing application prospects and synthesizing knowledge across various studies published in remote sensing journals. Notably, it utilizes a literature citation map based on X. Zhu et al. [
4] to identify highly cited works, enhancing the understanding of field dynamics. Following this, the sixth-ranked paper by LRF introduces the Spatiotemporal Reflectance Unmixing Model (STRUM). STRUM innovatively combines Bayesian theory and the STARFM moving window concept to estimate changes in fine-resolution elements directly from coarse image elements. Demonstrated using analog, Landsat, and MODIS imagery, and assessing temporal Normalized Difference Vegetation Index (NDVI) profiles, STRUM effectively captures phenological changes, showcasing the utility of hybrid data fusion approaches [
25].
The seventh-ranked paper proposes a novel deep convolutional neural network (CNN)-based method for spatiotemporal fusion (STF) tailored for remote sensing data. This approach leverages machine learning (ML) to model the correlation across observed coarse–fine image pairs, addressing the complex correspondence and significant spatial resolution gaps between MODIS and Landsat images. The dual five-layer CNN architecture not only extracts valid image features effectively but also learns the end-to-end mapping, yielding superior fusion results compared to sparse representation-based methods [
26]. The eighth most influential paper, by Song and Huang, develops a dictionary-pair learning-based STF method that utilizes a unique two-stage fusion model. This method establishes a correspondence between low-spatial-resolution, high-temporal-resolution (LSHT) data, and high-spatial-resolution, low-temporal-resolution (HSLT) data through super-resolution techniques and high-pass modulation. The fusion model effectively captures surface reflectance changes associated with climate and land cover type changes, outperforming other well-known STF algorithms in accuracy and detail [
27].
Notably, the ninth and tenth most influential papers ranked by LRF, which focus on specific advancements in data fusion models, do not appear in the top ten papers ranked by GRF. The ninth LRF paper introduces a new data fusion model that leverages unmixing to enhance image resolution before applying STF, utilizing classification maps from high-resolution imagery of the T1 temporal phase to reverse decompose the low-resolution imagery [
28]. The tenth LRF paper presents the Spatio-Temporal Adaptive Data Fusion Algorithm for Temperature Mapping (SADFAT), which modifies STARFM by integrating considerations of the annual temperature cycle and urban thermal landscape heterogeneity to refine surface temperature data [
29].
Among the GRF’s most influential papers, only the third- and ninth-ranked papers overlap with the LRF’s top ten, highlighting a divergence in citation impact and local relevance. The highest-ranked GRF paper explores the application of deep learning in remote sensing, with a focus on image recognition, target detection, and semantic segmentation, underscoring the growing importance of artificial intelligence (AI) technologies in this field [
30]. The second place GRF paper provides an overview of six significant themes in hyperspectral data analysis, including fusion, unmixing, and classification, reflecting key trends and challenges in remote sensing [
31]. Subsequent GRF papers address a variety of topics: the fourth-ranked paper critiques the limitations of pixel-by-pixel analysis in high-resolution imagery, advocating for the Geographic Object-Based Image Analysis (GEOBIA) paradigm in geographic information science [
32], while the fifth delves into deep learning for land cover and crop classification using multi-temporal, multi-source satellite imagery [
33]. The remaining papers explore methods related to the urban heat island effect, the fusion of high-resolution panchromatic with low-resolution multispectral images, and the integration of low-spatial-resolution hyperspectral and high-spatial-resolution multispectral data [
34,
35,
36,
37].
4.8. History and Frontier Applications
This study detected 7989 author keywords from 2967 papers published in STF studies from 1991 to 2023.
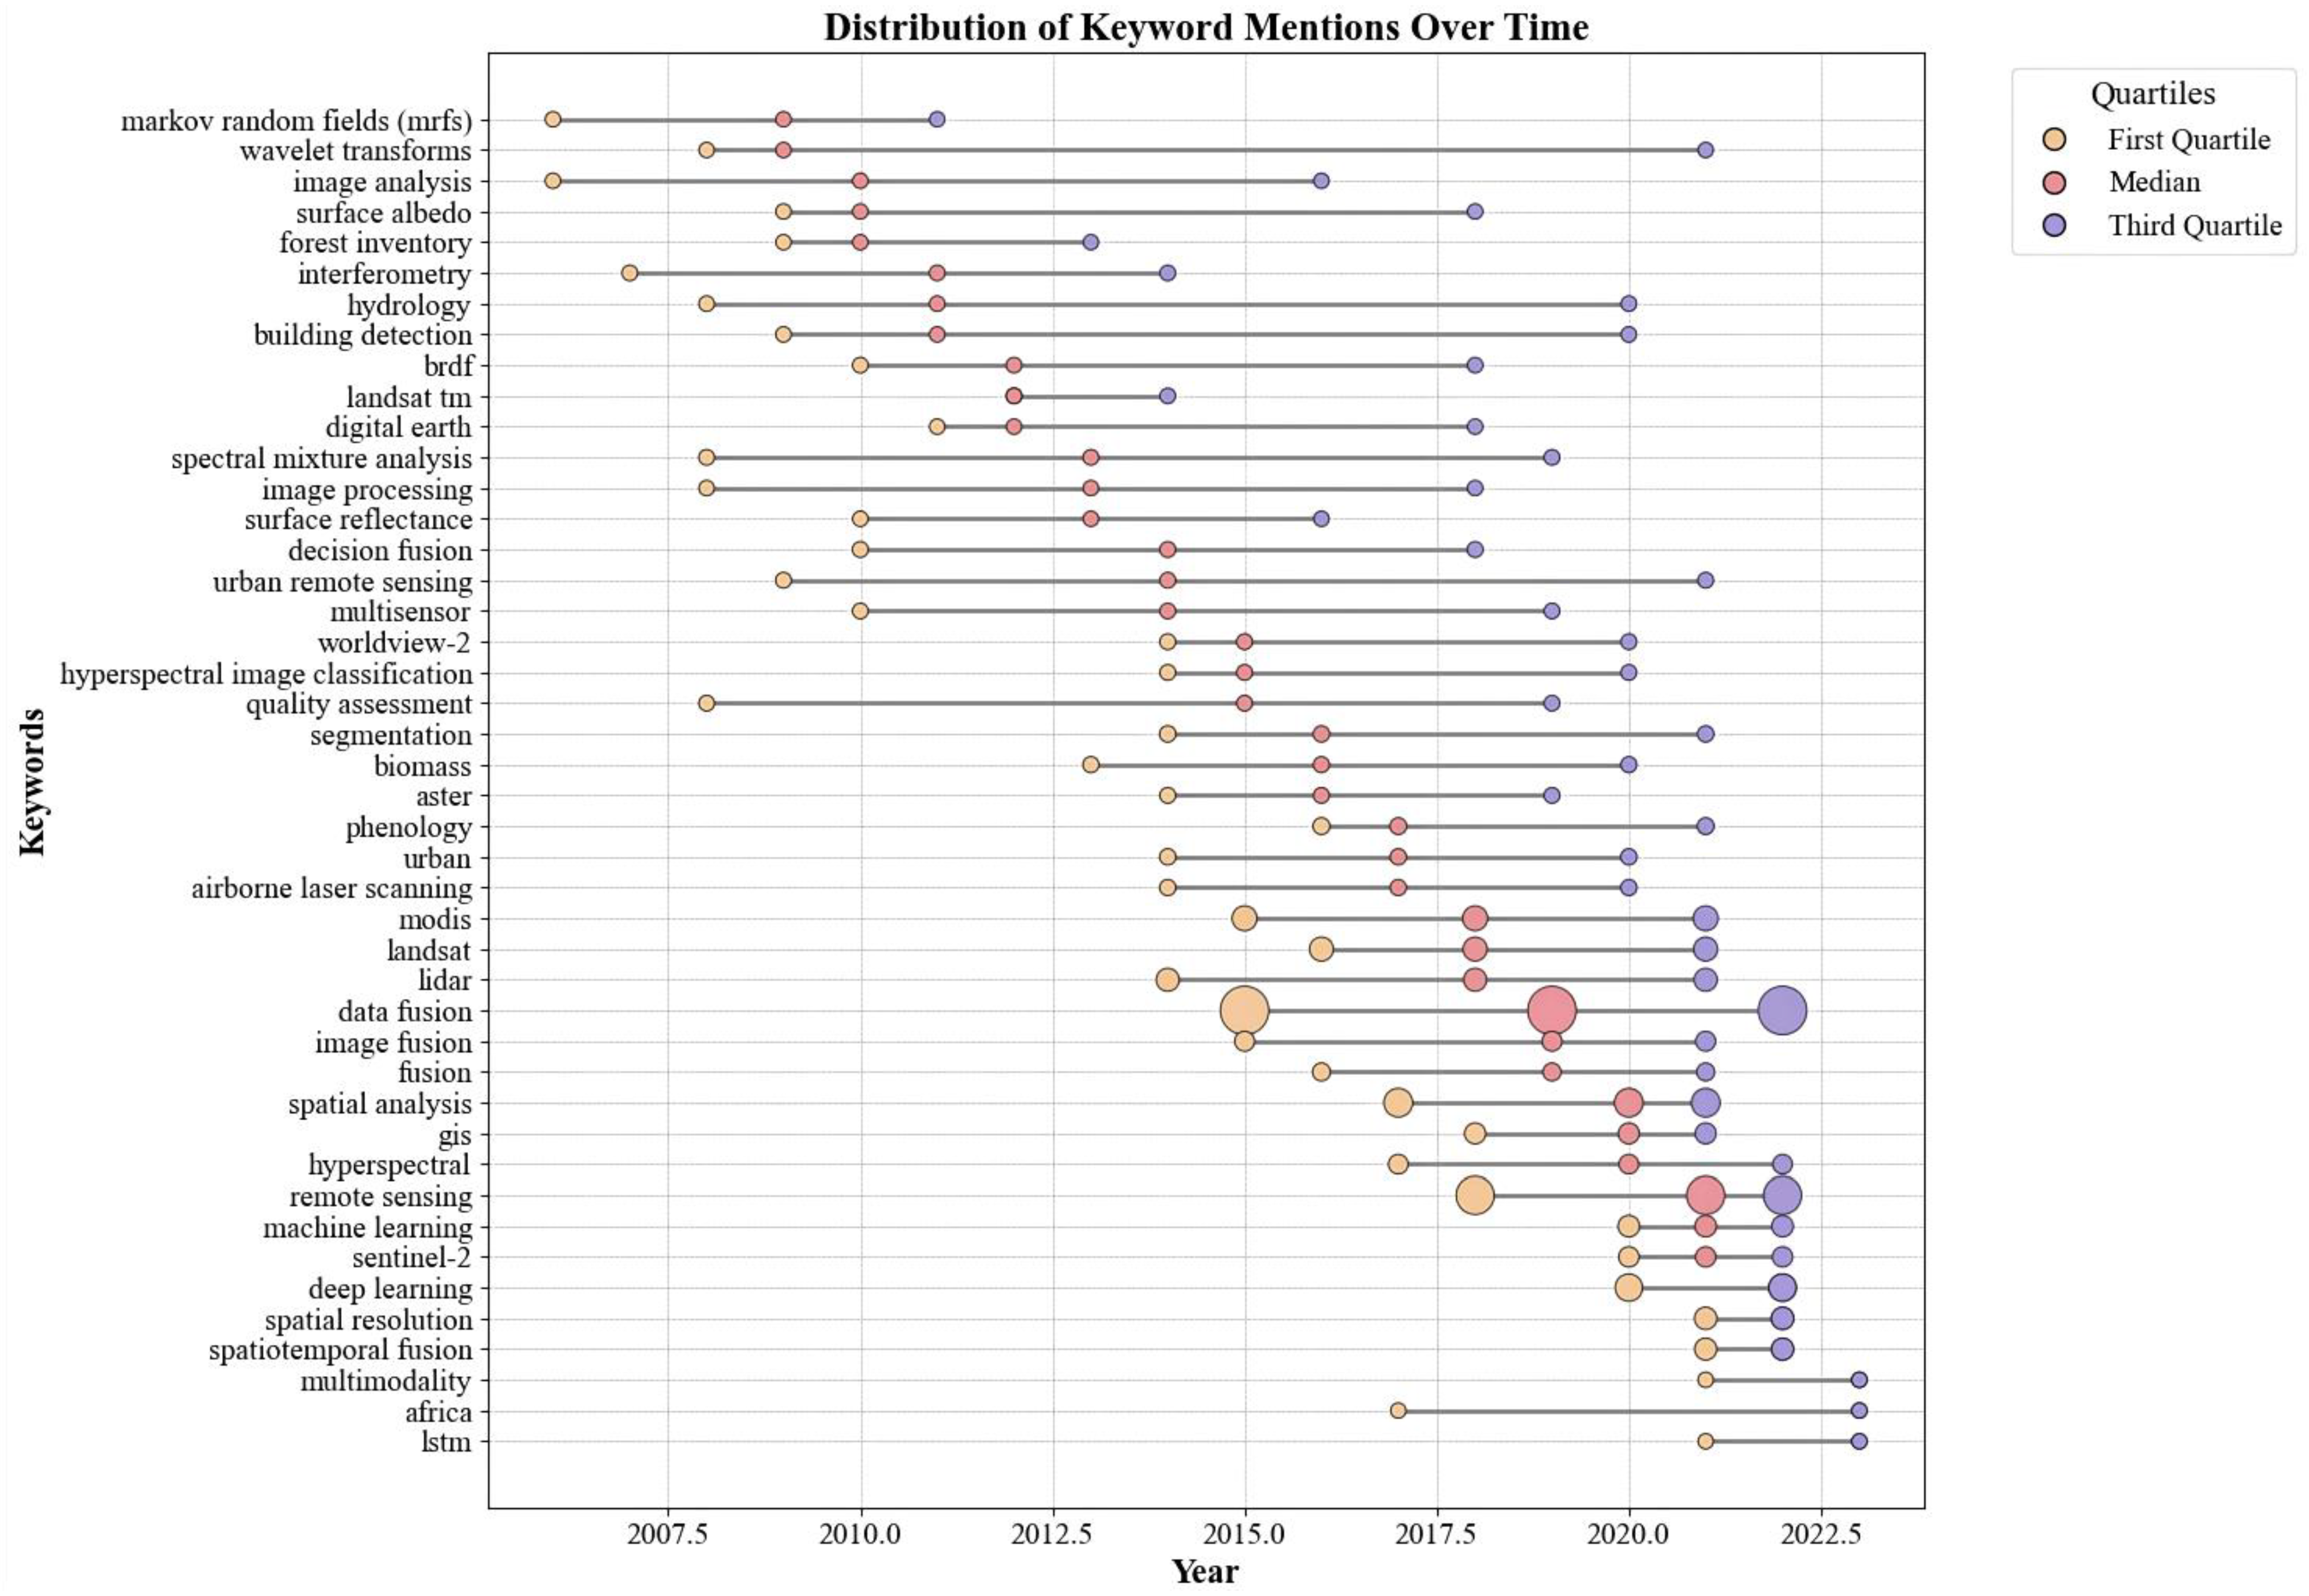
Figure 8 depicts the trend of author keywords over time, with the
x-axis representing the year and the
y-axis denoting the keywords. Each “dumbbell” or dot represents a keyword’s relative importance or popularity in a given year. At the same time, the length of the horizontal line indicates the duration of or attention received by the keyword between years. The yellow dot represents the first quartile of the publication year associated with the keyword, while the purple dot indicates the third quartile of the publication year. The red dot marks the median of the publication year, signifying the concentrated period when the paper was published. The size of the dots reflects the number of documents. The size of the central red dot mirrors the frequency of keywords; the larger the dot, the more often a keyword appears. “Data fusion”, “remote sensing”, “spatial analysis”, “deep learning”, “MODIS”, “Landsat”, “lidar”, “spatial resolution”, “spatiotemporal fusion”, and “machine learning” are the top ten keywords in terms of frequency. Landsat, MODIS, WorldView-2, and Sentinel are the most widely used remote sensing space–time fusion sensors. These remote sensing satellites provide a rich spatial and temporal data source for environmental monitoring and surface characterization. Six hundred and fifty-six papers were published in 2012–2023, accounting for 22.4% of the total papers. Landsat provides medium-to-high-spatial-resolution imagery for monitoring surface changes such as urban sprawl, deforestation, etc. Landsat provides a rich spatial and temporal data source for environmental monitoring and characterization in spatial and temporal fusion. In STF, Landsat data are often used to provide finer spatial details in combination with other data with a higher temporal resolution but a lower spatial resolution (e.g., MODIS). One of the prerequisites for the fusion of Landsat and MODIS is the similarity of orbital parameters. It is also possible to combine dual generative adversarial network (GAN) models with Cubesat constellation images for the super-resolution of historical Landsat images for spatially enhanced long-term vegetation monitoring [
38]. MODIS data are often combined with other data sources to improve spatial resolution or long-term temporal tracking. The latest MODIS data can be used for data fusion to estimate urban heat wave temperatures [
39], combined with deep neural networks for progressive spatiotemporal image fusion [
40] and the STF of surface temperatures based on convolutional neural networks [
41].
The amount of research on Sentinel data has grown the fastest in recent years. There is an increasing demand for hyperspectral data; conversely, the fusion of Landsat and MODIS images has been widely studied and provides a reasonable basis for developing fusion workflows for Sentinel-2 and Sentinel-3 data [
42]. Recent studies show more applications of Sentinel data in ecological environments, such as the near-real-time monitoring of tropical forest disturbances fused with Landsat data [
43], the monitoring of maize nitrogen concentration merged with radar (C-Sar), optical and sensor satellite data [
44], and the fusion of multimodal satellite-borne Lidar data with visual images to estimate forest canopy height [
45]. Light Detection and Ranging (LiDAR) and hyperspectral imagery (207 articles for 2014–2023) are two basic types of data used in remote sensing applications. High-resolution topographic data can be obtained using LiDAR data, which makes it easier to combine and understand different remote sensing datasets [
46]. The electromagnetic spectrum that an object reflects or emits is captured by hyperspectral imaging, enabling various materials to be identified and analyzed based on their unique spectral characteristics. Hyperspectral imaging (10 articles for 2013–2022) is a more advanced technique than multispectral imaging [
47], which collects information across the entire spectrum of waves at a very high resolution. A thorough and in-depth examination of the Earth’s surface, atmosphere, and environment is made possible by data from a variety of sensors, such as LiDAR, multispectral or hyperspectral imaging, and radar [
48].
It is also evident from the figure that the keywords “machine learning”, “deep learning”, and “LSTM” appearing behind the timeline were the hotspots of STF research in recent years, and there were 318 articles in 2017–2023. ML- and DL-based STF models do not rely on assumptions but on establishing complex relationships between input and output images. According to a survey of existing STF models, there are ten times more DL STF models than ML STF models. The first DL artificial neural network (ANN) STF model was proposed in 2015 [
49], followed by convolutional neural networks in STF models, which led to a rapid increase in STF models based on DL. Deep convolutional networks are the most commonly used CNN method among STF methods, followed by GAN, AutoEncoder, LSTM, and Transformer. Different convolutional neural networks have been developed in STF models at other times (see
Table 8). There are seven commonly used DL strategies for existing STF methods: residual learning, attention mechanism, super-resolution, multi-stream, composite loss function, multi-scale mechanism, and migration learning. The main applications of DL techniques in STF are land cover classification [
33,
50,
51,
52,
53,
54,
55,
56,
57,
58,
59], change detection [
60,
61,
62,
63,
64,
65,
66,
67,
68,
69], and multi-sensor data fusion [
70,
71,
72,
73,
74]. “Spatial analysis” and “GIS” had a total of 443 publications in 2017–2023, and the synergy between STF, spatial analysis, and the Geographic Information System (GIS) provides more integrated and fine-grained tools and methods.
