Article

A Field Survey on Indoor Climate in Land Transport Cabins of Buses and Trains

by
John Omomoluwa Ogundiran
1,*,
Jean-Paul Kapuya Bulaba Nyembwe
1,
Anabela Salgueiro Narciso Ribeiro
2 and
Manuel Gameiro da Silva
1,*
1
Department of Mechanical Engineering, University of Coimbra, ADAI, Rua Luís Reis Santos, Pólo II, 3030-788 Coimbra, Portugal
2
Department of Civil Engineering, University of Coimbra, Rua Sílvio Lima, Pólo II, 3030-790 Coimbra, Portugal
*
Authors to whom correspondence should be addressed.
Atmosphere 2024, 15(5), 589; https://doi.org/10.3390/atmos15050589
Submission received: 7 April 2024 / Revised: 9 May 2024 / Accepted: 11 May 2024 / Published: 13 May 2024
(This article belongs to the Special Issue Enhancing Indoor Air Quality: Monitoring, Analysis and Assessment)

Abstract

:
Assessing indoor environmental quality (IEQ) is fundamental to ensuring health, well-being, and safety. A particular type of indoor compartment, land transport cabins (LTCs), specifically those of trains and buses, was surveyed. The global rise in commute and in-cabin exposure time gives relevance to the current study. This study discusses indoor climate (IC) in LTCs to emphasize the risk to the well-being and comfort of exposed occupants linked to poor IEQ, using objective assessment and a communication method following recommendations of the CEN-EN16798-1 standard. The measurement campaign was carried out on 36 trips of real-time travel on 15 buses and 21 trains, mainly in the EU region. Although the measured operative temperature, relative humidity, CO2, and VOC levels followed EN16798-1 requirements in most cabins, compliance gaps were found in the indoor climate of these LTCs as per ventilation requirements. Also, the PMV-PPD index evaluated in two indoor velocity ranges of 0.1 and 0.3 m/s showed that 39% and 56% of the cabins, respectively, were thermally inadequate. Also, ventilation parameters showed that indoor air quality (IAQ) was defective in 83% of the studied LTCs. Therefore, gaps exist concerning the IC of the studied LTCs, suggesting potential risks to well-being and comfort and the need for improved compliance with the IEQ and ventilation criteria of EN16798-1.

1. Introduction

The indoor environmental quality (IEQ) of land transport cabins (LTCs) is accounted for by the combined influence of thermal comfort, indoor air quality (IAQ), acoustic comfort, visual comfort, and ergonomics for the overall safety, comfort, well-being, and performance of occupants [1]. The IEQ assessment discussed in this paper considers the recommendations of the EN16798-1 [2] standard for indoor environments. The global increase in commuters and commute distances across the EU, which increases the overall occupancy exposure duration to indoor microenvironment conditions in LTCs, altogether reinforces the need to assess the IEQ of LTCs. This assessment is critical for mass transit buses and trains, which represent most of a city’s collective mobility. According to a report [3] on EU coach market statistics (for domestic and international coach workers in 2014), over 0.55 (±10%) million individuals travel across EU member states, including drivers and other transport services personnel. Also, a recent factsheet report by the European Automobile Manufacturers’ Association (ACEA) [4] stated that land transport passengers account for 9% (estimated at 487.5 billion pkm) per year in the EU. For trains, according to Eurostat [5], demand for passenger transport in the EU peaked at 414 billion passenger kilometers (pkm) between 2015 and 2019. Although impacted negatively by COVID-19, decreasing to nearly half its value (to about 224 billion pkm), there has been a progressive recovery since the loosening of the COVID-19 pandemic restrictions. Notably, these trends gain upward revisions due to the focus on carbon footprint reduction, energy use, and associated sustainable mobility factors, especially for developed countries. This potentially growing volume of passenger traffic and the increased potential of mass transit emphasize the relevance of IEQ assessment to ensure safe and comfortable LTCs. Ensuring adequate indoor climate (IC) conditions in LTCs will help mitigate the risk of poor IEQ to the health, well-being, and comfort of exposed occupants.
Several studies have investigated CO2 and thermal comfort in vehicles, highlighting the importance of ensuring adequate IC in transport cabins [6,7,8]. Other studies on the indoor environment of trains and vehicles have highlighted the adverse effects of solar radiation on the cabin thermal environment [9,10], the passenger sitting location in the cabin, and airflow and distribution impacts on cabin thermal environments [11,12]. Inadequate IC conditions, including occupational airborne exposure, have been linked to an increased risk of respiratory diseases [13]. Additionally, the SARS-CoV-2 pandemic highlights the need for increased attention to influenza [14], as well as the continuous assessment of IEQ conditions in transport microenvironments [15]. In addition, the time spent in LTC microenvironments and proximity to sources of infectious pathogens are essential factors considering the risk and spread of airborne diseases [16]. The level of variance or compliance to the IEQ standard requirements for environmental parameters like operative temperature (TO), relative humidity (RH), CO2, volatile organic compounds (VOCs), and physical parameters like clothing and metabolic rate will help categorize IC conditions in vehicle cabins. Other pollutants, such as VOCs and particulate matter (PM), are important in the assessment of IAQ in LTCs, and several studies have also reported the presence of these air pollutants in passenger cabins [17,18,19]. Besides outdoor sources that infiltrate indoor environments depending on outdoor air quality, occupants contribute significantly to pollution in indoor spaces (CO2, noise, and odors). Also, people’s commute time contributes between 20 and 30% of their daily exposure and is up to eight times higher than the in-home environment, emphasizing the potential risk of poor IEQ regarding commuters.
Thermal comfort assessment in buses and trains is important since a significant number of people engage in inter-city travel, and the several hours of trip time imply long hours of possible exposure to inadequate indoor climate conditions if these cabin ICs are not well regulated. Poor IAQ conditions and thermal comfort in LTCs negatively impact the well-being of passengers [20]. Besides causing discomfort to passengers, thermal comfort affects the health and performance of drivers [21,22]. Shek et al. (2008) [23], evaluating the IAQ and thermal comfort towards achieving a comfortable in-bus environment for air-conditioned and non-air-conditioned buses, argued that the IEQ practice should be relatively ‘comfort-oriented’ rather than ‘standard-oriented’ to achieve absolute comfort and passenger satisfaction. Interestingly, the findings of Almeida et al.’s (2020) review of thermal comfort in bus cabins reported that 73% of the 22 studies evaluated focused on occupants’ thermal sensation, 9% on its impact on driver productivity, and 18% of the articles were related to energy use [24]. Moreover, they highlighted that most thermal comfort studies have focused on the occupant’s number and type rather than the physical and environmental parameters of the bus cabin, reinforcing the need for more objective IC studies, such as the current study. Meanwhile, regarding the IEQ standards used so far to evaluate vehicle thermal comfort, 10 studies have used the ASHRAE 55 standard, while only Lin et al. (2010) [25] used the ISO 14505-3 standard [24,26].
Besides thermal comfort and IAQ, other factors such as noise and lighting [27] impact the well-being and health of exposed commuters in these LTCs. Specifically, noise, vibration, and harshness (NVH) are critical factors, even in buses, that impact comfort, health, and safety [28]. Additionally, for trains, other parameters besides light and noise, such as aural comfort, acceleration effects, vibration, and seat static comfort [29,30], are critical to achieving passenger comfort and safety. Meanwhile, Mohammadi et al. (2020) proposed a quantitative multi-criterion for railway vehicle assessment, considering five critical parameters from the passenger’s perspective [31]. These parameters were IAQ, thermal comfort, noise, lighting, and vibration. However, the current study has evaluated the IC conditions (IAQ and thermal comfort) of buses and trains, following the recent recommendations of the EU as prescribed by EN16798-1 [2] and ISO 7730:2005 [32], applicable to indoor environments. The main contributions of the present study can be summarized as follows:
A. IC assessment and potential risk to well-being and comfort: Specifically, in vehicles, CO2 levels less than 3000 ppm pose a lesser risk, while in aircraft cabins or long-haul vehicles, the 5000 ppm limit over an 8-hour exposure threshold is recommended by the Occupational Safety and Health Administration (OSHA). The physiological and cognitive effects of unsafe CO2 levels (in various exposure durations) on exposed occupants in indoor spaces include fatigue, headaches, tremors, dyspnoea, central nervous system effects, sensory effects, cardiovascular endpoints, acidosis, hyperventilation, drowsiness, decreased heart rate, and decreased blood pressure [33,34,35,36]. Lawin et al.’s (2018) [37] review of health risks linked to occupational exposure to polluted ambient air acknowledges that vehicle drivers are exposed to significant health hazards due to polluted ambient air, although most of the studies reviewed did not focus on the vehicle cabin air quality. PM infiltrates vehicles indoors, while CO2 concentrations rise significantly from human emissions, especially in closed cabins [38]. Therefore, evaluating the cabin IAQ serves as a useful index to qualify the IC of LTCs. As more outdoor air is supplied and effectively circulated in the cabin by an increased air exchange rate (ACH), there will be a consequent reduction in CO2 concentration. Ultimately, the cabin CO2 levels are closely linked to the occupant’s satisfaction and degree of ventilation performance, which is a necessary metric for ensuring good IAQ in cabins. This may not eliminate the risk of disease spread, but it can contribute towards a lower risk when considering that other means of infectious disease spread are also possible in indoor spaces, such as large droplets, contact with contaminated surfaces, and physical human interaction [39,40].
B. Ventilation parameters in bus and train passenger cabins: The present study objectives align with the indications of Knibbs et al. (2012) [41] that influenza transmission risks in vehicles can exceed those in aircraft cabins. Ventilation in transport cabins impacts the IAQ conditions since it relates to the airflow and air exchange parameters, which affect the cabin air freshness of LTCs. Air exchange with fresh outdoor air and occupancy density impact the indoor concentration of pollutants, including infectious aerosols and pathogens [42,43]. Typically, overventilated cabins imply a higher chance of outdoor infiltration of pollutants, whereas under-ventilated cabins enhance CO2 rise in the vehicle cabin [44]. According to B. Zhang et al. (2017) [8], an assessment of the comfort performance of a car’s indoor environment indicated that two factors jointly impact cabin IAQ, affirming that air age and the speed in the distribution of air in the vehicle cabin are to be evaluated alongside the PMV index. Furthermore, a smaller value of air age implies good cabin IAQ, while the worst IAQ in the cabin has a higher air age in combination with a low speed of distribution. Moreover, disease dynamics suggest that spread can progress from an epidemic potential state to an endemic state and further on to a die-off stage if there is a significant increase in air supply [45]. The CO2 cabin levels also serve as a good indicator of the IAQ and ventilation parameters. Haq et al. (2022) [46] used CO2 measurements to assess the ventilation of vehicles under varying driving conditions with only two to three occupants, using levels above 800 ppm as the suboptimal threshold. The findings of Zhu et al. (2010) [47], using numerical and experimental methods, showed elevated levels of CO2 in occupied transport buses, with the conclusion that the CO2 results were also indicative of poor ventilation. Using the mean CO2 levels, Ogundiran et al. (2023) [29] evaluated the fresh air flow rates and air exchange rates in 15 train cabins, with the conclusion that ventilation was inadequate in 60% of them. Meanwhile, the influence of occupancy density coupled with the associated dynamics of road and ambient outdoor air quality conditions impacting vehicle cabin climate contributes to the reasons why the IAQ requirements are seldom achieved. Also, passengers and drivers can face various risks to their health, safety, and performance depending on exposure duration (short or long) at different levels of CO2 in ppm. The effect of indoor levels of CO2, VOCs, and ventilation on cognitive function and performance has already been studied, with high levels negatively impacing the cognitive function of exposed occupants in indoor spaces [48]. In Hudda et al.’s (2018) [49] study on CO2 accumulation in vehicles, they evaluated the effect of ventilation settings and driving conditions and assessed the accumulation levels for which CO2 can negatively impact cognitive functions or driver performance. The findings recommend that CO2 levels be kept below the 2500 ppm threshold using adequate recirculating ventilation modes. Human occupants in LTCs are sources of CO2 (exhaling approximately 40,000 ppm to 50,000 ppm of CO2) and bio-effluents, which may include infectious aerosols, hence the need for adequate ventilation and cabin climatization.
To summarize, the current study measured IC parameters, categorized them, and presented them in an adapted communication method using the requirements of the EN16798-1 standard. It has designated class schemes as suggested in the color code EN15251 [50] for indoor climate categories and indicated in the standard ISO 7730:2005. Furthermore, some implications regarding ventilation parameters, such as the fresh air flow rate (Q) and ACH (λ), were used to verify the IAQ in the studied LTCs, highlighting the potential risk to well-being, safety, and comfort with an emphasis on ensuring adequate IEQ in LTCs.

2. Materials and Methods

Field survey: A field survey of 15 bus and 21 train trips was analyzed. The measurements took place between June 2019 and May 2023, while the trip routes were mainly in the EU, including a few trips in South and Central American countries. The trips occurred in travels between cities, and IC measurements were completed in real-time of long-haul passenger travels exceeding 60 min of travel. The comparative assessment considers heating and cooling according to the application of HVAC use; the heating season corresponds to the colder times of the year, while the cooling season corresponds to the hotter period of the year. See Table 1a,b below for the routes, vehicle type, and trip details. The train’s passenger cars surveyed included those of high-speed trains (HSTs) and urban/suburban rolling stock (URS). However, for the present study, the scope was to evaluate the general IC conditions experienced in regular passenger cabins. The surveyed cabins were mostly closed-window settings and mechanically ventilated.
Environmental Measurement: An instrument with an IEQ multiprobe sensor was used to measure the influencing IEQ physical parameters. In Figure 1, some photos of the equipment and field survey are presented.
The device includes a software interface for interaction with a computer (Figure 1), following the methods presented by Gameiro da Silva et al. (2019) [51] and the assessments of IEQ in civil aircraft by Gameiro da Silva et al. (2023) [52]. IC measurements were made in the bus and train cabins. The USB stick format enables easy connection with a computer, and data acquisition and visualization happen in the computer system. The measured parameters are CO2 concentration, operative temperature (TO), relative humidity (RH), atmospheric pressure, illuminance, and embedded IAQ index for measuring VOCs. Complimentary calibration software was included for consistent metrological data by the IEQ multiprobe device. It ensures the adequate management of all procedures for calibration and updates to calibration files uploaded at the inception of measurement of the IC parameters taken by the multiprobe device. The IEQ multiprobe sensors were calibrated by the following procedures for these reference types of equipment: a Bruel & Kjaer 1212 Thermal Comfort Meter (room operative temperature reference); a Trotec DL200X Data Logger (relative humidity reference); and a Trotec DL200L Data Logger (CO2 concentration reference). The calibration session occurred during a 10-hour test in a room with controlled IEQ conditions, varying slowly and continuously. Considering the discussions and findings of previous studies [53,54,55] on operative temperature, the similarity of the IEQ multiprobe device used in the current study to the grey sensor was evaluated by [56]. Moreover, in the recent findings of Broday et al. (2021) [57], it was adequate to employ the IEQ multiprobe device for the measurement of TO since this solution ensures less uncertainty than the calculation of the TO based on air temperature, mean radiant temperature, and air velocity, where there are three sources of error. The calibration results are shown in Table 2 accordingly. Some photos relating to the field survey were collected using a mobile phone device, including screenshots of the computer and datalogger display. Figure S1 in the Supplementary Materials shows a typical data logger IEQ interface.
The measurements for environmental parameters began at the start of the bus or train trip and continued until the end of each respective journey. The position of the measurement is from a typical passenger seat, considering real-time travel conditions such as occupied cabins and restricted activity along cabin aisles. The device was at the level of the center of gravity, just above seat surfaces in the cabin, as per the recommendations of 1SO 77730 [32]. To mitigate the effects of local comfort (such as effects of draft and radiant asymmetry), personal air vents and curtains were adjusted (direct sunlight) at the measurement area. The consideration for the metabolic rate, 1.2 met and 0.1 m/s for air velocity, was adopted due to the sedentary position and resting conditions of passengers [58]. An average clothing insulation (Icl) of 1 clo was considered for the heating season and an average Icl of 0.5 clo for the cooling season. The measured environmental data and the assumed parameters were used to calculate the predicted mean vote (PMV) thermal comfort index. Air quality, based on VOCs and the concentration of CO2, was also evaluated. Calculations and computations were made via Microsoft Excel and the thermal comfort indices PMV-PPD spreadsheet calculator [59].
EN16798-1 requirements: The similarity in the sedentary nature of some activities of individuals in a building compares to that of passengers in a bus or train cabin, which makes it suitable to evaluate the indoor climate conditions of cabin spaces as prescribed by the CEN standard EN16798-1. To verify the indoor environment in cabins during bus and train trips, following EN16798-1, it is mandatory to check the recommended design values of indoor operative temperature (TO), the concentration of CO2, and volatile organic compounds, as shown in Table 3. Annex B1 of EN16798-1 defines the recommended values for operative temperature for the winter and summer seasons. The equipment sensors capturing volatile organic compounds (VOCs) in the cabins are delimited following the IAQ scale in the BME 680 datasheets regarding indoor air quality [60].
Evaluation method of the ventilation parameters: The fresh air flow rate and air exchange rate were calculated using Equations (1)–(4), using the estimated mean outdoor and mean measured in-cabin CO2 levels during each trip, similar to the methods applied by Ogundiran et al. (2023) [29]. The maximum occupancy passenger count was at full occupancy for only seating passengers, as was experienced in the field survey, including the estimated internal cabin volumes for the buses and train passenger cars.
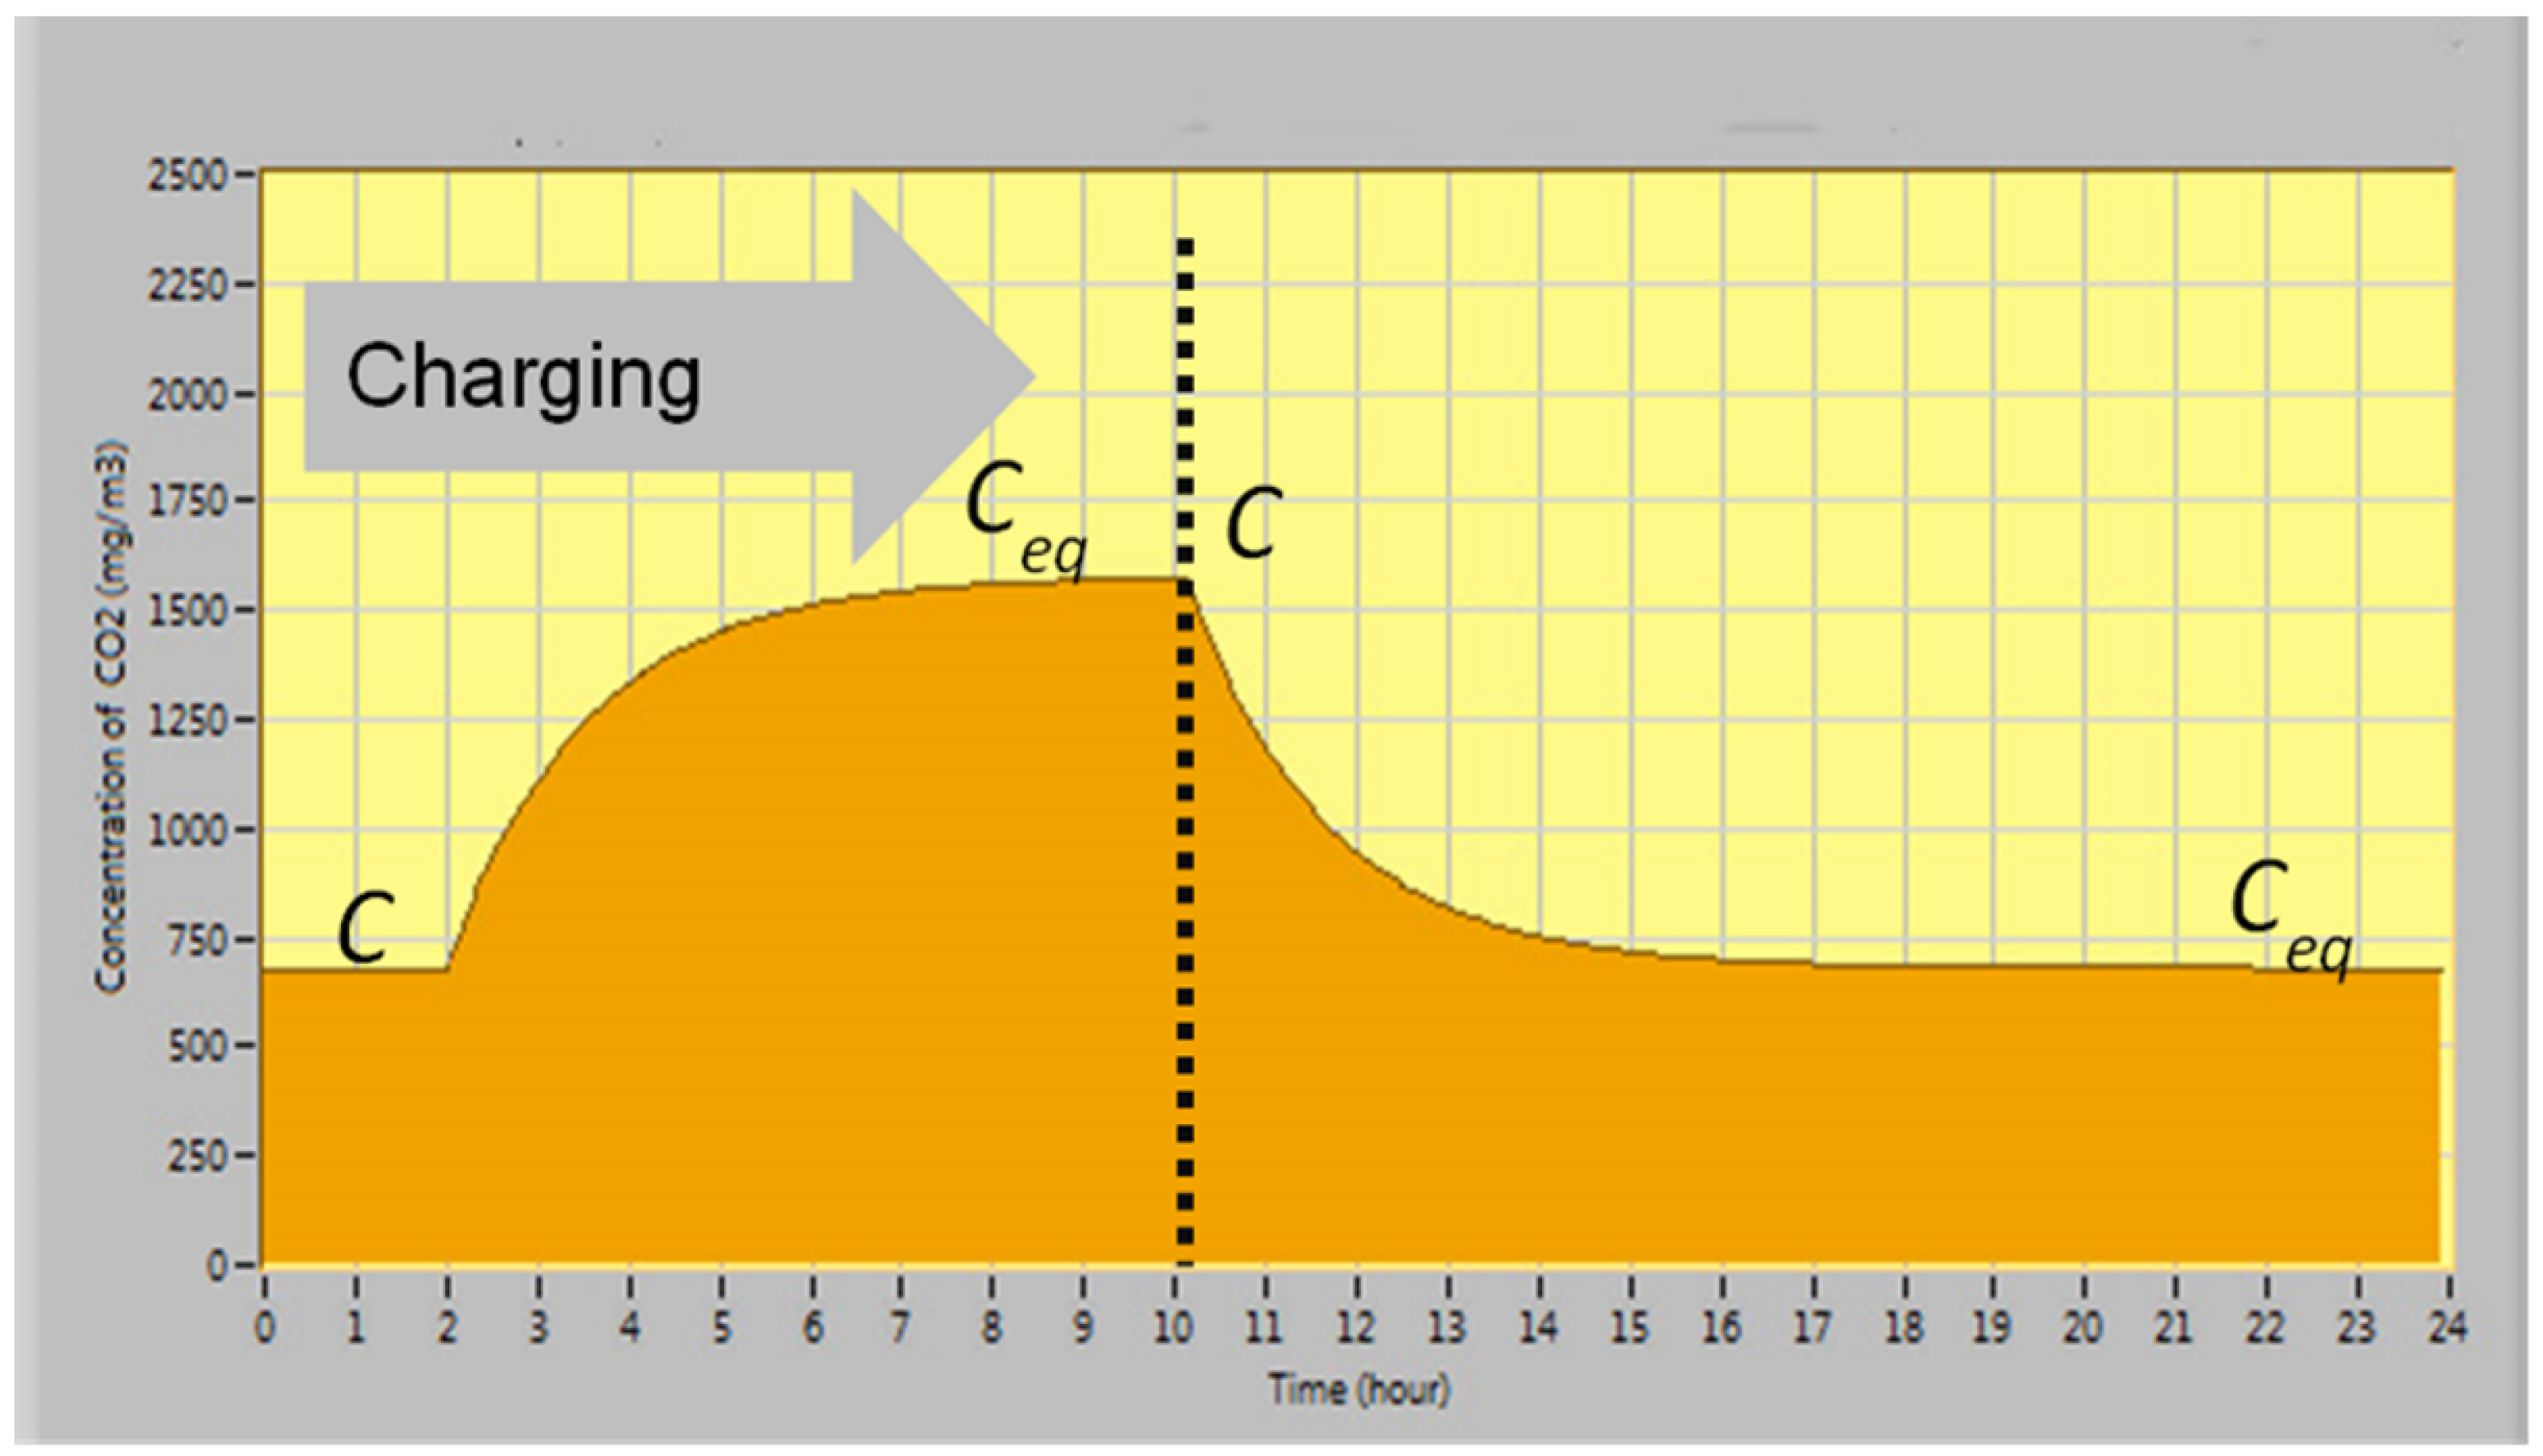
Figure 2 shows a typical charging and decay phase in the evolution of CO2 concentration in a typical room; in this case, it was adapted for the evaluation of the cabin. At the end of the charging phase, when C (the initial concentration of CO2) rises to Ceq (Cequilibrum), it becomes the ‘new’ initial condition C during the decay phase, again given Ceq.
d C d t = G V + λ C e x t e r n a l Λ c
C t C e q u i l i b r u m C o C e q u i l i b r u m = e λ t
C e q u i l i b r u m = C e x t e r n a l + G Q
λ V = Q V
Cequilbrum refers to the CO2 equilibrium concentration in ppm or mg/m3, Cext (Cexternal) refers to the outdoor CO2 concentration in ppm or mg/m3, and G is the CO2 (mg/h) generated in the cabin by the occupants. V is the volume of indoor space in m3 (in this case, the bus cabin, or the train passenger volume), Q is the fresh airflow rate (m3/h), and λV refers to the air exchange rate (h−1). The CO2 generated (GCO2) by a typical person is 37,000 mg/m3 (0.0187 × 10⁶ ppm). A metabolic rate of 1 met, similar to individuals in an office or classroom in sedentary positions, has been used for calculations.
Figure 2. Graphical illustration of the CO2 charging and decay processes in indoor spaces [61].
Atmosphere 15 00589 g002

3. Results and Discussion

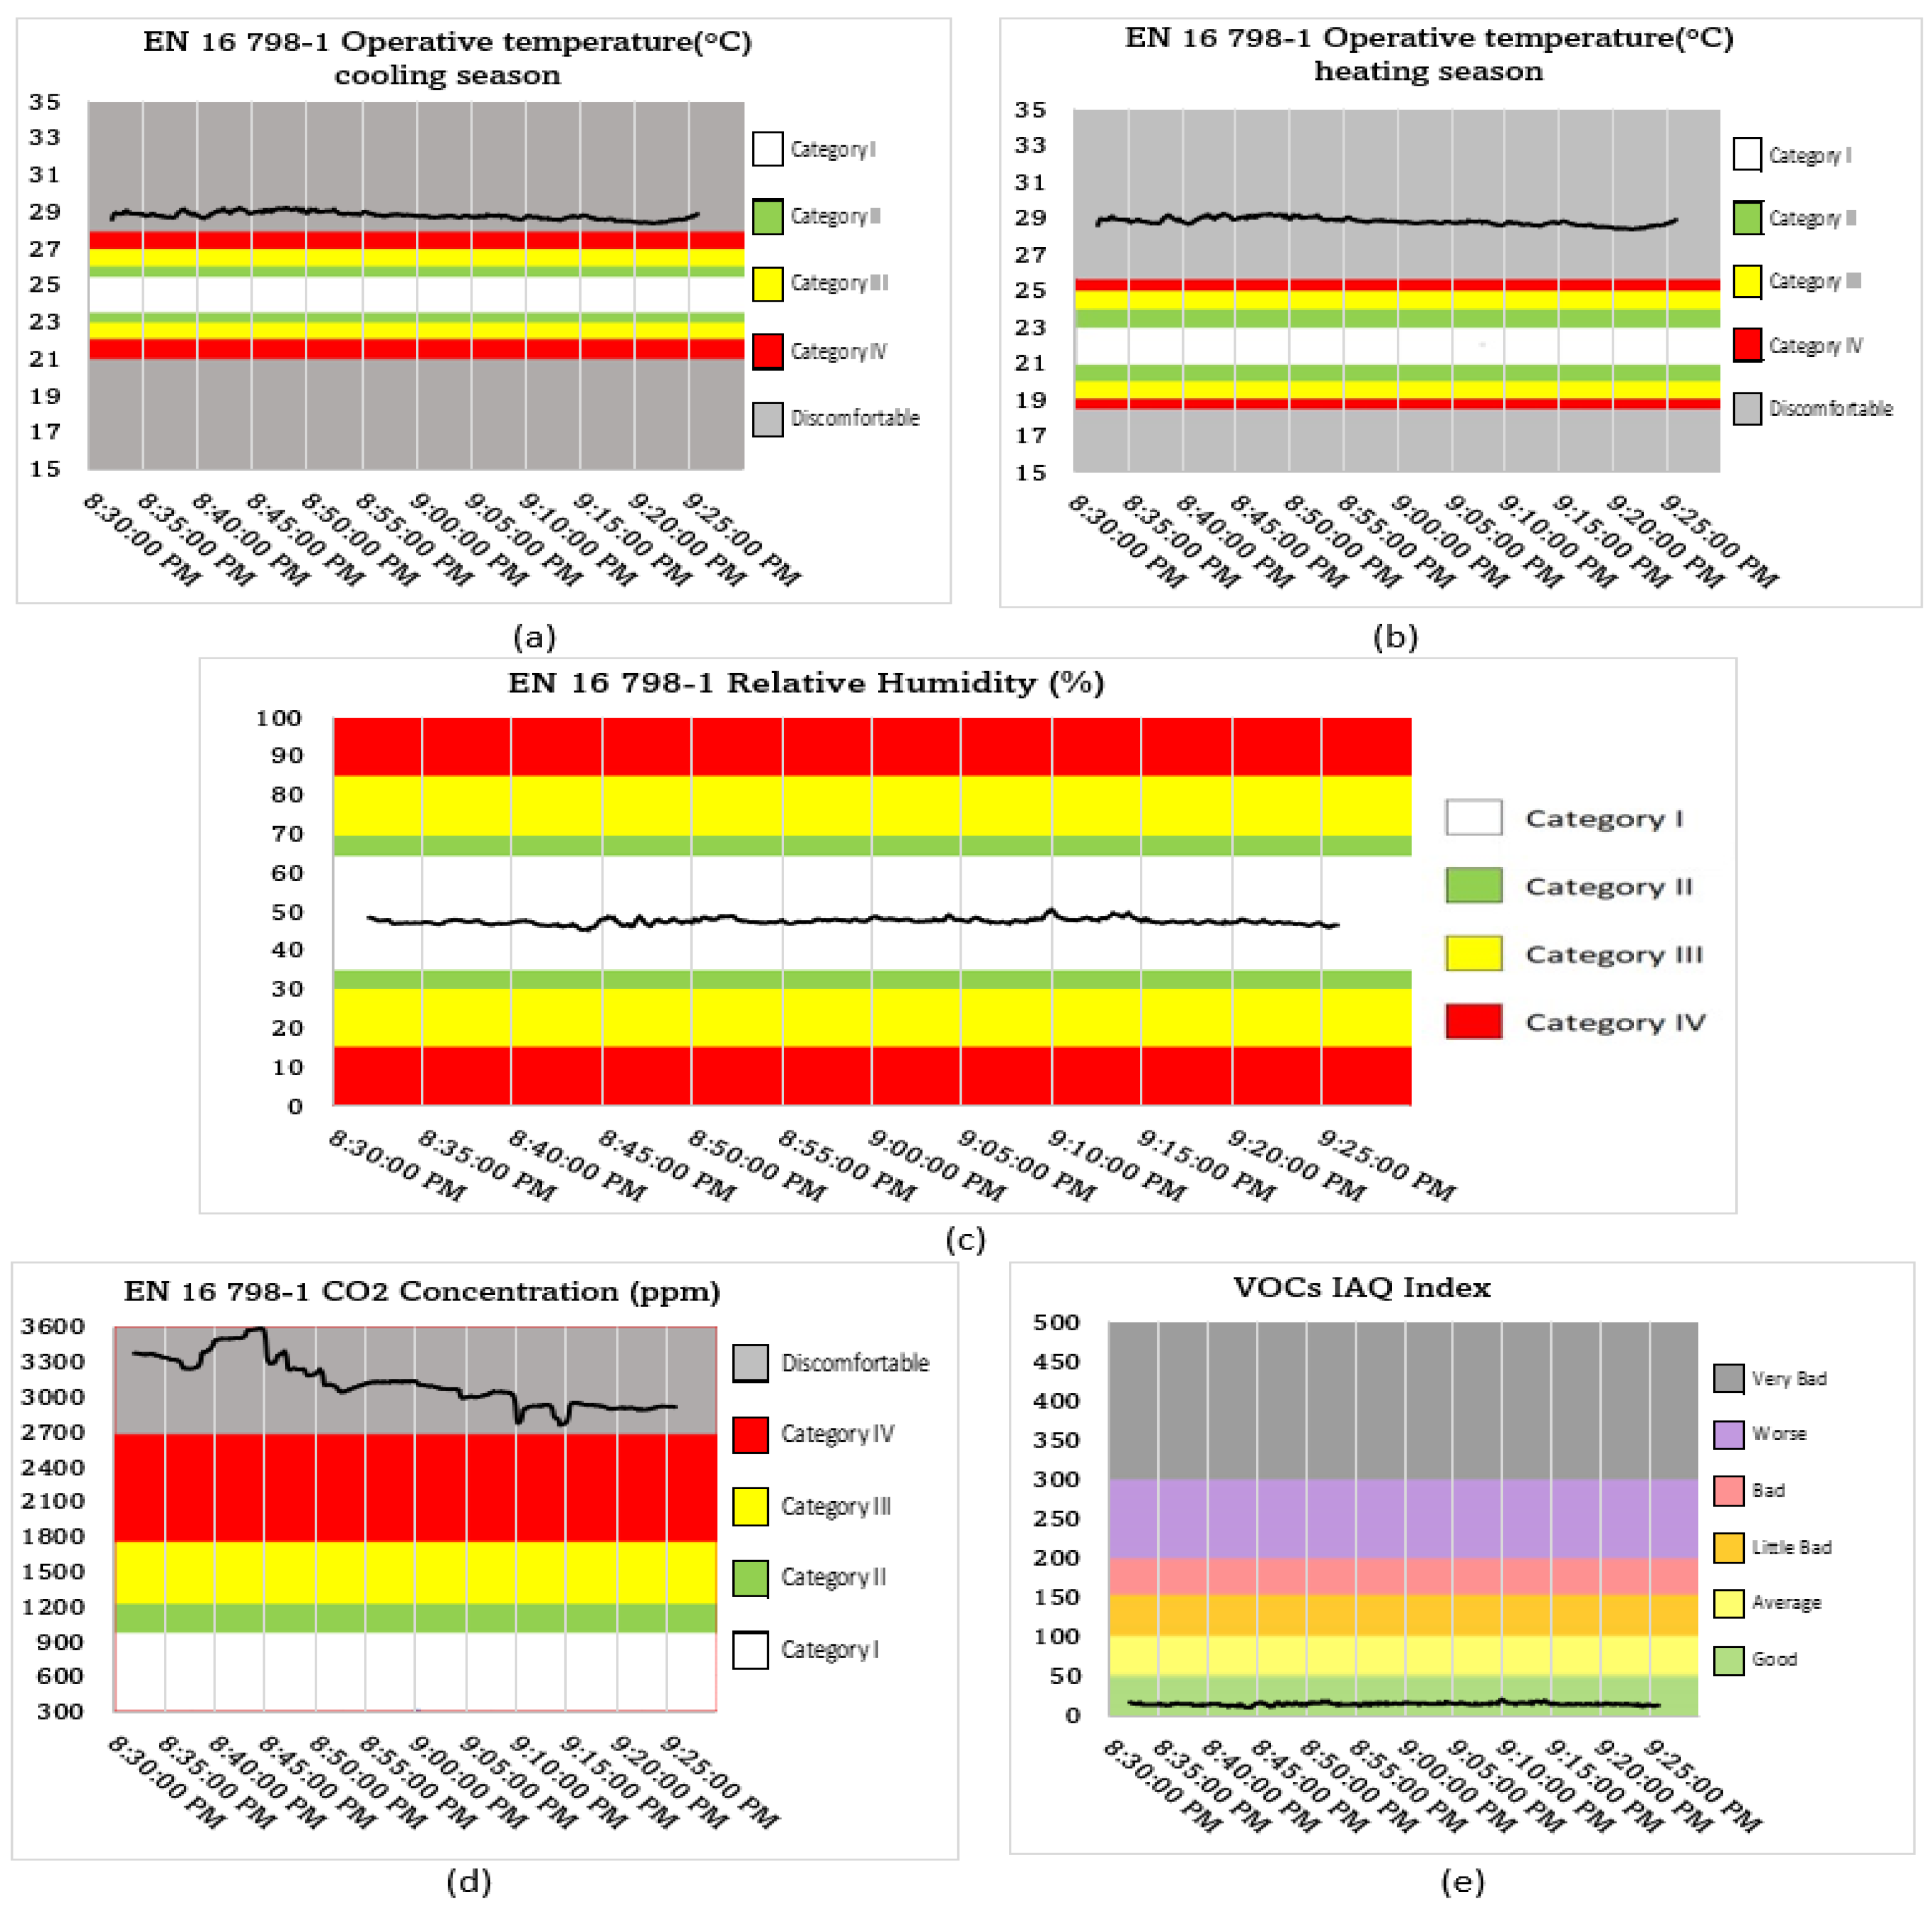
The technical life duration of public buses is mostly between 15 and 20 years [62], whereas the service years for trains in many cases exceed 50 years. Thus, any performance assessments, including IEQ evaluations, performed within the period of vehicle useful life expectancy are relevant for planning, comfort and safety assurance, HVAC regulations, vehicle maintenance, energy efficiency, operational cost, sustainability, and reduced emissions in cities. The IC assessments carried out in the current study were all conducted during the operational life of the buses and trains since they were performed during the real-time trip experience of passengers and drivers exposed to the cabin IC conditions. The result is presented for the IC parameters measured during the reported 15 bus and 21 train trips according to the requirements of the EN 16798-1 standard. PMV and PPD values were calculated and are presented, including the mean and standard deviation values of all IEQ parameters measured by the IEQ multiprobe device. A selected bus trip is presented, showing the functionality of the equipment, the type of data it provides, how the IC information is communicated, and the temporal evolution of the environmental variables. Following the suggested color code of EN15251, the time series is displayed over a background with the four categories of IEQ [50]. A preliminary assessment of the chosen trip is described accordingly.
Figure 3a,b shows the evolution of operative temperature, while Figure 3c presents the RH for the selected bus trip. For the presented bus trip, both the registered operative temperature and RH evolutions are presented. Although there is a general trend of consistency in the operative temperature and RH along the trip time, the operative temperature is clearly in the discomfort range. The RH is in the safe and comfortable range, in category I of the EN16798-1 standard. Figure 3d,e shows the time evolutions of CO2 concentration and VOC index. In the case of the presented bus trip, the measured CO2 level (in ppm) is not constant during the trip, as typically some disturbances occur that can affect the in-cabin CO2 level, such as variation in vehicle speed, road traffic dynamics, stops for coffee, and passenger drop-off or pick-up, in addition to other long-haul travel activities. Notably, the selected study trips were inter-city trips, most of which had journey times exceeding an hour. Furthermore, the CO2 levels did not meet the requirements of the referenced EN16798-1 standard, considering that the mean level of CO2 was 3122 ppm. The CO2 ranged in the discomfort zone throughout the journey, exceeding category IV. Regarding VOC assessment by the prescribed IAQ index, there is a trend of consistency in the levels, including compliance to safe levels for the entire trip (being less than 50) compared to the referenced index range from 0 to 500 (Table 3). The results suggest preliminary conclusions that the IC was inadequate for the referenced bus trip. The following sections will now present the results and discussions regarding the IC measurements for all 15 bus trips and 21 train trips.
Results for the investigated trips, combined cooling season and heating season: The preliminary assessments have revealed that most of the investigated cabins were within acceptable levels as per CO2, VOCs, RH, and TO. Nonetheless, a considerable number of cabins were not in the safe and comfort categories of the EN 16798-1 standard. This implies that gaps still exist and that there is a risk to the well-being and comfort of the exposed passengers, onboard train service staff, and bus drivers. The present study did estimate the specific risk levels, and the findings show information on the level of compliance with recommended IC requirements for the well-being and comfort of occupants. Furthermore, the assessment of ventilation parameters such as the fresh air flow rate and air exchange rate was evaluated, leading to the conclusion that the IAQ in most bus and train cabins was altogether inadequate as per the mean CO2 concentration levels recorded. The average environmental values of the IC parameters measured are presented in Table 4 for the 15 bus trips. Five trips are reported for the heating season and ten for the cooling season.
Table 5 presents the results of the average values of all the measured IC parameters for the 21 train trips.
Thermal comfort: Thermal comfort remains largely a subjective assessment of how the exposed occupants feel; however, the results of the measurements of the operative temperature and relative humidity in the current study are important environmental indicators to categorize the cabin thermal comfort conditions. The measured thermal comfort parameters are graphically presented and discussed below.
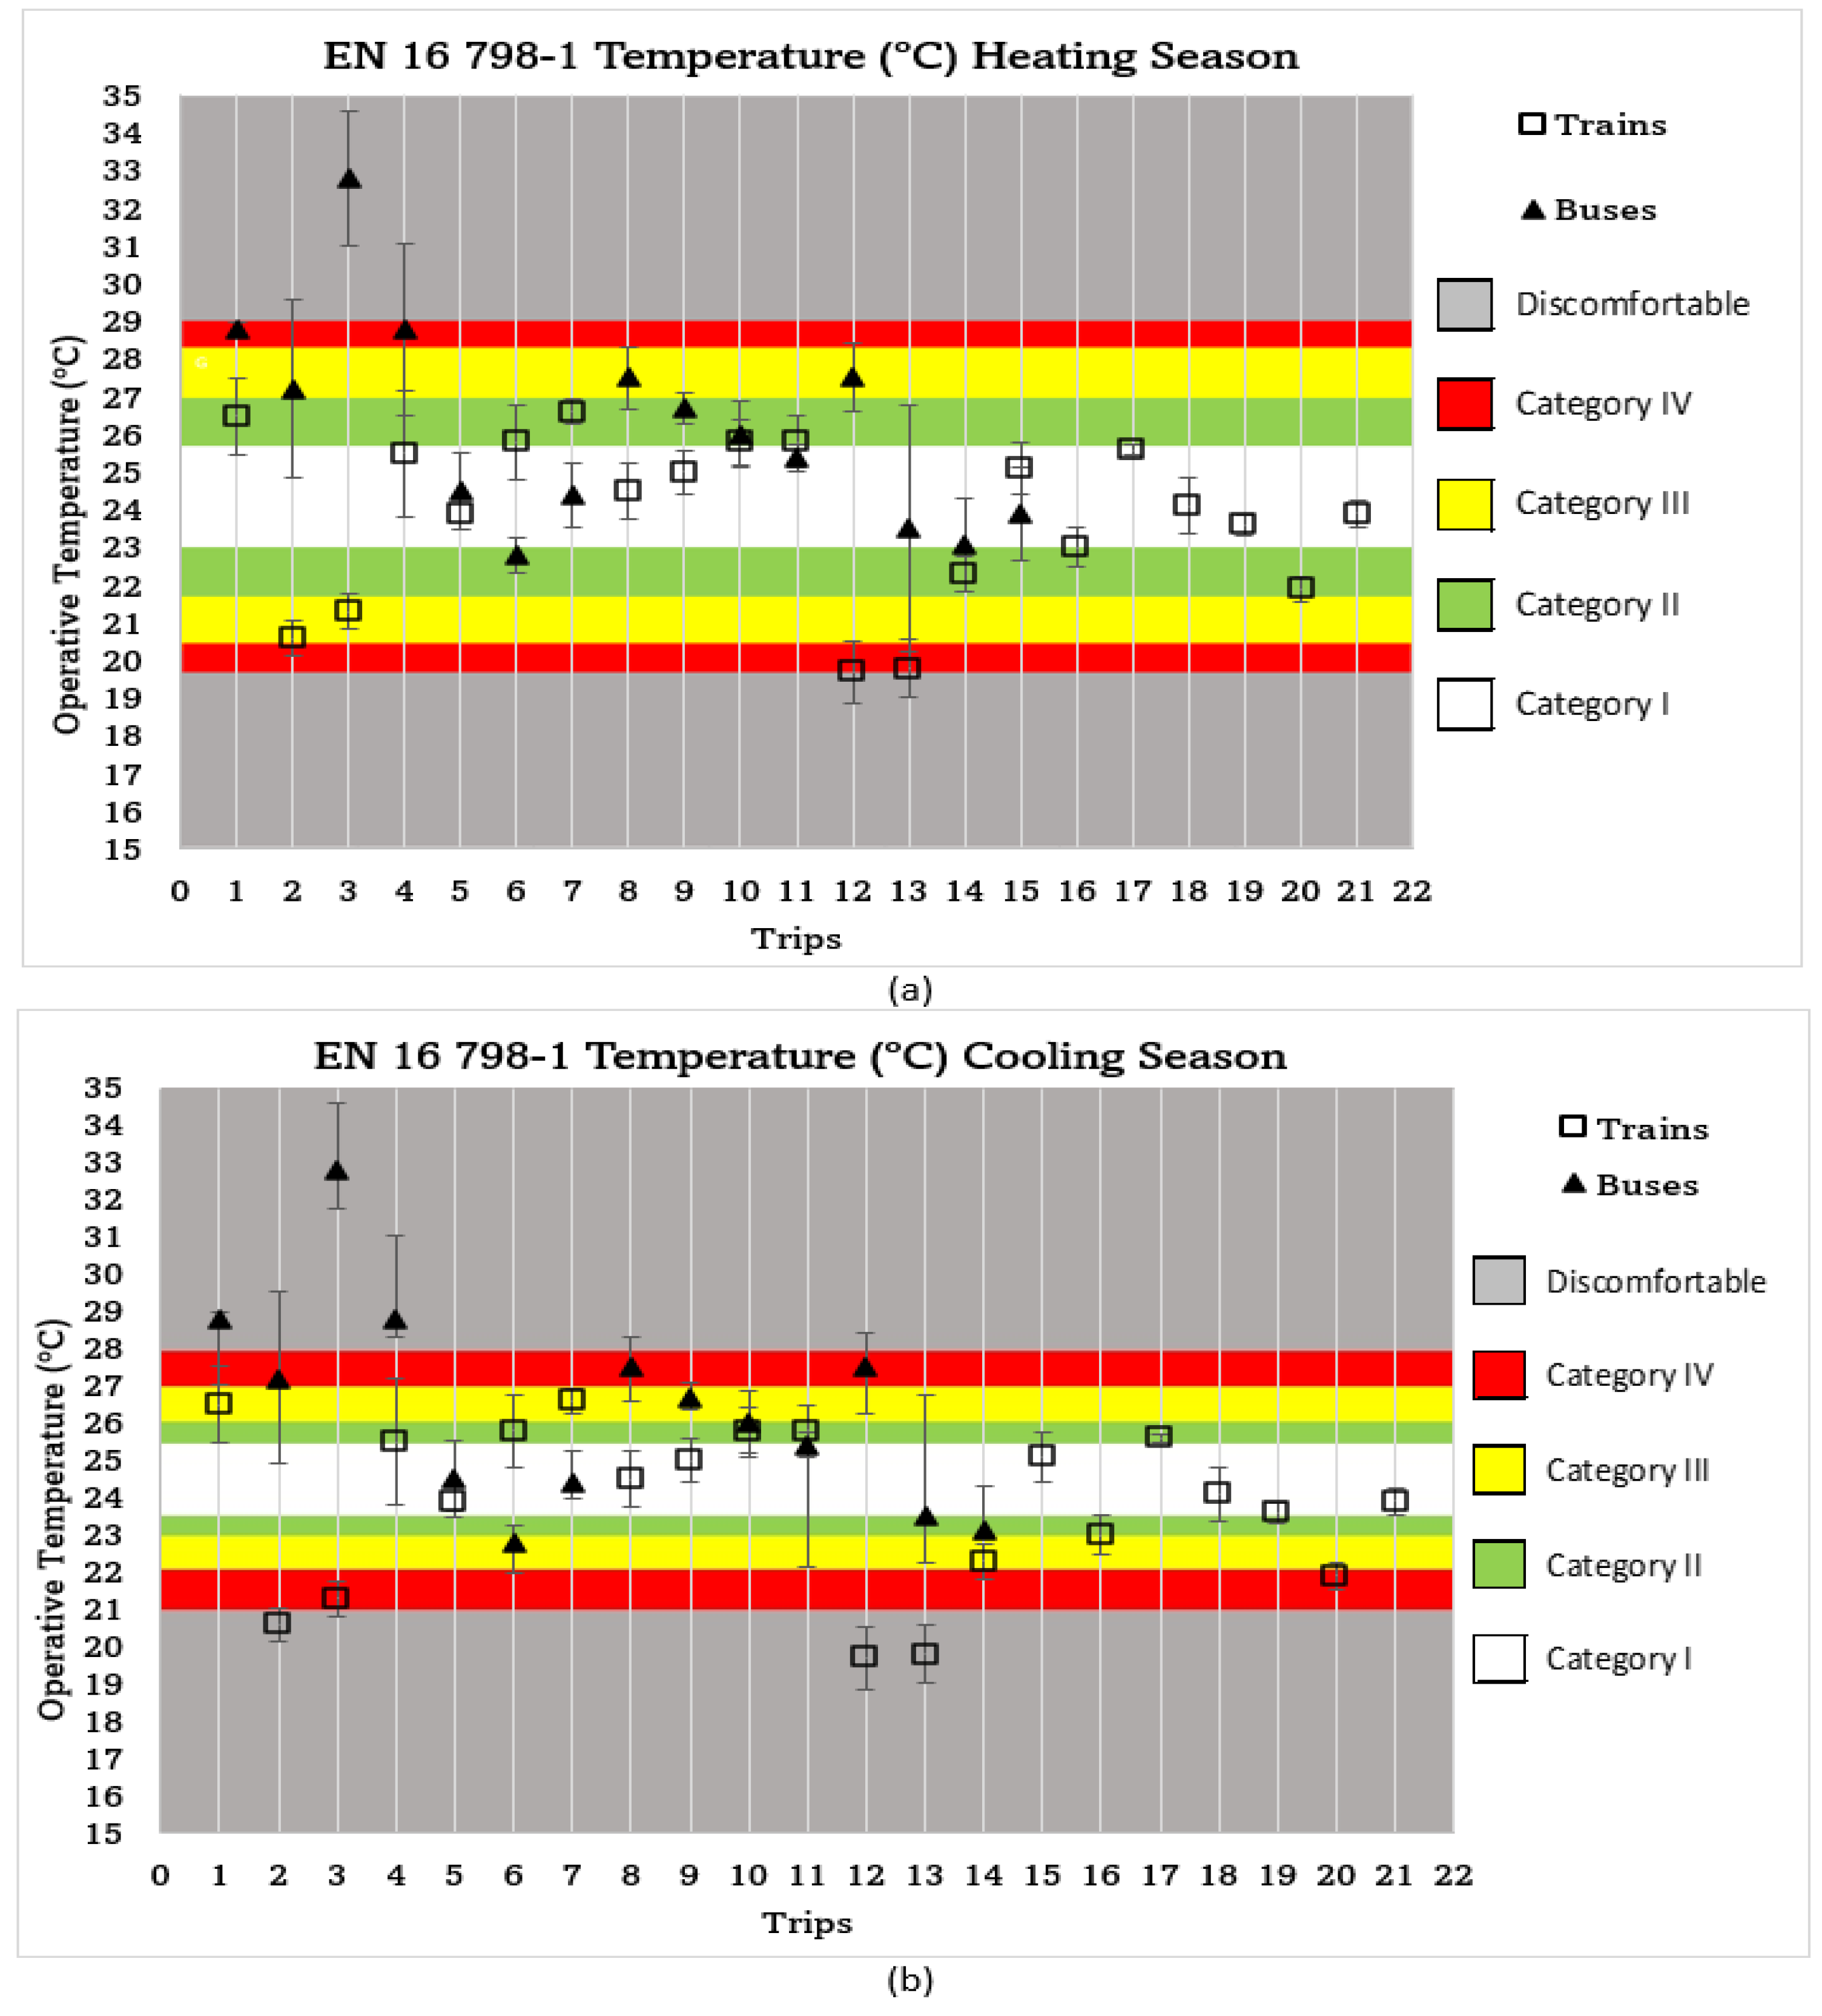
Figure 4 shows the results of the average operative temperature values of the recorded time series, categorized according to the EN 16798-1 requirement for each bus (15 trips) and train (21 trips). Figure 4a shows the categorization of all trips considering the heating season requirements of EN 16798-1, while Figure 4b shows the operative temperature categorization considering the cooling season requirements of EN 16798-1. Regarding buses, ten bus trips were investigated during the cooling season and five trips were assessed during the heating season as per the HVAC use for the summer and winter periods, respectively. According to EN 16798-1, the TO (°C) range for the comfortable categories varies between 21 °C and 28 °C in the cooling season for people with sedentary activity, this range being the limit of the four categories defined as represented in Figure 4. It can be verified that the average TO (°C) values of nine buses specifically were within categories I, II, and III, indicative of comfortable thermal environments in the cabins. Using the cooling season requirements (Figure 4a), in six of the bus trips (trips 1, 2, 3, 4, 8, and 12), the measured mean TO (°C) values were not in the comfort zone; significantly, the third trip was found in the category of discomfort at a mean TO (°C) of 32.8 °C. Using the heating season EN 16798-1 requirement (Figure 4b) to evaluate the mean TO (°C) level in the bus trips, three trips had inadequate thermal environments. Trips 1 and 4 were in category IV, while the third (bus trip 3) fell into the discomfort zone. Regarding the investigated train trips, using the cooling season EN 16798-1 requirement for the TO (°C) as in Figure 4a, five of the 21 trips were out of the recommended comfort range, with three in category IV and two in the discomfort zone. The mean TO (°C) values suggest that the thermal environment was colder than recommended. Using the heating season requirements as in Figure 4b, two trips showed poor thermal conditions at the boundary of category IV and discomfort, while another (trip 2), was between category IV and III. Meanwhile, no trips exceeded category II in the cooling season as per the EN 16798-1 requirement, suggesting that the thermal environments were better in the train cabins during the cooling season. It could be inferred that approximately 76% of the reported train trips had suitable thermal conditions, considering the requirement for cooling or heating season by EN 16798-1, whereas only 60% of all the studied bus cabins were thermally adequate considering the heating and cooling season EN 16798-1 requirements. These preliminary assessments suggest that gaps still exist in some bus and train passenger cabins in the studied vehicles.
PMV and PPD analysis: The PMV and PPD indices were calculated using the Excel spreadsheet [59] based on P.O. Fanger’s model [63], suitable for individuals in sedentary activities like passengers in trains and buses. Table 6 presents the calculated PMV and PPD values for each trip evaluated. The measured operative temperature and relative humidity values were considered together with the following assumptions: a metabolic rate of 1.2 met, a clothing insulation coefficient of 0.5 clo for the cooling season and 1.0 clo for the heating season, and an air velocity range (Va) from 0.1 to 0.3 m/s. This option is because the air velocity has an intrinsic, non-uniform character due to the type of jet-based ventilation systems used in passenger compartments. Thus, getting a complete spatial distribution is not compatible with the type of survey carried out in this work, where the passenger compartments were analyzed in actual exploitation circumstances. The interval limits for the airspeed were defined based on the results published by Zhu et al. (2010) [47] for the CFD calculation of the spatial distribution of this variable in bus compartments and Lin et al. (2005) [64] for the hot-wire anemometry time history measurements. The PMV nomenclatures were adopted to distinguish the results as follows: PMV1 (trains), PPD1 (trains), PMV3 (buses), and PPD3 (buses) were the values obtained considering a mean air velocity of 0.1 m/s, while PMV2 (trains), PPD2 (trains), PMV4 (buses), and PPD4 (buses) were the values obtained considering a mean air velocity of 0.3 m/s.
From the results of the calculated averages of PMV and PPD values for all the trips, graphs were created, analyzed, and discussed.
Figure 5a,b shows the distribution of the PMV index values for all bus and train trips. The focus of the evaluations and discussion will be on the PMV index graph obtained using the lower limit of the indoor velocity range of 0.1 m/s, which is the prevalent scenario observed regarding the bus and train cabins in the current study in HVAC use with closed window conditions and personal air vents in the passenger seats. The result is also presented to evaluate the PMV–PPD index values for air velocity conditions of 0.3 m/s. In comparison, the graphs suggest that there is a general trend of better compliance with the ISO 7730 recommendations for comfort in thermal environments in the condition with the PMV indexes in Figure 5a (Va = 0.1 m/s) than in the PMV indexes of Figure 5b (Va = 0.3 m/s) considering the recommended range of −0.5 to 0.5. Particularly for Va at 0.1 m/s, in 47% of the studied buses (7 trips) and 62% of the trains (15 trips), the PMV index values were within the acceptable range of −0.5 to 0.5. In contrast, for Va at 0.3 m/s, only 33% of the studied buses (5 trips) and 33% of the trains (7 trips) had PMV index values within the acceptable range of −0.5 to 0.5. Furthermore, looking at PMV–PPD values for Va at 0.1 m/s in the cooling season, the PPD values showed that a significant number of people were dissatisfied, specifically in seven of the ten cooling season bus trips (56, 30, 99, 57, 34, 23, and 15%). For trains, six of the eight cooling season trips showed high PPD values (23, 26, 18, 11, 14, and 22%). During the heating season, the PPD values imply that the degree of dissatisfaction with the thermal environment of the studied cabins was significantly lower. Meanwhile, of the five bus trips in the heating season, only the 12th trip showed a PPD value exceeding the 10% limit recommended by the American Society of Heating, Refrigerating and Air-Conditioning Engineers (ASHRAE). The PMV–PDD graph in Figure 5a shows that PMV values were spread across all thermal comfort categories of EN 16798-1, most of which were found in categories I, II, and then III. Also, only ten of all the studied trips fell into the unacceptable and discomfort categories. Particularly, three bus cabins (trips 1, 3, and 4) were categorized as outrightly unacceptable and uncomfortable. Moreover, by ASHRAE’s 10% PPD limit, only about 31% (11 cabins) of all the cabins studied were thermally acceptable, whereas by the recommended comfort categories I, II, and III of EN 16798-1, about 67% of the cabins (24 cabins) could be regarded as adequate. For PMV–PPD index values of the upper air velocity limit (when Va = 0.3 m/s), most of the cabins were categorized into discomfort zones with colder sensations in both heating and cooling season trips. Only bus cabins (trips 1, 3, and 4) were filled with warm sensations. Altogether, the PMV–PPD index (Table 6) suggests that thermal comfort was inadequate in about 39% (14 cabins) for the lower Va limit of 0.1 m/s. Also, thermal comfort was inadequate in 56% (20 cabins) of the investigated bus and train passenger cabins for the designated upper limit Va of 0.3 m/s. Perhaps implementing some preliminary intervention through regulated HVAC settings and other parameters such as clothing can enhance thermal conditions and perception in these buses and trains. The goal is to ensure adequate HVAC settings, in-cabin air flow, and air distribution to ensure a thermally comfortable environment. Notably, thermal comfort evaluations should investigate occupants’ sensations to understand their perception of comfort, since thermal comfort concerns the state of mind regarding the comfort of the exposed commuters. Moreover, thermal perception can serve as an important validation approach to reinforce the results of environmental measurements [65], provided the exposed occupants are in a healthy state.
Indoor air quality: The IAQ parameters measured and evaluated were CO2 and VOCs. The indoor CO2 concentration level is not sufficient to determine the IAQ condition of the cabins given that other pollutants are within the indoor cabin air or may intrude on the vehicle cabin; CO2 is recognized as an important critical IAQ parameter that offers valuable insight into the IAQ condition of the IC [66]. The computed mean values of CO2 and VOCs are shown in Table 4 (buses) and Table 5 (trains), which are graphically represented, analyzed, and discussed below.
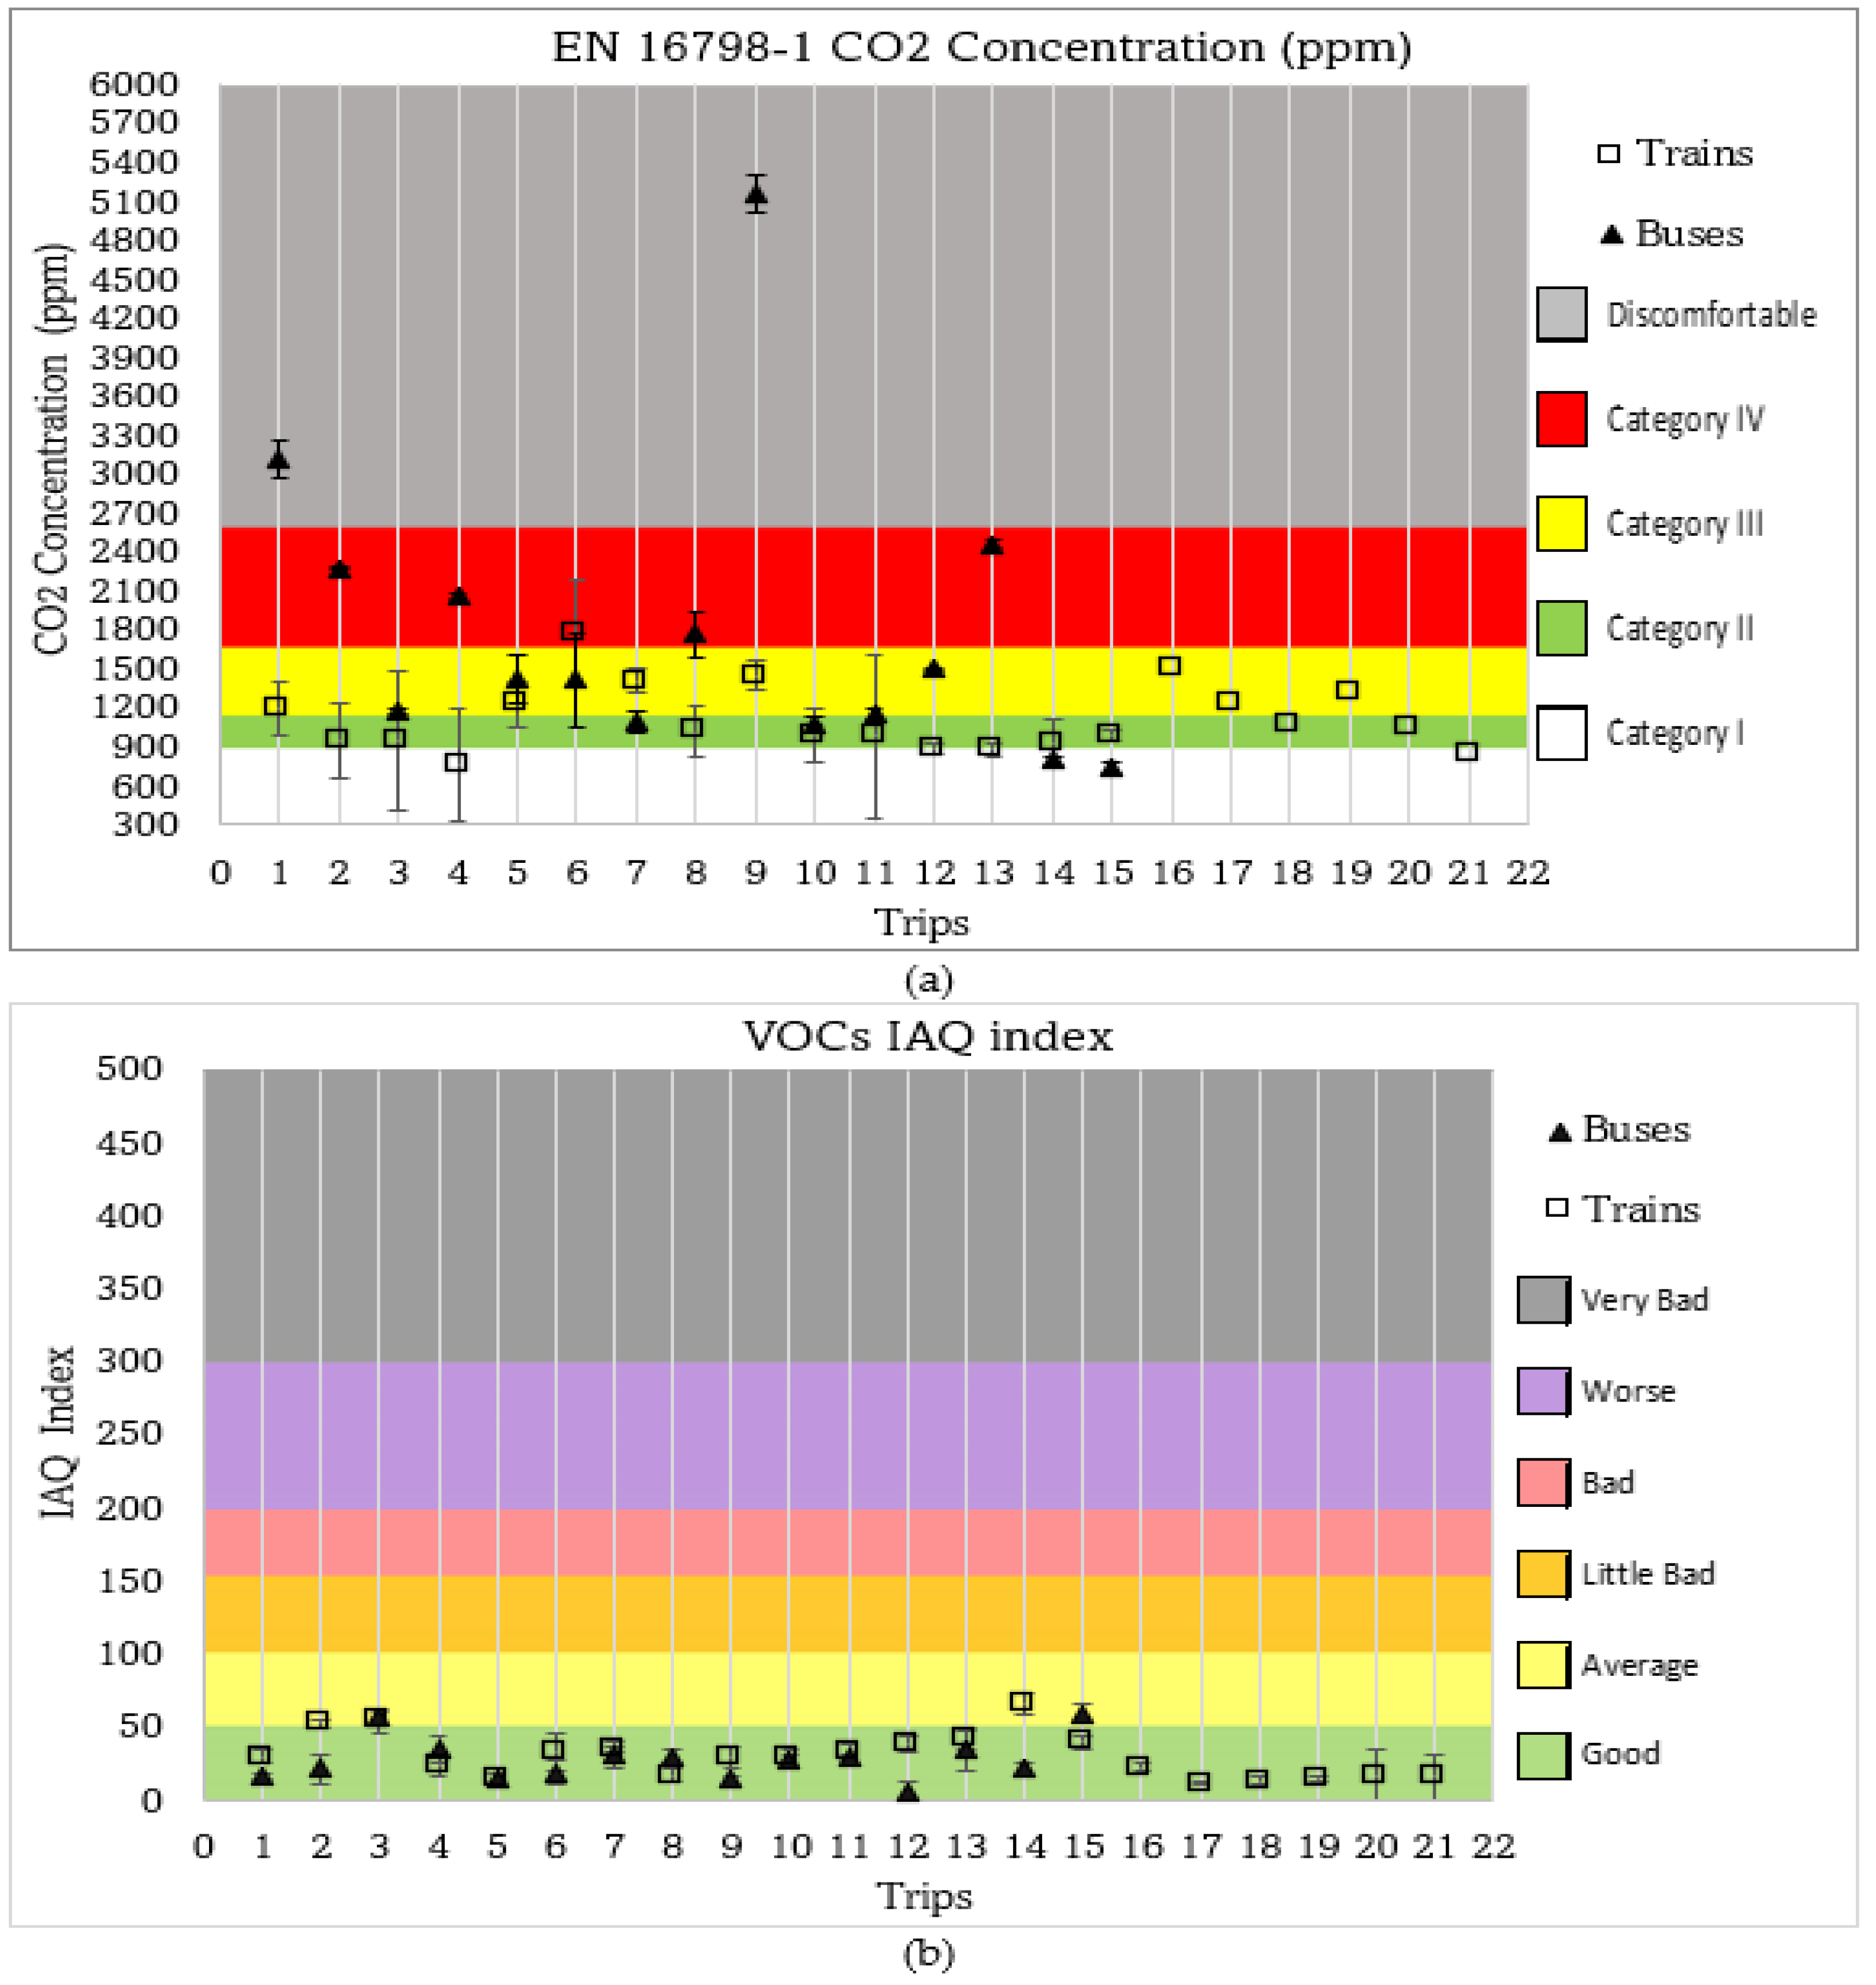
Figure 6a shows the mean and SD values of CO2 concentration on the investigated bus and train trips. By simple descriptive statistics, the mean value of CO2 concentration levels considering all 15 buses is 1848 ppm, which corresponds to category IV of EN16798-1, while for trains, it was 1116 ppm, which corresponds to category II. However, in nine buses, the values of the mean CO2 level were found to have not exceeded category III, while the remaining six buses presented high values of mean CO2 levels in category IV and the discomfort zone. The implication is that only 60% of the investigated buses had suitable mean CO2 levels. For the 21 train trips, the mean CO2 levels (Figure 5a) suggest that IAQ was better as per the CO2 requirements of the referenced standard. The overall situation is that 20 trips were within acceptable levels (categories I, II, and III), while one trip (trip 6) had a mean CO2 level of 1777 ppm. Notably, the mean CO2 levels recorded in all the passenger cabins did not attain nor exceed critical levels of 3000 pm, which can cause adverse symptoms such as fatigue, headaches, visual disturbances, reduced concentration, or poor performance in vehicle drivers [67]. The results of the average value of the time series of the VOCs IAQ index presented graphically in Figure 6b suggest that VOC levels complied with requirements during all train trips investigated. The volatile organic compound (VOC) levels in the 15 bus trips surveyed were also within the acceptable range according to the EN16798-1 requirements. The CO2 and VOC levels suggest that IAQ may be classified qualitatively as good in terms of what concerns these pollutants in the passenger cars of the studied train trips.
Figure S2 Relative humidity time series for bus and train trips combined (see Supplementary Materials).
Figure S2 shows the mean RH (%) and SD for all the buses and trains evaluated. Indoor RH levels can affect the condition of IAQ and thermal comfort. The preliminary assessment of CO2 levels suggests that the IAQ was inadequate for a significant number of cabins in some of the buses. According to EN 16798-1, RH within the range of 35% to 65% for categories I and II is observed to be suitable conditions for cabin comfort but should be maintained at greater than 40% for reduced infectivity of aerosolized viruses [68], since viruses become inactive at the RH range of 40% to 60% [69]. The RH has the most significant effect on airborne transmission mode when compared to other modes; it is recommended to ensure indoor RH at equivalent values of 50% [70]. It is important to note that the risk of viral transmission can be influenced by temperature and RH. Raines et al., evaluating the role of temperature and RH in the transmission of SARS-CoV-2, suggest that, if the indoor climate is not adequately regulated, viral spread can increase exponentially in conditions where RH exceeds 75% and above 20 °C, irrespective of higher temperatures, and experience attenuation of transmission in climates with sustained daily temperatures above 30 °C and simultaneous mean relative humidity below 78% [71]. Altogether, a defective IAQ and thermal comfort implies that the IC experienced during the bus trip might have been inadequate, though the mean values for the RH levels ranged mostly in category I for 13 buses and 19 trains, category II for two buses and a train trip, and only one train was found in category III. Sireesha (2017) [72] correlated CO2 intensities with ventilation and IAQ, suggesting that concentrations exceeding 1000 pm indicate that the ventilation rates are offensive in relation to body smells (a source of VOC) and are calculated based on ventilation rates and occupancy. The aim is to achieve adequate IC via compliance with EN16798-1′s IEQ requirements. These recommended categories, designated I, II, and III, are tolerable ranges for comfort and well-being, depending on the indoor occupancy density. While for overcrowded vehicle cabins or rooms it is not out of place to see conditions of IC parameters in category IV, it is still expected that IEQ parameters do reach the discomfort zone (the grey-colored zone in the graphs). The occupancy density and ventilation parameters are important factors that can significantly impact the IAQ in both mobile microenvironments and built indoor spaces [73]. The VOC levels reported in the current study suggest that all cabins were in good compliance concerning VOCs as per EN 16798-1 requirements. Human occupants in LTCs are sources of CO2 (exhaling approximately 35,000 to 50,000 ppm) and bio-effluents, which may include infectious aerosols, hence the need for adequate ventilation and cabin climatization. The IAQ conditions are also influenced by the ventilation parameters; hence, the air flow rate and air exchange rate have been estimated in the current study for a broader evaluation of the IAQ conditions in the studied cabins.
Evolution of CO2 concentration and air exchange rate: Regarding the IAQ of vehicle cabins, air exchange per hour and airflow patterns can have significant impacts on the air quality and the presence of possible infectious particles in the air (aerosols). The ACH in cabins can be influenced by variations in vehicle speeds, window settings, frequency of door opening, and ventilation mode (recirculatory or non-recirculatory). According to Mathai et al. (2021) [74], the most effective way to reduce cross-contamination between occupants in a car cabin is to fully open windows. Additionally, airflow patterns and scalar concentration fields support the use of cross-ventilation to minimize the spread of infectious aerosols in the car cabin. Meanwhile, recirculating vehicle cabin air is not recommended for a reduced risk of infectious aerosols [41,75]. Taking an average outdoor CO2 level of 450 ppm (Cext is 810 mg/m3) and the mean CO2 concentration values in each of the investigated trips as their respective Ceq, the estimated fresh air flow rates and air exchange rates in all the trips were calculated as illustrated with the case of a chosen bus trip. For the selected bus trip, the mean CO2 value measured was 3122 ppm, or 5619.6 mg/m3. Hence, obtaining the fresh air flow rate, Q per passenger, is 7.8 m3/h, obtained using the expression from Equation (3) in the Section Materials and Methods. Now, considering a fully loaded bus cabin with 56 people, all seats occupied, as in the investigated bus, the fresh air flow rate is Q = 7.8 × 56 = 430.8 m3/h. The ACH was obtained using the expression below from Equation (4) in the Section Materials and Methods. The ACH, λ, is 7.2 h−1, which indicates how long it takes to attain the referenced equilibrium concentration of CO2 (3122 ppm or 5619.6 mg/m3) in the evaluated indoor space (bus cabin). The calculated air exchange and fresh air flow rates for bus trips and train trips are in Table S1 of the Supplementary Materials. An estimated in-vehicle volume of 60 m3 (urban buses), 9.5 m3 (Coimbra shuttle), and 145.6 m3 (typical internal volume for passenger cars in the regular EU single-level train type) and maximum cabin passenger occupancy were adopted to calculate the Qtrain, λtrains, Qbuses, and λbuses. The train passenger car volume (TCV) and bus car volume (BCV) refer to the cabin volumes depending on the vehicle type identified for the investigated trip; the train passenger count (TPC) and bus passenger count (BPC) refer to the occupants in the investigated vehicles. In the current study, the CO2 levels (ppm) recorded in the cabins, with passenger occupancy of over 80% for most of the journey time, exceeded the 800 ppm threshold but stayed below the 5000 ppm occupational exposure limit set by OSHA [76]. The measured and calculated ventilation parameters for all trips are presented in Table S1 of the Supplementary Materials.
Typically, to achieve in-cabin conditions for suitable CO2 levels, it is recommended to ensure a fresh air flow rate of 36 m3/h (for category I) or 25 m3/h (for category II) per person, following EN 16798-1. Moreover, the ventilation rate base level for occupant emissions ranges from 9.0 to 36 m3/h per person in ASHRAE 62.1-2016 and 14.4 to 36 m3/h per person in EN 15251:2007 [77]. Furthermore, considering the dynamic influences that may occur due to variations in vehicle speed during a journey and the cabin occupancy rate, it is suggested to deploy a demand control ventilation strategy, accommodating possible trade-offs in energy consumption and the IAQ cabin conditions.
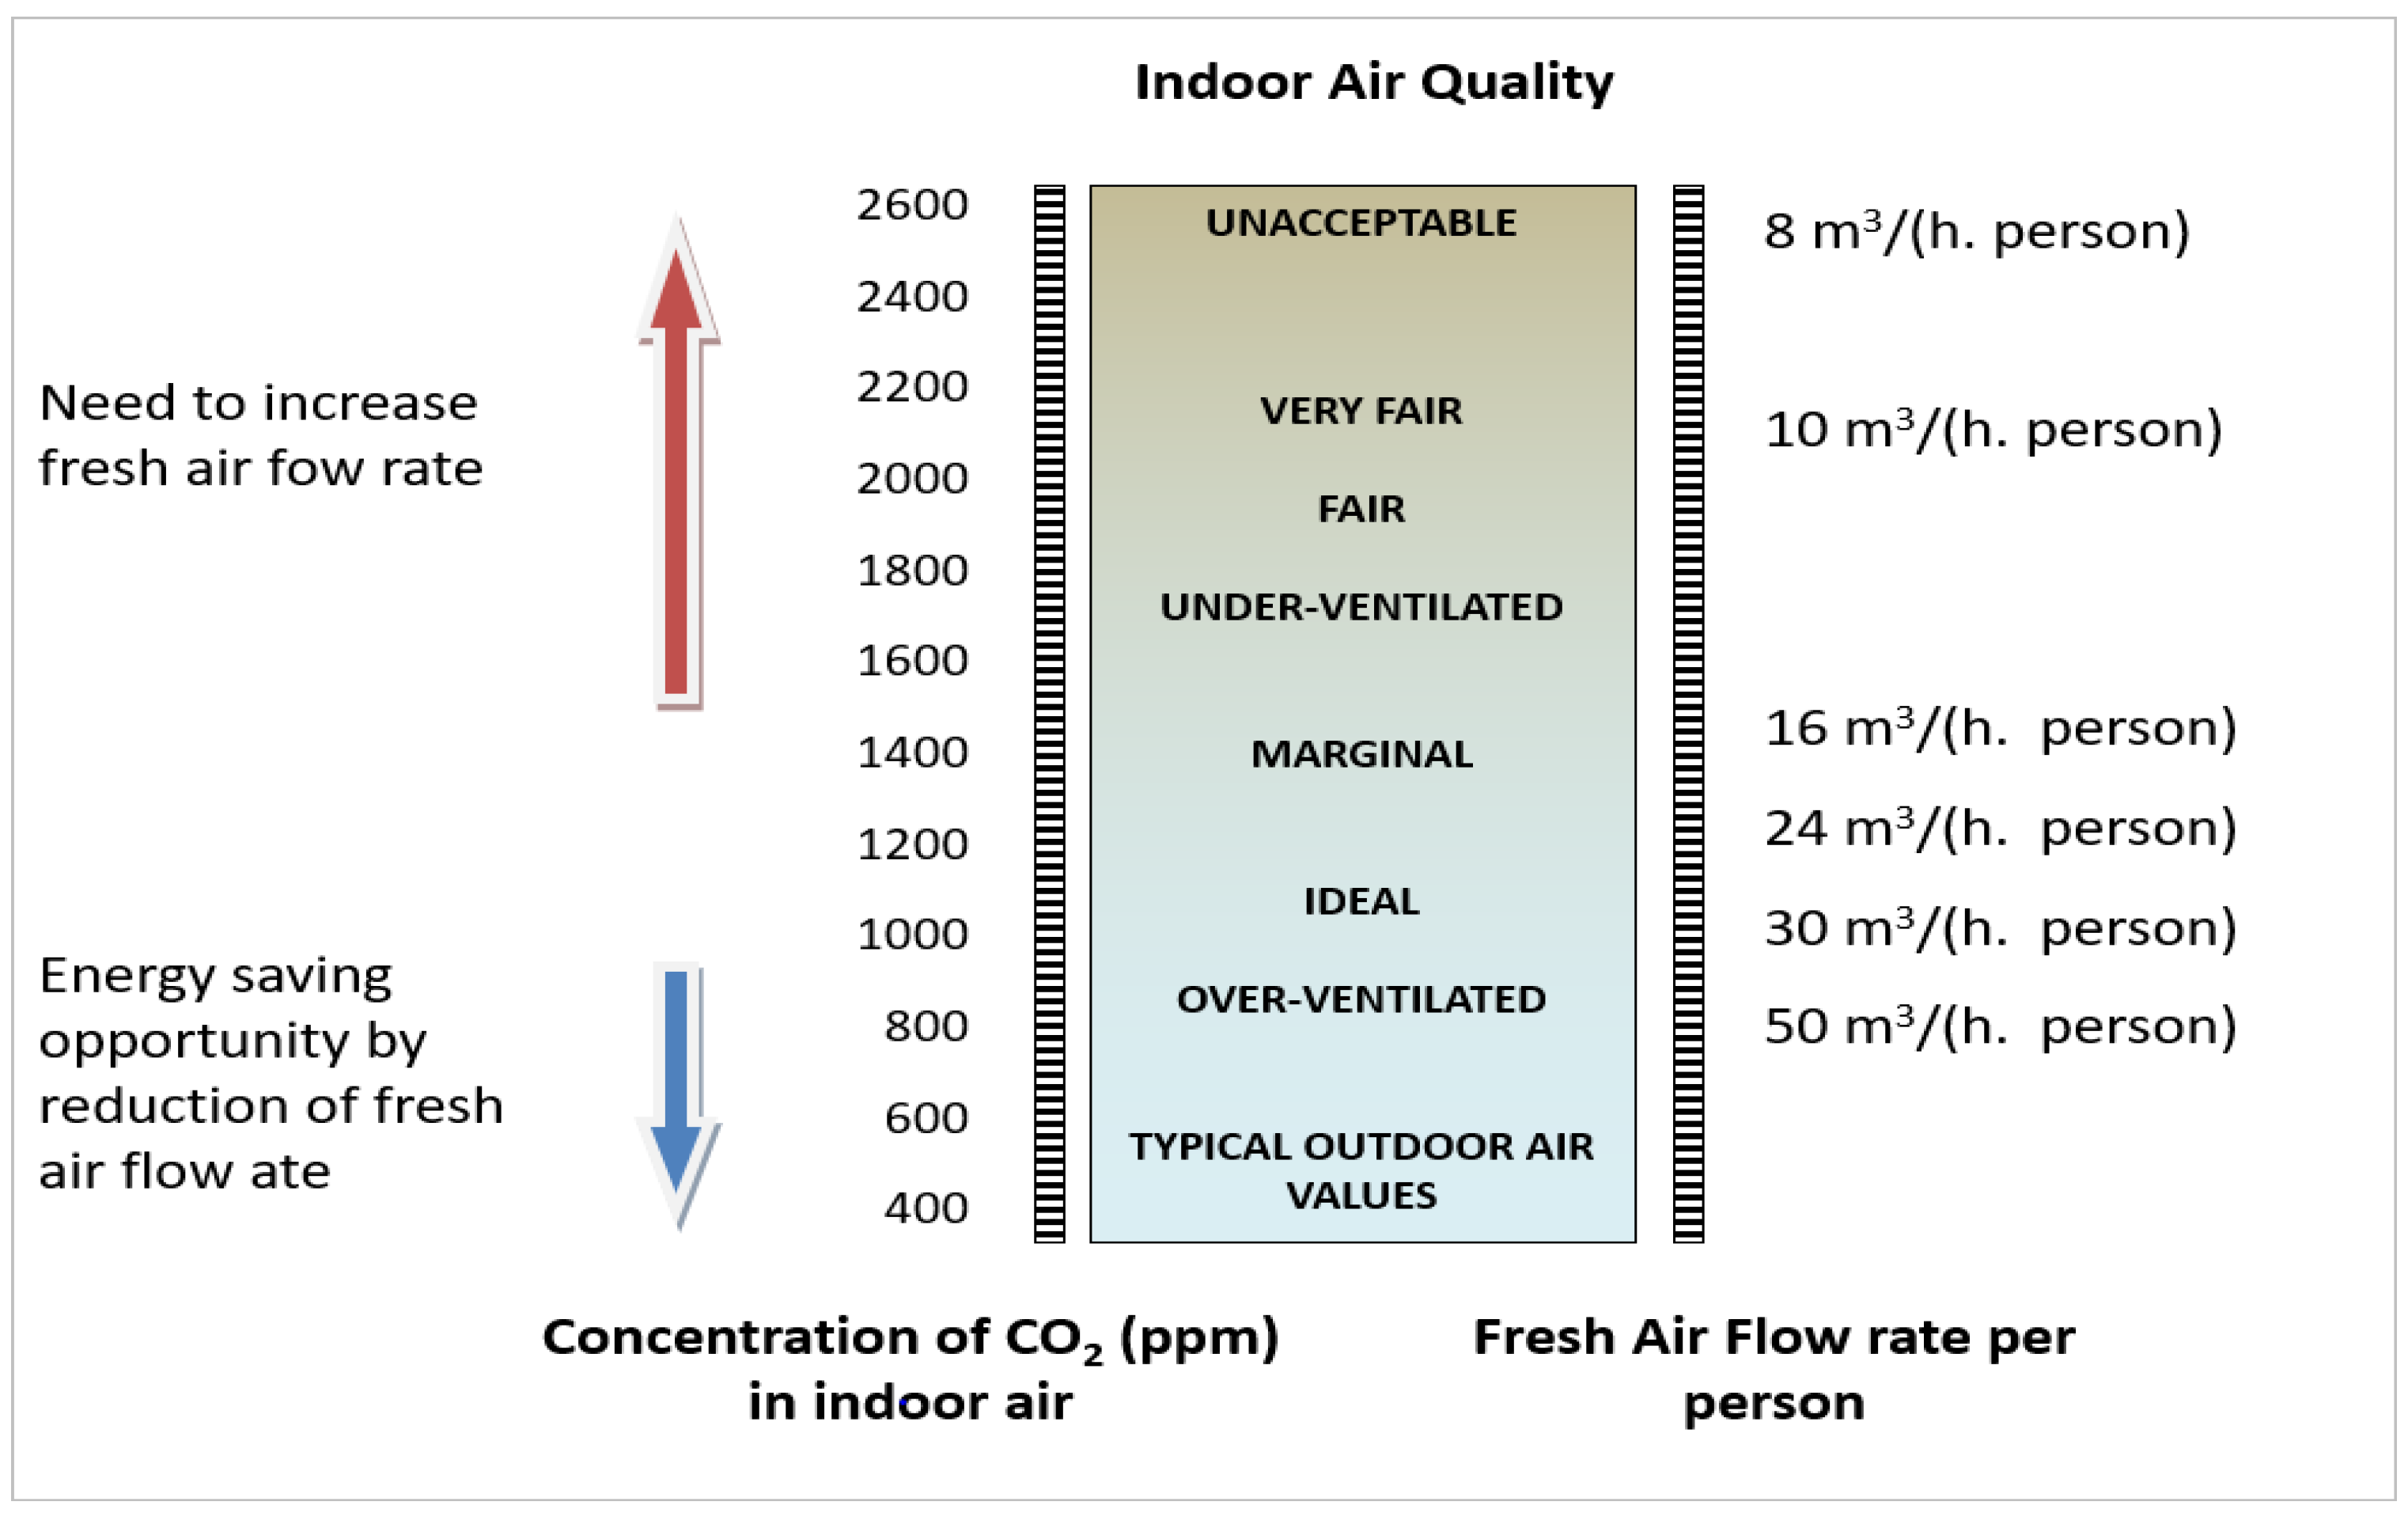
Figure 7 presents the IAQ-recommended conditions. A fresh air flow rate of 24 m3/h is considered optimal for indoor spaces like offices, schools, and libraries. The upper limit of 30 m3/h (ideal) and lower limit of 16 m3/h (marginal) correspond to achieving 1000 ppm and 1400 ppm of CO2, respectively. Therefore, considering the calculated estimated fresh air flow rate and air exchange rates of the studied vehicle cabins (Table S1), graphical representations of the results are shown to analyze and discuss these results.
Figure S3 Fresh air flow rate and air exchange rate for all investigated bus trips (see Supplementary Materials).
In Figure S3 of the Supplementary Materials, the ventilation parameters for each of the studied bus trips are shown. Only two bus trips were within the ideal limits considering the fresh air flow rate per person, Qbuses. Meanwhile, the results show that the air exchange rate (λbuses) distribution suggests that the air exchange rate per person was inadequate in 13 of the 15 bus passenger cabins. The Qbuses on trips 14 and 15 suggest that the cabins were overventilated. Even though the λbuses values revolved around the recommended 24 h−1, the cabin ventilation was still inadequate, hence the conclusion that gaps exist in the ventilation of the studied bus cabins.
Figure S4 Fresh air flow rate and air exchange rate for all investigated train trips (see Supplementary Materials).
In Figure S4 of the Supplementary Materials, the ventilation parameters for each of the 21 train trips are shown. The fresh air flow rate per person (Qtrains) for the train trips was inadequate for 17 passenger cars. The air exchange rate (λtrains) indicates the mean air age of the investigated passenger cars. For instance, in train trip 4, the λtrains of 25 h−1 imply a mean air age of 2.4 mins in the passenger compartment, while for train trip 5, it had a λtrains of 6 h−1, implying the mean air age was 10 mins. The smaller the mean air age, the lower the fresh air flow rate (Q), and vice versa. The current study findings are akin to those of Ogundiran et al. (2023) [29] on the IEQ of train cabins, in which ventilation parameters were inadequate in 9 of the 15 LTCs studied, besides other IEQ gaps. In comparison to buildings, given the high occupancy density in transport cabins, there is a need to improve the ventilation in the cabins through an increase in the fresh air flow rate per person and ACH. The ventilation parameters show that only two of the studied buses and three trains were within the recommended fresh air flow rate for ideal concentration levels of CO2 (1000 to 1400 ppm) to be achieved in the passenger cabins. Emphasizing the implications of poorly ventilated and saturated vehicle cabins, it is essential to consider the impact of aerosol-cloud dispersion and the time of residence of infectious aerosols in the vehicle cabin. Edwards et al. (2021) [79] analyzed aerosol particle cloud dispersion and the mean residence time of aerosol particles in buses and found that the use of masks and maintaining airflow in the cabin result in reduced aerosol particle counts and their associated risks. The study conclusions suggest that suitable ventilation supports a reduced risk regarding the spread and exposure to infectious aerosols since no single mitigation may give an optimal solution for the desired outcomes of ventilation. The present study agrees that increasing ventilation in closed public transport will mitigate the risk of infectious disease spread. Luo et al. (2023) [80] referenced China’s minimum fresh air flow rate per person of 30 m3/h for indoor ventilation, a difference from the current study’s ideal limit to achieve adequate ventilation and CO2 (Figure 9). Adequate vehicle maintenance and vehicle cabin management, considering HVAC settings and control, and ideal occupant density, including increased driver awareness of the implications of IEQ conditions, are a few relevant and recommendable interventions towards achieving improved comfort, safety, and the overall well-being of commuters. The other parameters measured were illuminance and atmospheric pressure, but for the present study scope, less attention has been given to the lighting and atmospheric pressure parameters. However, other dynamic influences impacted variations in the measured illuminance using the IEQ multiprobe in real-time travel due to vibrations, window and curtain settings, shadowing or other passenger activities, and vehicle passage through tunnels, besides other factors. In future IEQ evaluations, a more focused and adapted investigative campaign for real-time travel in the LTC is recommended to adequately evaluate the indoor cabin visual and acoustic environment.

4. Conclusions

IEQ is essential to the safety of lives, health, and general performance, leading to well-being and productivity. The impact of IEQ cuts across indoor spaces in buildings and mobile indoor environments. This paper analyzed 36 bus and train trips to verify if the parameters of operative temperature, relative humidity, CO2 concentration, and VOCs followed the IEQ recommendations of the CEN standard EN 16798-1. The IC investigation was solely based on objective measurements of IEQ parameters during real-time travel. Notably, only a few studies have evaluated the IC conditions of transport microenvironments according to the EN 16798-1 requirements. The study results were analyzed and communicated following the requirements of EN 16798-1. Also, the findings show that achieving good IAQ in the transport indoor microenvironment should be measured not only by the mean CO2 levels but also by the ventilation criteria of mass transit vehicles, which is critical to achieving suitable indoor climate conditions, including other effects such as the occupancy density in these passenger cabins. For thermal comfort, although 67% of cabins were found in the permissible comfort categories I, II, and III of EN 16798-1, the overall PMV–PPD index showed that the thermal environment was inadequate in 39% (14 cabins) and 56% (20 cabins) of passenger cabins considering the mean indoor air velocity of 0.1 m/s and 0.3 m/s, respectively. Regarding IAQ, the in-cabin CO2 levels of 29 cabins (9 buses and 20 trains) were within the safe and comfortable categories I, II, and III of EN 16798-1. Meanwhile, the ventilation parameters strongly show that IAQ gaps exist in 83% of the studied cabins. The fresh airflow and air exchange rate parameters revealed that IAQ was defective in most cabins, suggesting that categorizations of the mean CO2 and operative temperature levels according to EN 16798-1 were not sufficient to conclude that IC was adequate for the studied passenger cabins. Furthermore, these findings suggest that there is a risk to well-being and comfort in most of the studied cabins. Thus, it is recommended that adequate measures be taken to improve the fresh airflow rate and exchange rate in mass transport vehicles to mitigate the potential risks of a defective IC. Also, since mass transit vehicles are prone to high occupancy density, ensuring adequate ventilation settings is critical to mitigating the risk of infectious aerosol spread, well-being, and comfort linked to poor IC. Finally, the present study’s findings contribute scientific evidence underscoring the need to pay attention to mobile indoor spaces since more attention is given to buildings. Also to sensitize transport stakeholders and policymakers to the need for improvement in the IEQ conditions of mass transit vehicles across the mobility value chain, including vehicle design (perhaps in energy use and the HVAC systems), use-phase (like vehicle occupancy density), vehicle/train maintenance, and fleet management. It is recommended that future studies in the context of real-time passenger travel employ mixed methods, including subjective assessment evaluations, for a more robust understanding of the IC conditions, especially thermal comfort. The overall goal is to mitigate the inherent risk of IEQ gaps impacting commuter well-being, health, and safety.
Study Limitation: The present study’s assessment was limited to only objective measurements of the general real-time typical passenger experience. Future works should employ mixed methods, including subjective assessments in IEQ assessments of mass transit microenvironments. The study by Wierzbicka et al. [81] asserts that occupants, besides other parameters, impact IEQ both in causative and receptive contexts, hence their evaluation of the bio-psycho-social aspects of health, including occupants’ interactions, the building, and the indoor space. Their study reinforces the need for employing a subjective approach in the IEQ investigations. Moreover, some LTCs have designated cabin spaces for drivers and passengers; therefore, IEQ assessment methods in LTCs should account for these conditions regarding drivers. Additionally, in trains, several parameters, including cabin type/class, interior furnishings, train speed, lighting features, the rail type, its passage, and location (surface, elevated, or underground), are important factors to consider that affect occupants’ comfort and the IEQ condition. Although in the current study lighting levels were measured, they were excluded from the study evaluation. Meanwhile, future assessments should include other parameters that impact occupants’ comfort and well-being in LTCs, such as noise, vibration, and harshness (NVH). Although ventilation performance was evaluated for the LTCs, PM assessment and infiltration were not in the study scope. Finally, a holistic approach should include a risk correlation to factors like occupancy density, HVAC settings, static seats, aural pressure, and visual comfort (especially in train cabins), which are necessary to determine when estimating IEQ risk to well-being and comfort, occupants’ performance, and productivity linked to occupational exposure of the drivers and onboard transport workers.

Supplementary Materials

The following supporting information can be downloaded at: https://www.mdpi.com/article/10.3390/atmos15050589/s1, Figure S1: A computer screenshot showing a typical IEQ data logger display interface; Figure S2: Relative humidity time series for bus and train trips combined.; Figure S3: Fresh air flow rate and Air exchange rate for all investigated bus trips. title; Figure S4: Fresh air flow rate and Air exchange rate for all investigated train trips; Table S1: Ventilation parameters in all trips.

Author Contributions

Conceptualization, J.O.O.; methodology, J.O.O. and M.G.d.S.; software, M.G.d.S.; validation, J.O.O. and M.G.d.S.; formal analysis, J.O.O., J.-P.K.B.N., A.S.N.R. and M.G.d.S.; investigation, J.O.O.; resources, J.O.O. and M.G.d.S.; data curation, J.O.O. and M.G.d.S.; writing—original draft preparation, J.O.O.; writing—review and editing, J.O.O., J.-P.K.B.N., A.S.N.R. and M.G.d.S.; visualization, J.O.O.; supervision, A.S.N.R. and M.G.d.S.; project administration, A.S.N.R. and M.G.d.S.; funding acquisition, A.S.N.R. and M.G.d.S. All authors have read and agreed to the published version of the manuscript.

Funding

J.O.O has a grant Ref: UI/BD/152067/2021, sponsored by the Fundação para a Ciência e a Tecnologia (FCT)—IUDB/50022/2020 and IUDP/50022/2020 within the Associate Laboratory of Energy, Transports and Aerospace (LAETA) project; LA/P/0079/2020, DOI: 10.54499/LA/P/0079/2020 (https://doi.org/10.54499/LA/P/0079/2020, accessed on 10 May 2024).

Institutional Review Board Statement

Not applicable.

Informed Consent Statement

Not applicable.

Data Availability Statement

All data generated and analyzed during this study can be found within the published article and its Supplementary Files. They are also available from the corresponding author upon reasonable request.

Acknowledgments

The present work was developed in the framework of the Energy for Sustainability Initiative of the University of Coimbra and was supported by LAETA Projects.

Conflicts of Interest

The authors declared no conflicts of interest.

References

  1. Al Horr, Y.; Arif, M.; Katafygiotou, M.; Mazroei, A.; Kaushik, A.; Elsarrag, E. Impact of indoor environmental quality on occupant well-being and comfort: A review of the literature. Int. J. Sustain. Built Environ. 2016, 5, 1–11. [Google Scholar] [CrossRef]
  2. EN 16798-1:2019; Energy Performance of Buildings—Part 1: Indoor Environmental Input Parameters for Design and Assessment of Energy Performance of Buildings Addressing Indoor Air Quality, Thermal Environment, Lighting, and Acoustics—Module M1-6. British Standards Institution: London, UK, 2019. Available online: https://www.en-standard.eu/bs-en-16798-1-2019-energy-performance-of-buildings-ventilation-for-buildings-indoor-environmental-input-parameters-for-design-and-assessment-of-energy-performance-of-buildings-addressing-indoor-air-quality-thermal-environment-l (accessed on 20 October 2022).
  3. Steer, D.G. Comprehensive Study on Passenger Transport by Coach in Europe DG MOVE, European Commission Final Report; London, UK. 2016; Available online: https://transport.ec.europa.eu/document/download/d2c3465b-ba10-4edd-8d8d-fc4b2bc185fa_en?filename=2016-04-passenger-transport-by-coach-in-europe.pdf (accessed on 4 May 2022).
  4. ACEA. Fact Sheet-Buses. Available online: https://www.acea.auto/files/buses_fact_sheet_ACEA.pdf (accessed on 4 May 2023).
  5. [Dataset] Eurostat. Railway Passenger Transport Statistics-Quarterly and Annual Data. 2019. Available online: https://ec.europa.eu/eurostat/statisticsexplained/ (accessed on 4 May 2022).
  6. Pimenta, A.M.; Assunção, A. Thermal discomfort and hypertension in bus drivers and chargers in the metropolitan region of Belo Horizonte, Brazil. Appl. Ergon. 2015, 47, 236–241. [Google Scholar] [CrossRef] [PubMed]
  7. Velt, K.; Daanen, H. Optimal bus temperature for thermal comfort during a cool day. Appl. Ergon. 2017, 62, 72–76. [Google Scholar] [CrossRef] [PubMed]
  8. Zhang, B.; Xue, T.; Hu, N. Analysis and improvement of the comfort performance of a car’s indoor environment based on the predicted mean vote–predicted percentage of dissatisfied and air age. Adv. Mech. Eng. 2017, 9, 1687814017695693. [Google Scholar] [CrossRef]
  9. Hodder, S.G.; Parsons, K. The effects of solar radiation on thermal comfort. Int. J. Biometeorol. 2006, 51, 233–250. [Google Scholar] [CrossRef] [PubMed]
  10. Yang, L.; Li, X.; Tu, J. Thermal comfort analysis of a high-speed train cabin considering the solar radiation effects. Indoor Built Environ. 2019, 29, 1101–1117. [Google Scholar] [CrossRef]
  11. Maier, J.; Zierke, O.; Hoermann, H.-J.; Goerke, P. Effects of personal control for thermal comfort in long-distance trains. Energy Build. 2021, 247, 111125. [Google Scholar] [CrossRef]
  12. Su, C.-Q.; Liang, X.-X.; Wang, Y.-P.; Yang, Y.-F.; Su, J.-J.; Liu, X. Analysis of Human Thermal Comfort in Bus Based on Thermoelectric Cooling Climate-Controlled Seats. Int. J. Energy Res. 2023, 2023, 6918866. [Google Scholar] [CrossRef]
  13. Skorge, T.D.; Eagan, T.M.L.; E Eide, G.; Gulsvik, A.; Bakke, P.S. Indoor exposures and respiratory symptoms in a Norwegian community sample. Thorax 2005, 60, 937–942. [Google Scholar] [CrossRef]
  14. You, B.; Zhou, W.; Li, J.; Li, Z.; Sun, Y. A review of indoor Gaseous organic compounds and human chemical Exposure: Insights from Real-time measurements. Environ. Int. 2022, 170, 107611. [Google Scholar] [CrossRef]
  15. Mei, S.; Chen, B.; Zhu, Y.; Lees, M.; Boukhanovsky, A.; Sloot, P. Simulating city-level airborne infectious diseases. Comput. Environ. Urban Syst. 2015, 51, 97–105. [Google Scholar] [CrossRef]
  16. Nasir, Z.A.; Campos, L.C.; Christie, N.; Colbeck, I. Airborne biological hazards and urban transport infrastructure: Current challenges and future directions. Environ. Sci. Pollut. Res. 2016, 23, 15757–15766. [Google Scholar] [CrossRef] [PubMed]
  17. Wei, G.; Yang, X. Effect of temperature on VOC emissions and odor from vehicle carpet. J. Affect. Disord. 2023, 246, 110993. [Google Scholar] [CrossRef]
  18. Xu, B.; Hao, J. Air quality inside subway metro indoor environment worldwide: A review. Environ. Int. 2017, 107, 33–46. [Google Scholar] [CrossRef] [PubMed]
  19. Wang, H.; Xiong, J.; Wei, W. Measurement methods and impact factors for the key parameters of VOC/SVOC emissions from materials in indoor and vehicular environments: A review. Environ. Int. 2022, 168, 107451. [Google Scholar] [CrossRef] [PubMed]
  20. Hossam, M.; Fouad, M.; Abou-Zaid, A. Egypt Numerical Investigation of Airflow Patterns and Thermal Comfort in a Bus Cabin. SAE Int. J. Passeng. Cars Mech. Syst. 2020, 13, 145–156. [Google Scholar] [CrossRef]
  21. AIsmail, R.; Abdullah, S.N.A.; Abdullah, A.A.; Hamid, M.R.A.; Deros, B.M. Relationship between thermal comfort and driving performance among Malaysian bus driver. ARPN J. Eng. Appl. Sci. 2015, 10, 7406–7411. [Google Scholar]
  22. Makowiec-Dąbrowska, T.; Gadzicka, E.; Siedlecka, J.; Szyjkowska, A.; Viebig, P.; Kozak, P.; Bortkiewicz, A. Climate conditions and work-related fatigue among professional drivers. Int. J. Biometeorol. 2018, 63, 121–128. [Google Scholar] [CrossRef]
  23. Shek, K.W.; Chan, W.T. Combined comfort model of thermal comfort and air quality on buses in Hong Kong. Sci. Total Environ. 2008, 389, 277–282. [Google Scholar] [CrossRef]
  24. Almeida, M.d.N.; Xavier, A.A.d.P.; Michaloski, A.O. A Review of Thermal Comfort Applied in Bus Cabin Environments. Appl. Sci. 2020, 10, 8648. [Google Scholar] [CrossRef]
  25. Lin, T.-P.; Hwang, R.-L.; Huang, K.-T.; Sun, C.-Y.; Huang, Y.-C. Passenger thermal perceptions, thermal comfort requirements, and adaptations in short- and long-haul vehicles. Int. J. Biometeorol. 2009, 54, 221–230. [Google Scholar] [CrossRef] [PubMed]
  26. Almeida, M.D.N.; de Paula Xavier, A.A.; Michaloski, A.O.; Soares, A.L. Thermal Comfort in Bus Cabins: A Review of Parameters and Numerical Investigation. In Occupational and Environmental Safety and Health II. Studies in Systems, Decision and Control; Arezes, P.M., Baptista, J.S., Barroso, M.P., Carneiro, P., Cordeiro, P., Costa, N., Melo, R.B., Miguel, A.S., Perestrelo, G., Eds.; Springer: Cham, Zwitserland, 2020; Volume 277, pp. 499–506. [Google Scholar] [CrossRef]
  27. Xu, J.; Xiang, Z.R.; Zhi, J.Y.; Xu, X.F.; He, S.J.; Wang, J.; Du, Y.; Xu, G. Research on Virtual Simulation Evaluation System for Passenger Compartments Lighting of Subway Trains in China. In Advances in Human Factors in Wearable Technologies and Game Design; Ahram, T., Ed.; Springer International Publishing: Cham, Zwitserland, 2020; pp. 343–353. [Google Scholar]
  28. Selvaraj, K.; Padavala, P.; Rajamohan, K.; Medisetti, J.R. Experimental Investigation of Low-Frequency Noise and Vibration in a Bus. Automotive Technical Papers. Available online: https://www.sae.org/publications/technical-papers/content/2020-01-5082/ (accessed on 25 June 2023).
  29. Ogundiran, J.O.; Nyembwe, J.-P.K.B.; Ribeiro, A.S.N.; da Silva, M.G. Indoor Environmental Quality Assessment of Train Cabins and Passenger Waiting Areas: A Case Study of Nigeria. Sustainability 2023, 15, 16533. [Google Scholar] [CrossRef]
  30. Peng, Y.; Zhou, J.; Fan, C.; Wu, Z.; Zhou, W.; Sun, D.; Lin, Y.; Xu, D.; Xu, Q. A review of passenger ride comfort in railway: Assessment and improvement method. Transp. Saf. Environ. 2022, 4, tdac016. [Google Scholar] [CrossRef]
  31. Mohammadi, A.; Amador-Jimenez, L.; Nasiri, F. A multi-criteria assessment of the passengers’ level of comfort in urban railway rolling stock. Sustain. Cities Soc. 2020, 53, 101892. [Google Scholar] [CrossRef]
  32. ISO 7730:2005; Ergonomics of the Thermal Environment. ISO: Geneva, Switzerland, 2005. Available online: https://www.iso.org/standard/39155.html (accessed on 20 October 2022).
  33. Chen, R.-Y.; Ho, K.-F.; Chang, T.-Y.; Hong, G.-B.; Liu, C.-W.; Chuang, K.-J. In-vehicle carbon dioxide and adverse effects: An air filtration-based intervention study. Sci. Total Environ. 2020, 723, 138047. [Google Scholar] [CrossRef] [PubMed]
  34. Zhang, X.; Wargocki, P.; Lian, Z.; Thyregod, C. Effects of exposure to carbon dioxide and bioeffluents on perceived air quality, self-assessed acute health symptoms, and cognitive performance. Indoor Air 2016, 27, 47–64. [Google Scholar] [CrossRef] [PubMed]
  35. Jackie. Review of In-Cabin Carbon Dioxide Levels. Sep. 2017. Available online: https://www.chiefscientist.nsw.gov.au/__data/assets/pdf_file/0007/124936/Review-of-In-Cabin-CO2-Exposure-and-Risk-Issues-8-September-2017.pdf (accessed on 21 November 2022).
  36. López, L.; Dessì, P.; Cabrera-Codony, A.; Rocha-Melogno, L.; Kraakman, B.; Naddeo, V.; Balaguer, M.D.; Puig, S. CO2 in indoor environments: From environmental and health risk to potential renewable carbon source. Sci. Total Environ. 2023, 856, 159088. [Google Scholar] [CrossRef] [PubMed]
  37. Lawin, H.; Fanou, L.A.; Hinson, A.V.; Stolbrink, M.; Houngbegnon, P.; Kedote, N.M.; Fayomi, B.; Kagima, J.; Katoto, P.; Ouendo, E.M.D.; et al. Health Risks Associated with Occupational Exposure to Ambient Air Pollution in Commercial Drivers: A Systematic Review. Int. J. Environ. Res. Public Health 2018, 15, 2039. [Google Scholar] [CrossRef] [PubMed]
  38. Nazaroff, W.W.; Weschler, C.J. Indoor acids and bases. Indoor Air 2020, 30, 559–644. [Google Scholar] [CrossRef]
  39. Correia, G.; Rodrigues, L.; Afonso, M.; Mota, M.; Oliveira, J.; Soares, R.; Tomás, A.L.; Reichel, A.; Silva, P.M.; Costa, J.J.; et al. SARS-CoV-2 air and surface contamination in residential settings. Sci. Rep. 2022, 12, 1–12. [Google Scholar] [CrossRef]
  40. Moreno, T.; Pintó, R.M.; Bosch, A.; Moreno, N.; Alastuey, A.; Minguillón, M.C.; Anfruns-Estrada, E.; Guix, S.; Fuentes, C.; Buonanno, G.; et al. Tracing surface and airborne SARS-CoV-2 RNA inside public buses and subway trains. Environ. Int. 2020, 147, 106326. [Google Scholar] [CrossRef] [PubMed]
  41. Knibbs, L.D.; Morawska, L.; Bell, S.C. The risk of airborne influenza transmission in passenger cars. Epidemiol. Infect. 2012, 140, 474–478. [Google Scholar] [CrossRef] [PubMed]
  42. Zhu, S.; Lin, T.; Laurent, J.G.C.; Spengler, J.D.; Srebric, J. Tradeoffs between ventilation, air mixing, and passenger density for the airborne transmission risk in airport transportation vehicles. J. Affect. Disord. 2022, 219, 109186. [Google Scholar] [CrossRef] [PubMed]
  43. Passi, A.; Nagendra, S.S.; Maiya, M. Characteristics of indoor air quality in underground metro stations: A critical review. J. Affect. Disord. 2021, 198, 107907. [Google Scholar] [CrossRef]
  44. Matthaios, V.N.; Harrison, R.M.; Koutrakis, P.; Bloss, W.J. In-vehicle exposure to NO2 and PM2.5: A comprehensive assessment of controlling parameters and reduction strategies to minimise personal exposure. Sci. Total Environ. 2023, 900, 165537. [Google Scholar] [CrossRef] [PubMed]
  45. Pantelic, J.; Tham, K.W. Assessment of the mixing air delivery system ability to protect occupants from the airborne infectious disease transmission using Wells–Riley approach. HVAC&R Res. 2012, 18, 562–574. [Google Scholar] [CrossRef]
  46. Haq, M.; Cadnum, J.; Carlisle, M.; Hecker, M.; Donskey, C. SARS in Cars: Carbon Dioxide Levels Provide a Simple Means to Assess Ventilation in Motor Vehicles. Pathog. Immun. 2022, 7, 19–30. [Google Scholar] [CrossRef] [PubMed]
  47. Zhu, S.; Demokritou, P.; Spengler, J. Experimental and numerical investigation of micro-environmental conditions in public transportation buses. J. Affect. Disord. 2010, 45, 2077–2088. [Google Scholar] [CrossRef]
  48. Allen, J.G.; MacNaughton, P.; Satish, U.; Santanam, S.; Vallarino, J.; Spengler, J.D. Associations of Cognitive Function Scores with Carbon Dioxide, Ventilation, and Volatile Organic Compound Exposures in Office Workers: A Controlled Exposure Study of Green and Conventional Office Environments. Environ. Health Perspect. 2016, 124, 805–812. [Google Scholar] [CrossRef]
  49. Hudda, N.; Fruin, S. Carbon dioxide accumulation inside vehicles: The effect of ventilation and driving conditions. Sci. Total Environ. 2018, 610–611, 1448–1456. [Google Scholar] [CrossRef]
  50. EN 15251; Indoor Environmental Input Parameters for Design and Assessment of Energy Performance of Buildings-Addressing Indoor Air Quality, Thermal Environment, Lighting, and Acoustics. CEN: Brussels, Belgium, 2007. Available online: https://standards.globalspec.com/std/1110417/en-15251 (accessed on 18 November 2022).
  51. da Silva, M.G.; van Cappellen, L.W.; Sanjuanello, E. Assessing and Communicating Indoor Environmental Quality. REHVA 2019, 56, 14–18. [Google Scholar]
  52. da Silva, M.G.; Broday, E.E.; Ruivo, C.R. Indoor climate quality assessment in civil aircraft cabins: A field study. Therm. Sci. Eng. Prog. 2023, 37, 101581. [Google Scholar] [CrossRef]
  53. Madsen, T.L. Thermal Comfort Measurements. 1977. Available online: https://scholar.google.com/scholar?q==T.%20L.%20Madsen%2C%20%E2%80%9CThermal%20comfort%20measurements%2C%E2%80%9D%201977 (accessed on 2 May 2024).
  54. Madsen, T.L. Measurement of Thermal Comfort and Discomfort. 1978. Available online: https://scholar.google.com/scholar?q==T.%20L.%20Madsen%2C%20%E2%80%9CMeasurement%20of%20thermal%20comfort%20and%20discomfort%2C%E2%80%9D%201978 (accessed on 2 May 2024).
  55. Tomorad, J.; Horvat, I.; Dović, D. Study of Operative Temperature Using the Novel Detail Approach in Determining Mean Radiant Temperature–Comparison Between Wall-Mounted Convector and Conventional Radiator. Trans. Famena 2018, 42, 27–38. [Google Scholar] [CrossRef]
  56. Simone, A.; Olesen, B.W.; Babiak, J.; Bullo, M.; Langkilde, G. Operative Temperature for Control of Radiant Surface Heating and Cooling Systems. In 62 Congresso Nazionale ATI; 2007; Volume 1, pp. 233–237. Available online: https://findit.dtu.dk/en/catalog/537f0d827401dbcc1200e635 (accessed on 3 May 2024).
  57. Broday, E.E.; Ruivo, C.R.; da Silva, M.G. The use of Monte Carlo method to assess the uncertainty of thermal comfort indices PMV and PPD: Benefits of using a measuring set with an operative temperature probe. J. Build. Eng. 2020, 35, 101961. [Google Scholar] [CrossRef]
  58. Haghighat, F.; Allard, F.; Megri, A.C.; Blondeau, P.; Shimotakahara, R. Measurement of Thermal Comfort and Indoor Air Quality Aboard 43 Flights on Commercial Airlines. Indoor Built Environ. 1999, 8, 58–66. [Google Scholar] [CrossRef]
  59. da Silva, M.G. Spreadsheets for the Calculation of Thermal Comfort Indices PMV and PPD. 2013. Available online: https://www.researchgate.net/publication/255971260_SPREADSHEETS_FOR_THE_CALCULATION_OF_THERMAL_COMFORT_INDICES_PMV_AND_PPD (accessed on 25 October 2023).
  60. Bosch Sensortec BME 680 Datasheet. Low Power Gas, Pressure, Temperature & Humidity Sensor. 2017. Available online: https://www.bosch-sensortec.com/products/environmental-sensors/gas-sensors/bme680/#documents (accessed on 13 August 2022).
  61. da Silva, M.G. Operation of Energy Efficient Buildings. Managing Ventilation and Infiltration Rates in NZEBs. In 2015 Winter Conference, Chicago: REHVA, Jan. 2015. Available online: https://www.rehva.eu/fileadmin/events/eventspdf/AHR_EXPO/2015/AHR_EXPO_2015/MGS_Ashrae_WM2015.pdf (accessed on 26 September 2022).
  62. UITP. The Secondhand City Bus Market in Europe; 2021. Available online: https://www.uitp.org/publications/a-study-on-the-secondhand-city-bus-market-in-europe/ (accessed on 25 November 2022).
  63. Fanger, P.O. Thermal Comfort: Analysis and Applications in Environmental Engineering; Danish Technical Press: Kopenhagen, Denemarken, 1970. [Google Scholar]
  64. Lin, C.H.; Dunn, K.H.; Horstman, R.H.; Topmiller, J.L.; Ahlers, M.F.; Bennett, J.S.; Sedgwick, L.M.; Wirogo, S. Numerical Simulation of Airflow and Airborne Pathogen Transport in Aircraft Cabins-Part I: Numerical Simulation of the Flow Field. In ASHRAE 2005 Winter Meeting, Technical and Symposium Papers, Orlando. February 2005. Available online: https://www.aivc.org/resource/numerical-simulation-airflow-and-airborne-pathogen-transport-aircraft-cabins-part-1 (accessed on 6 May 2024).
  65. Orman, J.; Siwczuk, N.; Radek, N.; Honus, S.; Piotrowski, J.Z.; Dębska, L. Comparative Analysis of Subjective Indoor Environment Assessment in Actual and Simulated Conditions. Energies 2024, 17, 656. [Google Scholar] [CrossRef]
  66. Dimitroulopoulou, S.; Dudzinska, M.R.; Gunnarsen, L.; Hagerhed, L.; Maula, H.; Singh, R.; Toyinbo, O.; Haverinen-Shaughnessy, U. Indoor air quality guidelines from across the world: An appraisal considering energy saving, health, productivity, and comfort. Environ. Int. 2023, 178, 108127. [Google Scholar] [CrossRef] [PubMed]
  67. Tong, Z.; Li, Y.; Westerdahl, D.; Adamkiewicz, G.; Spengler, J.D. Exploring the effects of ventilation practices in mitigating in-vehicle exposure to traffic-related air pollutants in China. Environ. Int. 2019, 127, 773–784. [Google Scholar] [CrossRef] [PubMed]
  68. Noti, J.D.; Blachere, F.M.; McMillen, C.M.; Lindsley, W.G.; Kashon, M.L.; Slaughter, D.R.; Beezhold, D.H. High Humidity Leads to Loss of Infectious Influenza Virus from Simulated Coughs. PLoS ONE 2013, 8, e57485. [Google Scholar] [CrossRef]
  69. Davidse, A.; Zare, R.N. Effect of Relative Humidity in Air on the Transmission of Respiratory Viruses. Mol. Front. J. 2021, 5, 5–16. [Google Scholar] [CrossRef]
  70. Božič, A.; Kanduč, M. Relative humidity in droplet and airborne transmission of disease. J. Biol. Phys. 2021, 47, 1–29. [Google Scholar] [CrossRef] [PubMed]
  71. Raines, K.; Doniach, S.; Bhanot, G. The transmission of SARS-CoV-2 is likely comodulated by temperature and by relative humidity. PLoS ONE 2020, 16, e0255212. [Google Scholar] [CrossRef]
  72. Sireesha, N.L. Correlation amongst Indoor Air Quality, Ventilation and Carbon Dioxide. J. Sci. Res. 2017, 9, 179–192. [Google Scholar] [CrossRef]
  73. Zhang, Y.; Guo, Z.; Zhuo, L.; An, N.; Han, Y. Ventilation Strategies for Highly Occupied Public Environments: A Review. Buildings 2023, 13, 1642. [Google Scholar] [CrossRef]
  74. Mathai, V.; Das, A.; Bailey, J.A.; Breuer, K. Airflows inside passenger cars and implications for airborne disease transmission. Sci. Adv. 2021, 7, eabe0166. [Google Scholar] [CrossRef]
  75. Shen, Y.; Li, C.; Dong, H.; Wang, Z.; Martinez, L.; Sun, Z.; Handel, A.; Chen, Z.; Chen, E.; Ebell, M.H.; et al. Community Outbreak Investigation of SARS-CoV-2 Transmission Among Bus Riders in Eastern China. JAMA Intern. Med. 2020, 180, 1665–1671. [Google Scholar] [CrossRef] [PubMed]
  76. Cao, X.; Zevitas, C.D.; Spengler, J.D.; Coull, B.; McNeely, E.; Jones, B.; Loo, S.M.; MacNaughton, P.; Allen, J.G. The on-board carbon dioxide concentrations and ventilation performance in passenger cabins of US domestic flights. Indoor Built Environ. 2018, 28, 761–771. [Google Scholar] [CrossRef]
  77. Ye, W.; Gao, J.; Zhang, X.; Yu, C.W. Studies of relationship between ventilation, pollution exposure and environmental health of buildings. Indoor Built Environ. 2017, 26, 147–151. [Google Scholar] [CrossRef]
  78. da Silva, M.G. Indoor Air Quality Lecture Notes; University of Coimbra: Coimbra, Portugal, 2022. [Google Scholar] [CrossRef]
  79. Edwards, N.J.; Widrick, R.; Wilmes, J.; Breisch, B.; Gerschefske, M.; Sullivan, J.; Potember, R.; Espinoza-Calvio, A. Reducing COVID-19 airborne transmission risks on public transportation buses: An empirical study on aerosol dispersion and control. Aerosol Sci. Technol. 2021, 55, 1378–1397. [Google Scholar] [CrossRef]
  80. Luo, Q.; Yang, X.; Hang, J.; Fan, X.; Luo, Z.; Gu, Z.; Ou, C. Influence of natural ventilation design on the dispersion of pathogen-laden droplets in a coach bus. Sci. Total Environ. 2023, 885, 163827. [Google Scholar] [CrossRef]
  81. Wierzbicka, A.; Pedersen, E.; Stroh, E.; Li, Y.; Dahlblom, M.; Lundgren-Kownacki, K.; Isaxon, C.; Gudmundsson, A.; Wargocki, P.; Persson, R.; et al. Healthy Indoor Environments: The Need for a Holistic Approach. Int. J. Environ. Res. Public Health 2018, 15, 1874. [Google Scholar] [CrossRef] [PubMed]
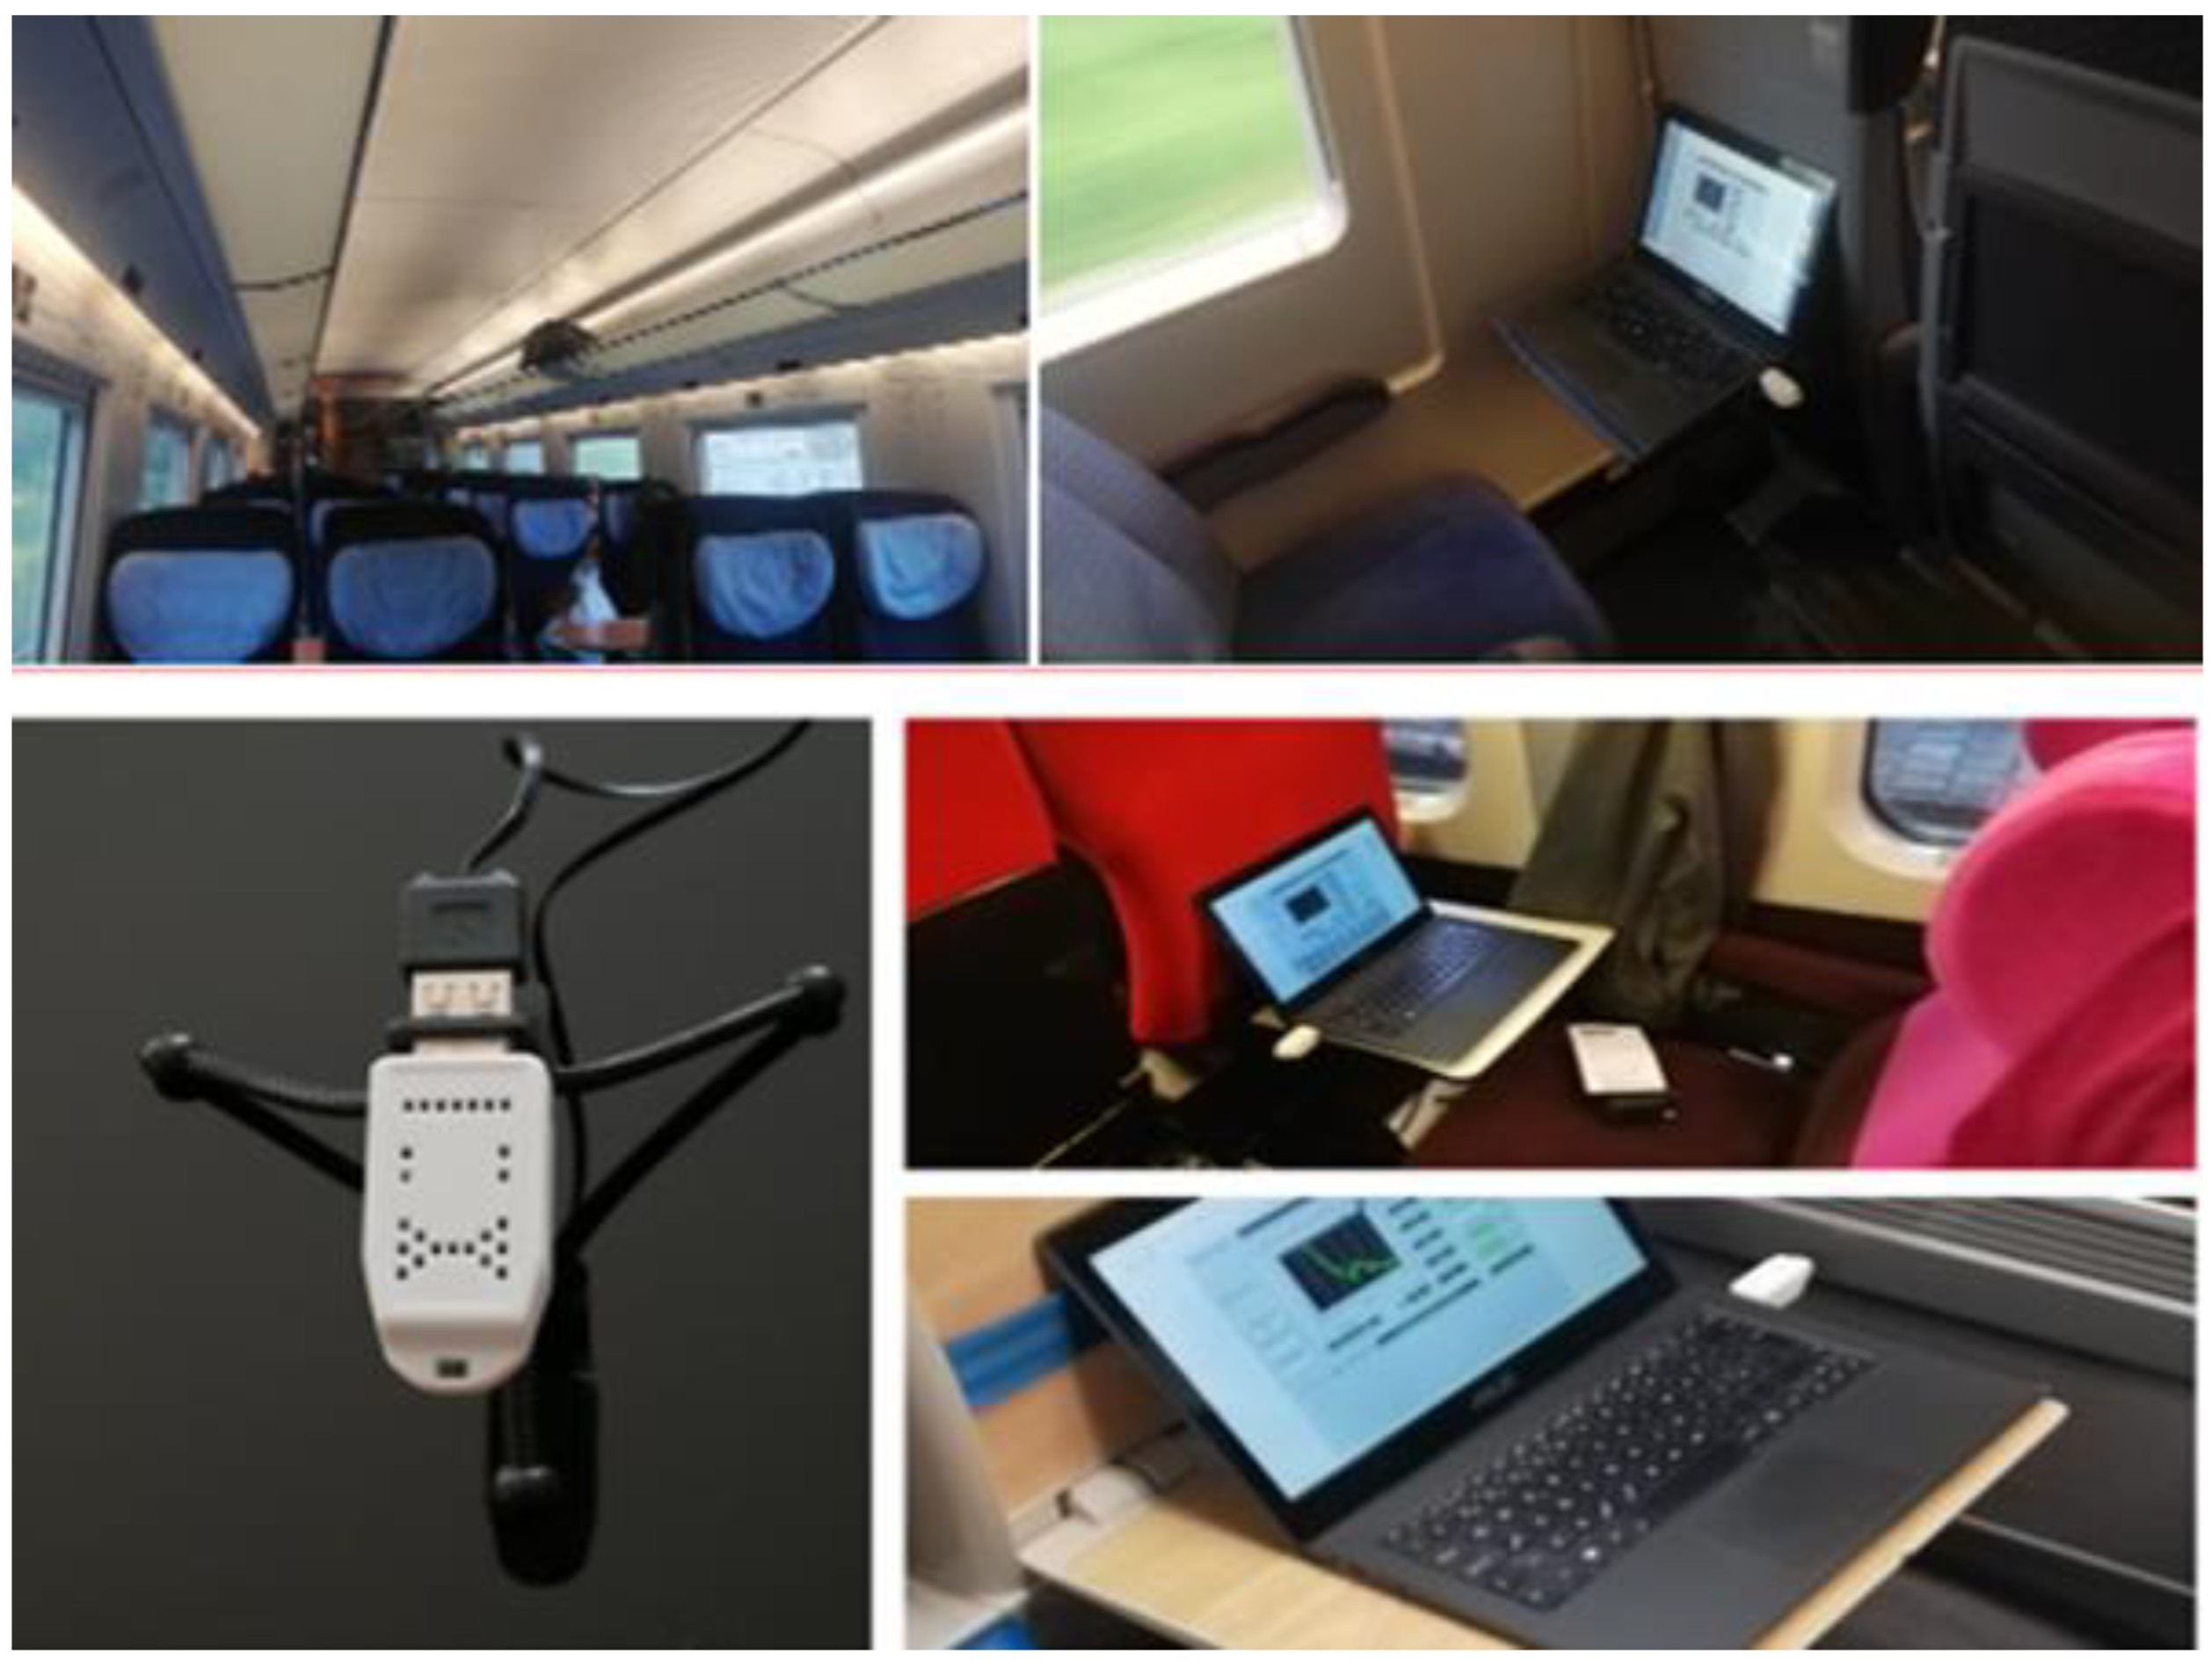
Figure 1. Use of an IEQ multiprobe device in bus and train cabins.
Atmosphere 15 00589 g001
Figure 3. Time evolution of indoor climate parameters during a selected bus trip. (a) TO (°C) considering HVAC use for heating; (b) TO (°C) considering HVAC use for cooling; (c) relative humidity; (d) CO2 level; and (e) VOC level.
Atmosphere 15 00589 g003
Figure 4. Mean and SD of thermal parameter series in all trips, (a) heating season and (b) cooling season, according to HVAC application.
Atmosphere 15 00589 g004
Figure 5. PMV index using two air velocities (a) Va = 0.1 m/s and (b) Va = 0.3 m/s for all the bus and train trips investigated.
Atmosphere 15 00589 g005
Figure 6. IAQ parameters for all trips: (a) CO2 level averages and SD; (b) VOC averages and SD for all trips.
Atmosphere 15 00589 g006
Figure 7. CO2 concentrations and fresh air flow rate correlation with the IAQ conditions [78].
Atmosphere 15 00589 g007
Table 1. a. Routes and bus models.
Bus TripRouteOperatorMonthSeatSeason
1Malpensa—TorinoFlibco711Cooling
2Torino—MalpensaFlibco77CCooling
3Cartagena—BarranquillaFlibco77Cooling
4Barranquilla—CartagenaMarsol87Cooling
5Charleroi—BrusselsMarsol92ACooling
6Coimbra—MadridFlix bus726Cooling
7Lisbon—CoimbraRoyal express7-Cooling
8Madrid—CoimbraFlix bus717VCooling
9Coimbra—LisbonCoimbra shuttle9-Cooling
10Lisbon—CoimbraCoimbra shuttle51CCooling
11Coimbra—CoimbraFlibco11-Heating
12Coimbra—LisbonCoimbra shuttle229Heating
13Coimbra—LisbonCoimbra shuttle1-Heating
14Lisbon—CoimbraCoimbra shuttle1-Heating
15Coimbra—LisbonCoimbra shuttle11-Heating
b. Routes and train models.
Train TripRouteOperator/typologyMonthSeatSeason
1Coimbra—LisbonCp Intercidades/URS611Cooling
2Coimbra—LisbonAlfa Pendular/HST822Cooling
3Coimbra—LisbonAlfa Pendular/HST822Cooling
4Coimbra—LisbonCp Intercidades/URS940Cooling
5Poitiers—ParisTGV/HST534Cooling
6Erfurt—JenaRegional-Train/URS5-Cooling
7Jena—BerlinICE/URS5-Cooling
8Frankfurt—ErfurtICE/URS542Cooling
9Massy—PoitiersTGV/HST376Heating
10Lisbon—CoimbraCp Intercidades/URS1024Heating
11Lisbon—CoimbraCp Intercidades/URS1024Heating
12Lisbon—CoimbraAlfa Pendular/HST1036Heating
13Lisbon—CoimbraAlfa Pendular/HST1036Heating
14Lisbon—CoimbraAlfa Pendular/HST1036Heating
15Coimbra—LisbonCp Intercidades/URS1123Heating
16Brussels—Paris TGV/HST1185Heating
17Paris—PoitiersTGV/HST1168Heating
18Paris—PoitiersTGV/HST1168Heating
19Paris—PoitiersTGV/HST1149Heating
20Lisbon—CoimbraAlfa Pendular/HST1132Heating
21Coimbra—LisbonCp Intercidades1146Heating
Table 2. The measuring equipment parameters.
EquipmentCalibrationResolution and SettingsDevice Range
IEQ multiprobe deviceCoverage factor (2), Probability (95%), TO (±0.2 °C), CO2 (±35 ppm), RH
(±1%)
Omni directional probe, Sampling interval (5 s), Data logging via USB connection to a computerCO2 (ppm), Operative temperature (°C)—TO, Relative humidity (%)—RH, Atmospheric pressure (Pa), VOCs, Illuminance (lux)
Table 3. TO (°C), CO2 (ppm), and VOC recommendation range.
Operative Temperature (°C)CO2 ConcentrationVOC
Sedentary activity
Air velocity < 0.1 m/s
CategoryTO (°C)
range for heating
(Winter)
~1 clo/RH 40%
TO range for cooling
(Summer)
~0.5 clo/RH 60%
CategoryCorresponding CO2 concentration above outdoors for non-adapted individuals (ppm)CategoryIAQ IndexAir Quality
Offices and spaces with
similar activity (conference
room, single office)
~1.2 met
I21–2323.5–25.5I550100–50Good
II20–2423–26II800751–100Average
III19–2522–27III13504101–150Little bad
IV17–2521–28IV13507151–200Bad
201–300Worse
301–500Very bad
Table 4. Environmental average values, including cooling and heating seasons for buses.
TripsTemp (°C)RH (%)Illuminance (lux)Atm. Pres. (Pa)CO2 (ppm)VOC
Index
HVAC
Use
128.8481997312216Cooling
227.250575985228021Cooling
332.8676861006118156Cooling
428.8573741003205835Cooling
524.54741020142415Cooling
622.84901017141519Cooling
724.455141009109431Cooling
827.5541934177130Cooling
926.74711002515414Cooling
10264701003107328Cooling
1125.454241011115429Heating
1227.543093915026Heating
1323.5571221014246235Heating
1423.1500101979821Heating
1523.9699099273959Heating
Table 5. Environmental average values, including cooling and heating seasons for trains.
TripsTemp (°C)RH
(%)
Illuminance (lux)Atm. Pres. (Pa)CO2 (ppm)VOC IndexHVAC Use
126.554841302120530Cooling
220.665764101695253Cooling
321.366390101094755Cooling
425.551251101677024Cooling
523.941381007123315Cooling
625.8481272998177733Cooling
726.650149979140735Cooling
824.5424701014102117Cooling
9254779991145329Heating
1025.85484101298729Heating
1125.856129101798134Heating
1219.759333101989539Heating
1319.860358101287841Heating
1422.3721390101492866Heating
1525.15950101098640Heating
16235145992150923Heating
1725.64673985123312Heating
1824.146116988106514Heating
1923.647112988131615Heating
2021.9487741013104617Heating
2123.94727101384716Heating
Table 6. PMV–PPD index for all the investigated bus and train trips.
TripsPMV1 PPD1PMV2PPD2PMV3PPD3PMV4PPD4
10.923−0.491.6560.26
2−1.026−2.1811.130−0.37
3−0.818−1.1732.9991.340
4−0.611−0.8171.6570.26
50.05−1.2350.26−1.027
60.614−0.715−0.37−1.551
70.922−0.59−0.26−1.129
80.26−1.0271.234−0.26
90.48−0.9220.923−0.49
100.511−0.9210.715−0.613
110.511−0.9200.510−0.819
12−0.49−0.260.818−1.129
13−0.48−0.260.26−0.612
140.05−0.590.15−0.611
150.49−0.818−0.26−0.614
160.15−0.511
170.510−0.820
180.27−0.714
190.26−0.613
200.15−0.49
210.26−0.614
Disclaimer/Publisher’s Note: The statements, opinions and data contained in all publications are solely those of the individual author(s) and contributor(s) and not of MDPI and/or the editor(s). MDPI and/or the editor(s) disclaim responsibility for any injury to people or property resulting from any ideas, methods, instructions or products referred to in the content.