Abstract
The utilization of remote sensing soil moisture products in agricultural and hydrological studies is on the rise. Conducting a regional applicability analysis of these soil moisture products is essential as a preliminary step for their effective utilization. The triple collocation (TC) method enables the estimation of the standard deviation of errors in products when true soil moisture values are unavailable. It assesses data uncertainty and mitigates the influence of product errors on fusion, thereby enhancing product accuracy significantly. In this study, the TC uncertainty error analysis was employed to integrate Soil Moisture Active Passive (SMAP), the Advanced Microwave Scanning Radiometer 2 (AMSR-2), and the European Space Agency Climate Change Initiative (ESA CCI) active (ESA CCI A) and passive (ESA CCI P) products, with ground-based measurements serving as a reference. Traditional evaluation metrics, such as the correlation coefficient (R), bias, root mean square error (RMSE), and unin situed root mean square error (ubRMSE), were employed to evaluate the accuracy of the product. The findings indicate that SMAP and ESA CCI P products demonstrate strong spatiotemporal continuity within the research area and exhibit low uncertainty across various land types. The products derived from the Advanced Microwave Scanning Radiometer 2 (AMSR-2) exhibit a high level of temporal and spatial continuity; however, there is a requirement for enhancing their accuracy. The products of ESA CCI A exhibit notable spatiotemporal disjunction, contributing significantly to their elevated level of uncertainty. After fusion with TC analysis, the correlation coefficient (R = 0.7) of the TC-2 product derived from the fusion of SMAP, AMSR-2, and ESA CCI P products is significantly higher than the correlation coefficient of the TC-1 product (R = 0.65) obtained from the fusion of SMAP, AMSR-2, and ESA CCI A products at a 95% confidence level. The integration of data can efficiently mitigate the challenges associated with spatiotemporal gaps and inaccuracies in products, offering a dependable foundation for the subsequent utilization of remote sensing products.
1. Introduction
Soil moisture is a crucial factor in the surface hydrological cycle and ecosystem health, with significant implications for meteorology, agriculture, water resource management, and various other fields [1]. The continuous progress in remote sensing technology has heightened the importance of global-scale soil moisture remote sensing products as essential data sources for soil moisture research in scientific studies. Nevertheless, global-scale soil moisture products consistently exhibit lower accuracy when compared to measurements obtained from ground-based sources. Furthermore, the products resulting from satellite operations often display strip-like patterns that can be attributed to variables such as orbit configuration and scanning methodology, resulting in incomplete coverage of global regions. Remote sensing products are currently considered the most efficient approach for acquiring soil moisture data over large areas and with a high temporal resolution [2].
In recent decades, the effective utilization of satellites equipped with sensors capable of detecting soil moisture has resulted in the ongoing production of soil moisture products. For instance, the successful deployment of the AQUA satellite by NASA in 2002 [3], equipped with the passive microwave sensor Advanced Microwave Scanning Radiometer-Earth Observing System (AMSR-E), enabled the generation of soil moisture datasets spanning from 2002 to 2011. In 2012, the Japan Aerospace Exploration Agency (JAXA) launched the Global Change Observation Mission 1st (GCOM-W1). The satellite, equipped with AMSR-2, is used for water monitoring. This mission has expanded the soil moisture observations that were initially started by AMSR-E and has been operational since 2012. In 2015, NASA initiated the Soil Moisture Active Passive (SMAP) mission [4], which integrates L-band radar and L-band microwave radiometer technologies. Subsequently, it has consistently shared soil moisture data products with the public. The ESA CCI product was developed by the European Space Agency. Integrating a variety of active and passive microwave soil moisture datasets, such as AMSR-E and SMAP, through the application of the TC method has become a prevalent approach to generating soil moisture products [5].
Several recent studies have assessed soil moisture products obtained from SMAP, AMSR-2, and ESA CCI, utilizing either in situ measurements or model simulation data [6]. For example, Zeng et al. [7] performed a technical evaluation of seven remote sensing soil moisture products and one reanalysis soil moisture product. They utilized observed data from three soil moisture monitoring networks that cover a wide range of climates and vegetation conditions on the Qinghai–Tibet Plateau from 2002 to 2012. Cui et al. [8] examined the performance of eight satellite-based soil moisture products by utilizing in situ soil moisture data from two dense soil moisture networks in the United States. Albergel et al. [9] assessed the reliability of three soil moisture products by employing in situ soil moisture data from over 200 sites across Africa, Australia, Europe, and the United States. Liu et al. [10] investigated seven categories of soil moisture remote sensing products by utilizing in situ networks in various regions, including North America, the Qinghai–Tibet Plateau, Western Europe, and Southeastern Australia. The results of these studies consistently demonstrate that the SMAP soil moisture product exhibits the lowest error rate in comparison to in situ data [11]. In contrast, the soil moisture products generated by JAXA’s AMSR-E and AMSR-2 satellites have shown a tendency to underestimate soil moisture levels [12]. Moreover, research indicates that the accuracy of different soil moisture products can vary significantly among regions. For example, while SMOS products exhibit satisfactory performance in continental Europe [13], they show significant noise and deviation in the Qinghai–Tibet Plateau region [10].
Scholars have utilized fusion techniques to derive regional soil moisture products with reduced systematic errors [14], considering the diverse accuracy requirements of soil moisture products obtained from various sensors. The TC method is currently acknowledged as a stable and effective approach [15,16,17]. Wu et al. [18] utilized the TC method to investigate the error characteristics of three soil moisture datasets derived from ASCAT, AMSR-E, and ERA-Interim. Notarnicola [19] employed the TC method to examine inaccuracies in soil moisture datasets obtained from satellite observations and ground-based model simulations. Dorigo et al. [20] employed the TC method to evaluate the comparative quality of various soil samples. Soil moisture products are derived from active (Advanced Scatterometer, ASCAT) and passive (AMSR-E and SSM/I) microwave sensors.
The current research predominantly concentrates on regions such as the United States, Europe, and Australia, with limited evaluation conducted on soil moisture products in the northeastern provinces of China. For example, Zheng et al. [21] performed an uncertainty analysis on SMAP, SMOS, FY-3C, and AMSR-2 products in northeastern China. The findings suggest that the precision of SMAP products closely aligns with the designated application accuracy at the time of product launch, with SMOS, FY-3C, and AMSR-2 following in descending order. The northeastern provinces of China, which are important regions for grain production and characterized by significant topographical diversity and abundant forestry, farmland, and grassland resources, necessitate precise monitoring of soil moisture and validation of remote sensing data products.
The study aimed to analyze and evaluate the active and passive soil moisture products provided by SMAP, AMSR-2, and ESA-CCI. Drawing upon the Dehui farmland pixel-scale soil moisture observation network established at the Jingyuetan Station of the Chinese Academy of Sciences. Subsequently, the TC method was employed to systematically assess uncertainties in individual soil moisture products. Furthermore, the TC method was employed to integrate the soil moisture datasets from SMAP, AMSR-2, and ESA-CCI in order to generate a holistic soil moisture product specifically tailored for the northeast region.
2. Data and Methods
2.1. Study Area
The research site is situated in the northeastern regions of China, as shown in Figure 1, encompassing Heilongjiang, Jilin, and Liaoning provinces. This region holds importance due to being one of the primary agricultural production zones in the country. It extends from around 118° E to 135° E longitude and from 38° N to 55° N latitude. The total area of these provinces amounts to 808,400 square kilometers. The climate in the region is categorized as a temperate continental monsoon climate, which is shaped by the East Asian monsoon during the summer months and polar cold air masses during the winter season. The average annual temperature in the region is 3.1 °C, and it receives an average annual precipitation of 500 mm.
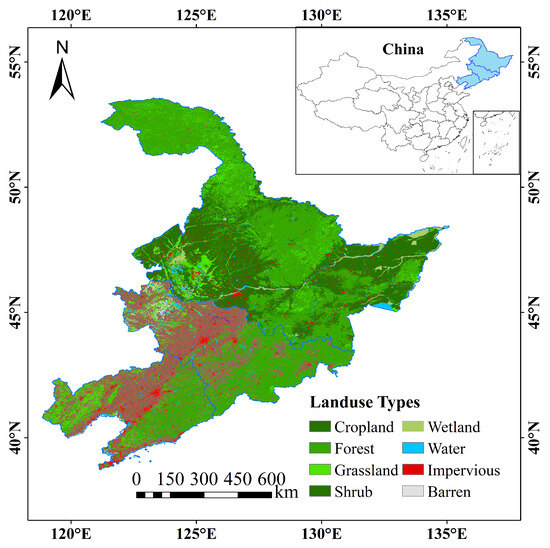
Figure 1.
Land use distribution map of the study area.
The region is characterized by extensive plains with significant expanses of cropland, forest, and grassland, which collectively constitute more than 90% of the land utilization in the area. The primary soil classifications comprise black soil, brown soil, meadow soil, marsh soil, and permafrost. Black soil is predominantly found in central Jilin and the western and eastern Heilongjiang regions. It is distinguished by its high organic content, loose texture, and exceptional moisture and nutrient retention capabilities, rendering it highly conducive for the cultivation of crops such as corn, soybeans, and wheat. Brown soil predominantly occurs in the low mountainous and hilly regions of the area, extending to certain areas on the periphery of plains. Meadow soil is predominantly found in proximity to rivers and lakeshores, particularly in low-lying regions. These areas offer favorable conditions abundant in organic matter and moisture, facilitating the growth of rice and other crops that demand high levels of moisture. Marsh soil is characterized by a high content of organic matter and moisture and is typically located in low-lying wetlands and river floodplains. Permafrost is typically found in regions of high altitude, where the soil remains frozen for the majority of the year.
2.2. Satellite Data
2.2.1. SMAP Passive Microwave Soil Moisture Product
The Soil Moisture Active Passive (SMAP) satellite, which was launched by NASA in January 2015, is specifically designed for the purpose of monitoring soil moisture levels. The system was outfitted with an L-band radar operating at 1.26 GHz and an L-band radiometer operating at 1.41 GHz. The L-band radar notably stopped operating after 11 weeks. In this study, we utilize the Enhanced SMAP Level 3 soil moisture dataset, which features a spatial resolution of 36 km and is provided by the National Snow and Ice Data Center (NSIDC). This product evaluates the moisture content of soil from the surface to a depth of 0–5 cm. The data utilized in this study are sourced from the Enhanced SMAP Level 2 semiorbit daily soil moisture dataset using the SMAP [22,23]. The dataset covers the period from May to September between 2016 and 2018 and has been resampled to a spatial resolution of 25 km. The data was accessed on 22 March 2024, and is accessible at: https://nsidc.org/data/smap/smap-data.html.
2.2.2. AMSR-2 Passive Microwave Soil Moisture Product
AMSR-E represents a passive microwave sensor that is part of the Global Change Observation Mission for Water-1 (GCOM-W1) satellite [24,25], which was deployed by the Japan Aerospace Exploration Agency (JAXA) in May 2012. The satellite operated from May 2002 to October 2011 and was subsequently replaced by AMSR-2. AMSR-2 is equipped with seven central frequencies and fourteen observation channels for brightness temperature measurements: 6.925 GHz, 7.3 GHz, 10.65 GHz, 18.7 GHz, 23.8 GHz, 36.5 GHz, and 89.0 GHz. The AMSR-2 Level 3 soil moisture product utilized in this research is supplied by JAXA. The dataset GCOM-W1 covers the period from May to September for the years 2016 to 2018. It has a spatial resolution of 25 km and a temporal resolution of daily. The information was accessed on 22 March 2024, and can be accessed at: https://gportal.jaxa.jp/gpr/?lang=en.
2.2.3. ESA CCI Active and Passive Microwave Soil Moisture Product
The active soil moisture product of the ESA Climate Change Initiative (CCI) is derived from the integration of scatterometer soil moisture data and the fusion of active and passive microwave soil moisture retrievals. The passive soil moisture product integrates data from various instruments, such as the Scanning Multichannel Microwave Radiometer (SMMR), Special Sensor Microwave/Imager (SSM/I), and Tropical Rainfall Measuring Mission. Microwave Imager (TMI), Advanced Microwave Scanning Radiometer-EOS (AMSR-E), WindSat, Advanced Microwave Scanning Radiometer 2 (AMSR-2), Soil Moisture and Ocean Salinity (SMOS), Soil Moisture Active Passive (SMAP), and Global Precipitation Measurement (GPM) and Fengyun have been extensively studied in previous research [26,27,28]. The dataset was generated in accordance with the methodologies outlined by Gruber et al. [29], Liu et al. [30], Wagner et al. [31], and other relevant sources. The assimilated and merged product offers global surface soil moisture data at a spatial resolution of 0.25 degrees and a temporal resolution of one day (reference time at UTC 0:00). The soil moisture data in the passive product are presented in volumetric units (m3/m3). The saturation percentage (%) of ESA CCI active products is transformed from soil porosity by utilizing ESA CCI auxiliary data to determine the volumetric water content (volumetric water content = soil saturation × soil porosity). This study utilizes the ESA CCI active (ESA CCI A) and passive (ESA CCI P) soil moisture products from May to September, spanning the years 2016 to 2018. Further information regarding the ESA CCI soil moisture products can be explored in the studies by Gruber and Dorigo [29,32].
2.2.4. Satellite Data Preprocessing
Initially, this study faced challenges due to inconsistent units in the soil moisture data. The volumetric soil water content (m3/m3) was calculated based on the saturation percentage data (%) obtained from the active microwave soil moisture product, utilizing soil bulk density information. This conversion was conducted to standardize all soil moisture estimates to volumetric units of cubic meters per cubic meter per day (m3/m3/day−1).
Secondly, to address the disparities in spatial and temporal resolutions among different soil products, a uniform methodology was implemented. This involved conducting bilinear interpolation and resampling on all soil moisture estimates to standardize the spatial resolution to 25 km and temporal resolution to 1 day. A weighted integration of ascending and descending soil moisture products was also performed. This study exclusively concentrates on estimating soil moisture levels over terrestrial areas. Pixels that represent inland water bodies are designated as NaN values and consequently excluded from subsequent analyses.
To assess remote sensing soil moisture products using ground measurement data, a specific approach involves selecting relevant ground measurement data samples according to the location of the product pixel. These selected samples are then arithmetically averaged to derive the ground measurement value for that pixel.
2.3. In Situ Observation Data
The study utilizes in situ observation data obtained from the Soil Moisture Observation Network in the Dehui agricultural area, situated in Dehui County, Jilin Province, China. The observation network in question was established by and is currently under the management of the Jilin Satellite Remote Sensing Experimental Station, which operates under the Chinese Academy of Sciences in Changchun. The Dehui Agricultural Soil Moisture Observation Network covers an area of 36 km by 36 km and has implemented a comprehensive network of soil moisture observation stations. A total of 28 soil moisture observation stations were chosen to provide a representative sample of the entire area. The measured data spatially cover four pixels, each with a spatial resolution of 25 km, in the remote sensing soil moisture products (Figure 2).
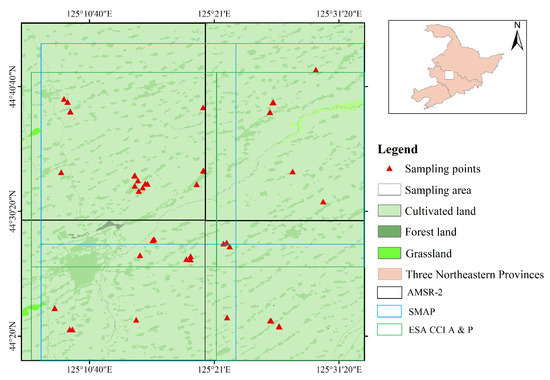
Figure 2.
Distribution map of Dehui soil moisture observation network stations.
The validation area is located in the northern region of Changchun, China, covering the maize cultivation zone in the eastern part of Nongan County and the western part of Dehui County. The region encounters a temperate monsoon climate characterized by well-defined seasons. The annual mean precipitation totals 520 mm, with the majority falling during the summer months of July and August. The mean annual temperature and cumulative temperature amount to 4.4 °C and 2851 °C, respectively. This region, characterized as a typical farmland area in Northeast China, is well suited for validating soil moisture products. The selection of this area was based on several factors. Firstly, there is a significant need for soil moisture validation in Chinese farmland regions. Secondly, the terrain is relatively flat, characterized by slopes ranging from 0° to 5.8° with a standard deviation (STD) of 0.45°. The land use consists of predominantly farmland, primarily for maize cultivation, covering over 90% of the pixel area, while water bodies occupy 0.37%. The soil texture is relatively uniform, with clay content varying from 11.5% to 12.5% and sand content from 51.5% to 60.6% [33].
At the observation sites, EC-5 soil moisture sensors were deployed and buried to collect soil moisture data from May to September between 2016 and 2018. The gathered data underwent recalibration utilizing on-site calibration coefficients, which were utilized as reference data to validate the microwave soil moisture [34]. To process the data containing the SMAP pixels, the Thiessen polygon method was utilized, as depicted in Figure 2, which illustrates the pixel coverage of the AMSR-2 and ESA CCI A and P products. This method enabled the conversion of ground observation data to match the pixel resolution of the target products [35].
2.4. Land Use Data
Land use information was obtained from the GlobeLand30 2020 dataset, a global land cover dataset published by China in 2017, which has a spatial resolution of 30 m [36,37,38]. The GlobeLand30 dataset is based on the WGS-84 coordinate system and encompasses 10 primary land cover categories: cropland, forestland, grassland, shrubland, wetland, water bodies, tundra, artificial surfaces, bare soil, glaciers, and permanent snow. In this study, discussions regarding soil moisture products focus on cropland, forestland, and grassland land use types.
3. Method
3.1. TC Method
The triple collocation (TC) method assumes the presence of three measurement systems that are spatially coincident and mutually independent. All three systems exhibit correlation with the unknown “true value” within a linear additive error model [39,40].
where denotes a random time series data of soil moisture using X, Y, and Z as triplets, with ; and represent the ordinary least squares intercept (additive mean bias) and slope (multiplicative mean bias) in the dataset of soil moisture i; t signifies the unknown true ground value of soil moisture; and stands for the zero-mean random error in the dataset of soil moisture i. Traditionally, a recognized approach for validating remote sensing data involves the utilization of in situ measurements for verification. In the realm of soil moisture determination, obstacles such as instrument inaccuracies and human-operational intervention pose challenges in accurately determining the actual soil moisture content. Consequently, this hinders the utilization of conventional statistical approaches for validating remote sensing soil moisture outputs. The uncertainty related to various remote sensing soil moisture products is evaluated through the TC method.
In mathematical terms, the TC method is formulated using both the covariance method and the differencing method [41]. This study choose the former approach because it has been more widely utilized in previous research. Another significant rationale for employing the covariance method is that, in addition to estimating error variances, it also offers an estimation of the datasets’ sensitivity to variations in soil moisture. The covariance method involves the utilization of dataset variances () and covariances (), which are mathematically expressed as
where i, j are elements of the sets X, Y, and Z, and i is not equal to j. The symbol denotes the variance of the actual observed soil moisture data, while represents the sensitivity of dataset i to the true signal variation. In essence, a higher value of indicates a more pronounced reaction of product i to variations in soil moisture levels. By employing the covariance representation, the error variance can be determined directly as follows:
The sensitivity of soil moisture data products is assessed through the following estimation method:
Hence, the standard deviation of the error can be calculated based on the error variance mentioned above:
The standard deviation values for the errors in three soil moisture remote sensing datasets can be determined through the TC method. The standard deviations of these errors form the basis for computing fusion weights.
The fusion weights for the three soil moisture remote sensing products are computed through the aforementioned equations. Subsequently, the linear fusion method is utilized to combine the three soil moisture remote sensing data products.
3.2. Evaluation Metrics
The evaluation of soil moisture products derived from remote sensing involves the utilization of essential metrics such as the correlation coefficient (R), root mean square error (, m3/m3), unbiased root mean square error (, m3/m3), and bias (m3/m3). The correlation coefficient adheres to the following relationship:
In the formula, refers to the data values of remote sensing soil moisture products, while denotes the ground-truth measurement data values. In the analysis of time series data, the variable N represents the total time span, whereas the variable i signifies a specific day. The symbols and denote the standard deviations of soil moisture data acquired through remote sensing and in situ measurements, respectively. The mean bias quantifies the degree to which the measured values diverge from the mean level, offering an intuitive illustration of the disparities between soil moisture products and in situ data. It is formulated as follows:
is employed to measure the absolute average deviation and accuracy when comparing remote sensing soil moisture products with in situ data.
In time series analysis, is defined to improve the accuracy of estimation by reducing the influence of mean bias.
4. Result Analysis
4.1. Variation Trends of Soil Moisture in Different Land Use Types
In the northeastern provinces of China, from May to September each year, the soil moisture exhibits distinct seasonal variations due to the combined effects of the rainy season and factors such as farmland irrigation. Observing the trend of soil moisture changes from May to September from 2016 to 2018 (Figure 3), it has been found that the overall trends are generally similar. Consequently, the present study selected the soil moisture time series of different land use types in 2016 for detailed analysis to investigate the impact of various land use types on soil moisture dynamics.
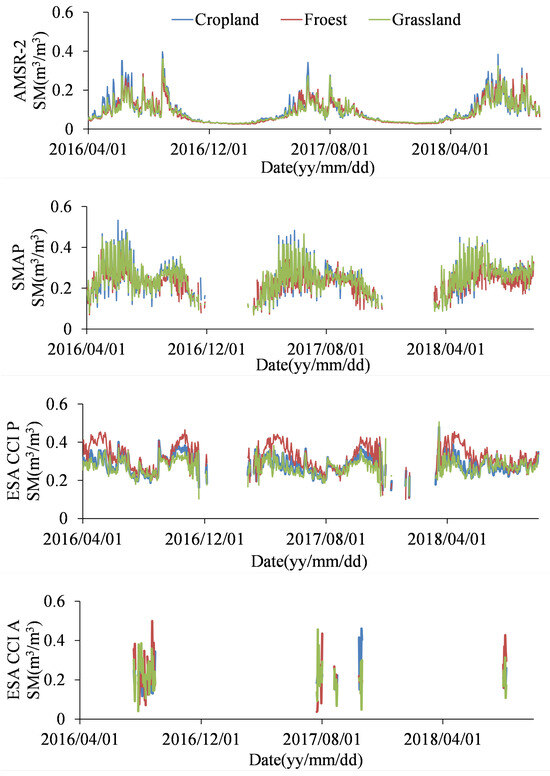
Figure 3.
Temporal trends of soil moisture in different land use types from 2016 to 2018.
In the cultivated land region of Northeast China, a comprehensive analysis of the SMAP and ESA CCI P products from May to September (Figure 4) revealed a high level of consistency between the two. The results of the mean value comparison (Table 1) confirmed this trend. During the period from May to September, the maximum difference in mean values between SMAP and ESA CCI P was 0.14 m3/m3, with a minimum of 0. At the 95% significance level, the mean correlation coefficient reached 0.822, indicating a significant correlation.
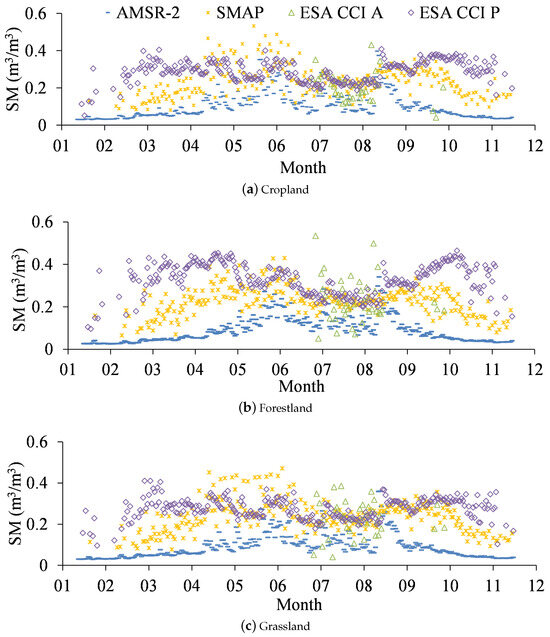
Figure 4.
Time series plot of microwave soil moisture data for different land use types in 2016.

Table 1.
Statistical summary of soil moisture values from April to September 2016 for different products in various land use types.
The standard deviation of the correlation coefficient was 0.86, suggesting a consistent trend in their data during this period. The coefficients of variation were between 10% and 30%, indicating a moderate level of relative variability in the SMAP and ESA CCI P products from May to September in the Northeast China region, without excessive fluctuations.
When examining the mean correlation coefficients for the period from April to September, the correlation coefficients for SMAP and ESA CCI P were 0.45, indicating a non-significant correlation, which suggests significant differences in the two sets of product data in April. In the cultivated land region of Northeast China, during the period spanning from May to September, the mean correlation coefficients between the AMSR-2 products and the SMAP, as well as the ESA CCI P products, were 0.83 and 0.483, respectively. Conversely, for the broader timeframe extending from April to September, the mean correlation coefficients observed were 0.903 and 0.126, respectively. Meanwhile, in the cultivated land region, the variation coefficient fluctuation range for AMSR-2 from April to September exceeded 30%, with a maximum of 67.1% and a minimum of 32.1%. In comparison, the fluctuation range for the coefficient of variation for SMAP was between 13.9% and 30%, and for ESA CCI P, it was between 7.3% and 15.4%, indicating moderate fluctuation levels. Although AMSR-2 exhibits more pronounced data variability in the cultivated land region and its mean correlation coefficient with SMAP in the farmland region is relatively high, this does not necessarily imply a significant correlation with SMAP data. As depicted in Figure 3, ESA CCI A products have data for the study area in July and August each year, whereas the coefficient of variation fluctuates significantly, reaching 57.3%, indicating substantial variability (Table 1). Given this, the data from ESA CCI A products have some uncertainty in terms of their reference value. Consequently, no further deliberation regarding these values is pursued in the subsequent research.
In the forest regions of Northeast China, the mean value of the ESA CCI P product is significantly higher than that of the SMAP and AMSR-2 products (Table 1). The range of standard deviation for the three groups of products—ESA CCI P, SMAP, and AMSR-2—is between 0.01 m3/m3 and 0.067 m3/m3, which is lower than the standard deviation found in the cultivated land and grassland regions (Table 1). This suggests that there is a relatively low level of data variation among the three product groups in forest areas. Further examination of Figure 5a–c and Figure 6a–c reveals that the mean levels of forest regions are higher than those in cultivated land and grassland regions, and the standard deviation levels of the three soil moisture products in forest regions are generally lower than those in cultivated land and grassland regions, signifying that soil moisture values obtained from monitoring forest areas are relatively stable and less affected by factors such as irrigation and rainfall. In comparison to the cultivated land region, the coefficient of variation for AMSR-2 in the forest region shows a significant decrease, ranging from 32.1% to 67.1% to between 19% and 48.5%, a reduction of 28% to 40%. The soil moisture data from AMSR-2 in the forest region exhibit a medium level of relative variability with no excessive fluctuations. Likewise, the coefficient of variation for SMAP and ESA CCI P products in the forest region from April to September ranges between 9.7% and 28.5% and between 7.7% and 15.5%, respectively, both remaining below 30%, which indicates that their data are relatively consistent.
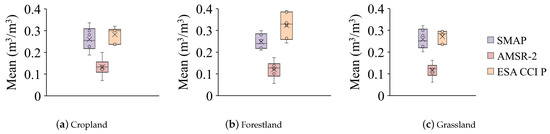
Figure 5.
Soil moisture monthly mean boxplots for SMAP, AMSR-2, and ESA CCI P in cropland, forestland, and grassland regions.
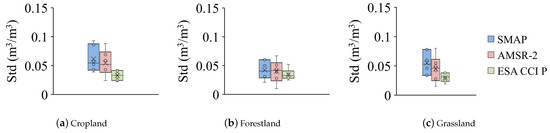
Figure 6.
Standard deviation boxplots for SMAP, AMSR-2, and ESA CCI P soil moisture in cropland, forestland, and grassland regions.
In Northeast China’s grassland region, the three products show trends similar to those in the cultivated land region in terms of mean, standard deviation, and coefficient of variation. However, within the forest region, the products possess distinct features, with mean values that are significantly higher than those in cultivated and grassland areas. At the same time, the standard deviation and coefficient of variation are relatively lower (Figure 5, Figure 6 and Figure 7). The mean value range for product data in the grassland region lies between 0.062 m3/m3 and 0.321 m3/m3, while in the cultivated land region, it spans from 0.07 m3/m3 to 0.336 m3/m3, and in the forest region, it extends from 0.056 m3/m3 to 0.391 m3/m3. These findings highlight the substantial influence of different land use types on product data.
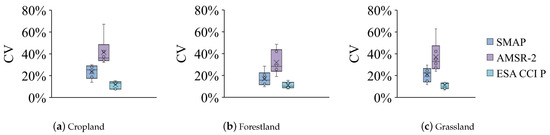
Figure 7.
Coefficient of variation boxplots for SMAP, AMSR-2, and ESA CCI P soil moisture in cropland, forestland, and grassland regions.
4.2. Uncertainty Analysis Based on the TC Method
As previously indicated in Section 3.1, this study is founded on the integration of two datasets, namely SMAP–AMSR-2–ESA CCI A and SMAP–AMSR-2–ESA CCI P. Consequently, it is imperative to establish correlations between these datasets prior to commencing the uncertainty TC analysis. Table 2 presents the mean and standard deviation of the correlation coefficients for the four soil moisture products. The table illustrates that the correlation coefficient between SMAP and AMSR-2 products is notably high, reaching 0.446. In comparison, the correlation coefficient between the ESA CCI A and ESA CCI P products is the lowest, measuring 0.038. The results suggest a significant level of autonomy among the products. The standard deviations among the products are all less than 0.006, suggesting that the TC outcomes demonstrate stability.
Table 2.
Statistical summary of correlation coefficients between soil moisture products.
The spatial distribution of the standard deviation of errors for the two product combinations, SMAP–AMSR-2–ESA CCI A and SMAP–AMSR-2–ESA CCI P, in the three northeastern provinces is illustrated in Figure 8 and Figure 9. In the first set of graphics, Figure 8, the standard deviation of errors in ESA CCI A products is consistently greater compared to those in the SMAP and AMSR-2 datasets. The errors of ESA CCI A products in the three northeastern provinces exhibit relatively high values, mostly ranging between 0.12 and 0.2 m3/m3. When considering the landform type (Figure 10), ESA CCI A demonstrates increased errors during landform transitions. The standard deviation of errors in SMAP products is lower compared to AMSR-2 products, typically falling below 0.08 m3/m3. While it does not meet the official standard of 0.04 m3/m3, it demonstrates a minimal margin of error. The error values of AMSR-2 products in the first group are predominantly distributed around 0.12 m3/m3. The error rates in southeastern Heilongjiang and northwest Jilin are comparatively lower than those observed in other regions. The potential explanation is that AMSR-2 observes regions unaffected by vegetation [42]. The error in the soil moisture value is minimal. In the subsequent set of Figure 9, the total error exhibited by the ESA CCI P product is comparatively lower than that of the SMAP and AMSR-2 products. Moreover, the standard deviation of error within the cultivated region is less than 0.04 m3/m3. The standard deviation of errors in the SMAP product is lower compared to that of the AMSR-2 product. Consequently, more precise soil moisture monitoring values are achieved in cultivated areas with reduced errors. In the second group, the standard deviation of errors in SMAP products is predominantly distributed within the range of 0.04–0.08 m3/m3, with a value nearing 0.12 m3/m3 in the northeastern of Heilongjiang. The standard deviation of errors in the AMSR-2 product does not significantly differ from the performance in the initial group, primarily clustered around 0.12. Moreover, the monitoring of surface soil moisture values demonstrates greater accuracy in flat terrains.
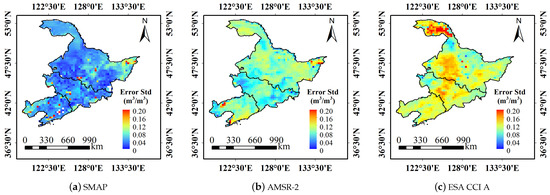
Figure 8.
The spatial distribution map of error values for SMAP–AMSR-2–ESA CCI A.
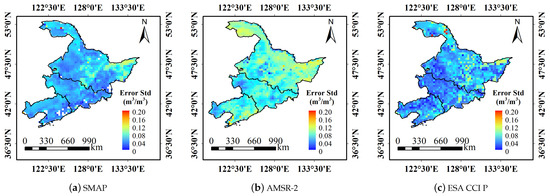
Figure 9.
The spatial distribution map of error values for SMAP–AMSR-2–ESA CCI P.
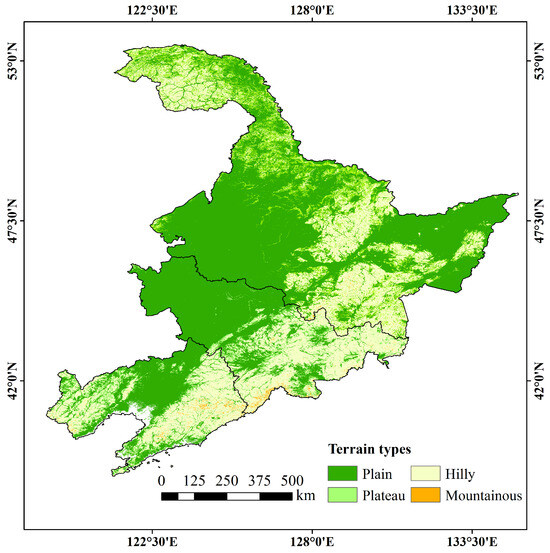
Figure 10.
Landform distribution map of the Northeast Three Provinces region.
In the second group, in Figure 9, the ESA CCI P product overall exhibits lower errors compared to SMAP and AMSR-2 products, with error standard deviations in cultivated lands dipping below 0.04 m3/m3. The SMAP product maintains a lower error standard deviation than that of AMSR-2, achieving more accurate soil moisture values in agricultural areas. Within this second set, the error standard deviations for the SMAP product are generally between 0.04 and 0.08 m3/m3, with areas in the northeastern part of Heilongjiang approaching 0.12 m3/m3. The performance of the AMSR-2 product in this group does not significantly deviate from the first, with most values clustered around 0.12 m3/m3, yet it achieves more accurate soil moisture measurements in plain areas.
4.3. Analysis of Fusion Results
The fusion weight of the soil moisture product is determined based on the standard deviation of the error, illustrated in Figure 11 and Figure 12 for the fusion weights of the SMAP–AMSR-2–ESA CCI A and SMAP–AMSR-2–ESA CCI P products. In Figure 11, it is evident that the weight of the SMAP product surpasses that of the AMSR-2 and ESA CCI A products. This observation aligns with the lower standard deviation error of SMAP, suggesting a more significant contribution of the SMAP product within this group of fusion products. As illustrated in Figure 11a, the weight of the SMAP product in the initial set of TC fusion combinations exhibits higher values in the plain cultivated land area, ranging from 0.6 to 0.8. In regions beyond flat agricultural land, the weight value remains higher compared to the AMSR-2 products and ESA CCI A products within the corresponding category. In Figure 11b,c, it is evident that the weight value of the AMSR-2 products is marginally greater than that of ESA CCI A within the specified study area, with variations between 0.2 and 0.5. The ESA CCI A products make the smallest contribution in terms of weight among this group of TC fusion products, with an overall weight ranging from 0 to 0.4. As illustrated in Figure 12, the weight values of ESA CCI P products range from 0.4 to 0.8, with the majority clustered around 0.5, constituting more than half of the total weight and playing a significant role in the second category of product integration. The weight values of SMAP products range from 0.2 to 0.7, which is slightly lower than ESA CCI P and higher than AMSR-2 products.
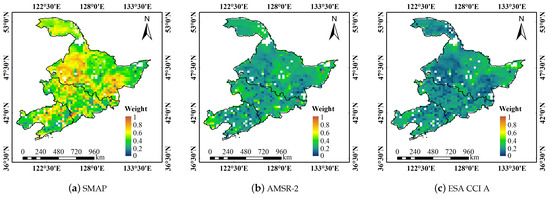
Figure 11.
Weight values of (a) SMAP, (b) AMSR-2, and (c) ESA CCI A products based on TC.
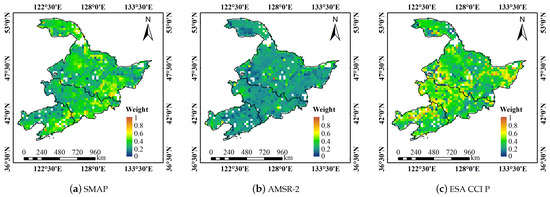
Figure 12.
Weight values of (a) SMAP, (b) AMSR-2, and (c) ESA CCI P products based on TC.
Combining the weights of the two groups of fusions reveals that SMAP products exhibit a substantial weight proportion in both groups. Moreover, the error standard deviation of SMAP products is below 0.08 m3/m3, suggesting a relatively high level of reliability within the study area. It can serve as a point of reference for future scientific research as well as for applications in production and daily life. The analysis results indicate that the accuracy of the ESA CCI P product in the study area surpasses that of the ESA CCI A product. Additionally, this product holds the highest weight ratio within the second group of fusion products. This study posits that the reliability of the ESA CCI P product within the research area is credible.
Figure 13 displays the SMAP, AMSR-2, ESA CCI A, ESA CCI P, and TC-1 products resulting from the integration of the initial set of products, SMAP–AMSR-2–ESA CCI A, and the subsequent set of products in the three northeastern provinces on 17 May 2016. The TC-2 product produced by the SMAP–AMSR-2–ESA CCI P fusion group product is utilized, and the correlation between the TC-1 and TC-2 products is assessed using ground-based measured data (Figure 14). The integrated TC-1 and TC-2 products have the capability to adjust soil moisture values that are excessively high or low, thereby enhancing the accuracy of soil moisture monitoring outcomes.
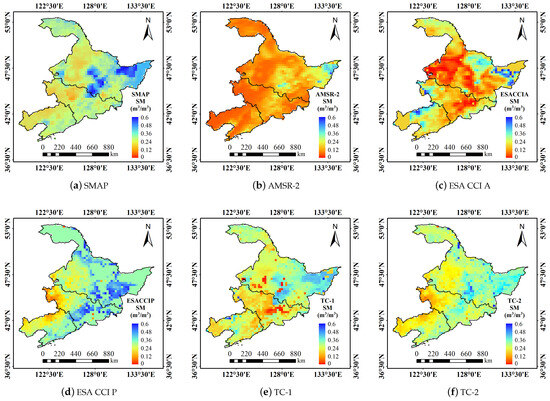
Figure 13.
Soil moisture data products for Northeast China on 5 June 2016.
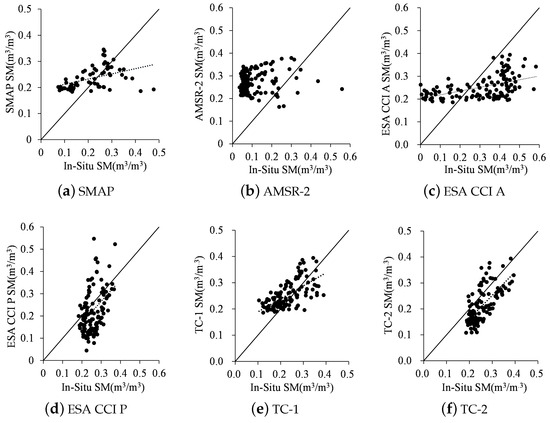
Figure 14.
A comparative analysis of remote sensing soil moisture products and ground-based measurements.
To assess the correlation between product data and ground monitoring data, the ground monitoring data obtained from the Dehui Farmland Soil Moisture Observation Network were utilized for validation purposes. The Dehui farmland soil moisture observation site exhibits consistent vegetation coverage, primarily consisting of corn crops, with minimal variation in elevation and spanning an area of 36 km × 36 km. The area can serve as a testing site for passive microwave remote sensing soil moisture products [33]. Simultaneously, for the purpose of enhancing analysis and processing efficiency, the spatial resolution of the aforementioned soil moisture products has been harmonized and standardized to 25 km. Based on the pixel positions of the observation network encompassed by the soil moisture products in the study area, the study calculated the daily average values of the station falling within the pixel and the corresponding position data of the product.
Figure 14 depicts a scatter plot illustrating the comparison between soil moisture products and ground-measured data. In Figure 14e,f, TC-1 and TC-2 demonstrate a good fit with the measured data and exhibit superior characteristics compared to the SMAP, AMSR-2, ESA CCI A, and ESA CCI P products.
As indicated in Table 3, the correlation coefficient (R = 0.44) between the ESA CCI P product and the ground-measured data is relatively high. Additionally, the bias (0.033), root mean square error (RMSE = 0.093), and unbiased root mean square error (ubRMSE = 0.087) are all comparatively low. These results suggest that the ESA CCI P product data are more precise within the specified study area. While the correlation coefficient between the ESA CCI A product and the ground-measured data stands at R = 0.5, the root mean square error (RMSE) is 0.15, and the unbiased root mean square error (ubRMSE) is 0.14. These values suggest that the ESA CCI A product exhibits a notable level of uncertainty. The correlation coefficient (R) of the SMAP product is 0.43, indicating a 2% decrease compared to the ESA CCI P product. The RMSE of 0.083 and ubRMSE of 0.08 for the SMAP product are both lower than the corresponding values for the ESA CCI P product. This suggests that the SMAP product yields more reliable results for monitoring soil moisture in the study area. The correlation coefficient (R = 0.17) between the AMSR-2 product and the ground-measured data suggests that there is room for improvement in the application accuracy of the AMSR-2 product within the study area. The TC-1 product is derived from the integration of SMAP, AMSR-2, and ESA CCI A products. The correlation coefficient with ground-measured data is R = 0.65, indicating a 51% increase compared to SMAP, AMSR-2, and ESA CCI A, and a 282% increase compared to ESA CCI P. The TC-2 product is derived from the integration of SMAP, AMSR-2, and ESA CCI P products, with respective contributions of 23%, 48%, and 29%. The correlation coefficient with the ground-measured data is R = 0.7, surpassing that of SMAP, AMSR-2, ESA CCI A, and ESA CCI P. The improvements were 63%, 311%, 40%, and 59%, respectively, suggesting that fusion techniques can significantly enhance the accuracy of the product. Furthermore, the correlation coefficient between the TC-2 product and the ground-measured data is 7.7% greater than that of the TC-1 product. The potential explanation for this lies in the enhanced precision of soil moisture monitoring in the study area by the ESA CCI P product compared to the ESA CCI A product, which exhibits a high incidence of missing values in the same region. Consequently, the fused TC-1 product’s accuracy is compromised relative to the TC-2 product.
Table 3.
The validation results for soil moisture products.
5. Conclusions
This study employs the triple collocation (TC) method to assess the standard deviation of errors in remote sensing soil moisture products and to investigate the uncertainty associated with these products. The fusion weights obtained from the error standard deviation are utilized for data fusion. Ground-measured data served as the reference point for assessing the precision of remote sensing soil moisture products and fusion products. This evaluation was conducted through the application of conventional statistical assessment metrics, such as the correlation coefficient, average deviation, root mean square error (RMSE), and unbiased root mean square error (ubRMSE). The results indicate that, (1) Among various land use types, ESA CCI P demonstrates a relatively high average value with moderate fluctuations. The sequence of mean values is as follows: ESA CCI P, SMAP, AMSR-2, and ESA CCI A. It is noteworthy that there is a higher level of uncertainty in the study area for ESA CCI A data, potentially attributed to the higher incidence of missing data in the study area within ESA CCI A products. (2) The fusion of thermal and optical remote sensing data results in a soil moisture product that exhibits enhanced accuracy. A statistically significant correlation with the ground-measured data was observed at a confidence level of 95%. The correlation coefficient between the TC-1 product derived from the integration of SMAP, AMSR-2, and ESA CCI A products and the ground-based measurements is 0.65. Similarly, the correlation coefficient between the TC-2 product obtained through the fusion of SMAP, AMSR-2, and ESA CCI P products and the ground-based measurements is also 0.65. The correlation coefficient is 0.7, and the TC-2 products exhibit a 7.7% increase compared to the TC-1 products. The findings indicate that the amalgamated product enhances the precision of ground soil moisture data detection and offers a more precise benchmark for monitoring soil moisture in the research area.
Author Contributions
Conceptualization, C.W. (Chunnuan Wang), C.W. (Chunmei Wang), T.Y. and X.G.; methodology, Q.X., X.Z. and C.W. (Chunmei Wang); software, C.W. (Chunnuan Wang), Q.L., L.L. and M.L.; validation, M.R., Q.X. and L.Z.; formal analysis, J.L. and X.Q.; data curation, C.W. (Chunnuan Wang); writing—original draft preparation, C.W. (Chunnuan Wang); writing—review and editing, Q.X., X.Z., C.W. (Chunmei Wang) and J.Y. All authors have read and agreed to the published version of the manuscript.
Funding
This research was funded by the Major Project of High Resolution Earth Observation System (grant number 30-Y60B01-9003-22/23), the Common Application Support Platform for National Civil Space Infrastructure Land Observation Satellites (grant number 2017-000052-73-01-001735), the Natural Science Foundation (grant number 42301367), and the Natural Science Foundation of Shandong Province (grant number ZR2022QD138).
Institutional Review Board Statement
Not applicable.
Informed Consent Statement
Not applicable.
Data Availability Statement
The SMAP soil moisture data can be downloaded from https://code.earthengine.google.com/ (accessed on 20 March 2024). The AMSR-2 and ESA CCI data can be downloaded from FTP station with a user’s account. The GlobeLand30 data can be downloaded from The precipitation data can be downloaded from https://data.cma.cn/ (accessed on 20 March 2024).
Acknowledgments
Thanks to the supporters and maintainers of the free dataset used in the article.
Conflicts of Interest
The authors declare no conflicts of interest.
References
- Zhao, W.; Wen, F.; Cai, J. Methods, progresses, and challenges of passive microwave soil moisture spatial downscaling. Natl. Remote Sens. Bull. 2022, 26, 1699–1722. [Google Scholar] [CrossRef]
- Zheng, M.; Liu, Z.; Xu, Z.; Li, J.; Sun, J. Research Progress of Soil Moisture Estimation Based on Microwave Remote Sensing. Acta Pedol. Sin. 2023, 61, 16–28. [Google Scholar]
- Kawanishi, T.; Sezai, T.; Ito, Y.; Imaoka, K.; Takeshima, T.; Ishido, Y.; Shibata, A.; Miura, M.; Inahata, H.; Spencer, R.W. The Advanced Microwave Scanning Radiometer for the Earth Observing System (AMSR-E), NASDA’s contribution to the EOS for global energy and water cycle studies. IEEE Trans. Geosci. Remote Sens. 2003, 41, 184–194. [Google Scholar] [CrossRef]
- Entekhabi, D.; Njoku, E.; O’Neill, P.; Spencer, M.; Jackson, T.; Entin, J.; Im, E.; Kellogg, K. The soil moisture active/passive mission (SMAP). In Proceedings of the IGARSS 2008—2008 IEEE International Geoscience and Remote Sensing Symposium, Boston, MA, USA, 7–11 July 2008; Volume 3, pp. III-1–III-4. [Google Scholar]
- Liu, Y.Y.; Dorigo, W.A.; Parinussa, R.; de Jeu, R.A.; Wagner, W.; McCabe, M.F.; Evans, J.; Van Dijk, A. Trend-preserving blending of passive and active microwave soil moisture retrievals. Remote Sens. Environ. 2012, 123, 280–297. [Google Scholar] [CrossRef]
- Wang, C.; Gu, X.; Zhou, X.; Yang, J.; Yu, T.; Tao, Z.; Gao, H.; Liu, Q.; Zhan, Y.; Wei, X.; et al. Chinese Soil Moisture Observation Network and Time Series Data Set for High Resolution Satellite Applications. Sci. Data 2023, 10, 424. [Google Scholar] [CrossRef] [PubMed]
- Zeng, J.; Li, Z.; Chen, Q.; Bi, H.; Qiu, J.; Zou, P. Evaluation of remotely sensed and reanalysis soil moisture products over the Tibetan Plateau using in-situ observations. Remote Sens. Environ. 2015, 163, 91–110. [Google Scholar] [CrossRef]
- Cui, C.; Xu, J.; Zeng, J.; Chen, K.S.; Bai, X.; Lu, H.; Chen, Q.; Zhao, T. Soil moisture mapping from satellites: An intercomparison of SMAP, SMOS, FY3B, AMSR2, and ESA CCI over two dense network regions at different spatial scales. Remote Sens. 2017, 10, 33. [Google Scholar] [CrossRef]
- Albergel, C.; De Rosnay, P.; Gruhier, C.; Muñoz-Sabater, J.; Hasenauer, S.; Isaksen, L.; Kerr, Y.; Wagner, W. Evaluation of remotely sensed and modelled soil moisture products using global ground-based in situ observations. Remote Sens. Environ. 2012, 118, 215–226. [Google Scholar] [CrossRef]
- Liu, Y.; Yang, Y.; Yue, X. Evaluation of satellite-based soil moisture products over four different continental in-situ measurements. Remote Sens. 2018, 10, 1161. [Google Scholar] [CrossRef]
- Zheng, J.; Zhao, T.; Lü, H.; Zou, D.; Rodriguez-Fernandez, N.; Mialon, A.; Richaume, P.; Xiao, J.; Ma, J.; Fan, L.; et al. Use of a new Tibetan Plateau network for permafrost to characterize satellite-based products errors: An application to soil moisture and freeze/thaw. Remote Sens. Environ. 2024, 300, 113899. [Google Scholar] [CrossRef]
- Fu, H.; Zhou, T.; Sun, C. Evaluation and analysis of AMSR2 and FY3B soil moisture products by an in situ network in cropland on pixel scale in the northeast of China. Remote Sens. 2019, 11, 868. [Google Scholar] [CrossRef]
- González-Zamora, Á.; Sánchez, N.; Martínez-Fernández, J.; Gumuzzio, Á.; Piles, M.; Olmedo, E. Long-term SMOS soil moisture products: A comprehensive evaluation across scales and methods in the Duero Basin (Spain). Phys. Chem. Earth Parts A/B/C 2015, 83, 123–136. [Google Scholar] [CrossRef]
- Han, L.; Wang, C.; Liu, Q.; Wang, G.; Yu, T.; Gu, X.; Zhang, Y. Soil moisture mapping based on multi-source fusion of optical, near-infrared, thermal infrared, and digital elevation model data via the bayesian maximum entropy framework. Remote Sens. 2020, 12, 3916. [Google Scholar] [CrossRef]
- Wu, K.; Ryu, D.; Wagner, W.; Hu, Z. A global-scale intercomparison of Triple Collocation Analysis-and ground-based soil moisture time-variant errors derived from different rescaling techniques. Remote Sens. Environ. 2023, 285, 113387. [Google Scholar] [CrossRef]
- Xingwen, L.; Qiaoling, L.; Shuhong, S. Fusion and Downscaling of Multi-Source Remote Sensing Soil Moisture based on 2D Triple-Collocation and Machine Learning Methods. Remote Sens. Technol. Appl. 2024, 38, 1317–1327. [Google Scholar]
- Xie, Q.; Jia, L.; Menenti, M.; Hu, G. Global soil moisture data fusion by Triple Collocation Analysis from 2011 to 2018. Sci. Data 2022, 9, 687. [Google Scholar] [CrossRef]
- Wu, K.; Shu, H.; Nie, L.N.; Jiao, Z. Error analysis of soil moisture based on Triple Collocation method. Remote Sens. Land Resour. 2018, 30, 68–75. [Google Scholar]
- Fascetti, F.; Pierdicca, N.; Pulvirenti, L.; Crapolicchio, R. SMOS, ASCAT, SMAP and ERA soil moisture comparison through the triple and quadruple collocation technique. In Proceedings of the SAR Image Analysis, Modeling, and Techniques XVI, Edinburgh, UK, 26–29 September 2016; SPIE: Bellingham, WA, USA, 2016; Volume 10003, pp. 84–90. [Google Scholar]
- Dorigo, W.A.; Scipal, K.; Parinussa, R.M.; Liu, Y.Y.; Wagner, W.; De Jeu, R.A.; Naeimi, V. Error characterisation of global active and passive microwave soil moisture datasets. Hydrol. Earth Syst. Sci. 2010, 14, 2605–2616. [Google Scholar] [CrossRef]
- Zheng, X.; Feng, Z.; Xu, H.; Sun, Y.; Bai, Y.; Li, B.; Li, L.; Zhao, X.; Zhang, R.; Jiang, T.; et al. Performance of multi-source passive microwave soil moisture products in maize cultivation areas of Northeast China. IEEE J. Sel. Top. Appl. Earth Obs. Remote Sens. 2020, 13, 2451–2460. [Google Scholar] [CrossRef]
- Santi, E.; Paloscia, S.; Pettinato, S.; Entekhabi, D.; Alemohammad, S.H.; Konings, A.G. Integration of passive and active microwave data from SMAP, AMSR2 and Sentinel-1 for Soil Moisture monitoring. In Proceedings of the 2016 IEEE International Geoscience and Remote Sensing Symposium (IGARSS), Beijing, China, 10–15 July 2016; pp. 5252–5255. [Google Scholar]
- Chan, S.K.; Bindlish, R.; O’Neill, P.; Jackson, T.; Njoku, E.; Dunbar, S.; Chaubell, J.; Piepmeier, J.; Yueh, S.; Entekhabi, D.; et al. Development and assessment of the SMAP enhanced passive soil moisture product. Remote Sens. Environ. 2018, 204, 931–941. [Google Scholar] [CrossRef]
- Kachi, M.; Imaoka, K.; Fujii, H.; Shibata, A.; Kasahara, M.; Iida, Y.; Ito, N.; Nakagawa, K.; Shimoda, H. Status of GCOM-W1/AMSR2 development and science activities. In Proceedings of the Sensors, Systems, and Next-Generation Satellites XII, Cardiff, UK, 15–18 September 2008; SPIE: Bellingham, WA, USA, 2008; Volume 7106, pp. 200–207. [Google Scholar]
- Kachi, M.; Hori, M.; Maeda, T.; Imaoka, K. Status of validation of AMSR2 on board the GCOM-W1 satellite. In Proceedings of the 2014 IEEE Geoscience and Remote Sensing Symposium, Quebec City, QC, Canada, 13–18 July 2014; pp. 110–113. [Google Scholar]
- Plummer, S.; Lecomte, P.; Doherty, M. The ESA climate change initiative (CCI): A European contribution to the generation of the global climate observing system. Remote Sens. Environ. 2017, 203, 2–8. [Google Scholar] [CrossRef]
- González-Zamora, Á.; Sánchez, N.; Pablos, M.; Martínez-Fernández, J. CCI soil moisture assessment with SMOS soil moisture and in situ data under different environmental conditions and spatial scales in Spain. Remote Sens. Environ. 2019, 225, 469–482. [Google Scholar] [CrossRef]
- Product User Guide. ESA Climate Change Initiative Plus Soil Moisture; EODC Earth Observation Data Centre for Water Resources Monitoring GmbH: Wien, Austria, 2022. [Google Scholar]
- Gruber, A.; Scanlon, T.; van der Schalie, R.; Wagner, W.; Dorigo, W. Evolution of the ESA CCI Soil Moisture climate data records and their underlying merging methodology. Earth Syst. Sci. Data 2019, 11, 717–739. [Google Scholar] [CrossRef]
- Liu, Y.Y.; Parinussa, R.; Dorigo, W.A.; De Jeu, R.A.; Wagner, W.; Van Dijk, A.; McCabe, M.F.; Evans, J. Developing an improved soil moisture dataset by blending passive and active microwave satellite-based retrievals. Hydrol. Earth Syst. Sci. 2011, 15, 425–436. [Google Scholar] [CrossRef]
- Wagner, W.; Dorigo, W.; De Jeu, R.; Fernandez, D.; Benveniste, J.; Haas, E.; Ertl, M. Fusion of active and passive microwave observations to create an essential climate variable data record on soil moisture. ISPRS Ann. Photogramm. Remote Sens. Spat. Inf. Sci. 2012, 1, 315–321. [Google Scholar] [CrossRef]
- Dorigo, W.; Wagner, W.; Albergel, C.; Albrecht, F.; Balsamo, G.; Brocca, L.; Chung, D.; Ertl, M.; Forkel, M.; Gruber, A.; et al. ESA CCI Soil Moisture for improved Earth system understanding: State-of-the art and future directions. Remote Sens. Environ. 2017, 203, 185–215. [Google Scholar] [CrossRef]
- Bai, Y.; Meng, Z.; Zhao, K.; Zheng, X.; Jiang, T. Pixel-scale soil moisture monitoring network and its preliminary validation of L-band soil moisture products. Remote Sens. Technol. Appl. 2018, 33, 78–87. [Google Scholar]
- Li, B.; Wang, C.; Gu, X.; Zhou, X.; Ma, M.; Li, L.; Feng, Z.; Ding, T.; Li, X.; Jiang, T.; et al. Accuracy calibration and evaluation of capacitance-based soil moisture sensors for a variety of soil properties. Agric. Water Manag. 2022, 273, 107913. [Google Scholar] [CrossRef]
- Wang, C.; Gu, X.; Wang, C.; Yang, J.; Lu, Y.; Chen, Z. Study on Optimal Sampling Analysis of Soil Moisture at Field Scale for Remote Sensing Applications. Atmosphere 2023, 14, 149. [Google Scholar] [CrossRef]
- Chen, J.; Chen, J. GlobeLand30: Operational global land cover mapping and big-data analysis. Sci. China Earth Sci 2018, 61, 1533–1534. [Google Scholar] [CrossRef]
- Yu, Q.; Hu, Q.; van Vliet, J.; Verburg, P.H.; Wu, W. GlobeLand30 shows little cropland area loss but greater fragmentation in China. Int. J. Appl. Earth Obs. Geoinf. 2018, 66, 37–45. [Google Scholar] [CrossRef]
- Arsanjani, J.J.; Tayyebi, A.; Vaz, E. GlobeLand30 as an alternative fine-scale global land cover map: Challenges, possibilities, and implications for developing countries. Habitat Int. 2016, 55, 25–31. [Google Scholar] [CrossRef]
- McColl, K.A.; Vogelzang, J.; Konings, A.G.; Entekhabi, D.; Piles, M.; Stoffelen, A. Extended triple collocation: Estimating errors and correlation coefficients with respect to an unknown target. Geophys. Res. Lett. 2014, 41, 6229–6236. [Google Scholar] [CrossRef]
- Chen, F.; Crow, W.T.; Colliander, A.; Cosh, M.H.; Jackson, T.J.; Bindlish, R.; Reichle, R.H.; Chan, S.K.; Bosch, D.D.; Starks, P.J.; et al. Application of triple collocation in ground-based validation of soil moisture active/passive (SMAP) level 2 data products. IEEE J. Sel. Top. Appl. Earth Obs. Remote Sens. 2016, 10, 489–502. [Google Scholar] [CrossRef]
- Gruber, A.; Su, C.H.; Zwieback, S.; Crow, W.; Dorigo, W.; Wagner, W. Recent advances in (soil moisture) triple collocation analysis. Int. J. Appl. Earth Obs. Geoinf. 2016, 45, 200–211. [Google Scholar] [CrossRef]
- Ji, S.; So, H.; Li, Y.; Pa, X.; Ji, H. Data fusion and evaluation of soil moisture products from FY-3B/3C microwave remote sensing in Inner Mongolia. Chin. J. Agrometeorol. 2020, 41, 529–538. [Google Scholar]
Disclaimer/Publisher’s Note: The statements, opinions and data contained in all publications are solely those of the individual author(s) and contributor(s) and not of MDPI and/or the editor(s). MDPI and/or the editor(s) disclaim responsibility for any injury to people or property resulting from any ideas, methods, instructions or products referred to in the content. |
© 2024 by the authors. Licensee MDPI, Basel, Switzerland. This article is an open access article distributed under the terms and conditions of the Creative Commons Attribution (CC BY) license (https://creativecommons.org/licenses/by/4.0/).