Article

Correlation of Rate of TEC Index and Spread F over European Ionosondes

by
Krishnendu Sekhar Paul
1,
Mehdi Hasan Rafi
2,
Haris Haralambous
1,3,* and
Mohammad Golam Mostafa
2
1
Frederick Research Center, Nicosia 1036, Cyprus
2
Military Institute of Science and Technology, Dhaka 1216, Bangladesh
3
Department of Electrical Engineering, Computer Engineering and Informatics, School of Engineering, Frederick University, Nicosia 1036, Cyprus
*
Author to whom correspondence should be addressed.
Atmosphere 2024, 15(3), 331; https://doi.org/10.3390/atmos15030331
Submission received: 12 February 2024 / Revised: 29 February 2024 / Accepted: 5 March 2024 / Published: 7 March 2024
(This article belongs to the Special Issue Ionospheric Irregularity)

Abstract

:
One of the most popular indices for monitoring the occurrence and intensity of ionospheric L-band irregularities is the Rate of TEC Index (ROTI). Due to low TEC in the mid-latitude ionosphere, ROTI has received significantly less attention than the equatorial and polar ionosphere. On the other hand, spread F is an established ionogram irregularity signature. The present study aims to correlate ROTI and spread F activity over European Digisonde stations for a low-to-moderate solar activity year (2011). With a focus on the latitude-dependent occurrence, the analysis demonstrates that range spread F (RSF) has been identified for all notable ROTI (>0.15 TECU/min) cases which also coincide with MSTID activity over the stations, suggesting induced gravity waves or polarization electric fields as the driving mechanism for enhanced ROTI activity. The diurnal and seasonal features are also presented. Maximum irregularity occurrence was observed around the 45° N from 18:00 to 05:00 UT with the seasonal maximum occurrence in January. Over lower mid-latitude Digisonde stations (latitude < 45° N), the diurnal and seasonal occurrence was observed from 19:00 to 04:30 UT in July.

1. Introduction

Despite the specification of the ionosphere as a stratified layer in accordance with Chapman’s theory [1], in practice and under specific conditions through various remote sensing techniques, we can observe electron density patches embedded in the surrounding ionosphere. These can appear at all latitudes over the globe and exhibit a large variety of scale sizes, from several centimetres to hundreds of kilometres [2]. The detection and interpretation of ionospheric plasma density irregularities is a challenge since they are generated and influenced by a wide variety of factors, including space weather-induced events as well as diurnal and seasonal ionization variations. Utilizing space-based Global Navigation Satellite System (GNSS) techniques to observe and analyse these irregularities is an established approach based on the impact of these irregularities on GNSS signals. In particular, they impose fluctuations on total electron content (TEC), the total amount of electrons present along the ray path between a radio transmitter and a receiver. Total Electron Content Units (TECUs) [3] is the unit of TEC measurement, and one TECU is equal to 1016 electrons per square metre. TEC can be derived from dual-frequency GNSS measurements [3].
The Rate of Total Electron Content (TEC) Index, or ROTI, is an indicator of such TEC fluctuations. Based on the “frozen” irregularity assumption [4], ionospheric irregularity characteristics do not change within a short period when they encounter the trans-ionospheric electromagnetic satellite links. The fluctuations observed in Rate of TEC (ROT) may be due to the depletions in TEC, i.e., ΔTEC/ΔL, where L is the horizontal irregularity scale length. For low and midlatitude ionosphere, the fluctuations in ROT are due to irregularities with much smaller scale sizes (several hundred meters to 2.5 km), depending on plasma drift velocities. To identify these smaller-scale ionospheric irregularities, ROTI has been calculated based on the standard deviation of ROT. ROTI was first introduced by [4], as a GNSS-based index that characterizes the impact on the trans-ionospheric electromagnetic links based on the severity of the GNSS amplitude and phase fluctuations and identifies dynamic variations in electron density and the spatial scale of such ionospheric irregularities. According to [4], ROTI is defined as the standard deviation of the rate of TEC (ROT) over 5 min and is applied to estimate ionospheric irregularities using a GPS receiver. Typically, this method exploits data from dual-frequency GNSS receivers with regional or global coverage; for instance, the International GNSS Service (IGS) stations, to map ionospheric irregularities. Its main advantage over scintillation indices S4 or σϕ (which necessitate high-rate GNSS signals for their estimation) is that it is calculated based on measurements from standard dual-frequency observations at 30 s sampling. Based on the findings published [4,5], ROTI can be used as a proxy for the presence of ionospheric irregularities. Although a significant number of ROTI studies have been published [6,7,8] with a focus on the equatorial and high-latitude ionosphere, a few studies have addressed the midlatitude ionosphere. Cherniak et al. (2014; 2018) [7,8] used data from over 700 GPS ground stations to track ROTI in the Northern Hemisphere’s high and medium latitudes, between 50° and 90° N geomagnetic, while [6] utilized two chains of GNSS stations located in European and North American regions to examine ROTI at high latitudes. ROTI was proven to have a direct correlation with radio wave scintillations (S4) [9]. The International GNSS Service (IGS) ionospheric working group suggested a new official/operational product for space weather monitoring at high latitudes due to the clear benefit of ROTI as an ionospheric irregularity indicator [8]. The International GNSS Service (IGS) has ensured open access to high-quality GNSS data products since 1994, and provides the products and services in support of the terrestrial reference frame, Earth observation and research, positioning, navigation and timing from 400 worldwide reference stations (https://igs.org/about/ accessed on 25 January 2024). Using an extended array of permanent GNSS stations in regional and worldwide networks, the new product was presented in the form of a ROTI map [7,8]. Compared to its equatorial and polar counterparts, the midlatitude ionosphere is less affected by ionospheric irregularities [10]. Scintillation patches (S4) noted in GNSS trans-ionospheric links, as a consequence of ionospheric irregularities, over the nighttime midlatitude ionosphere, are not as frequent [11] except during disturbed geomagnetic conditions. The midlatitude nighttime F region is characterised by multiple diffused patterns of plasma structure irregularities, which may last from a few minutes to several hours, referred to as midlatitude spread F [12,13,14,15]. Nighttime irregularities (spread F) in the mid-latitude F region are caused by spatial electron density perturbations. According to [16], the Perkins instability [17] is most likely the driver of midlatitude spread F. Perkins (1973) [17] proposed that variation in eastward electric field and/or southward wind in the midlatitude ionosphere can disturb the plasma equilibrium against the Earth’s gravity, giving rise to plasma instability structures, which is a favourable condition for the formation of spread F. One drawback of this mechanism is the growth rate which was shown to be small (~10−4 s) [18]. Therefore, the formation of midlatitude spread F cannot be fully explained by the Perkins instability process. However, the growth rate can be amplified [19,20] by the action of gravity waves and the associated electric field perturbations at the bottomside ionosphere. Past studies [21,22] have presented a possible correlation between medium-scale travelling ionospheric disturbances (MSTIDs) and midlatitude spread F. Furthermore, it was demonstrated [23,24,25] that the coupling between E and F regions contributes to generating and sustaining MSTIDs.
A spread F event may be broadly classified into two categories based on the structure of the spread echoes observed in an ionogram [26]. According to [26], range spread F (RSF) is observed around the low-frequency segments (<2–2.5 MHz) of F-region traces with diffused echoes dispersed over 10 km or more beyond the main echo trace. On other occasions, diffused echoes are mostly observed around the critical frequency of the F trace which is termed Frequency Spread F (FSF). Bowman (1990; 1991) [12,27] suggested that range spreading is associated with the frontal structure of irregularities with a linear extent of around 1000 km or more. On the other hand, frequency spreading is due to diffused echoes scattered from the ionosphere close to the zenith. Additionally, there is a notable latitudinal and longitudinal diversity in the occurrence of midlatitude spread F [28,29,30,31,32]. Past publications [28,29,30,31] indicate that latitudinal variability is recorded over different latitude sectors. Shimazaki (1962) [33] investigated the global latitudinal distribution of spread F occurrence. Paul et al. (2018) [30] have presented comparable findings from the European longitude sector. They examined 2009, 2015, and 2016 ionograms from Athens, Pruhonice, and Nicosia, and reported distinct latitude-based characteristics in spread F occurrence. Based on a comparative statistical study of nighttime spread F occurrence between two European midlatitude stations with a latitudinal difference of approximately 20° over a full solar cycle [31], they also reported a notable difference in spread F occurrence between these two stations. Similar midlatitude spread F statistics over eight European digisonde stations recorded in 2017, 2020, and 2021 were also highlighted recently [32]. In addition, the role of MSTIDs and additional ionogram signatures related to spread F development have been investigated [34,35]. In this study, based on the identification of significant ROTI activity (ROTI > 0.15 TECU/min) [36] over eight Digisonde stations during 2011, the temporal and zonal distribution of ionospheric irregularities over Europe was investigated. A strong correlation between amplitude scintillation (S4) and/or phase scintillation (σφ) with ROTI has been reported [36], and they noted the formation of F region irregularity structure for ROTI > 0.15 TECU/min. We have visually inspected all ionograms from these Digisonde stations at the same period with corresponding ROTI activity over each station and identified the dominant spread F type. The goal was to examine whether there is a dominant spread F type associated with ROTI occurrence and characterize the diurnal, seasonal, and latitudinal variation in the ROTI occurrence associated with this dominant spread F event over the European midlatitude ionosphere.

2. Instruments and Methods

In this study, we have used Digisonde ionograms from the Digital Ionogram DataBase (DIDBase) of the Global Ionospheric Radio Observatory (GIRO) portal (data resolution given in Table 1) and detrended TEC (d-TEC) and ROTI maps over Europe from the Densed Regional and Worldwide International GNSS-TEC observation (DRAWING-TEC) project (https://aer-nc-web.nict.go.jp/GPS/EUROPE/ accessed on 25 January 2024) at 10 min resolution for 2011. The DRAWING-TEC project provides a high-resolution Global, Continental (North America and Europe) and regional (Japan) GNSS TEC map [36]. The available products are absolute TEC, d-TEC, and ROTI maps with 10 min resolution. In the present study, high-resolution d-TEC maps over Europe for 2011 were used to identify the presence of MSTID and the ROTI map was used to identify the high ROTI occurrences over the Digisonde stations. We also examined geomagnetic conditions through the hourly Dst index downloaded from https://wdc.kugi.kyoto-u.ac.jp/dst_final/index.html (accessed on 25 January 2024) website to verify the impact of geomagnetic activity [30].

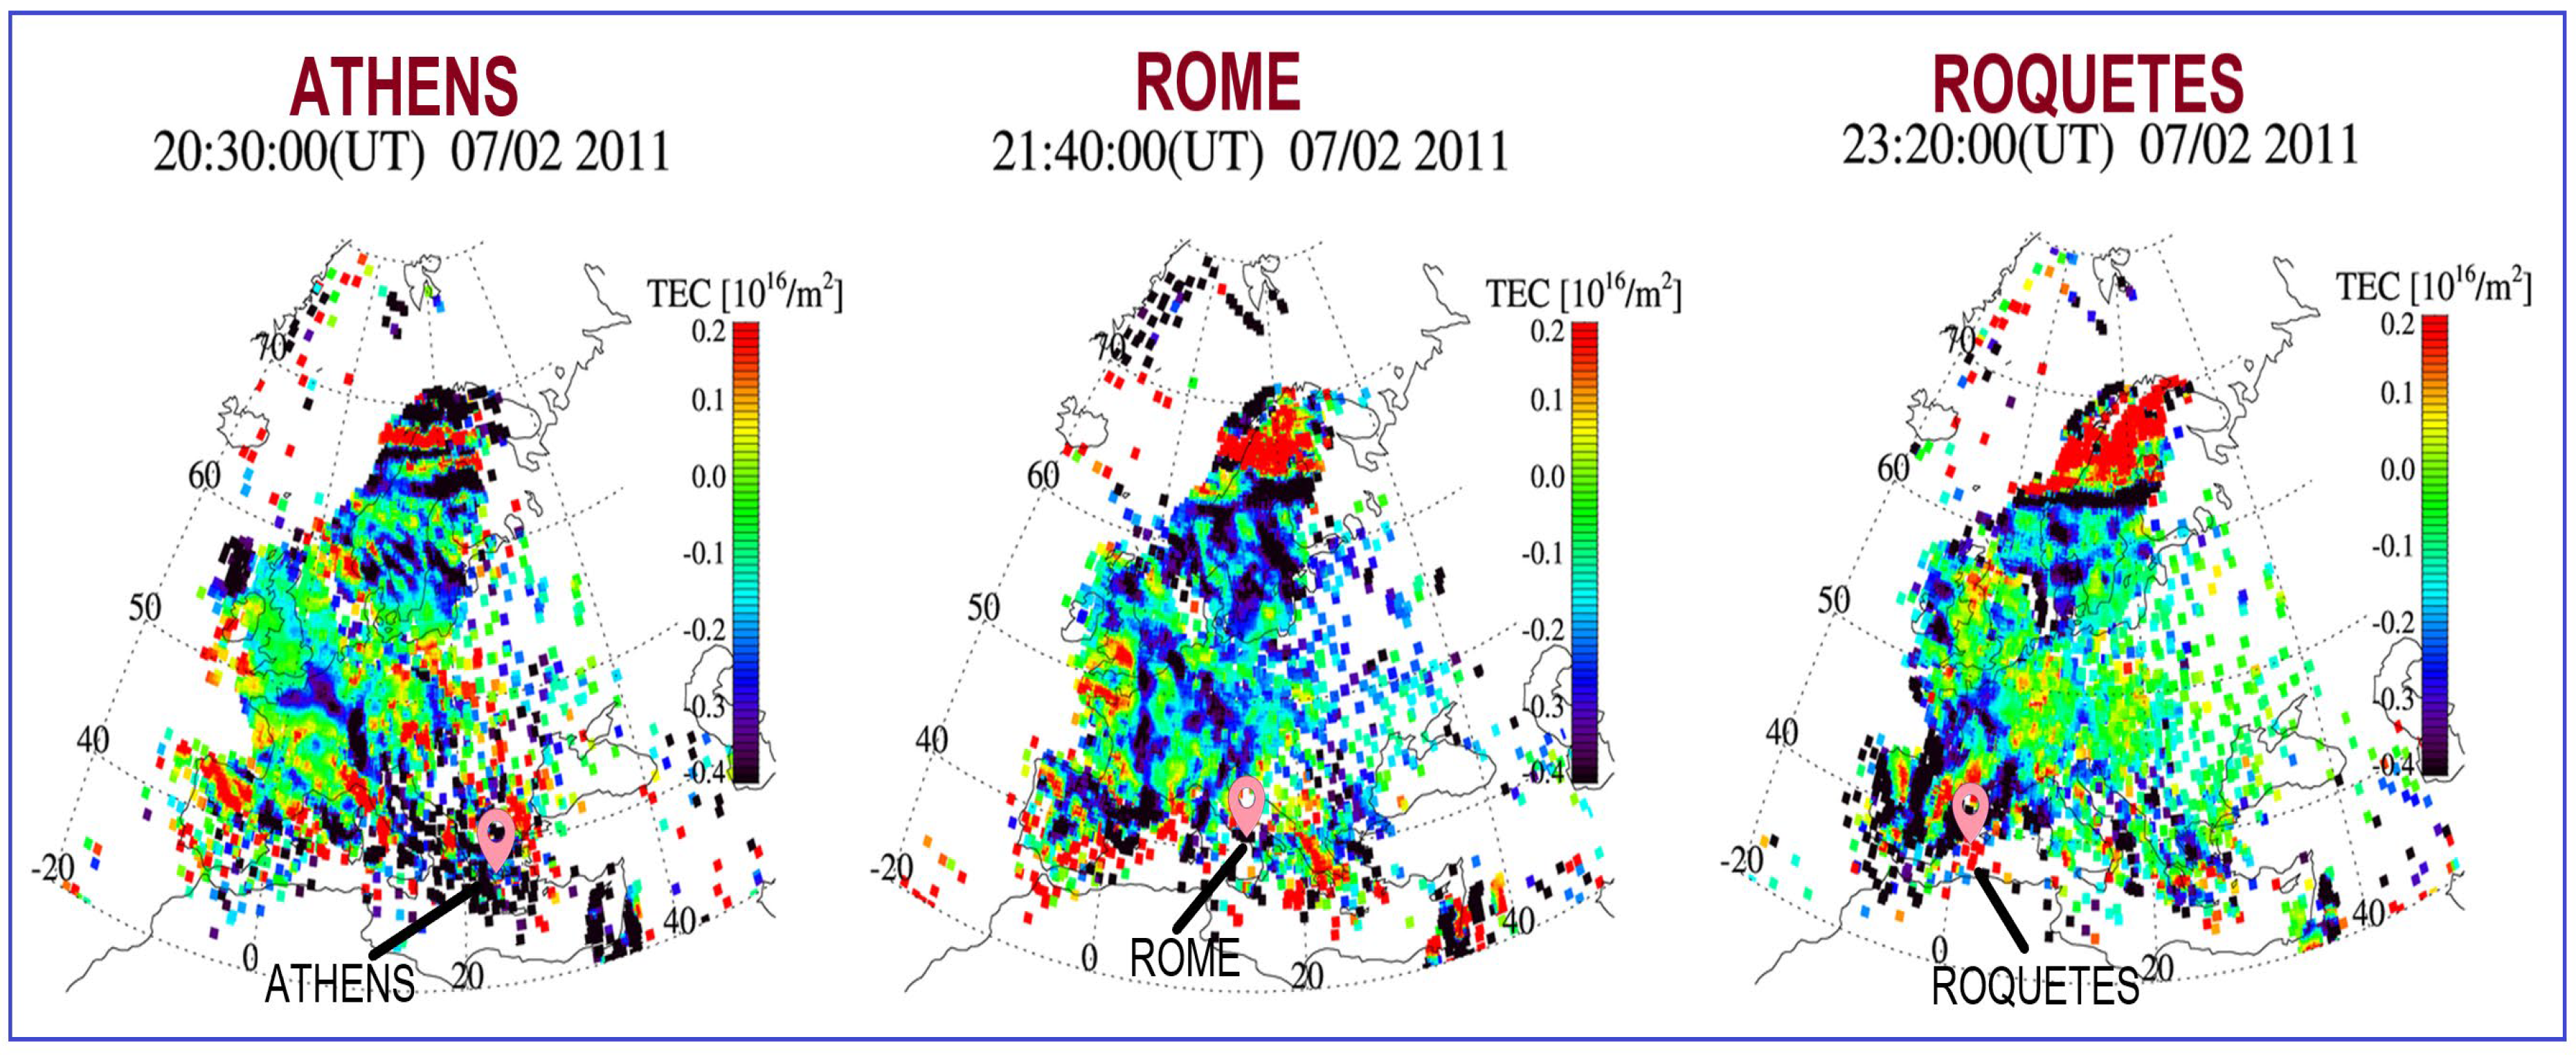
2.1. GPS IGS TEC Map Products

To investigate the collocated ROTI and spread F activity, ROTI and spread F events were identified. This will help researchers to better understand the irregularity dynamics of the midlatitude ionosphere. ROTI TEC maps from the DRAWING-TEC project at 10 min resolution were inspected to identify the ROTI events over the Digisonde stations. The DRAWING-TEC maps are based on slant TEC data estimated from the carrier phase advance measurements from dual-frequency GPS receivers (almost 800 receivers) all over Europe with a sampling interval of 30 s. Slant TEC data for satellite elevation angles of less than 35° are excluded to reduce cycle slips. The selected slant TEC was then multiplied by a slanting factor to obtain its vertical counterpart. A slanting factor (τ0/τ1) was adopted [37] to obtain vertical TEC. According to [37], τ0 is the slab thickness (thickness of the ionosphere 200~300 km) and τ1 is the ray path distance (250 to 450 km). The Rate of TEC or ROT represents the phase fluctuation activity and can be calculated as [4,38]
R O T = T E C k i T E C k 1 i ( t k t k 1 )
In Equation (1), variables i and k represent satellite visibility and the time of epoch. The rate of the TEC Index or ROTI can be represented as a standard deviation of the detrended rate of change of the TEC [4] and can be calculated as
R O T I = R O T 2 R O T 2
Detrended TEC (d-TEC), on the other hand, represents the TEC fluctuation on top of TEC. We have also visually inspected d-TEC maps over Europe for 2011 to identify the presence of MSTIDs when spread F was observed over the Digisonde stations [30,33]. The d-TEC maps were generated from TEC fluctuations extracted by subtracting the 1 h running average (average over ±30 min centred on the corresponding data) from the TEC time series for each pair of satellite and receiver. It must be noted that TEC perturbations encapsulate both temporal and spatial variations. The precision of the relative change in TEC is theoretically 0.01–0.02 TECU (where 1 TECU = 1016 m−2), which corresponds to 1% of the wavelength of GPS signals L1 (0.19 m) and L2 (0.24 m).
For the DRAWING project [39], the average ROTI and d-TEC values were mapped on the ionospheric shell at a 300 km altitude with a pixel size of 0.15° × 0.15° in latitude and longitude. To compensate for the scarcity of data availability, ROTI and d-TEC values in each pixel were smoothed temporally with a running average of 10 min, during which an ionospheric pierce point (IPP) moves approximately 50 km around the zenith of a GPS receiver [39]. In the present work, we have used ROTI (https://aer-nc-web.nict.go.jp/GPS/EUROPE/RMAP/#2011 accessed on 25 January 2024) and d-TEC maps (https://aer-nc-web.nict.go.jp/GPS/EUROPE/MAP/#2011 accessed on 25 January 2024) for 2011, covering Europe between 20° W and 40° E in longitude and between 30° to 75° N in latitude, with a spatial resolution of approximately (80 × 80) km at 30-s intervals (10-min smoothing).

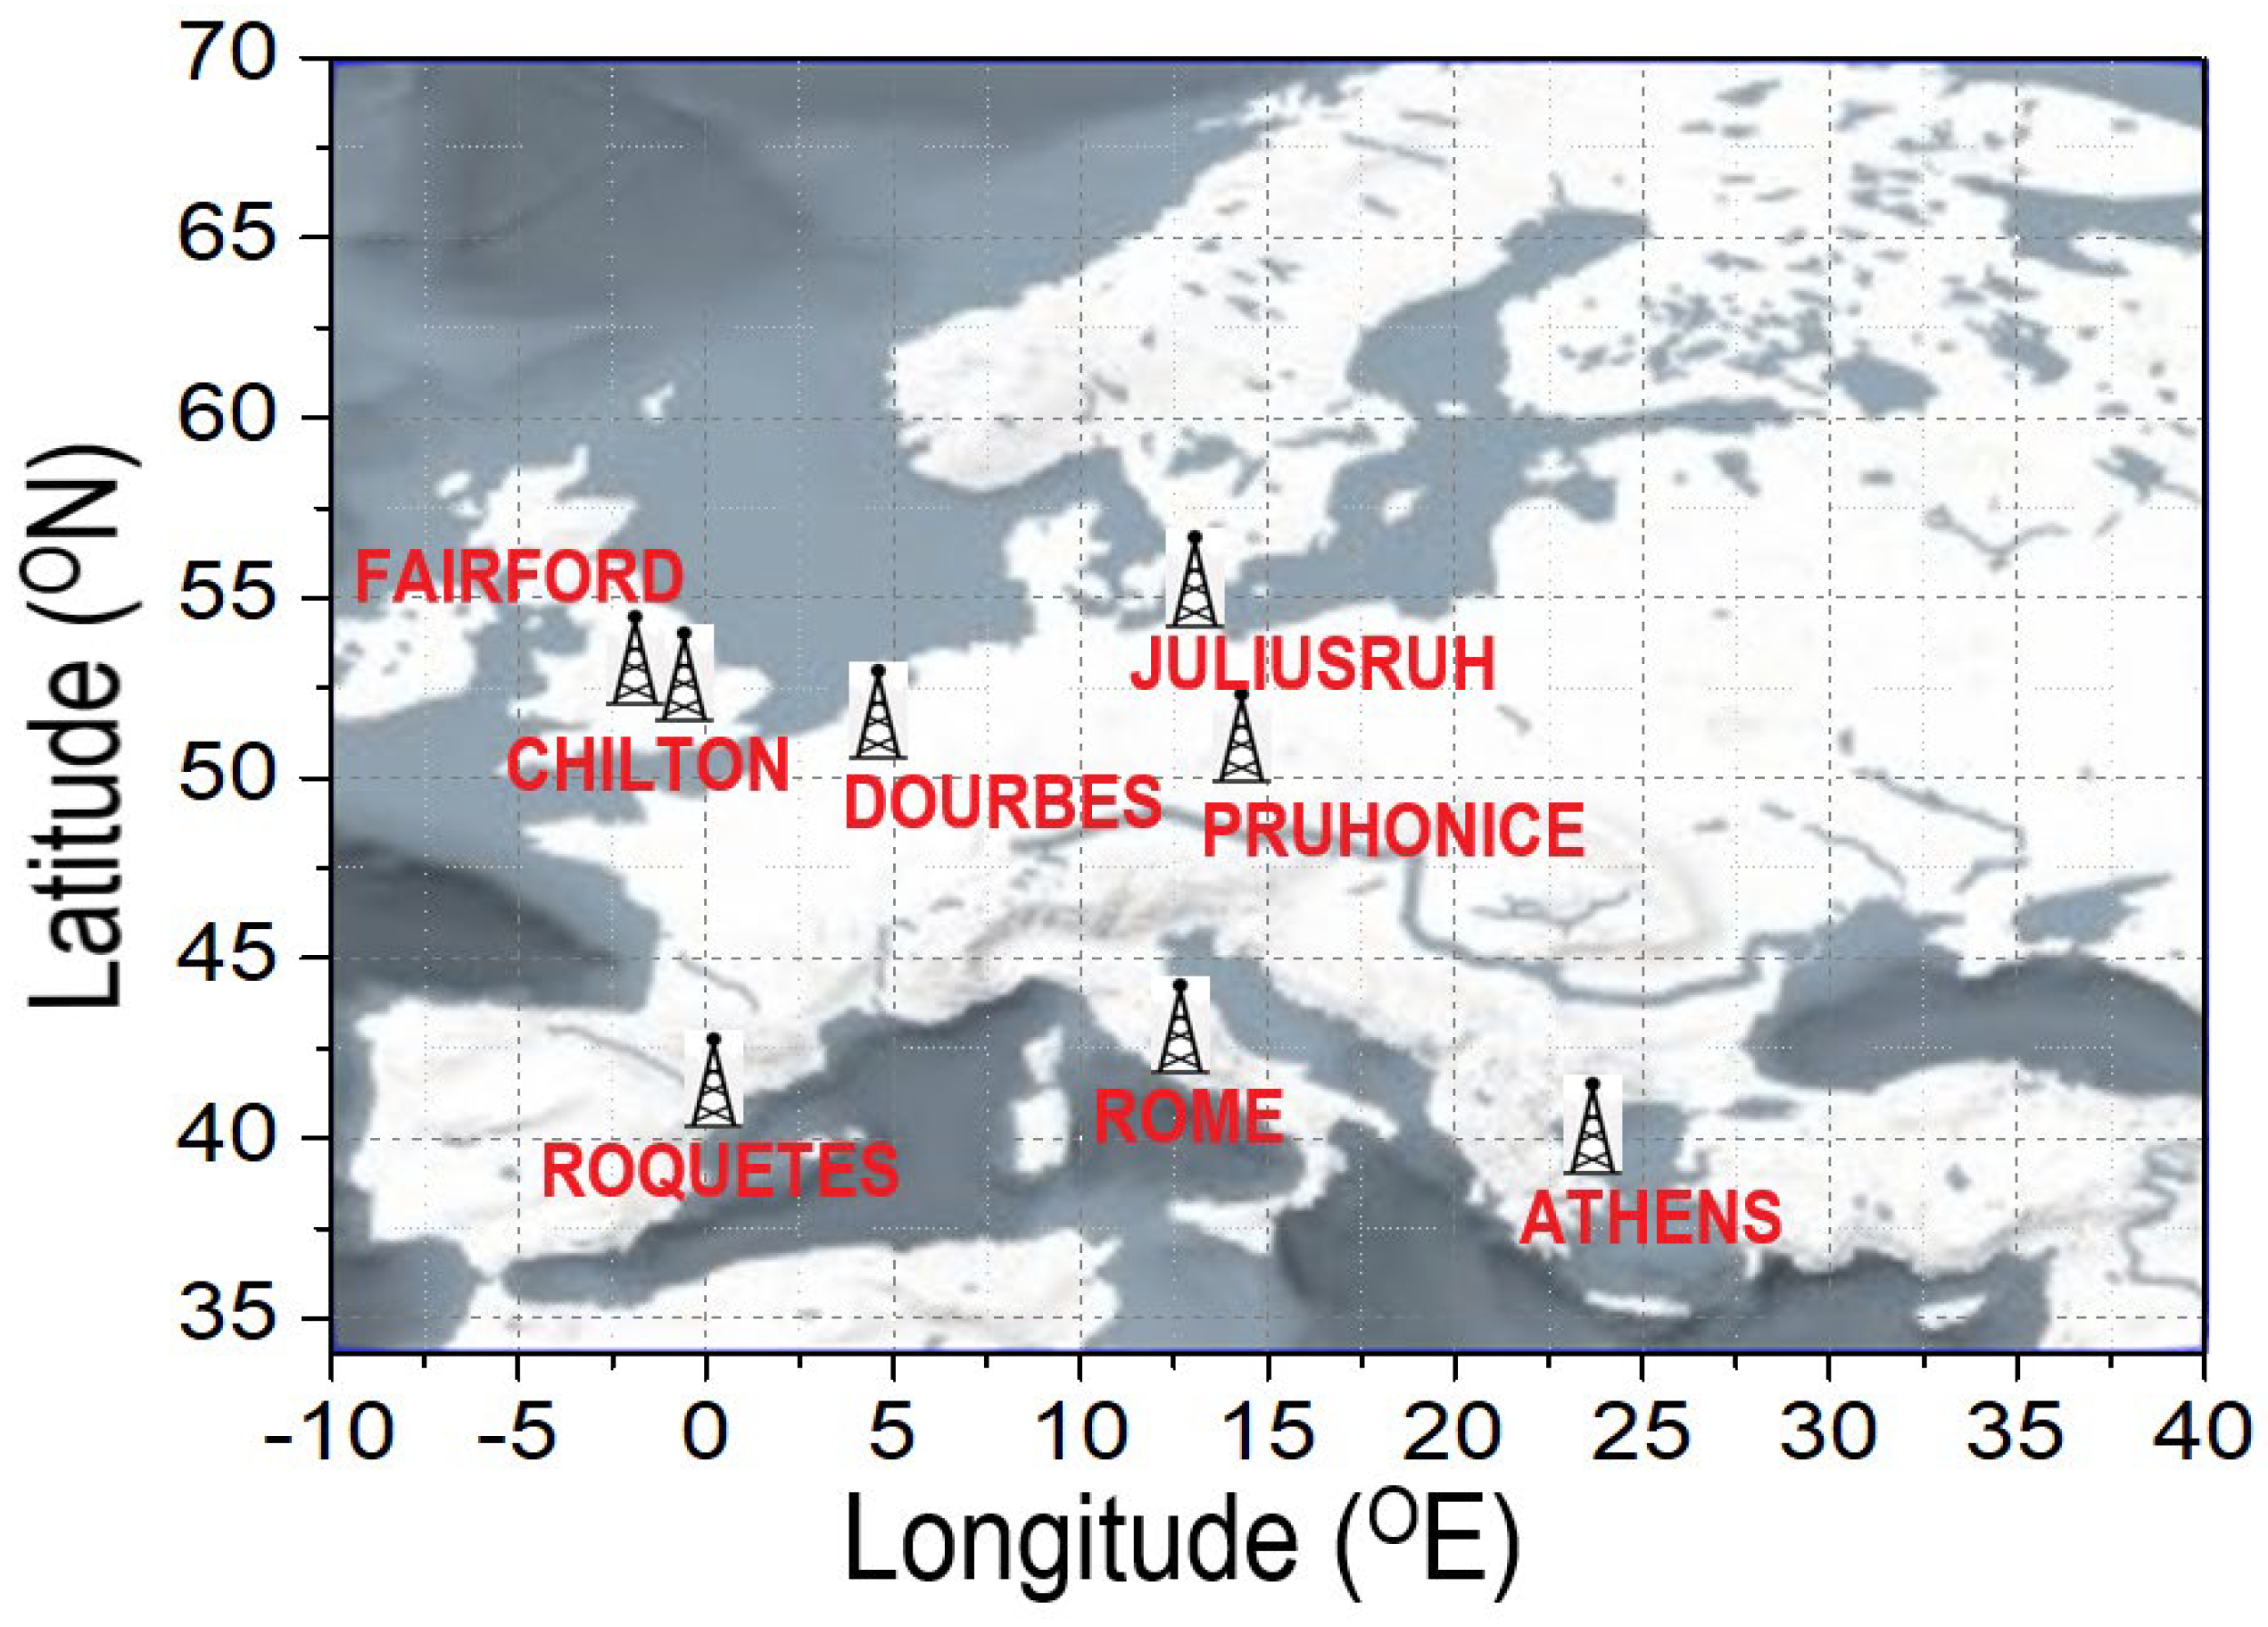
2.2. Digisondes over Europe

Eleven Digisonde stations were operational in 2011 over Europe. Eight of these Digisonde stations were selected for the current study on the basis of data availability for a full year. Within the framework of a spread F activity analysis, the ionograms from eight Digisonde stations were visually inspected. The location and coordinates, station codes, and sampling interval for each Digisonde are given in Table 1 and Figure 1. These ionograms are available on Digital Ionogram DataBase or DIDBase https://lgdc.uml.edu/common/DIDBFastStationList (accessed on 11 February 2024) [40].

3. Results and Discussions

Although many researchers have used GPS-based ROTI as a monitoring index for ionospheric irregularities over the equatorial and the polar ionosphere [6,41,42], over the mid-latitude ionosphere it has been less exploited. Several global-based ROTI mapping studies discussed ROTI features over the mid-latitudes [39,43]. Liu et al. (2020) [44] demonstrated the statistics of the interhemispheric (E-F layer) coupling of ionospheric irregularities in terms of ROTI over mid-latitude ionosphere by using COSMIC radio occultation data and reported a maximum (~70%) occurrence of E and F region irregularities during June in the Northern Hemisphere. In the present study, we have visually identified ROTI activity on European maps for the low-to-moderate solar activity year of 2011. Notable ROTI activity was considered when ROTI > 0.15 TECU/min [36,44]. Ionospheric irregularities in the mid-latitude ionosphere are usually associated with mid-latitude spread F on ionograms as a result of signal scattering from plasma irregularities. Large-scale gravity waves [12], coupling between unstable Es layers and the bottom of the F layer [44], Gradient drift, and Perkins instability [17] are established driving mechanisms responsible for the formation of mid-latitude spread F. The focus of the present study is to correlate L-band GPS-based ROTI with spread F activity. Therefore, as a first step, we have identified ROTI activity on ROTI maps for 2011 over each European Digisonde and subsequently investigated spread F activity over these stations. To examine the latitude dependence [6], we have separated these eight Digisonde stations (as shown in Figure 1) into two distinct regions: the upper mid-latitude region (Latitude > 45° N) with Juliusruh, Fairford, Chilton, Dourbes, and Pruhonice and the low mid-latitude region (Latitude < 45° N) with Roquetes, Rome, and Athens. In the next section, we present and discuss three case studies followed by a diurnal and seasonal analysis.

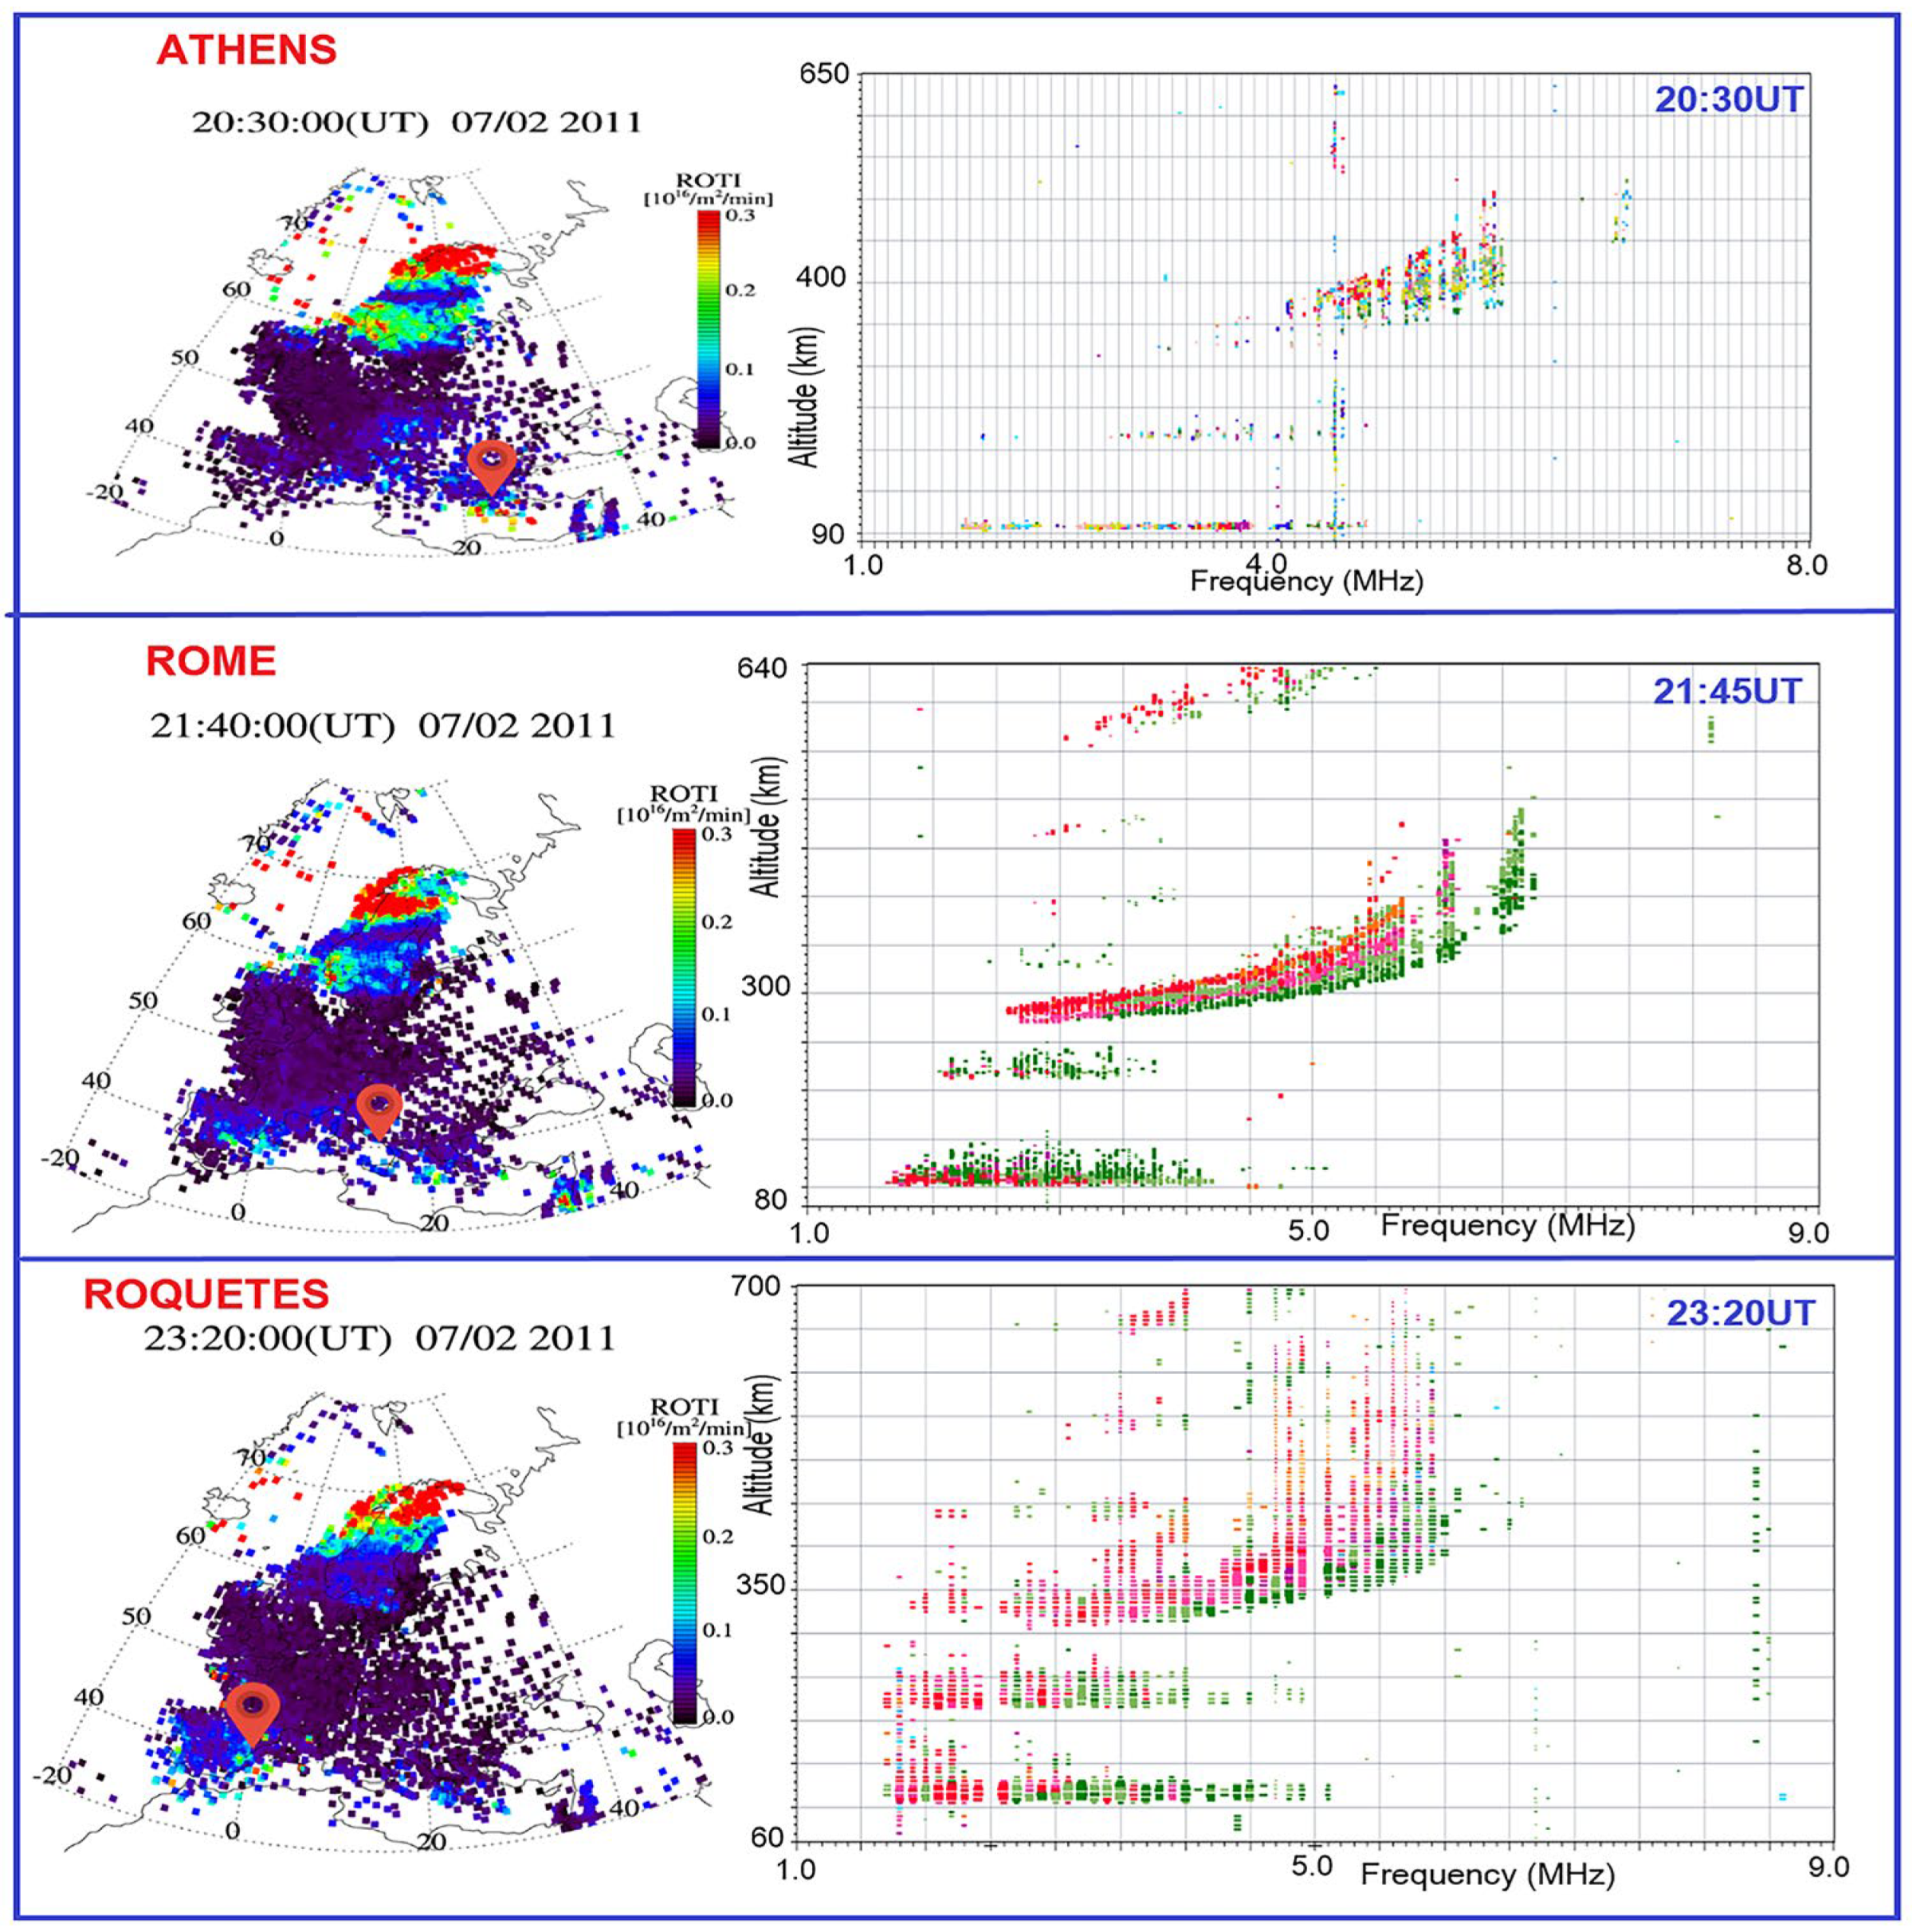
3.1. Case Study: 1 (2–3 July 2011)

On 2–3 July 2011, the low mid-latitude region of the European longitude sector was affected by ionospheric irregularities. The interval 2–3 July 2011 was a geomagnetically quiet period with a minimum Dst value of −25 nT. Notable ROTI activity (>0.15 TECU/min) was observed over Athens, Rome, and Roquetes during nighttime on 2nd July 2011, as depicted in Figure 2. Mid-latitude spread F was also registered over these three stations on 2–3 July 2011. Over Athens, clear ROTI (>0.2 TECU/min) was noted from 19:00 to 22:00 UT on 2 July 2011. RSF spread F was registered in Athens ionograms during this period. Over Rome and Roquetes, clear ROTI activity (>0.15 TECU/min) was noted around 21:00 to 00:20 UT, also associated with range spread F (RSF). Figure 2 provides a snapshot of the GPS-based ROTI map during RSF formation at the same time over Athens at 20:30 UT, Rome around 21:40 UT, and Roquetes at around 23:20 UT. According to [41], spread F formation and ROTI activity are manifested simultaneously, indicating the presence of large-scale ionospheric irregularities ranging from a few metres to tens of kilometres. Sivakandan et al. (2020) [45] reported intense ROTI over the mid-latitude ionosphere transition region over India in synchronism with spread F, confirming ionospheric irregularities on 13 June 2018. Although several authors have reported the concurrence of the high ROTI and spread F over mid-latitudes, the most interesting aspect that has been noted in this case study is the fact that only RSF (not FSF or any other type of spread F) has been identified when high ROTI values have been observed over Athens, Rome, and Roquetes.
We have also considered detrended TEC (d-TEC) maps at the time interval presented in Figure 3. The locations of Athens, Rome and Roquetes in Figure 3 are depicted in pink location markers. In Figure 3, −0.4 to −0.3 TECU fluctuations in d-TEC were noted over all three stations from around 20:30 to 23:20 UT, indicating the presence of MSTIDs [37,46]. MSTID signatures identified on d-TEC maps in conjunction with spread F events has demonstrated that MSTIDs are one of the primary drivers of midlatitude spread F generation [30,33]. Spread F across Japan was also investigated by [47] at the high latitude station of Wakkanai (45.4° N, 141.7° E) and the importance of the polarization electric fields in the generation and the direction of propagation of the MSTIDs was highlighted [37]. Our findings suggest gravity wave-induced MSTIDs, resulting in RSF giving rise to ROTI activity.

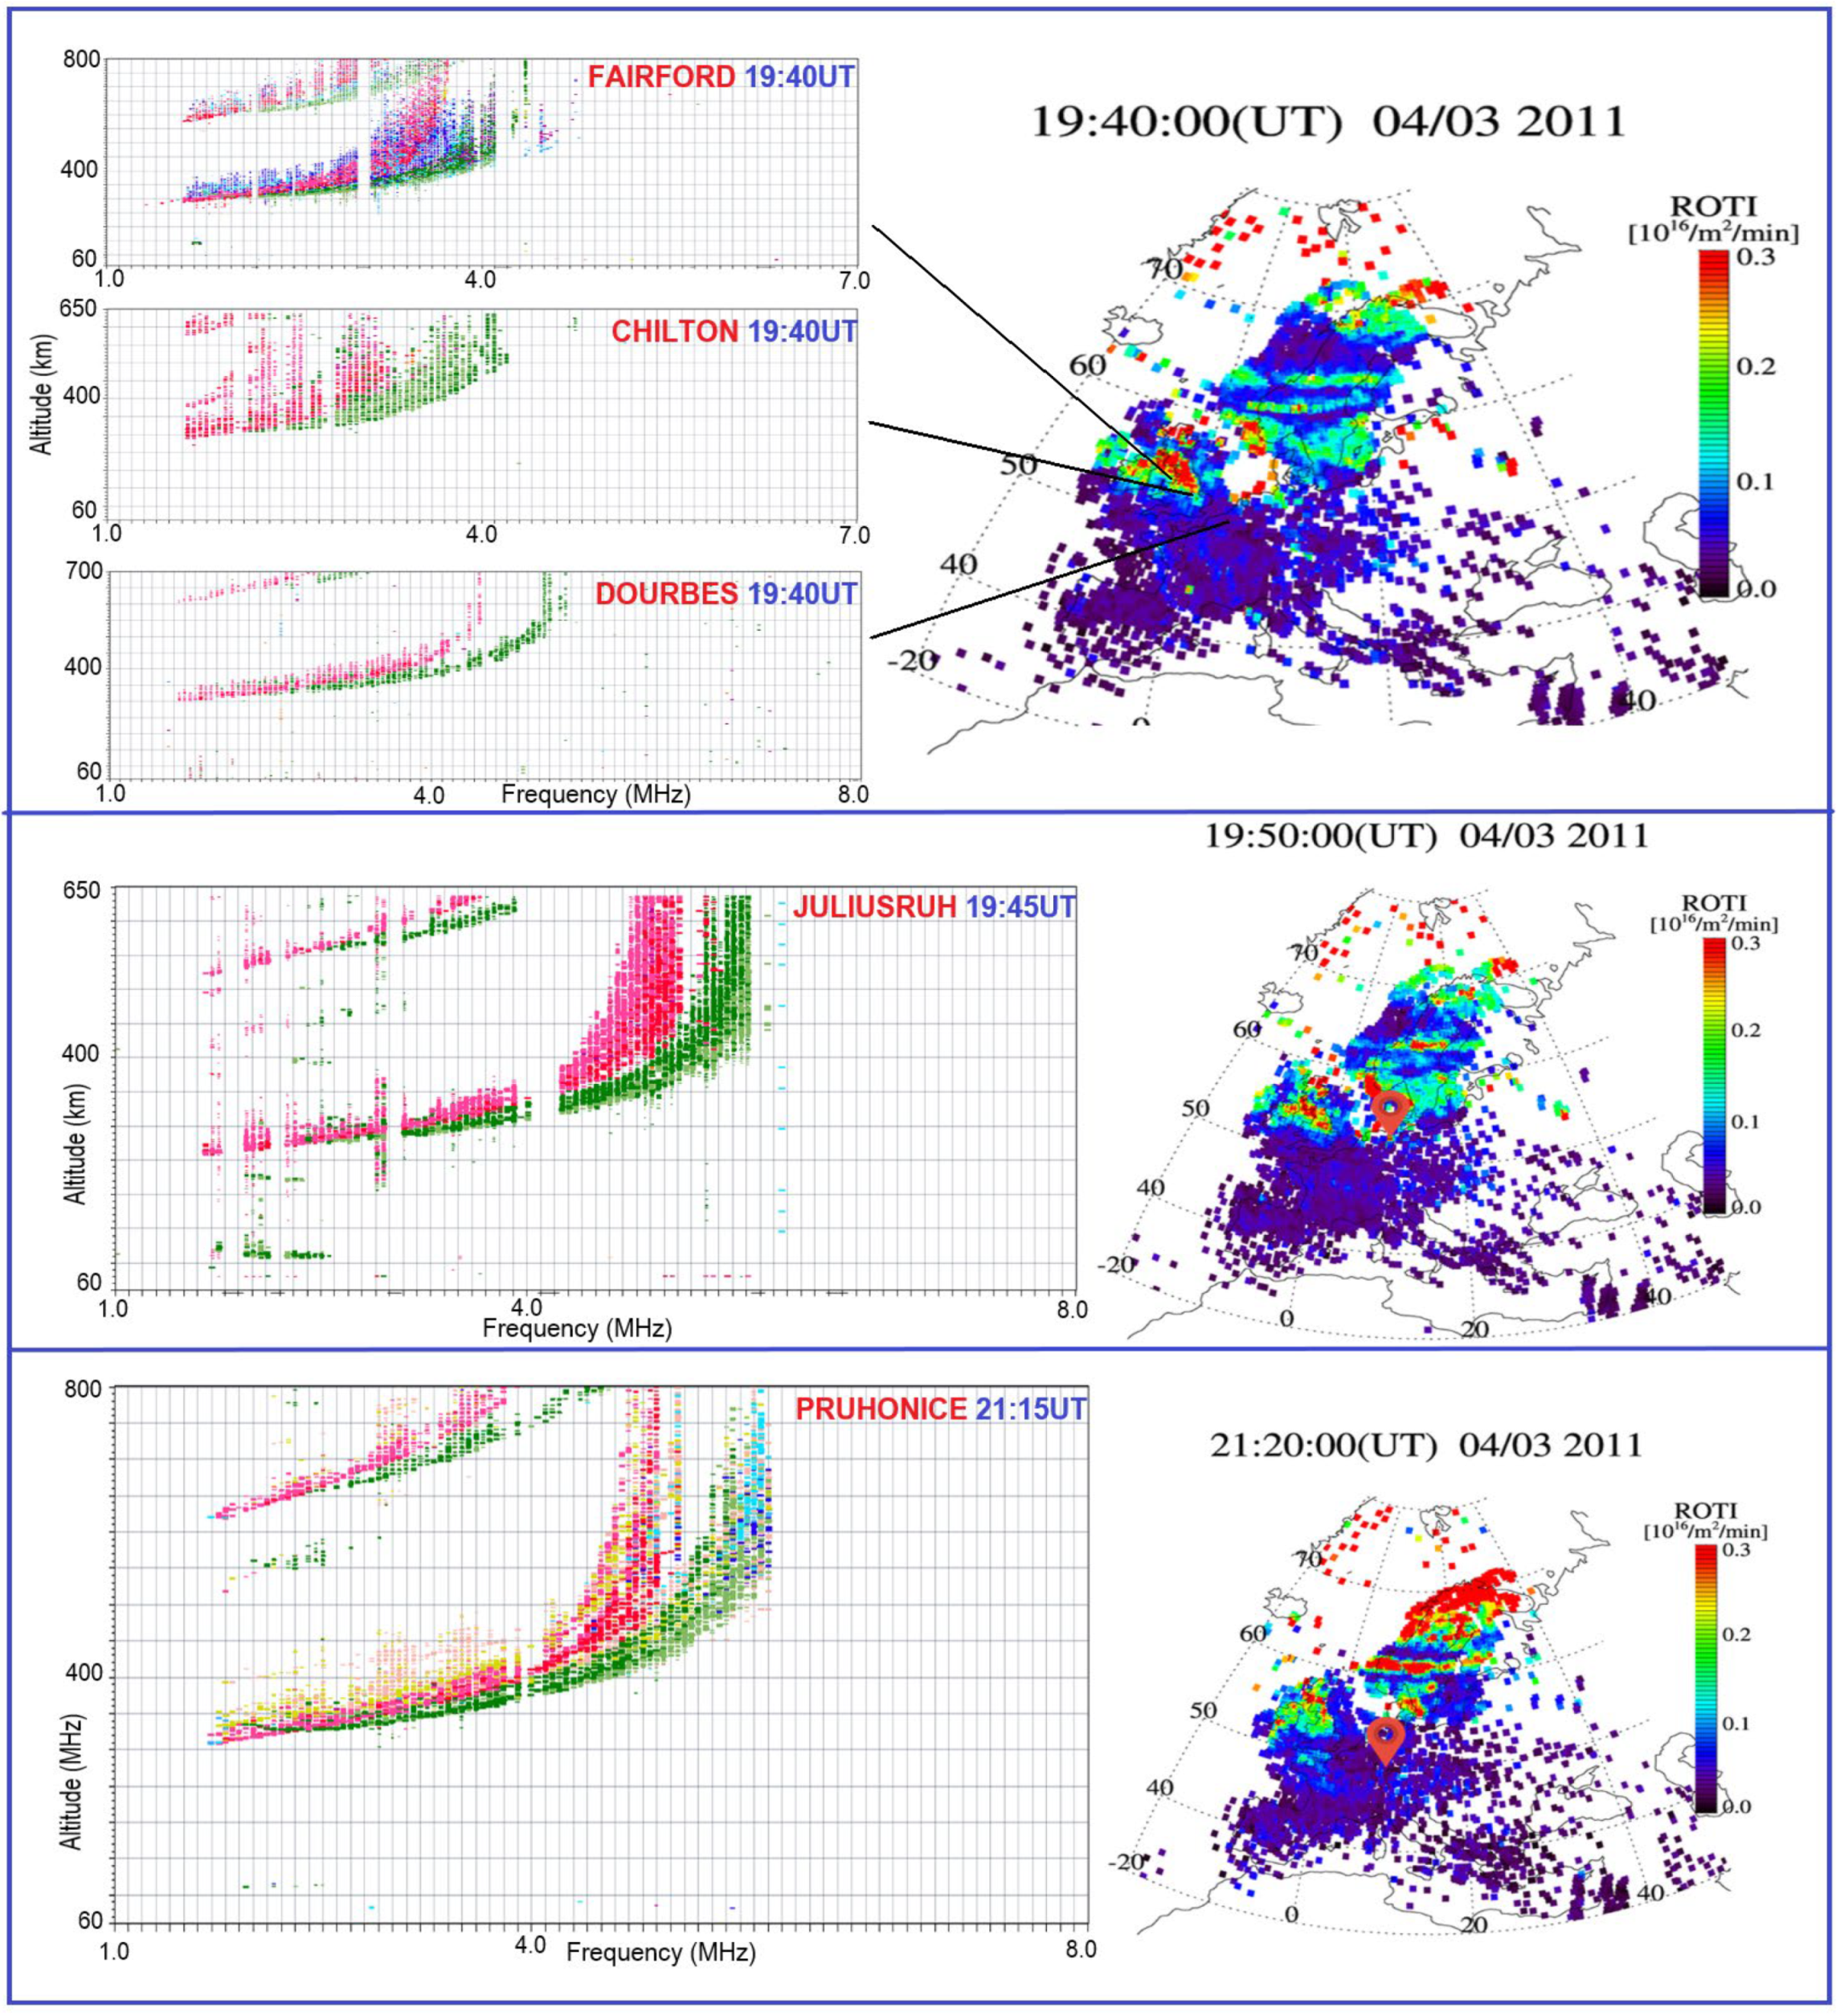
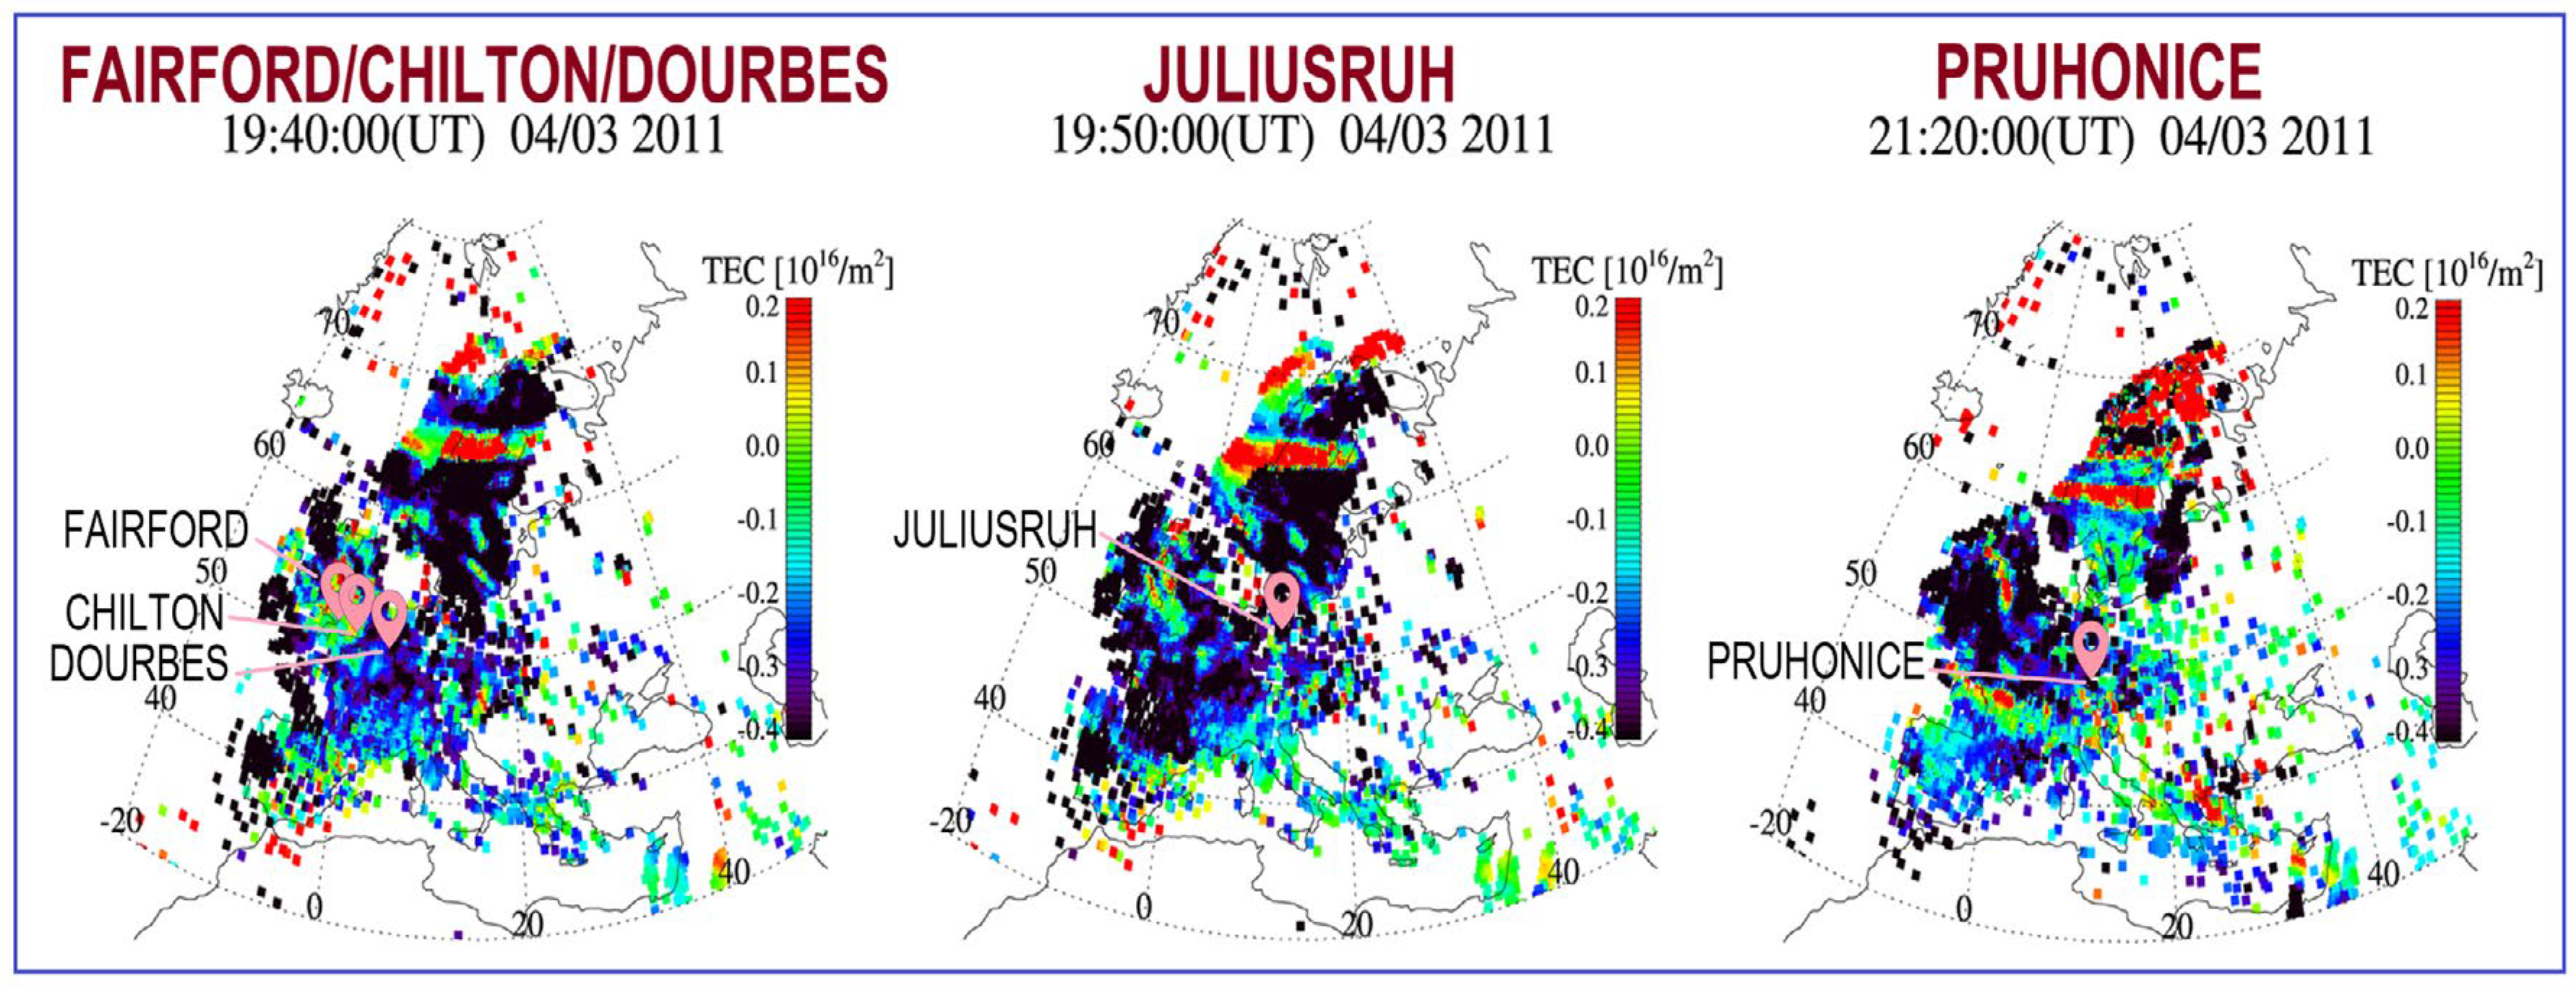
3.2. Case Study: 2 (3–4 April 2011)

A unique example of ionospheric irregularity manifestation is also demonstrated in the second case study of 3–4 April 2011, under quiet geomagnetic activity with a minimum Dst index of −24 nT. Spread F, coupled with high ROTI, was identified over all five upper mid-latitude Digisonde stations. On 3–4 April 2011, over Juliusruh high ROTI (>0.25 to 0.3 TECU/min) was noted from 18:00 UT of 3 April to 01:50 UT of 4 April 2011. RSF was also registered over Juliusruh during this time interval. On 3 April 2011, between 19:00 and 22:50 UT, significant ROTI (>0.25 to 0.3 TECU/min) was noted over Fairford, Chilton, and Dourbes, which also coincided with RSF. Similarly, over Pruhonice, clear ROTI (>0.2 to 0.25 TECU/min) and RSF were recorded around 21:00 to 22:50 UT on 3 April 2011. Figure 4 depicts a snapshot of concurrent intense ROTI and RSF over Juliusruh, Fairford, Chilton, Dourbes and Pruhonice on 3 April 2011. From the figure, it can be seen that clear ROTI activity associated with RSF was noted over Fairford-Chilton-Dourbes around 19:40 UT whereas over Juliusruh this was registered at 19:45 UT and over Pruhonice around 21:15 UT.
The d-TEC maps with the locations of five upper mid-latitude Digisonde stations are depicted in Figure 5 during high ROTI associated with RSF. The pink location markers represent the station locations on d-TEC maps in Figure 5. MSTID signatures were noted in terms of d-TEC (~−0.4 TECU) over every station from 19:00 to 01:00 UT of 3–4 April 2011. We may conclude that MSTIDs, which give rise to RSF coupled with ROTI activity similar to the low mid-latitude ionosphere, are primary drivers for mid-latitude ionospheric irregularities over high mid-latitude ionosphere in Europe.

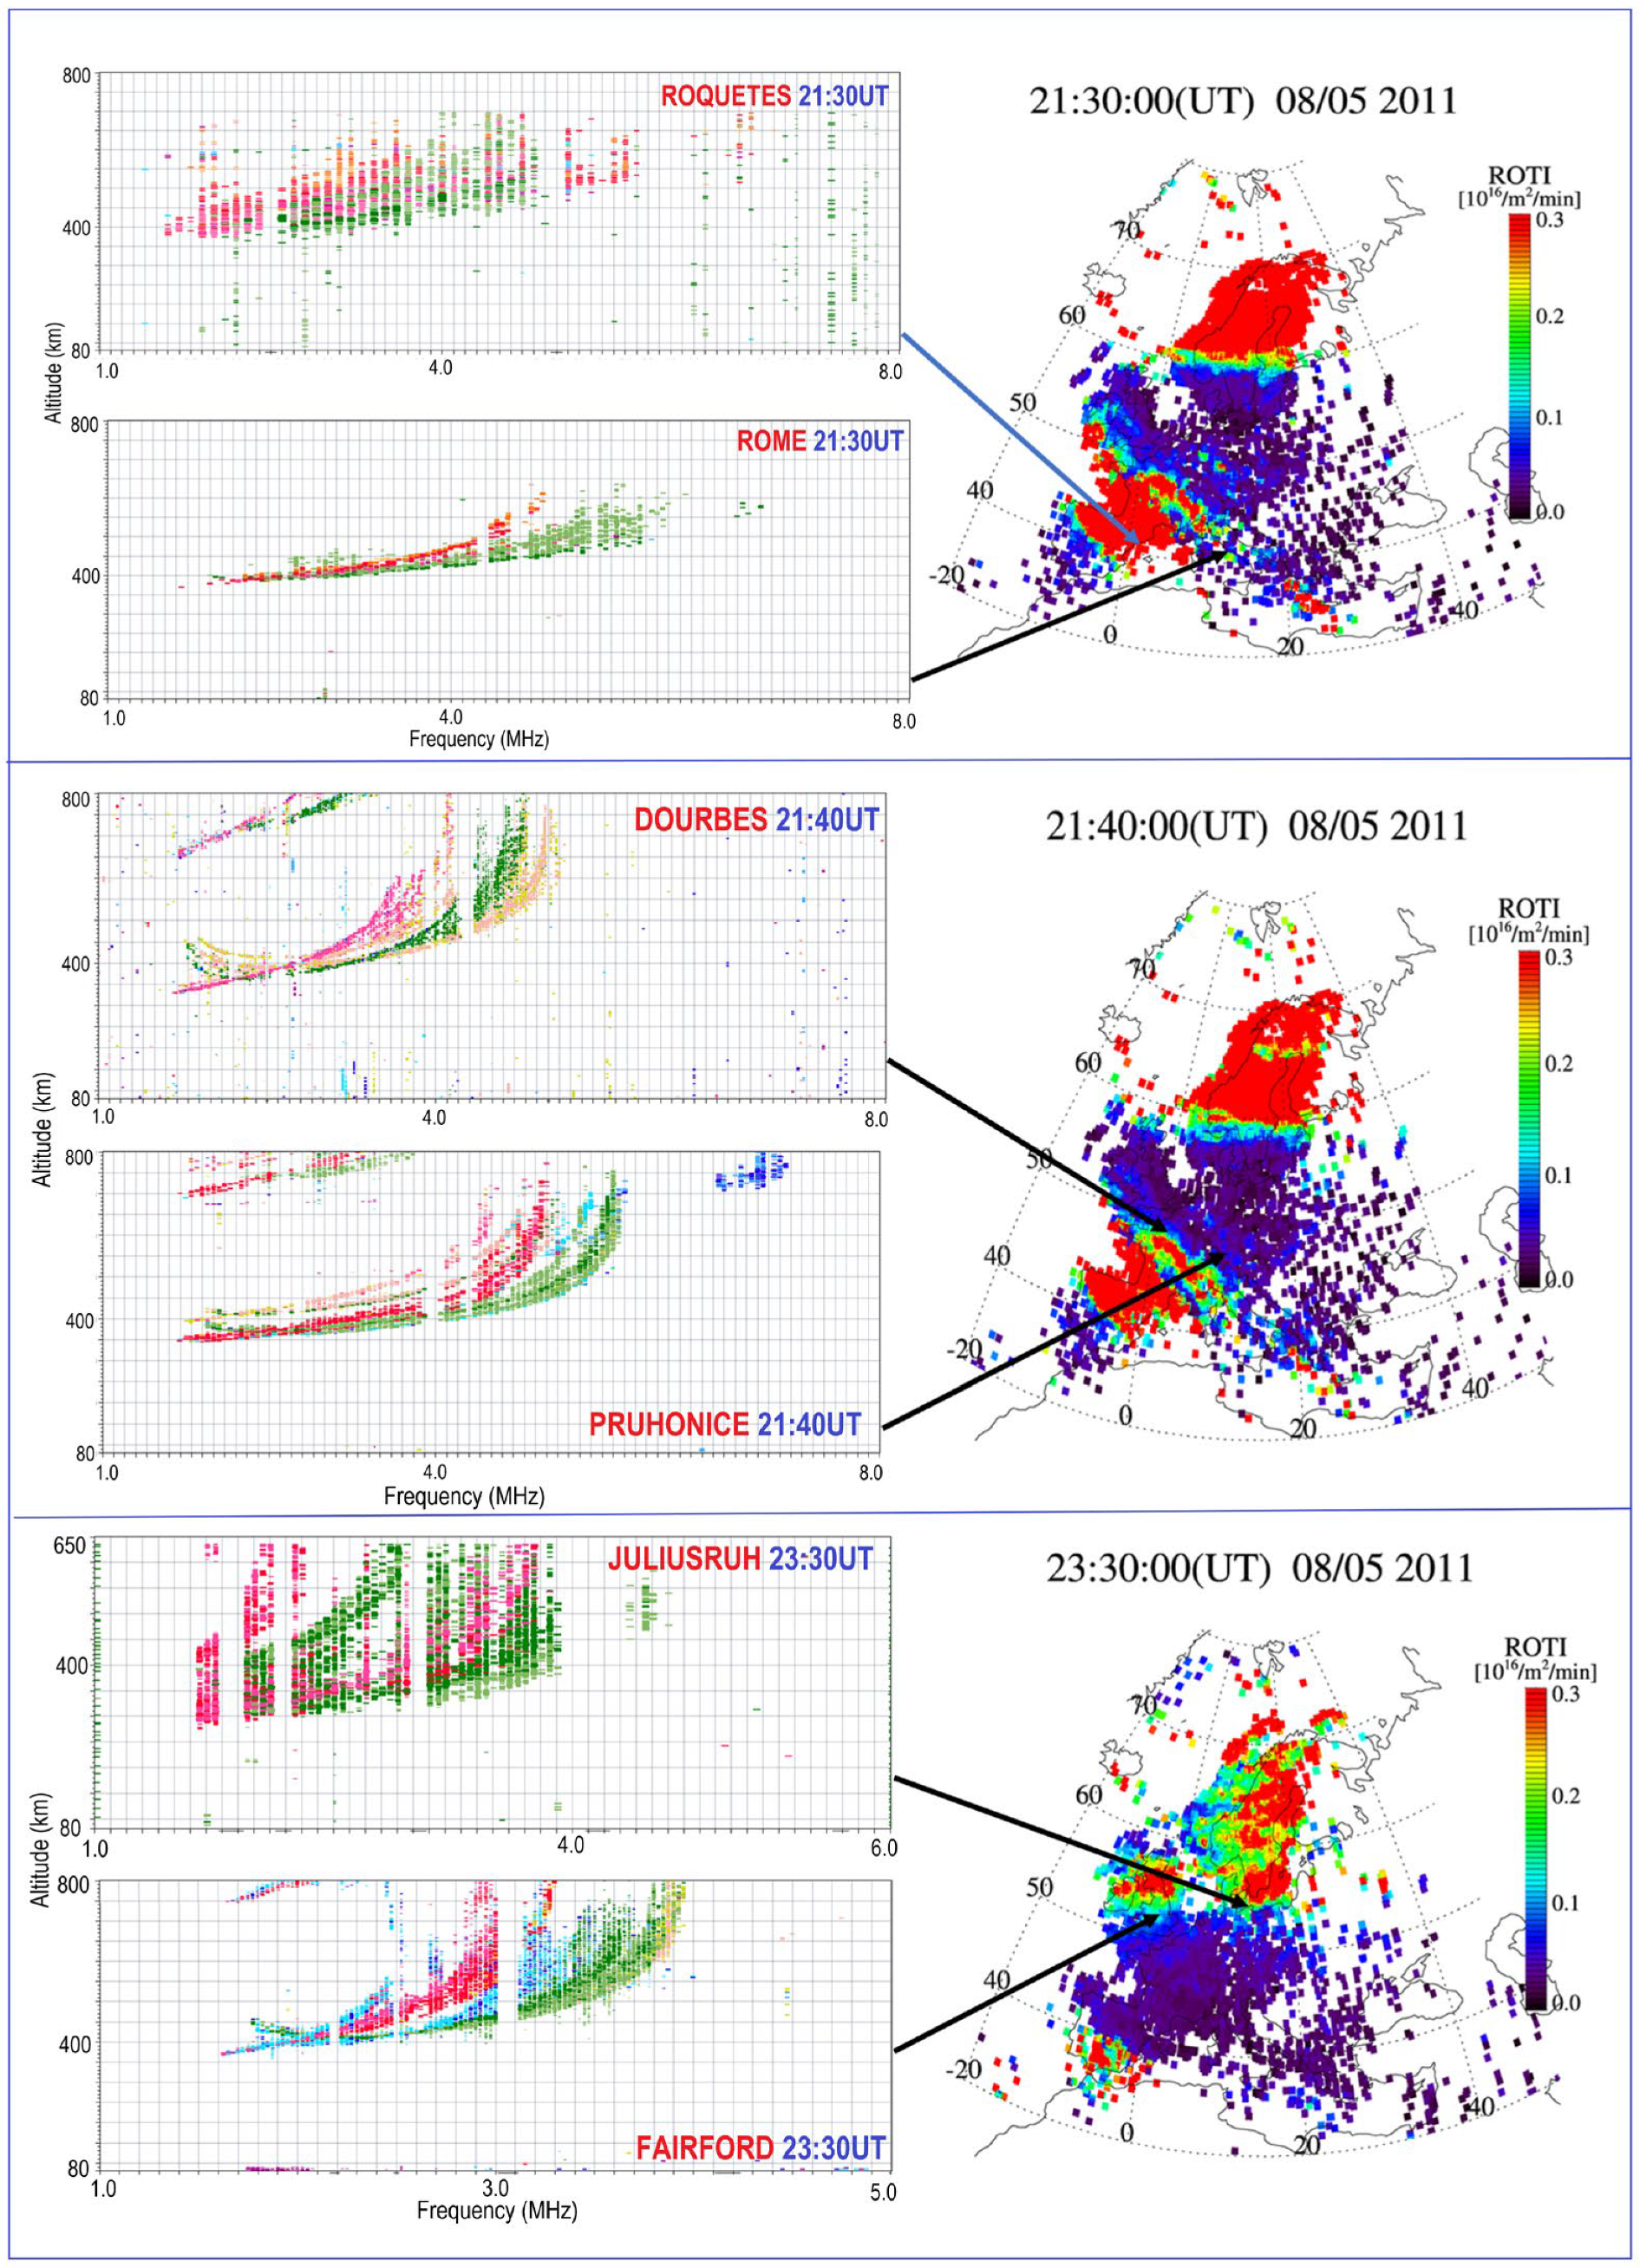
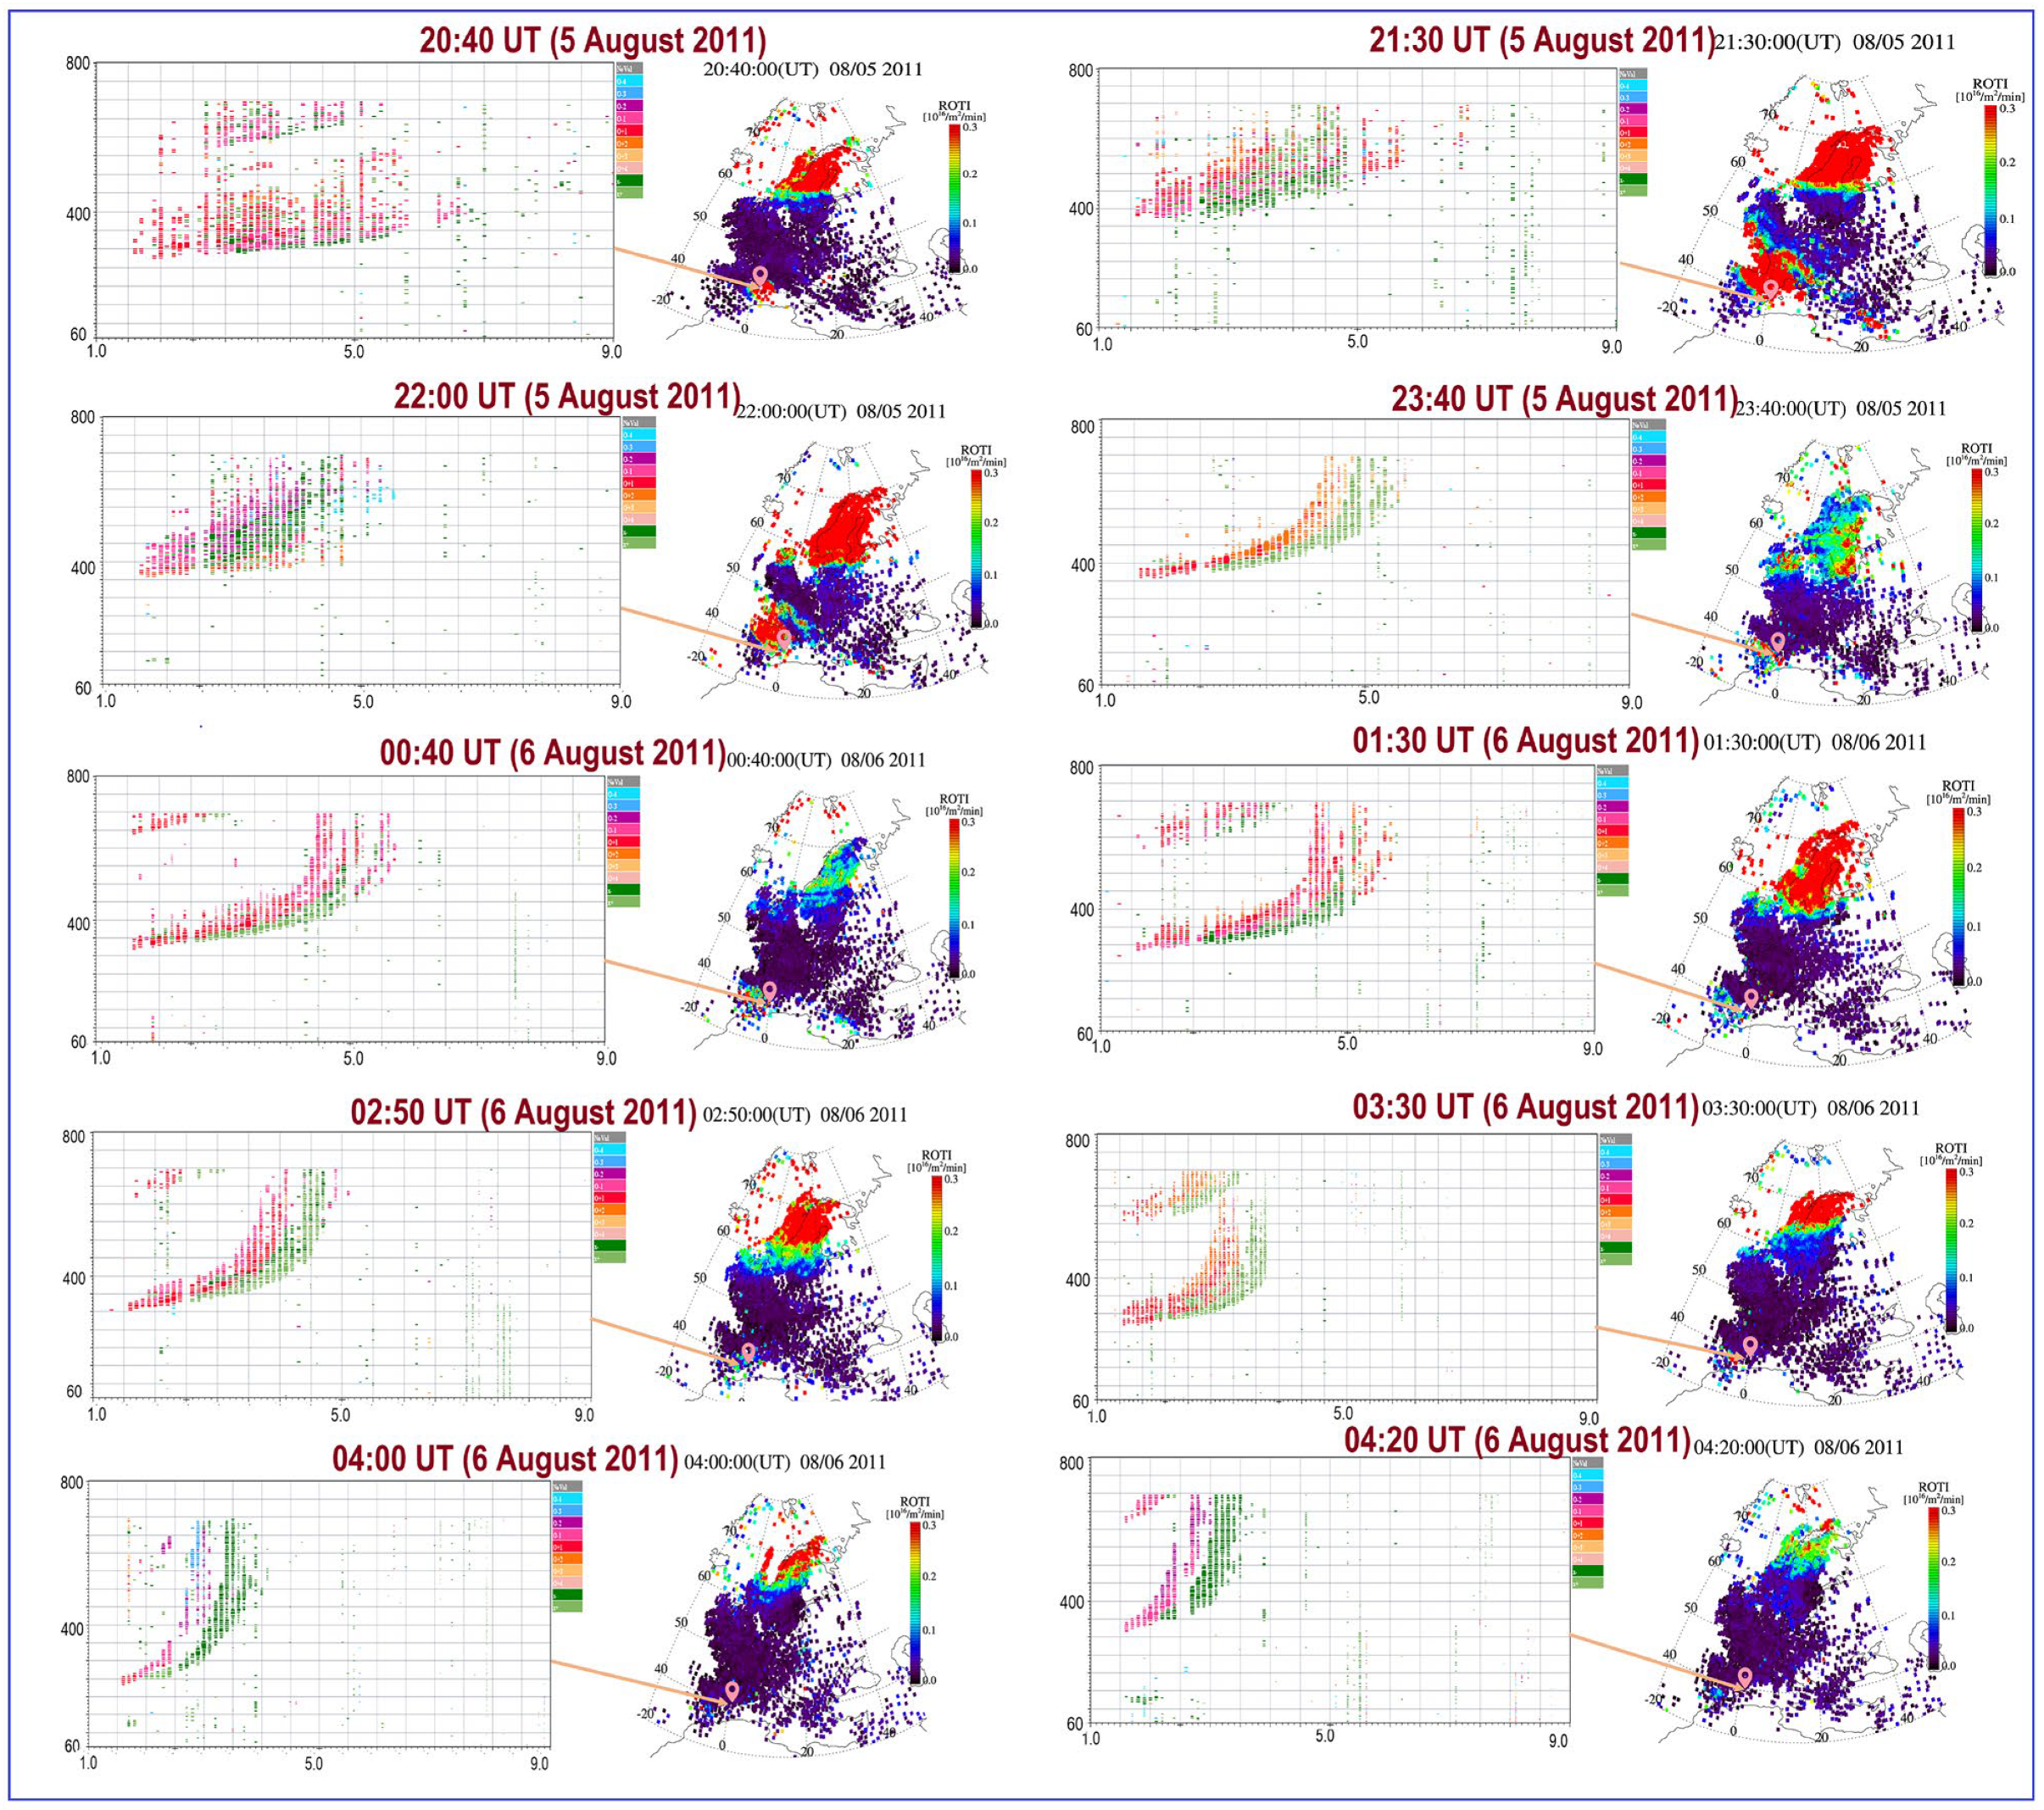
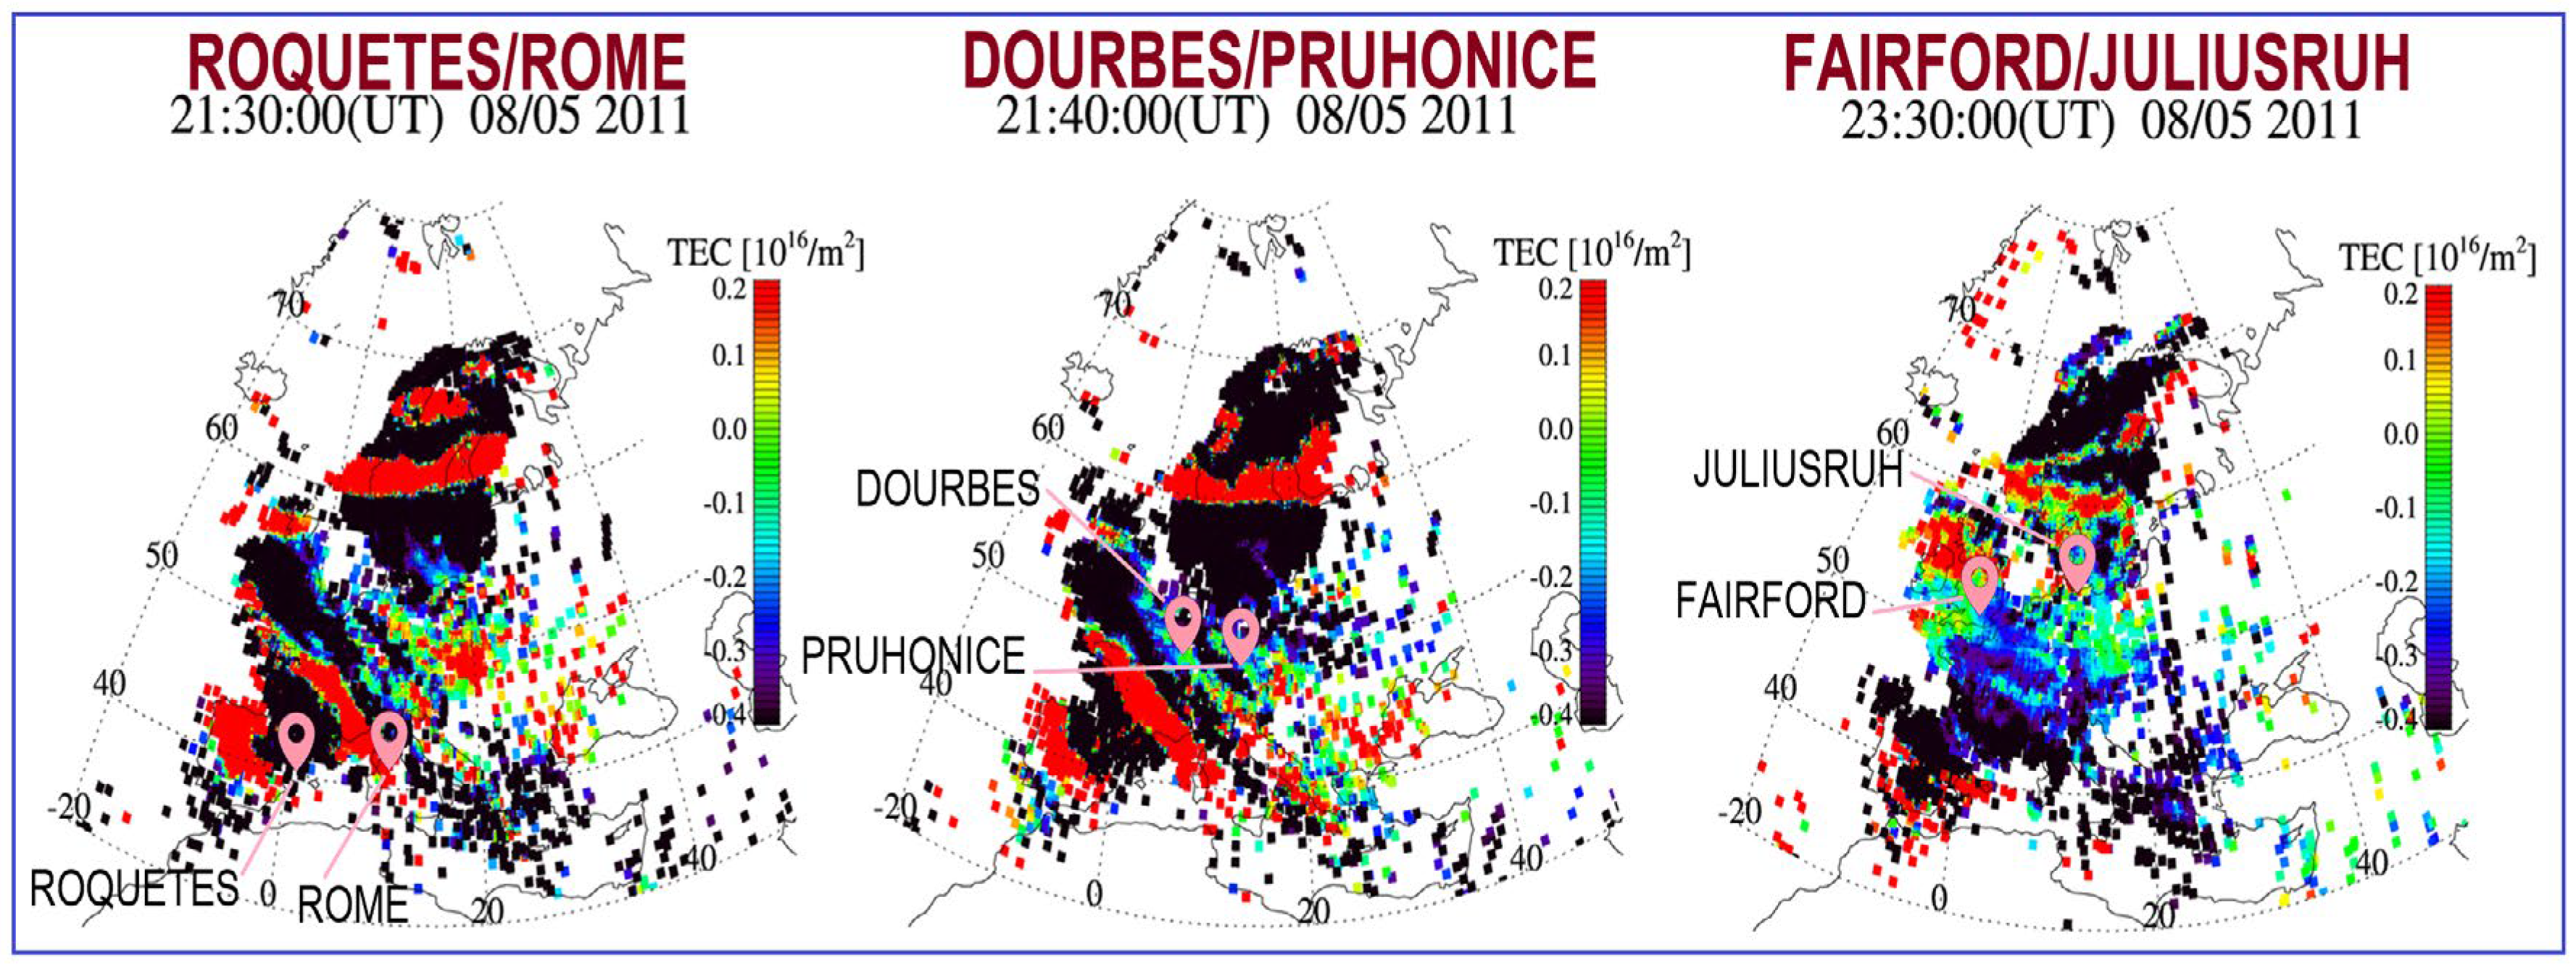
3.3. Case Study: 3 (5–6 August 2011)

The effect of the geomagnetic storm is demonstrated in the present case study in terms of intense ROTI in association with RSF. The spatial and temporal extent of the irregularities during the storm periods are discussed in the present section. On 5–6 August 2011, a geomagnetic storm was noted from 23:00 UT of 5 August 2011 to 22:00 UT of 6 August 2011. The minimum Dst noted during this period was −115 nT (04:00 UT of 6 August 2011). On this day, almost every Digisonde station was affected by clear ROTI associated with RSF. Over Juliusruh, ROTI (>0.3 TECU/min) associated with RSF was noted from 20:00 UT to 01:00 UT. Fairford was not particularly affected during this period as ROTI activity (>0.25 TECU/min) in association with RSF was only noted from 21:10 to 21:40 UT. Over Dourbes and Pruhonice, high values of ROTI (>0.25 TECU/min) in association with RSF were registered from 21:40 to 22:30 UT and 20:30 to 21:40 UT, respectively. Over Roquetes, ROTI (>0.3 TECU/min) associated with RSF was noted around 20:20 to 02:50 UT whereas over Rome, ROTI was observed from 20:30 to 22:45 UT. On 5–6 August 2011, Chilton and Athens Digisondes recorded no ionograms. Figure 6 represents a snapshot of the spatial extent of the ionospheric irregularity during the storm. Geomagnetically disturbed periods amplify the spatial extent of the mid-latitude irregularities, according to a comparison of Figure 2, Figure 4 and Figure 6.
An interesting case of ROTI activity is presented in Figure 7 in the context of the spread F evolution over Roquetes from 20:40 UT on 5 August 2011 to 04:20 UT on 6 August 2011. Paul et al. (2018) [30] reported a typical spread F event during which RSF evolved into frequency spread F (FSF) and was termed RSF to FSF. A similar RSF to FSF progression is observed in Figure 7 where increased range ambiguity noted from 20:40 UT to 02:50 UT developed into a mixed spread F (MSF) pattern and finally into FSF after 04:00 UT. High ROTI values (~2.5 to 3 TECU/min) were registered from 20:40 to 02:50 UT coupled with RSF activity. Around 03:30 UT, ROTI reduced to 0.1 TECU/min in association with MSF and during 04:00UT when FSF developed, the ROTI value decreased to 0.05 TECU/min. Thus, in RSF to FSF evolution [30], plasma instabilities (RSF) gradually dissipated towards higher F layer altitudes which in turn generated FSF during postmidnight periods. King (1970) [48] discussed this sequence indicating that FSF is the decay product of RSF.
Figure 8 contains d-TEC maps for 5–6 August 2011. The pink position markers represent all six (four upper mid-latitude stations and two low mid-latitude stations) Digisonde stations. MSTID signatures are prominent in these maps with a NorthWest to SouthEast (NW-SE) direction [37,47]. During geomagnetic storms, Joule heating currents and particle precipitation from the magnetosphere are the main drivers of this effect [48]. The upper thermosphere temperature rises due to Joule heating at mid-latitudes, and high-velocity neutral winds are enhanced by ion drag. Gravity waves and wind surges through the thermosphere from high latitudes travel towards the equatorial region through the mid-latitude ionosphere [48]. MSTIDs are a manifestation of this process, as shown in Figure 8. The area where this thermosphere heating can occur (the MSTIDs excitation zone) is in the same time and location where most intense ionospheric plasma irregularities detected by the ROTI technique are developed, according to [8] joint analysis of the ionospheric plasma irregularities, Field Aligned Currents (FACs), and MSTIDs, which reveals a zone with intense FACs and mid-latitude ionospheric irregularities and particle precipitation, all of which contribute in the energy deposition process. Jiang et al. (2020) [49] have reported a similar scenario in the Chinese longitude sector, where large-scale ionospheric irregularities/spread F has been detected over the Chinese mid-latitude ionosphere in synchronism with the ROTI distribution during the main phase of the geomagnetic storm registered on 8 September 2018.

3.4. Diurnal Variation

The diurnal variation in the ROTI occurrences in the presence of RSF over the midlatitude ionosphere is depicted in Figure 9a–h. In this Figure, the x-axis represents the day of the year 2011 for all eight Digisonde stations and the y-axis is the time of occurrence of mid-latitude ROTI in the presence of RSF in UT. The time range in the y-axis was limited between 14:00 UT of the previous day to 10:00 UT of the next day. The blue and brown markers represent the ROTI cases during geomagnetically quiet and disturbed conditions. The grey marker stands for the data gaps (no ionogram present for the ROTI cases). The black and red line in each plot denotes the sunrise and sunset time in UT to that corresponding station. A threshold value of ROTI > 0.15 TECU/min was considered for a registered ROTI event [36,44]. Figure 9a–h shows the ROTI distribution over all eight Digisonde stations, which are confined by the solar terminator (sunset and dawn times). Every ROTI event that was noted in 2011 was associated with RSF. It is evident from Figure 9d that over the entire year of 2011—from 18:00 to 05:30 UT—the mid-latitude ROTI cases in conjunction with the formation of RSF are prominent above Juliusruh. The reason for this might be that ROTI is enhanced by auroral electrojet activity; the largest dependence (correlation R > 0.6–0.8) was found within a small range of 55–70° N latitude [6]. Over Chilton and Fairford (Figure 9a,b), the diurnal occurrence of significant ROTI cases is rather identical except for the data gap period. Evidence of irregularities can be noted between 18:00 and 05:00 UT over Chilton and Fairford. The fact that Chilton and Fairford are very near (latitude difference ~0.2°) justifies this similarity in the diurnal occurrence. Given that Dourbes and Pruhonice are located in almost identical latitude zones (see Table 1), they also exhibit a comparable diurnal occurrence. From Figure 9c,g, significant indications of the mid-latitude irregularity occurrences are observed over Dourbes and Pruhonice between 19:00 and 05:00 UT. Over the low mid-latitude region, similar diurnal ionospheric irregularity occurrence around 19:00 to 04:30 UT was recorded over Rome and Roquetes, as shown in Figure 9e,f due to their proximity. The diurnal ionospheric irregularity occurrence profile over Athens (Figure 9h) between 18:00 and 04:00 UT is depicted in Figure 9.
The diurnal irregularity occurrence variation over eight Digisonde stations appears to have a notable latitudinal sensitivity with significantly higher diurnal variability over Juliusruh (Latitude ~55° N). According to [6], a possible explanation for this discrepancy is the auroral electrojet. Paul et al. (2023) [32] reported similar differences in spread F occurrence between stations over 50° N and less than 50° N over Europe attributed to different spread F driving mechanisms. In the present scenario, auroral LSTIDs and MSTIDs seem to be the main drivers for mid-latitude ionospheric irregularities.

3.5. Seasonal Variation

Figure 10 and Figure 11 illustrate the seasonal variation of the mid-latitude ROTI monthly occurrence (>0.15 TECU/min) in the presence of RSF for each of the two latitude zones discussed. The x-axis in Figure 10 denotes the month and the number of days affected by ROTI associated with RSF is displayed in the y-axis. With a maximum in January and April, Juliusruh exhibits a significant percentage of these ionospheric irregularities. In February, March, and September, a secondary maximum for the mid-latitude ionospheric irregularity occurrence is observed over Juliusruh. Over the upper stations (Fairford, Chilton, Dourbes, and Pruhonice) around ~50° N, the maximum ionospheric irregularity occurrence is also noted.
January exhibits a secondary maximum around summer (Figure 10a). Figure 10b depicts the monthly occurrence of mid-latitude ionospheric irregularities for the low mid-latitude stations of the European longitude sector. The maximum ionospheric irregularity occurrence over Rome, Athens, and Roquetes is registered around the summer, primarily during July of 2011. Figure 11 illustrates a comparative study of the monthly occurrence of mid-latitude ionospheric irregularities between the upper and low mid-latitude stations. The y-axis displays the average of the number of days affected by ROTI associated with RSF cases recorded from the upper and lower mid-latitude stations. The orange and blue column indicates the upper and lower mid-latitude stations. Observations can be made that, from January to April, the upper mid-latitude stations were encountered by the mid-latitude ionospheric irregularity occurrences when the low mid-latitude stations were severely affected during the summer, notably in July.
Latitudinal sensitivity is depicted in the seasonal variation in the mid-latitude ionospheric irregularity occurrence. We may conclude that, for the higher mid-latitude station, the monthly occurrence of the mid-latitude ionospheric irregularities peaks in January, and for the lower mid-latitude stations, in July. Paul et al. (2023) [32] demonstrated similar results for spread F occurrence over the European longitude sector for 2017, 2020, and 2021. According to their report, maximum spread F occurrence was noted in winter (December–January) for the Digisonde stations situated above 50° N, whereas stations below 50° N were affected by the maximum spread F occurrence during the summer (May–August) which supports our conclusion of a latitudinal sensitivity for the seasonal variation in the mid-latitude ROTI occurrence. Liu and Shih-An (2021) [42] found that, in the mid-latitude, TEC maximises in late March 2000, and in May and June of 2009 and 2013. In contrast, ROTI activity was enhanced around May to June of 2000, 2009, and 2013, as observed in the present study for 2011. The distribution of ROTI in 2000, 2009, and 2013 was rather similar, even though, TEC was lower in 2009 than in 2000 and 2013.
From the above analysis, we can deduce that all 2011 significant ROTI (>0.15 TECU/min) cases coincided with RSF along with clear MSTID activity over the Digisonde stations. Therefore, it can be suggested that the enhanced ROTI activity is driven by induced gravity waves. The diurnal and seasonal aspects of the ROTI events were described with special emphasis on the latitude-dependent occurrence. Maximum occurrence was observed from 18:00 to 5:00 UT with a seasonal maximum in January. The diurnal and seasonal maximum of ROTI activity over lower mid-latitude Digisonde stations was noted in July.

4. Summary

GPS-based ROTI is one of the most used indices for tracking the presence and intensity of ionospheric L-band irregularities. While an ionospheric irregularity monitoring index over the mid-latitude ionosphere is much less explored over mid-latitudes, spread F, on the other hand, is a distinct ionogram ionospheric irregularity signature.
In the present work, we observed and analysed clear ROTI activity (>0.15 TECU/min) over the European mid-latitude ionosphere during a low-to-moderate solar activity year (2011). By correlating the GPS-based ROTI and the spread F recorded at the same period of ROTI cases, we were able to analyse the mid-latitude ionospheric irregularity distribution. The latitude dependency of the mid-latitude ionospheric irregularity distribution has been demonstrated by [29,30,31,32]. Due to the different ionospheric dynamics, observations [30,31,32] show a distinct latitudinal variation in the spread F occurrence (diurnal, seasonal, and solar cycle) between the high and the low mid-latitude stations over Europe. According to [31,32], the polar ionosphere primarily controls the dynamics of the high mid-latitude ionosphere, whereas the equatorial counterpart regulates the dynamics of the low mid-latitude ionosphere. To investigate this latitudinal effect on the ROTI occurrence, we categorized the digisonde stations in (a) upper mid-latitude region with latitude extent >45° N (Juliusruh, Fairford, Chilton, Dourbes and Pruhonice) and (b) low mid-latitude region with latitude extent <45° N (Roquetes, Rome and Athens). We can summarize the findings of our present study as follows:
  • RSF has been recorded in the ionogram for all the ROTI (>0.15 TECU/min) occurrences observed in 2011. This behaviour was seen independently of geomagnetic activity for both low and upper mid-latitude Digisonde stations.
  • MSTIDs, which may develop as a result of induced gravity waves or polarisation electric fields [37], are driving most ROTI enhancements also related to RSF.
  • During a geomagnetic storm, the spatial extent of irregularities increases.
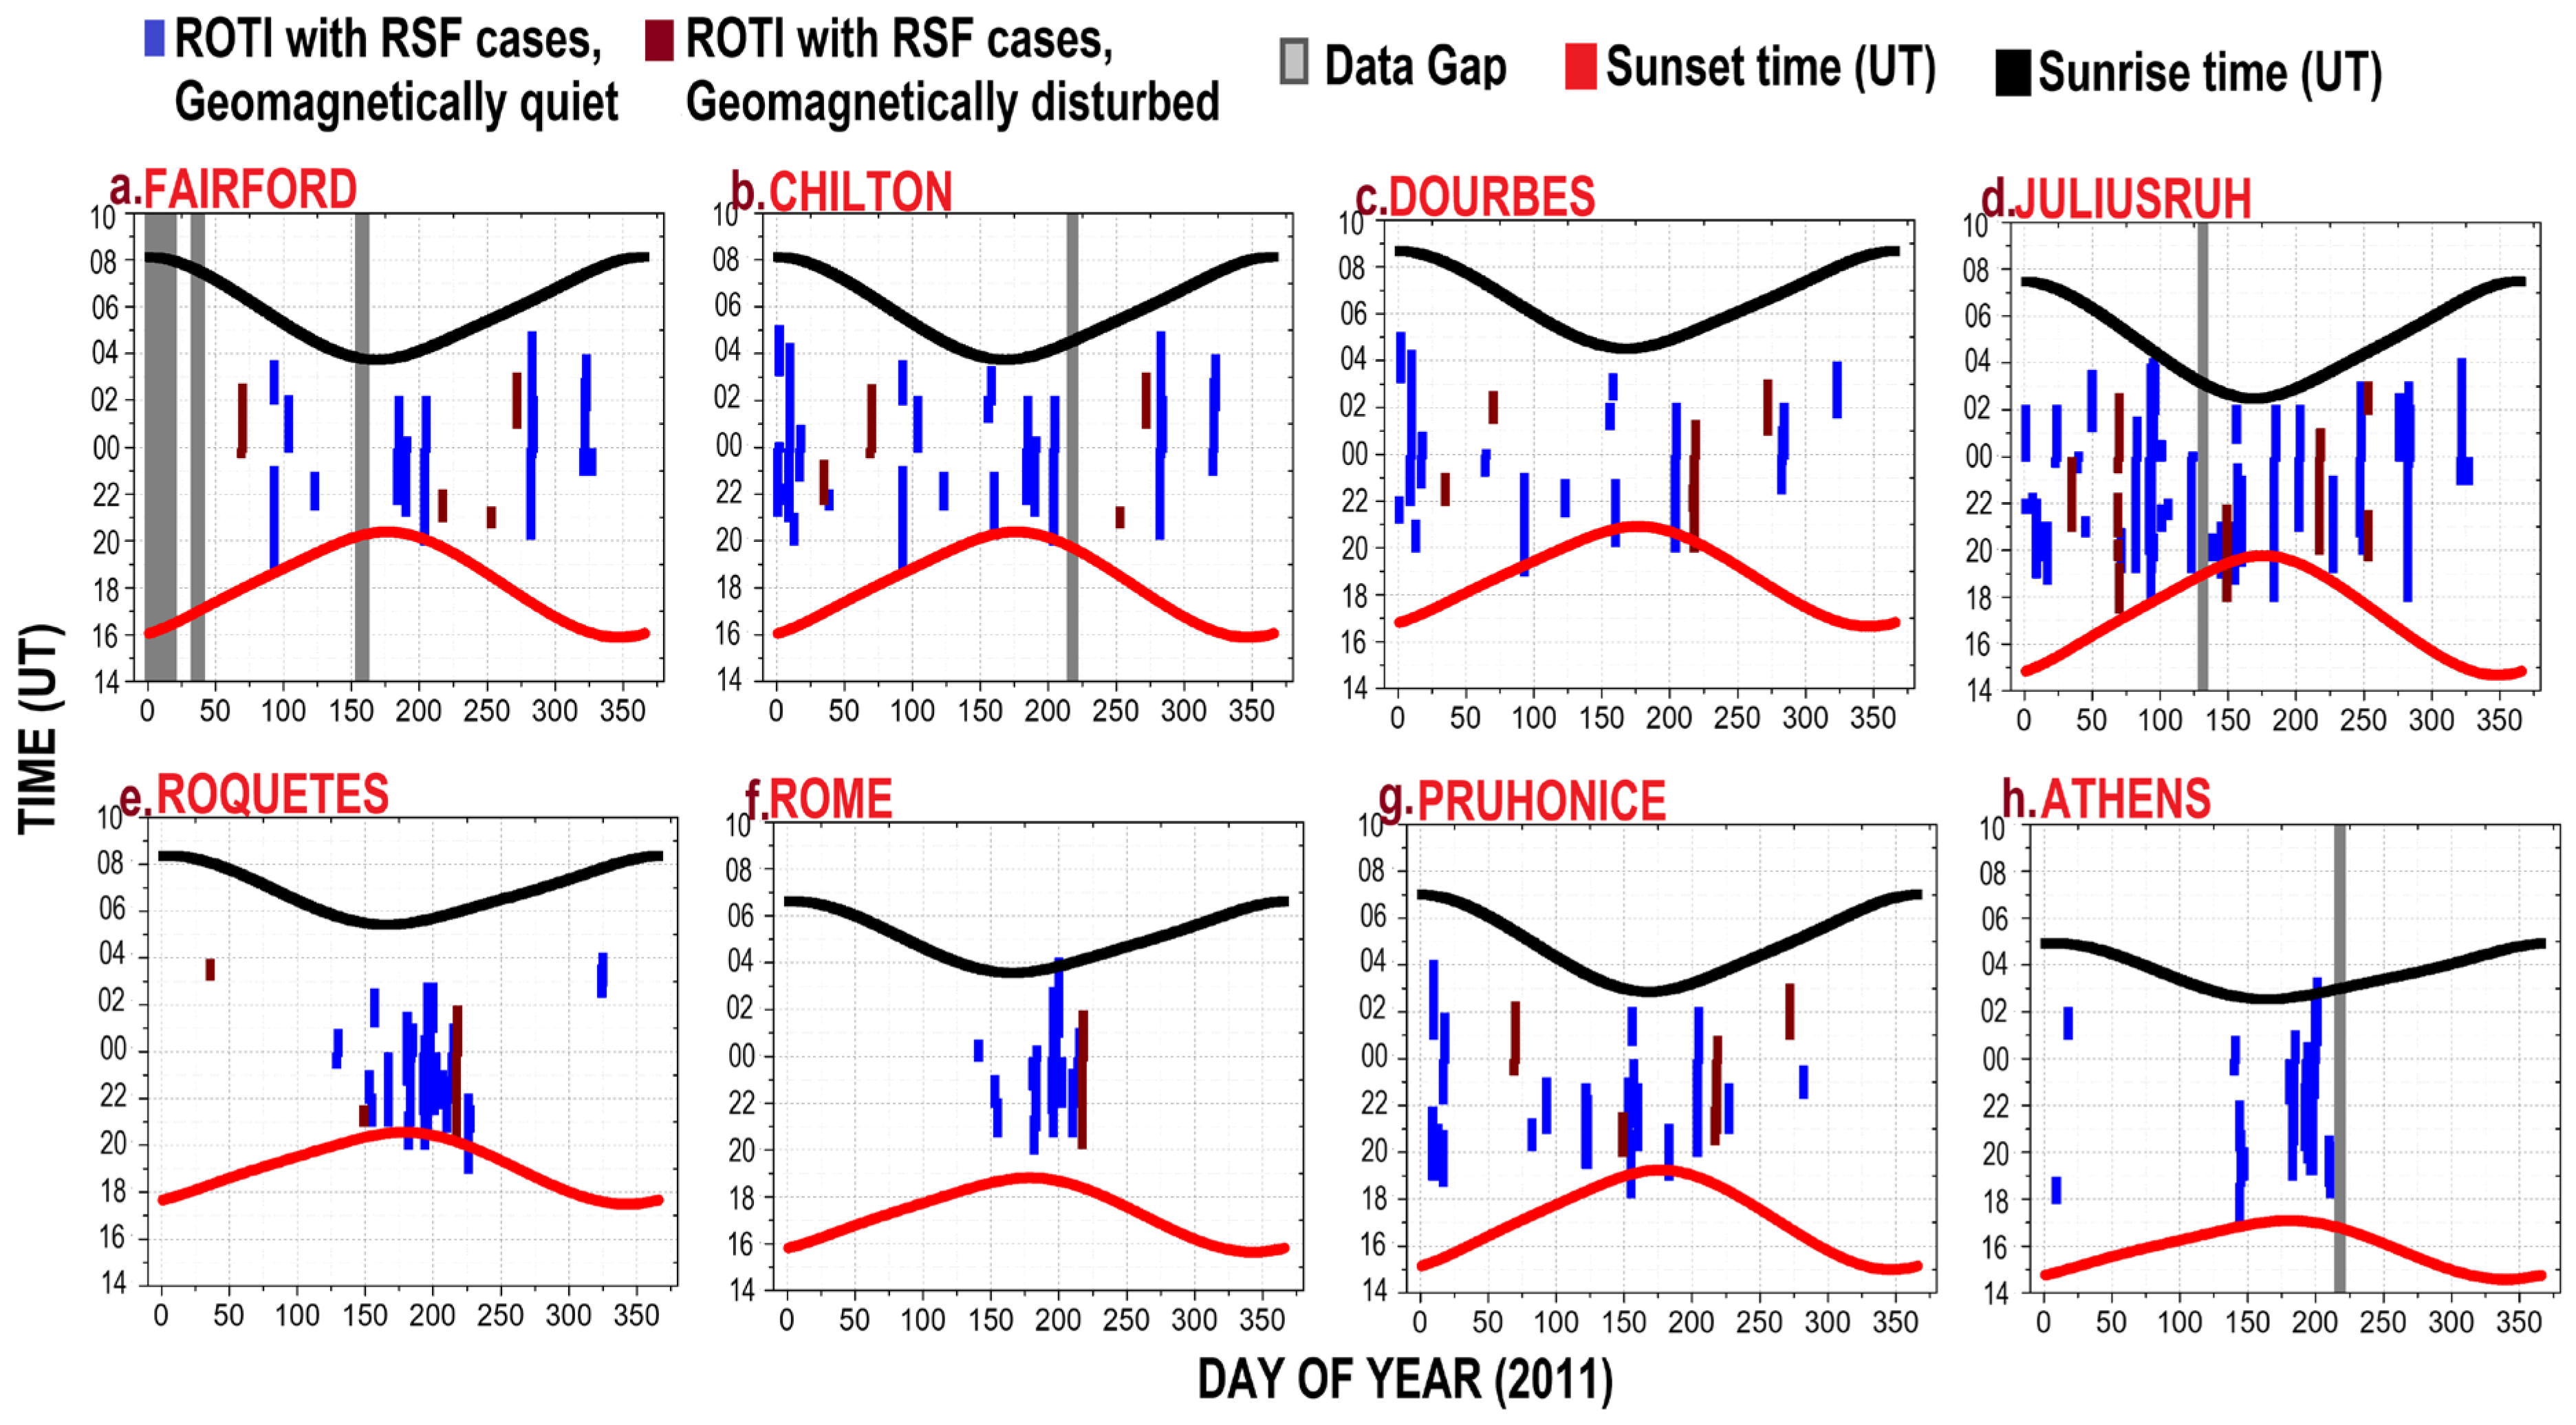
  • The diurnal variation in the mid-latitude ionospheric irregularity occurrences is a latitude-dependent [30,31,32], nighttime phenomenon. The maximum extent of this occurrence was noted around 55° N (time zone = UT + 01:00) latitude from 18:00 to 05:30 UT, 18:00 to 05:00 UT around 50° N (time zone = UT for Fairford and Chilton; UT + 01:00 for Dourbes and Pruhonice) and over the lower mid-latitude Digisonde (time zone = UT + 01:00 for Roquetes and Rome; UT + 02:00 for Athens) stations from 19:00 to 04:30 UT.
  • Seasonal variation in the mid-latitude ionospheric irregularity occurrence is also latitude-dependent [30,31,32]. This occurrence was most prevalent over the higher mid-latitude region around January, and most frequent over the lower mid-latitude region during July.

Author Contributions

Conceptualization, H.H.; methodology, K.S.P.; validation, H.H., M.H.R. and K.S.P.; formal analysis, K.S.P.; investigation, K.S.P.; resources, M.H.R.; data curation, M.H.R.; writing—original draft preparation, K.S.P.; writing—review and editing, H.H.; visualization, K.S.P.; supervision, H.H. and M.G.M.; project administration, M.G.M. All authors have read and agreed to the published version of the manuscript.

Funding

This research received no external funding.

Institutional Review Board Statement

Not applicable.

Informed Consent Statement

Not applicable.

Data Availability Statement

In the present study, we have downloaded the TEC maps (both ROTI and detrended TEC) over Europe from the website https://aer-nc-web.nict.go.jp/GPS/EUROPE/ accessed on 25 January 2024. The ionograms over Juliusruh, Fairford, Chilton, Dourbes, Roquetes, Rome, and Athens for 2011 have been downloaded from the Digital Ionogram database or DIDBase (https://lgdc.uml.edu/common/DIDBFastStationList accessed on 25 January 2024). Both databases used in the present article are free.

Acknowledgments

We are thankful to Kyoto University, Japan (https://wdc.kugi.kyoto-u.ac.jp/dst_final/, accessed on 11 February 2024) for providing the geomagnetic data and the Digital Ionogram DataBase (DIDBase) of the Global Ionospheric Radio Observatory (GIRO) portal (http://giro.uml.edu, accessed on 11 February 2024) for the ionograms for 2011. We acknowledge the use of ROTI and detrended=GPS TEC maps over Europe for 2011 which are available at https://aer-nc-web.nict.go.jp/GPS/EUROPE/, accessed on 11 February 2024.

Conflicts of Interest

The authors declare no conflicts of interest.

References

  1. Chapman, S. The electrical conductivity of the ionosphere: A review. Il Nuovo C. (1955–1965) 1956, 4 (Suppl. S4), 1385–1412. [Google Scholar] [CrossRef]
  2. Schunk, R.; Nagy, A. Ionospheres: Physics, Plasma Physics, and Chemistry; Cambridge University Press: Cambridge, UK, 2009. [Google Scholar]
  3. McNamara, L.F. Prediction of total electron content using the International Reference Ionosphere. Adv. Space Res. 1984, 4, 25–50. [Google Scholar] [CrossRef]
  4. Pi, X.; Mannucci, A.J.; Lindqwister, U.J.; Ho, C.M. Monitoring of global ionospheric irregularities using the worldwide GPS network. Geophys. Res. Lett. 1997, 24, 2283–2286. [Google Scholar] [CrossRef]
  5. Basu, S.; Groves, K.M.; Quinn, J.M.; Doherty, P. A comparison of TEC fluctuations and scintillations at Ascension Island. J. Atmos. Sol.-Terr. Phys. 1999, 61, 1219–1226. [Google Scholar] [CrossRef]
  6. Kotulak, K.; Zakharenkova, I.; Krankowski, A.; Cherniak, I.; Wang, N.; Fron, A. Climatology characteristics of ionospheric irregularities described with GNSS ROTI. Remote Sens. 2020, 12, 2634. [Google Scholar] [CrossRef]
  7. Cherniak, I.; Zakharenkova, I.; Krankowski, A. Approaches for modelling ionosphere irregularities based on the TEC rate index. Earth Planets Space 2014, 66, 165. [Google Scholar] [CrossRef]
  8. Cherniak, I.; Krankowski, A.; Zakharenkova, I. ROTI Maps: A new IGS ionospheric product characterizing the ionospheric irregularities occurrence. GPS Solut. 2018, 22, 69. [Google Scholar] [CrossRef]
  9. Tiwari, R.; Strangeways, H.J.; Tiwari, S.; Ahmed, A. Investigation of ionospheric irregularities and scintillation using TEC at high latitude. Adv. Space Res. 2013, 52, 1111–1124. [Google Scholar] [CrossRef]
  10. Kintner, P.M., Jr.; Coster, A.J.; Fuller-Rowell, T.; Mannucci, A.J.; Mendillo, M.; Heelis, R. (Eds.) Midlatitude Ionospheric Dynamics and Disturbances; John Wiley & Sons: Hoboken, NJ, USA, 2013; Volume 181. [Google Scholar]
  11. Vadakke Veettil, S.; Haralambous, H.; Aquino, M. Observations of quiet-time moderate midlatitude L-band scintillation in association with plasma bubbles. GPS Solut. 2017, 21, 1113–1124. [Google Scholar] [CrossRef]
  12. Berkner, L.V.; Wells, H.W. F-region ionosphere-investigations at low latitudes. Terr. Magn. Atmos. Electr. 1934, 39, 215–230. [Google Scholar] [CrossRef]
  13. Bowman, G.G. Ionospheric frequency spread and its relationship with range spread in mid-latitude regions. J. Geophys. Res. Space Phys. 1991, 96, 9745–9753. [Google Scholar] [CrossRef]
  14. Bowman, G.G. Short-term delays (hours) of ionospheric spread F occurrence at a range of latitudes, following geomagnetic activity. J. Geophys. Res. Space Phys. 1998, 103, 11627–11634. [Google Scholar] [CrossRef]
  15. Wang, Z.; Shi, J.K.; Torkar, K.; Wang, G.J.; Wang, X. Correlation between ionospheric strong range spread F and scintillations observed in Vanimo station. J. Geophys. Res. Space Phys. 2014, 119, 8578–8585. [Google Scholar] [CrossRef]
  16. Kelley, M.C.; Fukao, S. Turbulent upwelling of the mid-latitude ionosphere: 2. Theoretical framework. J. Geophys. Res. Space Phys. 1991, 96, 3747–3753. [Google Scholar] [CrossRef]
  17. Perkins, F. Spread F and ionospheric currents. J. Geophys. Res. 1973, 78, 218–226. [Google Scholar] [CrossRef]
  18. Kelley, M.C.; Makela, J.J.; Ledvina, B.M.; Kintner, P.M. Observations of equatorial spread-F from Haleakala, Hawaii. Geophys. Res. Lett. 2002, 29, 64-1–64-4. [Google Scholar] [CrossRef]
  19. Huang, C.S.; Miller, C.A.; Kelley, M.C. Basic properties and gravity wave initiation of the mid-latitude F region instability. Radio Sci. 1994, 29, 395–405. [Google Scholar] [CrossRef]
  20. Miller, C.A.; Swartz, W.E.; Kelley, M.C.; Mendillo, M.; Nottingham, D.; Scali, J.; Reinisch, B. Electrodynamics of midlatitude spread F: 1. Observations of unstable, gravity wave-induced ionospheric electric fields at tropical latitudes. J. Geophys. Res. Space Phys. 1997, 102, 11521–11532. [Google Scholar] [CrossRef]
  21. Bowman, G.G.; Monro, P.E. Mid-latitude range spread and travelling ionospheric disturbances. J. Atmos. Terr. Phys. 1988, 50, 215–223. [Google Scholar] [CrossRef]
  22. Otsuka, Y.; Shiokawa, K.; Ogawa, T.; Yokoyama, T.; Yamamoto, M. Spatial relationship of nighttime medium-scale travelling ionospheric disturbances and F region field-aligned irregularities observed with two spaced all-sky airglow imagers and the middle and upper atmosphere radar. J. Geophys. Res. Space Phys. 2009, 114. [Google Scholar] [CrossRef]
  23. Narayanan, V.L.; Shiokawa, K.; Otsuka, Y.; Neudegg, D. On the role of thermospheric winds and sporadic E layers in the formation and evolution of electrified MSTIDs in geomagnetic conjugate regions. J. Geophys. Res. Space Phys. 2018, 123, 6957–6980. [Google Scholar] [CrossRef]
  24. Otsuka, Y.; Onoma, F.; Shiokawa, K.; Ogawa, T.; Yamamoto, M.; Fukao, S. Simultaneous observations of nighttime medium-scale travelling ionospheric disturbances and E region field-aligned irregularities at midlatitude. J. Geophys. Res. Space Phys. 2007, 112. [Google Scholar] [CrossRef]
  25. Yokoyama, T.; Hysell, D.L.; Otsuka, Y.; Yamamoto, M. Three-dimensional simulation of the coupled Perkins and Es-layer instabilities in the nighttime midlatitude ionosphere. J. Geophys. Res. Space Phys. 2009, 114. [Google Scholar] [CrossRef]
  26. Hajkowicz, L.A. Morphology of quantified ionospheric range spread-F over a wide range of midlatitudes in the Australian longitudinal sector. Ann. Geophys. 2007, 25, 1125–1130. [Google Scholar] [CrossRef]
  27. Bowman, G.G. Frontal and non-frontal characteristics of mid-latitude spread-F structures. Indian J. Radio Space Phys. 1990, 19, 62–68. [Google Scholar]
  28. Singleton, D.G. The morphology of spread-F occurrence over half a sunspot cycle. J. Geophys. Res. 1968, 73, 295–308. [Google Scholar] [CrossRef]
  29. Igarashi, K.; Kato, H. Solar cycle variations and latitudinal dependence on the mid-latitude spread-F occurrence around Japan. In Proceedings of the XXIV General Assembly, Kyoto, Japan, 15–27 August 1993. [Google Scholar]
  30. Paul, K.S.; Haralambous, H.; Oikonomou, C.; Paul, A.; Belehaki, A.; Ioanna, T.; Kouba, D.; Buresova, D. Multi-station investigation of spread F over Europe during low to high solar activity. J. Space Weather Space Clim. 2018, 8, A27. [Google Scholar] [CrossRef]
  31. Paul, K.S.; Haralambous, H.; Singh, A.K.; Gulyaeva, T.L.; Panchenko, V.A. Mid-latitude Spread F long-term occurrence characteristics as a function of latitude over Europe. Adv. Space Res. 2022, 70, 710–722. [Google Scholar] [CrossRef]
  32. Paul, K.S.; Haralambous, H.; Oikonomou, C.; Singh, A.K.; Gulyaeva, T.L.; Panchenko, V.A.; Altadill, D.; Buresova, D.; Mielich, J.; Verhulst, T. A mid-latitude spread F over an extended European area. J. Atmos. Sol.-Terr. Phys. 2023, 248, 106093. [Google Scholar] [CrossRef]
  33. Shimazaki, T. A statistical study of occurrence probability of spread F at high latitudes. J. Geophys. Res. 1962, 67, 4617–4634. [Google Scholar] [CrossRef]
  34. Paul, K.S.; Haralambous, H.; Oikonomou, C.; Paul, A. Long-term aspects of nighttime spread F over a low mid-latitude European station. Adv. Space Res. 2019, 64, 1199–1216. [Google Scholar] [CrossRef]
  35. Paul, K.S.; Haralambous, H.; Oikonomou, C.; Paul, A. Investigation of Satellite Trace (ST) and Multi-reflected Echo (MRE) ionogram signatures and its possible correlation to nighttime spread F development from Cyprus over the solar mini-max (2009–2016). Adv. Space Res. 2021, 67, 1958–1967. [Google Scholar] [CrossRef]
  36. Yang, Z.; Liu, Z. Correlation between ROTI and Ionospheric Scintillation Indices using Hong Kong low-latitude GPS data. GPS Solut. 2016, 20, 815–824. [Google Scholar] [CrossRef]
  37. Saito, A.; Fukao, S.; Miyazaki, S. High-resolution mapping of TEC perturbations with the GSI GPS network over Japan. Geophys. Res. Lett. 1998, 25, 3079–3082. [Google Scholar] [CrossRef]
  38. Cherniak, I.; Zakharenkova, I.; Krankowski, A. IGS ROTI maps: Current status and its extension towards equatorial region and southern hemisphere. Sensors 2022, 22, 3748. [Google Scholar] [CrossRef] [PubMed]
  39. Otsuka, Y.; Suzuki, K.; Nakagawa, S.; Nishioka, M.; Shiokawa, K.; Tsugawa, A. GPS observations of medium-scale travelling ionospheric disturbances over Europe. Ann. Geophys. 2013, 31, 163–172. [Google Scholar] [CrossRef]
  40. Reinisch, B.W.; Galkin, I.A. Global ionospheric radio observatory (GIRO). Earth Planets Space 2011, 63, 377–381. [Google Scholar] [CrossRef]
  41. Mrak, S.; Coster, A.; Groves, K.; Nikoukar, R. Ground-based infrastructure for observing and characterizing GNSS scintillation-producing ionospheric irregularities at mid-latitudes. Bull. Am. Astron. Soc. 2023, 55, 286. [Google Scholar]
  42. Liu, J.Y.; Shih-An, W. Global observations of ROTI by using ground-based GNSS receivers. TAO Terr. Atmos. Ocean. Sci. 2021, 32, 5. [Google Scholar] [CrossRef]
  43. Nguyen, C.T.; Oluwadare, S.T.; Le, N.T.; Alizadeh, M.; Wickert, J.; Schuh, H. Spatial and temporal distributions of ionospheric irregularities derived from regional and global ROTI maps. Remote Sens. 2021, 14, 10. [Google Scholar] [CrossRef]
  44. Liu, Y.; Zhou, C.; Xu, T.; Wang, Z.; Tang, Q.; Deng, Z.; Chen, G. Investigation of midlatitude nighttime ionospheric E-F coupling and interhemispheric coupling by using COSMIC GPS radio occultation measurements. J. Geophys. Res. Space Phys. 2020, 125, e2019JA027625. [Google Scholar] [CrossRef]
  45. Sivakandan, M.; Mondal, S.; Sarkhel, S.; Chakrabarty, D.; Sunil Krishna, M.V.; Chaitanya, P.P.; Patra, A.K.; Choudhary, R.K.; Pant, T.K.; Upadhayaya, A.K.; et al. Mid-latitude spread-F structures over the geomagnetic low-mid latitude transition region: An observational evidence. J. Geophys. Res. Space Phys. 2020, 125, e2019JA027531. [Google Scholar] [CrossRef]
  46. Haralambous, H.; Paul, K.S. Travelling Ionospheric Disturbance Direction of Propagation Detection Using Swarm AC In-Situ Electron Density. Remote Sens. 2023, 15, 897. [Google Scholar] [CrossRef]
  47. Ye, H.; Yi, W.; Zhou, B.; Wu, J.; Yu, B.; Tian, P.; Wang, J.; Long, C.; Lu, M.; Xue, X.; et al. Multi-Instrumental Observations of Midlatitude Plasma Irregularities over Eastern Asia during a Moderate Magnetic Storm on 16 July 2003. Remote Sens. 2023, 15, 1160. [Google Scholar] [CrossRef]
  48. King, G.A.M. Spread F on Ionograms. J. Atmos. Terr. Phys. 1970, 32, 209–221. [Google Scholar] [CrossRef]
  49. Jiang, C.; Wei, L.; Yang, G.; Aa, E.; Lan, T.; Liu, T.; Liu, J.; Zhao, Z. Large-scale ionospheric irregularities detected by ionosonde and GNSS receiver network. IEEE Geosci. Remote Sens. Lett. 2020, 18, 940–943. [Google Scholar] [CrossRef]
Figure 1. Geographical coordinates of the Digisonde stations over Europe.
Atmosphere 15 00331 g001
Figure 2. A case study of ROTI occurrence associated with RSF over low mid-latitude Digisonde stations (Athens, Rome, and Roquetes) in the European longitude sector recorded on 2–3 July 2011 during geomagnetically quiet conditions, (Dst~−25 nT).
Atmosphere 15 00331 g002
Figure 3. Detrended TEC maps with locations of low mid-latitude Digisonde stations (Athens, Rome, and Roquetes) in the European longitude sector recorded on 2–3 July 2011 during geomagnetically quiet conditions, (Dst~−25 nT).
Atmosphere 15 00331 g003
Figure 4. A case study of ROTI occurrence associated with RSF over upper mid-latitude Digisonde stations (Juliusruh, Fairford, Chilton, Dourbes, and Pruhonice) in the European longitude sector recorded on 3–4 April 2011 during geomagnetically quiet conditions, (Dst~−24 nT).
Atmosphere 15 00331 g004
Figure 5. Detrended TEC maps with locations of upper mid-latitude Digisonde stations (Juliusruh, Fairford, Chilton, Dourbes, and Pruhonice) in the European longitude sector recorded on 3–4 April 2011 during geomagnetically quiet conditions, (Dst~−24 nT).
Atmosphere 15 00331 g005
Figure 6. A case study of ROTI occurrence associated with RSF over mid-latitude Digisonde stations in the European longitude sector was recorded on 5–6 August 2011 during geomagnetically disturbed conditions, (Dst~−115 nT).
Atmosphere 15 00331 g006
Figure 7. A case study of ROTI activity during RSF to FSF evolution over Roquetes recorded on 5–6 August 2011 during geomagnetically disturbed conditions, (Dst~−115 nT).
Atmosphere 15 00331 g007
Figure 8. Detrended TEC maps with locations of mid-latitude Digisonde stations in the European longitude sector recorded on 5–6 August 2011 during geomagnetically disturbed conditions, (Dst ~−115 nT).
Atmosphere 15 00331 g008
Figure 9. (ah) Diurnal variation in significant ROTI in the presence of RSF over the eight Digisonde stations in 2011.
Atmosphere 15 00331 g009
Figure 10. Seasonal variation in the ROTI occurrences in the presence of RSF recorded over the (a) upper mid-latitude Digisonde stations (Juliusruh, Fairford, Chilton, Dourbes, and Pruhonice) and (b) low mid-latitude Digisonde stations (Athens, Rome, and Roquetes) of the European mid-latitude ionosphere in 2011.
Atmosphere 15 00331 g010
Figure 11. Comparative study of the seasonal ROTI occurrences associated with RSF recorded over the upper and low mid-latitude Digisonde stations of Europe in 2011.
Atmosphere 15 00331 g011
Table 1. Geographic latitude, longitude, station codes, and the data samples for ionograms for the Digisonde stations in 2011.
Station NameStation CodeGeographical Latitude (°N)Geographical Longitude (°E)Sampling Interval
JuliusruhJR05554.613.415 min.
FairfordFF05151.7358.515 min.
ChiltonRL05251.5359.410 min.
DourbesDB04950.14.65 min.
PruhonicePQ0525014.615 min.
RomeRO04141.912.515 min.
RoquetesEB04040.80.515 min.
AthensAT1383823.515 min.
Disclaimer/Publisher’s Note: The statements, opinions and data contained in all publications are solely those of the individual author(s) and contributor(s) and not of MDPI and/or the editor(s). MDPI and/or the editor(s) disclaim responsibility for any injury to people or property resulting from any ideas, methods, instructions or products referred to in the content.

