Article

The Relationship between the Typhoons Affecting South China and the Pacific Decadal Oscillation

Guangxi Climate Center, Nanning 530022, China
*
Author to whom correspondence should be addressed.
Atmosphere 2024, 15(3), 285; https://doi.org/10.3390/atmos15030285
Submission received: 5 January 2024 / Revised: 19 February 2024 / Accepted: 23 February 2024 / Published: 26 February 2024
(This article belongs to the Special Issue Advances in Tropical Cyclone Climate Research)

Abstract

:
Using typhoon data from the Shanghai Typhoon Institute of the China Meteorological Administration, the Japan Meteorological Agency’s annual Pacific decadal oscillation (PDO) index, and NCEP/NCAR reanalysis data from 1951 to 2021, correlation and composite analyses were carried out to study the relationship between the variability among tropical cyclones of different magnitudes affecting South China and the PDO. The results show that there is an obvious out-of-phase relationship between the proportion of tropical cyclones reaching a typhoon-level intensity or above in South China and the PDO index. When the PDO is in a cold (warm) phase, the sea surface temperature in the eastern and central equatorial Pacific is cold (warm), similar to the eastern Pacific La Niña (El Niño) phenomenon, and the SST in the eastern and western tropical Pacific Ocean shows a negative (positive) gradient; the subtropical high in the western Pacific Ocean is weaker (stronger) than normal, with the western ridge point to the east (west), and the 500 hPa geopotential height in the South China Sea and the area east of the Philippines is weaker (stronger), which is conducive to (unfavorable to) the formation of a monsoon trough; and the westerly (easterly) winds at high altitudes and the southwesterly (northeasterly) winds at low altitudes from the South China Sea to the Philippines are abnormally strong, and a positive (negative) vorticity at low altitudes, a low (high) sea level pressure, and strong (weak) convection are shown. These conditions are favorable (unfavorable) for the intensification of typhoons affecting South China, and as a result, the number of tropical cyclones reaching the level of typhoons or above account for a greater (smaller) proportion of those affecting South China.

1. Introduction

South China is adjacent to the western Pacific and is often severely affected by typhoons every year, causing significant economic losses and casualties. In the context of global warming, the climate system has become increasingly unstable, there has been an increase in heat and humidity in the lower troposphere over the tropical oceans, and the energy required for deep convection is on the rise, with changes in ambient heat exerting the greatest impact on the severity of typhoons [1]. Rapidly intensifying typhoons on the surface of the northwest Pacific are becoming more common, and the tendency for typhoons to intensify into super typhoons is becoming more prevalent. Typhoons originating from the western northwest Pacific tend to gain strength upon landfall, whereas those from the eastern northwest Pacific rarely do. Super typhoons are more likely to land in the northwest Pacific, putting the western area of South China at an increasingly higher risk of being affected [2,3,4]. Significant changes in environmental steering flow have occurred in recent decades. With an increase in the number of typhoons making landfall in eastern China due to the southeasterly flow of cyclonic circulation in the southeast [5], the number of annual tropical cyclone landfalls has decreased in Southern China [6]. The increasingly destructive nature of the typhoons hitting the Chinese mainland every year negatively affects the economy and results in the loss of human life [7]. The above research shows that more intense tropical cyclones occur in the northwest Pacific, and China is becoming increasingly affected by tropical cyclones under the background of climate warming. However, there is currently limited research on the climate change characteristics of the various levels of tropical cyclones affecting Southern China, especially on the change characteristics of the proportion of strong tropical cyclones; are the trends shown the same as those of the tropical cyclones that make landfall?
The Pacific SST displays obvious interdecadal variability, with the most famous being the Pacific decadal oscillation (PDO), the development of which is capable of triggering anomalies in the atmospheric circulation on a global scale [8]. The PDO is the main factor related to the occurrence of typhoons in the northwest Pacific and the probable cause of interdecadal variability [9]. The close relationships between typhoon frequency and the El Niño—southern oscillation (ENSO) and between typhoon intensification and snowpack on the eastern Tibetan Plateau may be associated with the current PDO phase, with both of the above correlations strengthening during the PDO’s cold phase, and vice versa during the warm phase [10,11,12]. The PDO plays a moderating role in the frequency of typhoons in the northwest Pacific, with anticyclonic circulation in the Philippines increasing in size and fewer typhoons occurring in the northwest Pacific during the PDO’s warm phase [13,14,15]. The above research reveals that the PDO affects atmospheric circulation through sea surface temperature (SST) anomaly modes, thereby affecting the occurrence and development of tropical cyclones in the northwest Pacific.
SST anomaly modes are the main driving force for changes in northwest Pacific tropical cyclones. The extremes in seasonal northwest Pacific tropical cyclone activity are driven by SST variables such as ENSO [16]. How do SST anomaly modes affect atmospheric circulation? The impacts of SST zonal gradients on the atmosphere were studied, and the zonal gradient of the SST from the North Indian Ocean to the northwest Pacific triggers abnormal circulation similar to that of the Walker circulation, causing abnormal downdrafts at high altitudes over the northern part of the South China Sea and divergence in the boundary layer, inhibiting Madden–Julian oscillation (MJO) activity in the South China Sea and leading to fewer typhoons there [17].
The PDO also plays a moderating role in the rapid intensification of typhoons in the northwest Pacific. The PDO’s cold (warm) phase is characterized by the presence (absence) of a steeper thermocline in the northwest Pacific, which hinders the eastward propagation of warm water and leads to an increase (decrease) in the number of rapidly intensifying typhoons. For example, at the beginning of the PDO’s cold phase in 2006, the intensity of the typhoons that made landfall or severely affected Guangdong increased significantly [18,19,20]. Most of the above studies focused on the impact of the PDO on the tropical cyclones in the northwest Pacific; however, South China possesses a unique terrain and landforms, and the tropical cyclones affecting South China also possess unique characteristics, though we still lack a comprehensive understanding of the changes in the proportion of typhoons (including typhoons, severe typhoons, and super typhoons) affecting South China in terms of their total number and their connections to ocean–atmosphere anomalies in different PDO phases.
Therefore, the objectives of this study were (1) to analyze the interannual variation characteristics of tropical cyclones affecting South China at all levels, revealing the relationship between the proportion of tropical cyclones reaching or exceeding a typhoon level and affecting South China (hereafter referred to as SCTYs) and the PDO index, and (2) to study the characteristics of the SST, subtropical highs, relative humidity, sea level pressure (SLP), wind, convection, and Madden–Julian oscillation (MJO) during different PDO phases and their correlations with the proportion of SCTYs.

2. Data and Methods

2.1. Data

This study utilized tropical cyclone data from the Shanghai Typhoon Institute of the China Meteorological Administration (https://tcdata.typhoon.org.cn/en/index.html, accessed on 18 February 2024); the Japan Meteorological Agency’s annual PDO index (https://www.data.jma.go.jp/gmd/kaiyou/data/db/climate/pdo/pdo.txt, accessed on 18 February 2024); the National Centers for Environmental Prediction (NCEP)/National Center for Atmospheric Research (NCAR) reanalysis data (https://www.esrl.noaa.gov/psd/data/gridded/data.ncep.reanalysis.html, accessed on 18 February 2024); the National Oceanic and Atmospheric Administration (NOAA) Extended Reconstructed Sea Surface Temperature (ERSST) (https://www1.ncdc.noaa.gov/pub/data/cmb/ersst/v3b/ascii/, accessed on 18 February 2024) for the years 1951 to 2021; the daily outgoing long-wave radiation (OLR) data (https://www.esrl.noaa.gov/psd/data/gridded/data.interp_OLR.html, accessed on 18 February 2024) from NOAA for the years 1979 to 2021; and the MJO index, averaged every five days (http://www.cpc.ncep.noaa.gov/products/precip/CWlink/daily_mjo_index/proj_norm_order.ascii, accessed on 18 February 2024), from the NOAA Climate Prediction Center (CPC) for the years 1978 to 2021.
The tropical cyclone centers entering the region (15°–28° N, 104°–115° E) were defined as tropical cyclones affecting Southern China (hereafter referred to as SCTCs). SCTCs include tropical depressions, tropical storms, severe tropical storms, typhoons, severe typhoons, and super typhoons. The negative PDO index years included 1961–1976, 1989–1991, 1999–2002, and 2007–2013 (hereinafter referred to as the “cold phase”), and the positive PDO index years included 1977–1988, 1992–1998, 2003–2006, and 2014–2019 (hereinafter referred to as the “warm phase”).

2.2. Methods

Parallel empirical orthogonal function (EOF) analyses of the monthly SST anomaly fields were performed based on the temporal covariance matrix from 1901 to 2000. The PDO index is defined as the projections of monthly mean SST anomalies onto their first EOF vectors in the North Pacific (north of 20° N), which serves as an indicator of the Pacific decadal oscillation [21].
The statistical methods employed in this study included a correlation analysis, linear regression equations, a composite analysis, etc. The correlation coefficient was calculated as follows:
r ( i , j ) = t = 1 y n ( H i , j , t H i , j ¯ ) ( P D O t P D O ¯ ) t = 1 y n ( H i , j , t H i , j ¯ ) 2 t = 1 y n ( P D O t P D O ¯ ) 2
where r(i,j) is the correlation coefficient of each grid point, Hi,j,t and PDOt are the time series of each grid point value and the PDO index, H i , j ¯ and P D O ¯ are each grid point’s climatological value and PDO index, yn is the year, and (i,j) is the grid point position. The Monte Carlo method was used for correlation significance testing.

3. Results

3.1. Climatic Characteristics of Tropical Cyclones Affecting South China and Their Relationship with the PDO Index

The average annual number of SCTCs during the period of 1951–2021 was 7.8 and showed a decreasing trend, which reached high points of 14 in 1964 and 2013, and 13 in 1971, 1973, and 1994. The lowest number was two in 1998. An average of 0.7 tropical depressions, 1.4 tropical storms, 2.1 severe tropical storms, 2.3 typhoons, 1.1 severe typhoons, and 0.2 super typhoons affect South China annually, of which 4.2 are below the severe tropical storm level and 3.6 are above the typhoon level. Figure 1a shows the changes in the number of tropical cyclones at all levels during 1951–2021, including an increase in the number of tropical storms (passing the significance test at 0.1) and severe tropical storms and a decrease in the numbers of all other types of SCTCs.
Figure 1b illustrates the variations in the proportion of tropical cyclones reaching or exceeding the typhoon level and affecting South China (hereafter referred to as SCTYs) and the PDO index during the period of 1951–2021. A significant out-of-phase correlation between the proportion of SCTYs and the PDO index can be observed, with a correlation coefficient of −0.43 and a significant correlation at the 99.9% confidence level. In other words, if the PDO index is positive (negative), the proportion of SCTYs is small (large). Put another way, the probability of SCTYs occurring decreases (increases), and the proportion of SCTCs that are below the severe tropical storm level increases (decreases).

3.2. Characteristics of Ocean–Atmosphere Anomalies in Different PDO Phases and Their Relationship with the Proportion of SCTYs

The rapid intensification of typhoons in the northwest Pacific is related to conditions such as a high SST and humidity. An analysis of the characteristics of the SST, subtropical highs, relative humidity, sea level pressure (SLP), wind, convection, and MJO in the Pacific during different PDO phases and their correlations with the proportion of SCTYs is presented in the following sections.

3.2.1. SST

The SST plays an important role in changing the typhoon intensity, and an SST ≥ 28 °C is an important factor in rapid typhoon intensification [22]. Because of La Niña (El Niño), the maximum typhoon kinetic energy occurs closer to the western (eastern) part of the western Pacific, with typhoon genesis occurring further west (east), conducive to intensified (weakened) Walker circulation, the propagation of the typhoon kinetic energy westward (northward), and the intensification (weakening) of westbound typhoons [23,24,25,26]. Different types of the El Niño phenomenon are associated with the westward extension of the western North Pacific subtropical high, thereby affecting the typhoons making landfall in China [27]. Figure 2a illustrates the SST and anomalies during the PDO’s cold phase from July to September (JAS), clearly showing the SST in the tropical western Pacific to be higher than 28 °C, abnormally high in the middle latitudes of the northern Pacific, and cold in the eastern and central equatorial Pacific, in a state of the eastern Pacific La Niña phenomenon. The SSTs of the eastern and western Pacific show a distribution pattern of “cold in the east and warm in the west”. Airflow ascends in the western part and sinks in the eastern part of the tropical Pacific, strengthening Walker circulation, intensifying SCTCs, and leading to a large proportion of SCTYs. Figure 2b shows the SST distribution during the PDO’s warm phase. The eastern and central equatorial Pacific SSTs are warm, and the tropical Pacific is in a state of the eastern Pacific El Niño phenomenon. Walker circulation is weak. Anticyclonic circulation in the northwest Pacific is stronger, which is not conducive to the intensification of SCTCs, and the proportion of SCTYs remains modest.

3.2.2. Subtropical High

SCTYs often originate on the southern edge of the western Pacific subtropical high, which plays a crucial role in the entry and landing of typhoons in the northwest Pacific and the South China Sea [28,29]. During the PDO’s warm phase, the subtropical high is strong, and its controlled regional sinking motion inhibits convection, resulting in the strengthening of tropical easterly trade winds and weakening the monsoon trough (MT), which is not conducive to the genesis and intensification of typhoons [30,31]. Figure 3a shows the correlation coefficient between the PDO index and the 500 hPa geopotential height during the period of 1951–2019. The shaded areas in the figure show a significant correlation at the 95% confidence level; there is a significant positive correlation in tropical regions, while the eastern belt of the Korean Peninsula shows a significant negative correlation. It can be seen that there is a close relationship between the PDO and the intensity and position of the subtropical high in the northwest Pacific. Figure 3b illustrates the difference in the JAS 500 hPa geopotential height between the PDO’s cold and warm phases, showing that the western Pacific subtropical high is weaker than normal, with its western ridge further east in the PDO’s cold phase. There are significant negative anomalies in the northwest Pacific and on the Chinese mainland (significant difference at the 95% confidence level). The geopotential height to the east of the Philippines and in the South China Sea is weak, which is conducive to the MT and the genesis and intensification of SCTCs. The proportion of SCTYs is, thus, considerable. During the PDO’s warm phase, the western Pacific tropical high is more pronounced than usual and the western ridge is further west. There are significant positive anomalies in the northwest Pacific and on the Chinese mainland, and the 500 hPa geopotential height to the east of the Philippines and in the South China Sea is stronger. The probability of the tropical cyclone genesis regions being controlled by the subtropical high and its downdrafts is high, which is not conducive to the genesis and intensification of SCTCs, with a smaller proportion of SCTYs.

3.2.3. Relative Humidity

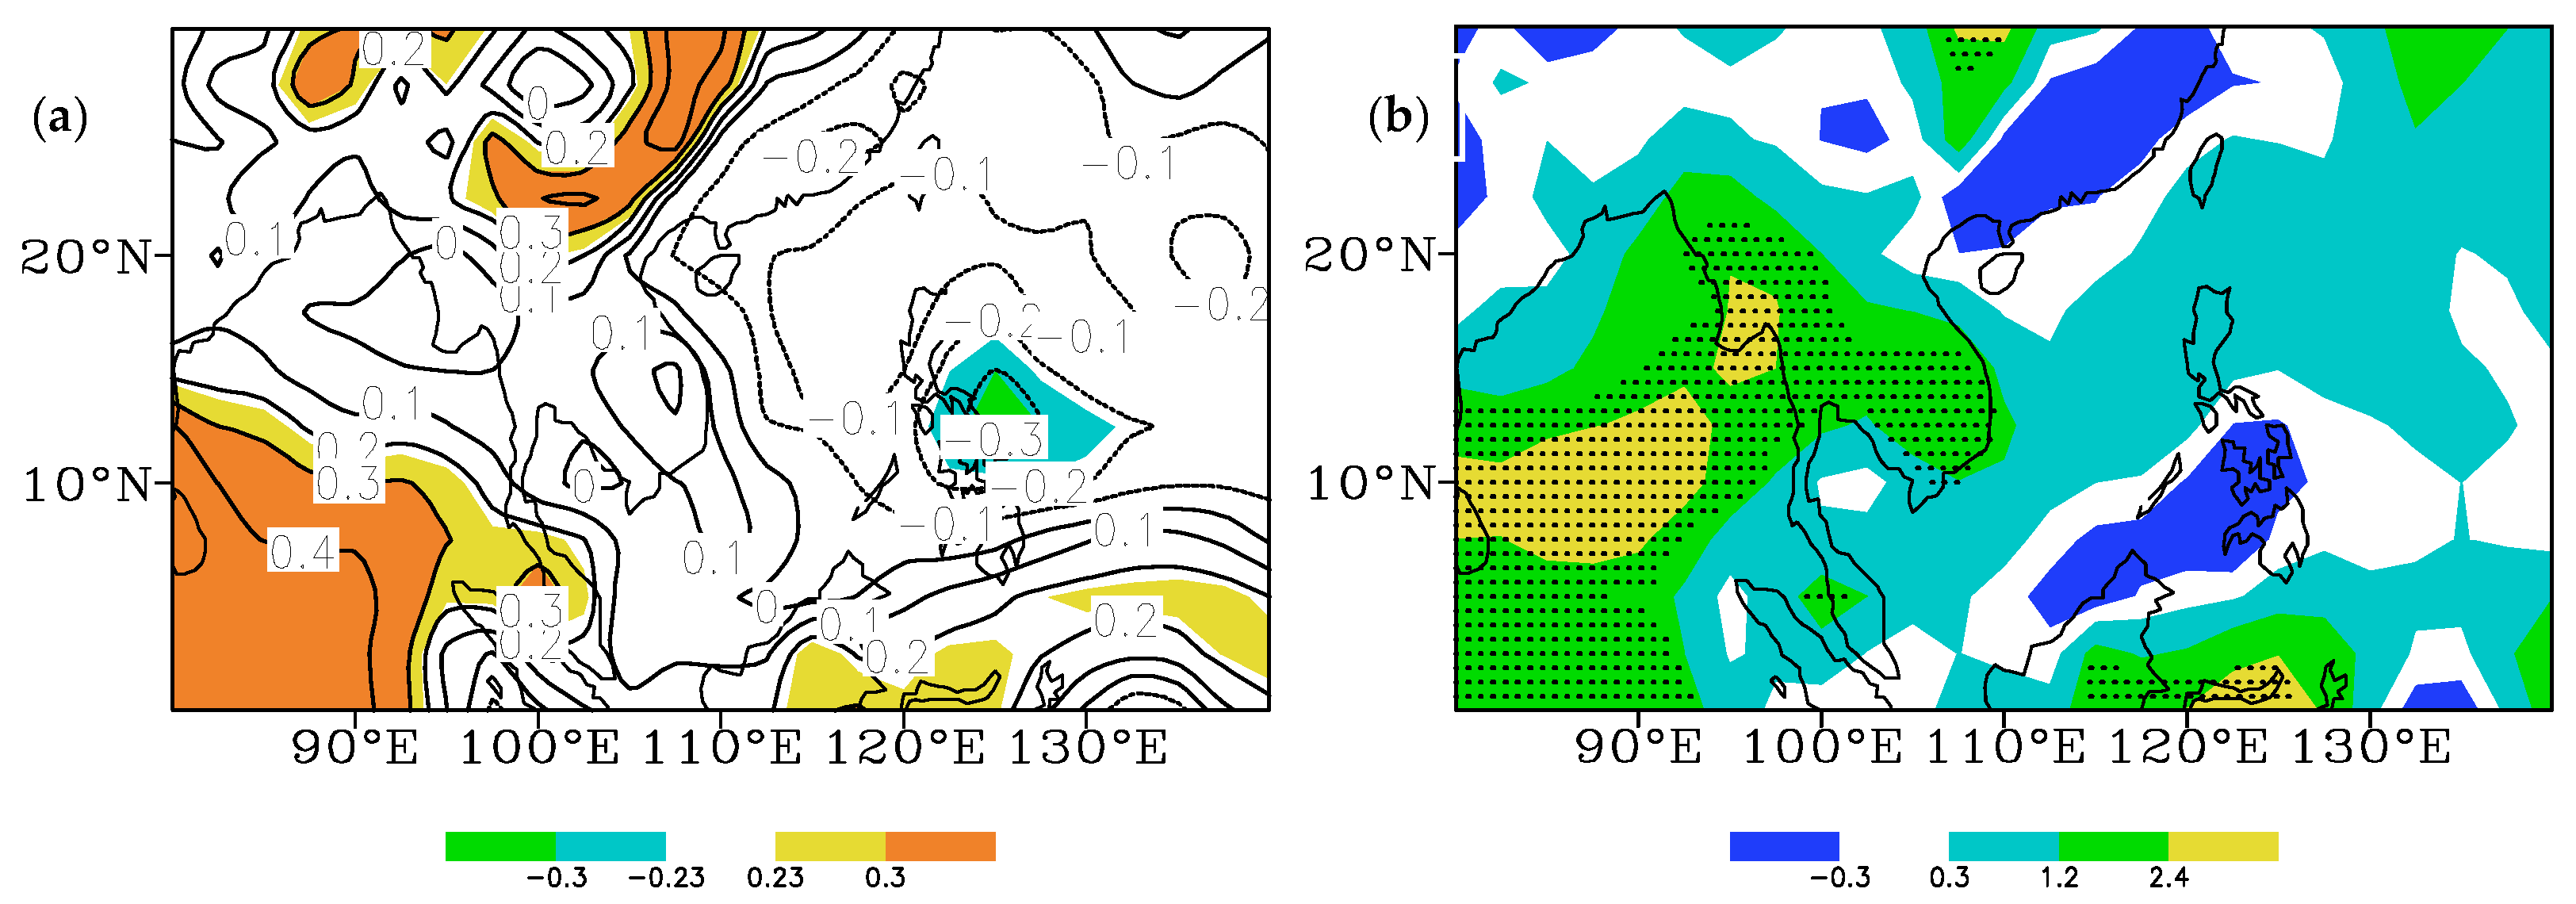
Higher water vapor and humidity play an important role in the genesis and development of tropical cyclones [32]. Figure 4a shows the correlation coefficient between the proportion of SCTYs and the 850 hPa relative humidity during the period of 1951–2021. There was a significant positive correlation between the Bay of Bengal and southwestern China; it can be seen that water vapor from the Bay of Bengal is important for SCTCs, and a high relative humidity is beneficial for increasing the proportion of SCTYs. Figure 4b displays the difference in the 850 hPa relative humidity between the PDO cold and warm phases, showing abnormal positive anomalies in the relative humidity near the Bay of Bengal, the Indochinese Peninsula, the central and northern South China Sea, and the Philippines, creating an enhanced water vapor transport belt with high humidity between the Bay of Bengal and the Indochinese Peninsula. A cradle of SCTYs was found in the central and northern South China Sea in the vicinity of the Philippines, with positive anomalies in the relative humidity being highly conducive to the intensification of SCTCs, resulting in a larger proportion of SCTYs. The relative humidity at 850 hPa during the PDO’s warm phase was the opposite to that of the cold phase, when abnormal negative anomalies and the weak transport of water vapor prevail near the Bay of Bengal, Indochinese Peninsula, the central and northern South China Sea, and the Philippines; these negative anomalies of relative humidity are not conducive to the intensification of SCTCs, resulting in a small proportion of SCTYs.

3.2.4. Sea Level Pressure

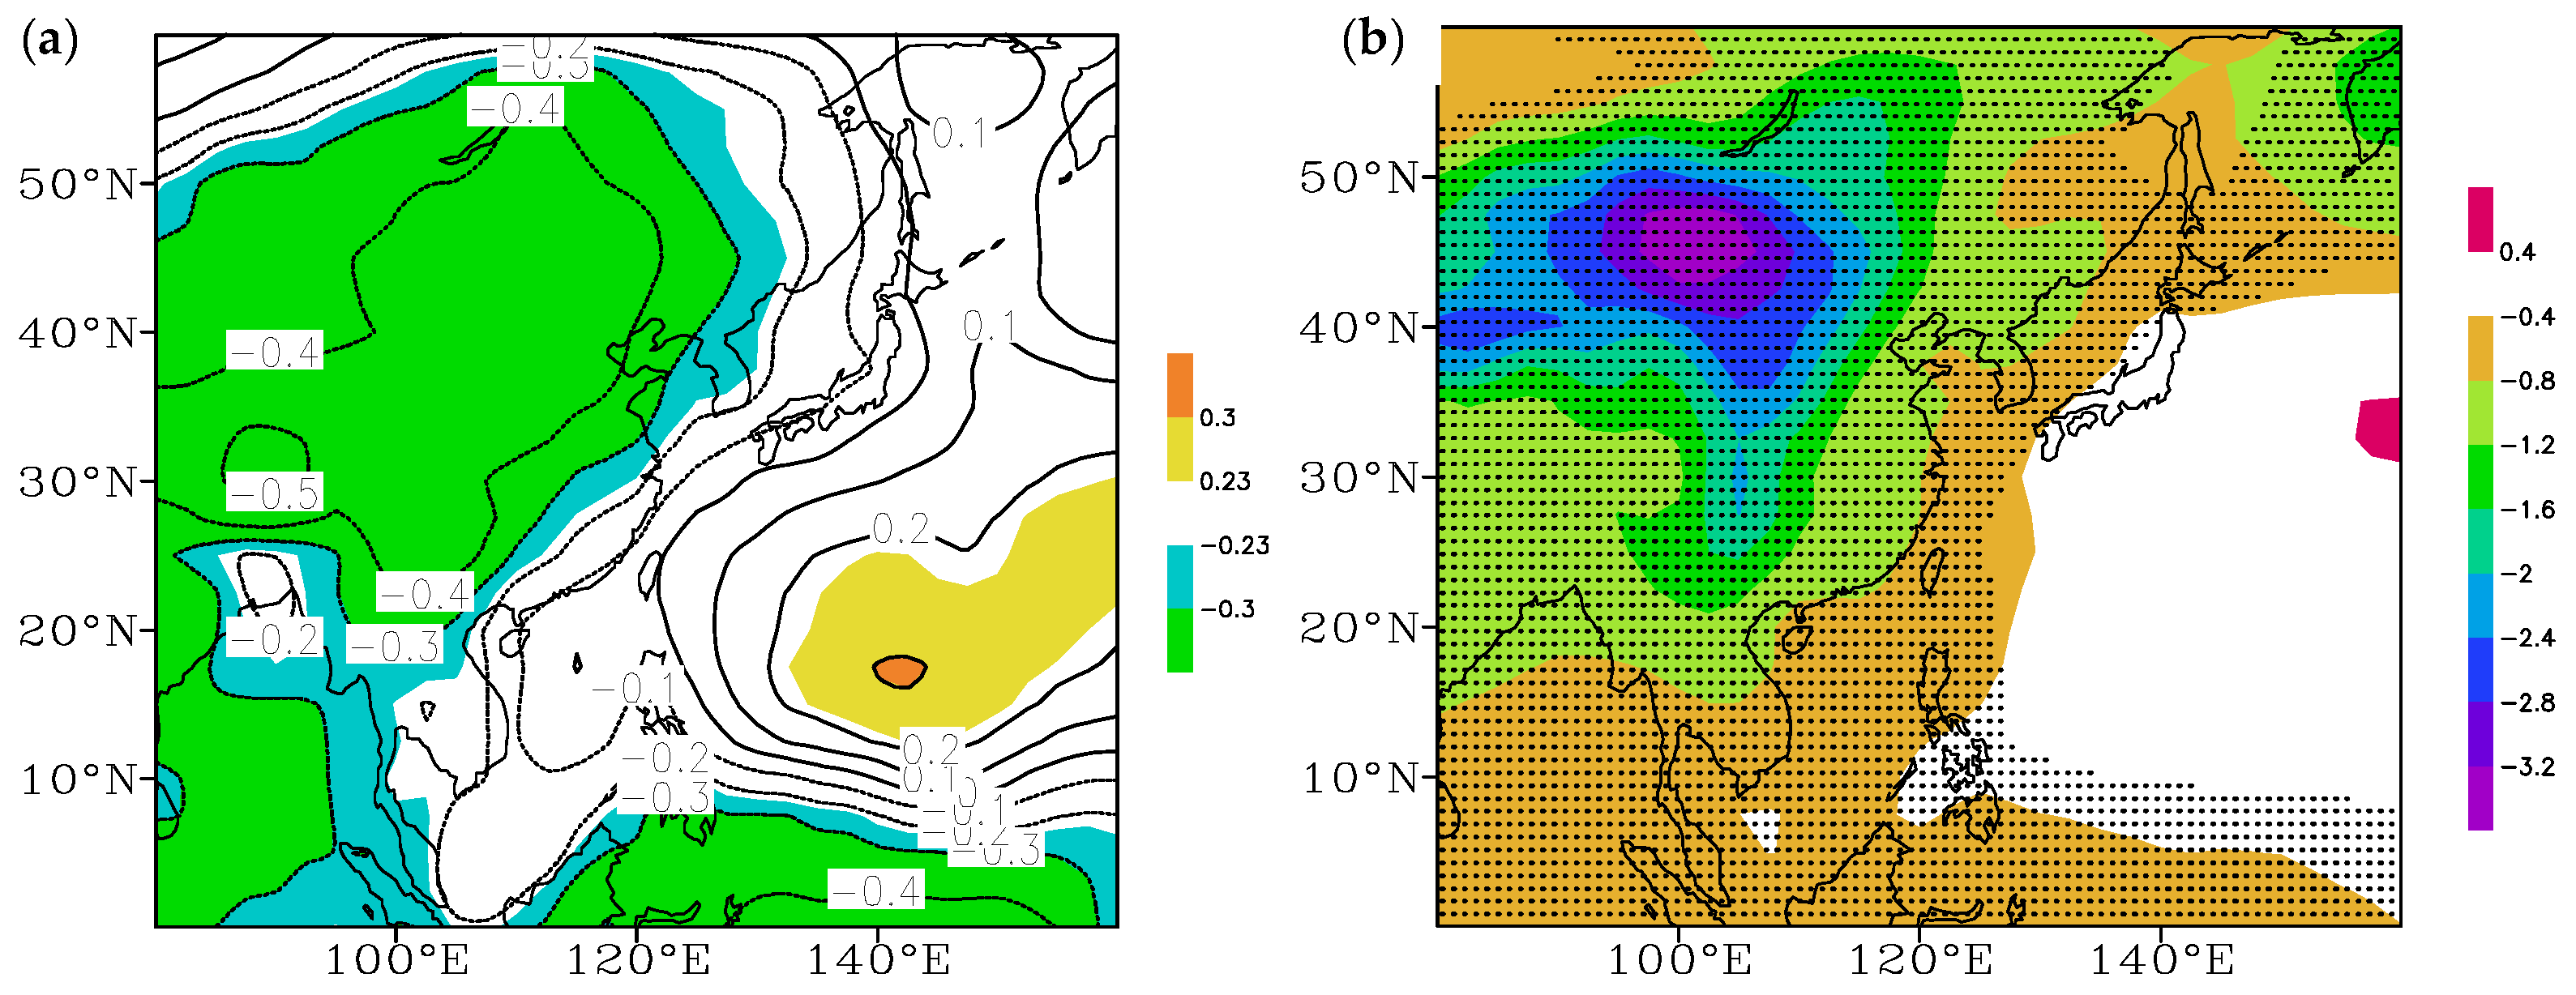
The SLP is more conducive to the genesis and development of typhoons [33]. Figure 5a shows the correlation coefficient between the proportion of SCTYs and the SLP during the period of 1951–2021. There is a significant negative correlation between the Chinese mainland and the Bay of Bengal, while there is a positive correlation in the eastern Philippines. It can be seen that the distribution pattern of the Chinese mainland’s low pressure and the eastern Philippines’ high pressure forms a positive pressure gradient in the west–east direction, which is conducive to the enhancement of SCTCs, leading to an increase in the proportion of SCTYs. Figure 5b illustrates the difference in the SLP between the PDO’s cold and warm phases. During the PDO’s cold phase, the SLP in the Bay of Bengal, in the vicinity of the Philippines, and from the South China Sea to the Asian continent is weak, with the area from North China to Mongolia featuring at the center of the abnormal negative anomalies, forming a positive pressure gradient in the west–east direction. The lower SLP near the Philippines and the South China Sea is conducive to the intensification of SCTCs, leading to a large proportion of SCTYs. During the PDO warm phase, the SLP is more pronounced near the Philippines, the South China Sea, and the Asian continent, with the area from North China to Mongolia featuring at the center of the abnormal positive anomalies. The higher SLP near the Philippines and the South China Sea is not conducive to the development and intensification of SCTCs. It has been observed that, when the PDO is in a cold (warm) phase, the SLP near the Philippines and the South China Sea is lower (higher) than normal, which is conducive to the intensification (weakening) of SCTCs, resulting in a larger (smaller) proportion of SCTYs.

3.2.5. High- and Low-Altitude Wind Fields

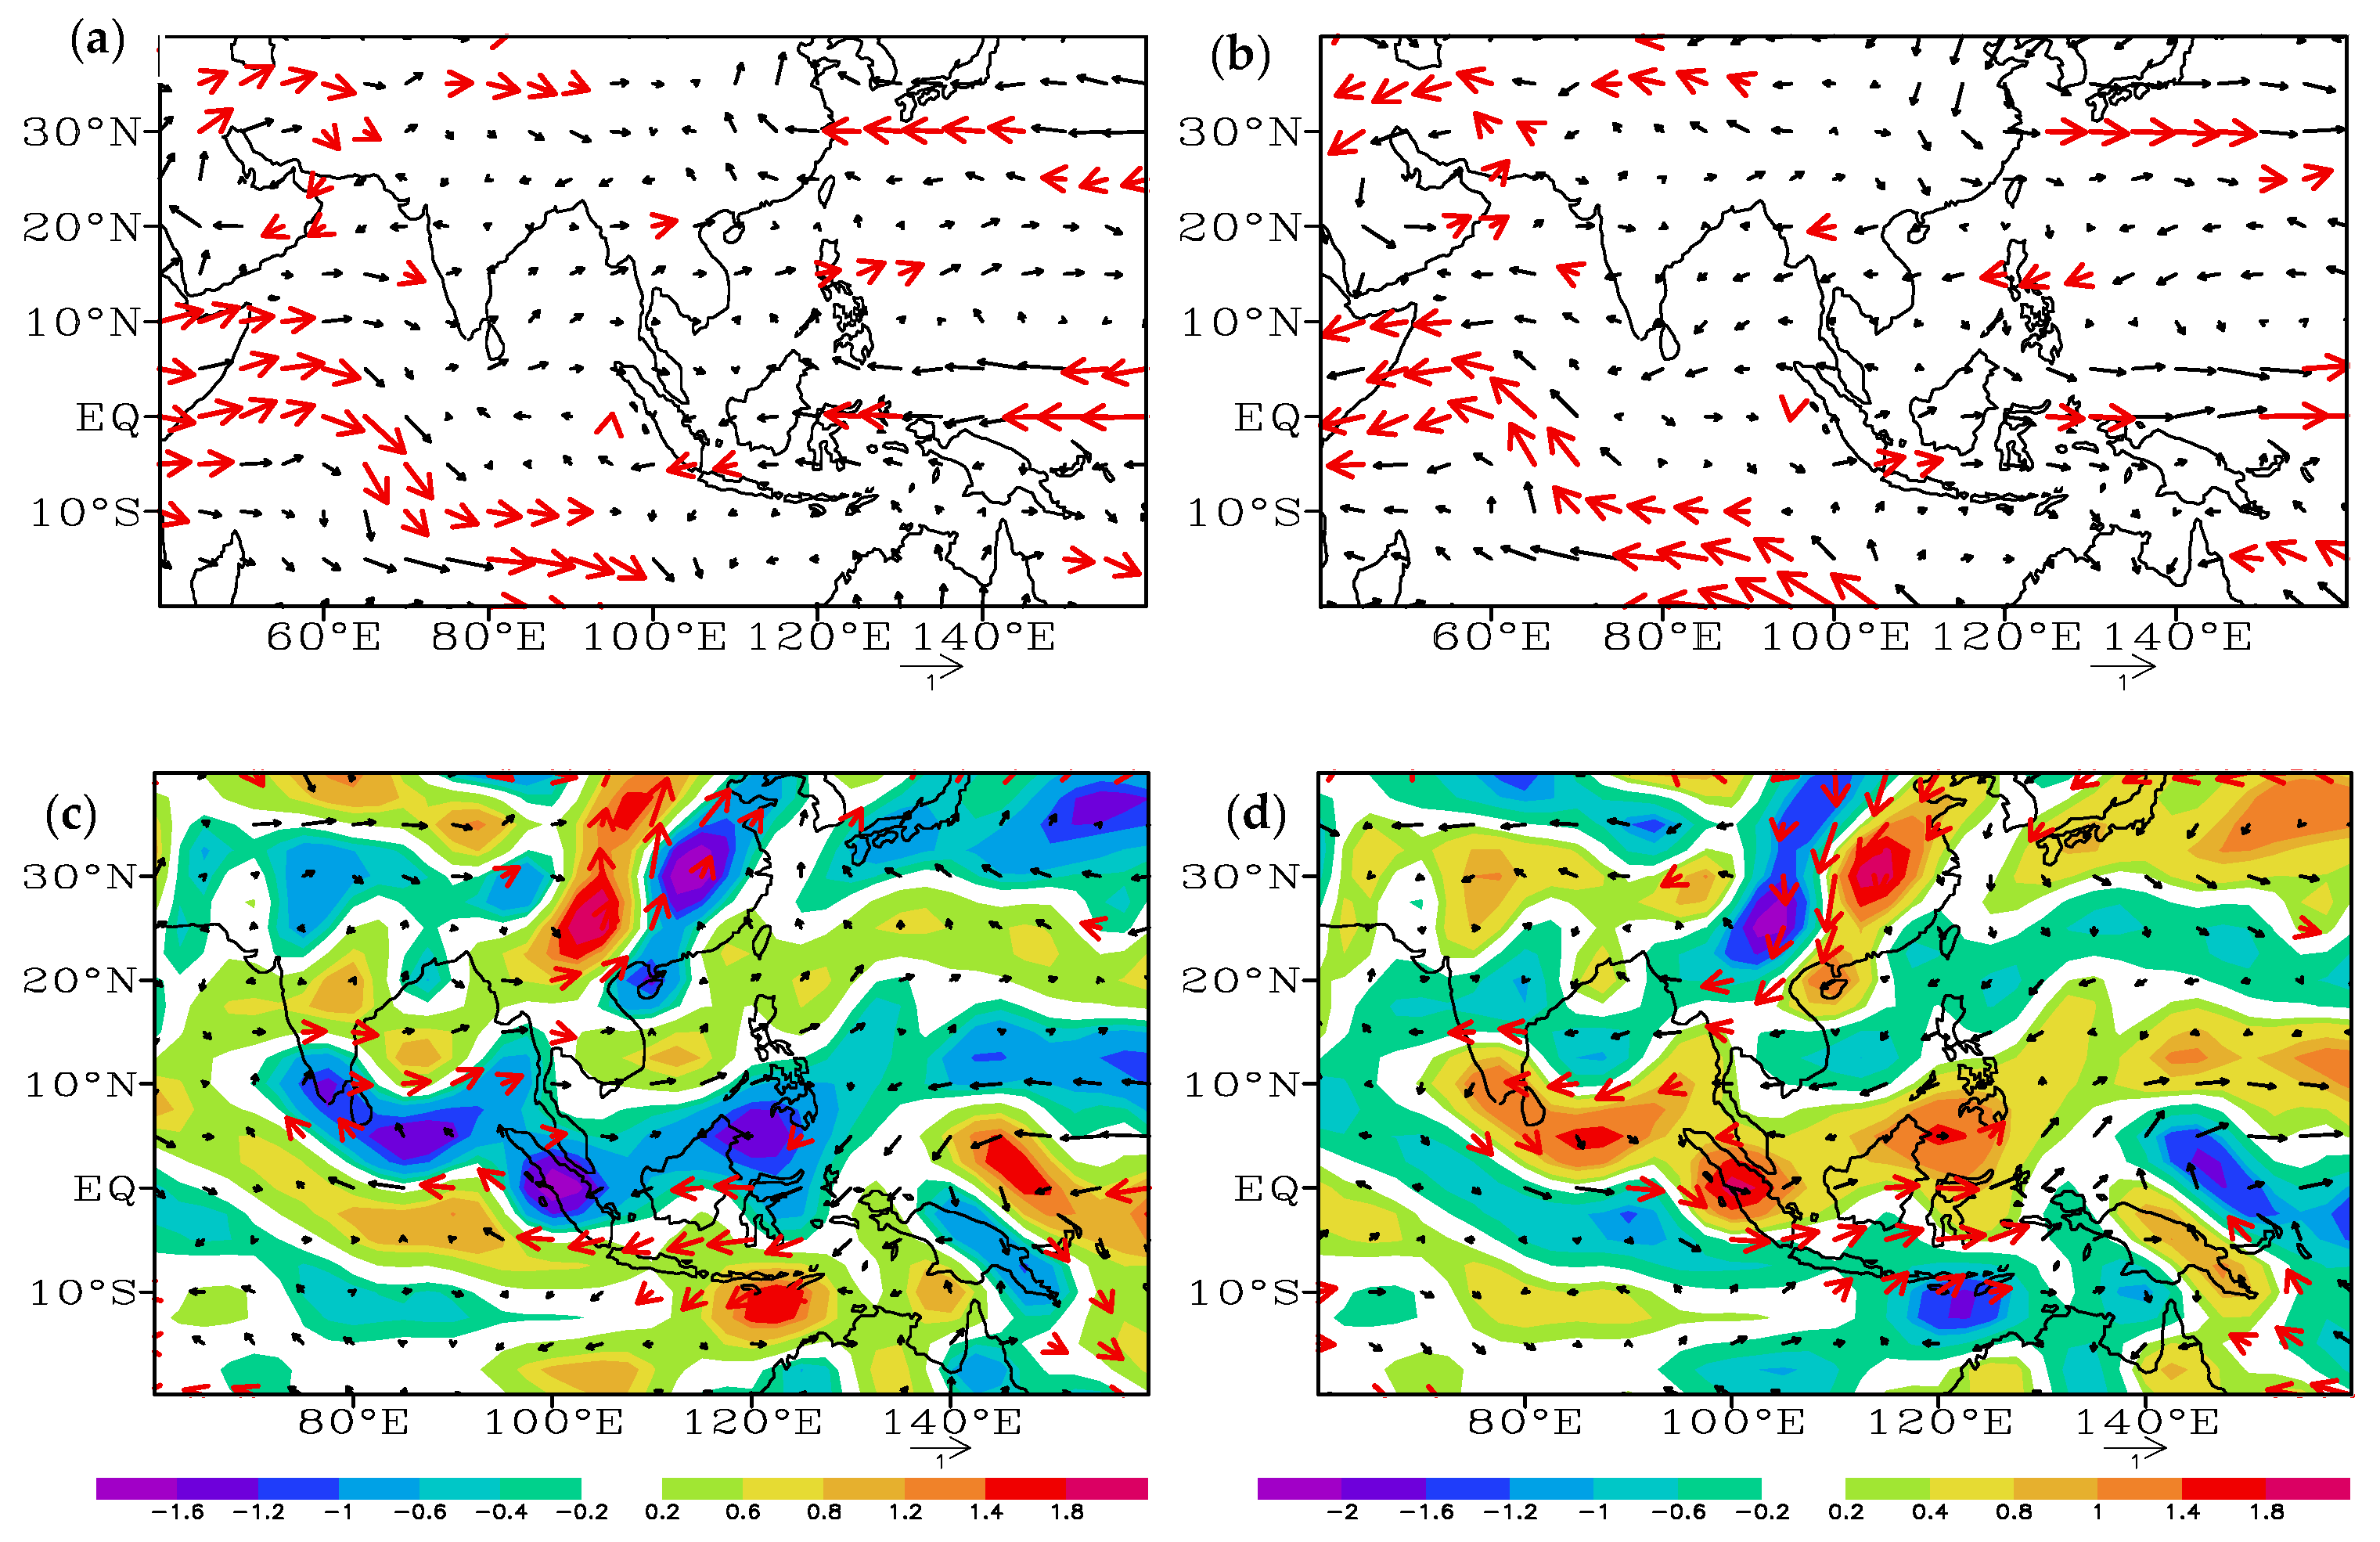
The activities of tropical cyclones in the northwest Pacific are closely related to monsoon troughs (MTs) or vortices that affect the structure of tropical cyclones, and thus, their genesis and development [34,35,36]. When the PDO is in a cold phase, there are two enhanced anticyclonic circulation zones in the 500 hPa wind in the northwest Pacific. One is located in the equatorial tropical western Pacific, the western edge of which reaches the South China Sea. The other is located in the mid–high latitude area, the western edge of which extends to East China. The two zones form an MT in the coastal areas of South China and the Philippines, which is conducive to the genesis, development, and intensification of SCTCs. There is an obvious eastward and northward cross-equatorial airflow enhancement zone in equatorial tropical Africa, intensifying SCTCs and leading to a large proportion of SCTYs (Figure 6a). When the PDO is in a warm phase, the 500 hPa wind field is the opposite of that in the cold phase. There are two enhanced cyclonic circulation zones in the northwest Pacific, and there is one enhanced zone of westerly winds towards equatorial tropical Africa in Western Australia. The northerly winds from eastern China to the South China Sea are stronger, the westerly winds east of the subtropical East China Sea are significantly intensified, and the easterly winds from the tropical South China Sea to the Philippines are abnormally strengthened, causing the MT to retreat eastward and the frequency of typhoons to reduce significantly. These conditions are not conducive to the intensification of SCTCs, and they lead to a smaller proportion of SCTYs (Figure 6b).
Slightly north of the tropical convergence zone, typhoons in the northwest Pacific occur significantly more frequently than normal [18], and their intensity is closely related to the vertical wind shear [37]. There is a significant positive correlation between the frequency of typhoons and the injection intensity at the approach to the tropical easterly jet in the western Pacific [38]. When the PDO is in a cold phase, there is an enhanced airflow zone in the 850 hPa wind that crosses the equator from Northern Australia to the west and north. It turns eastward in the middle of the North Indian Ocean through the Bay of Bengal and the Indochinese Peninsula before reaching the Chinese mainland in the north and the South China Sea and near the Philippines in the east, which is conducive to the transport of water vapor from the Indian Ocean to South China, forming positive vorticity near the central South China Sea, the eastern coast of South China, and near the Philippines. With the corresponding tropical convergence zone located further north, it is conducive to ascending movement, intensifies SCTCs, and leads to a large proportion of SCTYs (Figure 6c). When the PDO is in a warm phase, the 850 hPa wind is opposite to that in the cold phase. There is a southward airflow on the Chinese mainland that moves across the Indochinese Peninsula and the North Indian Ocean, reaching Northern Australia. There are negative vorticities in most of the South China Sea, the eastern coastal areas of South China, and the vicinity of the Philippines, with the corresponding tropical convergence zone located further south, which is not conducive to the intensification of SCTCs, resulting in a small proportion of SCTYs (Figure 6d).

3.2.6. Atmospheric Convection

OLR reflects the atmospheric convection condition. The smaller the OLR value, the lower the top temperature of the convective cloud, the greater the height, and the stronger the intensity of the atmospheric convection. Figure 7a illustrates the distribution of JAS OLR anomalies when the PDO is in a cold phase, from which it can be seen that areas in the South China Sea and east of the Philippines demonstrate negative anomalies, a significant difference at the 95% confidence level, and intensified atmospheric convection, which is conducive to the intensification of SCTCs and an increase in the proportion of SCTYs. When the PDO is in a warm phase, the distribution of OLR anomalies is opposite to that of the cold phase, with significant positive anomalies in the South China Sea and east of the Philippines and suppressed atmospheric convection, which is not conducive to the intensification of SCTCs, reducing the proportion of SCTYs (Figure 7b).

3.2.7. Madden–Julian Oscillation

The Madden–Julian oscillation (MJO) is a low-frequency oscillation phenomenon at the time scale of 30 to 60 days in the tropical atmosphere [39,40]. The MJO has an important impact on the genesis and development of tropical cyclones in the western Pacific, especially when it is combined with waveforms of different scales, such as equatorial Rossby waves, gravity waves, Kelvin waves, and tropical depressions [41,42,43,44]. In the marine areas where tropical cyclones originate, there are more tropical cyclones when the MJO is in the convective phase, with fewer tropical cyclones when the MJO is experiencing convective inhibition [45,46,47,48]. Judging from the composite of the JAS MJO index during the PDO’s cold and warm phases, when the PDO is in a cold phase, the negative centers of the JAS MJO index can be found primarily in the area from the East Indian Ocean to the western Pacific; that is to say, the phases of MJO convection are mostly in the source areas of tropical cyclones, which is conducive to the development and intensification of SCTCs, leading to an increasing proportion of SCTYs (Figure 8a). When the PDO is in a warm phase, the MJO convection inhibition zone moves significantly eastward in mid-to-late July, with the convection development phase in the central and eastern Pacific. From August to September, the western Pacific is in the convection inhibition phase; in other words, the convection at the genesis region of tropical cyclones is inhibited, which is not conducive to the development and intensification of SCTCs, resulting in a small proportion of SCTYs (Figure 8b).

4. Discussion

4.1. Climate Change and SCTCs

This study reveals a significant correlation between the proportion of SCTYs and the PDO for the first time. This helps explain why, in recent years, despite a decreasing trend in the number of tropical cyclones, the impact of tropical cyclones has become increasingly severe. For example, the frequency of rapidly strengthening tropical cyclones on the surface of the northwest Pacific Ocean has significantly increased since 1998 [2], and in recent years, the trend of coastal typhoons strengthening into super typhoons has become increasingly significant. Typhoons generated in the western part of the northwest Pacific have dramatically increased in size at landfall, with an increase in the number of super typhoons landing in the northwest Pacific; the risk of super typhoons affecting western South China and southeastern China is increasing [3,4]. In the context of a decreasing trend in the number of SCTCs, these research findings are rare and valuable.

4.2. SST and Subtropical High

There have been many studies on the impact of the SST on the tropical cyclone genesis frequency, and although some research results have been achieved [49,50], there is still limited research on the relationship between the SST and the proportion of SCTYs. A composite method was used to analyze the anomalous characteristics of the SST and a 500 hPa geopotential height and their relationship with typhoons in South China in the PDO’s cold phases and warm phases. Relevant significance testing methods were used to increase the credibility. From the perspective of the SST, when the PDO is in the cold (warm) phase, the distribution mode of the SST in the east and west of the Pacific Ocean shows a “cold (warm) to the east and warm (cold) to the west” pattern. Different SST modes in the east and west directions directly affect the strength of the subtropical high. When the PDO is in the warm phase, the east Pacific SST is warm and the west Pacific SST is cold; the probability of the tropical cyclone genesis regions being controlled by the subtropical high and its downdrafts is high, and thus, not conducive to the development of typhoons. The above further verifies the more recent finding by Shan et al. that interdecadal variation in the movement speed of typhoons in the South China Sea is related to variations in the steering airflow driven by the east–west SST gradient [51]. The abnormal mode of the Pacific SST is closely related to the cross-equatorial airflow. Figure 6c shows that the cross-equatorial airflow is stronger, which is related to the early La Nina phenomenon [52].

4.3. MT and MJO

The MT has an important impact on the generation and development of tropical cyclones. When the MT is stronger, it is beneficial for the development of tropical cyclones, while when the MT is weaker, it is not conducive to the development of tropical cyclones [53,54,55,56]. This article reveals that the PDO’s cold (warm) phase is beneficial (unfavorable) for the generation of MTs by compositing a 500 hPa geopotential height and wind. Thus, the PDO’s cold (warm) phase is (not) conducive to the development of tropical cyclones, and the proportion of SCTYs increases (decreases). This is important for understanding the causes of varied typhoon intensity.
The MJO has a significant impact on the formation of tropical cyclones in the western Pacific. When the MJO is located in the western Pacific, the number of tropical cyclones in the western Pacific is the highest. When the MJO is located on an oceanic continent, the number of tropical cyclones in the western Pacific is the lowest. Tropical cyclones are often generated in the moist phase of an eastward-moving MJO [44,45,46]. The negative centers of the MJO index can be found primarily in the area ranging from the East Indian Ocean to the western Pacific in the PDO’s cold phase, which is beneficial for water vapor transport from the East Indian Ocean and western Pacific to Southern China and conducive to the strengthening of SCTCs.
The climatic changes in SCTCs and the characteristics of the SST, subtropical highs, relative humidity, sea level pressure (SLP), wind, convection, and Madden–Julian oscillation (MJO) in the Pacific during different PDO phases and their correlations with the proportion of SCTYs were examined in this study. Meanwhile, there may be some controversy surrounding the significance test of the time series in the article, with some suggesting that significance may be attributed to a large sample size [57]. Preliminary results have been obtained from this research, and further in-depth research is needed to determine the process and physical mechanisms of the impact of the PDO.

5. Conclusions

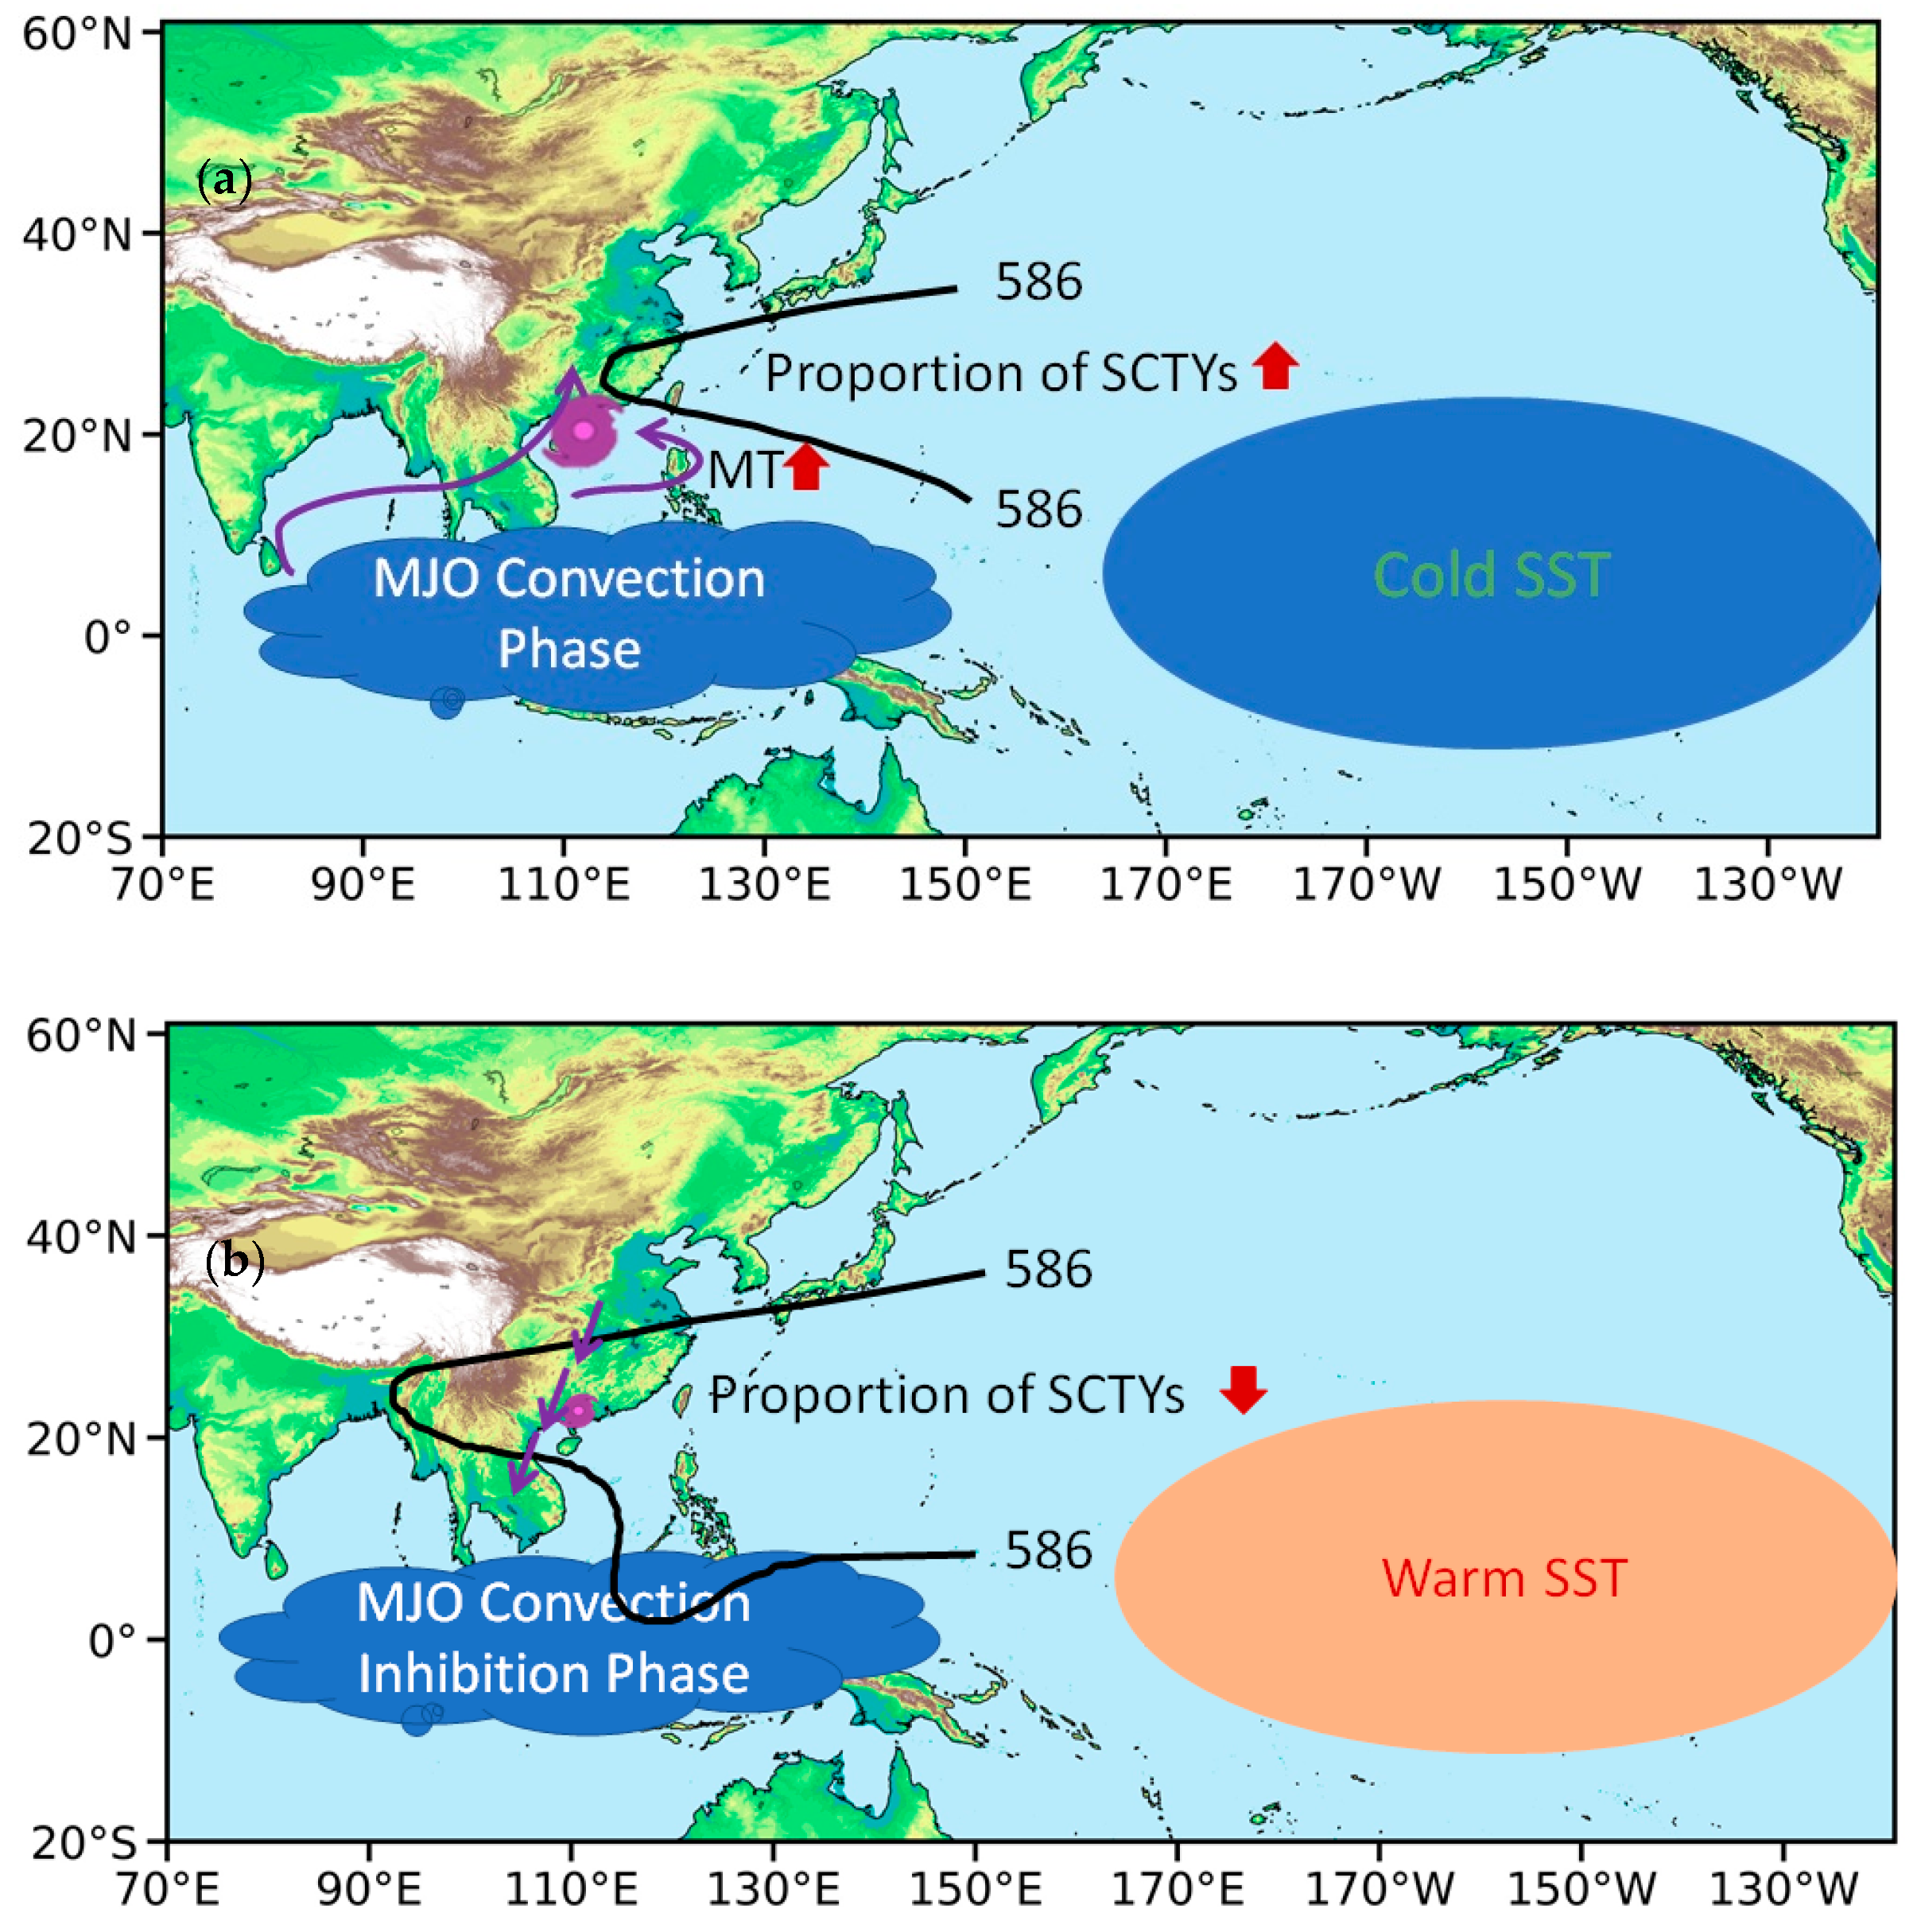
This study employed tropical cyclone data from the Shanghai Typhoon Institute of the China Meteorological Administration, the Japan Meteorological Agency’s year-by-year PDO index, and NCEP/NCAR reanalysis data from 1951 to 2021, with methods such as a linear regression analysis applied to the variability in SCTCs and their correlation with the PDO index. We established an obvious out-of-phase relationship between the proportion of SCTYs and the PDO index. Briefly, if the PDO index is a positive (negative) value, the proportion of SCTYs in that year is small (large). When the PDO is in a cold (warm) phase, the SSTs in the eastern and central equatorial Pacific are colder (warmer), which is similar to the state of the eastern Pacific La Niña (El Niño) phenomenon. East–west tropical Pacific SSTs show negative (positive) gradient variability, which is (not) conducive to the intensification of SCTCs. The intensity of the western Pacific subtropical high is weaker (stronger) than normal, with its western ridge points being further east (west), and the 500 hPa geopotential height field in the South China Sea and east of the Philippines is weak (strong), which is (not) conducive to the formation of the MT. The westerly (easterly) winds are abnormally strengthened from the South China Sea to the Philippines at high altitudes, and the southwesterly (northeasterly) winds are significantly stronger from the Indian Ocean to South China at low altitudes, which is (not) conducive to the formation of the MT, with a positive (negative) vorticity at a low altitude, a low (high) SLP, and stronger (weaker) convection, leading to a large (small) proportion of SCTYs (Figure 9).

Author Contributions

Conceptualization, W.Q.; methodology, W.Q.; validation, Y.C. and L.H.; software, W.Q. and Y.C.; formal analysis, W.Q.; investigation, Y.C. and L.H.; resources, W.Q. and L.H.; data curation, W.Q. and Y.C.; writing—original draft preparation, W.Q.; writing—review and editing, all authors; visualization, Y.C. and L.H.; supervision, W.Q.; project administration, L.H.; funding acquisition, W.Q. and Y.C. All authors have read and agreed to the published version of the manuscript.

Funding

This study was supported by the Science and Technology Program of Guangxi (GuiKeAB21075005), the Natural Science Foundation of Guangxi (2023GXNSFBA026346), and the key project of the Guangxi meteorological scientific research plan (GuiQiKe2023Z05).

Institutional Review Board Statement

Not applicable.

Informed Consent Statement

Not applicable.

Data Availability Statement

The TC data were obtained from the Shanghai Typhoon Institute of the China Meteorological Administration (https://tcdata.typhoon.org.cn/en/index.html, accessed on 18 February 2024). The reanalysis data in this study were downloaded from NCEP–NCAR (https://www.esrl.noaa.gov/psd/data/gridded/data.ncep.reanalysis.html, accessed on 18 February 2024). The PDO index data were downloaded from the Japan Meteorological Agency (https://www.data.jma.go.jp/gmd/kaiyou/data/db/climate/pdo/pdo.txt, accessed on 18 February 2024). The National Oceanic and Atmospheric Administration (NOAA) extended reconstructed sea surface temperatures (ERSSTs) (https://www1.ncdc.noaa.gov/pub/data/cmb/ersst/v3b/ascii/, accessed on 18 February 2024).

Conflicts of Interest

The authors declare no conflicts of interest.

References

  1. Kang, N.Y.; Elsner, J.B. Climate mechanism for stronger typhoons in a warm world. J. Clim. 2016, 29, 1051–1057. [Google Scholar] [CrossRef]
  2. Zhao, H.K.; Duan, X.Y.; Raga, G.B.; Philip, J.K. Changes in characteristics of rapidly intensifying western North Pacific tropical cyclones related to climate regime shifts. J. Clim. 2018, 31, 8163–8179. [Google Scholar] [CrossRef]
  3. Xiao, M.Z. Change in the occurrence frequency of landfalling and non-landfalling tropical cyclones over the Northwest Pacific. J. Clim. 2021, 34, 3145–3154. [Google Scholar] [CrossRef]
  4. Shen, Z.Q.; Nie, G.Z.; Qiu, X.; Gu, J.F.; Zhang, Y. Outer size distribution of landfalling tropical cyclones over China changes in the recent decades. J. Clim. 2023, 36, 6427–6445. [Google Scholar] [CrossRef]
  5. Li, C.Y.; Zhou, W.; Shun, C.M.; Lee, T.C. Change in destructiveness of landfalling tropical cyclones over China in recent decades. J. Clim. 2017, 30, 3367–3379. [Google Scholar] [CrossRef]
  6. Shan, K.Y.; Yu, X.P. Variability of tropical cyclone landfalls in China. J. Clim. 2021, 34, 9235–9247. [Google Scholar] [CrossRef]
  7. Liu, L.; Wang, Y.Q.; Zhan, R.F.; Xu, J.; Duan, Y.H. Increasing destructive potential of landfalling tropical cyclones over China. J. Clim. 2020, 33, 3731–3743. [Google Scholar] [CrossRef]
  8. Xie, M.M.; Wang, C.Z. Decadal variability of the anticyclone in the western North Pacific. J. Clim. 2020, 33, 9031–9043. [Google Scholar] [CrossRef]
  9. Chen, S.H.; Zhao, H.K.; Philp, J.K.; Graciela, B.R.; Cao, J.; Wang, C. Decadal modulation of transbasin variability on extended boreal summer tropical cyclone activity in the tropical North Pacific and Atlantic Basins. J. Clim. 2021, 34, 7149–7166. [Google Scholar] [CrossRef]
  10. Zhao, H.; Wang, C. Interdecadal modulation on the relationship between ENSO and typhoon activity during the late season in the western North Pacific. Climate dynamics: Observational, theoretical and computational research on the climate system. Clim. Dyn. 2016, 47, 315–328. [Google Scholar] [CrossRef]
  11. Shimada, U.D. Variability of environmental conditions for tropical cyclone rapid intensification in the western North Pacific. J. Clim. 2022, 35, 4437–4453. [Google Scholar] [CrossRef]
  12. Cai, Y.H.; Han, X.; Zhao, H.K.; Klotzbach, P.J.; Wu, L.G.; Raga, G.B.; Wang, C. Enhanced predictability of rapidly intensifying tropical cyclones over the western North Pacific associated with snow depth changes over the Tibetan Plateau. J. Clim. 2022, 35, 2093–2110. [Google Scholar] [CrossRef]
  13. Feng, J.; Wang, L.; Chen, W. How Does the east asian summer monsoon behave in the decaying phase of El Niño during different PDO phases. J. Clim. 2014, 27, 2682–2698. [Google Scholar] [CrossRef]
  14. Zhao, H.K.; Chen, S.H.; Klotzbach, P.J. Recent strengthening of the relationship between the western North Pacific monsoon and western North Pacific tropical cyclone activity during the boreal summer. J. Clim. 2019, 32, 8283–8299. [Google Scholar] [CrossRef]
  15. Choi, Y.M.; Ha, K.J.; Jin, F.F. Seasonality and El Niño diversity in the relationship between ENSO and western North Pacific tropical cyclone activity. J. Clim. 2019, 32, 8021–8045. [Google Scholar] [CrossRef]
  16. Patricola, C.M.; Camargo, S.J.; Klotzbach, P.J.; Saravanan, R.; Chang, P. The influence of ENSO flavors on Western North Pacific tropical cyclone activity. J. Clim. 2018, 31, 5395–5416. [Google Scholar] [CrossRef]
  17. Li, C.Y.; Zhou, W. Interdecadal change in South China Sea tropical cyclone frequency in association with zonal sea surface temperature gradient. J. Clim. 2014, 27, 5468–5480. [Google Scholar] [CrossRef]
  18. Liao, X.Q.; Holloway, C.E.; Feng, X.B.; Liu, C.L.; Lyu, X.Y.; Xue, Y.F.; Bao, R.J.; Li, J.D.; Qiao, F.L. Observed interannual relationship between ITCZ position and tropical cyclone frequency. J. Clim. 2023, 36, 5587–5603. [Google Scholar] [CrossRef]
  19. Wang, X.D.; Wang, C.Z.; Zhang, L.P.; Wang, X. Multidecadal variability of tropical cyclone rapid intensification in the western North Pacific. J. Clim. 2015, 28, 3806–3820. [Google Scholar] [CrossRef]
  20. Hu, Y.M.; Liu, J.L.; Zhuang, X.D.; Du, Y.D. New characteristics of tropical cyclones affecting Guangdong and proposals for their mitigation. Guangdong Meteorol. 2015, 37, 1–4. [Google Scholar]
  21. Mantua, N.J.; Hare, S.R.; Zhang, Y.; Wallace, J.M.; Francis, R.C. A Pacific Interdecadal Climate Oscillation with impacts on salmon production. Bull. Am. Meteor. Soc. 1997, 78, 1069–1079. [Google Scholar] [CrossRef]
  22. Holliday, C.R.; Thompson, A.H. Climatological characteristics of rapidly intensifying typhoons. Mon. Weather Rev. 1979, 107, 1022–1034. [Google Scholar] [CrossRef]
  23. Bai, C.Z.; Zhang, R.; Bao, S.L. Forecasting the tropical cyclone genesis over the Northwest Pacific through identifying the causal factors in cyclone–climate interactions. J. Clim. 2018, 31, 247–259. [Google Scholar] [CrossRef]
  24. Matsuura, T.; Yumoto, M.; Iizuka, S.; Kawamura, R. Typhoon and ENSO simulation using a high-resolution coupled GCM. Geophys. Res. Lett. 1999, 26, 1755–1758. [Google Scholar] [CrossRef]
  25. Corporal-Lodangco, I.L.; Leslie, L.M.; Lamb, P.J. Impacts of ENSO on Philippine tropical cyclone activity. J. Clim. 2016, 29, 1877–1896. [Google Scholar] [CrossRef]
  26. Ha, Y.; Zhong, Z.; Hu, Y.J. Influences of ENSO on western North Pacific tropical cyclone kinetic energy and its meridional transport. J. Clim. 2013, 26, 322–332. [Google Scholar] [CrossRef]
  27. Wang, C.; Wang, X. Classifying El Niño Modoki I and II by different impacts on rainfall in South China and typhoon tracks. J. Clim. 2013, 26, 1322–1338. [Google Scholar] [CrossRef]
  28. Goh, A.Z.C.; Chan, J.C.L. An improved statistical scheme for the prediction of tropical cyclones making landfall in South China. Weather Forecast. 2010, 25, 587–593. [Google Scholar]
  29. Wu, Q.; Wang, X.; Tao, L. Interannual and interdecadal impact of western North Pacific subtropical high on tropical cyclone activity. Clim. Dyn. 2020, 54, 2237–2248. [Google Scholar] [CrossRef]
  30. Liu, K.S.; Chan, C.L. Interdecadal variability of western North Pacific tropical cyclone tracks. J. Clim. 2008, 21, 4464–4476. [Google Scholar] [CrossRef]
  31. Liu, K.S.; Chan, C.L. Inactive period of western North Pacific tropical cyclone activity in 1998–2011. J. Clim. 2013, 26, 2614–2630. [Google Scholar] [CrossRef]
  32. Camargo, S.J.; Emanuel, K.A.; Sobel, A.H. Use of a genesis potential index to diagnose ENSO effects on tropical cyclone genesis. J. Clim. 2007, 20, 4819–4834. [Google Scholar] [CrossRef]
  33. Guo, Y.P.; Tan, Z.M. Impacts of the boreal spring Indo-Pacific Warm Pool Hadley Circulation on tropical cyclone activity over the western North Pacific. J. Clim. 2018, 31, 1361–1374. [Google Scholar] [CrossRef]
  34. Liang, J.; Wu, L.G.; Gu, G.J. Rapid weakening of tropical cyclones in monsoon gyres over the tropical western North Pacific. J. Clim. 2018, 31, 1015–1028. [Google Scholar] [CrossRef]
  35. Matsuura, T.; Yumoto, M.; Iizuka, S. A Mechanism of interdecadal variability of tropical cyclone activity over the western North Pacific. Clim. Dyn. 2003, 21, 105–117. [Google Scholar] [CrossRef]
  36. Huang, R.H.; Huang, J.L.; Wu, L.; Feng, T.; Chen, G.H. Research on the interannual and interdecadal variabilities of the monsoon trough and their impacts on tropical cyclone genesis over the western North Pacific Ocean. J. Trop. Meteor. 2018, 24, 395–420. [Google Scholar]
  37. Aiyyer, A.; Thorncroft, C. Interannual-to-multidecadal variability of vertical shear and tropical cyclone activity. J. Clim. 2011, 24, 2949–2962. [Google Scholar] [CrossRef]
  38. Zhan, R.F.; Wang, Y.Q.; Ding, Y.H. Impact of the western Pacific tropical easterly jet on tropical cyclone genesis frequency over the western North Pacific. Adv. Atmos. Sci. 2022, 39, 235–248. [Google Scholar] [CrossRef]
  39. Madden, R.A.; Julian, P.R. Detection of a 40–50 day oscillation in the zonal wind in the tropical Pacific. J. Atmos. Sci. 1971, 28, 702–708. [Google Scholar] [CrossRef]
  40. Madden, R.A.; Julian, P.R. Description of global scale circulation cells in the tropics with 40–50 day period. J. Atmos. Sci. 1972, 29, 1109–1123. [Google Scholar] [CrossRef]
  41. Schreck, C.J.; Molinari, J.; Mohr, K.I. Attributing tropical cyclogenesis to equatorial waves in the western North Pacific. J. Atmos. Sci. 2011, 68, 195–209. [Google Scholar] [CrossRef]
  42. Chen, G.H.; Chou, C. Joint Contribution of multiple equatorial waves to tropical cyclogenesis over the western north Pacific. Mon. Weather Rev. 2014, 142, 79–93. [Google Scholar] [CrossRef]
  43. Schreck, C.J. Kelvin waves and tropical cyclogenesis: A global survey. Mon. Weather Rev. 2015, 143, 3996–4011. [Google Scholar] [CrossRef]
  44. Park, M.S.; Kim, H.S.; Ho, C.H.; Elsberry, R.L.; Lee, M.I. Tropical cyclone Mekkhala’s (2008) formation over the South China Sea: Mesoscale, synoptic-scale, and large-scale contributions. Mon. Weather Rev. 2015, 143, 88–110. [Google Scholar] [CrossRef]
  45. Klotzbach, P.J. The Madden–Julian Oscillation’s impact on global tropical cyclone activity. J. Clim. 2014, 27, 2317–2330. [Google Scholar] [CrossRef]
  46. Zhao, H.K.; Yoshida, R.J.; Raga, G.B. Impact of the Madden–Julian Oscillation on Western North Pacific tropical cyclogenesis associated with large-scale patterns. J. Appl. Meteor. Climatol. 2015, 54, 1413–1429. [Google Scholar] [CrossRef]
  47. Shu, S.J.; Zhang, F.Q. Influence of equatorial waves on the genesis of super typhoon Haiyan (2013). J. Atmos. Sci. 2015, 72, 4591–4613. [Google Scholar] [CrossRef]
  48. Kim, H.K.; Seo, K.H. Cluster analysis of tropical cyclone tracks over the western North Pacific using a self-organizing map. J. Clim. 2016, 29, 3731–3751. [Google Scholar] [CrossRef]
  49. Li, S.; Mei, W.; Xie, S.P. Effects of tropical sea surface temperature variability on northern hemisphere tropical cyclone genesis. J. Clim. 2022, 35, 4719–4739. [Google Scholar] [CrossRef]
  50. Huang, C.M.; Liu, H.L.; Wang, X.D.; Li, H.; Zhang, Z.R.; Zuo, J.C. PDO modulation on the relationship between ENSO and typhoon tracks. J. Clim. 2022, 35, 6703–6720. [Google Scholar] [CrossRef]
  51. Shan, K.Y.; Chu, P.S.; Yu, X.P. Interdecadal change of tropical cyclone translation speed during peak season in South China sea:observed evidence, model results, and possible mechanism. J. Clim. 2023, 36, 4531–4541. [Google Scholar] [CrossRef]
  52. Zhao, X.X.; Lu, R.Y.; Dong, B.W.; Hong, X.W.; Liu, J.Q.; Sun, J.Q. Tropical anomalies associated with the interannual variability of the cross-equatorial flows over the maritime continent in boreal summer. J. Clim. 2022, 35, 5591–5603. [Google Scholar] [CrossRef]
  53. Li, R.C.; Zhou, W. Modulation of Western North Pacific Tropical Cyclone Activity by the ISO. Part I: Genesis and Intensity. J. Clim. 2013, 26, 2904–2918. [Google Scholar] [CrossRef]
  54. Molinari, J.; Vollaro, D. What Percentage of Western North Pacific Tropical Cyclones Form within the Monsoon Trough? Mon. Weather Rev. 2013, 141, 499–505. [Google Scholar] [CrossRef]
  55. Wu, L.; Zong, H.; Liang, J. Observational Analysis of Tropical Cyclone Formation Associated with Monsoon Gyres. J. Atmos. Sci. 2013, 70, 1023–1034. [Google Scholar] [CrossRef]
  56. Zong, H.; Wu, L. Synoptic-Scale Influences on Tropical Cyclone Formation within the Western North Pacific Monsoon Trough. Mon. Weather Rev. 2015, 143, 3421–3433. [Google Scholar] [CrossRef]
  57. Serinaldi, F.; Kilsby, C.G.; Lombardo, F. Untenable nonstationarity: An assessment of the fitness for purpose of trend tests in hydrology. Adv. Water Resour. 2017, 111, 132–155. [Google Scholar] [CrossRef]
Figure 1. (a) Time series and linear trends of SCTCS, TSs, and STSs during the period of 1951–2021 (black line and equation: SCTCs; red line and equation: TSs; and blue line and equation: STSs). (b) Time series of the proportion of SCTYs and the PDO index during the period of 1951–2021 (red line: the proportion of SCTYs; blue line: the PDO index).
Atmosphere 15 00285 g001
Figure 2. JAS SST and anomalies during the PDO’s (a) cold phase and (b) warm phase. Shaded areas indicate the absolute SST anomaly values above 0.2, and the contour lines represent the SST.
Atmosphere 15 00285 g002
Figure 3. (a) Correlation coefficient between the PDO index and the JAS 500 hPa geopotential height during the period of 1951–2021 (shaded areas show a significant correlation at the 95% confidence level). (b) The difference in the JAS 500 hPa geopotential height between the PDO’s cold and warm phases (the blue represents the 586 dgpm line in the cold phase, the red represents the 587 dgpm line in the warm phase, the black represents the 586 dgpm line of climatology, and dotted areas show significant differences at the 95% confidence level).
Atmosphere 15 00285 g003
Figure 4. (a) Correlation coefficient between the proportion of SCTYs and the JAS 850 hPa relative humidity during the period of 1951–2021 (shaded areas show the significant correlation at the 95% confidence level). (b) The difference in the JAS 850 hPa relative humidity between the PDO’s cold and warm phases (unit: %; dotted areas show significant differences at the 95% confidence level).
Atmosphere 15 00285 g004
Figure 5. (a) Correlation coefficient between the proportion of SCTYs and the SLP during the period of 1951–2021 (b) The difference in the SLP between the PDO’s cold and warm phases.
Atmosphere 15 00285 g005
Figure 6. JAS wind velocity anomaly during the PDO’s (a,c) cold phase and (b,d) warm phase; (a,b): 500 hPa; (c,d): 850 hPa; unit: m/s; the red wind velocity vector shows a significant difference at the 95% confidence level; and the shaded areas show where the absolute vorticity anomaly value is ≥0.2.
Atmosphere 15 00285 g006
Figure 7. JAS OLR anomalies (a) during the PDO’s (a) cold phase and (b) warm phase (unit: w/m2; dotted areas show significant differences at the 95% confidence level; and the shaded areas show where the absolute OLR anomaly is ≥1 w/m2).
Atmosphere 15 00285 g007
Figure 8. Composites of the JAS MJO index during the PDO’s (a) cold phase and (b) warm phase.
Atmosphere 15 00285 g008
Figure 9. Schematic diagrams for the anomalous circulation in the PDO’s cold (a) and warm (b) phase.
Atmosphere 15 00285 g009
Disclaimer/Publisher’s Note: The statements, opinions and data contained in all publications are solely those of the individual author(s) and contributor(s) and not of MDPI and/or the editor(s). MDPI and/or the editor(s) disclaim responsibility for any injury to people or property resulting from any ideas, methods, instructions or products referred to in the content.