Article

Comprehensive Study of Natural Radioactivity in Building Materials: A Case Study in Ica, Peru

1
Departamento de Ciencias, Seccion Física, Pontificia Universidad Católica del Peru, San Miguel 15088, Peru
2
Facultad de Ingeniería, Universidad Tecnológica del Peru, Lima 15046, Peru
3
Vicerrectorado de Investigación, Universidad Autónoma del Peru, Lima 15842, Peru
4
Facultad de Ciencias de la Salud, Escuela Académico Profesional de Medicina Humana, Universidad Privada Norbert Wiener, Lima 15072, Peru
5
Escuela de Ingeniería Mecánica Eléctrica, Universidad Señor de Sipán, Chiclayo 14000, Peru
6
Laboratorio de Física Nuclear, Universidad Simón Bolívar, Caracas 1080 A, Venezuela
7
Alba Regia Technical Faculty, Óbuda University, 8000 Szekesfehervar, Hungary
*
Author to whom correspondence should be addressed.
Atmosphere 2024, 15(3), 279; https://doi.org/10.3390/atmos15030279
Submission received: 4 December 2023 / Revised: 20 January 2024 / Accepted: 26 January 2024 / Published: 26 February 2024
(This article belongs to the Special Issue Indoor Air Pollutants and Public Health (2nd Edition))

Abstract

:
This study evaluates radon exhalation rates and assesses the potential radiological risks of external exposure to primordial radionuclides in building materials employed in the Ica region of Peru, particularly those with high uranium content. The radon exhalation rates are currently measured using a combination of a closed chamber and an active monitor. We proposed a novel method that effectively ensured a hermetic seal for the closed chamber and guaranteed that the efficient maintenance of secular equilibrium. The obtained results ranged from below the detection limit (BDL) to a maximum of 52.3 mBq · kg−1h−1. Gamma spectrometry was employed to measure the concentrations of radionuclides by utilizing a 3′ × 3′ NaI detector. The analysis of cement samples revealed a strong positive correlation between the activity concentration of radium and the radon exhalation rate. The activity concentrations for radionuclides varied, with values ranging from BDL to 60.6 mBq · kg−1h−1 for 226Ra, BDL to 22.3 mBq · kg−1h−1 for 232Th, and BDL to 1074 mBq · kg−1h−1 for 40K. These findings contribute valuable insight to decision-making processes in the Peruvian construction industry, particularly regarding material safety and radiological risk management.

1. Introduction

Radioactive isotope content in soil, rocks, and building materials is a significant source of environmental radiation that may impact human health [1,2]. Natural internal and external exposure includes the inhalation of radon progeny and gamma radiation from natural radioactive materials (NORMs) [3]. Both indoor and outdoor external exposures are mainly caused by gamma rays emitted by 40K, 226Ra (238U), and 232Th decay series [4,5]. The production of building materials requires the extraction of raw materials from quarries, and the resulting materials, such as bricks, cement, and gypsum, can present variations in their activity concentrations [6]. Known types of ionizing radiation induce damage that alters the molecular structure in living tissues quantified in terms of the effective dose. That takes into account the type of radiation and the sensitivity of different tissues and organs. In short, it is a way of expressing the overall risk of harm from ionizing radiation exposure, to which radioactive elements in construction materials may contribute remarkably; their impact on indoor radiation levels may have a significant human health risk, although it depends on various factors such as the specific materials used, local geology, and building design. Considering that in Peru, 77% of the population are living in urban areas, and, therefore, a large group of individuals dwells indoors for most of their time, the assessment of radiation emitted by building materials is deemed important for the estimation of potential radiation risks to inhabitants. Monitoring and controlling the activity concentration of radionuclides in building materials is essential, especially in Peru, which to date has relied on international recommendations for regulatory criteria application. This monitoring is valuable to assess the increase in health risk due to relatively high dose rates on long-term radiation exposure. The UNSCEAR report (2000) indicates that radon and its decay products all contribute to an average inhaled dose of 1.26 mSv/y, which is approximately half of an annual effective dose that individuals receive (2.4 mSv/y) from natural sources [7,8,9,10]. The International Commission on Radiological Protection (ICRP) and the World Health Organization (WHO) recognize radon problems and external irradiation from building materials as significant factors that affect public health. Radon gas tends to accumulate in low-ventilated spaces such as homes, and it is the most significant contributor to radon levels indoors [11]. This accumulation occurs through a process known as radon exhalation, which begins with radon emanation. Radon emanation is the term used to describe the proportion of radon atoms generated within the structure of a material (soils and/or building materials) that can escape to its pores [12,13]. Radon exhalation from materials depends on intrinsic factors (such as radium content and other physical properties of the material) and extrinsic factors (such as air pressure, temperature, relative humidity, etc.) [14]. Measuring the radon exhalation rate from building materials is essential for monitoring risk levels from a radiological point of view. Ensuring proper ventilation and performing air quality tests are vital for the safety and regulatory compliance of a dwelling. Even for existing buildings, measuring the radon exhalation rate can help determine appropriate mitigation strategies, especially if radon levels are found to be above the standards set by the country’s regulatory body. In most cases, building materials have a negligible influence on the radon concentration within residences, although some specific materials can significantly increase indoor radon exposure [15]. In Peru, research on radon exposure has gained significant interest in recent years, thus featuring studies such as [16,17]. However, regulations that limit the dose of exposure to construction materials have not yet been established. In the latest update of the Radiation Protection Regulation, approved by D.S. No. 009-97-EM on 20 May 1997 [C], no reference is made to an action level concerning building materials. This study aims to evaluate and provide experimental data on the natural radioactivity concentration, the radon exhalation rate, and the radiological risk indexes (gamma index, radium equivalent activity, external hazard index, and internal hazard index) of the most common construction materials available commercially in Ica, Peru. With this study, we hope to inform public policy, improve building practices, and increase public awareness of the impact of building materials on radon exposure. This advice should regulate and establish safe limits for radionuclides in building materials for the purpose of efficient supervision and control. Additionally, the effectiveness of one method with three different settings for hermetically sealing the container used in gamma ray spectrometry was also studied.

2. Materials and Methods

2.1. Sample Collection and Preparation

Fourteen samples of building materials were collected from Ica, a city on the Peruvian coast. Samples were prepared for gamma radiation measurements and radon mass exhalation rate determination following the recommended protocol: First, samples were crushed and ground to a 1 mm mesh size, dried at 110 °C for 24 h, then stored in a dry environment until their analysis. Cement and brick samples were obtained from main factories on the Peruvian coast. Aggregates for concrete (sand and rock) and gypsum samples were sourced from geographical areas in the Ica region near locations with potential significant uranium concentration anomalies [18]. Figure 1 illustrates the extraction areas for gypsum and aggregates, with red circles indicating areas of potential uranium exploitation.

2.2. Measurement of Natural Radioactivity

Building materials from various manufacturers were collected. Processed samples were subsequently stored in high-density plastic containers with screw caps. Container dimensions were 85.40 mm (external diameter), 139.98 mm (filling height), 1.96 mm (side thickness), and 2.20 mm (base thickness).
A radon leak test was performed to ensure the tightness of the cylindrical plastic container designated for gamma spectrometry measurements. The AlphaGUARD (AG) equipment in diffusion configuration was used as a radon monitor for the leak test, which was conducted inside a methacrylate accumulation chamber (Figure 2D). A uranium ore sample was placed inside the cylindrical container, and three sealing methods were tested (Figure 2).
Then, the containers were sealed using a method that ensured negligible radon leakage, thereby maintaining secular equilibrium between 226Ra, 222Rn, and their short-lived progeny. Upon achieving secular equilibrium, samples were analyzed using a gamma spectrometer with a 3 × 3 NaI(Tl) scintillation detector. The detector had a resolution ≤ 8.5% at the 662 keV peaks of 137Cs. Cylindrical plastic containers containing the building material were positioned on a low-density plastic support to standardize measurements. Natural radionuclides 40K, 226Ra, and 232Th were identified through their respective energy peaks, as depicted in Figure 3.
Gamma spectra for the background, samples, and reference material were acquired over 86,400 s. Full energy peaks were identified, regions of interest (ROIs) were set, and net peak areas were determined using the MAESTRO®-32 MCA emulation software (ORTEC/AMETEK, Oak Ridge, TN, USA) The minimum detectable activity (MDA) by the system was estimated at a 95% confidence level. Energy calibration was typically performed using point sources, while efficiency calibration was done using reference materials. However, energy calibration was deemed unnecessary for this study due to the similarity in radionuclides between building material samples and the IAEA-412 (ocean sediment) reference material.
For quantification, an extended relative method of activity determination (ERMAD) similar to that developed by [19] was employed. Instead of full Monte Carlo simulations, in our approach, we used the ETNA (EfficiencyTransfer for Nuclide Activity) software for the efficiency transfer calculations [20]. This calculation remains consistent as long as there are negligible differences in geometry and composition between them. Summing-up and loss effects by coincidence were not considered because the radionuclides and energies were identical for samples and the reference material; also, the discrepancies in container sizes and volumes occupied by them were minimal.

2.3. Measurement of Radon Mass Exhalation Rates

Determining radon exhalation from surface area of granular materials like soil, rock, or building materials is indeed a complex task due to the multiple factors that can influence the process. It often requires a combination of experimental techniques and modeling approaches to obtain accurate and meaningful results. Their granular nature means that the total exhalation surface is not just the external area, but includes the surfaces of individual particles. Additionally, variability in grain size, shape, and radon content, combined with the presence of intergranular spaces, complicates the measurement process. Therefore, in these cases, it is common to determine the radon exhalation rate as a function of mass [21,22]. In practical scenarios, building materials often degrade into smaller particles, where knowledge of the contribution of various components of building materials to the exhalation rate is required. A custom-designed cylindrical stainless steel accumulation chamber was used, in which the radon leakage rate was negligible, as confirmed in [16]. This chamber was connected to a RAD7 instrument through two valves to form a closed circuit, as shown in Figure 4.
The radon concentration, denoted as C(t), within the stainless steel accumulation chamber is regulated by the subsequent radon mass transfer equation [23]:
d C ( t ) d t = E ( t ) S V c λ R n C λ L C λ B D C
E represents the radon exhalation rate, S represents the exhalation surface area, V c defines the available volume within the enclosed chamber (including the volume of RAD7 measurement mechanism), λ B D is the back-diffusion rate, λ L is the radon leak rate, and λ R n is the radon decay constant. Then, for a short sampling duration, during which the linear growth of radon concentration governs the radon accumulation process within the closed chamber for the first 24 h [24,25], it is possible to consider λ B D and λ L as negligible [26]:
E M = ( m + λ R n C 0 ) V c M
Here, m ( Bq · m 3 · h 1 ) denotes the initial slope of the increase in radon within the accumulation chamber, and M denotes the mass of the sample.
The emanation fraction refers to the proportion of 222Rn atoms generated within the grains of materials that successfully escape the pore space. We can obtain the radon emanation fraction according to the following [27]:
f = E M C R a λ R n
where f represents the radon emanation fraction, E M is the radon mass exhalation rate ( Bq · kg 1 · h 1 ), and C R a is the 226Ra concentration (Bq·kg−1).

2.4. Radiological Parameters

To assess the radiation hazard associated with the building materials used, radiological parameters such as the gamma index ( I γ ), the radium equivalent activity ( R a e q ), and the external and internal hazard index ( H e x and H i n , respectively) were determined.

2.4.1. Gamma Index I γ

The European Commission [28] and several authors [27,29] have proposed some indices to assess the excess gamma radiation from building materials and its relationship to the annual dose rate. In this sense, the gamma index is an important measure for assessing the potential radiological risk posed by the presence of 226Ra, 232Th, and 40K in building materials. It quantifies the cumulative impact of these radioisotopes, thereby providing a comprehensive understanding of their contribution to the annual dose rate and ensuring safety and compliance with health standards.
I γ = C 226 R a 300 + C 232 T h 200 + C 40 K 3000
Building materials with a gamma index equal to or greater than 1 have the capacity to produce annual effective doses exceeding 1 mSv . In contrast, a gamma index value < 1 means that the analyzed material is safe to use [28].

2.4.2. External Hazard Index H e x

The external hazard index H e x estimates the radiation dose expected due to the emitted γ rays by building materials and assumes thick walls without windows and doors [30]. The values of the H e x index can be calculated according to [30] to determine if the radiation hazard is insignificant. It is required that the values be lower than 1.
H e x = C 226 R a 370 + C 232 T h 259 + C 40 K 4810

2.4.3. Internal Hazard Index H i n

The internal hazard index ( H i n ) represents the internal exposure to radon and its progeny, in addition to the external hazard index ( H e x ). According to [31], the maximum permissible concentration for 226Ra needs to be lowered to half of the standard limit (185 Bq· kg−1) to mitigate this risk.
H i n = C 226 R a 185 + C 232 T h 259 + C 40 K 4810
Keeping the values of this index below 1 is neccesary to ensure that radiation risks can be considered negligible.

2.4.4. Absorbed Gamma Dose Rate

The absorbed gamma dose rate, attributed to gamma emissions from radionuclides such as (226Ra, 232Th, and 40K) and NORMs in building materials, was computed using the methodologies delineated in the European Commission Report [28,32] and is calculated by the following:
D R ( nGy . h 1 ) = 0.92 C R a + 1.1 C T h + 0.08 C K
The global average absorbed gamma dose rate has been reported as 55 nGy·h−1 [33]:

2.4.5. Annual Effective Doses Rate ( A E D )

The estimation of annual effective dose rate indoors ( A E D ) incorporates a conversion coefficient from the absorbed dose rate in air ( D R ) to an annual effective dose value of 0.7Sv·Gy−1. This calculation also factors in an indoor occupancy rate of 0.8, thereby reflecting the typical scenario where individuals reside indoors for approximately 80% of their daily duration, and T denotes the number of hours in a year (8760 h·y−1) [7].
A E D ( mSv · y 1 ) = D R × T × 0.8 × 0.7 × 10 6

3. Results and Discussion

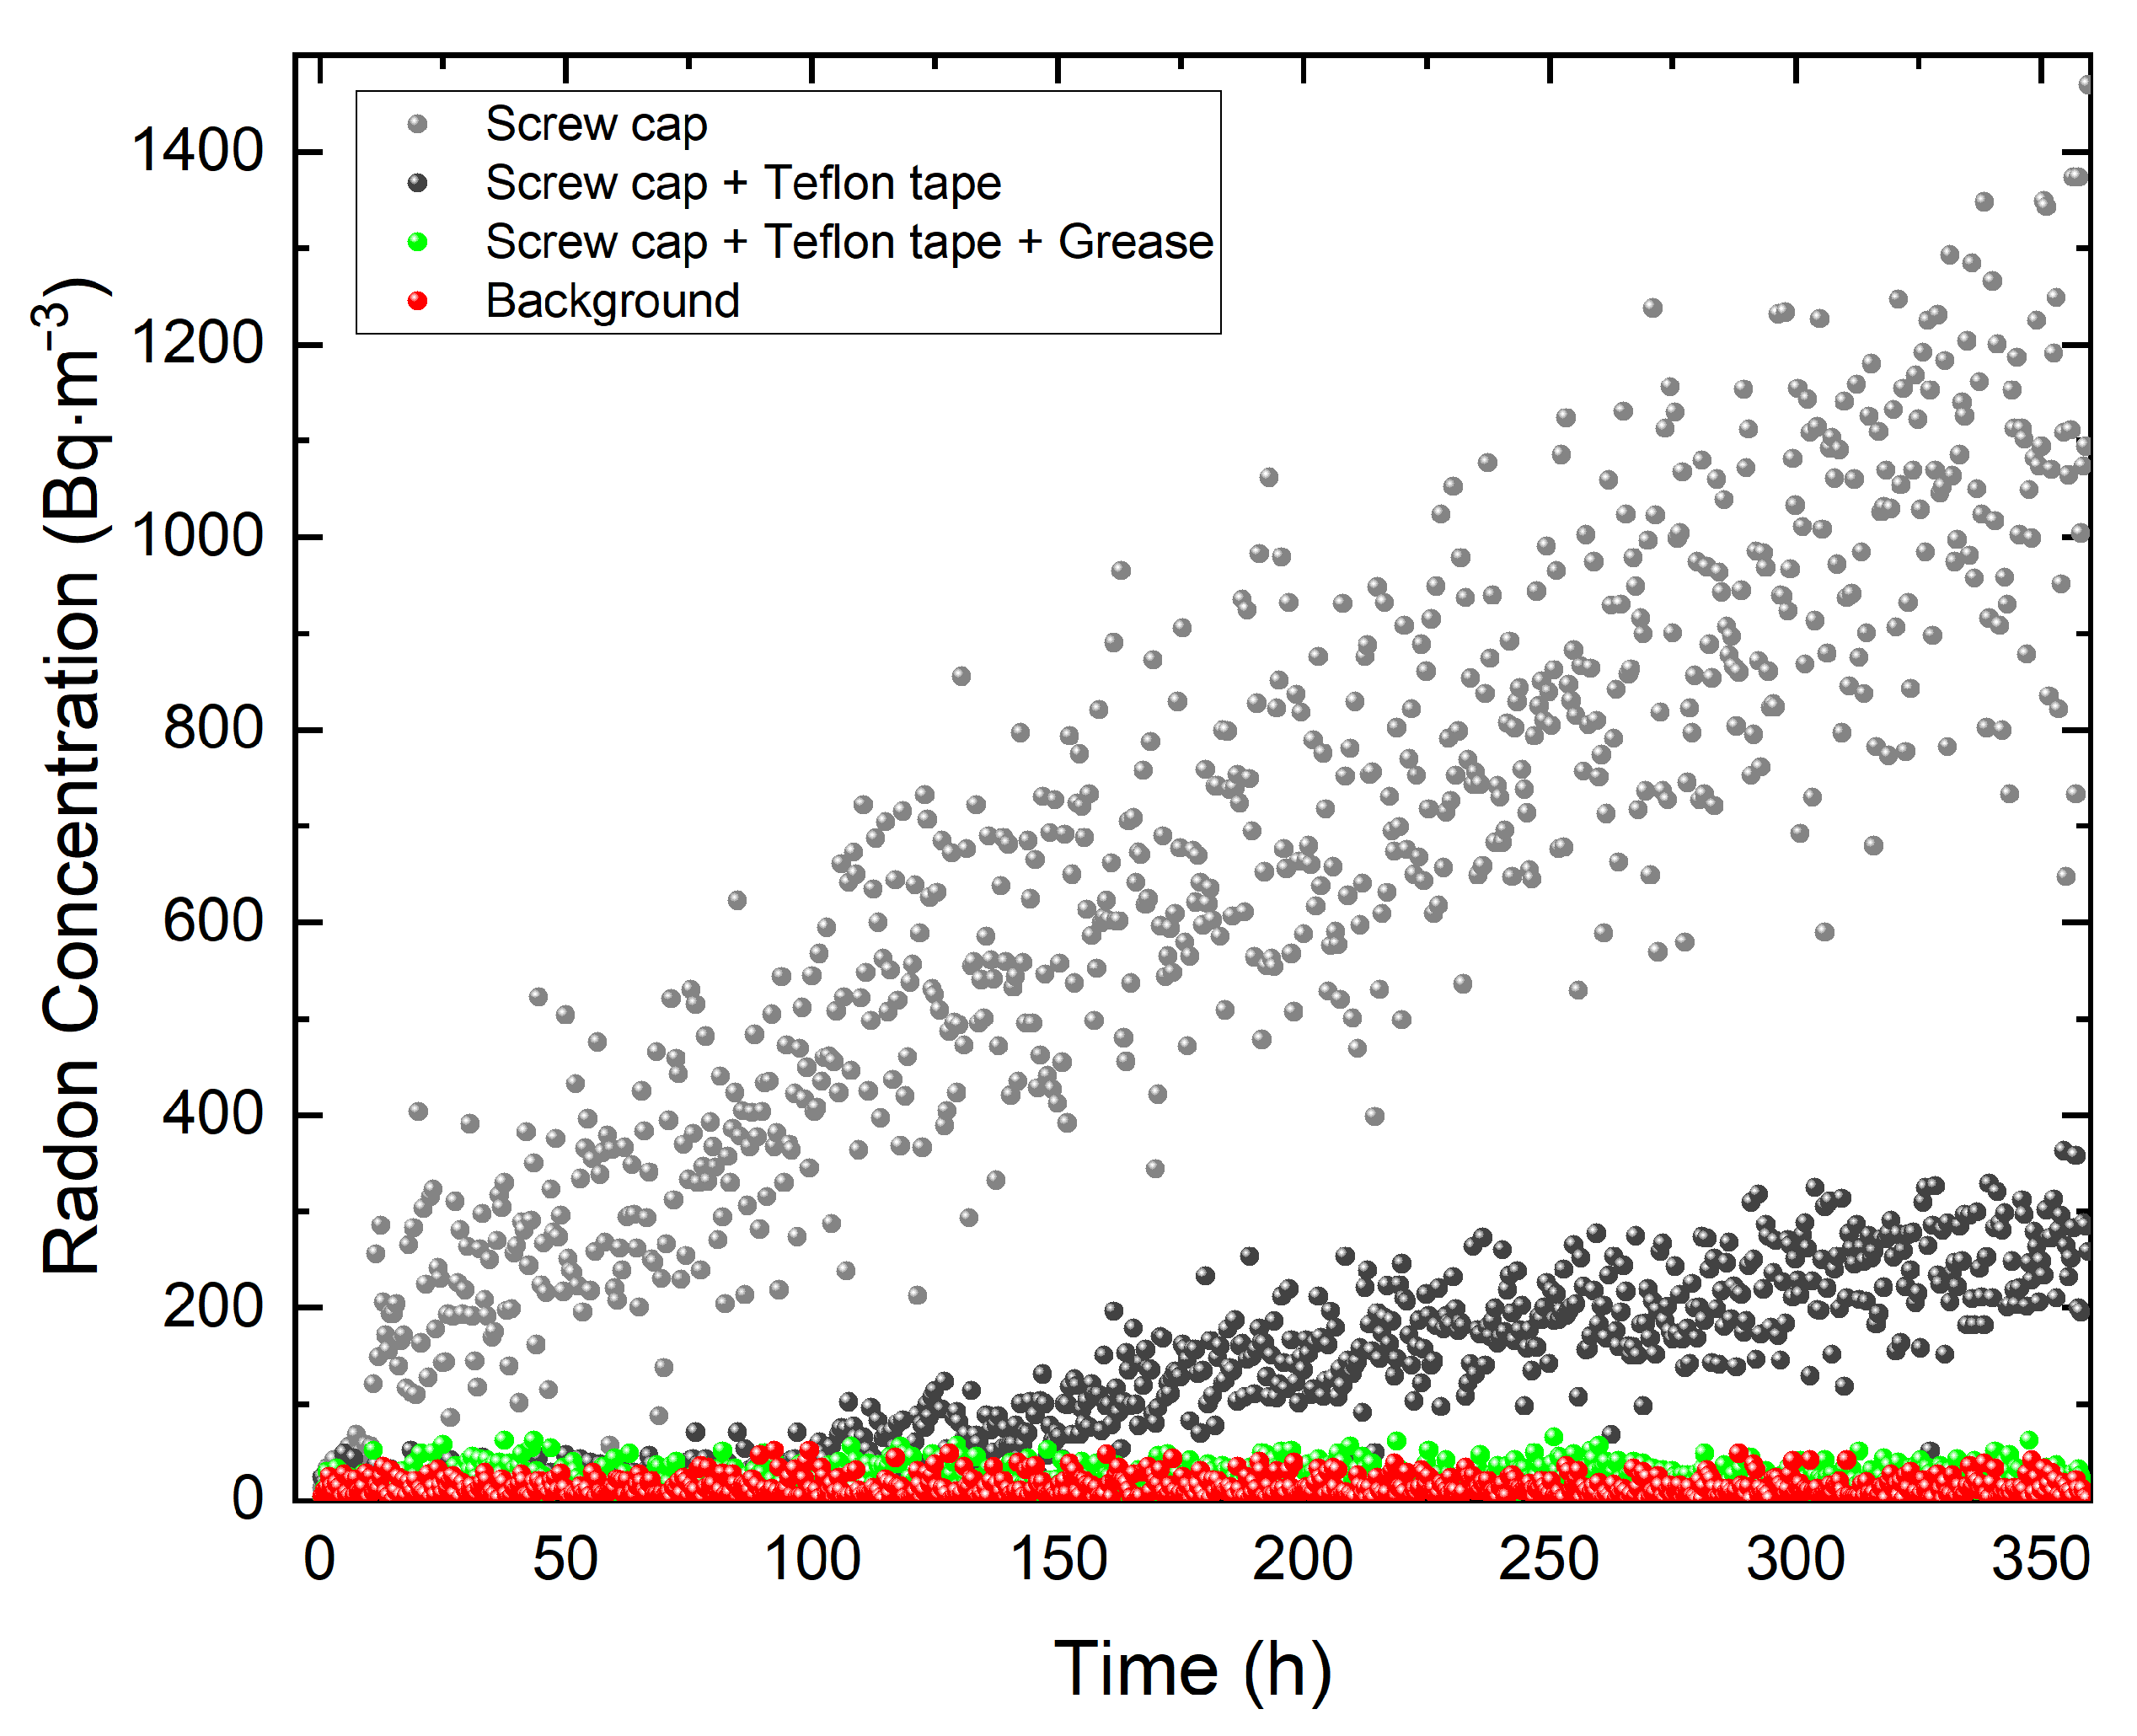
3.1. Testing of Sealing Methods for Cylindrical Plastic Containers Used in Gamma Spectrometry Measurements

The radon concentration was monitored inside a methacrylate accumulation chamber over 15 days to assess the radon leakage from cylindrical plastic containers, with collected data every 15 min. The AlphaGUARD (AG) instrument in the diffusion configuration was used as a radon monitor for the leak test conducted inside the chamber (Figure 2D). The average background radon concentration within the accumulation chamber was (13.4 ± 10.2) Bq·m−3 after being hermetically closed. However, it is important to understand that the thickness of the container and, consequently, the value of its diffusion coefficient are significant factors to consider to prevent leakage through diffusion. Additionally, from other tests conducted in the laboratory, it has been verified that the best seal for the plastic container is achieved when the cap is equipped with an O-ring that ensures an enhanced sealing effect. On the other hand, the accurate measurement of radon at the bottom inside the chamber must take into account that the accumulation chamber, whether made of methacrylate or another material, ensures hermeticity. This is crucial because potential leakage from the container with NORM sample could be so minor that it might be mistaken for the background and lead to an erroneous measurement of leakage from the plastic container.
The results in Figure 5 indicate that radon leakage for the first sealing method was inefficient, since the radon concentration after 15 days was about 97 times larger than the average background radon concentration. The second method yielded a leak of a smaller magnitude; however, it still surpassed the background concentration by a factor of 15. The last sealing method, using Teflon tape and high-vacuum grease, showed a practically hermetic sealing, so it can be considered to be a negligible leak. The average radon concentration in this method was (17.9 ± 9.5) Bq·m−3, which is statistically comparable to the average background radon concentration. This result demonstrates that the third method of sealing is effective for achieving air-tightness of the containers, which has been the subject of numerous studies for measuring 226Ra activity via the gamma ray spectrometry of natural samples [34,35,36].

3.2. Activity Concentrations of 226Ra, 232Th, and 40K

The minimum detectable activity (MDA) was determined as 6.6 Bq·kg−1 for 226Ra, 6.2 Bq·kg−1 for 232Th, and 32 Bq·kg−1 for 40K. Table 1 presents the activity concentrations of 226Ra, 232Th, and 40K in Bq·kg−1. The activity concentrations of 226Ra were found to vary from below the detection limit (BDL) to 60.6 Bq·kg−1, with an average of 39.4 Bq·kg−1. For 232Th, it was found in the range of BDL to 22.3 Bq·kg−1, with a mean value of 13 Bq·kg−1. For 40K, it was found in the range from BDL to 1074 Bq·kg−1, with a mean value of 702 Bq·kg−1.
According to UNSCEAR [7], the average global activity levels of 226Ra, 232Th, and 40K have been measured at 35 Bq·kg−1, 30 Bq·kg−1, and 400 Bq·kg−1, respectively. Cement PR, cement PV, sand G, sand F2, concrete, and both brick samples had values slightly higher than the global average for 226Ra. For 40K, only cement A and cement PV had values lower than the global average. On the other hand, the concentration of 232Th in all samples was always lower than the global average. Gypsum samples had the lowest content of all primary radionuclides, while brick samples had the highest content of 226Ra (60.6 Bq·kg−1), 233Th (22.3 Bq·kg−1), and 40K (1074 Bq·kg−1). The low values of these radionuclides in a macroregion of potential interest for uranium exploitation have shown that they do not automatically imply high concentrations of natural radioactivity in construction materials derived from these areas. Therefore, radiological safety assessments should not be based solely on proximity to uranium-rich zones but on a detailed analysis of specific geological characteristics and direct measurements of radioactivity in building materials. In Figure 6, the averages of the activity concentrations of 226Ra, 232Th, and 40K for the sample groups of cement, sand, and brick are shown.

3.3. Radon Mass Exhalation Rate and Radon Emanation Fraction

Table 2 summarizes the radon mass exhalation rate for all samples, the slope “m”, which represents the linear growth of the radon concentration during the first 24 h of measurement, and the radon emanation fraction f. A good correlation between the total radium and radon mass exhalation rate from cement samples was found as shown in Figure 7 ( R 2 = 0.99 ). The radon mass exhalation rate ( E M ) varied from (4.50 ± 0.42) mBq·kg−1·h −1 to (22.34 ± 1.30) mBq·kg−1·h −1, with an average value of (14.01 ± 1.04) mBq·kg−1·h−1. The average radon mass exhalation rates from the cement and gypsum samples were comparable with the values reported by [37]. The radon exhalation rate from the bricks was higher than from other samples. Gypsum samples did not show significant radon exhalation, which is consistent with the amount of radium in these samples. The radon emanation fraction for each building material was determined using Equation (3). The average values were 5.9% for cement, 8.6% for sand, 7.1% for concrete, 5.1% for rock, and 11.6% for bricks. Figure 7 shows a strong positive correlation (0.99) between the radium activity concentration and the radon exhalation rate for cement samples.

3.4. Radiological Parameters

The range and average ± SD values of the gamma index I γ , external hazard H e x , internal hazard H i n , absorbed gamma dose rate D R , and annual effective dose ( A E D ) are summarized in Table 3. Building materials such as cement, sand, concrete, and gypsum demonstrated gamma index values of ≤ 0.5, thereby corresponding to the exemption dose criterion of 0.3 mSv·y−1 and indicating that these types of materials can be considered exempt and can be used without restrictions. On the other hand, the I γ of the brick samples exceeded this criterion but met the I γ ≤ 1 criterion, thereby indicating that it did not exceed the 1 mSv·y−1 and therefore can be used for building construction. The values of the external hazard index H e x and internal hazard index H i x were < 1 for the studied building materials, thus ensuring negligible radiation risk due to their use. Of all the samples, only the brick ones exceed the dose level of 55 nGy·h−1. Meanwhile, the annual effective doses were below the recommended limit of 1 mSv·y−1, as suggested by [38].
The concetration of 226Ra, 232Th, and 40K varied considerably among countries. It is important to note that the results of the 40K measurements in this study were higher than those of previous works. Radiological H i n and H e x indices varied but generally remained at comparable levels. It is also evident that the radiological index values were sufficiently low for gypsum to be considered negligible. The anual effective dose (AED) varied, thereby being the lowest in India and highest in the European Union. The building materials in the present study showed concentrations and AEDs in a medium range compared to other countries, as shown in Table 4. Variations may be due to material features, local geology, and regional technical norms regarding building materials. In addition, countries such as Ecuador and Colombia are carrying out similar work to characterize the natural radioactivity of any building materials in the region [39,40].

4. Conclusions

The findings of this study offer a comprehensive assessment of the effectiveness of various sealing techniques for cylindrical plastic containers in gamma spectrometry. Among the methods evaluated, the use of Teflon tape combined with high-vacuum grease was proven to be the most efficient, as evidenced by its performance under the minimum detectable concentration (MDC) criteria set at 44 Bq·m−3. This novel sealing method is especially effective in maintaining air-tightness, which is crucial to ensure the secular equilibrium between 226Ra and its radon progeny. This equilibrium is vital for the indirect estimation of the radium content in samples. Hermetic sealing is paramount in gamma spectrometry, particularly for measuring the natural radioactivity in naturally occurring radioactive material (NORM) and technically enhanced naturally occurring radioactive material (TENORM); it also directly impacts the precision and reliability of these measurements. Therefore, the results of this study can contribute to determining the best practices for air-tight sealing containers containing construction material, thereby avoiding radon leakage for gamma spectrometry and enhancing the accuracy of radioactivity measurements in various materials, as well as provide a more reliable and safer handling of radioactive substances in research and industrial applications.
The analysis of the measurements of the primary radioisotopes, in various materials (including 226Ra, 232Th, and 40K), reveals important findings about their levels. The content of 226Ra was close to or slightly above the global average. Additionally, the levels of 232Th did not exceed the global average in any sample, while 40K was above the average in two samples. When evaluating radiological risks using indices such as the gamma index ( I γ ), only brick samples surpassed the exemption criterion of 0.3 mSv·y−1, although they remained below the more flexible criterion of 1 mSv·y−1. This pattern was observed for indices including the external hazard index ( H e x ) and internal hazard index ( H i n ). Moreover, when calculating gamma dose rates, sand, concrete, and brick exhibited higher levels than the global average of 55 nGy·h−1, but they were still within the UNSCEAR’s recommended limits. The latter could be attributed to the geographical proximity of the raw material extraction areas for brick fabrication to regions known for uranium production. Additionally, the study identified a significant correlation between radon mass exhalation and radon exhalation rates in cement samples, thus suggesting a uniform distribution of 226Ra in the raw material zones used for cement production.
Based on the radiological indices, we conclude that generally all the building materials studied could be considered safe for use, as their values were found to be below the thresholds recommended by the UNSCEAR.
The data from this research are crucial in forming the foundation for national guidelines in Peru. These guidelines aim to regulate radiation exposure from building materials, ensure public safety, and adhere to international standards. In conclusion, this study has significant implications for public health and safety regulations in the construction industry.

Author Contributions

Conceptualization, R.L.; methodology, R.L., P.P., M.E.L.H. and D.P.; formal analysis, R.L., F.D., D.P. and L.S.-B.; investigation, R.L., J.R., N.C., S.R., F.D. and V.V.; writing—original draft preparation, R.L., J.R., N.C. and F.D.; writing—review and editing, R.L., J.R., S.R., F.D., D.M., P.P. and D.P.; supervision, D.P., L.S.-B. and M.E.L.H. All authors have read and agreed to the published version of the manuscript.

Funding

This work was supported by the Project CAP 2018-3-0018/PI 578 of the Pontificia Universidad Católica del Peru and the Universidad Señor de Sipán under Resolution N°079-2022-N°11.

Informed Consent Statement

Not Applicable.

Data Availability Statement

The data presented in this study are available on request from the corresponding author. The data are not publicly available due to privacy.

Acknowledgments

This study was carried out as part of the project CAP 2018-3-0018/ PI 578 and the National Council of Science, Technology, and Technological Innovation (CONCYTEC) under the PhD scholarship program (236-2015-FONDECYT) and the Universidad Señor de Sipán under Resolution N°079-2022-N°11. The authors thank the GITHUNU-PUCP team.

Conflicts of Interest

The authors declare no conflicts of interest.

References

  1. Sonkawade, R.; Kant, K.; Muralithar, S.; Kumar, R.; Ramola, R. Natural radioactivity in common building construction and radiation shielding materials. Atmos. Environ. 2008, 42, 2254–2259. [Google Scholar] [CrossRef]
  2. Ramachandran, T. Background radiation, people and the environment Iran. J. Radiat. Res. 2011, 9, 63–76. [Google Scholar]
  3. Lecomte, J.; Shaw, P.; Liland, A.; Markkanen, M.; Egidi, P.; Andresz, S.; Mrdakovic-Popic, J.; Liu, F.; da Costa Lauria, D.; Okyar, H.; et al. ICRP publication 142: Radiological protection from naturally occurring radioactive material (NORM) in industrial processes. Ann. ICRP 2019, 48, 5–67. [Google Scholar] [CrossRef] [PubMed]
  4. Anjos, R.M.d.; Ayub, J.J.; Cid, A.S.; Cardoso, R.; Lacerda, T. External gamma-ray dose rate and radon concentration in indoor environments covered with Brazilian granites. J. Environ. Radioact. 2011, 102, 1055–1061. [Google Scholar] [CrossRef] [PubMed]
  5. Ramola, R.; Gusain, G.; Badoni, M.; Prasad, Y.; Prasad, G.; Ramachandran, T. 226Ra, 232Th and 40K contents in soil samples from Garhwal Himalaya, India, and its radiological implications. J. Radiol. Prot. 2008, 28, 379. [Google Scholar] [CrossRef] [PubMed]
  6. Coletti, C.; Brattich, E.; Cinelli, G.; Cultrone, G.; Maritan, L.; Mazzoli, C.; Mostacci, D.; Tositti, L.; Sassi, R. Radionuclide concentration and radon exhalation in new mix design of bricks produced reusing NORM by-products: The influence of mineralogy and texture. Constr. Build. Mater. 2020, 260, 119820. [Google Scholar] [CrossRef]
  7. UNSCEAR. Sources and Effects of Ionizing Radiation; United Nations: New York, NY, USA, 2000. [Google Scholar]
  8. Nunes, L.J.R.; Curado, A.; Graça, L.; Soares, S.; Lopes, S.I. Impacts of Indoor Radon on Health: A Comprehensive Review on Causes, Assessment and Remediation Strategies. Int. J. Environ. Res. Public Health 2022, 19, 3929. [Google Scholar] [CrossRef]
  9. Chambers, D.B. Thoron and decay products, beyond UNSCEAR 2006 Annex E. Radiat. Prot. Dosim. 2010, 141, 351–356. [Google Scholar] [CrossRef]
  10. Jasaitis, D.; Pečiulienė, M. Natural Radioactivity and Radon Exhalation from Building Materials in Underground Parking Lots. Appl. Sci. 2021, 11, 7475. [Google Scholar] [CrossRef]
  11. Omori, Y.; Tokonami, S.; Sahoo, S.K.; Ishikawa, T.; Sorimachi, A.; Hosoda, M.; Kudo, H.; Pornnumpa, C.; Nair, R.R.K.; Jayalekshmi, P.A.; et al. Radiation dose due to radon and thoron progeny inhalation in high-level natural radiation areas of Kerala, India. J. Radiol. Prot. 2016, 37, 111. [Google Scholar] [CrossRef]
  12. Ishimori, Y.; Lange, K.; Martin, P.; Mayya, Y.; Phaneuf, M. Measurement and Calculation of Radon Releases from NORM Residues; IAEA: Vienna, Austria, 2013. [Google Scholar]
  13. Andersen, C.E. Radon-222 Exhalation from Danish Building Materials: H+ H Industri A/S Results; Technical Report; Risoe National Laboratory: Roskilde, Denmark, 1999. [Google Scholar]
  14. Hassan, N.M.; Hosoda, M.; Ishikawa, T.; Sorimachi, A.; Sahoo, S.K.; Tokonami, S.; Fukushi, M. Radon migration process and its influence factors; review. Jpn. J. Health Phys. 2009, 44, 218–231. [Google Scholar] [CrossRef]
  15. Chen, J.; Rahman, N.M.; Atiya, I.A. Radon exhalation from building materials for decorative use. J. Environ. Radioact. 2010, 101, 317–322. [Google Scholar] [CrossRef]
  16. Liza, R.; Pereyra, P.; Rau, J.; Guzman, M.; Sajo-Bohus, L.; Palacios, D. Assessment of Natural Radioactivity and Radon Exhalation in Peruvian Gold Mine Tailings to Produce a Geopolymer Cement. Atmosphere 2023, 14, 588. [Google Scholar] [CrossRef]
  17. Pereyra, P.; Guevara-Pillaca, C.J.; Liza, R.; Pérez, B.; Rojas, J.; Vilcapoma L, L.; Gonzales, S.; Sajo-Bohus, L.; López-Herrera, M.E.; Palacios Fernández, D. Estimation of Indoor 222Rn Concentration in Lima, Peru Using LR-115 Nuclear Track Detectors Exposed in Different Modes. Atmosphere 2023, 14, 952. [Google Scholar] [CrossRef]
  18. Rivera, R. Realidad y Perspectivas de los Minerales Radioactivos en el Peru. INGEMMET. 2010. Available online: https://portal.ingemmet.gob.pe/documents/73138/202784/P11_Expo_Uranio.pdf/3bf404af-97c8-4b48-84e2-f84e0e1e5d9b (accessed on 24 October 2023).
  19. Vidmar, T.; Vodenik, B. Extended relative method of activity determination. Appl. Radiat. Isot. 2010, 68, 2421–2424. [Google Scholar] [CrossRef]
  20. Lépy, M.C.; Bé, M.M.; Piton, F. ETNA (Efficiency Transfer for Nuclide Activity Measurement): Software for Efficiency Transfer and Coincidence Summing Corrections in Gamma-Ray Spectrometry; Note Technique LNHB/01/09/A; LNHB: Gif-sur-Yvette Cedex, France, 2004; Volume 1. [Google Scholar]
  21. Stajic, J.; Nikezic, D. Measurement of radon exhalation rates from some building materials used in Serbian construction. J. Radioanal. Nucl. Chem. 2015, 303, 1943–1947. [Google Scholar] [CrossRef]
  22. Kovler, K.; Perevalov, A.; Steiner, V.; Metzger, L. Radon exhalation of cementitious materials made with coal fly ash: Part 1–scientific background and testing of the cement and fly ash emanation. J. Environ. Radioact. 2005, 82, 321–334. [Google Scholar] [CrossRef]
  23. Gutiérrez-Álvarez, I.; Martín, J.; Adame, J.A.; Grossi, C.; Vargas, A.; Bolívar, J. Applicability of the closed-circuit accumulation chamber technique to measure radon surface exhalation rate under laboratory conditions. Radiat. Meas. 2020, 133, 106284. [Google Scholar] [CrossRef]
  24. López-Coto, I.; Mas, J.; Bolivar, J.; García-Tenorio, R. A short-time method to measure the radon potential of porous materials. Appl. Radiat. Isot. 2009, 67, 133–138. [Google Scholar] [CrossRef]
  25. Cosma, C.; Cucoş-Dinu, A.; Papp, B.; Begy, R.; Sainz, C. Soil and building material as main sources of indoor radon in Băiţa-Ştei radon prone area (Romania). J. Environ. Radioact. 2013, 116, 174–179. [Google Scholar] [CrossRef]
  26. Tuccimei, P.; Castelluccio, M.; Soligo, M.; Moroni, M. Radon exhalation rates of building materials: Experimental, analytical protocol and classification criteria. In Building Materials: Properties, Performance and Applications; Nova Science Publishers: Hauppauge, NY, USA, 2009; pp. 259–274. [Google Scholar]
  27. Righi, S.; Bruzzi, L. Natural radioactivity and radon exhalation in building materials used in Italian dwellings. J. Environ. Radioact. 2006, 88, 158–170. [Google Scholar] [CrossRef]
  28. European Commission. Radiation Protection 112: Radiological protection principles concerning the natural radioactivity of building materials. Nucl. Saf. Civ. Prot. 1999. Available online: https://energy.ec.europa.eu/system/files/2014-11/112_0.pdf (accessed on 24 October 2023).
  29. Khandaker, M.U.; Jojo, P.; Kassim, H.; Amin, Y. Radiometric analysis of construction materials using HPGe gamma-ray spectrometry. Radiat. Prot. Dosim. 2012, 152, 33–37. [Google Scholar] [CrossRef]
  30. Beretka, J.; Mathew, P. Natural radioactivity of Australian building materials, industrial wastes and by-products. Health Phys. 1985, 48, 87–95. [Google Scholar] [CrossRef]
  31. Raghu, Y.; Ravisankar, R.; Chandrasekaran, A.; Vijayagopal, P.; Venkatraman, B. Assessment of natural radioactivity and radiological hazards in building materials used in the Tiruvannamalai District, Tamilnadu, India, using a statistical approach. J. Taibah Univ. Sci. 2017, 11, 523–533. [Google Scholar] [CrossRef]
  32. Othman, S.Q.; Ahmed, A.H.; Mohammed, S.I. Natural radioactivity and radiological risk assessment due to building materials commonly used in Erbil city, Kurdistan region, Iraq. Environ. Monit. Assess. 2023, 195, 140. [Google Scholar] [CrossRef] [PubMed]
  33. UNSCEAR. Sources and Effects of Ionizing Radiation, United Nations Scientific Committee on the Effects of Atomic Radiation; United Nations Publication: New York, NY, USA, 2008. [Google Scholar]
  34. Scholten, J.C.; Osvath, I.; Pham, M.K. 226Ra measurements through gamma spectrometric counting of radon progenies: How significant is the loss of radon? Mar. Chem. 2013, 156, 146–152. [Google Scholar] [CrossRef]
  35. Bonczyk, M.; Samolej, K. Testing of the radon tightness of beakers and different types of sealing used in gamma-ray spectrometry for 226Ra concentration determination in NORM. J. Environ. Radioact. 2019, 205, 55–60. [Google Scholar] [CrossRef] [PubMed]
  36. Syam, N.S.; Lim, S.; Lee, H.Y.; Lee, S.H. Determination of radon leakage from sample container for gamma spectrometry measurement of 226Ra. J. Environ. Radioact. 2020, 220, 106275. [Google Scholar] [CrossRef]
  37. Frutos-Puerto, S.; Pinilla-Gil, E.; Andrade, E.; Reis, M.; Madruga, M.J.; Rodríguez, C.M. Radon and thoron exhalation rate, emanation factor and radioactivity risks of building materials of the Iberian Peninsula. PeerJ 2020, 8, e10331. [Google Scholar] [CrossRef]
  38. Valentin, J.; Clarke, R.H.; GonzálezY, A.J.; Alexakhin, R.M.; Sasaki, Y.; Holm, L.-E.; Streffer, C.; Boice jr, J.D.; Mettler jr, F.A.; Sugier, A.; et al. The 2007 Recommendations of the International Commission on Radiological Protection; Elsevier: Oxford, UK, 2007; Volume 37. [Google Scholar] [CrossRef]
  39. Tene, T.; Gomez, C.V.; Usca, G.T.; Suquillo, B.; Bellucci, S. Measurement of radon exhalation rate from building materials: The case of Highland Region of Ecuador. Constr. Build. Mater. 2021, 293, 123282. [Google Scholar] [CrossRef]
  40. Herrera, D.C.; Ramirez, J.G.; Munera, H.A. Preliminary study of radiation doses from some natural materials used by the construction industry in Colombia. In Proceedings of the IRPA 12: 12th International Congress of the International Radiation Protection Association (IRPA): Strengthening Radiation Protection Worldwide, Buenos Aires, Argentina, 19–24 October 2008. [Google Scholar]
  41. Szabó, Z.; Völgyesi, P.; Nagy, H.; Szabó, C.; Kis, Z.; Csorba, O. Radioactivity of natural and artificial building materials–a comparative study. J. Environ. Radioact. 2013, 118, 64–74. [Google Scholar] [CrossRef]
  42. Imani, M.; Adelikhah, M.; Shahrokhi, A.; Azimpour, G.; Yadollahi, A.; Kocsis, E.; Toth-Bodrogi, E.; Kovács, T. Natural radioactivity and radiological risks of common building materials used in Semnan Province dwellings, Iran. Environ. Sci. Pollut. Res. Int. 2021, 28, 41492–41503. [Google Scholar] [CrossRef]
  43. Lewicka, S.; Piotrowska, B.; Łukaszek-Chmielewska, A.; Drzymała, T. Assessment of natural radioactivity in cements used as building materials in Poland. Int. J. Environ. Res. Public Health 2022, 19, 11695. [Google Scholar] [CrossRef]
  44. ukaszek-Chmielewska, A.; Girard, M.; Wojtkowski, K.; Isajenko, K.; Piotrowska, B. Analysis of natural radionuclide concentrations in selected building materials available on the domestic market. In Proceedings of the SHS Web of Conferences; EDP Sciences: Gdańsk-Nynäshamn, Poland, 2018; Volume 57, p. 02003. [Google Scholar] [CrossRef]
  45. Todorović, N.; Bikit, I.; Krmar, M.; Mrđa, D.; Hansman, J.; Nikolov, J.; Todorović, S.; Forkapić, S.; Jovančević, N.; Bikit, K.; et al. Assessment of radiological significance of building materials and residues. Rom. J. Phys. 2016, 62, 817. [Google Scholar]
  46. Trevisi, R.; Risica, S.; D’Alessandro, M.; Paradiso, D.; Nuccetelli, C. Natural radioactivity in building materials in the European Union: A database and an estimate of radiological significance. J. Environ. Radioact. 2012, 105, 11–20. [Google Scholar] [CrossRef]
  47. Trevisi, R.; Leonardi, F.; Risica, S.; Nuccetelli, C. Updated database on natural radioactivity in building materials in Europe. J. Environ. Radioact. 2018, 187, 90–105. [Google Scholar] [CrossRef] [PubMed]
  48. Nuccetelli, C.; Risica, S.; d’Alessandro, M.; Trevisi, R. Natural radioactivity in building material in the European Union: Robustness of the activity concentration indexIand comparison with a room model. J. Radiol. Prot. 2012, 32, 349–358. [Google Scholar] [CrossRef]
  49. Schroeyers, W.; Sas, Z.; Bátor, G.; Trevisi, R.; Nuccetelli, C.; Leonardi, F.; Schreurs, S.; Kovács, T. The NORM4Building database, a tool for radiological assessment when using by-products in building materials. Constr. Build. Mater. 2018, 159, 755–767. [Google Scholar] [CrossRef]
  50. Lyngkhoi, B.; Nongkynrih, P. Radioactivity in building materials and assessment of risk of human exposure in the East Khasi Hills District, Meghalaya, India. Egypt. J. Basic Appl. Sci. 2020, 7, 194–209. [Google Scholar] [CrossRef]
  51. da Silva, L.B.; da Silva, L.F.; Orejuela, C.O.P.; Junior, V.B.; da Silva, A.X. Assessment and estimation of the effective dose due to external exposure from natural radioactivity of sands used in civil construction in the state of Rio de Janeiro (Brazil). Appl. Radiat. Isot. 2023, 205, 111157. [Google Scholar] [CrossRef] [PubMed]
  52. Malanca, A.; Pessina, V.; Dallara, G. Assessment of the natural radioactivity in the Brazilian state of Rio Grande do Norte. Health Phys. 1993, 65, 298–302. [Google Scholar] [CrossRef] [PubMed]
  53. Quintana, E.; Serdeiro, G.; Fernandez, J.; Ciallella, H. Study of the Radiological Impact of the Construction Materials in Argentina; Estudio del Impacto Radiologico de los Materiales de la Construccion en Argentina. 2006. Available online: https://inis.iaea.org/collection/NCLCollectionStore/_Public/38/007/38007682.pdf (accessed on 16 January 2024).
Figure 1. The dotted blue curve indicates the extraction area of natural mineral materials used as raw materials for the construction products evaluated in this study. The green dot points to the primary raw material extraction area for brick production located in Ica, which is southwest of Lima on the central coast of Peru [18].
Atmosphere 15 00279 g001
Figure 2. Sealing methods and leakage setup experiment are displayed. On the left, three methods are shown: (A) tightening the screw cap to its limit, (B) using Teflon tape on the thread, and (C) applying high-vacuum grease to the internal contour of the screw cap and covering the thread with Teflon tape. Depicted on the right, (D) is the setup inside the accumulation chamber for measuring container leakage.
Atmosphere 15 00279 g002
Figure 3. Gamma spectrum of various materials such as gypsum, brick, and the IAEA reference sample.
Atmosphere 15 00279 g003
Figure 4. Radon exhalation experimental setup: RAD7 instrument measuring the radon exhalation rate of the sample contained in the stainless steel accumulation chamber.
Atmosphere 15 00279 g004
Figure 5. Comparison of the time evolution of radon leakage for the three sealing methods vs. background concentration for the plastic cylindrical containers.
Atmosphere 15 00279 g005
Figure 6. Averages of activity concentrations of 226Ra, 232Th, and 40K for cement, sand, and bricks.
Atmosphere 15 00279 g006
Figure 7. Correlation between radon mass exhalation rate and radium concentration of cement samples.
Atmosphere 15 00279 g007
Table 1. Activity concentration of 226Ra, 232Th, and 40K in pulverized samples of building materials from the Peruvian central coast.
Sample
Building Materials *
Activity Concentration (Bq·kg−1)
C 40 K Uncertainty (±) C 226 Ra Uncertainty (±) C 232 Th Uncertainty (±)
1Cement S4051933.31.07.80.8
2Cement PR5792742.51.610.81.0
3Cement A3471631.81.27.80.8
4Cement PV3561743.81.79.91.0
5Cement Y8213930.01.19.50.9
6Sand G9244440.91.515.41.5
7Sand F18984323.80.97.70.7
8Sand F28344042.11.613.41.3
9Gypsum MBDLBDLBDL
10Gypsum LBDLBDLBDL
11Concrete6673344.41.719.61.9
12Rock4522128.71.110.81.0
13Brick P810675160.62.321.42.1
14Brick P910745150.61.922.32.2
BDL: Below the detection limit. * The letters accompanying the construction materials indicate the brands of these products.
Table 2. The radon mass exhalation rate E M , the initial slope of radon growth in the accumulation chamber m, and the radon emanation fraction f of the building material samples.
Samples m ± Δ m (Bq·m−3·h−1) E M ± Δ E M (mBq·kg−1h−1)f (%)
Cement S 0.98 ± 0.07 13.1 ± 0.9 5.2
Cement PR 1.77 ± 0.06 20.8 ± 1.4 6.5
Cement A 1.30 ± 0.07 14.5 ± 1.1 6.0
Cement PV 1.34 ± 0.07 21.0 ± 1.3 6.4
Cement Y 0.93 ± 0.08 12.9 ± 1.1 5.7
Sand G 2.40 ± 0.07 29.8 ± 1.8 9.6
Sand F1 1.44 ± 0.08 13.7 ± 1.1 7.6
Sand F2 1.04 ± 0.07 18.8 ± 1.1 5.9
Gypsum M 0.21 ± 0.09 BDLBDL
Gypsum L 0.25 ± 0.09 BDLBDL
Concrete 1 1.75 ± 0.07 23.9 ± 1.5 7.1
Rock C 1.15 ± 0.08 11.1 ± 0.9 5.1
Brick P8 2.45 ± 0.05 52.3 ± 2.4 13.6
Brick P9 1.25 ± 0.06 44.2 ± 2.1 11.6
Table 3. Range and average of the different radiological hazard indices for the analyzed building material samples.
Building
Material
No. I γ H ex H in D ( nGy · h 1 ) AED ( m Sv · y 1 )
Cement5Range0.26–0.420.19–0.290.27–0.3933.87–53.830.17–0.26
Average ± SD 0.33 ± 0.07 0.24 ± 0.04 0.34 ± 0.05 43.21 ± 8.57 0.21 ± 0.04
Sand3Range0.42–0.520.28–0.360.35–0.4753.09–66.730.26–0.33
Average ± SD 0.47 ± 0.05 0.33 ± 0.04 0.42 ± 0.07 60.71 ± 6.96 0.30 ± 0.03
Gypsum2------
Concrete1- 0.52 0.38 0.54 67.37 0.33
Rock1- 0.30 0.21 0.29 38.63 0.19
Brick2Range0.64–0.660.45–0.470.58–0.6381.63–85.420.40–0.42
Average ± SD 0.65 ± 0.02 0.46 ± 0.02 0.61 ± 0.03 83 ± 2.68 0.41 ± 0.01
Table 4. Measured activity concentrations of 226Ra, 232Th, and 40K, calculated indices and AEDs for building materials from various country studies. Average value are provided in parenthesis; notation for no range is (NR) and for unvailable data is (ND).
Country/
Reference
Samples226Ra (Bq·kg−1)232Th (Bq·kg−1)40K (Bq·kg−1) H in H ex I γ AED ( m Sv · y 1 )
Hungary [41]Cement19–251 (108)7–25 (17)36–110 (69)0.14–1.47 (0.67)0.09–0.79 (0.38)0.11–0.98 (0.47)0.4–1.29 (0.61)
Brick31–32 (32)NR (31)473–484 (479)0.39–0.40 (0.40)0.30–0.31 (0.31)NR (0.42)0.49–0.50 (0.50)
Concrete9–13 (11)5–7 (6)115–169 (142)0.11–0.12 (0.12)0.08–0.09 (0.09)0.11–0.12 (0.12)0.13–0.15 (0.14)
Iran [42]Cement24–38 (31)11–18 (15)145–312 (231)0.24–0.31 (0.27)0.17–0.20 (0.19)0.23–0.27 (0.25)0.28–0.33 (0.30)
Brick20–39 (30)19–34 (28)167–536 (338)0.25–0.40 (0.34)0.18–0.29 (0.26)0.24–0.39 (0.35)0.28–0.46 (0.42)
Gypsum10–13 (12)11–17 (14)66–172 (116)0.13–0.15 (0.14)0.10–0.11 (0.11)0.14–0.15 (0.15)0.16-0.17 (0.17)
Poland [43,44,45]Cement21.7–75.6 (48)12.3–47.3 (29)123–430 (238)0.35–0.67 (0.51)0.22–0.44(0.32)0.33–0.61 (0.47)0.40–0.74 (0.57)
Brick(35.6)(31.75)(546.41)NDNDND(0.098)
Sand2–49(13.5)2.3–90.0 (9.4)26–770 (206)NDNDNDND
European Union [46,47,48,49]Cement4–422 (45)3–266 (67)4–846 (216)NDNDND0.10–3.01 (1.03)
Brick2–148 (47)2–164 (48)12–1169 (598)NDNDND0.15–2.34 (1.01)
Gypsum22–668 (318)5–55 (19)3–151 (58)NDNDNDND
India [50]Sand42.6–92.7 (70.81)45.2–95.6 (77.10)409.5–777.10 (575.20)0.61–0.95 (0.80)0.46–0.70 (0.61)0.63–0.93 (0.81)0.10–0.15 (0.12)
Cement35.8–69.5 (55.26)45.0–77.4 (64.61)55.8–133.3 (97.83)0.35–0.64 (0.52)0.28–0.50 (0.41)0.40-0.71 (0.58)0.06-0.10 (0.08)
Brick36.4–80.9 (63.0)35.7–73.2 (53.78)292.6–492.3 (405.02)0.43–0.81 (0.62)0.32–0.61 (0.47)0.41–0.81 (0.61)0.07–0.13 (0.10)
Brazil [51,52]Sand40.3–134.0 (66.7)15.1–136.0 (40.6)289.0–1019.0 (647.0)NDNDND0.33–1.06 (0.51)
CementNR (62)NR (59)NR (564)NDNDNDND
Brick9.5–70.0 (46.8)12.7–488.6 (119.9)149–553 (349)NDNDNDND
Argentina [53]Cement6.4–34.0(16.3)11.6–14.1 (13.0)199–247 (228.8)NDNDNDND
Sand3.7–45.8 (20.1)4.7–90.0 (33.8)85–1168 (522)NDNDNDND
Gypsum1.6–9.5 (5.8)<26–59.7 (25.7)NDNDNDND
Present studyCement30–43.8 (36.28)7.8–10.8 (9.16)347–821 (501.6)0.27–0.39 (0.34)0.19–0.29 (0.24)0.26–0.42 (0.33)0.17–0.26 (0.21)
Brick50.6–60.6 (55.8)21.4–22.3 (21.85)1067–1074 (1070.5)0.58–0.63 (0.61)0.45–0.47 (0.46)0.64–0.66 (0.65)0.40–0.42 (0.41)
Concrete(44.7)(19.6)(667)0.58–0.63 (0.61)0.45–0.47 (0.46)0.64–0.66 (0.65)0.40-0.42 (0.41)
Sand23.8–42.1 (35.6)7.7–15.4 (12.16)834–924 (885.3)0.35–0.47 (0.42)0.28–0.36 (0.33)0.42–0.52 (0.47)0.26–0.33 (0.30)
Disclaimer/Publisher’s Note: The statements, opinions and data contained in all publications are solely those of the individual author(s) and contributor(s) and not of MDPI and/or the editor(s). MDPI and/or the editor(s) disclaim responsibility for any injury to people or property resulting from any ideas, methods, instructions or products referred to in the content.

