Article

A Case Study of Pc1 Waves Observed at the Polar Cap Associated with Proton Precipitation at Subauroral Latitudes

by
Giulia D’Angelo
1,2,*,
Patrizia Francia
1,
Marcello De Lauretis
1,
Alexandra Parmentier
2,
Tero Raita
3 and
Mirko Piersanti
1,2
1
Department of Physical and Chemical Sciences, University of L’Aquila, 67100 Coppito (AQ), Italy
2
National Institute of Astrophysics, IAPS, INAF-IAPS, 00133 Rome, Italy
3
Sodankylä Geophysical Observatory, University of Oulu, FIN-99600 Sodankylä, Finland
*
Author to whom correspondence should be addressed.
Atmosphere 2024, 15(2), 219; https://doi.org/10.3390/atmos15020219
Submission received: 20 December 2023 / Revised: 5 February 2024 / Accepted: 7 February 2024 / Published: 11 February 2024
(This article belongs to the Section Upper Atmosphere)

Abstract

:
The importance of ElectroMagnetic Ion Cyclotron (EMIC) ultra-low-frequency (ULF) waves (and their Pc1 counterparts) is connected to their critical role in triggering energetic particle precipitation from the magnetosphere to the conjugated ionosphere via pitch angle scattering. In addition, as a prominent element of the ULF zoo, EMIC/Pc1 waves can be considered a perfect tool for the remote diagnosis of the topologies and dynamic properties of near-Earth plasmas. Based on the availability of a comprehensive set of instruments, operating on the ground and in the top-side ionosphere, the present case study provides an interesting example of the evolution of EMIC propagation to both ionospheric hemispheres up to the polar cap. Specifically, we report observations of Pc1 waves detected on 30 March 2021 under low Kp, low Sym-H, and moderate AE conditions. The proposed investigation shows that high-latitude ground magnetometers in both hemispheres and the first China Seismo-Electromagnetic Satellite (CSES-01) at a Low Earth Orbit (LEO) detected in-synch Pc1 waves. In strict correspondence to this, energetic proton precipitation was observed at LEO with a simultaneous appearance of an isolated proton aurora at subauroral latitudes. This supports the idea of EMIC wave-induced proton precipitation contributing to energy transfer from the magnetosphere to the ionosphere.

1. Introduction

Geomagnetic Pc1 pulsations in the frequency range ~0.2–5.0 Hz represent the ground signatures of ElectroMagnetic Ion-Cyclotron (EMIC) waves. EMIC waves are generated in the equatorial magnetosphere by the cyclotron instability of energetic ions with distributions in the velocity space marked by thermal anisotropy T > T (in field-aligned coordinates-perpendicular and parallel direction taken w.r.t. local magnetic field). This mechanism is also found to occur during storm recovery phases [1] due to hot (a few dozen to a few hundred keV) ring current ions overlapping cold plasmaspheric plasma in regions near the plasmapause [2,3] and in plasmaspheric plumes [4].
EMIC waves are transmitted in the form of left-hand polarized Alfvén waves along magnetic field lines into the high-latitude ionosphere, where they experience mode conversion to compressional waves, undergoing gradual polarization rotation (left-hand to linear to right-hand) as they propagate far from the injection region [5]. Their propagation in the ionospheric waveguide—approximately centered at the altitude of the electron density maximum (~350 km)—is horizontal, equidirectional, and induced by ionospheric Hall currents [6]. During propagation, these waves are subject to attenuation due to absorption and leakages [7,8]. Wave attenuation is predicted to be larger in daytime than in nighttime, allowing propagation over distances of hundreds and thousands of km, respectively [8]. Leakages of the wave energy through the lower wall of the duct make possible their detection on the ground, even at large distances from the injection region [9,10,11].
In the upper ionosphere, Pc1 waves are detected by Low Earth Orbit (LEO) satellites. Recent statistical studies, based on Swarm data, have revealed that Pc1 waves at LEO mostly occur at subauroral/auroral latitudes with a dominant linear polarization and an oblique propagation with respect to the local magnetic field. Such waves are more frequent during the late recovery phase of geomagnetic storms [12,13]. Moreover, several studies have observed Pc1 waves at ground in the form of long-lasting, large-scale events [14,15,16]. Most recently, Liu et al. [17] statistically estimated the longitudinal extent of Pc1 pulsations using seven PWING ground stations at subauroral latitudes, and they found that the peak of the probability distribution of their longitudinal extent is ~82.5°, with a half maximum of ~114°.
On the ground, Pc1 pulsations are commonly observed from subauroral to polar latitudes [10,18,19]. Under very quiet geomagnetic conditions (Kp ≤ 1), the occurrence peak is usually in the prenoon sector, but it shifts to afternoon for increasing geomagnetic activity [19,20]. Kim et al. [10] found that the wave propagation in the ionospheric waveguide was generally poleward from an injection region, at a lowest magnetic latitude of ~62°; yet, for about 15% of these events, there was no clear poleward propagation, and the highest spectral power appeared elsewhere than the lowest latitude, thus implying either a higher-latitude or an off-meridional wave injection. In the polar cap, Francia et al. [21] observed simultaneous, highly coherent Pc1 waves at two Antarctic stations, Mario Zucchelli (MZS) and Concordia (DMC), located at a distance of about one thousand kilometers from each other and at approximately the same geographic latitude, but at different longitudes. These last observations suggested a wave propagation in the ionospheric waveguide from the same injection region at a lower latitude, toward the two polar cap stations, possibly along different paths.
EMIC waves produce the precipitation into the atmosphere of ring current protons from a few dozen to a few hundred keV, scattered by resonance [22,23]. Proton precipitation is the cause of Isolated Proton Auroras (IPAs) at subauroral latitudes (55°–65°), observed in association with ground Pc1 pulsations [24,25,26,27]. In a statistical study, Sakaguchi et al. [25] found that IPAs tend to occur across the late recovery phase of a storm in both post- and pre-midnight sectors. Also, those IPAs were found to move equatorward (poleward) with an increasing (decreasing) frequency of simultaneous Pc1 waves (and of the He+-band EMIC waves at the equatorial plane connected to the observed isolated arcs), suggesting that, since the ion cyclotron frequency depends on the magnetic field’s intensity, auroras are magnetically connected to the magnetospheric regions associated with EMIC generation.
Finally, it is worth noting that energetic precipitating particles might have important effects on the chemistry and electrical properties of the atmosphere at mesospheric and stratospheric altitudes [28].
In the present work, we present a case study of an EMIC/Pc1 event simultaneously observed at DMC in Antarctica and by the LEO CSES-01 spacecraft at L = 6.7 on 30 March 2021. The event was also observed in the northern hemisphere at the highest-latitude station in the Finnish pulsation magnetometer network. These data suggest a possible source region for the pulsations in the evening/L~6.7 magnetosphere, and provide further evidence of the wave propagation in the ionospheric waveguide up to the polar cap. In addition, the availability of measurements of precipitating particles and auroral radiance observations also allows to observe proton precipitation upon the wave event, accompanied by the corresponding occurrence of an IPA.

2. Materials and Methods

In this study, we have examined Pc1 waves observed on 30 March 2021 by ground search-coil magnetometers located in Antarctica at Mario Zucchelli (MZS) and Concordia (DMC) stations, respectively, whose coordinates are shown in Table 1, together with their locations and station identifiers (IDs).
Both magnetometers provide variations in the geomagnetic H (northward), D (eastward), and Z (vertically downward) field components at a 5 Hz sampling rate.
For an interhemispheric comparison, we also have used geomagnetic observations from the Finnish Pulsation Magnetometer Network (LT = UT + 2), run by the Sodankylä Geophysical Observatory. Specifically, we selected search-coil magnetometers at a sampling rate of 250 Hz with a cut-off frequency of 35 Hz, located at the stations listed in Table 2.
It is worth noting that, in the present investigation, we have resampled geomagnetic signals at 5 Hz, in order to have the same sampling frequency as for southern observatories.
We have applied Welch’s method [29] to compute the power spectral density (PSD) over 120 s time intervals using the Hamming window and averages of 30 s sub-intervals, with a 50% overlapping and a frequency smoothing over three frequency bands, which results in about 24 degrees of freedom and a frequency resolution of 33.3 mHz.
We also have estimated the polarization parameters, applying the technique for partially polarized waves proposed by Fowler et al. [30]. In particular, we have estimated the polarization ratio R (i.e., the ratio of polarized to total intensity of the horizontal signal) and the ellipticity ε (i.e., the ratio of minor to major axis of the polarization ellipse in the horizontal plane). A positive (negative) value of the ellipticity is a mark of right-handed (left-handed) polarized waves; when the ellipticity is close to zero (generally |ε| < 0.2), the related waves are considered linearly polarized [10,31].
In order to investigate in-situ ionospheric electric and magnetic fields, we have used data from the first China Seismo-Electromagnetic Satellite (CSES-01, [32]), which has a sun-synchronous orbit at an altitude of about 500 km, with an inclination angle of 97.4°. The local time of the descending (ascending) node is 14 LT (02 LT). The CSES-01 satellite is equipped with a search coil magnetometer (SCM) with a sampling rate of 1024 Hz [33], and an electric field detector (EFD) with a sampling rate of 5 kHz [34]. Although the satellite is usually turned off at geographic latitudes greater than 65° in both hemispheres, it is able to observe auroral and polar regions within specific geomagnetic configurations, as in the case of the present work.
Earth’s magnetic field data have also been acquired by the Iridium constellation. Iridium satellites provide voice and data coverage for satellite phones, pagers, and integrated transceivers over the Earth’s entire surface [35]. Magnetometer data from this constellation (of 66 active satellites in LEO (~780 km) that ensure a global coverage of the Earth) provide observations of the inner magnetospheric field. Such data are sent to the Active Magnetosphere and Planetary Electrodynamics Response Experiment (AMPERE) Science Data Center, where they are processed to extract the perturbation signatures associated with the Field Aligned Current (FAC) systems that connect the ionosphere to the magnetosphere [36]. AMPERE data are considered here to better characterize the energy transfer from the magnetosphere to the ionosphere.
To understand whether the observed EMIC/Pc1 event may have caused the precipitation of particles to the high-latitude ionosphere on 30 March 2021, we have analyzed and interpreted data acquired by the National Oceanic and Atmospheric Administration (NOAA)-operated Defence Meteorological Satellite Program (DMSP) Polar-orbiting Operational Environmental Satellites (POES), and the EUMETSAT-operated Meteorological Operational (MetOp) satellites. These are all LEO-polar satellites orbiting at about 850 km from the Earth’s surface. Specifically, the Special Sensor Ultraviolet Spectrographic Imagers (SSUSI [37]) on board DMSP satellites F17–F19 provide global auroral radiance observations at five wavelengths in the ultraviolet range (115–180 nm), with high spatial resolution (7–9 km at nadir), using 15-s scans across the satellite track [38]. In this study, the emission in the hydrogen line HI (121.6 nm) is used to detect proton precipitation [39].
Any POES and MetOp satellite is equipped with the Total Energy Detector (TED, [40]), which consists of two sets of subdetectors capable of monitoring the influx of either energetic ions or electrons under 20 keV to the atmosphere. TED proton total atmospheric integral energy flux at 120 km has been used in this work to track <20-keV proton activity. Any POES or MetOp satellite also accommodates a Medium Energy Proton and Electron Detector (MEPED [40]), which also includes two couples of 30°-wide, high-energy proton/electron telescopes. The approximately zenith-pointing (0°) proton telescope operates in the range from 30 to 6900 keV over five differential energy channels, basically observing—at very high latitudes—fluxes of radiation-belt populations inside the bounce loss cone, i.e., precipitating beneath the spacecraft [41]. Channels P1 (30–80 keV) and P2 (80–240 keV) are best suited to monitor energies typical of the magnetospheric ring current [42].
Auroral activity has been additionally monitored from the ground, exploiting the all-sky images taken by the white-light cameras at the Antarctic Syowa Station, which is the mother station of the Japanese Antarctic Research Expedition (JARE), established in 1957.
In order to characterize the interplanetary conditions and the geomagnetic activity during and around the wave event, we have used OMNI solar wind and Interplanetary Magnetic Field (IMF) data [43], as well as the geomagnetic index SYM-H [44], both with 1-min resolution.
Finally, the plasmapause location has been assessed using the Liu and Liu model [45], which is based on the experimental THEMIS-D satellite plasmapause crossing database. The model relies on the following equations:
L p p = a 1 1 + a M L T c o s φ 2 π a φ 24 × l o g 10 D s t + b 1 1 + b M L T c o s φ 2 π b φ 24
φ = 2 π M L T 24
with MLT of THEMIS-D and other parameters as reported in Table 1 of [46].

3. Results

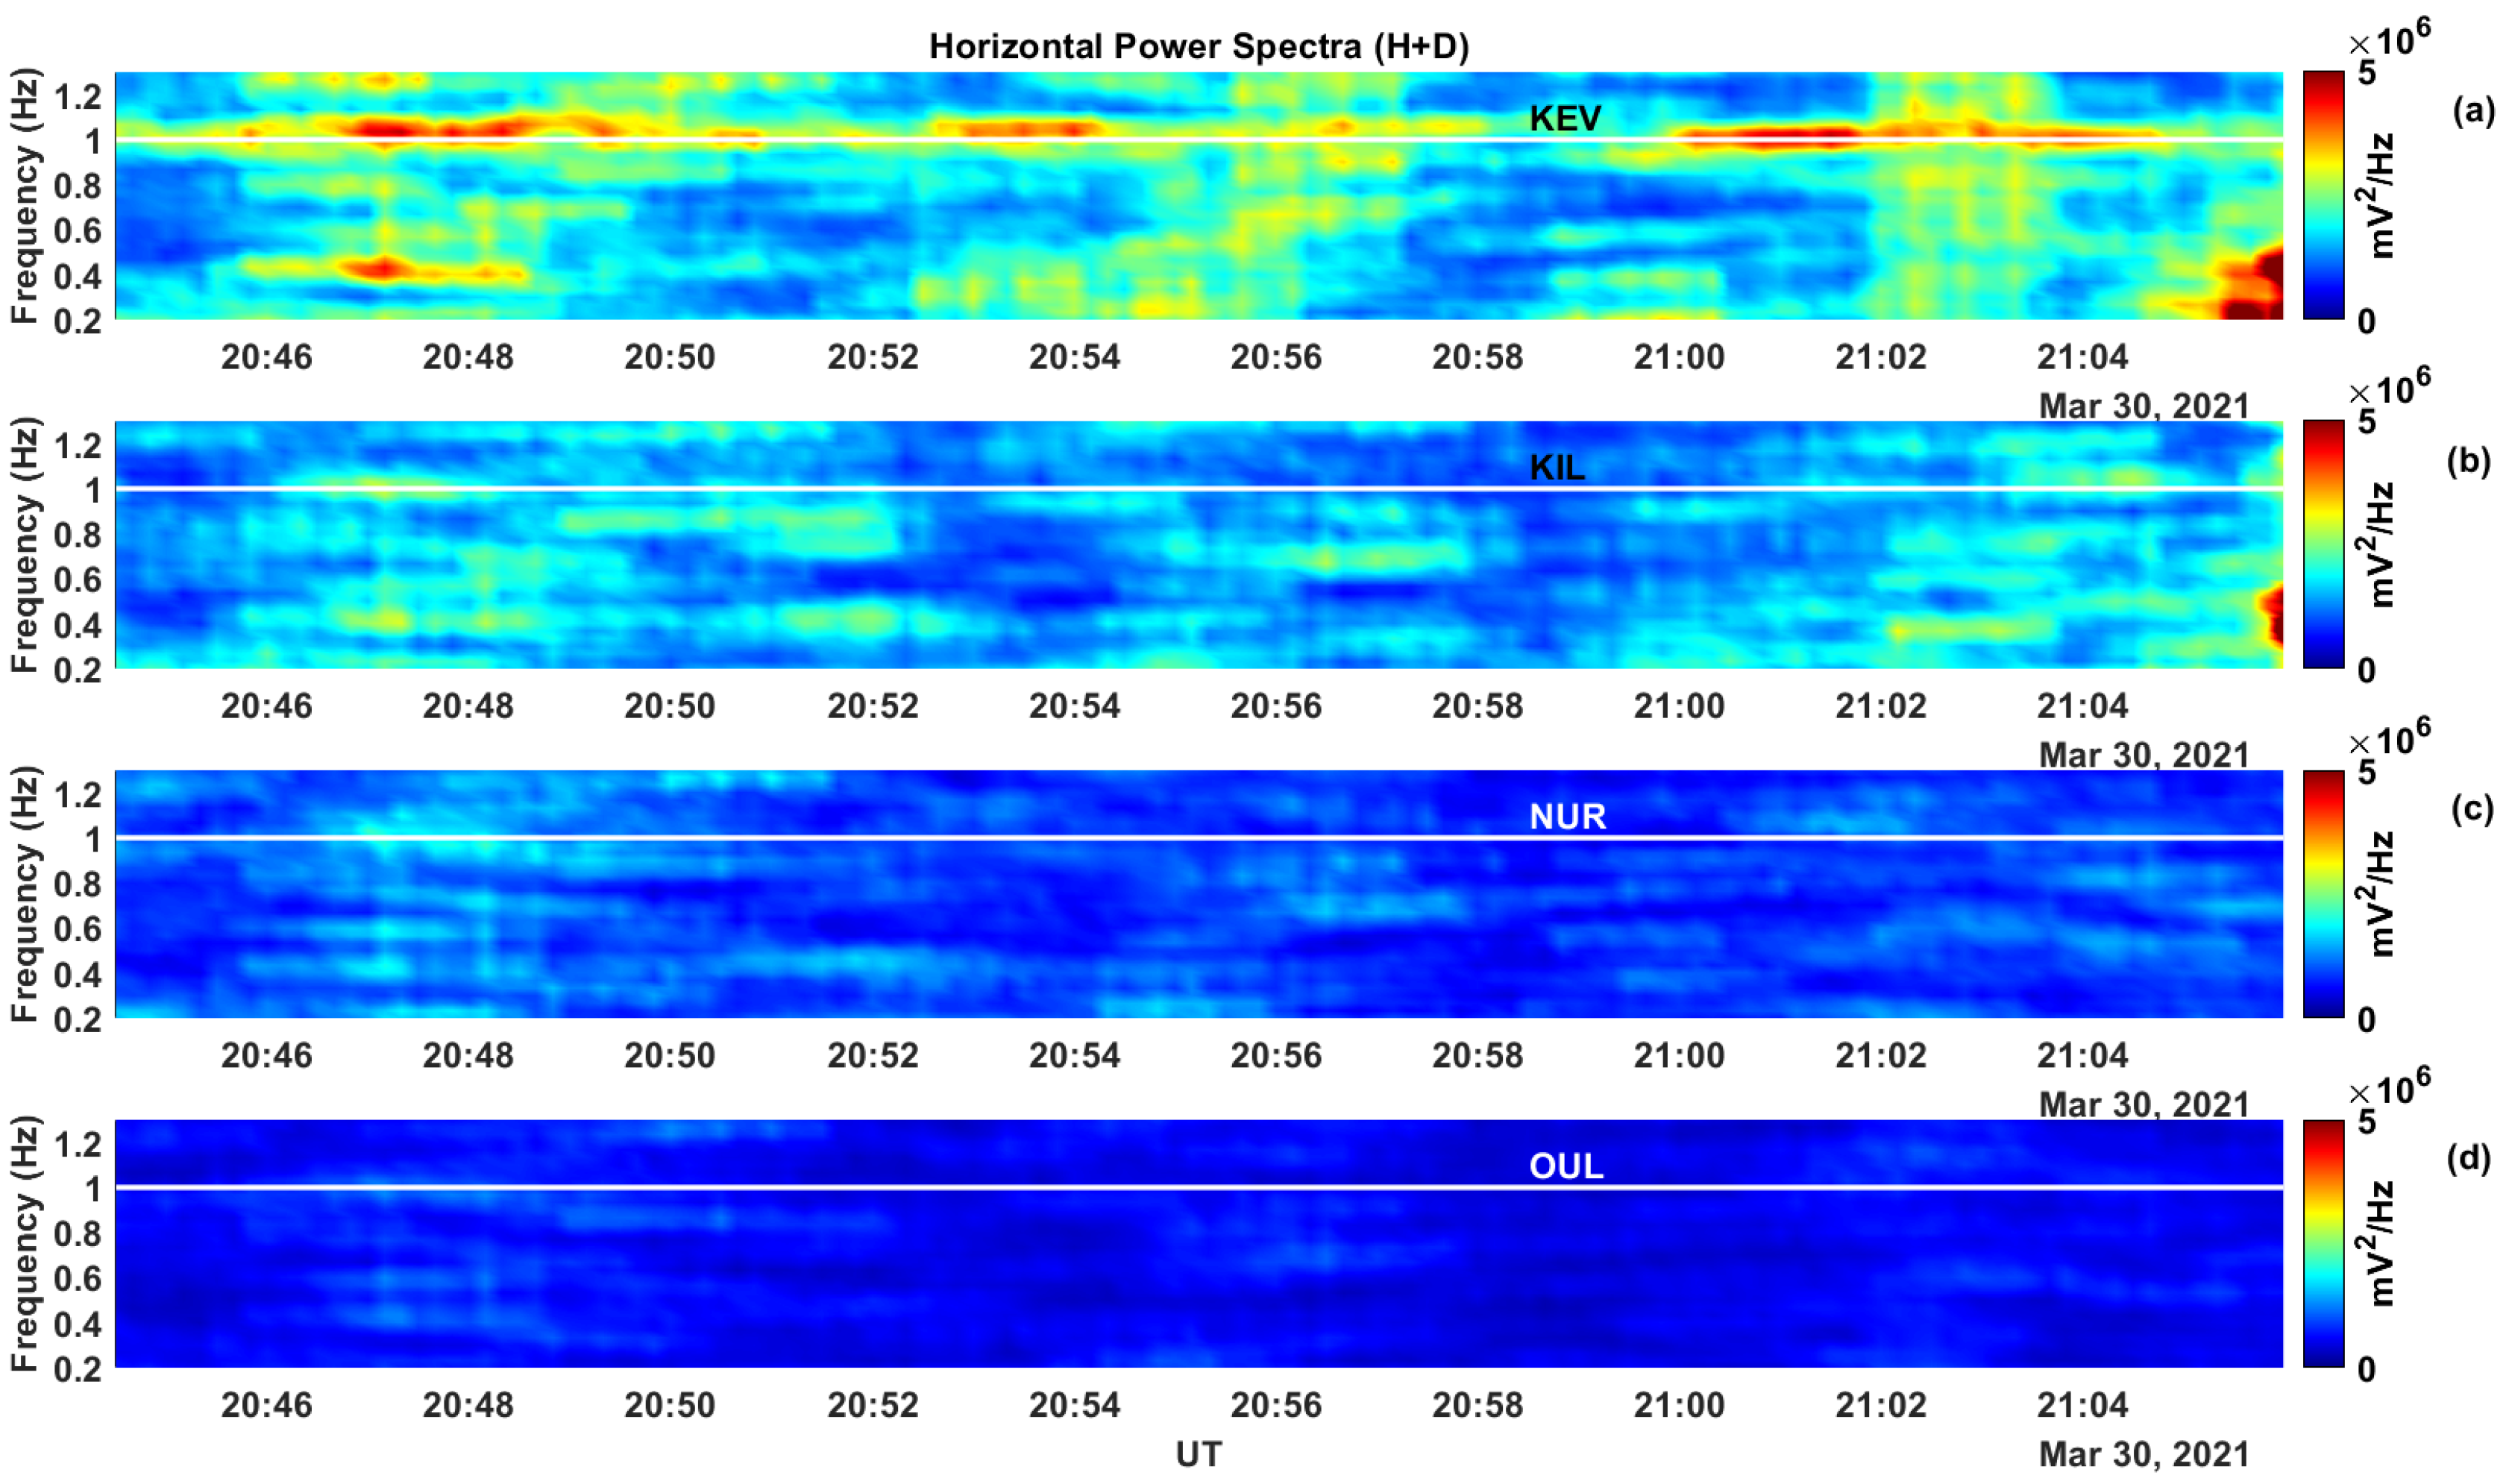
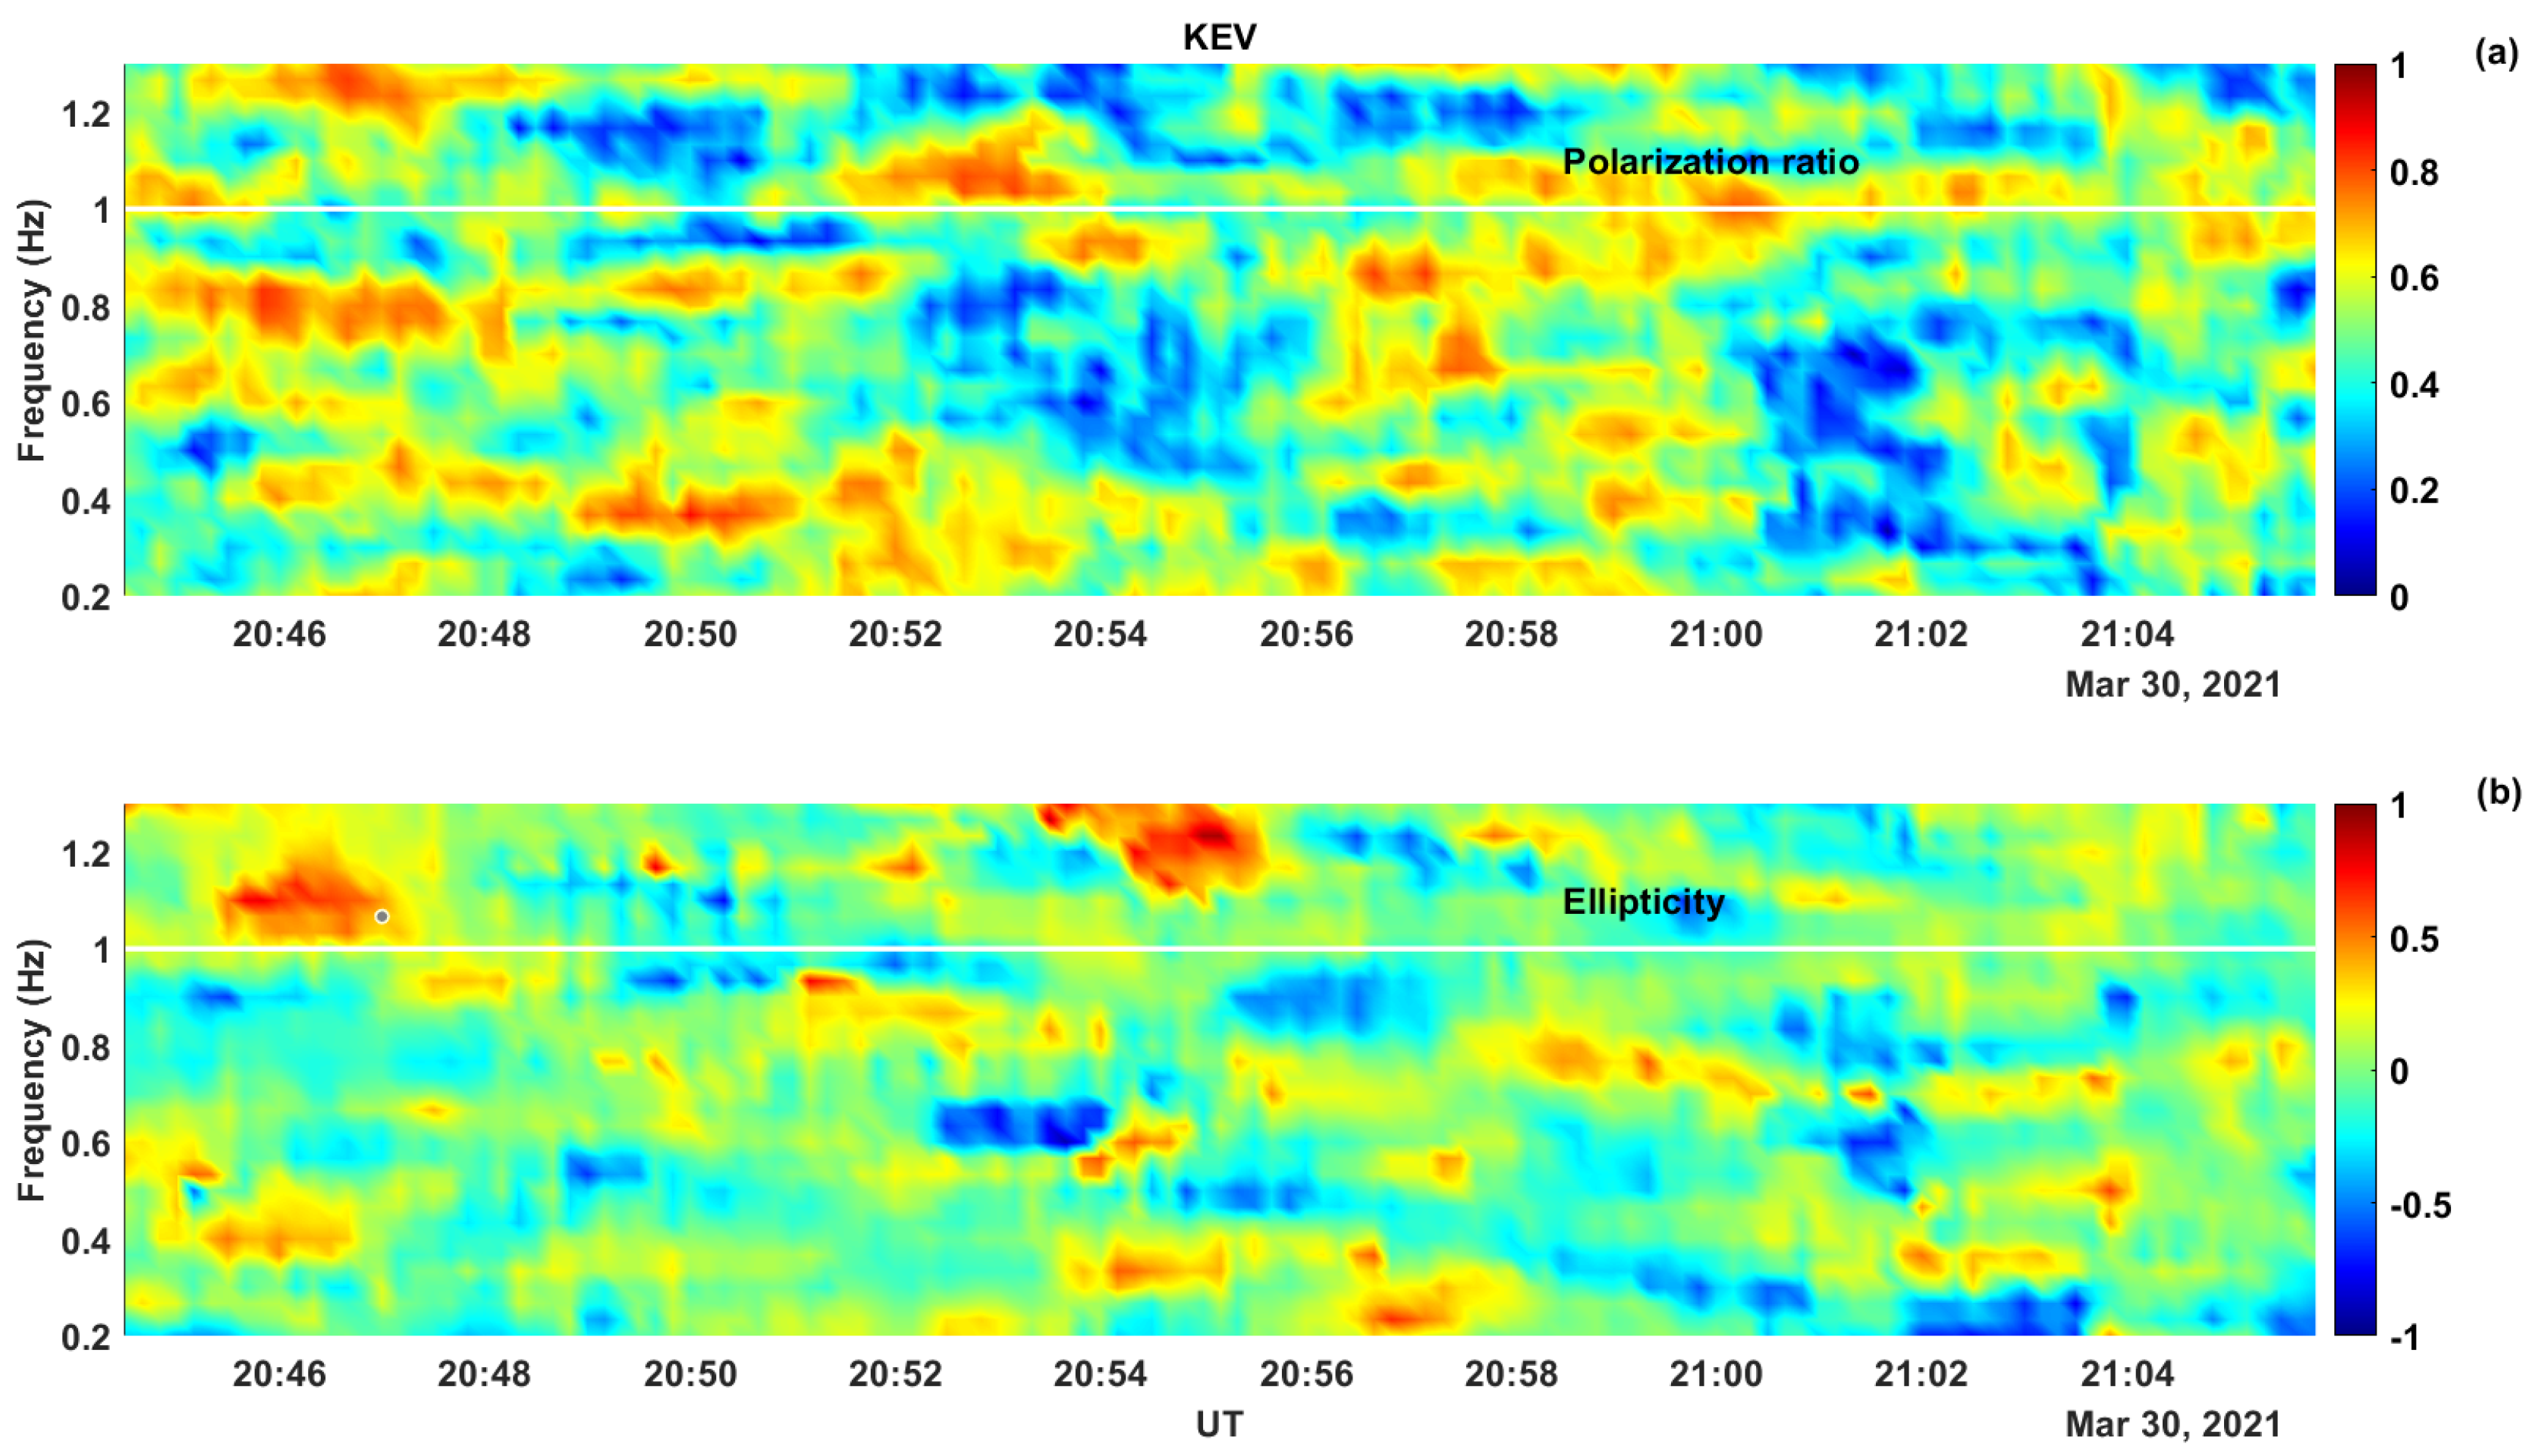
3.1. Ground and Satellite EMIC Observations

In Figure 1 we show the interplanetary and geomagnetic conditions recorded over the period 27–31 March 2021. The blue shaded area marks the time interval during which Pc1 waves were simultaneously observed at DMC in Antarctica and by the LEO CSES-01 spacecraft, i.e., approximately 20:44–21:06 UT on 30 March 2021. Figure 1 shows that, a few days before the wave event, a weak storm (SYM-H minimum value: ~−40 nT) occurred in correspondence with the southward turning of the IMF between 21:00 UT and 23:00 UT on 27 March 2021. The storm was followed by a long recovery phase corresponding to a fluctuating IMF. The observed Pc1 event occurred at a near-zero IMF, upon a small increase in the solar-wind dynamic pressure.
Figure 2 shows the dynamic spectra of the H and D geomagnetic field components recorded at MZS (panels a and b) and DMC (panels c and d) stations between 20:44 UT and 21:06 UT on 30 March 2021. Variations in MZS field components (panels a and b) suggest intense low-frequency activity, even though no specific signature of any isolated signal appears. Conversely, Pc1 waves at a frequency of 0.9–1.0 Hz emerge in the H component of the geomagnetic field recorded by the DMC magnetometer at 20:46 UT (panel c), which becomes very clear from 20:52 UT to 21:02 UT. The DMC magnetometer also recorded a weak signal in the D component just between 20:55 UT and 21:01 UT (panel d).
Figure 3 shows the results of the polarization analysis performed on the DMC observations between 20:44 UT and 21:06 UT on 30 March 2021. In the time interval 20:52–21:02 UT, the observed Pc1 waves appear strongly polarized (R1, top panel) and exhibit a right-handed polarization (ε > 0.2, bottom panel).
Figure 4 shows the spectra of CSES-01/SCM magnetic field observations in the mean field aligned coordinate system (MFA), together with their ellipticity. The MFA coordinate system is defined such that the compressional component ( e ^ c ) is along the direction of the mean magnetic field; the toroidal component ( e ^ t ) is pointing azimuthally as a cross product between the satellite’s ram direction and the mean magnetic field; and the poloidal component ( e ^ p ) completes the triad. Between 20:58 UT and 20:59 UT, the spectra show Pc1 wave activity in the poloidal component and especially in the toroidal one. Negligible wave activity was observed in the compressional component, which is a typical mark of transverse waves. Such signals present a peculiar frequency of 1 Hz and an almost linear polarization (ε < 0.2).
The same analysis (not shown) performed on EFD data shows similar polarization results, but with a higher spectral power in the parallel component. Indeed, looking at both SCM (Figure 5, black line) and EFD (Figure 5, red line) waveforms filtered at 1 Hz, it can be easily seen that magnetic field fluctuations are larger in the components perpendicular to the local geomagnetic field (mid and bottom panels) than in the parallel component (upper panel), which is once again a mark of transverse Alfvén waves. Correspondingly, the electric field shows higher fluctuations in the component parallel to the local geomagnetic field, which suggests a chance of particle acceleration along the field line, possibly leading to precipitation.
In order to assess whether Pc1 waves at 1 Hz also occur in the northern hemisphere [47], we have investigated the dynamic spectra of the horizontal component measured along the Finnish network on 30 March 2021 over the same time interval (20:44–21:06 UT). In Figure 6, a clear signal at 1 Hz was recorded at the highest-latitude station (KEV, L = 6.6—top panel), while lower amplitude signals were recorded at the other stations, becoming weaker and weaker as GMLAT keeps decreasing (bottom panels).
The polarization parameters at KEV, shown in Figure 7, indicate that the waves are mostly linearly polarized.

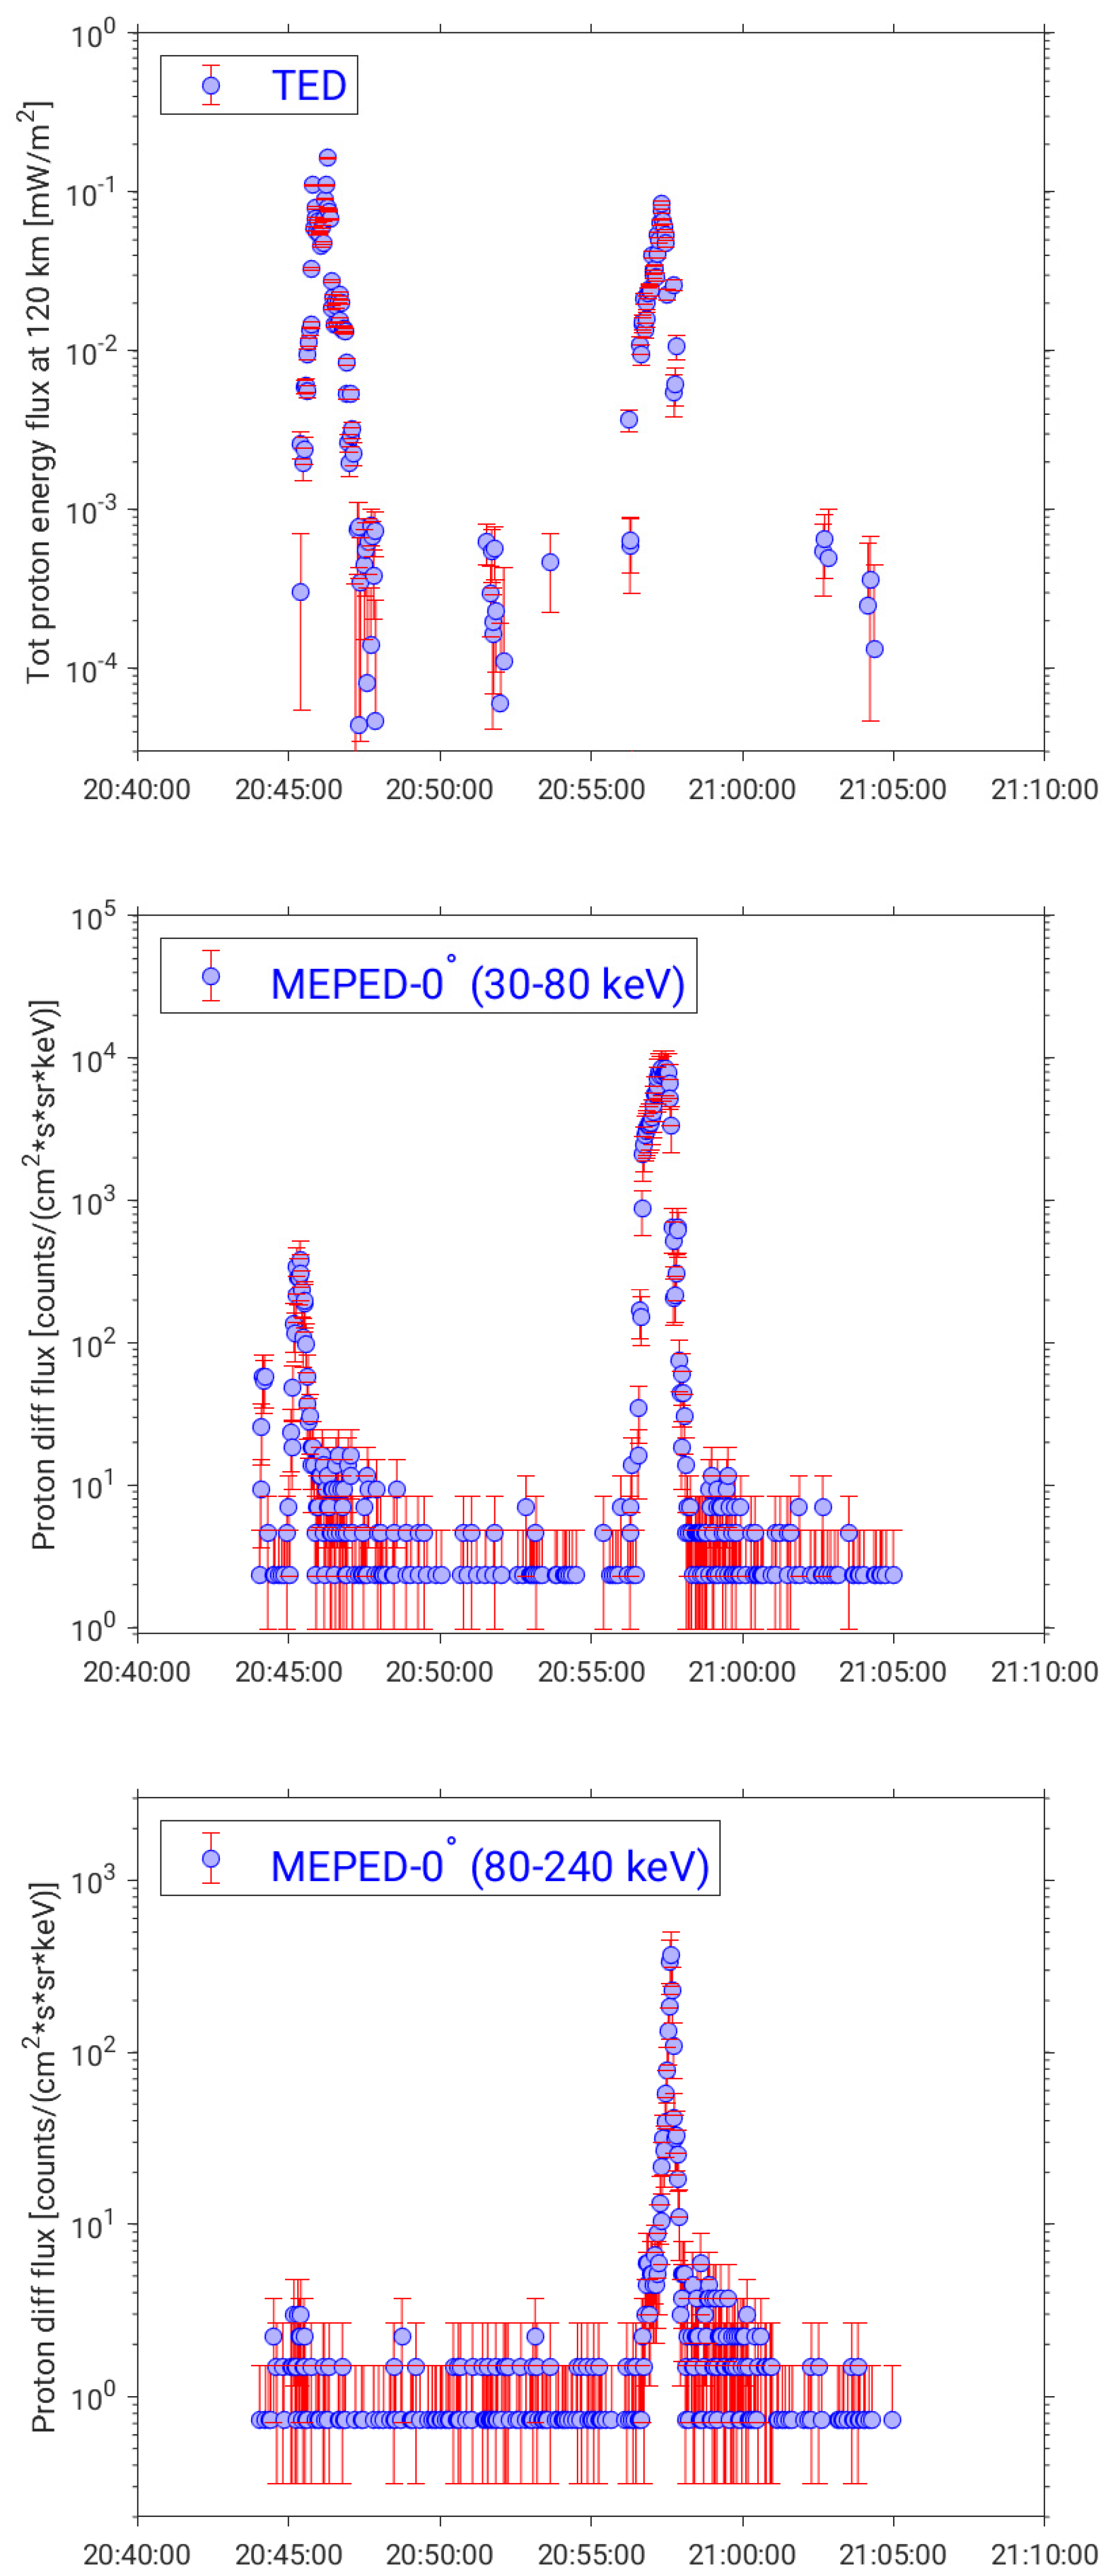
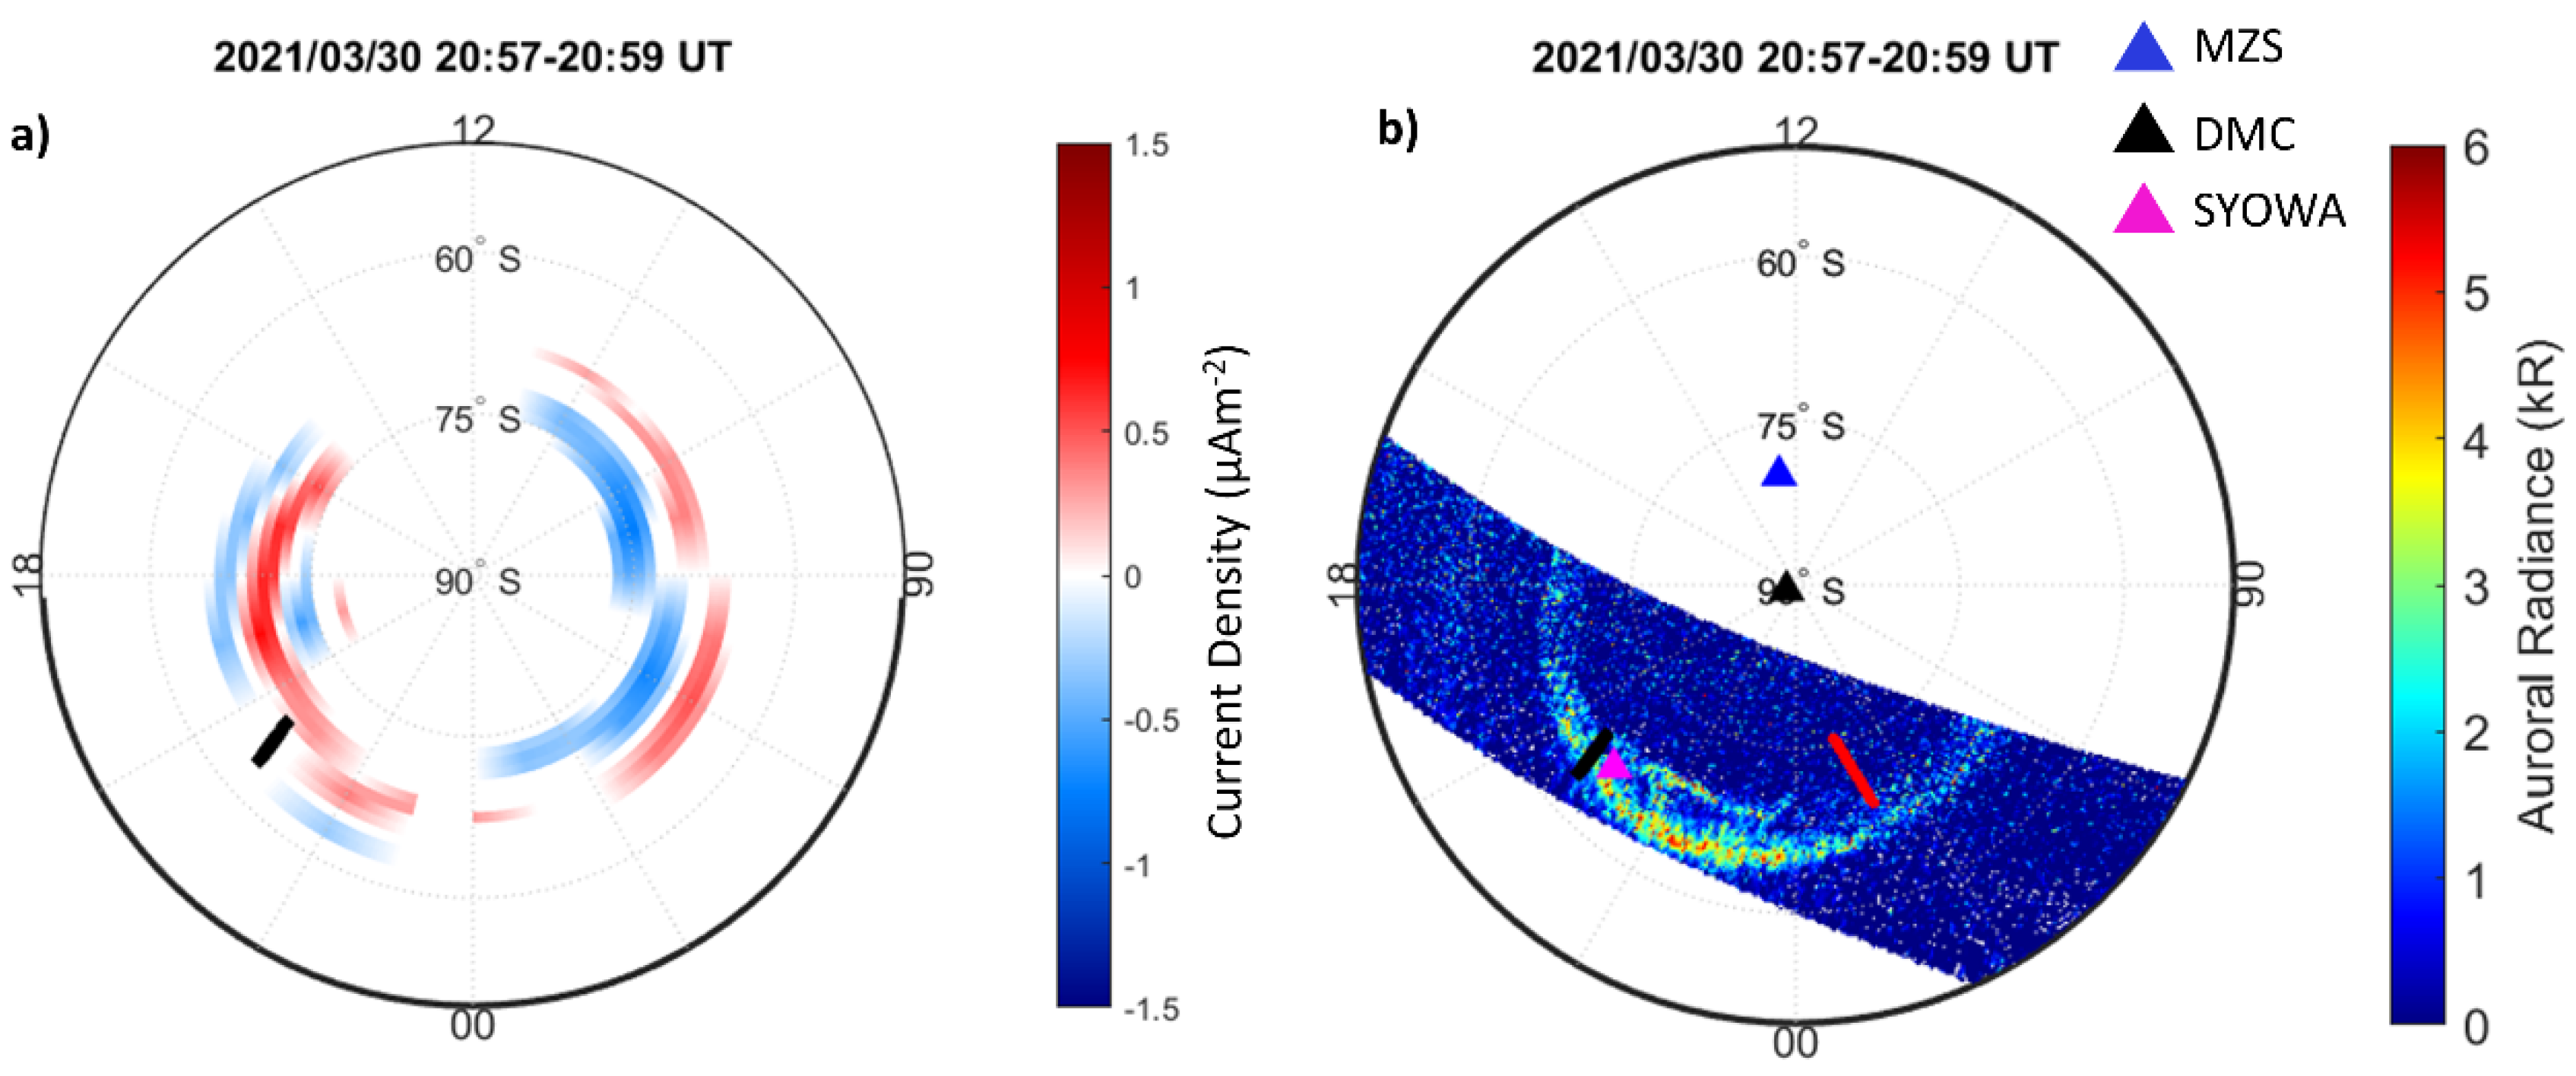
3.2. Associated Proton Precipitation

Figure 8 shows a stack of proton fluxes recorded by the TED and MEPED-0° detectors on board the MetOp-01 satellite between 20:44 UT and 21:05 UT on the day of the wave event. An unmistakable simultaneous precipitation of <20-keV (upper panel) and ring-current-like protons (30–80 keV—mid panel; 80–240 keV—bottom panel) appears between approximately 20:56:30 UT and 20:58:00 UT, in perfect coincidence with maximum intensity of the Pc1 “pearl necklace” captured by DMC through its magnetic H component at ~1 Hz (Figure 2c).
Figure 9 shows polar-view maps, in AACGM latitude and MLT, of the 10-min (between 20:50 UT and 21:00 UT) integrated FAC density (panel a, red/blue shaded areas) and HI auroral radiance (panel b, colored area). As visible from panel a, which also shows the total proton flux integrated at 120 km as measured by the TED on board the MetOp–01 satellite between 20:57 UT and 20:59 UT (thick black curve), the flux centered around 20:58 UT marks a precipitation that is concurrent with Pc1 intensity maximum detected at DMC (see Figure 2 and Figure 3). When observing panel b as well, it is visible that, in the same magnetic sector (i.e., 20:00–22:00 MLT) affected by proton precipitation (panel a, black segment), HI emission has been also recorded (panel b, colored area).
The IPA scenario is corroborated by the keogram reported in Figure 10, which provides all-sky, white-light imaging at Syowa station [48] over the time interval from late March 30 to early 31 March 2021. A clear isolated arc, coming from lower latitudes than auroral ones, is clearly visible between ~20:30 UT and ~21:30 UT, when <20-keV and ring current proton precipitation is detected by the instruments on board MetOp–01 (Figure 9a). A rapid comparison with the position of Syowa station reported in Figure 9 (magenta triangle, panel b; AACGM Lat 66.49° S, AACGM Lon 73.47° E; L-shell 6.3) suggests that such observations span the very same region marked by the proton precipitation spotted by DMSP/SSUSI imagers.

4. Discussion

The importance of EMIC ultra-low-frequency (ULF) waves (and Pc1 counterparts) is connected to their critical role in triggering energetic particle precipitation from the magnetosphere to the conjugated ionosphere via pitch angle scattering. In particular, through ionization processes, precipitating particles can produce variations in the chemistry and electric properties of the atmosphere, possibly impacting climate modeling [49]. Statistical analyses have shown significant correlations between Pc1 activity and atmospheric properties at stratospheric and tropospheric altitudes in Antarctica [50,51,52]. A recent study has demonstrated the temporal correlation between an EMIC-driven IPA and a localized mesospheric ozone loss [53].
The localized bursts of protons caught by LEO satellites all over the ring current energy range (Figure 8, mid and bottom panels) in strict correspondence with the Pc1 waves per serepresent a strong mark of possible EMIC-driven precipitation [54]. Let us take a better look to their low-energy extension (TED data; Figure 8, upper panel) and concomitance with IPA occurrence (Figure 9), which can be considered a proxy of typical EMIC/particle interactions.
As shown in Figure 9 (panel a), proton precipitation occurred in an ionospheric region characterized by downward FACs (blue shaded areas) at the same time as Pc1 wave activity was recorded by the DMC ground magnetometer (Figure 2). Concurrently, DMSP/SSUSI captured proton precipitation in the same magnetic sector crossed by MetOp–01 (Figure 9b). The same phenomenon was observed from the ground by all-sky, white-light cameras at Syowa station: a related optical keogram in Figure 10 clearly shows the appearance of an isolated auroral arc in strict positional and temporal concomitance with MetOp–01 and DMSP/SSUSI observations (Figure 9).
Back to Figure 9, MZS location (panel b, blue triangle) provides a possible explanation for the intense low-frequency activity recorded, masking Pc1 signatures, since the magnetic observatory was crossing the cusp region [55] at the time when DMC observed the “necklace”. In addition, note how CSES–01 satellite’s track (red full curve, panel b) approaches the proton precipitation region (panel b), marked also by downward FACs (blue shaded area, panel a), suggesting that the same Pc1 wave activity captured at LEO corresponds to the one recorded on the ground. A further corroboration came from the presence of an electric field component of the Pc1 waves observed by CSES–01 (Figure 5), which is parallel to the local magnetic field.
Finally, Figure 11 provides a counterpart, in the northern hemisphere, to the left plot in Figure 9. The magnetic position of each of the four ground magnetometers listed in Figure 6 are also reported. Interestingly, unlike the other stations in the array, both KIL and KEV (black and blue triangle, respectively) appeared to be in an ionospheric sector associated with downward FACs (blue shaded area). This gives a potential explanation for the presence of Pc1 wave activity in a very narrow latitudinal band, as shown in Figure 6.
The wave/particle scenario described so far globally suggests that Pc1 waves at ~1 Hz observed at ground and in the top-side ionosphere probably have their source in a magnetospheric equatorial region at L ~6.6/6.7 in the evening/night sector, not far from the plasmapause (Figure 12). Original EMIC waves propagate along magnetic field lines toward the high-latitude ionosphere in both hemispheres. In the southern ionosphere, the waves are detected by CSES at L = 6.7, ~02 LT; they show the characteristic properties of incident waves on the ionosphere, in that they are transverse with almost linear polarization, suggesting that the satellite is located close to the injection region. These waves can propagate horizontally in the polar ionosphere with slow attenuation, so that they are observed at DMC station (polar cap) with a right-hand polarization, as expected for waves far from their injection region [5]. Simultaneously, in the northern hemisphere, linearly polarized Pc1-class waves are observed at KEV (L = 6.6, ~23:30 MLT), plausibly close to the injection region.
That said, we suggest that the EMIC waves propagated from their magnetospheric source along the magnetic field lines both southward and northward; after their injection into the northern ionosphere, they were transmitted to KEV ground station (probably close to the injection region); while in the southern ionosphere, they arrived at the CSES satellite, located near to the injection region, then propagating up to the field line with footprint at DMC polar station.
Wave propagation at such large distances from the source (~2000 km) in the dusk/night sector might be indicative of weak attenuation [8].
The timing of the Pc1 event, when compared to LEO satellite observations of sudden and localized proton precipitation, is considered a strong point in favor of an associated resonant wave–particle interaction.

5. Conclusions

As a prominent element of the ULF zoo, EMIC/Pc1 waves can be considered as a perfect tool for the remote diagnosis of the topologies and dynamic properties of near-Earth plasmas.
Based on the availability of a comprehensive set of instruments, operating on the ground and in the top-side ionosphere, the present case study provides an interesting example of the evolution of EMIC propagation to both ionospheric hemispheres, up to the polar cap. The occurrence of the original wave event within the dusk/night sector of the magnetosphere near the plasmapause is consistent with CRRES spacecraft observations [2] and moderate AE conditions (as classified in [20] metrics). Also, particle dynamics is impacted by the wave event, as identified by localized proton scattering loss over the ring-current energy range in the same MLT sector, as well as simultaneous IPA occurrence at lower energies (which corroborates the commonly envisioned link between EMIC waves and detached proton precipitation).
This investigation contributes to enlarging the experimental collection needed to characterize the impact of EMIC waves on ionospheric–magnetospheric dynamics.

Author Contributions

G.D.: writing—review and editing, formal analysis, and investigation; P.F.: writing—original draft preparation and formal analysis; M.D.L.: formal analysis, data curation, and methodology; A.P.: writing—review and editing and investigation; T.R. provided the Finnish pulsation magnetometer data; M.P.: writing—review and editing, data curation, and supervision. All authors have read and agreed to the published version of the manuscript.

Funding

This research received no external funding.

Institutional Review Board Statement

Not applicable.

Informed Consent Statement

Not applicable.

Data Availability Statement

Measurements of the magnetic field fluctuations at Terra Nova Bay and Dome C can be requested from M. De Lauretis at the following e-mail address: [email protected]. The Finnish pulsation magnetometer data are available by request from Sodankylä Geophysical Observatory at https://www.sgo.fi/Data/archive.php, (accessed on 10 September 2023). CSES/SCM and CSES/EFD data are available at https://leos.ac.cn/ (accessed on 28 September 2023). AMPERE data are provided by the AMPERE Science Data Center (http://ampere.jhuapl.edu/, accessed on 10 October 2023). The Special Sensor Ultraviolet Spectrographic Imager (SSUSI) data are available and documented at https://ssusi.jhuapl.edu/ (accessed on 10 October 2023). The SSUSI Principal Investigator is Larry J. Paxton. Proton fluxes from the instruments on board MetOp–01 are available at the NASA CDAWeb site (https://cdaweb.gsfc.nasa.gov/istp_public/, accessed on 1 September 2023). The same database provides OMNI parameters and THEMIS-D data. Images from the all-sky cameras at Syowa station in Antarctica are part of the IUGONET dataset and can be accessed in real time at http://polaris.nipr.ac.jp/~aurora/icam/, (accessed on 15 September 2023).

Acknowledgments

This research activity was supported by the Italian PNRA (Programma Nazionale di Ricerche in Antartide, 2022—PNRA0000036 project “ITALIAN GEOMAGNETIC PERMANENT OBSERVATORIES FOR SOLID EARTH AND SPACE WEATHER STUDIES IN ANTARCTICA”). The authors thank the AMPERE team and the AMPERE Science Center for providing the Iridium-derived data products (http://ampere.jhuapl.edu/index.html, accessed on 10 October 2023). The authors kindly acknowledge N. Papitashvili and J. King at the National Space Science Data Center of the Goddard Space Flight Center for their permission to use 1-min OMNI data, and the NASA CDAWeb team for making these data available. This work made use of the data from the CSES mission (https://leos.ac.cn/, accessed on 28 September 2023), a project funded by the China National Space Administration and China Earthquake Administration in collaboration with the Italian Space Agency and Istituto Nazionale di Fisica Nucleare. M.P. and G.D. thank the ISSI-BJ project “The electromagnetic data validation and scientific application research based on CSES satellite” and Dragon 5 cooperation 2020–2024 (ID. 59236). This research work is supported by the Italian MIUR-PRIN grant 2022ZBBBRY on the Characterization of the Lithosphere-Ionosphere coupling during seismic phenomena. G.D. thanks the Italian Space Agency for their financial support under the contract ASI “LIMADOU Scienza+” n° 2020-31-HH.0. The authors kindly acknowledge Giuseppe Consolini for useful discussion about all-sky camera observations.

Conflicts of Interest

The authors declare no conflicts of interest.

References

  1. Remya, B.; Halford, A.J.; Sibeck, D.G.; Murphy, K.R.; Fok, M.-C. Understanding Quiet and Storm Time EMIC Waves—Van Allen Probes Results. J. Geophys. Res. Space Phys. 2023, 128, e2023JA031712. [Google Scholar] [CrossRef]
  2. Fraser, B.J.; Nguyen, T.S. Is the plasmapause a preferred source region of electromagnetic ion cyclotron waves in the magnetosphere? J. Atmos. Sol.-Terr. Phys. 2001, 63, 1225–1247. [Google Scholar] [CrossRef]
  3. Pickett, J.S.; Grison, B.; Omura, Y.; Engebretson, M.J.; Dandouras, I.; Masson, A.; Adrian, M.L.; Santolík, O.; Décréau, P.M.E.; Cornilleau-Wehrlin, N.; et al. Cluster observations of EMIC triggered emissions in association with Pc1 waves near Earth’s plasmapause. Geophys. Res. Lett. 2010, 37, L09104. [Google Scholar] [CrossRef]
  4. Morley, S.K.; Friedel, R.H.W.; Cayton, T.E.; Noveroske, E. A rapid, global and prolonged electron radiation belt dropout observed with the global positioning system constellation. Geophys. Res. Lett. 2010, 37, L06102. [Google Scholar] [CrossRef]
  5. Fujita, S.; Tamao, T. Duct propagation of hydromagnetic waves in the upper ionosphere, 1, Electromagnetic field disturbances in high latitudes associated with localized incidence of a shear Alfvén wave. J. Geophys. Res. Space Phys. 1988, 93, 14665–14673. [Google Scholar] [CrossRef]
  6. Waters, C.L.; Lysak, R.L.; Sciffer, M.D. On the coupling of fast and shear Alfvén wave modes by the ionospheric Hall conductance. Earth Planets Space 2013, 65, 385–396. [Google Scholar] [CrossRef]
  7. Manchester, R.N. Propagation of Pc 1 micropulsations from high to low latitudes. J. Geophys. Res. 1966, 71, 3749–3754. [Google Scholar] [CrossRef]
  8. Greifinger, C.; Greifinger, P.S. Theory of hydromagnetic propagation in the ionospheric waveguide. J. Geophys. Res. 1968, 73, 7473–7490. [Google Scholar] [CrossRef]
  9. Kim, H.; Lessard, M.R.; Engebretson, M.J.; Lühr, H. Ducting characteristics of Pc 1 waves at high latitudes on the ground and in space. J. Geophys. Res. Space Phys. 2010, 115, A09130. [Google Scholar] [CrossRef]
  10. Kim, H.; Lessard, M.R.; Engebretson, M.J.; Young, M. Statistical study of Pc1–2 wave propagation characteristics in the high-latitude ionospheric waveguide. J. Geophys. Res. Space Phys. 2011, 116, A07227. [Google Scholar] [CrossRef]
  11. Regi, M.; Marzocchetti, M.; Francia, P.; De Lauretis, M. A statistical analysis of Pc1-2 waves at a near-cusp station in Antarctica. Earth Planets Space 2017, 69, 152. [Google Scholar] [CrossRef]
  12. Kim, H.; Hwang, J.; Park, J.; Bortnik, J.; Lee, J. Global characteristics of electromagnetic ion cyclotron waves deduced from Swarm satellites. J. Geophys. Res. Space Phys. 2018, 123, 1325–1336. [Google Scholar] [CrossRef]
  13. Kim, H.; Shiokawa, K.; Park, J.; Miyoshi, Y.; Stolle, C.; Buchert, S. Statistical analysis of Pc1 wave ducting deduced from Swarm satellites. J. Geophys. Res. Space Phys. 2021, 126, e2020JA029016. [Google Scholar] [CrossRef]
  14. Mann, I.R.; Usanova, M.E.; Murphy, K.; Robertson, M.T.; Milling, D.K.; Kale, A.; Kletzing, C.; Wygant, J.; Thaller, S.; Raita, T. Spatial localization and ducting of EMIC waves: Van Allen Probes and ground-based observations. Geophys. Res. Lett. 2014, 41, 785–792. [Google Scholar] [CrossRef]
  15. Kim, H.; Hwang, J.; Park, J.; Miyashita, Y.; Shiokawa, K.; Mann, I.R.; Raita, T.; Lee, J. Large-scale ducting of Pc1 pulsations observed by Swarm satellites and multiple ground networks. Geophys. Res. Lett. 2018, 45, 12703–12712. [Google Scholar] [CrossRef]
  16. Gou, X.; Li, L.; Zhang, Y.; Zhou, B.; Feng, Y.; Cheng, B.; Raita, T.; Liu, J.; Zhima, Z.; Shen, X. Ionospheric Pc1 waves during a storm recovery phase observed by the China Seismo-Electromagnetic Satellite. In Annales Geophysicae; Copernicus GmbH: Göttingen, Germany, 2020; pp. 775–787. [Google Scholar] [CrossRef]
  17. Liu, J.; Shiokawa, K.; Oyama, S.I.; Otsuka, Y.; Jun, C.W.; Nosé, M.; Nagatsuma, T.; Sakaguchi, K.; Kadokura, A.; Ozaki, M.; et al. A statistical study of longitudinal extent of Pc1 pulsations using seven PWING ground stations at subauroral latitudes. J. Geophys. Res. Space Phys. 2023, 128, e2021JA029987. [Google Scholar] [CrossRef]
  18. Upadhyay, A.; Kakad, B.; Kakad, A.; Omura, Y.; Sinha, A.K. Occurrence characteristics of electromagnetic ion cyclotron waves at sub-auroral Antarctic station Maitri during solar cycle 24. Earth Planets Space 2020, 72, 35. [Google Scholar] [CrossRef]
  19. Kwon, J.-W.; Kim, K.-H.; Jin, H.; Kwon, H.-J.; Jee, G.; Shiokawa, K.; Connors, M. Statistical study of EMIC Pc1-Pc2 waves observed at subauroral latitudes. J. Atmos. Sol.-Terr. Phys. 2020, 205, 105292. [Google Scholar] [CrossRef]
  20. Saikin, A.A.; Zhang, J.-C.; Smith, C.W.; Spence, H.E.; Torbert, R.B.; Kletzing, C.A. The dependence on geomagnetic conditions and solar wind dynamic pressure of the spatial distributions of EMIC waves observed by the Van Allen Probes. J. Geophys. Res. Space Phys. 2016, 121, 4362–4377. [Google Scholar] [CrossRef]
  21. Francia, P.; Regi, M.; De Lauretis, M.; Pezzopane, M.; Cesaroni, C.; Spogli, L.; Raita, T. A case study of correspondence between Pc1 activity and ionospheric irregularities at polar latitudes. Earth Planets Space 2020, 72, 59. [Google Scholar] [CrossRef]
  22. Yahnina, T.A.; Yahnin, A.G.; Kangas, J.; Manninen, J. Proton precipitation related to Pc1 pulsations. Geophys. Res. Lett. 2000, 27, 3575–3578. [Google Scholar] [CrossRef]
  23. Yahnina, T.A.; Yahnin, A.G.; Kangas, J.; Manninen, J.; Evans, D.S.; Demekhov, A.G.; Trakhtengerts, V.Y.; Thomsen, M.F.; Reeves, G.D.; Gvozdevsky, B.B. Energetic particle counterparts for geomagnetic pulsations of Pc1 and IPDP types. In Annales Geophysicae; Copernicus Publications: Göttingen, Germany, 2003; pp. 2281–2292. [Google Scholar] [CrossRef]
  24. Sakaguchi, K.; Shiokawa, K.; Ieda, A.; Miyoshi, Y.; Otsuka, Y.; Ogawa, T.; Connors, M.; Donovan, E.F.; Rich, F.J. Simultaneous ground and satellite observations of an isolated proton arc at subauroral latitudes. J. Geophys. Res. Space Phys. 2007, 112, A04202. [Google Scholar] [CrossRef]
  25. Sakaguchi, K.; Shiokawa, K.; Miyoshi, Y.; Otsuka, Y.; Ogawa, T.; Asamura, K.; Connors, M. Simultaneous appearance of isolated auroral arcs and Pc 1 geomagnetic pulsations at subauroral latitudes. J. Geophys. Res. Space Phys. 2008, 113, A05201. [Google Scholar] [CrossRef]
  26. Nomura, R.; Shiokawa, K.; Sakaguchi, K.; Otsuka, Y.; Connors, M. Polarization of Pc1/EMIC waves andrelated proton auroras observed at subauroral latitudes. J. Geophys. Res. Space Phys. 2012, 117, A02318. [Google Scholar] [CrossRef]
  27. Nakamura, K.; Shiokawa, K.; Otsuka, Y.; Shinbori, A.; Miyoshi, Y.; Connors, M.; Spence, H.; Reeves, G.; Funsten, H.O.; MacDowall, R.; et al. Simultaneous observation of two isolated proton auroras at subauroral latitudes by a highly sensitive all-sky camera and Van Allen Probes. J. Geophys. Res. Space Phys. 2021, 126, e2020JA029078. [Google Scholar] [CrossRef]
  28. Mironova, I.A.; Aplin, K.L.; Arnold, F.; Bazilevskaya, G.A.; Harrison, R.G.; Krivolutsky, A.A.; Nicoll, K.A.; Rozanov, E.V.; Turunen, E.; Usoskin, I.G. Energetic particle influence on the Earth’s atmosphere. Space Sci. Rev. 2015, 194, 1–96. [Google Scholar] [CrossRef]
  29. Welch, P.D. The use of Fast Fourier Transform for the estimation of power spectra: A method based on time averaging over short, modified periodograms. IEEE Trans. Audio Electroacoust. 1967, 15, 70–73. [Google Scholar] [CrossRef]
  30. Fowler, R.A.; Kotick, B.J.; Elliott, R.D. Polarization analysis of natural and artificially induced geomagnetic micropulsations. J. Geophys. Res. 1967, 72, 2871–2883. [Google Scholar] [CrossRef]
  31. Anderson, B.J.; Erlandson, R.E.; Zanetti, L.J. A statistical study of Pc1-2 magnetic pulsations in the equatorial magnetosphere: 2. Wave properties. J. Geophys. Res. Space Phys. 1992, 97, 3089–3101. [Google Scholar] [CrossRef]
  32. Shen, X.; Zong, Q.G.; Zhang, X. Introduction to special section on the China Seismo-Electromagnetic Satellite and initial results. Earth Planet. Phys. 2018, 2, 439–443. [Google Scholar] [CrossRef]
  33. Wang, Q.; Huang, J.; Zhang, X.; Shen, X.; Yuan, S.; Zeng, L.; Cao, J. China Seismo-Electromagnetic Satellite search coil magnetometer data and initial results. Earth Planet. Phys. 2018, 2, 462–468. [Google Scholar] [CrossRef]
  34. Diego, P.; Huang, J.; Piersanti, M.; Badoni, D.; Zeren, Z.; Yan, R.; Rebustini, G.; Ammendola, R.; Candidi, M.; Guan, Y.B.; et al. The Electric Field Detector on Board the China Seismo Electromagnetic Satellite—In-Orbit Results and Validation. Instruments 2021, 5, 1. [Google Scholar] [CrossRef]
  35. Pizzicaroli, J.C. Launching and building the Iridium® constellation. In Mission Design & Implementation of Satellite Constellations: Proceedings of an International Workshop, Held in Toulouse, France, November 1997; Springer: Dordrecht, The Netherlands, 1998; pp. 113–121. [Google Scholar] [CrossRef]
  36. Anderson, B.J.; Takahashi, K.; Toth, B.A. Sensing global Birkeland currents with Iridium® engineering magnetometer data. Geophys. Res. Lett. 2000, 27, 4045–4048. [Google Scholar] [CrossRef]
  37. Paxton, L.J.; Meng, C.I.; Fountain, G.H.; Ogorzalek, B.S.; Darlington, E.H.; Gary, S.A.; Goldsten, J.O.; Kusnierkiewicz, D.Y.; Lee, S.C.; Linstrom, L.A.; et al. Special sensor ultraviolet spectrographic imager: An instrument description. In Instrumentation for Planetary and Terrestrial Atmospheric Remote Sensing; SPIE: Bellingham, WA, USA, 1992; pp. 2–15. [Google Scholar] [CrossRef]
  38. Paxton, L.J.; Morrison, D.; Zhang, Y.; Kil, H.; Wolven, B.; Ogorzalek, B.S.; Humm, D.C.; Meng, C.I. Validation of remote sensing products produced by the Special Sensor Ultraviolet Scanning Imager (SSUSI): A far UV-imaging spectrograph on DMSP F-16. In Optical Spectroscopic Techniques, Remote Sensing, and Instrumentation for Atmospheric and Space Research IV; SPIE: Bellingham, WA, USA, 2002; pp. 338–348. [Google Scholar] [CrossRef]
  39. Paxton, L.J.; Meng, C.I. Auroral imaging and space-based optical remote sensing. Johns Hopkins APL Tech. Dig. 1999, 20, 556–569. [Google Scholar]
  40. Evans, D.; Greer, M. Polar Orbiting Environmental Satellite Space Environment Monitor2: Instrument Descriptions and Archive Data Documentation; Technical Memorandum 93; OAR SEC 93; Version 1.4; NOAA: Boulder, CO, USA, 2004. Available online: https://ngdc.noaa.gov/stp/satellite/poes/docs/SEM2v1.4b.pdf (accessed on 15 December 2023).
  41. Ǿdegaard, L.-K.G.; Tyssǿy, H.N.; Jakobsen Sandanger, M.I.; Stadsnes, J.; Sǿraas, F. Space Weather impact on the degradation of NOAA POES MEPED proton detectors. J. Space Weather Space Clim. 2016, 6, A26. [Google Scholar] [CrossRef]
  42. Daglis, I.A.; Thorne, R.M.; Baumjohann, W.; Orsini, S. The terrestrial ring current: Origin, formation, and decay. Rev. Geophys. 1999, 37, 407–438. [Google Scholar] [CrossRef]
  43. King, J.; Papitashvili, N. Solar wind spatial scales in and comparisons of hourly Wind and ACE plasma and magnetic field 829 data. J. Geophys. Res. Space Phys. 2005, 110, A02104. [Google Scholar] [CrossRef]
  44. Wanliss, J.A.; Showalter, K.M. High-resolution global storm index: Dst versus SYM-H. J. Geophys. Res. Space Phys. 2006, 111, A02202. [Google Scholar] [CrossRef]
  45. Liu, X.; Liu, W. A new plasmapause location model based on THEMIS observations. Sci. China Earth Sci. 2014, 57, 2552–2557. [Google Scholar] [CrossRef]
  46. O’Brien, T.P.; Moldwin, M.B. Empirical plasmapause models from magnetic indices. Geophys. Res. Lett. 2003, 30, 1152. [Google Scholar] [CrossRef]
  47. Ozaki, M.; Shiokawa, K.; Horne, R.B.; Engebretson, M.J.; Lessard, M.; Ogawa, Y.; Hosokawa, K.; Nosé, M.; Ebihara, Y.; Kadokura, A.; et al. Magnetic Conjugacy of Pc1 Waves and Isolated Proton Precipitation at Subauroral Latitudes: Importance of Ionosphere as Intensity Modulation Region. Geophys. Res. Lett. 2021, 48, e2020GL091384. [Google Scholar] [CrossRef]
  48. Hirasawa, N.; Yabuki, M.; Shiobara, M.; Shimode, Y.; Kuji, M. Long-term all-sky-camera images and evaluated cloud-cover data at Syowa Station, Antarctica. Polar Data J. 2023, 7, 35–49. [Google Scholar] [CrossRef]
  49. Hendry, A.T.; Seppälä, A.; Rodger, C.J.; Clilverd, M.A. Impact of EMIC-Wave Driven Electron Precipitation on the Radiation Belts and the Atmosphere. J. Geophys. Res. Space Phys. 2021, 126, e2020JA028671. [Google Scholar] [CrossRef]
  50. Francia, P.; Regi, M.; De Lauretis, M. Signatures of the ULF geomagnetic activity in the surface air temperature in Antarctica. J. Geophys. Res. Space Phys. 2015, 120, 2452–2459. [Google Scholar] [CrossRef]
  51. Regi, M.; De Lauretis, M.; Redaelli, G.; Francia, P. ULF geomagnetic and polar cap potential signatures in the temperature and zonal wind re-analysis data in Antarctica. J. Geophys. Res. Space Phys. 2016, 121, 286–295. [Google Scholar] [CrossRef]
  52. Regi, M.; Redaelli, G.; Francia, P.; De Lauretis, M. ULF geomagnetic activity effects on tropospheric temperature, specific humidity, and cloud cover in Antarctica, during 2003–2010. J. Geophys. Res. Atmos. 2017, 122, 6488–6501. [Google Scholar] [CrossRef]
  53. Ozaki, M.; Shiokawa, K.; Kataoka, R.; Mlynczak, M.; Paxton, L.; Connors, M.; Yagitani, S.; Hashimoto, S.; Otsuka, Y.; Nakahira, S.; et al. Localized mesospheric ozone destruction corresponding to isolated proton aurora coming from Earth’s radiation belt. Sci. Rep. 2022, 12, 16300. [Google Scholar] [CrossRef]
  54. Søraas, F.; Aarsnes, K.; Carlsen, D.V.; Oksavik, K.; Evans, D.S. Ring Current Behavior as Revealed by Energetic Proton Precipitation. Inn. Magnetos. Phys. Model. 2005, 155, 237. [Google Scholar] [CrossRef]
  55. Park, J.; Luehr, H.; Rauberg, J. Global characteristics of Pc1 magnetic pulsations during solar cycle 23 deduced from CHAMP data. In Annales Geophysicae; Copernicus Publications: Göttingen, Germany, 2013; pp. 1507–1520. [Google Scholar] [CrossRef]
Figure 1. Interplanetary and geomagnetic conditions during the time interval 27–31 March 2021. From the top: the IMF strength (a) and north–south component (b), the solar wind speed (c), density (d), temperature (e), dynamic pressure (f), and the Sym-H index (g). The blue shaded area marks the specific Pc1 event simultaneously observed at DMC in Antarctica and by the LEO CSES-01 spacecraft. Red dashed horizontal line corresponds to the zero value.
Atmosphere 15 00219 g001
Figure 2. The dynamic spectra of the H (panels (a,c)) and D (panels (b,d)) components at MZS (first and second panel from the top) and DMC (third and fourth panel from the top) during the time interval 20:42–21:06 UT on 30 March 2021.
Atmosphere 15 00219 g002
Figure 3. The time–frequency dependence of the polarization ratio (a) and ellipticity (b) at DMC during the time interval 20:42–21:05 UT on 30 March 2021.
Atmosphere 15 00219 g003
Figure 4. The dynamic spectra of the magnetic field observations by CSES–01 along the mean field-aligned coordinate system (from top to bottom: compressional (a), poloidal (b), and toroidal (c) components), and the ellipticity (d) during the time interval 20:58–21:02 UT on 30 March 2021. The high values of ellipticity between 21:01:00 UT and 21:01:30 UT correspond to a negligible PSD in the field components (not visible in the selected color scale).
Atmosphere 15 00219 g004
Figure 5. The CSES–01 electric (red) and magnetic field (black) waveforms, filtered at 1 Hz. From top to bottom: compressional, poloidal, and toroidal components.
Atmosphere 15 00219 g005
Figure 6. The dynamic power spectra of the horizontal geomagnetic component measured across the Finnish network during the time interval 20:44–21:06 UT on 30 March 2021: (a) Kevo station; (b) Kilpisjärvi station; (c) Nurmijärvi station; (d) Oulu station.
Atmosphere 15 00219 g006
Figure 7. The time–frequency dependence of the polarization ratio (a) and ellipticity (b) at KEV during the time interval 20:44–21:06 UT on March 2021.
Atmosphere 15 00219 g007
Figure 8. Stack plot of MetOp–01/TED total proton flux integrated at 120 km (upper panel) and MEPED–0° differential proton flux in channels P1 (30–80 keV; mid panel) and P2 (80–240 keV; bottom panel).
Atmosphere 15 00219 g008
Figure 9. Polar-view maps, in AACGM latitude and MLT, of the 10-min (between 20:50 UT and 21:00 UT) integrated FAC density ((a), red/blue shaded areas) as provided by AMPERE, and the auroral emission in the hydrogen line HI (121.6 nm) as measured by the SSUSI instrument on board DMSP ((b), colored area). Map in panel a also reports the total proton flux integrated at 120 km, as measured by the TED on board the MetOp–01 satellite between 20:57 UT and 20:59 UT (thick black curve). In panel b, the CSES–01 track between 20:57 UT and 20:59 UT (red full curve) and the Altitude Adjusted Corrected Geomagnetic (AACGM) coordinates of DMC (black triangle, 89.03° S), MZS (blue triangle, 79.88° S), and Syowa (magenta triangle, 66.49° S) stations at 20:58 UT are also reported. Each map covers 00:00–24:00 MLT and |50°|–|90°| AACGM Lat; the magnetic noon/midnight is at the top/bottom.
Atmosphere 15 00219 g009
Figure 10. A north–south optical keogram produced by all-sky white-light cameras located at Syowa station between 18:00 UT on 30 March 2021 and 06:00 UT on next day.
Atmosphere 15 00219 g010
Figure 11. Same plot as in Figure 9a for the northern hemisphere, superimposed onto AACGM coordinates of four ground magnetometers in the Finnish Pulsation Magnetometer Array, evaluated at 20:58 UT.
Atmosphere 15 00219 g011
Figure 12. Plasmapause location in the second half of the event day (between 03:30 and 06:30 MLT), as estimated using the Liu and Liu [45] model.
Atmosphere 15 00219 g012
Table 1. Station name, station identifier, geographic and geomagnetic coordinates, local time (LT), and magnetic local time (MLT) of the ground search-coil magnetometers located in Antarctica.
StationStation IDGeographic CoordinatesGeomagnetic CoordinatesLocal Time (LT)Magnetic Local Time (MLT)
Mario ZucchelliMZS74.69° S
164.12° E
80.03° S
307.74° E
UT + 11UT-8
ConcordiaDMC75.11° S
123.40° E
88.84° S
55.73° E
UT + 8UT-1
Table 2. Station name, station identifier, geographic and geomagnetic coordinates, L value, and magnetic local time (MLT) of geomagnetic observatories in the Finnish Pulsation Magnetometer Network.
StationStation IDGeographic CoordinatesGeomagnetic CoordinatesL ValueMagnetic Local Time (MLT)
KevoKEV69.75° N
27.02° E
66.9° N
107.4° E
6.6UT + 2:49
KilpisjärviKIL69.05° N
20.79° E
66.4° N
101.8° E
6.3UT + 2:26
OuluOUL65.08° N
25.90° E
62.1° N
103.9° E
4.6UT + 2:36
NurmijärviNUR62.42° N
25.28° E
59.4° N
102.3° E
3.9UT + 2:29
Disclaimer/Publisher’s Note: The statements, opinions and data contained in all publications are solely those of the individual author(s) and contributor(s) and not of MDPI and/or the editor(s). MDPI and/or the editor(s) disclaim responsibility for any injury to people or property resulting from any ideas, methods, instructions or products referred to in the content.

